
Submitted:
13 April 2025
Posted:
14 April 2025
You are already at the latest version
Abstract
Maowusu sandy land is characterized by fragile ecological environment and extreme sensitivity to external disturbances such as climate change and human activities. Identifying and zoning ecological spaces in this region are crucial for maintaining eco-environmental safety and promoting sustainable regional development. With Maowusu sandy land as the study object, the temporal and spatial characteristics of land use and the driving forces were explored via spatial analysis technology—geographic information system. Then, a 2D relation judgment matrix was constructed by evaluating the importance of ecosystem service functions and ecological sensitivity. Next, restoration zoning of natural ecological space was performed, and relevant restoration suggestions were put forward accordingly. Results show that the land use in Maowusu sandy land has changed obviously in the past 30 years, with construction land and forest continuously expanded, cropland and grassland squeezed, and some areas of unutilized land effectively developed. Ecological service functions tend to weaken from southwest to northeast, whereas the ecologically sensitive zones are mainly distributed in the middle of Maowusu sandy land. The high-importance and high-sensitivity zones of natural ecological space account for 3.60% of the total area of natural ecological space, mainly distributed near Ejin Horo Banner. The comprehensive restoration project of soil and water conservation should be conducted in this zone to alleviate soil erosion and maintain the management and restoration of ecological protection red lines. Moderately important sensitive zones account for the largest proportion (80.42%) of the total area of natural ecological space, being widely distributed. In such zones, water resources should be taken as constraints, with the emphasis on ecological protection and improvement measures. Low-importance and low-sensitivity zones account for the smallest proportion, in which ecosystem protection, near-natural restoration, and moderate development and utilization should be carried out. This study aims to provide a scientific basis for reasonably protecting natural ecological resources and promoting the healthy and ordered development of natural ecosystems.
Keywords:
Maowusu sandy land
; land use
; ecological space
; ecosystem service function
; ecological sensitivity
; restoration zoning
1. Introduction
As one of the four major sandy lands in China, Maowusu sandy land is an important ecological security barrier in the sand control belt in northern China and is an important area for the development of national land space in the country. The sustainable development of Maowusu sandy land has a far-reaching effect on exerting the function of the ecological barrier and promoting social and economic development [1,2]. With the rapid economic and social development, the advancement of urbanization, and the construction of resource-based industrial bases in China, the area of Maowusu sandy land has become a hotspot to undertake industrial transfer in the eastern region [3]. However, this area is characterized by a fragile ecological environment and is highly sensitive to external disturbances such as climate change and human activities [4,5]. Driven by economic development and policy implementation [6], Maowusu sandy land is undergoing drastic economic and social transformation and land use change [7], accompanied by the increasingly prominent contradiction between ecological space and construction demand and the frequent occurrence of a series of ecological security problems, such as ecological structure destruction and functional degradation [8]. Therefore, identifying ecological space of Maowusu sandy land and performing restoration zoning will be of great significance to the sustainable development of this area [9,10].
Many countries have realized reasonable zoning of ecological space by spatial planning. For example, Germany took the lead in dividing national space into different regions and implementing spatial planning at the beginning of the 20th century [11], closely followed by countries in Europe, America, and Asia. For instance, in the early 20th century, the United States addressed land issues by implementing a land use zoning system tailored to the specific challenges of different periods. By the 21st century, the focus shifted toward marine resources, as evidenced by the introduction of initiatives like the Oceans Blueprint for the 21st Century and the National Ocean Policy Implementation Plan. These efforts emphasize the protection, sustainable development, and utilization of marine resources [12,13,14]. In Europe, the research on ecological space zoning tends to be quantitative. For example, Dutch scholar Janne Soininen conducted quantitative research on ecological space through the analysis of social space structure [15]; French scholar Govaert Lynn took the importance of ecology and evolution to population and community as the index for ecological evolution zoning [16]. The research on zoning of natural ecological space in China began with the protection of cropland [17]. To improve the quality of cropland and promote the sustainable utilization of land resources [18,19,20], China divided land into three types: cropland, construction land, and unutilized land, and then carried out more refined classification management in the protection of forest, water, and marine resources [21,22]. The current research on the zoning of natural ecological space in China mainly focuses on the identification and structural optimization of ecological space, the imbalance and reconstruction of ecological space, and the evolution and planning of ecological space [23,24].
The existing research provides a robust theoretical basis and technical support for the management of natural ecological space and can be a valuable reference for future studies. However, most of the research has concentrated on macro levels, and the spatial characteristics regarding the importance of ecosystem service functions in space and sensitivity to ecological environment have been less considered. Reasonably judging the spatial distribution differences in ecosystem service functions of natural ecological space and sensitivity to ecological environment and dividing spatial restoration zones serve as an effective means to realize the sustainable regional ecological and social development and maintain the steady development of ecosystem environment. Given this, the temporal and spatial characteristics of land use in the study area and the driving forces were explored via spatial analysis technology—geographic information system (GIS)—with Maowusu sandy land as the study area. Moreover, a 2D relation judgment matrix was established by evaluating the importance of ecosystem service functions and ecological sensitivity. Next, restoration zoning of natural ecological space was performed, and relevant restoration suggestions were raised. These efforts aim to provide a theoretical foundation and technical reference for scientifically protecting natural ecological resources in Maowusu sandy land and promoting the healthy and ordered development of natural ecosystems.
2. Materials and Methods
2.1. Overview of the Study Area
Maowusu sandy land, which is one of the four major sandy lands in China, is located at the southeast of Ordos Plateau and lies, as a whole, in the zigzag bend of the Yellow River (37 27.5′–39 22.5′ N, 107 20′–111 30′ E), with a total area of about 38,000 km2. In the north and west are denuded highlands, and it transits to the Loess Plateau in the east and south [25,26]. It is high in the northwest and low in the southeast, with an elevation of 1,094–1,553 m (Figure 1). In addition, this area belongs to the typical temperate continental semi-arid climate, with an average annual temperature of 6.8 °C–9.2 °C, annual precipitation of about 250–440 mm, and annual evaporation of 1,800–2,500 mm. Zonal chestnut soil and non-zonal aeolian sandy soil are dominant soil types [27,28]. The scarcity of precipitation seriously affects the growth of regional vegetation, with broad-leaved forests in the south and southeast, dry grasslands in the middle and east, and desert grasslands at the northern edge [29].
2.2. Data Sources and Preprocessing
The data needed in this study included normalized difference vegetation index (NDVI), net primary productivity (NPP) over years, soil type, meteorology, digital elevation model (DEM), and land use. After acquisition, the basic data were preprocessed, including projection, mask extraction, and resampling. Specifically, all basic data were uniformly projected as WGS 1984 UTM Zone 49N. The data sources and basic information are listed in Table 1.
2.3. Analysis Methods for Land Use Changes and Driving Forces
(1) Land use transfer matrix
The land use data in four periods—1990, 2000, 2010, and 2020—were subjected to spatial analysis via ArcGIS10.7, and a land use transfer matrix [30] was established, as shown as follows:
where S denotes land use area; n represents the number of land use types before and after the transfer; i (i=1, 2, 3... n) represents the land use type before the transfer; j (j=1, 2, 3... n) represents the land use type after the transfer; and Sij is the land use area transformed from type i before the transfer into type j after the transfer. The row of the matrix denotes the flow information from the area of type i before the transfer to the area of various land types after the transfer, and the column of the matrix denotes the source of the area of type j after the transfer from the area of various land types before the transfer.
(2) Land use dynamic degree
Land use dynamic degree is an index reflecting the dynamic change degree of land use types, including single and comprehensive land use dynamic degrees [31,32], where the former is expressed as follows:
where Ub and Ua represent the area of a single land use type at the end and beginning of one period, respectively; and T stands for the time frame.
The comprehensive land use dynamic degree is solved as
where LUi-j is the absolute value of the area transformed from type i to type j within time T.
(3) Gray relational model
The water resource status in the study area was reflected by selecting the water supply of surface water, groundwater, and other water sources. The socioeconomic characteristics were reflected by the total population, the per capita income of farmers and herdsmen, and the output of livestock products. The natural climatic features were characterized by the annual precipitation, annual mean temperature, and annual mean evaporation. The above indexes all served as the indicator values for the driving factors of the model.
X0={X0 (1), X0 (2), …, X0 (n)} is set as the reference series; and Xi={Xi (1), Xi (2), …, Xi (n)} is set as the compared series, i=1, 2, …, m. The correlation coefficient of Xi with X0 at point k is expressed as follows:
The relational degree of Xi to X0 is solved as
where ρ is the resolution coefficient, ρ=0.5. The values of r1, r2, …, rm were compared, and the relational order was acquired.
2.4. Evaluation of Ecosystem Service Functions and Ecological Sensitivity
Based on the ecological protection policy of Inner Mongolia Autonomous Region and the availability of background data, combined with the ecological problems faced by Maowusu sandy land at this stage, water conservation, water and soil conservation, biodiversity, and carbon sequestration service functions were chosen to evaluate and grade its ecosystem service functions. Soil erosion sensitivity and land desertification sensitivity indexes were selected to evaluate its ecological sensitivity. Table 2 shows the calculation method and required data of each index.
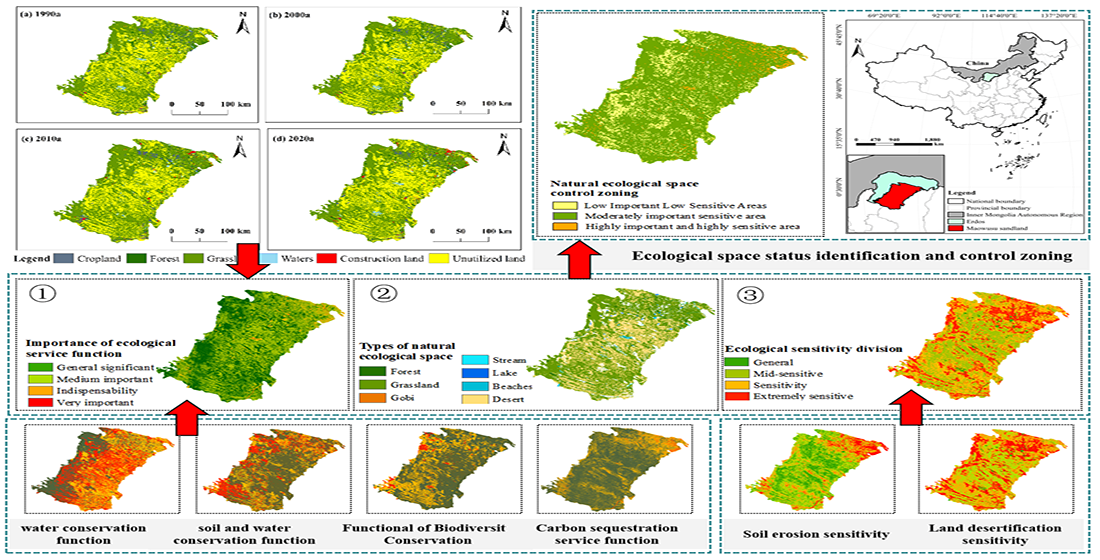
2.5. Natural Ecological Restoration Zoning
The cluster merging and convergence analysis were performed on the evaluation results of ecosystem service functions and eco-environmental sensitivity. According to the function index, ecosystem service functions were divided into four types: general importance, moderate importance, important and extremely important, and ecological sensitivity was divided into four types: general sensitivity, moderate sensitivity, sensitive and extremely sensitive. On this basis, the natural ecological space was classified and zoned by using the 2D relation judgment matrix method, as shown in Table 3.
3. Results
3.1. Analysis of Temporal and Spatial Characteristics of Land Use and Driving Forces
3.1.1. Temporal and Spatial Characteristics of Land Use
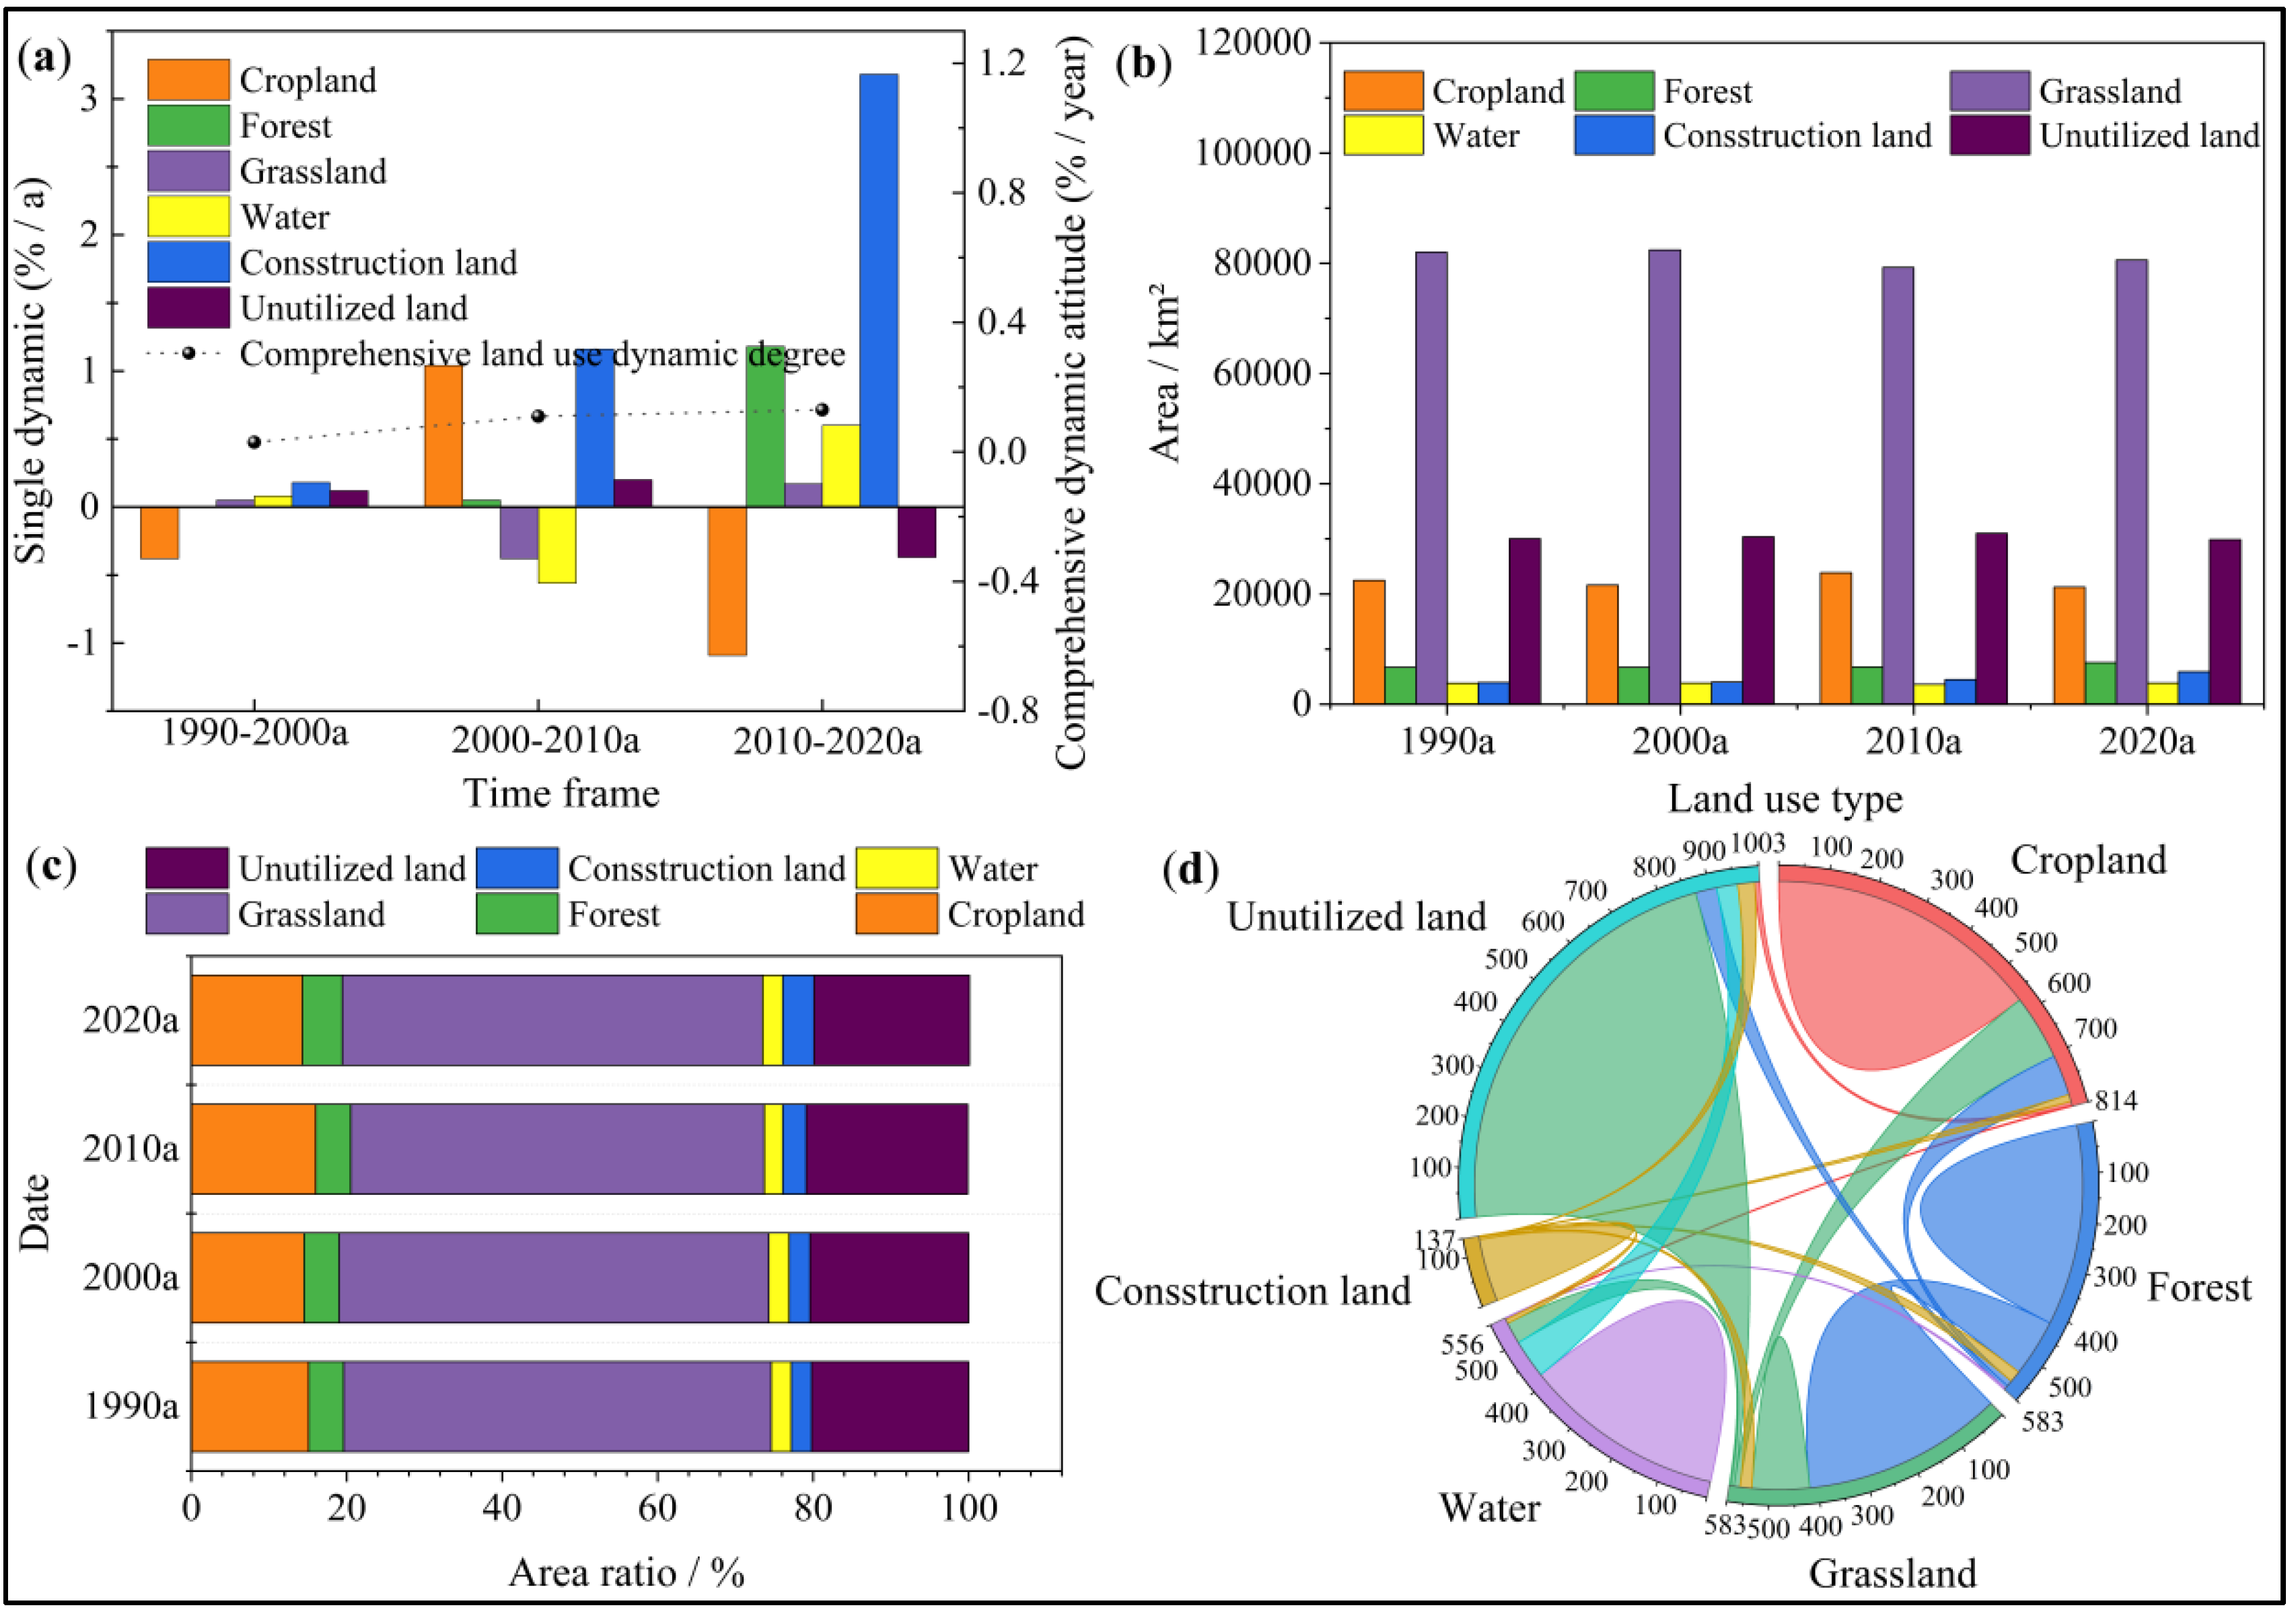
Using single and comprehensive dynamic degrees (Figure 3a) to analyze the change range of land use types in Maowusu sandy land revealed an upward trend in the comprehensive dynamic degree of land use. The values were 0.03%, 0.11%, and 0.13% for 1990–2000a, 2000–2010a, and 2010–2020a, respectively. The single dynamic degree of forest and construction land in these three time periods was positive, whereas the single dynamic degree of other land use types showed fluctuating changes. Particularly, the single dynamic degree of cropland decreased at an annual rate of −0.38% in 1990–2000a, increased at a rate of 1.04% in 2000–2010a, and decreased at a rate of −1.09% in 2010–2020a. The single dynamic degree of grassland increased at an annual rate of 0.05% in 1990–2000a, decreased at a rate of −0.38% in 2000–2010a, and increased at a rate of 0.17% in 2010–2020a. The single dynamic degree of waters increased at an annual rate of 0.08% in 1990–2000a, decreased at a rate of −0.56% in 2000–2010a, and increased at a rate of 0.60% in 2010–2020a. The single dynamic degree of unutilized land showed an upward trend in 1990–2000a and 2000–2010a, increasing at the rate of 0.12% and 0.20% each year, but decreasing at the rate of −0.37% in 2010–2020a.
As shown in Figure 2, Figure 3b and 3c, the distribution of construction land expanded continuously from the east and northeast edges of Maowusu sandy land to the west and southwest in the past 30 years, with a total increase of 1,961.1 km2 affected by human activities, and the area ratio increased from 2.6% in 1990a to 4.0% in 2020a. After long-term management of Maowusu sandy land, the area of forest increased by 829.3 km2, the proportion of forest increased from 4.5% in 1990a to 5.1% in 2020a, and the distribution of forest gradually expanded from the marginal area to the center. Cropland was mainly distributed at the southeast and northeast edges, with a small amount at the west edge. With the change of time, the cropland area showed a decreasing trend, with a total decrease of 1,211.1 km2, and the area ratio decreased from 15.1% in 1990a to 14.3% in 2020a. The grassland area initially increased, then decreased, and increased again, where it increased by 402.2 km2 in 1900–2000a, decreased by 3,152.7 km2 in 2000–2010a, and increased by 1,324.4 km2 in 2010–2020a, with a total decrease of 1,426.2 km2, and the area ratio decreased from 55.0% in 1990a to 50% in 2020a. The area of unutilized land increased initially and then decreased. From 1990 to 2020a, the area of unutilized land decreased by 185.5 km2, and the area ratio decreased from 20.2% in 1990a to 20.0% in 2020a. In 1990–2020a, the land use types in Maowusu sandy land changed obviously (Figure 3d). The unutilized land area mainly came from grassland, the construction land mainly came from cropland and forest, and the reduced part of waters was converted into unutilized land.
Overall, the distribution of land use types in Maowusu sandy land has notably changed in the past 30 years. Construction land and forest areas have continuously expanded, whereas the space occupied by cropland and grassland has been reduced. This period has also seen severe grassland degradation in some areas, increased potential desertification risk, and effective development of some areas of unutilized land. Land use changes presented a complicated pattern of “co-existence of ecological recovery and degradation,” making it necessary to pertinently strengthen natural ecological restoration.
Figure 3.
Statistical land use changes of Maowusu sandy land during 1990–2020a.
3.1.2. Driving Force Analysis
The influencing degree of each influencing factors on the land use changes of Maowusu sandy land was quantitatively analyzed via the gray relational model, with the results listed in Table 4. Among various land use types, cropland, forest, grassland, waters, and unutilized land were highly related to the annual mean temperature and annual mean evaporation, where the relational degree with annual mean temperature was 0.97, 0.98, 0.98, 0.98, and 0.99, respectively, and that with annual mean evaporation was 0.96, 0.98, 0.97, 0.97, and 0.98, respectively. Construction land showed the highest relational degree with total population, being 0.96. The driving factor having the minimum relational degree with land use types was always the per capita income of farmers and herdsmen, and the relational degrees of cropland, forest, grassland, waters, construction land, unutilized land and per capita income of farmers and herdsmen were 0.65, 0.65, 0.64, 0.64, 0.67, and 0.65, respectively. Analysis of the relational degree of land use types with each driving factor indicated that natural driving factors were the dominant factors influencing the changes in natural ecological space of Maowusu sandy land, among which the driving levels of annual mean temperature and annual mean evaporation were higher than that of other driving factors. Total population and natural driving factors were the main factors influencing the changes in construction land of Maowusu sandy land, where the driving level of total population was higher than that of natural driving factors, indicating that the development and utilization of construction land were significantly affected by human activities.
3.2. Evaluation of Ecosystem Service Functions
3.2.1. Evaluation of Water Conservation Function
The higher the importance index of water conservation function, the higher the requirement and value of the ecosystem service function, and the greater the constraint intensity on construction and development. The zoning results (Figure 4a) show that the water conservation function of Maowusu sandy land showed an obvious spatial distribution trend, being strong in the central region and relatively weak in the south and north. Judging from the importance index, the high-value zones accounted for 36.07% of Maowusu sandy land, mainly concentrated in the south of Wushen Banner and the east of Otog Banner. The reason is mainly attributed to the remarkable improvement of the vegetation coverage rate by ecological restoration measures implemented in recent years, thereby enhancing the water conservation capacity. The proportion of low-value zones was only 1.28%, which were relatively scattered, and the importance index of water conservation function in such zones was low because of the serious land desertification and steep terrains, which are not good for water conservation.
3.2.2. Evaluation of Water and Soil Conservation Function
The soil and water conservation function refers to the function of reducing soil erosion caused by water erosion through the interaction between its own structure and process in the ecosystem. The zoning results (Figure 4b) indicate that the high-value zones accounted for the smallest proportion and were distributed in the northeast of Maowusu sandy land. The zones with the importance index of soil and water conservation function being 35.0–101.1 accounted for the largest proportion (71.68%) of the total area. These zones were distributed in Hangjin Banner, Otog Banner, and Wushen Banner, and the distribution area was large in Wushen Banner. The extensive distribution area of such zones manifested that the water and soil conservation capacity of the study area is still in a weak state, and further strengthening the implementation of water and soil conservation engineering measures is still necessary. The water and soil loss results from the relatively loose soil texture, which impedes water storage.
3.2.3. Evaluation of Biodiversity Conservation Function
The biodiversity conservation function reflects the ability to maintain the diversity of species and ecosystems. According to the zoning results (Figure 4c), the total area of zones with biodiversity conservation function index of 0–0.2 and 0.2–0.5 was similar, accounting for 35.72% and 33.27% of the total area, respectively, and the two zones together accounted for about 70% of the total area. Thus, the overall biodiversity conservation ability of Maowusu sandy land is poor. This may be attributed to the degradation of ecosystems and the expansion of desertification, resulting in the rapid disappearance of many animal and plant species in Maowusu sandy land or the sharp decline of their population. At the same time, the land desertification in this area is serious, making it difficult to maintain biodiversity.
3.2.4. Evaluation of Carbon Sequestration Service Function
The carbon sequestration service function is the function of fixing carbon in plants or soil. The zoning results (Figure 4d) show that the carbon sequestration service function of Maowusu sandy land presented significant spatial heterogeneity. The zones with the importance index of carbon sequestration service function being 243.8–747.5 occupied a relatively large area, accounting for 57.56%, and they were mainly concentrated around Wushen Banner. Carbon sequestration could be effectively realized because of the relatively perfect ecosystems in such zones. High-value zones exhibited more prominent carbon sequestration capacity, but they only accounted for 18.18% of the total area and were mainly distributed in Otog Banner, Otog Front Banner, and the northern part of Maowusu sandy land. Most of these zones are typical grasslands and desert grasslands. Because of their rich vegetation types, the carbon reserve is significantly higher than that of zones mainly dominated by food crops and economic crops. On the whole, the carbon sequestration capacity of Maowusu sandy land is greatly influenced by ecological types, and grassland and desert grassland areas provide favorable carbon storage conditions.
3.2.5. Comprehensive Evaluation of Ecosystem Service Functions
The comprehensive index of ecosystem service functions in Maowusu sandy land was divided into four grades—generally important, moderately important, important, and extremely important—by cluster analysis (Figure 5). On the whole, the ecological service function index of Otog Banner and Otog Front Banner was the highest, presenting an overall trend of weakening from the southwest to the northeast. Generally important and moderately important zones occupied a relatively large area, accounting for 47.67% and 47.83% of the total area, respectively. The important zones accounted for a relatively small proportion (4.25%) of the total area, and the extremely important zones accounted for the smallest proportion (0.25%) of the total area. Thus, the overall ecosystem service function of the study area is weak, and ecological protection projects still need to be actively promoted in environmental protection and ecological construction.
3.3. Evaluation of Ecological Sensitivity
3.3.1. Water and Soil Loss Sensitivity
The sensitivity of Maowusu sandy land to water loss and soil erosion was comprehensively evaluated by using the equation model of soil erosion. The evaluation results (Figure 6a) show that the high-value zones accounted for 27.31% of the total area of the study area, mainly distributed in the middle of the sandy land. The reason for the high sensitivity of this area lies in the low vegetation cover, and the imbalance of ecological environment caused by overgrazing and unreasonable land use. The low-value zones accounted for the smallest proportion (8.52%) of the total area, mainly distributed in the northern part of the sandy land, where the vegetation cover was relatively high. The zones with water loss and soil erosion sensitivity index of 0.18–0.22 accounted for 40.61% of the total area of the study area. Overall, the water loss and soil erosion remain severe in Maowusu sandy land.
3.3.2. Land Desertification Sensitivity
As revealed by the spatial distribution of land desertification sensitivity (Figure 6b), the land desertification status in Maowusu sandy land was still serious. The zones with the land desertification sensitivity index of 0.5–1.1 accounted for the largest proportion (49.97%) of the total area of the study area; the high-value zones accounted for the smallest proportion (2.02%) of the total area. Land desertification is greatly affected by wind, and the damage of wind erosion is mainly caused by the decline of groundwater level, vegetation degradation, and low vegetation cover. The proportion of high-value zones was the smallest, reflecting that the implementation effect of sand control engineering measures has been improved compared with previous years. The zones with land desertification sensitivity index of 0.5–1.1 and 1.1–1.3 accounted for a high proportion, meaning that restoration work remains to be strengthened.
3.2.3. Comprehensive Evaluation of Ecological Sensitivity
The comprehensive evaluation result of ecological sensitivity was acquired by combining water loss and soil erosion sensitivity and land desertification sensitivity and divided into four grades in descending order (Figure 6c). In the study area, sensitive zones were mainly distributed in the center of Maowusu sandy land, extremely sensitive zones accounted for 2.05% of the total area, and moderately sensitive zones reached 42.43%. The above analysis indicates the relatively high ecological sensitivity of the study area, requiring relevant departments to enhance ecological protection in this area.
3.4. Restoration Zoning of Natural Ecological Space
According to the Measures for the Control of the Use of Natural Ecological Space (Trial) in China, data with natural attributes, including grassland, forest, lake, river, beach, and other natural ecological space types, were extracted to form a natural ecological space (Figure 7a). The natural ecological space of the study area was zoned by combining the evaluation of the importance of ecosystem service functions (Figure 7b) and ecological sensitivity (Figure 7c) in the study area.
3.4.1. High-Importance and High-Sensitive Zones
High-importance and high-sensitivity zones refers to the zones with extremely high characteristics in ecological service function and ecological sensitivity. The evaluation results (Figure 7d) show that the high-importance and high-sensitivity zones accounted for 3.60% of the total area of natural ecological space, mainly distributed near Ejin Horo Banner. These zones have relatively more construction land with a more complicated distribution of forest and grassland, which results in relatively fragile ecological environment, serious water loss and soil erosion, and prominent resource–environment contradiction. To cope with this situation, water and soil conservation capacity and water conservation capacity should be strengthened by implementing comprehensive government projects, thereby improving the ecological service capacity of this area. Efforts should also be made to strengthen the biodiversity conservation in natural reserves and manage and restore ecological protection red lines, ensuring the sustainable development of ecosystems.
3.4.2. Moderately Important and Sensitive Zones
Moderately important and sensitive zones refer to zones with moderate ecological service function and ecological sensitivity, which accounted for the largest proportion (80.42%) of the total area of natural ecological space in this area, presenting a widely spatial distribution. Overall, the eco-environmental status in such zones is good and plays the role of an important ecological corridor connecting the ecosystems in high-importance and high-sensitivity zones with those in low-importance and low-sensitivity zones. However, the water conservation function in such zones is general, and water loss, soil erosion, and land desertification are prominent, making it especially important to manage and protect water resources. Therefore, water resources should be taken as important constraints, and the emphasis should be laid on ecological protection in land use and production activities, ensuring the maintenance and improvement of ecological functions.
3.4.3. Low-Importance and Low-Sensitivity Zones
Low-importance and low-sensitivity zones are those with low levels of ecosystem service functions and ecological sensitivity. Such zones accounted for 15.97% of the total area of natural ecological space, accompanied by general carbon sequestration service function and extreme sensitivity to water loss and soil erosion. Accordingly, focus should be on vegetation recovery. On the precondition of not destructing ecological environment and giving priority to protection, scientific governance should be conducted to realize protection and near-natural restoration of desert ecosystems.
4. Discussion
Since the end of the 20th century, driven by the implementation of the project “Returning Farmland to Forest and Grassland” in China [38], the grassland area of Maowusu sandy land has been greatly enlarged [39]. However, the grassland degradation in some areas is still severe, the potential desertification risk is aggravated [40], and the land use change presents a complex pattern of “co-existence of ecological restoration and degradation.” The study of land use change and its driving forces is helpful to deeply understand the present situation and variation trend of regional land use and determine the internal mechanism and basic process of land use changes [41,42]. Land use change is a dynamic process influenced by many factors, such as nature and society. Among the natural factors, climate and hydrology are the basic conditions that affect land use change, and they are the main driving forces of ecological land use change, exerting a cumulative effect in a long time series [43,44]. This study finds that natural driving factors are the dominant factors affecting the natural ecological space change in Maowusu sandy land, and the driving levels of annual mean temperature and annual mean evaporation are higher than those of other driving factors. In addition, the total population and natural driving factors are the dominant factors affecting the change of construction land in Maowusu sandy land, in which the driving level of total population is higher than that of other natural driving factors. Hence, the development and utilization of construction land are significantly affected by human activities.
Natural ecological space refers to the space with natural attributes that can provide ecological products or take ecological functions as the leading function [45]. Natural ecological space restoration aims to protect natural ecological resources reasonably, improve the ecological environment, realize the sustainable utilization of resources, alleviate the contradiction between the excessive expansion of construction space and ecological protection, and promote the sustainable development of cities [46]. Therefore, the restoration zoning of natural ecological space can serve as strong support for ecological protection planning, land use planning, and urban development planning to ensure the healthy development of the ecological environment in the study area during the economic transformation period [47,48,49]. Through the evaluation and classification of its ecosystem service functions and ecological sensitivity, the results show that the four selected important ecosystem service function zones are different in spatial distribution. The extremely important zones of water conservation function are concentrated in the middle of Maowusu sandy land, namely, Wushen Banner and Otog Banner; the extremely important zones of soil and water conservation function are concentrated in the north of Maowusu sandy land, namely, Yijin Horo Banner; the extremely important zones of biodiversity are concentrated in the north of Maowusu sandy land, accounting for a relatively small proportion; and the extremely important zones of carbon sequestration service function are widely distributed, mainly distributed in Otog Front Banner and Otog Banner. The spatial distribution of water loss and soil erosion sensitivity and land desertification sensitivity is different. The zones sensitive and extremely sensitive to water loss and soil erosion account for a large proportion and are widely distributed, whereas the high-value zones of land desertification sensitivity are relatively scattered. The main reason is that these zones experience low annual mean precipitation and lack groundwater, leading to the low vegetation cover and susceptibility to wind erosion. Moreover, the unreasonable land use and the abuse of water resources by humans have aggravated water loss, soil erosion, and land desertification. Overall, the differences in the distribution of importance and sensitivity of ecosystem service functions reflect the challenges faced by this area between ecological protection and sustainable socioeconomic development.
At present, researchers have established a national spatial planning system in terms of supply and demand of ecosystem services [50], red line delineation of ecological protection [51], optimal allocation of land use [52], and ecological restoration of national space [53]. However, their studies differ from the present one in terms of emphasis. In this study, when performing natural ecological space zoning of Maowusu sandy land, its ecological sensitivity and ecosystem service functions are fully considered, the attributes of natural ecological space are planned as a whole, and classification and zoning measures are implemented according to the specific local conditions. Therefore, the restoration zoning results of natural ecological space are relatively reliable. This study can provide the corresponding theoretical basis for ecological planning of Maowusu sandy plan and facilitate the coordinated development of construction and ecological protection.
5. Conclusions
The restoration zoning of natural ecological space focuses on the improvement of natural ecological environment and the rational utilization of natural resources, which is an important way to seek for the sustainable and healthy development of regional ecological environment. In this study, the temporal and spatial characteristics of land use in the study area—Maowusu sandy land—and the driving forces were explored. Restoration zoning of natural ecological space was performed via GIS based on the identification of the importance of ecosystem service functions and ecological sensitivity. The results showed that the construction land and forest in Maowusu sandy land have increased continuously in the past 30 years, increasing by 1,961.1 km2 and 829.3 km2, respectively; and the space of cropland and grassland has reduced, decreasing by 1,211.1 km2 and 1,426.2 km2, respectively. Some areas of unutilized land were effectively developed, and the area has decreased by 185.5 km2. The evaluation results of ecological service functions indicate that the overall ecosystem service function tended to weaken from southwest to northeast. Generally important zones and moderately important zones accounted for large area ratios, being 47.67% and 47.83%, respectively; important zones accounted for a relatively small proportion (4.25%); and extremely important zones occupied the least area, accounting for 0.25% of the total area. The evaluation results of ecological sensitivity imply that sensitive zones were mainly distributed in the middle of Maowusu sandy land; in addition, extremely sensitive zones only accounted for 2.05% of the total area of the study area, whereas moderately sensitive zones accounted for 42.43%. The zoning results of natural ecological space showed that the high-importance and high-sensitivity zones accounted for 3.60% of the total area of natural ecological space, mainly distributed near Ejin Horo Banner. The comprehensive restoration project of soil and water conservation should be performed in such zones to alleviate soil erosion and maintain the management and restoration of ecological protection red lines. Moderately important and sensitive zones accounted for the largest proportion (80.42%) of the total area of natural ecological space, and they were extensively distributed. In these zones, the focus should be on ecological protection and improvement of ecological measures and activities with water resources as important constraints; low-importance and low-sensitivity zones accounted for the smallest proportion, in which ecosystem protection, near-natural restoration, and moderate development and utilization should be conducted.
Author Contributions
T. Z., Conceptualization, Formal analysis, Investigation, Methodology, Supervision, Visualization, Writing—original draft, Writing—review and editing; P. X., Investigation, Writing—original draft, Data curation, Formal analysis; Z. Y., Investigation, Methodology, Visualization; J. G., Investigation, Methodology, Visualization.
Funding
This study was conducted with the support of the Inner Mongolia Autonomous Region’s Science and Technology Fund under the Prosper Mongolia Action Key Project (2022EEDSKJXM003).
Data Availability Statement
The original contributions presented in this study are included in the Supplementary Materials; further inquiries can be directed to the corresponding author.
Conflicts of Interest
The authors declare that the research was conducted in the absence of any commercial or financial relationships that could be construed as potential conflicts of interest.
References
- Liang, P., Yang, X. P. Landscape spatial patterns in the Maowusu (Mu Us) Sandy Land, northern China and their impact factors. CATENA. 2016;145 (0):321-333. [CrossRef]
- Gao, W. D., Zheng, C., Li, X. H. NDVI-based vegetation dynamics and their responses to climate change and human activities from 1982 to 2020: A case study in the Mu Us Sandy Land, China. Ecological Indicators. 2022;137 (0):108745-108745.
- Li, Y. R., Cao, Z., Long, H. L. Dynamic analysis of ecological environment combined with land cover and NDVI changes and implications for sustainable urban–rural development: The case of Mu Us Sandy Land, China. Journal of Cleaner Production. 2017;142 (0):697-715. [CrossRef]
- Min Lin, Lizhu Hou, Zhiming Qi, et al. Impacts of climate change and human activities on vegetation NDVI in China’s Mu Us Sandy Land during 2000–2019. Ecological Indicators. 2022;142 (0):109164-109164. [CrossRef]
- Sun, Z. H., Mao, Z. A., Yang, L. Y. Impacts of climate change and afforestation on vegetation dynamic in the Mu Us Desert, China. Ecological Indicators. 2021;129 (0):108020-108020. [CrossRef]
- Karnieli, A., Qin, Z. H., Wu, B. Spatio-Temporal Dynamics of Land-Use and Land-Cover in the Mu Us Sandy Land, China, Using the Change Vector Analysis Technique. Remote Sensing. 2014;6 (10):9316-9339. [CrossRef]
- Li, S., Wang, T., Yan C. Assessing the Role of Policies on Land-Use/Cover Change from 1965 to 2015 in the Mu Us Sandy Land, Northern China. Sustainability. 2017;9 (7):1164-1164. [CrossRef]
- Zhang, M. M., Wu, X. L. The rebound effects of recent vegetation restoration projects in Mu Us Sandy land of China. Ecological Indicators. 2020;113 (0):106228-106228. [CrossRef]
- Sadeghi, S. H., Chamani, R., Silabi, M. Z. Watershed health and ecological security zoning throughout Iran. Science of The Total Environment. 2023;905 (0):167123-167123. [CrossRef]
- Li, F., Chen, X. C. Method and control measures of ecological space zoning in Pearl River Delta urban agglomeration. Acta Ecologica Sinica. 2021;41 (13):0-0. [CrossRef]
- Wen, L. J., Zhang, J. J. Land space control, land unbalanced development and externality research : review and prospect. Land science in China. 2015;29 (07) : 4-12. [CrossRef]
- Ellickson, R. C. Alternatives to Zoning: Covenants, Nuisance Rules, and Fines as Land Use Controls. University of Chicago Law Review. 1973;40 (4):681-681. [CrossRef]
- Chapman, M. R., Kramer, D. L. Gradients in coral reef fish density and size across the Barbados Marine Reserve boundary: effects of reserve protection and habitat characteristics. Marine Ecology Progress Series. 1999;181 (0):81-96. [CrossRef]
- Rosenberg, A. A. Changing U.S. Ocean Policy Can Set a New Direction for Marine Resource Management. Ecology and Society. 2009;14 (2):0-0. [CrossRef]
- Soininen, J. Spatial structure in ecological communities – a quantitative analysis. Oikos. 2015;125 (2):160-166. [CrossRef]
- Govaert, L., Pantel, J. H., Meester, L. D. Eco-evolutionary partitioning metrics: assessing the importance of ecological and evolutionary contributions to population and community change. Ecology Letters. 2016;19 (8):839-853. [CrossRef]
- Yanan Liu, Kening Wu, Xiaoliang Li, et al. Adaptive Management of Cultivated Land Use Zoning Based on Land Types Classification: A Case Study of Henan Province. Land. 2022;11 (3):346-346. [CrossRef]
- Zhao, R., Li, J. Y., Wu, K. N. Cultivated Land Use Zoning Based on Soil Function Evaluation from the Perspective of Black Soil Protection. Land. 2021;10 (6):605-605. [CrossRef]
- Zhao, R., Zhang, X. D., Gabriel, J. L. Classification of agricultural land consolidation types based on soil security to improve limiting factors adapted to local soil conditions. Land Degradation & Development. 2023;34 (11):3098-3113. [CrossRef]
- Zhang, A. L., Wang, S. L., Zhang, Z. P. Classification and Evaluation of Marginal Land for Potential Cultivation in Northwest China Based on Contiguity and Restrictive Factors. Agronomy. 2024;14 (10):2413-2413. [CrossRef]
- Zhai, H.B., Zhao, Z. N., Zhang, Y. S. Research on the reform of forest resource asset use control system. Forestry resource management. 2014; 12 (06) : 16-20. [CrossRef]
- Dong Y. E., Xu, W., Teng, X. Research on GIS-based marine functional zoning implementation evaluation method. Ocean development and management. 2014;31 (11) : 27-31. [CrossRef]
- Wu, Z., Chen, S. J., Xu, K. Ecological network resilience evaluation and ecological strategic space identification based on complex network theory: A case study of Nanjing city. Ecological Indicators. 2024;158 (0):111604-111604. [CrossRef]
- Zhang, J., Yan, C., Zhu, C. Identification of Potential Land-Use Conflicts between Agricultural and Ecological Space in an Ecologically Fragile Area of Southeastern China. Land. 2021;10 (10):1011-1011. [CrossRef]
- Zhang, Y. Z., Zheng, T. Y., Chen, Y. Multi-Perspective Analysis of Land Changes in the Transitional Zone between the Mu Us Desert and the Loess Plateau in China from 2000 to 2020. Land. 2023;12 (5):1103-1103. [CrossRef]
- Li, J., Yu, L., Wang, X. H. Exploring the Spatial-Temporal Patterns, Drivers, and Response Strategies of Desertification in the Mu Us Desert from Multiple Regional Perspectives. Sustainability. 2024;16 (21):9154-9154. [CrossRef]
- Huang, Y. G., Wang, N. A., He, T. B. Historical desertification of the Mu Us Desert, Northern China: A multidisciplinary study. Geomorphology. 2009;110 (3-4):108-117. [CrossRef]
- Zhang, C. X., Wang, X. M., Li, J.C. Identifying the effect of climate change on desertification in northern China via trend analysis of potential evapotranspiration and precipitation. Ecological Indicators. 2020;112 (0):106141-106141. [CrossRef]
- Zhu, Z. C., Shao, M.G., Jia, X. X. Rainfall partitioning characteristics and simulation of typical shelter forest in Chinese Mu Us Sandy Land. The Science of The Total Environment. 2024;945 (0):174091-174091. [CrossRef]
- Wang, C. D., Wang, Y. T., Wang, R. Q. Modeling and evaluating land-use/land-cover change for urban planning and sustainability: A case study of Dongying city, China. Journal of Cleaner Production. 2018;172 (0):1529-1534. [CrossRef]
- Chen, M., Wu, C., Wu, J. Spatiotemporal changes of coastal land use land cover and its drivers in Shanghai, China between 1989 and 2015. Ocean & Coastal Management. 2023;244 (0):106802-106802. [CrossRef]
- Song, W., Deng, X. Z. Land-use/land-cover change and ecosystem service provision in China. Science of The Total Environment. 2017;576 (0):705-719.
- Wang, Z. Y., Zhang, H. J., Wang, Y. Y. Corrigendum to “Deficit irrigation decision-making of indigowoad root based on a model coupling fuzzy theory and grey relational analysis” [Agric. Water Manag. 275 (2023) 107983]. Agricultural Water Management. 2023;277 (0):108133-108133. [CrossRef]
- Chen, Z., Zhang, X.Y., Han, Y. Effects of Forest Conversion on Soil Ecosystem Services in Liuxihe National Forest Park, China. Forests. 2022;13 (10):1650-1650. [CrossRef]
- Huang, Z., Qian, L.Y., Cao, W. Z. Developing a Novel Approach Integrating Ecosystem Services and Biodiversity for Identifying Priority Ecological Reserves. Resources, Conservation and Recycling. 2022;179 (0):106128-106128.
- Lin, T., Wang, R. Y. The Evaluation of Land Use Evolution and Ecological Sensitivity of Guangzhou Based on GIS and RS. International journal of rural development, environment and health research. 2023;7 (4):47-58. [CrossRef]
- Zhang, Q. Q., Yang, Y., Zhao, Z. Q. Identification of Harbin Ecological Function Degradation Areas Based on Ecological Importance Assessment and Ecological Sensitivity. Sustainability. 2024;16 (16):6763-6763. [CrossRef]
- Wang, B., Gao, P., Niu, X. Policy-driven China’s Grain to Green Program: Implications for ecosystem services. Ecosystem Services. 2017;27 (0):38-47.
- Li, Y. R., Cao, Z., Long, H. L. Dynamic analysis of ecological environment combined with land cover and NDVI changes and implications for sustainable urban–rural development: The case of Mu Us Sandy Land, China. Journal of Cleaner Production. 2017;142 (0):697-715. [CrossRef]
- Zhang, D., Deng, H. Historical human activities accelerated climate-driven desertification in China’s Mu Us Desert. Science of The Total Environment. 2020;708 (0):134771-134771. [CrossRef]
- Tessema, M. W., Abebe, B. G., Bantider, A. Physical and socioeconomic driving forces of land use and land cover changes: the case of Hawassa City, Ethiopia. Frontiers in Environmental Science. 2024;12 (0):0-0. [CrossRef]
- Sharma, B., Kumar, J., Collier, N. Quantifying Carbon Cycle Extremes and Attributing Their Causes Under Climate and Land Use and Land Cover Change From 1850 to 2300. Journal Of Geophysical Research: Biogeosciences. 2022;127 (6):0-0. [CrossRef]
- Mgalula, M. E., Majule, A. E., Saria, A. E. Land use and land cover changes and their driving forces in selected forest reserves in Central Tanzania. Trees Forests and People. 2024;16 (0):100584-100584. [CrossRef]
- Xu, J., Meng, M. h., Liu, Y. b. Assessing 30-Year Land Use and Land Cover Change and the Driving Forces in Qianjiang, China, Using Multitemporal Remote Sensing Images. Water. 2023;15 (18):3322-3322. [CrossRef]
- Gao, J. X., Xu, D. L., Qing, Q. Research on the construction and planning theory of natural ecological spatial pattern. ACTA ECOLOGICA SINICA. 2020;40 (03) : 749-755.
- Huang, X. Y., Zhao, X. M., Guo, X. Research on natural ecological space control zoning based on ecosystem service function and ecological sensitivity. ACTA ECOLOGICA SINICA. 2020;40 (03) : 1065-1076.
- Yuhang Zhang, Zhenqi Hu, Jiazheng Han, et al. Spatiotemporal Relationship between Ecological Restoration Space and Ecosystem Services in the Yellow River Basin, China. Land. 2023;12 (4):730-730. [CrossRef]
- Wessels, N., Sitas, N., Farrell, P. J. Inclusion of ecosystem services in the management of municipal natural open space systems. People and nature. 2023;6 (1):301-320. [CrossRef]
- Zuo, L. Y., Gao, J. B., Du, F. J. The pairwise interaction of environmental factors for ecosystem services relationships in karst ecological priority protection and key restoration areas. Ecological Indicators. 2021;131 (0):108125-108125.
- Zhou J., Feng, Z. X. Systematic conservation planning by integrating ecosystem services and biodiversity. Acta Ecologica Sinica. 2023;43 (2):0-0. [CrossRef]
- Ma, M. X., Zhang, H., Gao, J. X. Different methods comparison of delineating the ecological protection red line for biodiversity conservation. Acta Ecologica Sinica. 2019;39 (19):0-0. [CrossRef]
- Phinyoyang, A., Ongsomwang, S. Optimizing Land Use and Land Cover Allocation for Flood Mitigation Using Land Use Change and Hydrological Models with Goal Programming, Chaiyaphum, Thailand. Land. 2021;10 (12):1317-1317. [CrossRef]
- Chen, W. C., Gu, T. C., Xiang, J. W. Ecological restoration zoning of territorial space in China: An ecosystem health perspective. Journal of Environmental Management. 2024;364 (0):121371-121371. [CrossRef]
Figure 1.
Map of the study area.
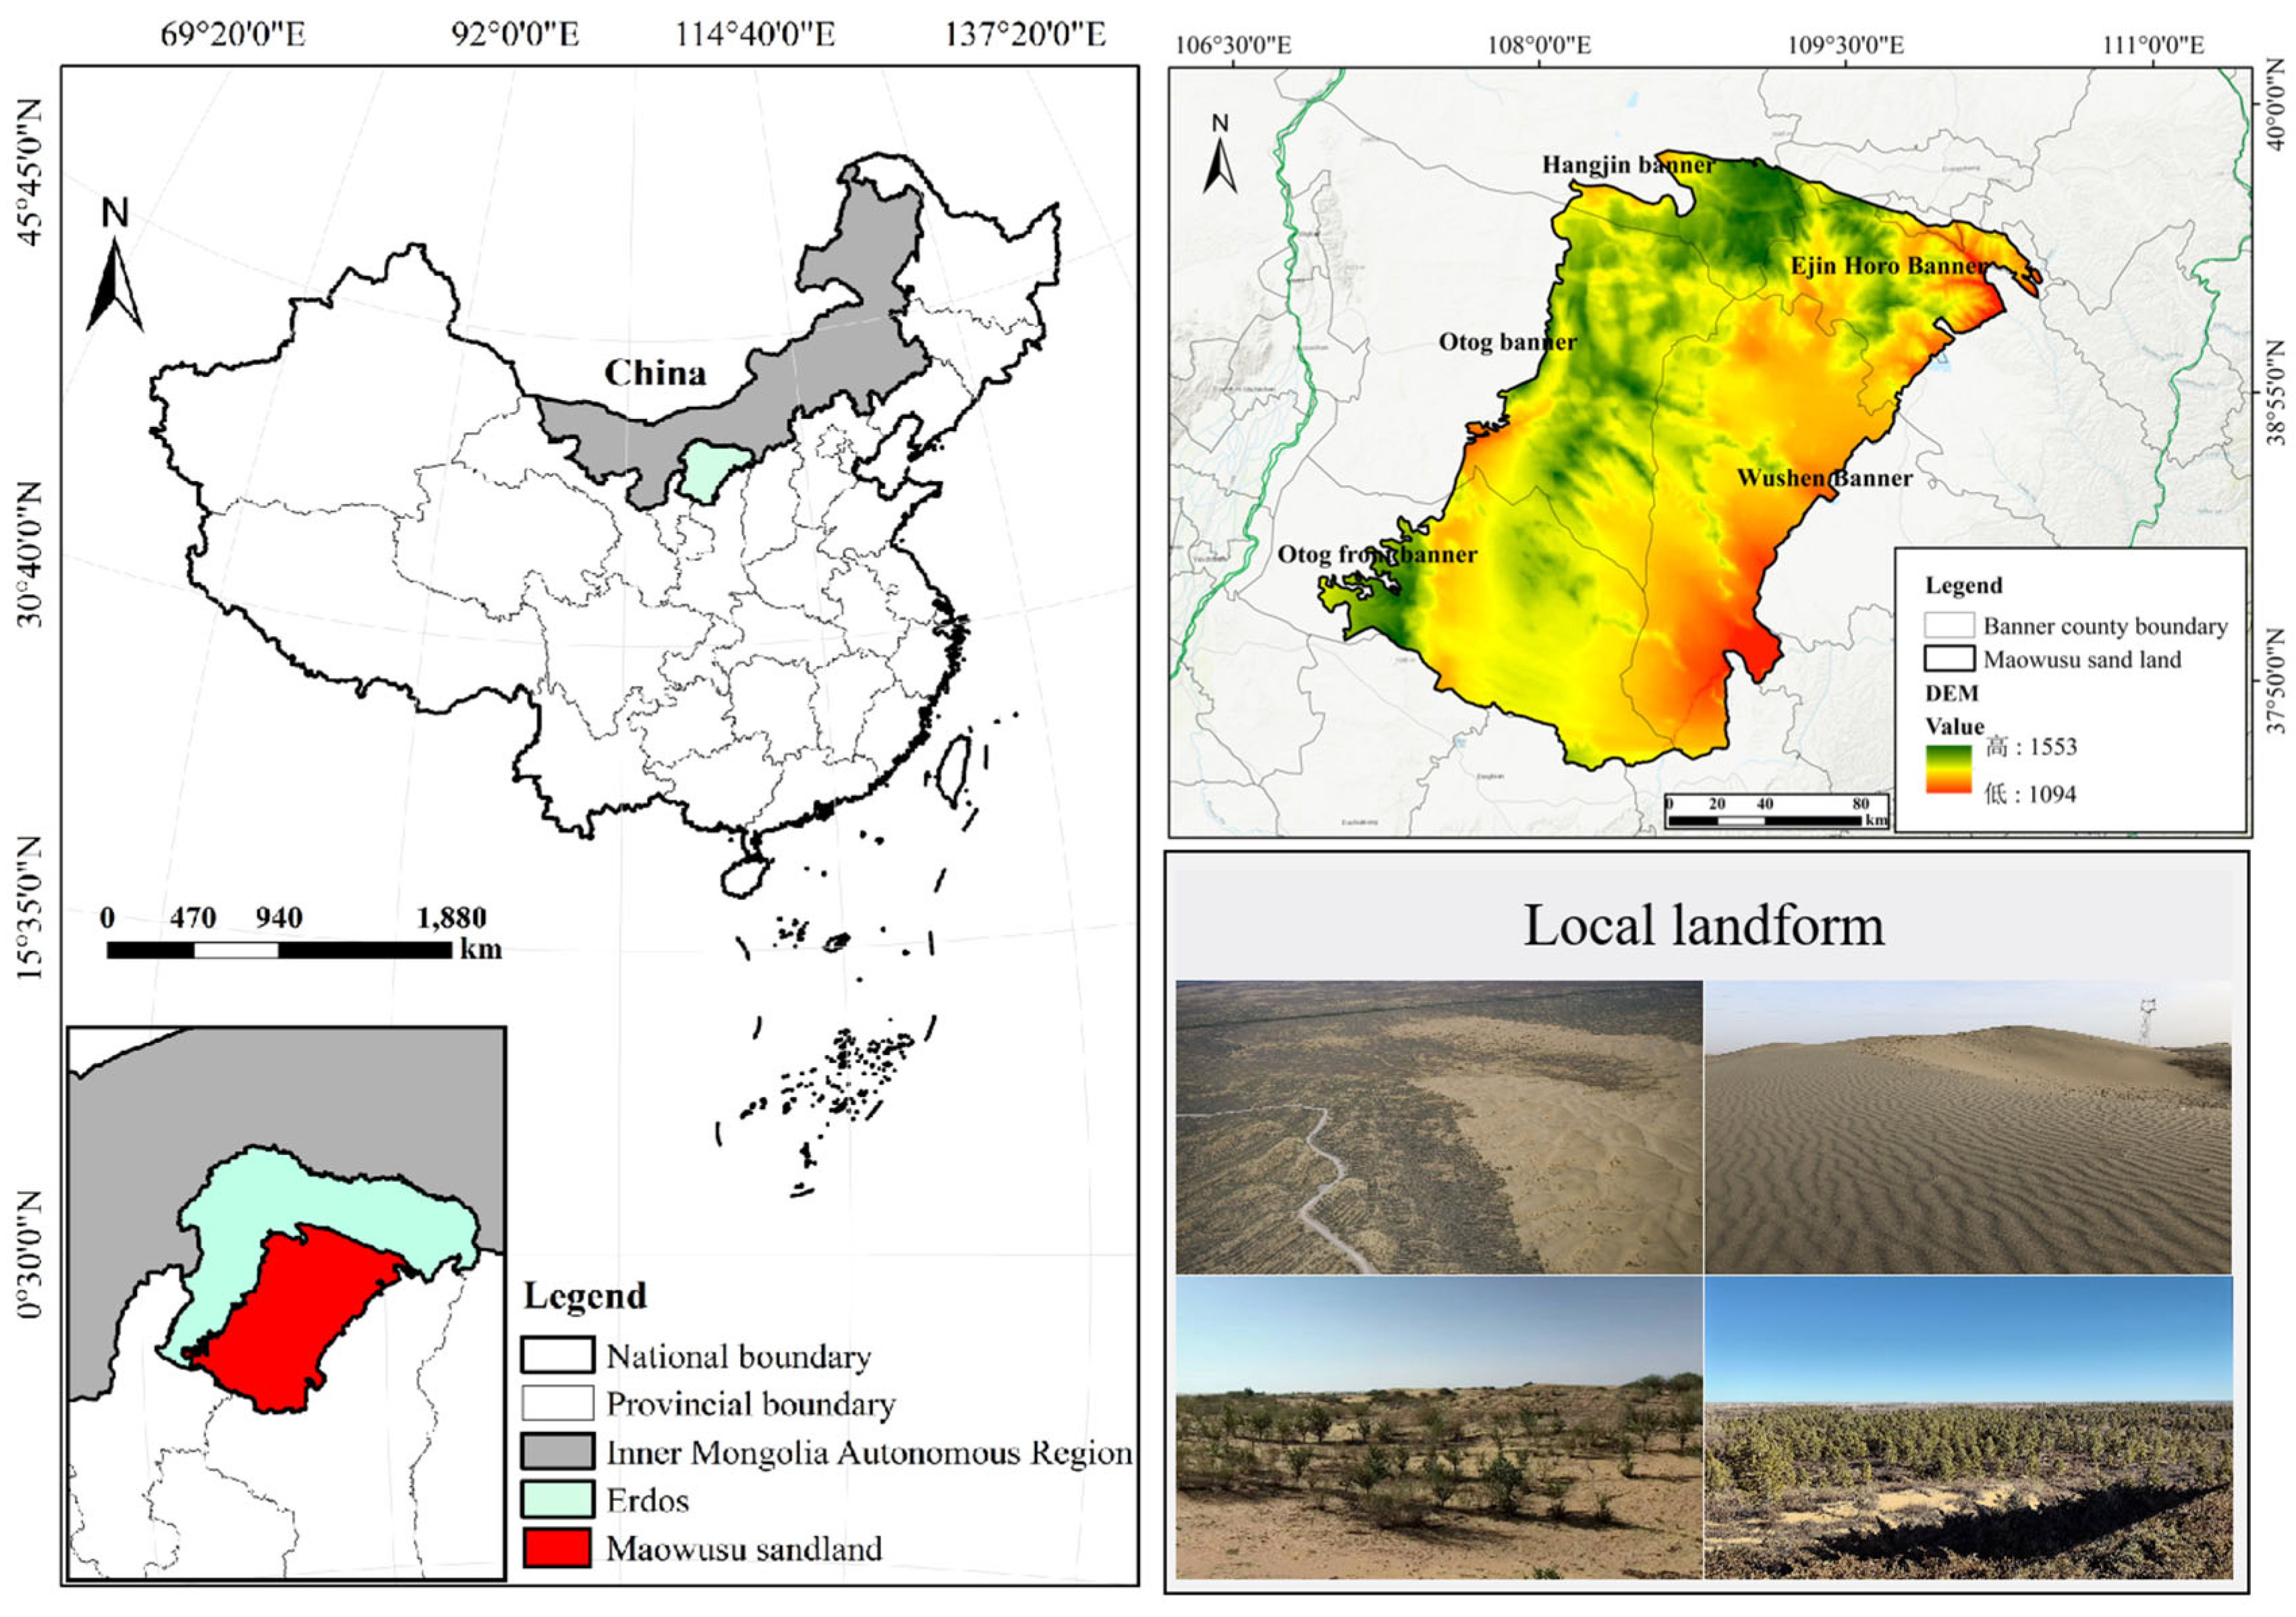
Figure 2.
Land use type distribution of Maowusu sandy land during 1990–2020a.
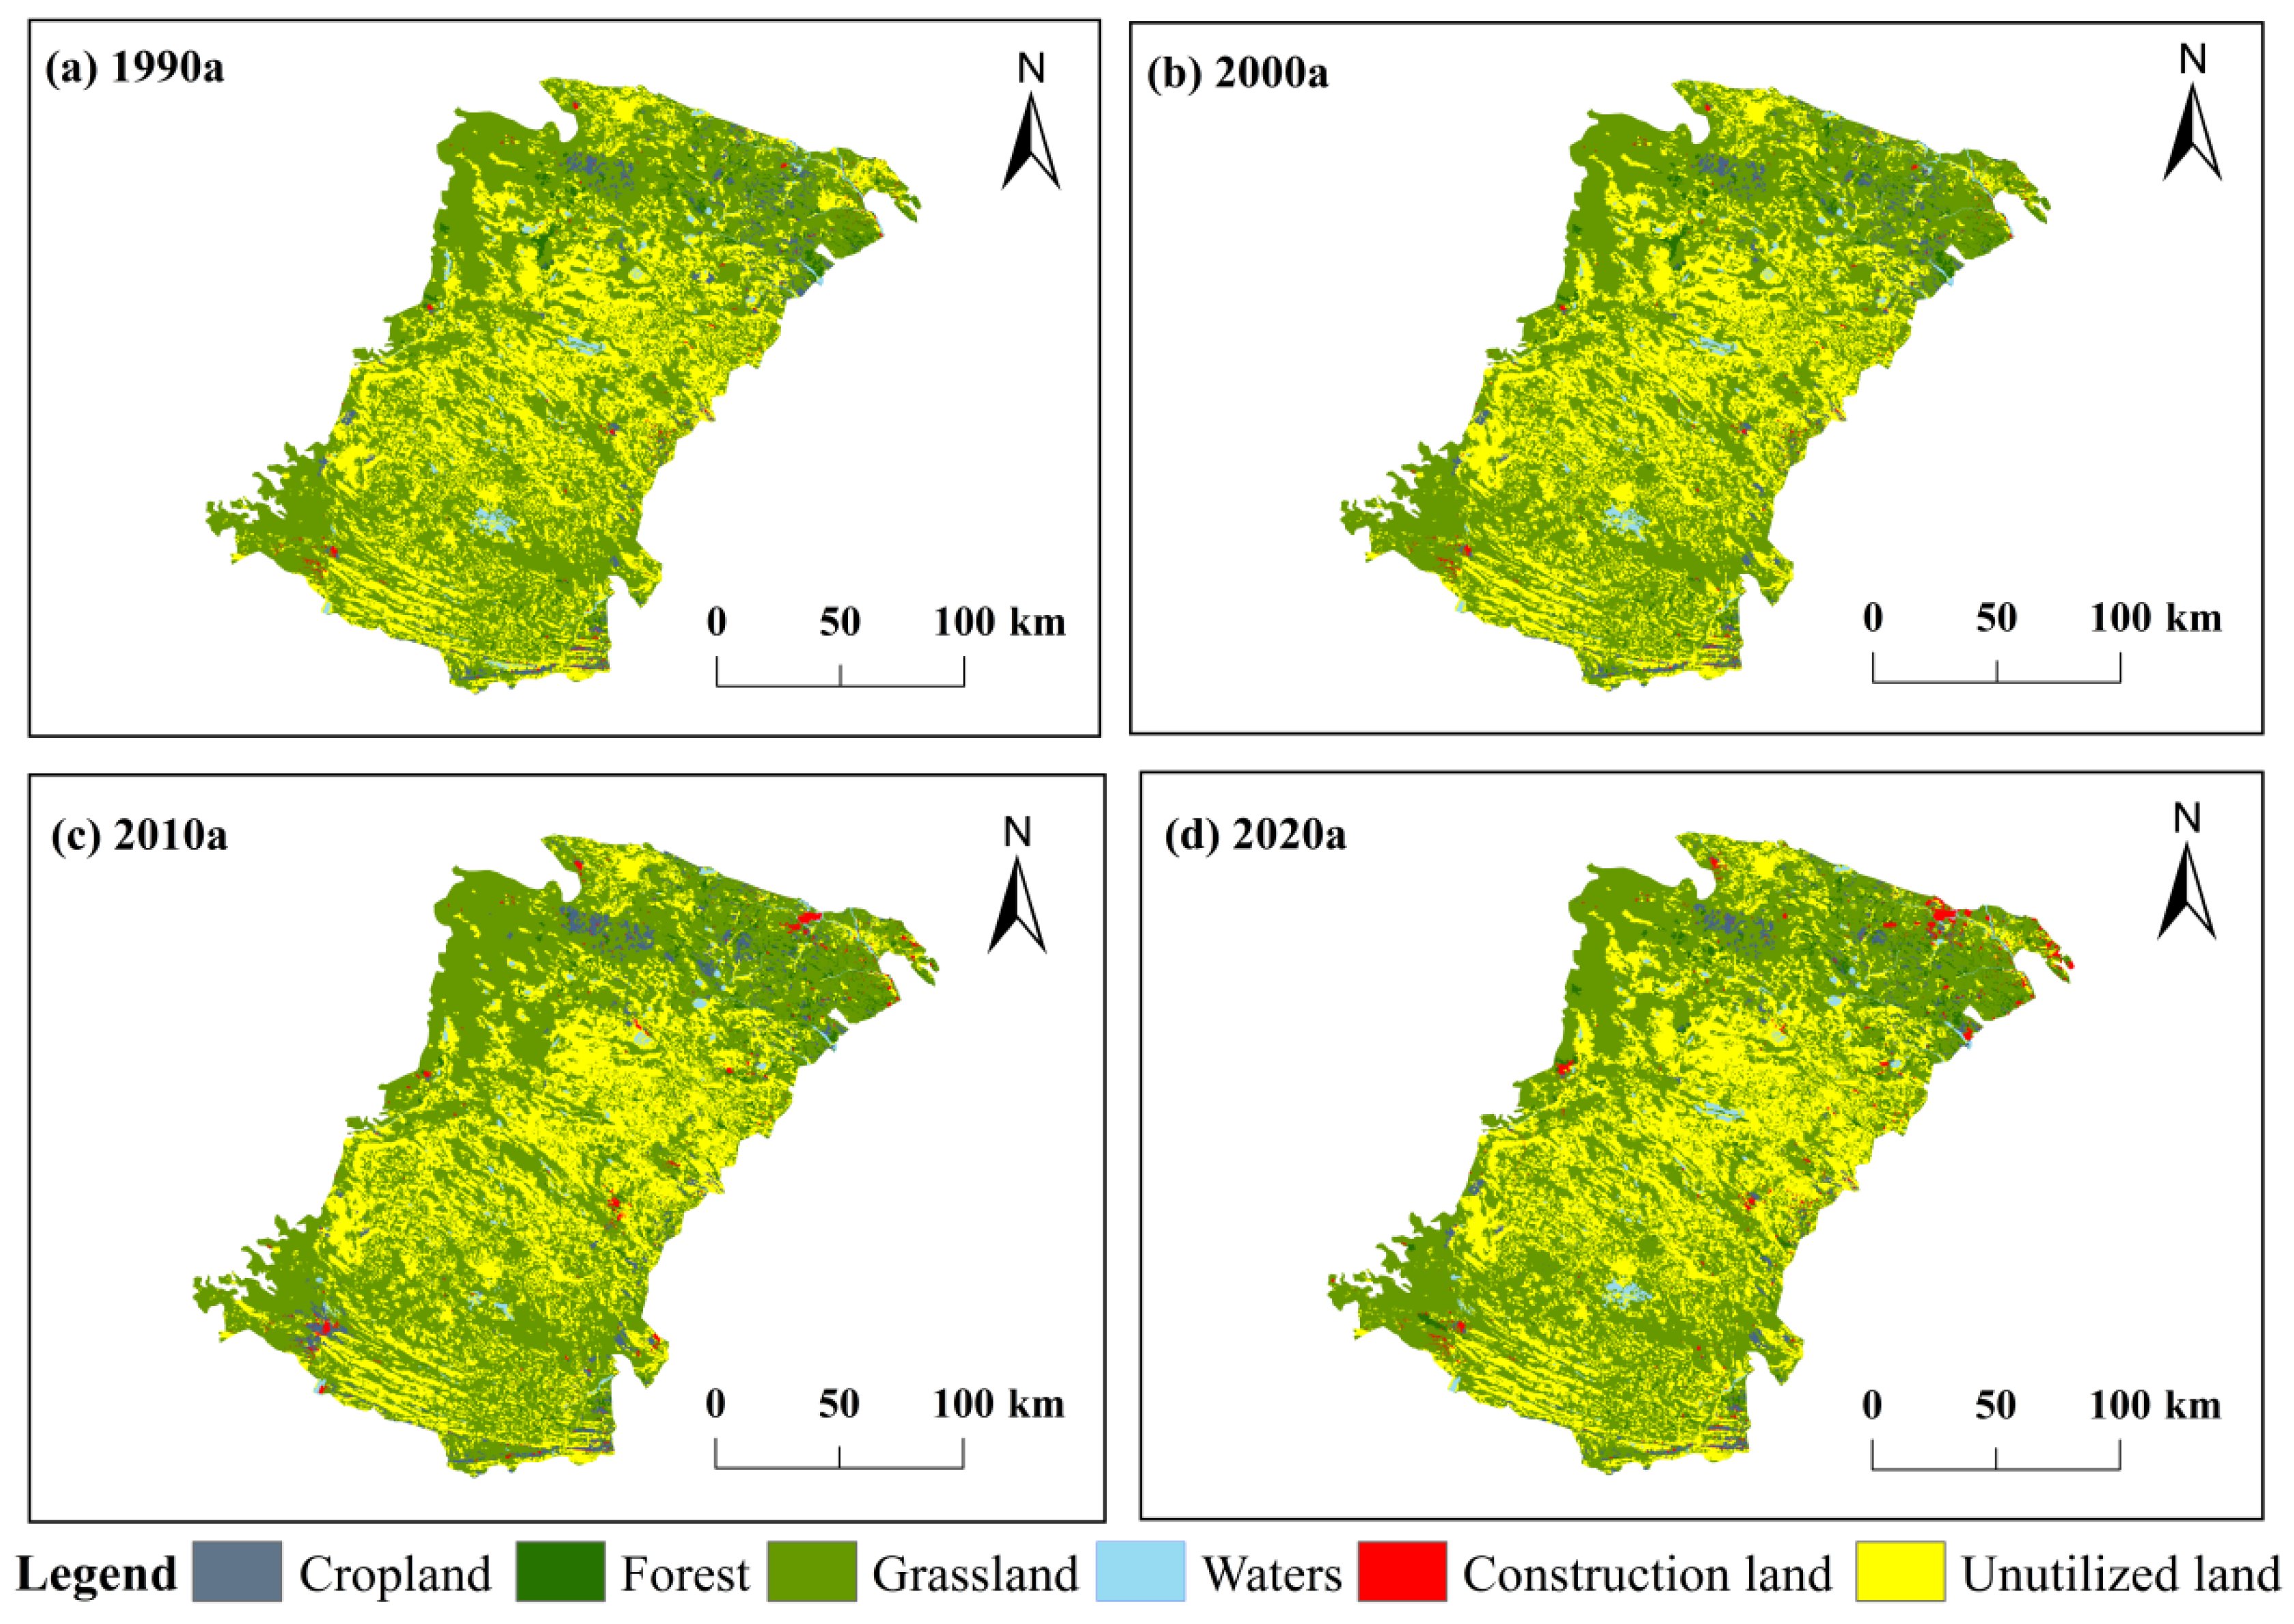
Figure 4.
Ecosystem service function indexes of Maowusu sandy land.
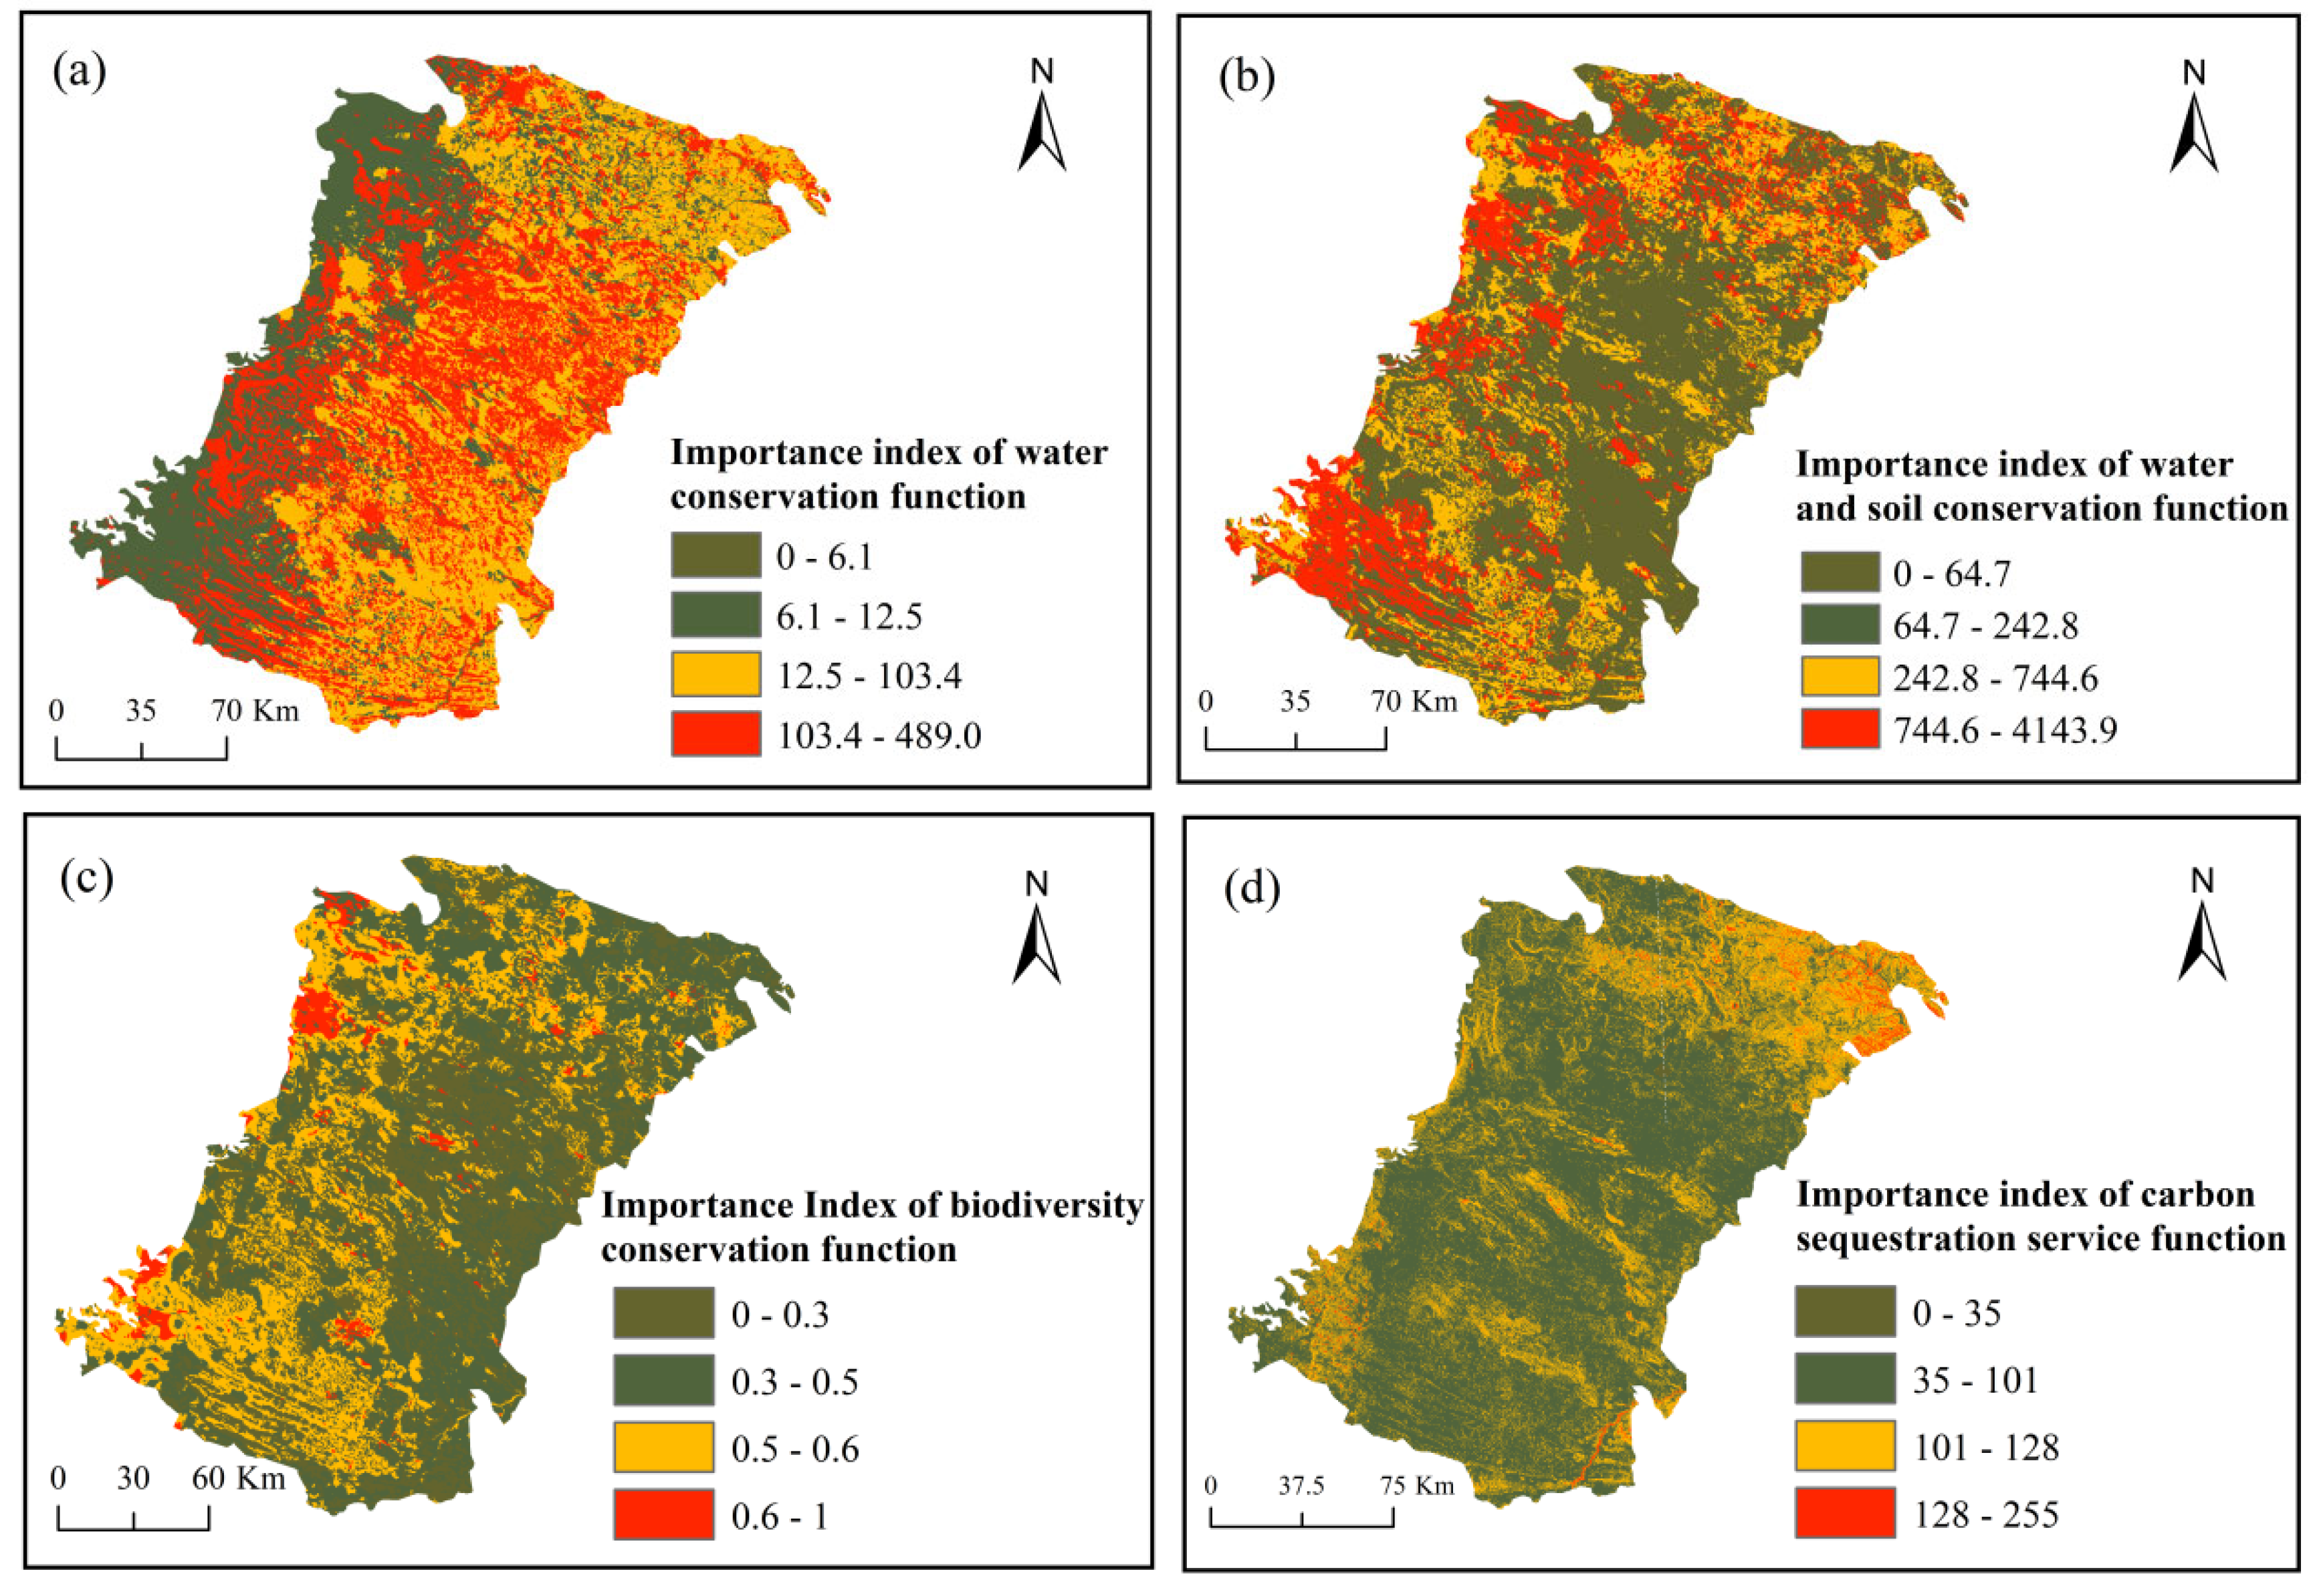
Figure 5.
Importance evaluation of ecosystem service functions.
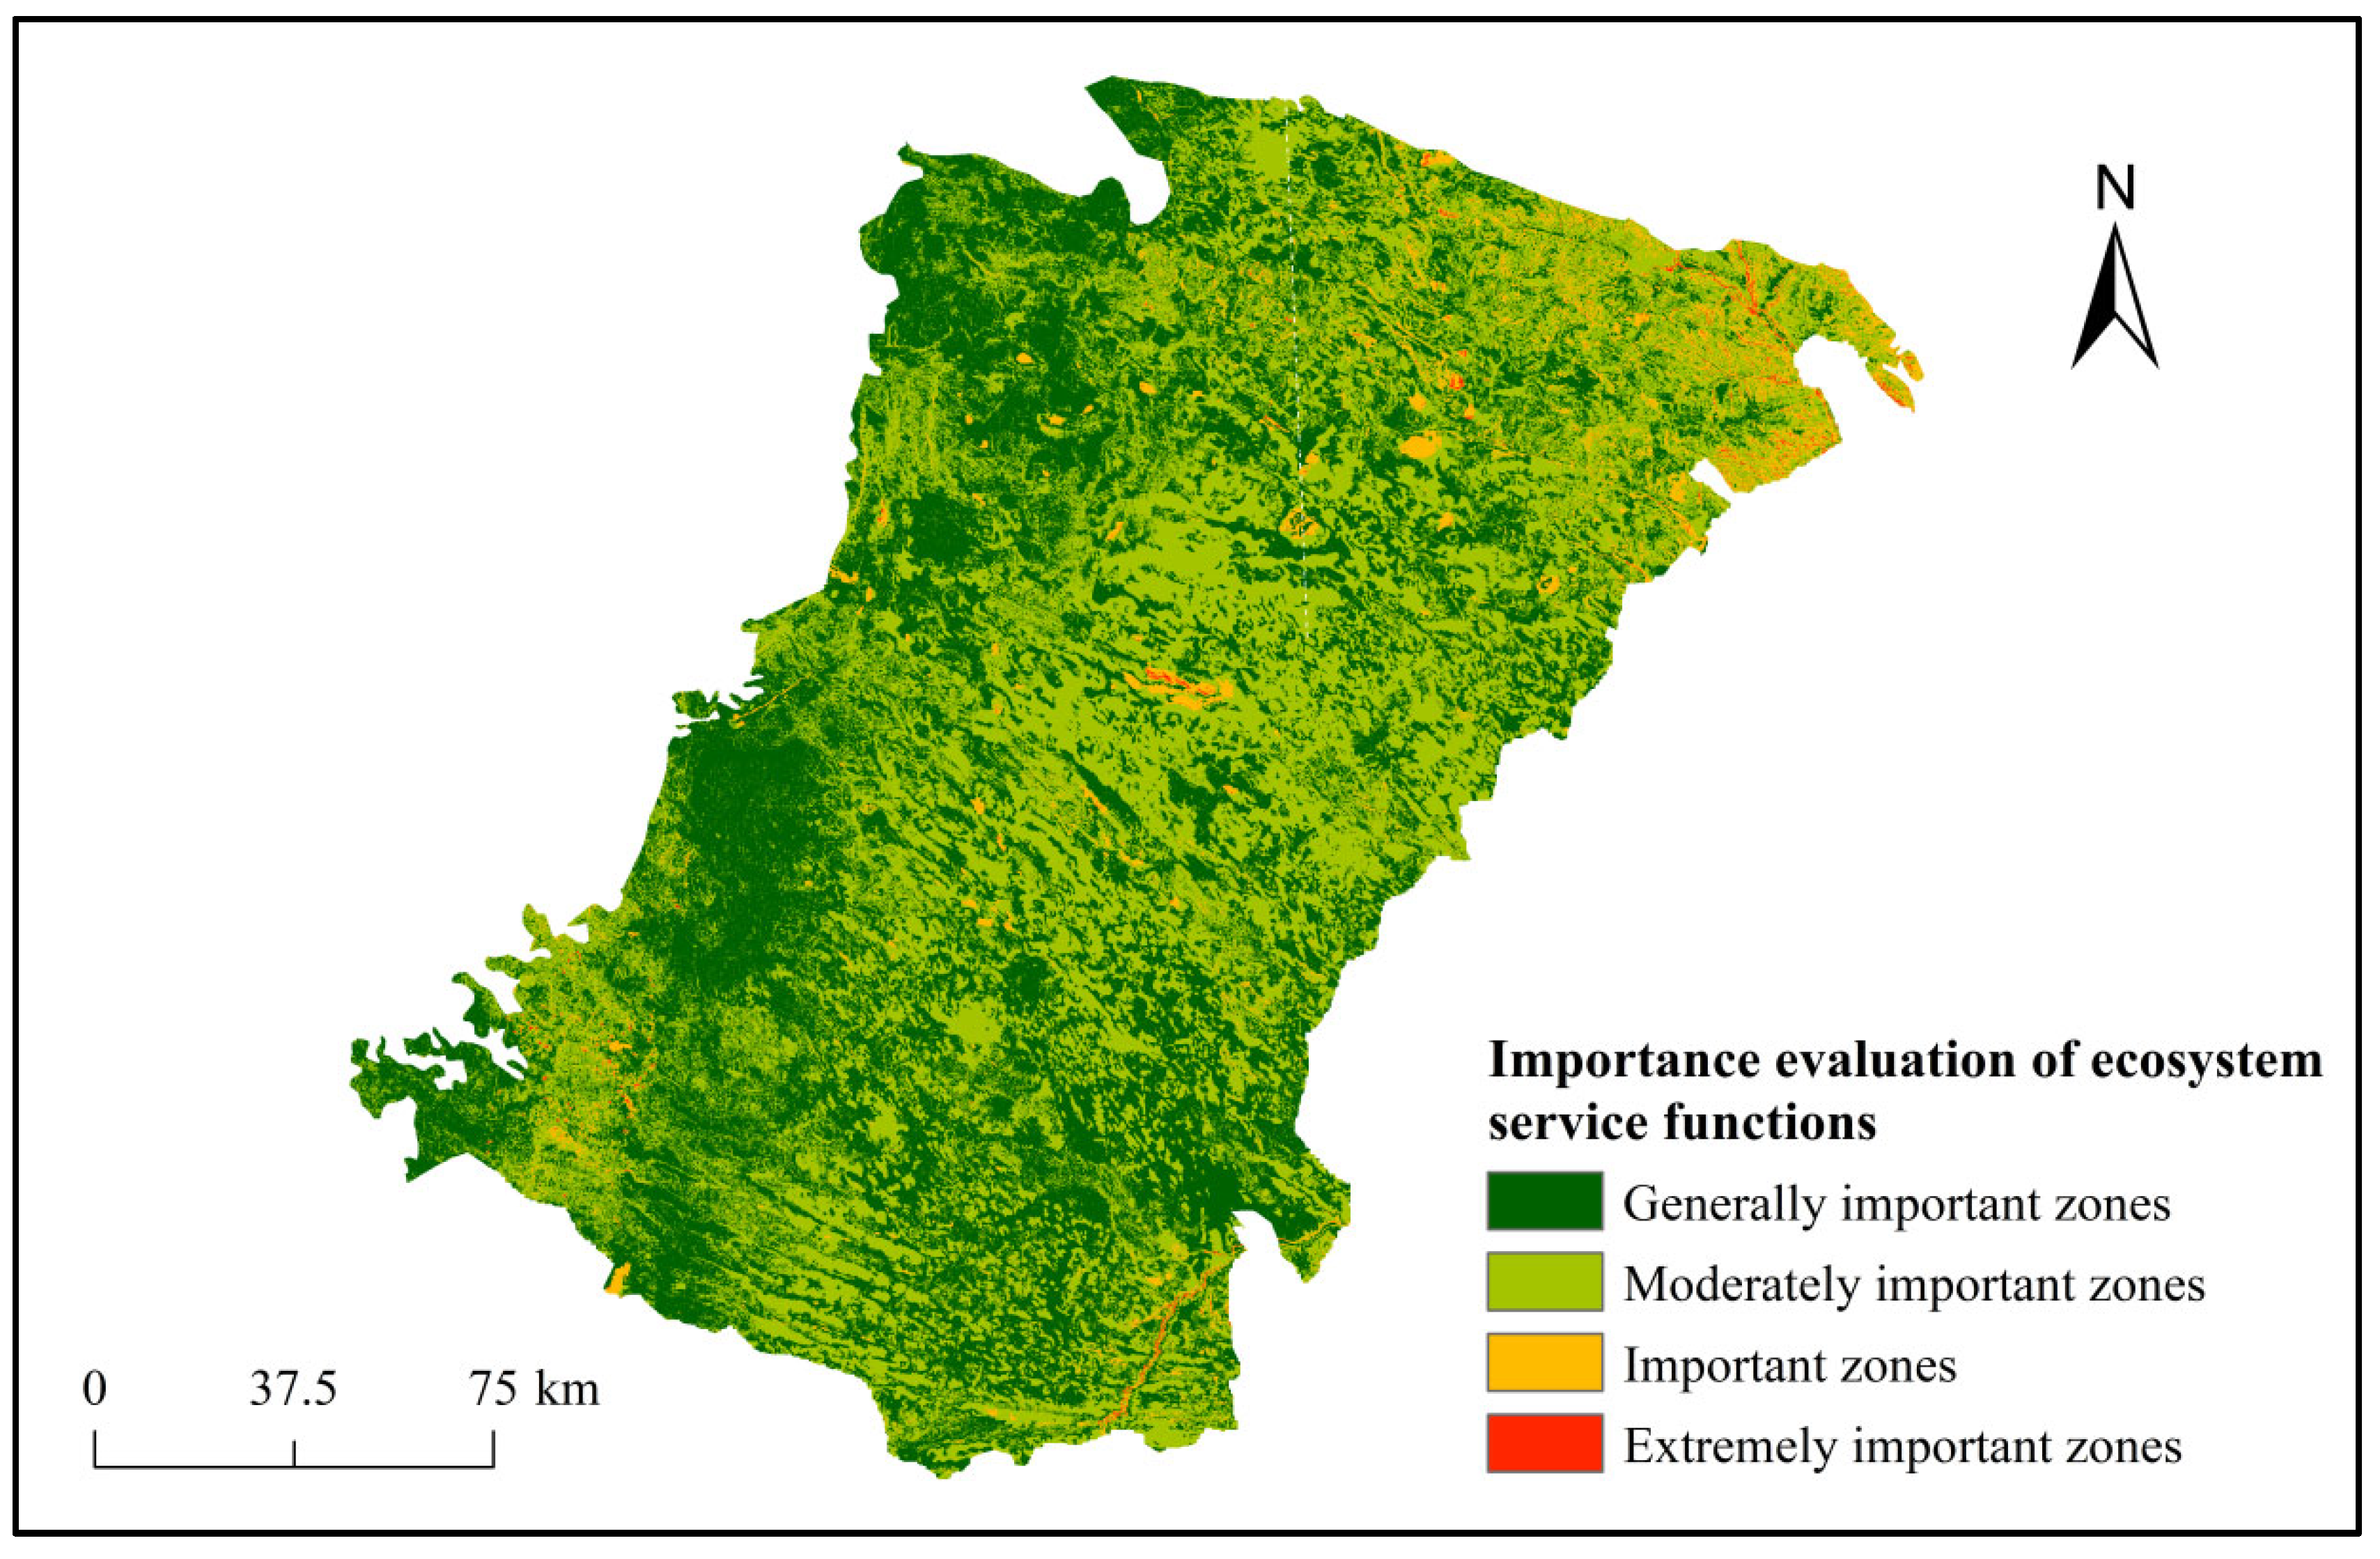
Figure 6.
Evaluation of ecological sensitivity.
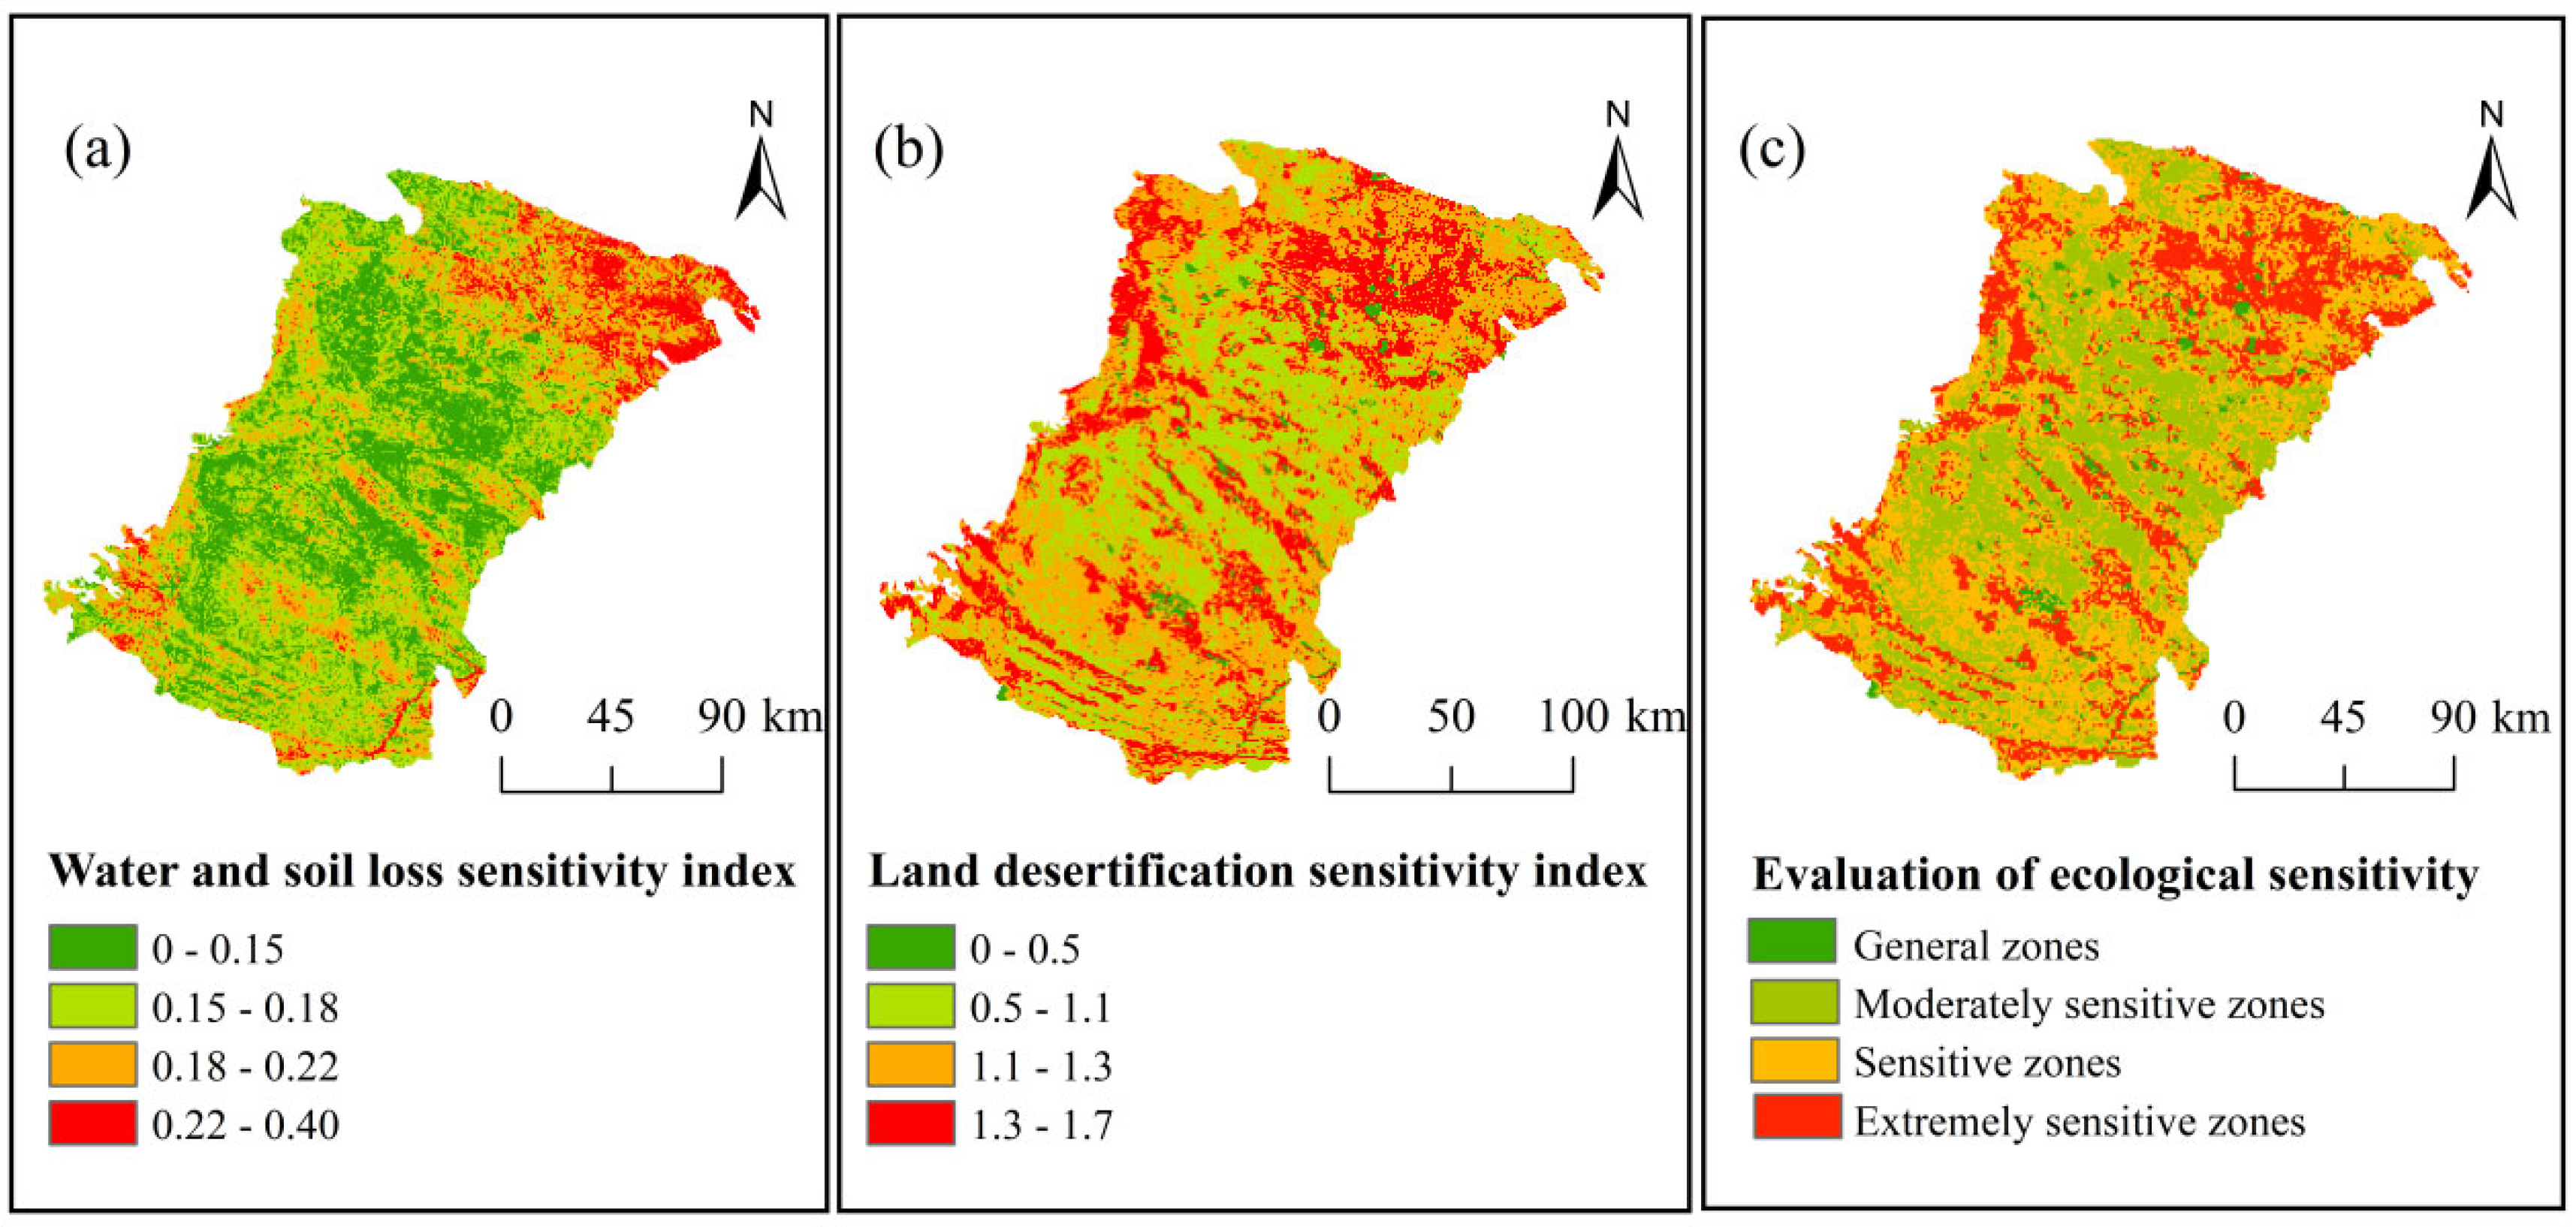
Figure 7.
Restoration zoning of natural ecological space.
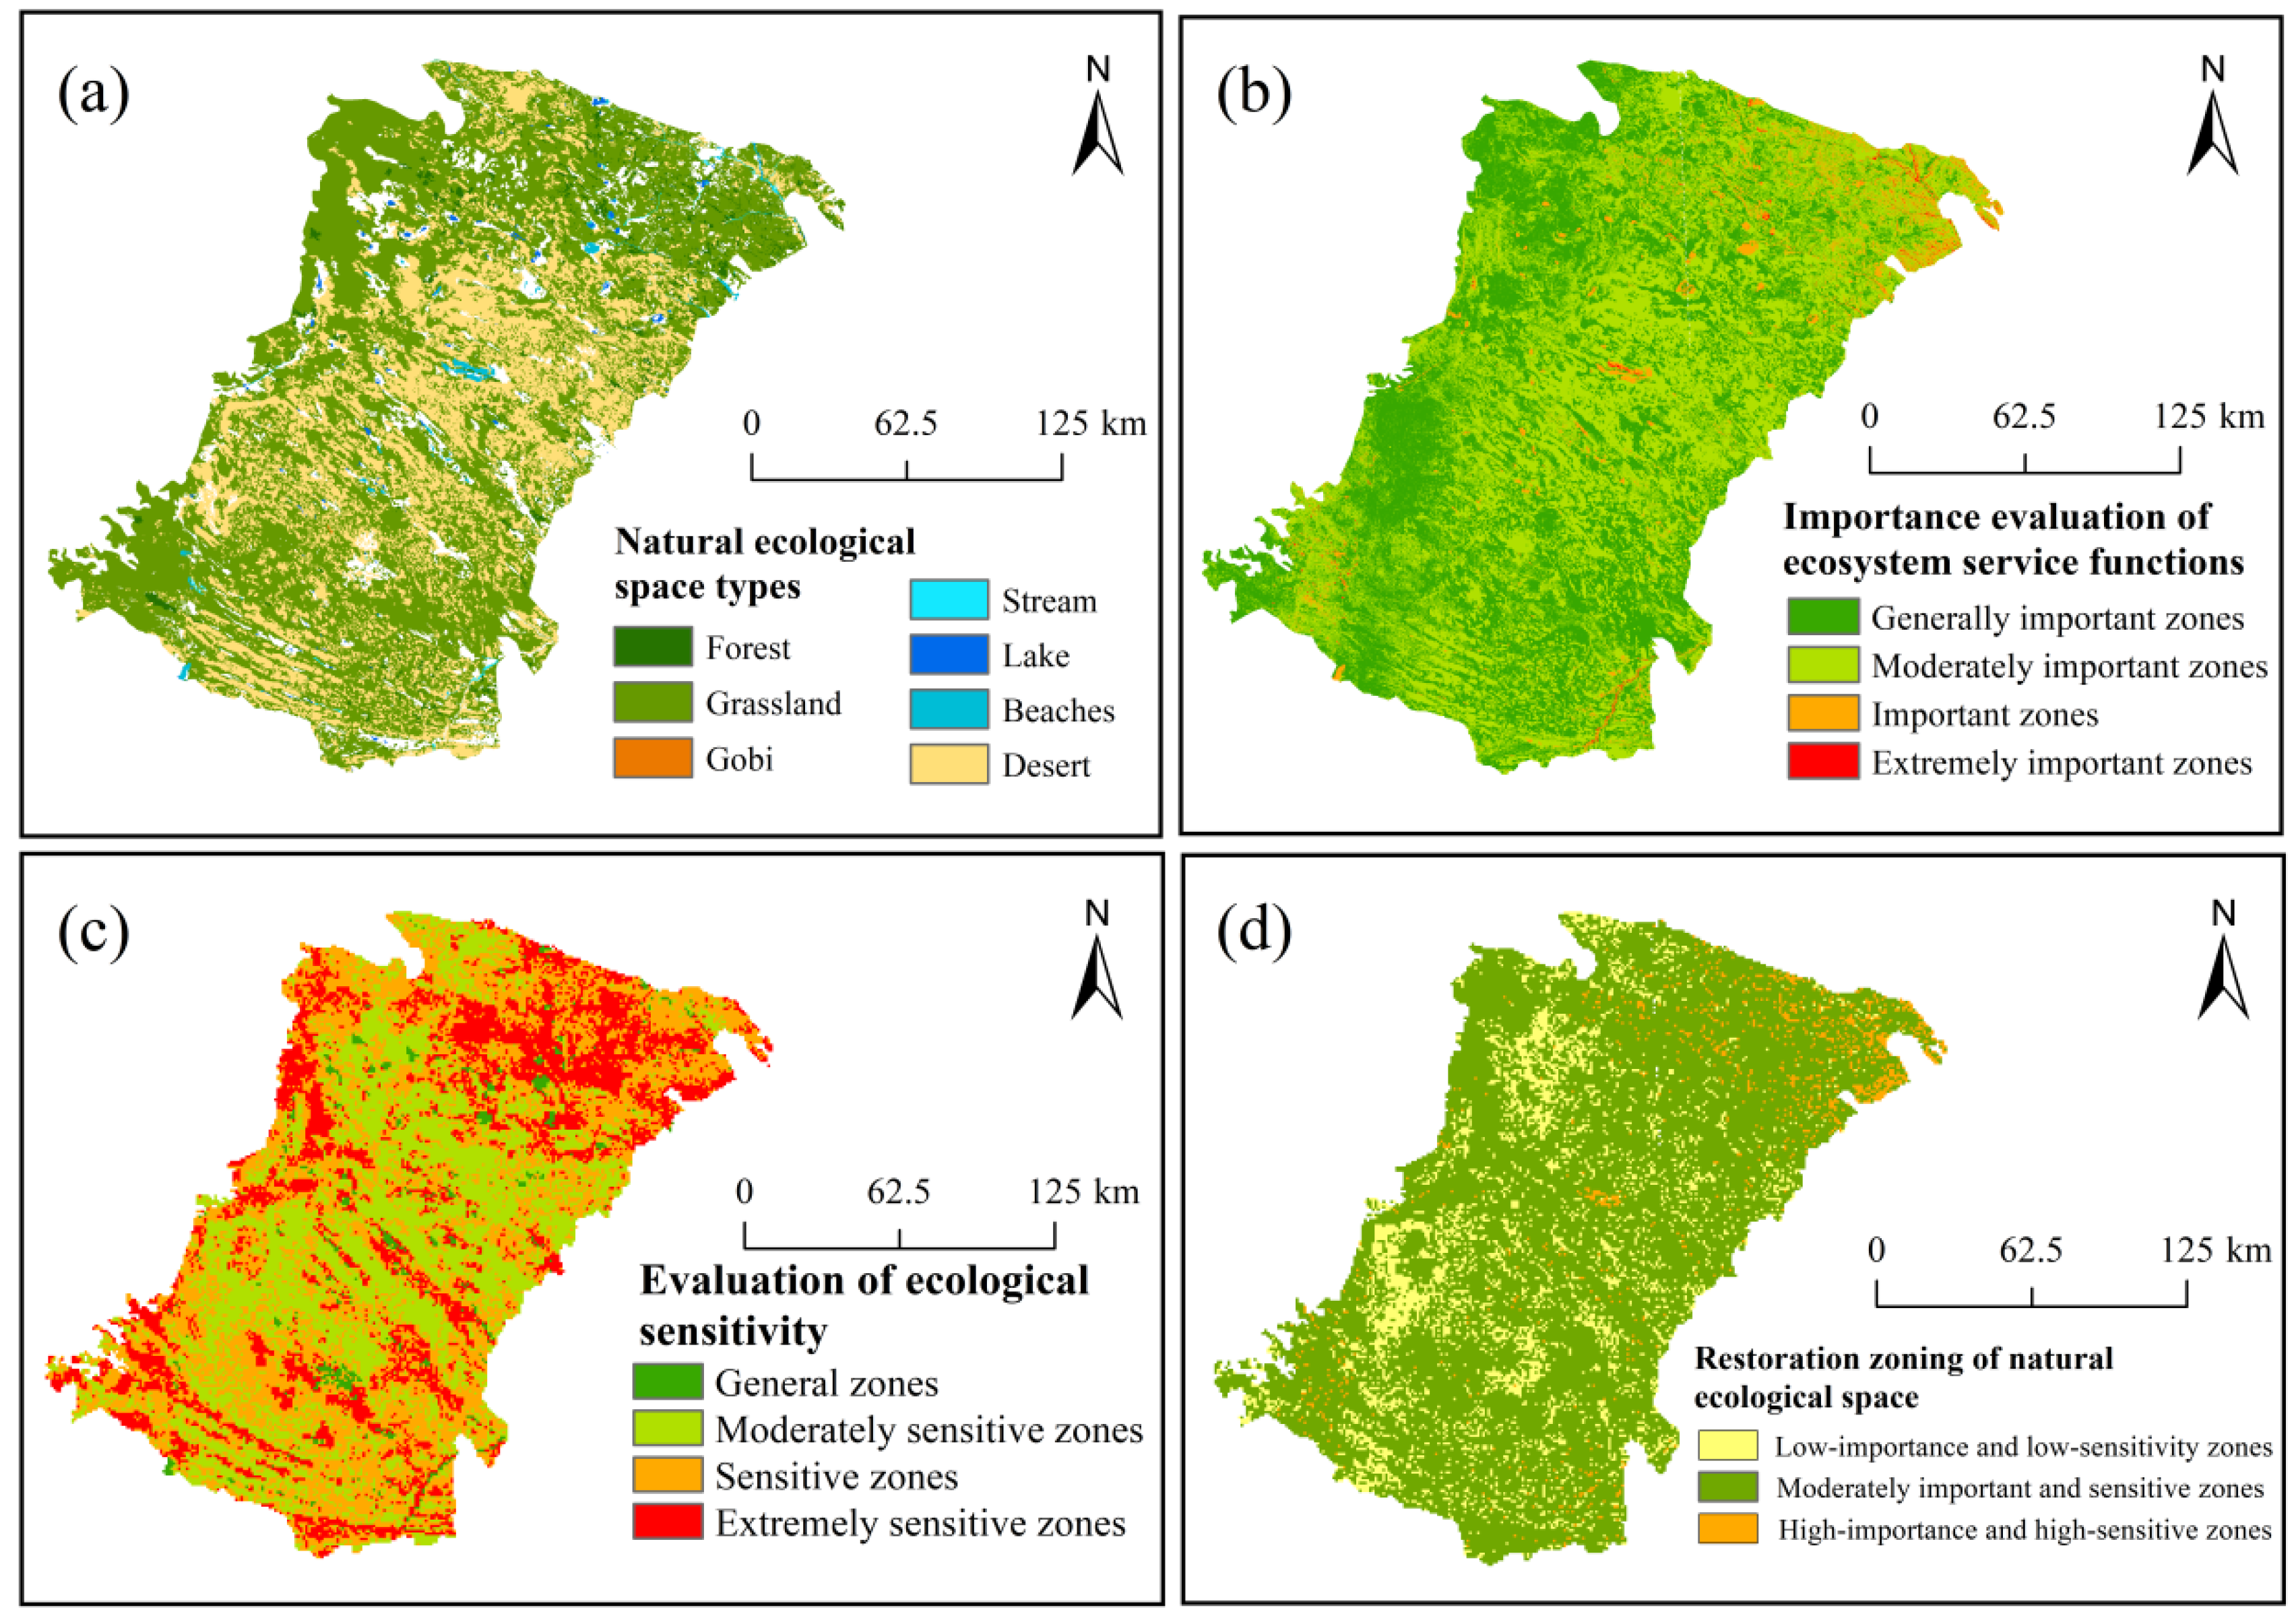

Table 1.
Data sources and preprocessing.
| Data Type | Source | Resolution | Preprocessing |
|---|---|---|---|
| NDVI data | MODI3Q1 products provided by the National Aeronautics and Space Administration (NASA) of the United States (http://lpdaac.usgs.gov) | 250 m | Projection and resampling |
| NPP data | Carnegie-Ames-Stanford Approach (CASA) model | 30 m | Maximum value composite, protection, and mask extraction |
| Soil type data | Harmonized World Soil Database (HWSD) | 1∶100,000 | Mask extraction and resampling |
| Meteorological data | National Earth System Science Data Center (http://www.geodata.cn) | 1 km | Mask extraction and resampling |
| DEM topographic data | Geographic spatial data cloud (http://www.gscloud.cn/) | 30 m | Splicing and projection |
| Land use data | Scientific Data Center of Resources and Environment, the Chinese Academy of Sciences | 30 m | Projection and mask extraction |
| Water and soil conservation bulletin of Inner Mongolian Autonomous Region | Water Resources Department of Inner Mongolia Autonomous Region (nmg.gov.cn) | \ | \ |
| Water resources bulletin of Inner Mongolia Autonomous Region | Water Resources Department of Inner Mongolia Autonomous Region (nmg.gov.cn) | \ | \ |
Table 2.
Evaluation of ecosystem service functions and ecological sensitivity.
| Comprehensive Evaluation Method | Evaluation Type | Calculation Formula | Remark |
|---|---|---|---|
| Ecosystem service functions [34,35] | Water conservation function | is the net primary productivity over years, is the soil filtration capacity factor, is the annual mean precipitation factor, and is the slope factor. | |
| Water and soil conservation function | is the annual mean primary productivity, is the soil erodibility value, and is the slope factor. | ||
| Biodiversity | is the average temperature over years, and is the elevation factor. | ||
| Carbon sequestration service function | , , , , and represent the total carbon reserve, aboveground carbon reserve, underground carbon reserve, and dead organic carbon reserve, respectively. | ||
| Comprehensive index of ecosystem service functions | is the water conservation service capacity index, is the water and soil conservation service capacity index, and is the biodiversity conservation service capacity. | ||
| Ecological sensitivity [36,37] | Water loss and soil erosion sensitivity | is the rainfall erosion factor, is the soil erodibility, is the topographic relief factor, and is the vegetation cover factor. | |
| Land desertification sensitivity | is the dryness index factor, and indicates the number of sandy and windy days. | ||
| Comprehensive index of ecological sensitivity | D | is the comprehensive ecological sensitivity index, is the soil and water erosion sensitivity index, and is the land desertification sensitivity index. |
Table 3.
Natural ecological restoration zoning.
| Zoning Result | Generally Important Zones | Moderately Important Zones | Important and Extremely Important Zones |
|---|---|---|---|
| Generally sensitive zones | Low-importance and low-sensitivity zones | Low-importance and low-sensitivity zones | Moderately important sensitive zones |
| Moderately sensitive zones | Low-importance and low-sensitivity zones | Moderately important and sensitive zones | Moderately important and sensitive zones |
| Sensitive and extremely sensitive zones | Moderately important and sensitive zones | Moderately important and sensitive zones | High-importance and high-sensitivity zones |
Table 4.
Gray relational coefficient.
| Driving Factors | Cropland | Forest | Grassland | Water | Construction Land | Unutilized Land | ||||||
| Relational degree | Billing | Relational degree | Billing | Relational degree | Billing | Relational degree | Billing | Relational degree | Billing | Relational degree | Billing | |
| Surface water | 0.79 | 6 | 0.81 | 6 | 0.80 | 6 | 0.80 | 6 | 0.78 | 7 | 0.80 | 6 |
| Groundwater | 0.88 | 4 | 0.89 | 4 | 0.88 | 4 | 0.88 | 4 | 0.90 | 5 | 0.89 | 4 |
| Total population | 0.92 | 3 | 0.94 | 3 | 0.91 | 3 | 0.91 | 3 | 0.95 | 1 | 0.92 | 3 |
| Per capita income of farmers and herdsmen | 0.65 | 8 | 0.65 | 8 | 0.64 | 8 | 0.64 | 8 | 0.67 | 8 | 0.65 | 8 |
| Output of livestock products | 0.71 | 7 | 0.72 | 7 | 0.70 | 7 | 0.70 | 7 | 0.78 | 6 | 0.71 | 7 |
| Annual mean precipitation | 0.88 | 5 | 0.89 | 5 | 0.86 | 5 | 0.86 | 5 | 0.95 | 2 | 0.87 | 5 |
| Annual mean temperature | 0.97 | 1 | 0.98 | 2 | 0.98 | 1 | 0.98 | 1 | 0.91 | 4 | 0.99 | 1 |
| Annual mean evaporation | 0.96 | 2 | 0.98 | 1 | 0.97 | 2 | 0.97 | 2 | 0.92 | 3 | 0.98 | 2 |
Disclaimer/Publisher’s Note: The statements, opinions and data contained in all publications are solely those of the individual author(s) and contributor(s) and not of MDPI and/or the editor(s). MDPI and/or the editor(s) disclaim responsibility for any injury to people or property resulting from any ideas, methods, instructions or products referred to in the content. |
© 2025 by the authors. Licensee MDPI, Basel, Switzerland. This article is an open access article distributed under the terms and conditions of the Creative Commons Attribution (CC BY) license (http://creativecommons.org/licenses/by/4.0/).
Copyright: This open access article is published under a Creative Commons CC BY 4.0 license, which permit the free download, distribution, and reuse, provided that the author and preprint are cited in any reuse.


