Submitted:
10 April 2025
Posted:
11 April 2025
You are already at the latest version
Abstract
Heat Shock Protein Beta-1 (HSPB1), a molecular chaperone crucial for celluar response and proteostasis, exhibits evolutionary conservation woth potential lineage-specific adaptations in placental mammals, warranting detailed comparative genomic investigation. The study investigated the characteristics, evolutionary links, motifs, secondary structure, and genetic organization of Heat Shock Protein Beta-1 (HSPB1) protein across twelve distinct mammals. Significant sequence conservation was identified using multiple sequence alignments (MSA), with over 70% identity in specific areas among the chosen organisms. Physiochemical analysis revealed that all species’ protein sequences exhibited an acidic nature, while instability indices indicated inherent protein instability. The GRAVY analysis referred to hydrophilic properties, while the aliphatic index showed heat stability. Phylogenetic analysis revealed five distinct clades, corresponding to major placental mammals’ groups (e.g. Homo sapiens, Bos Taurus), which underscores deep evolutionary divergences and conserved stress-response adaptations across lineages. Motif analysis revealed distinctive patterns in several species, and InterProScan results revealed membership in the "Homologous superfamily HSP20_like_Chapserson" family. An examination of the genetic organization indicated differences among organisms in the upstream, downstream, intron, and CDS regions, and the presence of conserved regions suggested their identity and similarity matrices. The current study conducted a computational approach and supporting evidence that HSPB1 is a novel heat shock responsive protein identified in placental mammals The current study findings provide a foundational framework delving into HSPB1 evolutionary and lineage-specific diversification, offering valuable insights into stress adaptation mechanisms and their implications for biomedical or evolutionary studies in mammals.
Keywords:
domain
; gene structure
; genomics
; HSPB1
; motif
; phylogeny
Introduction
In response to environmental stress, all organisms— ranging from archaea and bacteria to plants and animals—produce heat shock proteins. A subgroup of these heat shock proteins is known as small heat shock proteins (sHSPs). HSPB1 also referred toknown as Heat Shock Protein 27, is a member of of this family of sHSPs. The production of these Heat Shock Protein (HSPs) is triggered when cells are exposed to elevated temperatures [1].The sHSP family is the most prevalent class of molecular chaperones, which are proteins responsible for assisting in the proper folding or unfolding of other proteins and the assembly and disassembly of macromolecular structures,. The functions of molecular chaperones, particularly sHSPs, is critically dependent on their structural properties. sHSPs typically from large oligomeric complexes that resemble spheres or barrels. These Oligomers are macromolecular complexes composed of multiple monomers, usually ranging from 12 to 24 monomers, formed through non-covalent interactions between proteins [2]. Structural studies, including crystallography, reveal that dimers are the fundamental building blocks that aggregate to form these larger oligomers [3]. This oligomerization process is essential for the chaperones function of sHSPs, which involves preventing the aggregation of misfolded proteins and assisting in their proper refolding under stress condition [4]. sHSP are present in virtually all organisms, and their role in cellular protection under stress has led to increasing interest from researchers in recent years To facilitate the study of sHSPs[5], a dedicated database, known as sHSPdb has been developed. This database serve as a resource to analyze the structure, function and evolving research trends related to sHSPs [6].Heat Shock Protein 27, also known as HSPB1, is a component of the family of proteins known as small heat shock proteins, or sHSPs. However, stress situations such as heat shock can cause the cell to become exposed, which in turn leads to the folding of proteins and stimulates the production of HSPB1.The production of HSPB1 in the cell results in increased resistance of the cell to the damaging effects of heat shock and oxidative stress. HSPB1 are molecular chaperones, which are proteins that aid in the conformational folding or unfolding as well as the construction or disassembly of other macromolecular structures, and they share an ATP independent holdase activity [7]. HSPB1 are ATP-independent chaperon; they engage with proteins that have not fully folded, and it is this association that prevents the proteins from aggregating under stressful conditions [8] and promotes the storage of the proteins in a refolding competent state. In the event that these partially folded or misfolded proteins do not interact with HSPB1, then this leads to irreversible protein aggregation, which can be harmful to cells.
In addition to this, HSPB1 is particularly significant since it is associated with diabetic kidney disease as well as viral infection [9,10]. Osteoblasts are very critical cells for the development of bones, and HSPB1 plays a role in the functionality of osteoblasts. Both TNF- and IL-6 are considered to be inflammatory cytokines, and both become active during the process of inflammation. Interleukin (IL)-6 plays an important role in the development of an immune response, the formation of B cells, and the production of neutrophils in the bone marrow. It is also produced when tissue is damaged or infected. The production of tumor necrosis factor alpha (TNF-a), which has a role in the development of resistance to infection and cancer, takes place during acute inflammation. In osteoblast cells such as MC3T3-E1, HSPB1 acts as a regulator for the TNF--stimulated production of IL-6 [11]. The current study will provide vital information pertaining to the structure, functions, and evolutionary links of the heat shock protein (HSPB1) among mammals.
This work aims to systematically identify and characterize HSPB1 orthologs across placental mammals by analyzing their genomic features, evolutionary conservation and lineage-specific adaptations. Additionally, it seeks to elucidate the phylogenetic relationships of HSPB1, tracing its functional divergence and role in stress adaptation mechanisms within eutherian lineages.
Materials and Methods
Data Collection
The CDS, protein, and DNA sequences were retrieved from the National Centre for Biotechnology Information (NCBI) https://www.ncbi.nlm.nih.gov/ [12]. The data for all organisms are shown in Table 1, together with their respective accession ids, protein ids, and the databases from which they were downloaded.
Multiple Sequence Alignment
All of the HSPB1- protein sequences were aligned using Multiple Align Show (https://www.bioinformatics.org/sms/ multi_align.html) [13], which allowed for the detection and visualization of sequence variants as well as insertions and deletions.
Phylogenetic tree
The neighbor joining (NJ) approach was used to generate a phylogenetic tree of closely related species using MEGA 11 [14]. The bootstrap was set to 1000 repeats, and the tree was constructed using this method. ITOL version 4.2.4 was utilized in order to visualize and investigate the findings of phylogeny and multiple sequence alignment.
Motif and Domain Analyses
The MEME (Multiple Expectation Maximization) tool [15] was utilized in order to locate motifs within the protein sequences of each and every organism. The generation of motifs permitted any number of repetitions, and the maximum number of motifs that could be used was 10. In order to locate domains in each and every organism, the InterProScan [16] was utilized. It was possible to determine which protein families an organism belonged to and, as a result, whether or not it included any functional domains.
Gene structure Analysis
The application of Gene Structure Display Server (GSDS) version 2.0 [17] was utilized in order to determine the configuration of conserved elements, exons, and introns, as well as their respective localities.
Physiochemical Properties
ProtParam an online tool [18] that is available on the Expert Protein Analysis System (Expasy) Server which was used to compute physiochemical properties, including the molecular weight (MW), amino acids (AA), theoretical pI, instability index (II), aliphatic index (AI) and grand average of hydropathy (GRAVY). The WOLFPSORT software is used to determine where in the subcellular environment each and every organism's protein resides. The Hydropathy Plot was created with the support of the ProtScale software and then analyzed further.
Structural Characterizations
Using a method for the prediction of secondary structures called GORIV [19], which is used to calculate the secondary structure parameters (Alpha helix, Beta Bridge, Beta Turn, Extended strand, and Random Coil). The properties of all of an organism's secondary structures are listed in Table 5. The 3D model of protein was generated using online tool Phyre2, a completely web-based homology modelling tool for protein structures.
Results
Multiple Sequence Alignment
The Multiple Sequence Alignment (MSA) of each organism's protein was analyzed and displayed using the Multiple Align show. In Figure 1, the light red color represents the identical amino acid, while the blue color represents amino acids that are related. Although the color light yellow indicates that there are no similarities between the organisms. More than 70 percent of the sequences are identical along these locations that have been highlighted.
Physiochemical Analysis
The results showed that there were changes in the physiochemical parameters of the organisms (Table 2). The species E. europaeus has the lowest number of amino acids (199), while the species O. princeps had the highest number of amino acids (233). Because all of the organisms have theoretical PI values that are lower than 7, it may be deduced that these are acidic in their natural state. All of the organisms' instability indices were higher than 40, indicating that the proteins of all of the selected organisms were unstable. The aliphatic index is a measure that may be used to evaluate the thermal stability of proteins; in this case, its value was greater than 50% for every protein. This suggests that aliphatic side amino acids covered over half of the volume of these proteins. The fact that the GRAVY values were less than 0 demonstrates that the hydrophilic quality of proteins. It was noted that the nucleus and the mitochondria both contain proteins from the organisms that were studied. Additionally, It was observed that the proteins from certain organisms are water-soluble. The hydropathy plot, generated for all of the species and shown in Figure 2, demonstrated these organisms tend to exhibi a greater affinity for hydrophobicity. The physiochemical parameters of each organism are provided in Table 2, including the amino acid composition, extinction coefficient, theoretical pI, instability index, aliphatic index, molecular weight, grand average of hydropathicity (GRAVY) and localization of each protein.
Phylogenetic Analysis
Within the evolutionary tree that was constructed with MEGA 11, five distinct groups, or clades, emerged. Figure 3 illustrates quite clearly that members of clade 1, represented by the blue color, S. etruscus and E. europaeus, have descended from the same ancestor and are closely related to one another. In the second group, represented by the color red, H. sapiens and G. gorillas are closely related to one another since they share a common ancestor. C. porcellus, L. canadensis, and O. princeps are the three species that originated from the same ancestor and make up the third clade, which is colored peach. All four of these species, B. taurus, O. aries, C. ferus, and C. hircus, belong to the same clade and are closely related to one another. P. alecto is not closely related to any other organism and is depicted as a single entity in the phylogenetic tree even though it is located in clade 5, which is denoted by the branch color purple.
Motif Analysis
The investigation that was carried out with the assistance of the MEME tool revealed that motifs 1 through 7 were existing in the protein sequences of all species with the exception of E. europaeus. Only the protein sequences of two different species, namely S. etruscus and O. princeps, contained the Motif 8 pattern. Two more species, namely P. alecto and O. princeps, were identified to have a motif 9 in their DNA. Motif 10 was unique to O. princeps, as illustrated in Figure 4, and was only identified in that species.
Domain Analysis
According to the results of the InterProScan study, all of the proteins from the species that were selected are members of the same homologous family called "Homologous super family HSP20_like_Chaperson," having the accession number IPR008978. The accession numbers (IPR002068 and IPR037876) for both of the DNA building domains known as "ACD_HSPB1 and A Crystalline" for each species as shown in Table 3.
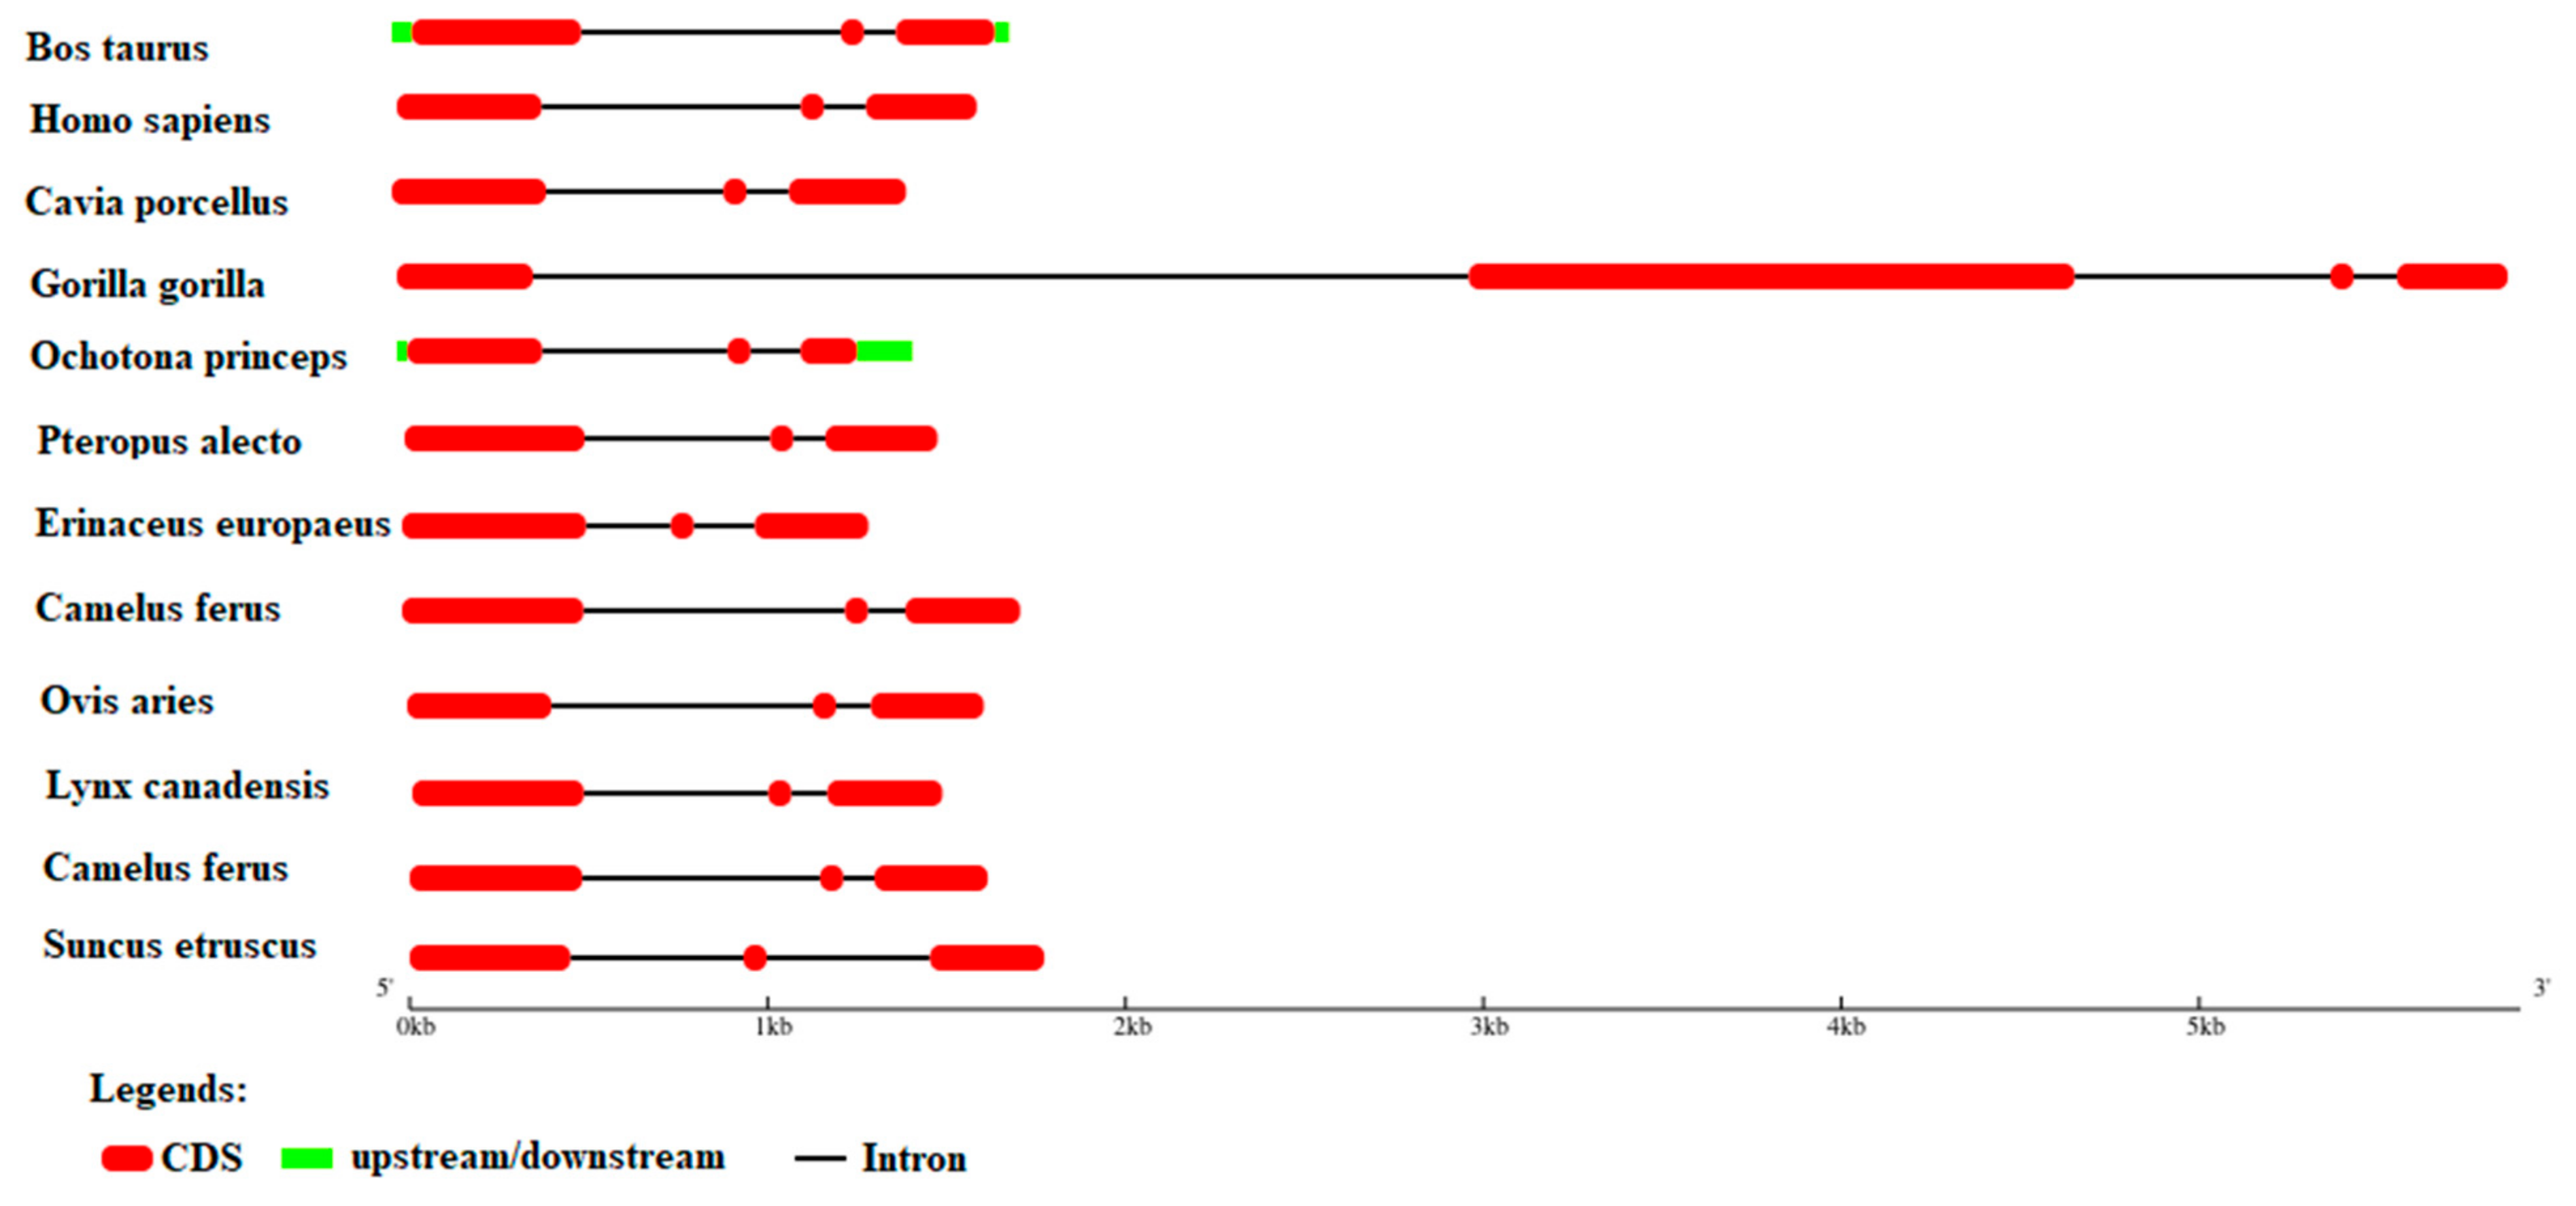
Gene Structure Analysis
The analysis of upstream, downstream, intron, and CDS regions was conducted using GSDS for each species. The term upstream and downstream refer to the relative positions of the genetic information within RNA or DNA, respectively. Specifically, downstream refers to the 3' end of the coding strand, while upstream refers to the 5' end of the coding strand. Both B. taurus and O. princeps possess all four components, upstream, downstream intron and CDS regions. Other species, including C. porcellus, L. canadensis, O. aries, C. ferus, C. hircus, P. alecto, H. sapiens, G. gorilla, E. europaeus, and S. etruscus only possess intron and CDS regions of the gene.
Figure 5.
A Graphical representation of GSDS indicating proteins that are upstream, downstream, in the intron, and in the CDS portion.
Figure 5.
A Graphical representation of GSDS indicating proteins that are upstream, downstream, in the intron, and in the CDS portion.
Percentage Identity and Similarity of HSPB1 Gene
The percentage of amino acids that are identical to one another and the identity matrix of amino acids are crucial factors in predicting evolutionary patterns and distinguishing different species. Table 4 and Table 5 present the the identity percentage and the similarity percentage of various species, respectively. A higher identity and similarity percentage between species typically indicates a closer relationship, suggesting that their structure and functions are are more likely to be comparable. In particular, sequences with a similarity percentage of approximately 70% are indicative of shared homology, functional similarity, and highly conserved regions HSPB1 gene. This gene plays a crucial role in cellular stress response and protein maintenance. The pair of species exhibiting a similarity of around 70% in their HSPB1 gene likely share similar functions and evolutionary histories.
Structural Analysis
GORIV tool was used to make the prediction about the secondary structure of the HSPB1 gene for the 12 organisms that were chosen. According to Table 6, the HSPB1 gene has an alpha helix, a random coil, and extended strands as part of its secondary structure. The HSPB1 gene has an alpha helix, a random coil, and extended strands as part of its secondary structure. The L. canadensis alpha helix takes up a total of 26.83 percent of the structure. The portion of the structure that is occupied by the alpha helix, the least by H. sapiens and G. gorilla is 13.66 percent. In addition, the extended strand for the B. taurus was the longest at 17.75%, while the extended strand for the C. porcellus was the shortest at 11.00%. On the other hand, random coils make up 73.17% of the structure of H. sapiens and G. gorilla, which is the largest percentage of random coils among other creatures. For HSPB1 protein sequence, a 12, 3D structure templates were created, and all of the models were successfully constructed from Phyre2 (Figure 6). The 3D structure of HSPB1 protein revealed details about their folding, stability, and domain interactions.
Discussion
Heat shock protein 27, also known as HSPB1, is a member of the family of proteins known as small heat shock proteins, or sHSPs. This protein contributes to the development of a stable state during times of high stress, such as when the body is subjected to heat shock or oxidative damage [20]. The findings of this study were derived from a computational analysis of the HSPB1 protein found in a variety of species. During this computational analysis, a number of analyses were carried out in order to identify Domains, multiple sequence alignment, physiochemical properties, motifs, quaternary structure, secondary structure parameters, protein interaction with its functional proteins in a variety of organisms, similarity and identity matrix, and the Position and composition of conserved elements, introns, exons in protein.
A gene family's genetic characterization can reveal details about the genes' origins, duplication events, and diversification throughout their evolutionary history. The conserved regions, which are crucial for protein structure and functional studies, can be found using multiple sequence alignment (MSA) [21]. In nucleus majority of the proteins were found, while the mitochondria only contained a small percentage. Except for B. taurus and O. princeps, all creatures had just CDS parts, downstream and upstream in their protein sequences. These two species have CDS parts, Introns, downstream and upstream in their protein sequences. When referring to the relative placement of the genetic code in DNA or RNA, the terms "downstream" and "upstream" are both used. Upstream is towards the 5' end of the coding strand of the protein that is now being analyzed, while downstream is towards the 3' end of the coding strand. Both ACD_HSPB1 IPR037876 and A Crystalline IPR002068 were identified as the domains, present in each and every organism. The homologous superfamily found in all organisms was designated as IPR008978 Hsp20. The motif from 1 to 7 was found in the protein sequences of all organisms, with the exception of E. europaeus. Only the protein sequences of two different organisms, namely S. etruscus and O. princeps, contained the Motif 8 pattern. Two more organisms, namely P. alecto and O. princeps, were found to have a motif 9 in their DNA. While Motif 10 was unique to O. princeps, it was detected in both species. Furthermore, the varied patterns of the introns and downstream/upstream untranslated regions (UTRs) in the gene structure suggest that it may be due to the inclusion and removal of retroposons [22]. A prior study [23] was also responsible for collecting amino acids, determining % similarity and identity, phylogenetic relationship, determining physiochemical qualities, and identifying motifs.
The phylogenetic tree revealed the presence of five distinct clades. In clade 1(represented by blue color), the species S. etruscus and E. europaeus share common ancestor, indicating their close evolutionary relationship. In the second clade (marked in red), H. sapiens and G. gorillas are closely related, as evidenced by to their shared common ancestor. The third clade, colored peach, consists of C. porcellus, L. canadensis, and O. princeps, which all originated from a common ancestor, highlighting their evolutionary proximity. The fourth clade includes B. taurus, O. aries, C. ferus, and C. hircus, which are all closely related, stemming from a shared lineage. Lastly, P. alecto is depicted as a distinct entity in clade 5 (marked in purple), isolated from other species, despite being located within this clade. The phylogenetic analysis also revealed a high degree of sequence homology among the species, reinforcing their evolutionary relationships as observed in other studies [24].
Furthermore, assessing the physiochemical characteristics of the gene encoding the gene is necessary to comprehend the protein structure and function of the gene family [25]. According to the findings, every organism has a greater tendency towards hydrophilicity. The aliphatic index is a measure that may be used to evaluate the thermal stability of proteins; in this case, its value was greater than 50% for every protein. This suggests that aliphatic side amino acids covered over half of the volume of these proteins. In addition, GRAVY values that are lower than zero indicate that the hydrophilicity of these proteins is greater than that of their surroundings. The fact that all of the organisms have theoretical PI values that are lower than 7 demonstrates that they are all acidic in their natural state. Because the instability index for every creature was greater than 40, it may be deduced that every protein in every organism, with one exception, is unstable. Similarly, since GRAVY indicates a protein's hydrophilicity (GRAVY <0) or hydrophobicity (GRAVY >0), assessing it would aid in a better understanding of its tertiary structure or shape [26]. Similar genetic characterization was done in previous studies including the assembly of amino acids and nucleotides, the computation of similarity and identity matrices, the assessment of physiochemical properties, the analysis of evolutionary relationships, the characterization of structural features, and the generation of a hydrophobicity plot [27]. Hence in recent years, determining and quantifying the evolutionary processes that contributed to genetic variety has emerged as an exciting area of research.
The secondry structure of the HSPB1 gene in 12 species was predicted using GORIV tool, indicating the presence of alpha helices, random coils and extended strands. L. canadensis showed the highest alpha helix content, while H. sapiens and G. gorillas had the largest proportion of random coils. The three-dimensional models generated for the HSPB1 protein provided insights into its folding. Stability and domain interactions. These findings align with the previous studies on protein structure-function relationship and emphasize the evolutionary conservation of the HSPB1 gene across the species [28,29].
Conclusion
This study provides comprehensive insights into the evolutionary history, functional motifs, physiochemical characteristics and structural traits of the HSPB1 gene across various species. The results revealed the vital role of HSPB1 proteins in cellular processes, emphasizinf their acidic nature and high sequence conservation. Phgylogenetic analysis highlighted the evolutionary relationship among species, depicting their shared ancestry, The GRAVY values pointed to the hydrophilic nature of these proteins while the aliphatic index indicated their heat stability, further emphasizing their functional significance. The study also unveiled conserved motifs and homologous superfamily memberships which underscore the functional conservation of HSPB1 gene across the species. Variations in genetic organization, like the presence of distinct upstream and downstream regions in certain species reflect the complexity of gene regulation. Furthermore, the presence of conserved regions within the supports the notion of functional similarity across the species. The identity and similarity matrices confirmed that the species with higher similarity percentages in the HSPB1 gene likely shre common functions and evolutionary backgrounds. The analysis of secondary structure, including the distribution of alpha helices, random coils and extended strands, provided valuable insights on the protein folding, stability and domain interactions, the three-dimensional structure of HSPB1 protein offered further insights into its functional architecture. This work identifies HSPB1 as functionally significant and underscores the need for additional research to fully comprehend the function and mechanism of HSPs.
Author Contributions
M.S wrote original draft, S.P conceived main idea, A.K and M.A.M performed analysis, S.J and M. H wrote methodology, S.S and M.T prepared tables, M.F.K revised the manuscript and project administration.
Data Availability Statement
All the data is included in the manuscript.
Acknowledgments
None
Conflicts of Interest
Authors have declared no conflict of interest.
References
- Mymrikov, E.V., A.S. Seit-Nebi, and N.B. Gusev, Large Potentials of Small Heat Shock Proteins. Physiological Reviews, 2011. 91(4): p. 1123-1159.
- Russo Krauss, I., et al., An Overview of Biological Macromolecule Crystallization. International Journal of Molecular Sciences, 2013. 14(6): p. 11643-11691.
- Salahuddin, P., et al., Structure of amyloid oligomers and their mechanisms of toxicities: Targeting amyloid oligomers using novel therapeutic approaches. European Journal of Medicinal Chemistry, 2016. 114: p. 41-58.
- Eyles, S.J. and L.M. Gierasch, Nature’s molecular sponges: Small heat shock proteins grow into their chaperone roles. Proceedings of the National Academy of Sciences, 2010. 107(7): p. 2727-2728.
- Jaspard, E. and G. Hunault, sHSPdb: a database for the analysis of small Heat Shock Proteins. BMC Plant Biology, 2016. 16(1): p. 135.
- Feng, P., et al., Classifying the superfamily of small heat shock proteins by using g-gap dipeptide compositions. International Journal of Biological Macromolecules, 2021. 167: p. 1575-1578.
- Acunzo, J., M. Katsogiannou, and P. Rocchi, Small heat shock proteins HSP27 (HspB1), αB-crystallin (HspB5) and HSP22 (HspB8) as regulators of cell death. The International Journal of Biochemistry & Cell Biology, 2012. 44(10): p. 1622-1631.
- Bakthisaran, R., R. Tangirala, and C.M. Rao, Small heat shock proteins: Role in cellular functions and pathology. Biochimica et Biophysica Acta (BBA) - Proteins and Proteomics, 2015. 1854(4): p. 291-319.
- Borgo, C., et al., Protein kinase CK2: a potential therapeutic target for diverse human diseases. Signal Transduction and Targeted Therapy, 2021. 6(1): p. 183.
- Bolhassani, A. and E. Agi, Heat shock proteins in infection. Clinica Chimica Acta, 2019. 498: p. 90-100.
- Mebarek, S., et al., Phospholipases of Mineralization Competent Cells and Matrix Vesicles: Roles in Physiological and Pathological Mineralizations. International Journal of Molecular Sciences, 2013. 14(3): p. 5036-5129.
- Coordinators, N.R., Database resources of the National Center for Biotechnology Information. Nucleic Acids Research, 2015. 44(D1): p. D7-D19.
- McDonald, E.T., et al., Sequence, Structure, and Dynamic Determinants of Hsp27 (HspB1) Equilibrium Dissociation Are Encoded by the N-Terminal Domain. Biochemistry, 2012. 51(6): p. 1257-1268.
- Baharum, S. and A.w.A. Nurdalila, Phylogenetic Relationships of Epinephelus fuscoguttatus and Epinephelus hexagonatus Inferred from Mitochondrial Cytochrome b Gene Sequences using Bioinformatic Tools. International Journal of Bioscience, Biochemistry and Bioinformatics, 2011. 1(1): p. 47.
- Bailey, T.L., et al., The value of position-specific priors in motif discovery using MEME. BMC Bioinformatics, 2010. 11(1): p. 179.
- Blum, M., et al., The InterPro protein families and domains database: 20 years on. Nucleic Acids Research, 2020. 49(D1): p. D344-D354.
- Iqbal Qureshi, A.M., et al., Insilco identification and characterization of superoxide dismutase gene family in Brassica rapa. Saudi Journal of Biological Sciences, 2021. 28(10): p. 5526-5537.
- Sahay, A., A. Piprodhe, and M. Pise, In silico analysis and homology modeling of strictosidine synthase involved in alkaloid biosynthesis in catharanthus roseus. Journal of Genetic Engineering and Biotechnology, 2020. 18(1): p. 44.
- CoSec: a hub of online tools for comparing secondary structure elements. International Journal of Bioinformatics Research and Applications, 2023. 19(1): p. 56-69.
- Kurashova, N.A., I.M. Madaeva, and L.I. Kolesnikova, Expression of HSP70 Heat-Shock Proteins under Oxidative Stress. Advances in Gerontology, 2020. 10(1): p. 20-25.
- Sultana, M., et al., In silico molecular characterization of TGF-β gene family in Bufo bufo: genome-wide analysis. Journal of Biomolecular Structure and Dynamics: p. 1-15.
- Su, J., et al., Comparative evolutionary and molecular genetics based study of Buffalo lysozyme gene family to elucidate their antibacterial function. International Journal of Biological Macromolecules, 2023. 234: p. 123646.
- Akbari Rokn Abadi, S., et al., An accurate alignment-free protein sequence comparator based on physicochemical properties of amino acids. Scientific Reports, 2022. 12(1): p. 11158.
- Hassan, F.-u., et al., Genome-wide identification and evolutionary analysis of the FGF gene family in buffalo. Journal of Biomolecular Structure and Dynamics, 2024. 42(19): p. 10225-10236.
- Lee, D., O. Redfern, and C. Orengo, Predicting protein function from sequence and structure. Nature Reviews Molecular Cell Biology, 2007. 8(12): p. 995-1005.
- Amrhein, S., et al., Molecular Dynamics Simulations Approach for the Characterization of Peptides with Respect to Hydrophobicity. The Journal of Physical Chemistry B, 2014. 118(7): p. 1707-1714.
- as, J.K., et al., Mapping sequence to feature vector using numerical representation of codons targeted to amino acids for alignment-free sequence analysis. Gene, 2021. 766: p. 145096.
- M. F. Khan et al., “Evolution and comparative genomics of the transforming growth factor-β-related proteins in Nile tilapia,” Mol Biotechnol, pp. 1–15, 2024.
- S. Parveen, M. F. Khan, M. Sultana, S. ur Rehman, and L. Shafique, “Molecular characterization of doublesex and Mab-3 (DMRT) gene family in Ctenopharyngodon idella (grass carp),” J Appl Genet, pp. 1–12, 2024.
Figure 1.
The multiple sequence alignment of the twelve proteins that was obtained by using Multiple align is displayed here. The protein sequences in the red dark regions share an identity of greater than 70 percent.
Figure 1.
The multiple sequence alignment of the twelve proteins that was obtained by using Multiple align is displayed here. The protein sequences in the red dark regions share an identity of greater than 70 percent.
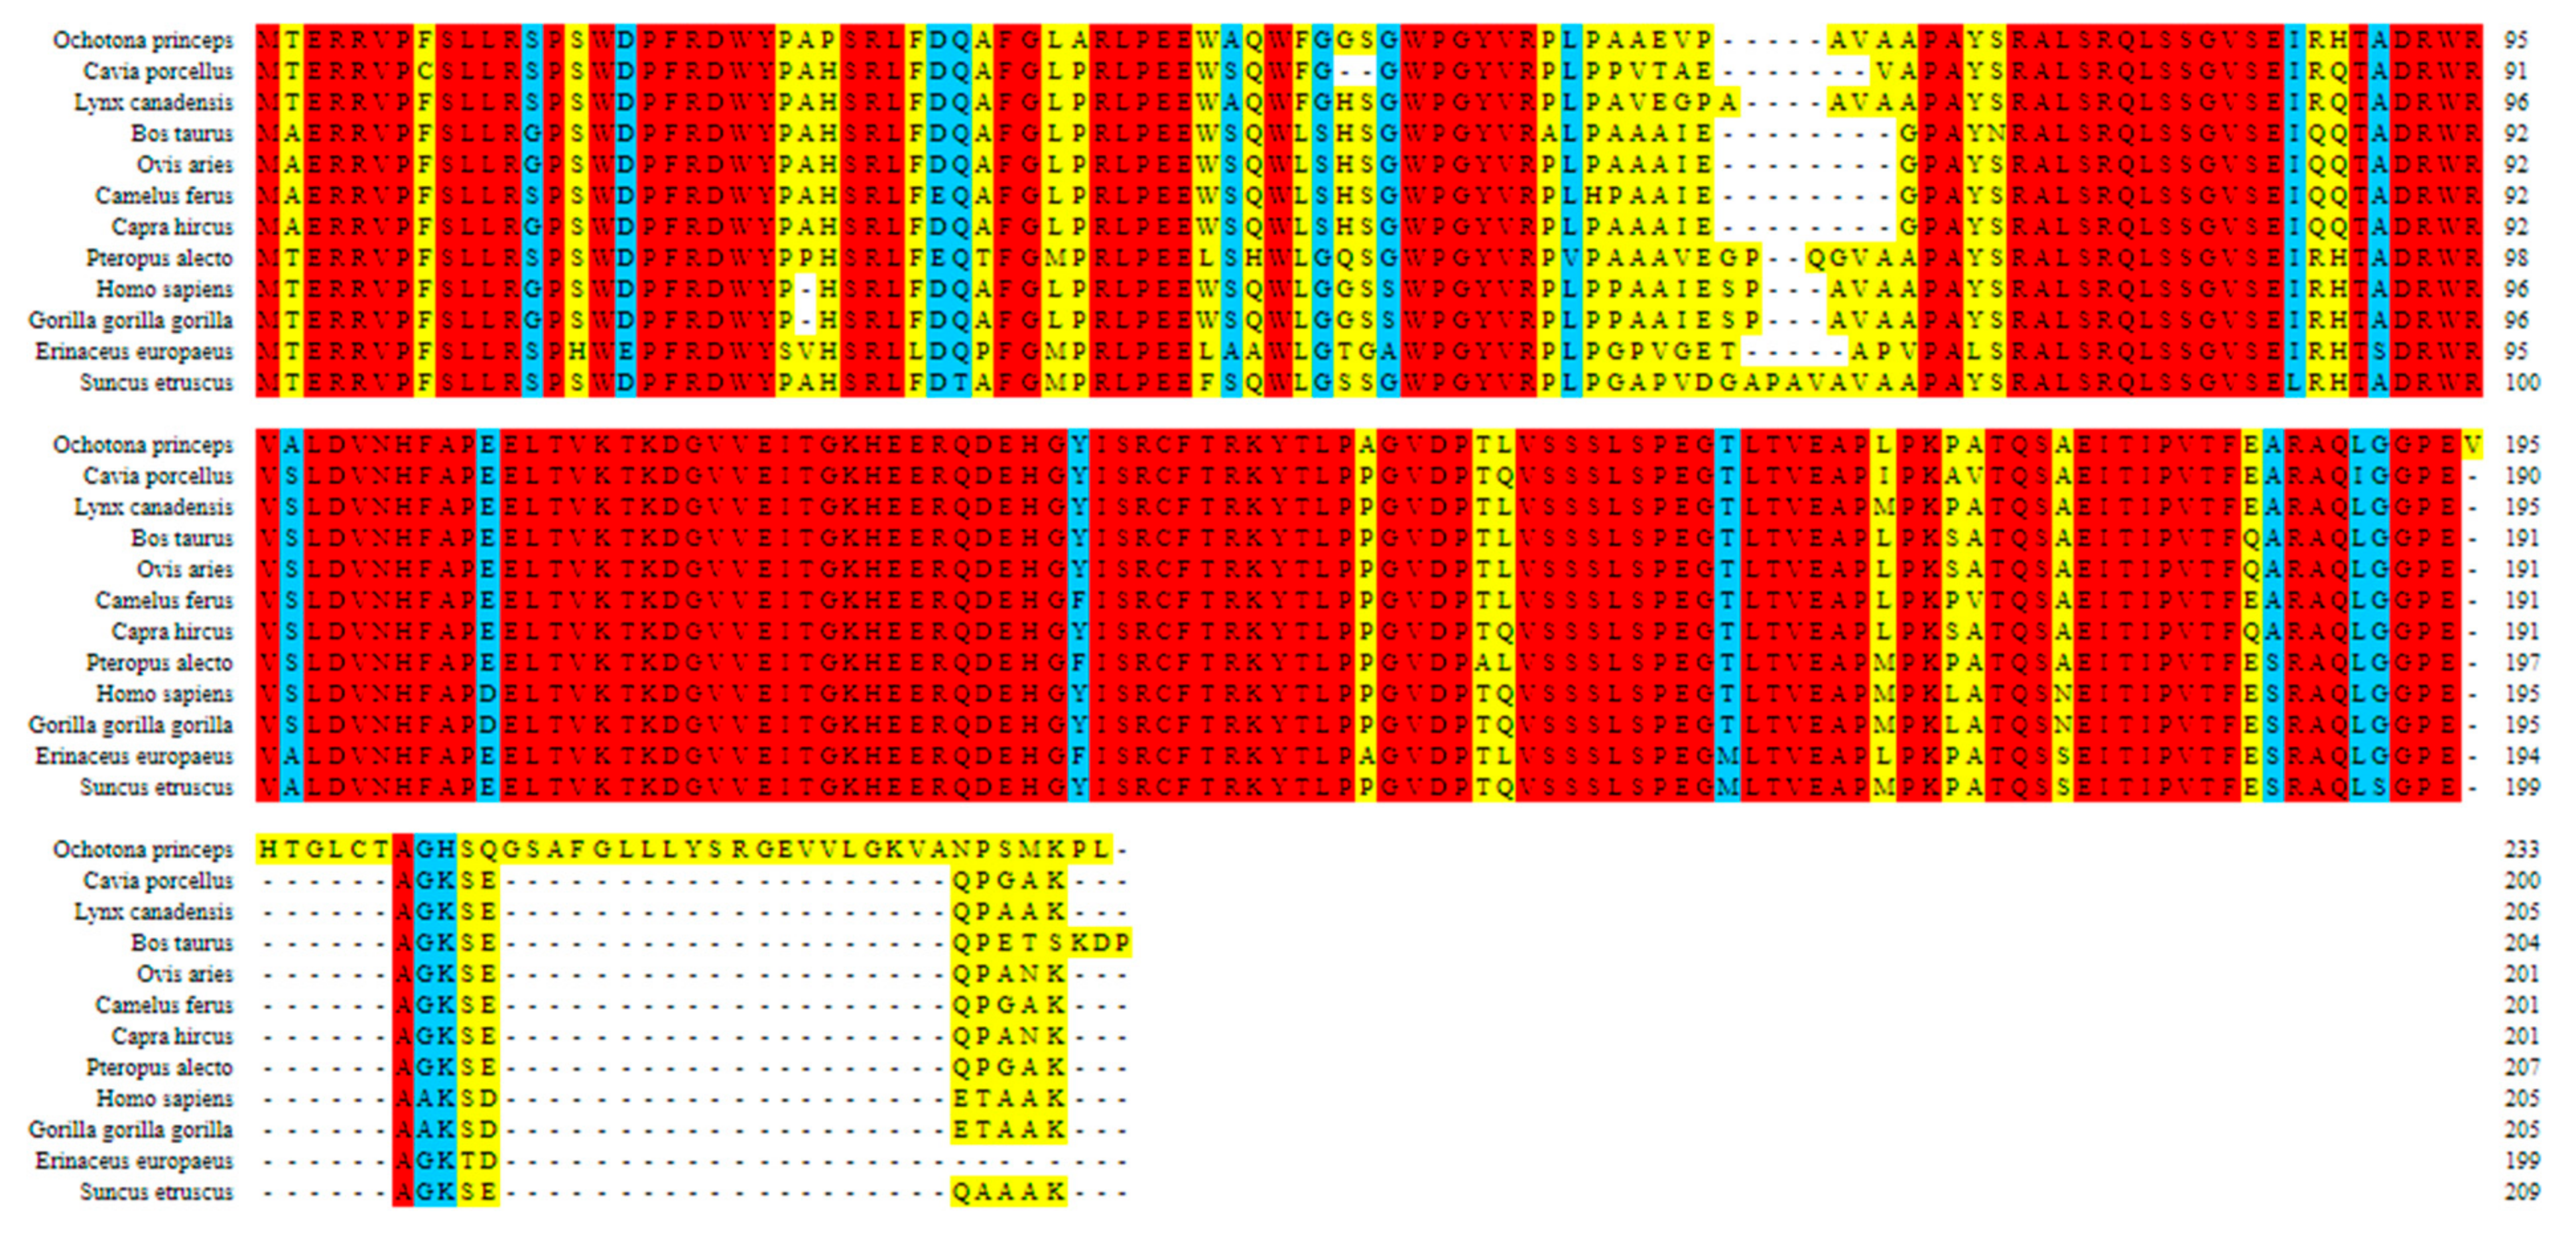
Figure 2.
The hydrophobicity plot for these four creatures illustrates that, in their natural states, they are all more inclined to be hydrophilic.
Figure 2.
The hydrophobicity plot for these four creatures illustrates that, in their natural states, they are all more inclined to be hydrophilic.
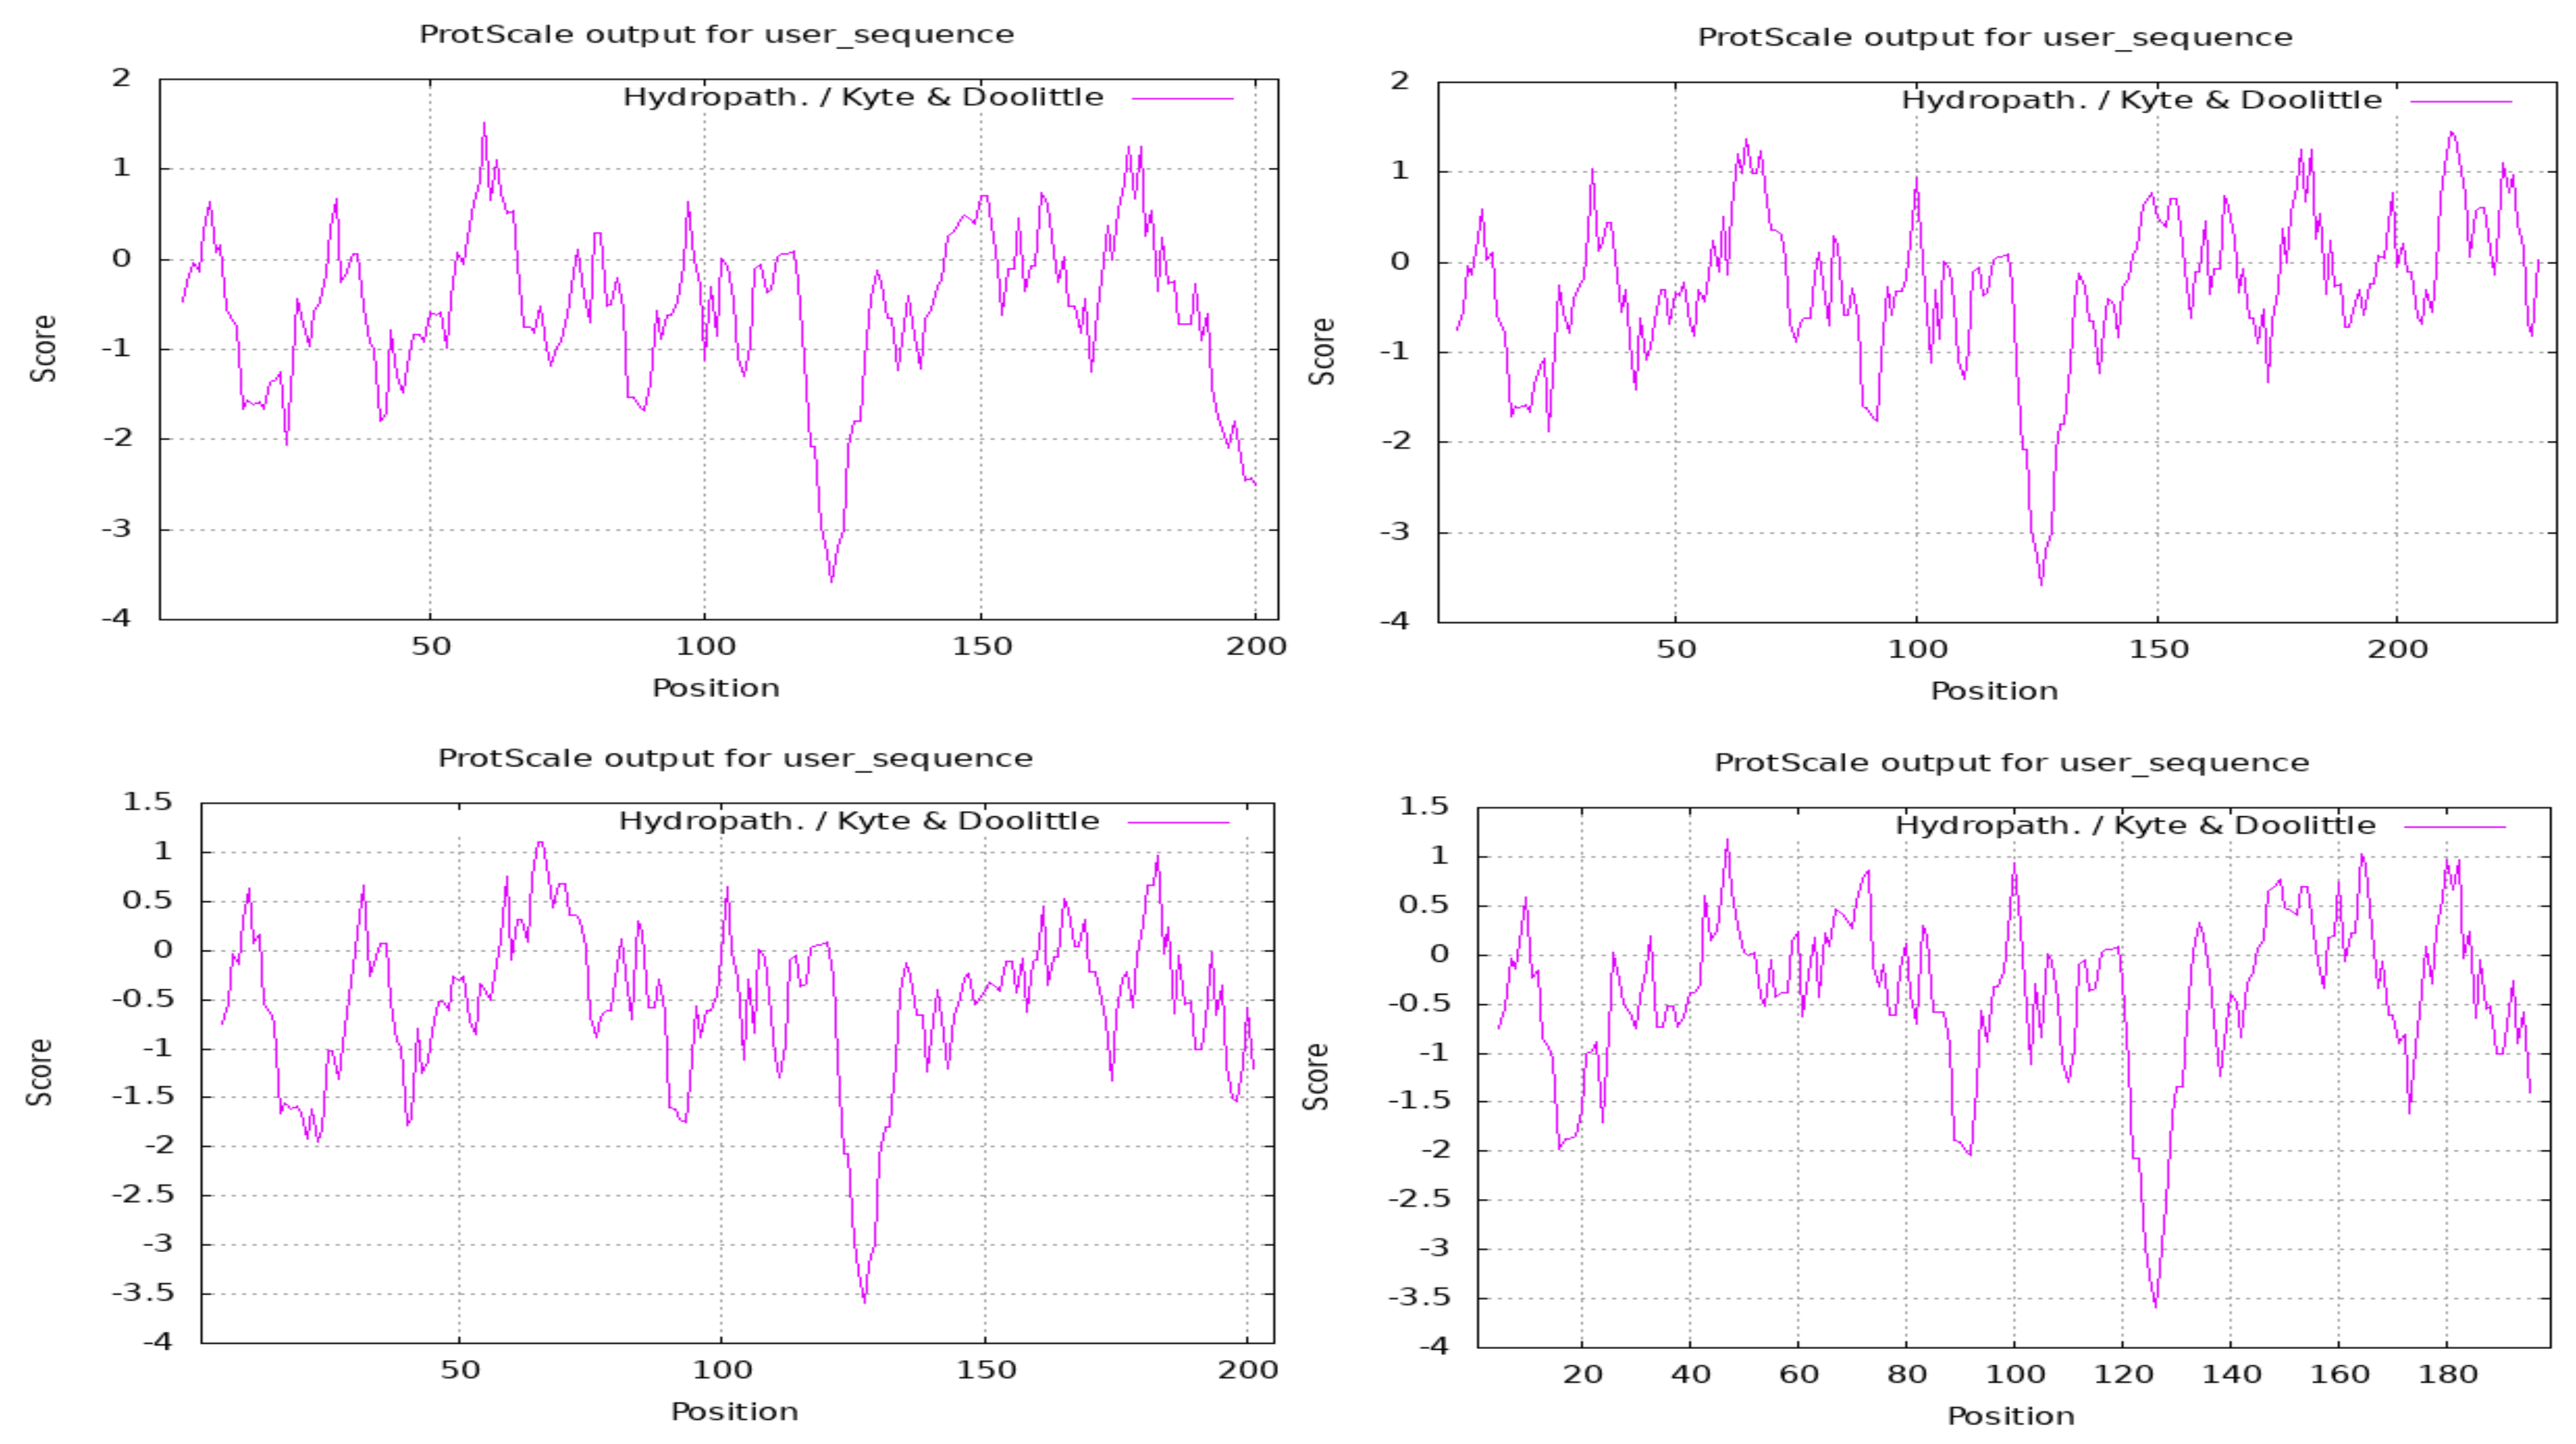
Figure 3.
The phylogenetic tree was constructed by using the maximum likelihood approach in conjunction with the bootstrap test (1000 replications) in MEGA 11 and ITOL.
Figure 3.
The phylogenetic tree was constructed by using the maximum likelihood approach in conjunction with the bootstrap test (1000 replications) in MEGA 11 and ITOL.
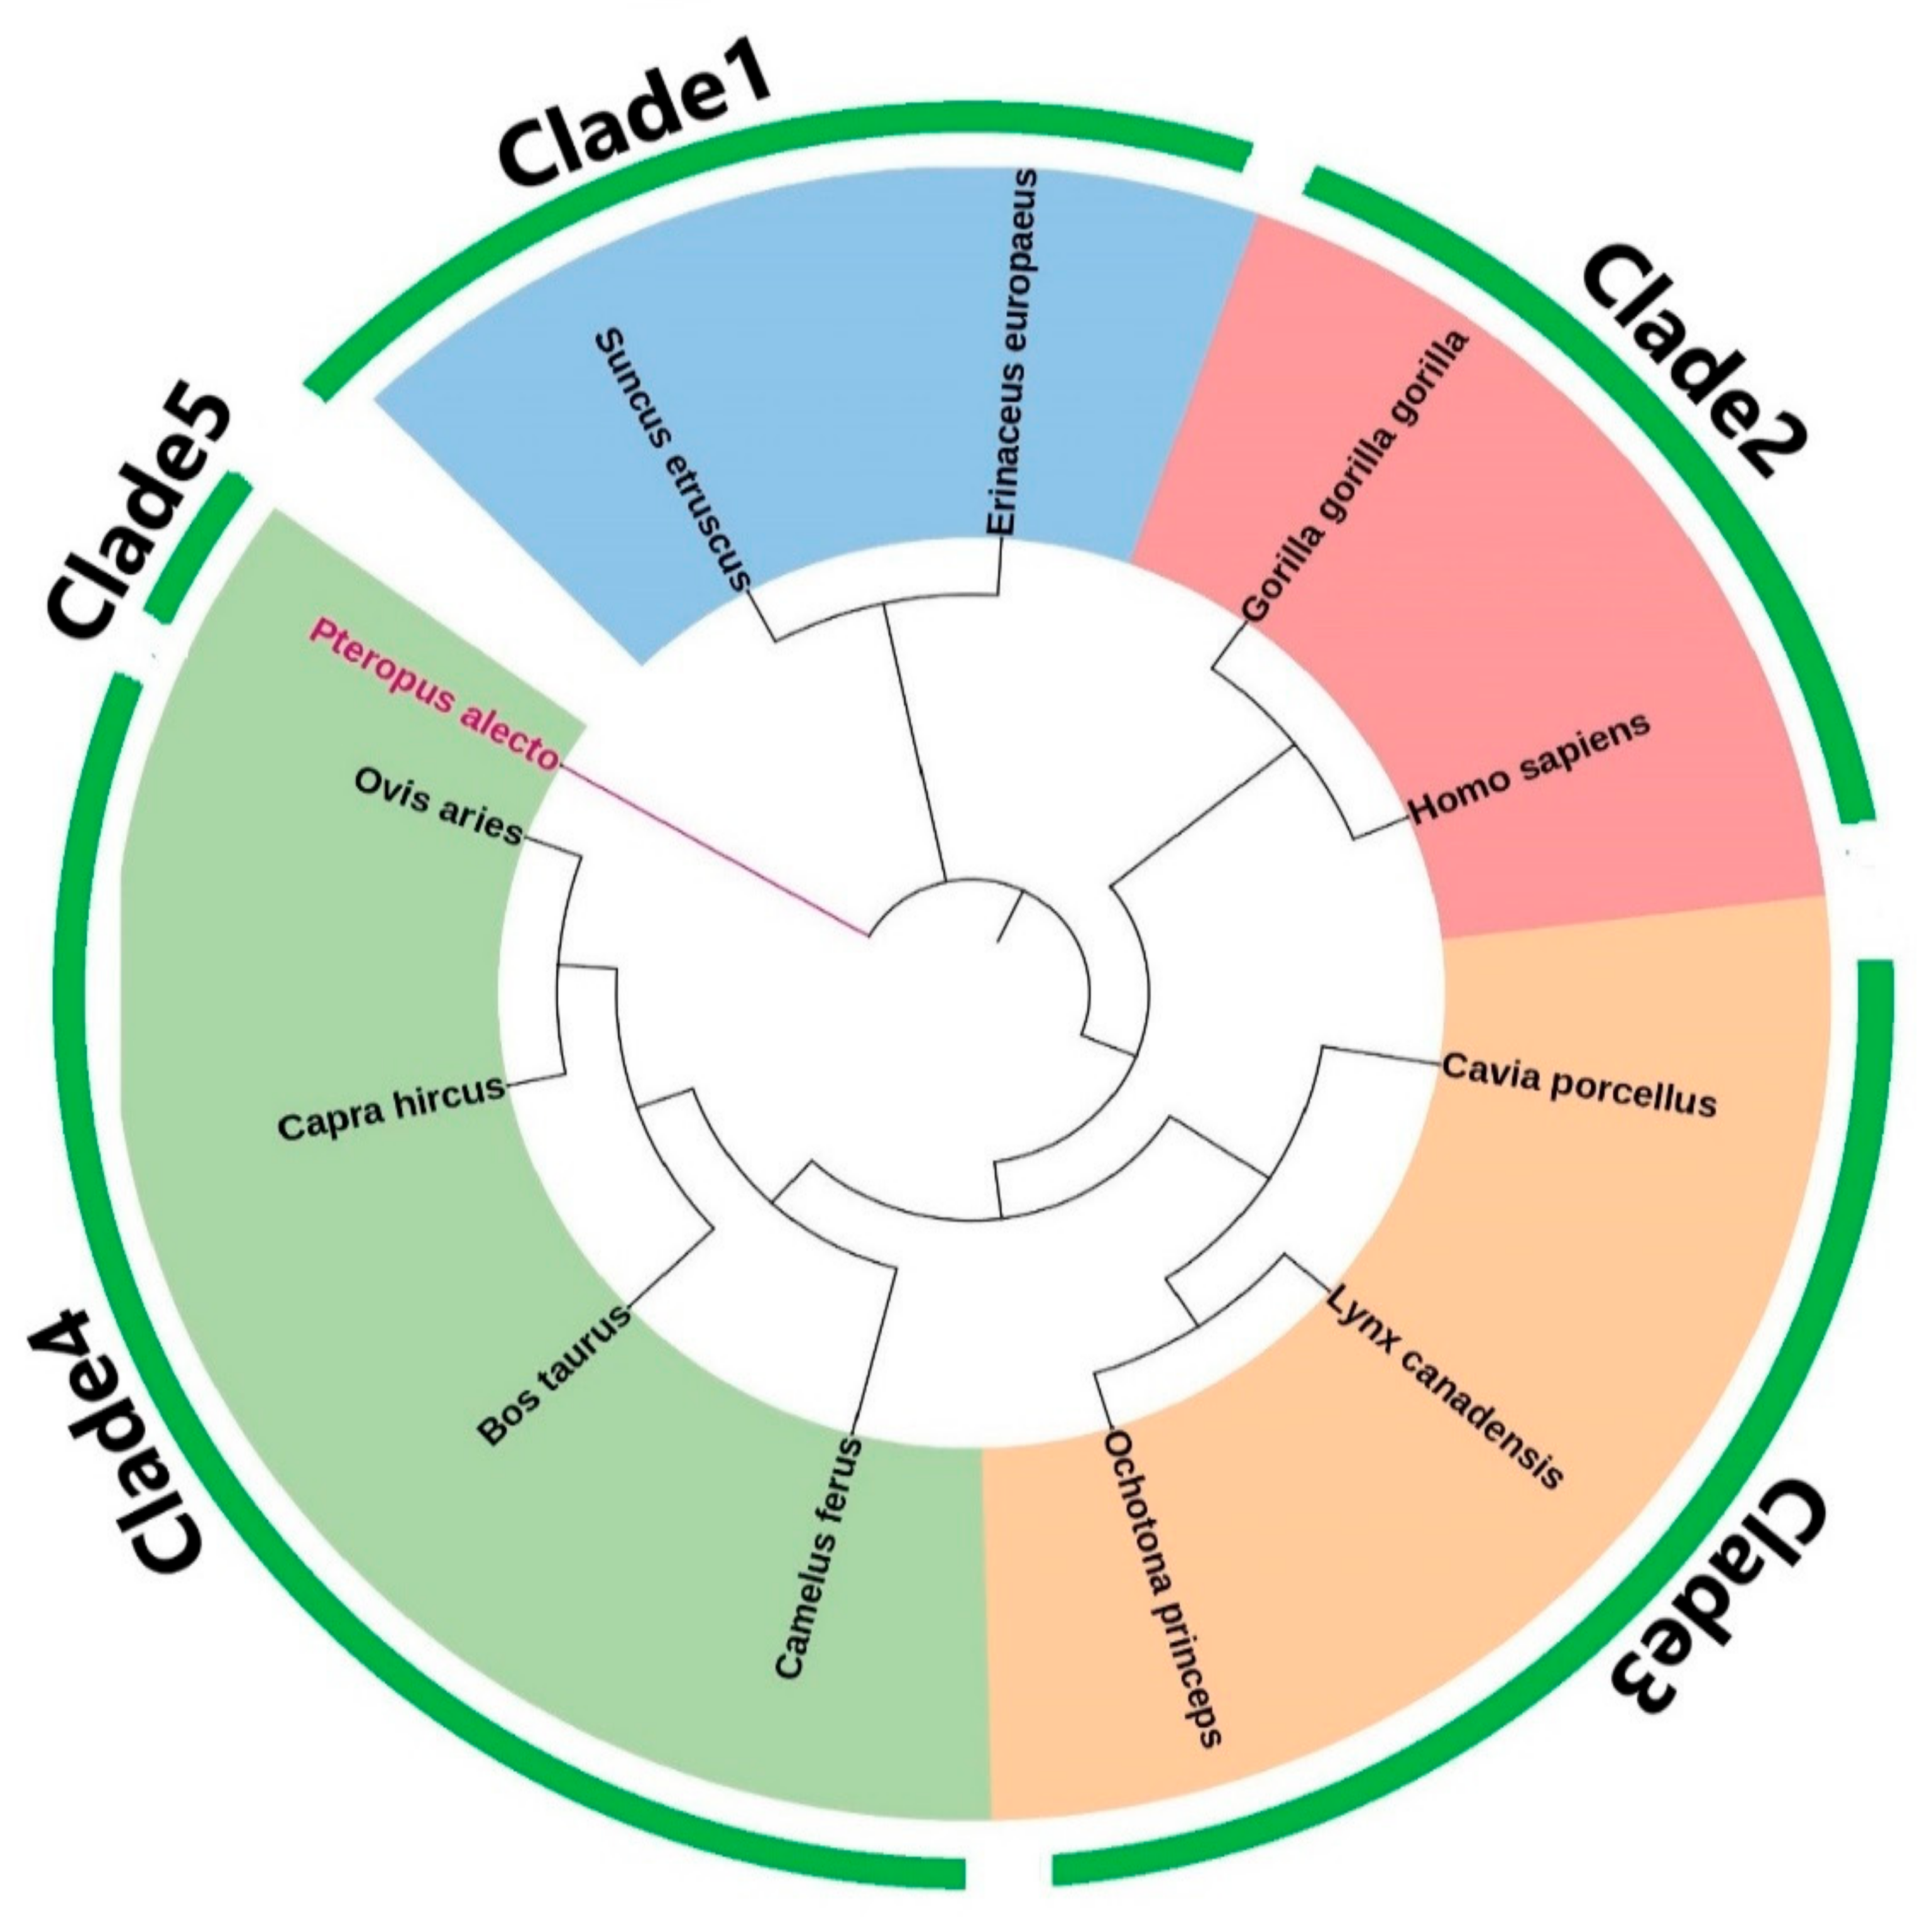
Figure 4.
The motifs found in the protein sequences of 12 distinct organisms, with each motif represented by a unique color.
Figure 4.
The motifs found in the protein sequences of 12 distinct organisms, with each motif represented by a unique color.
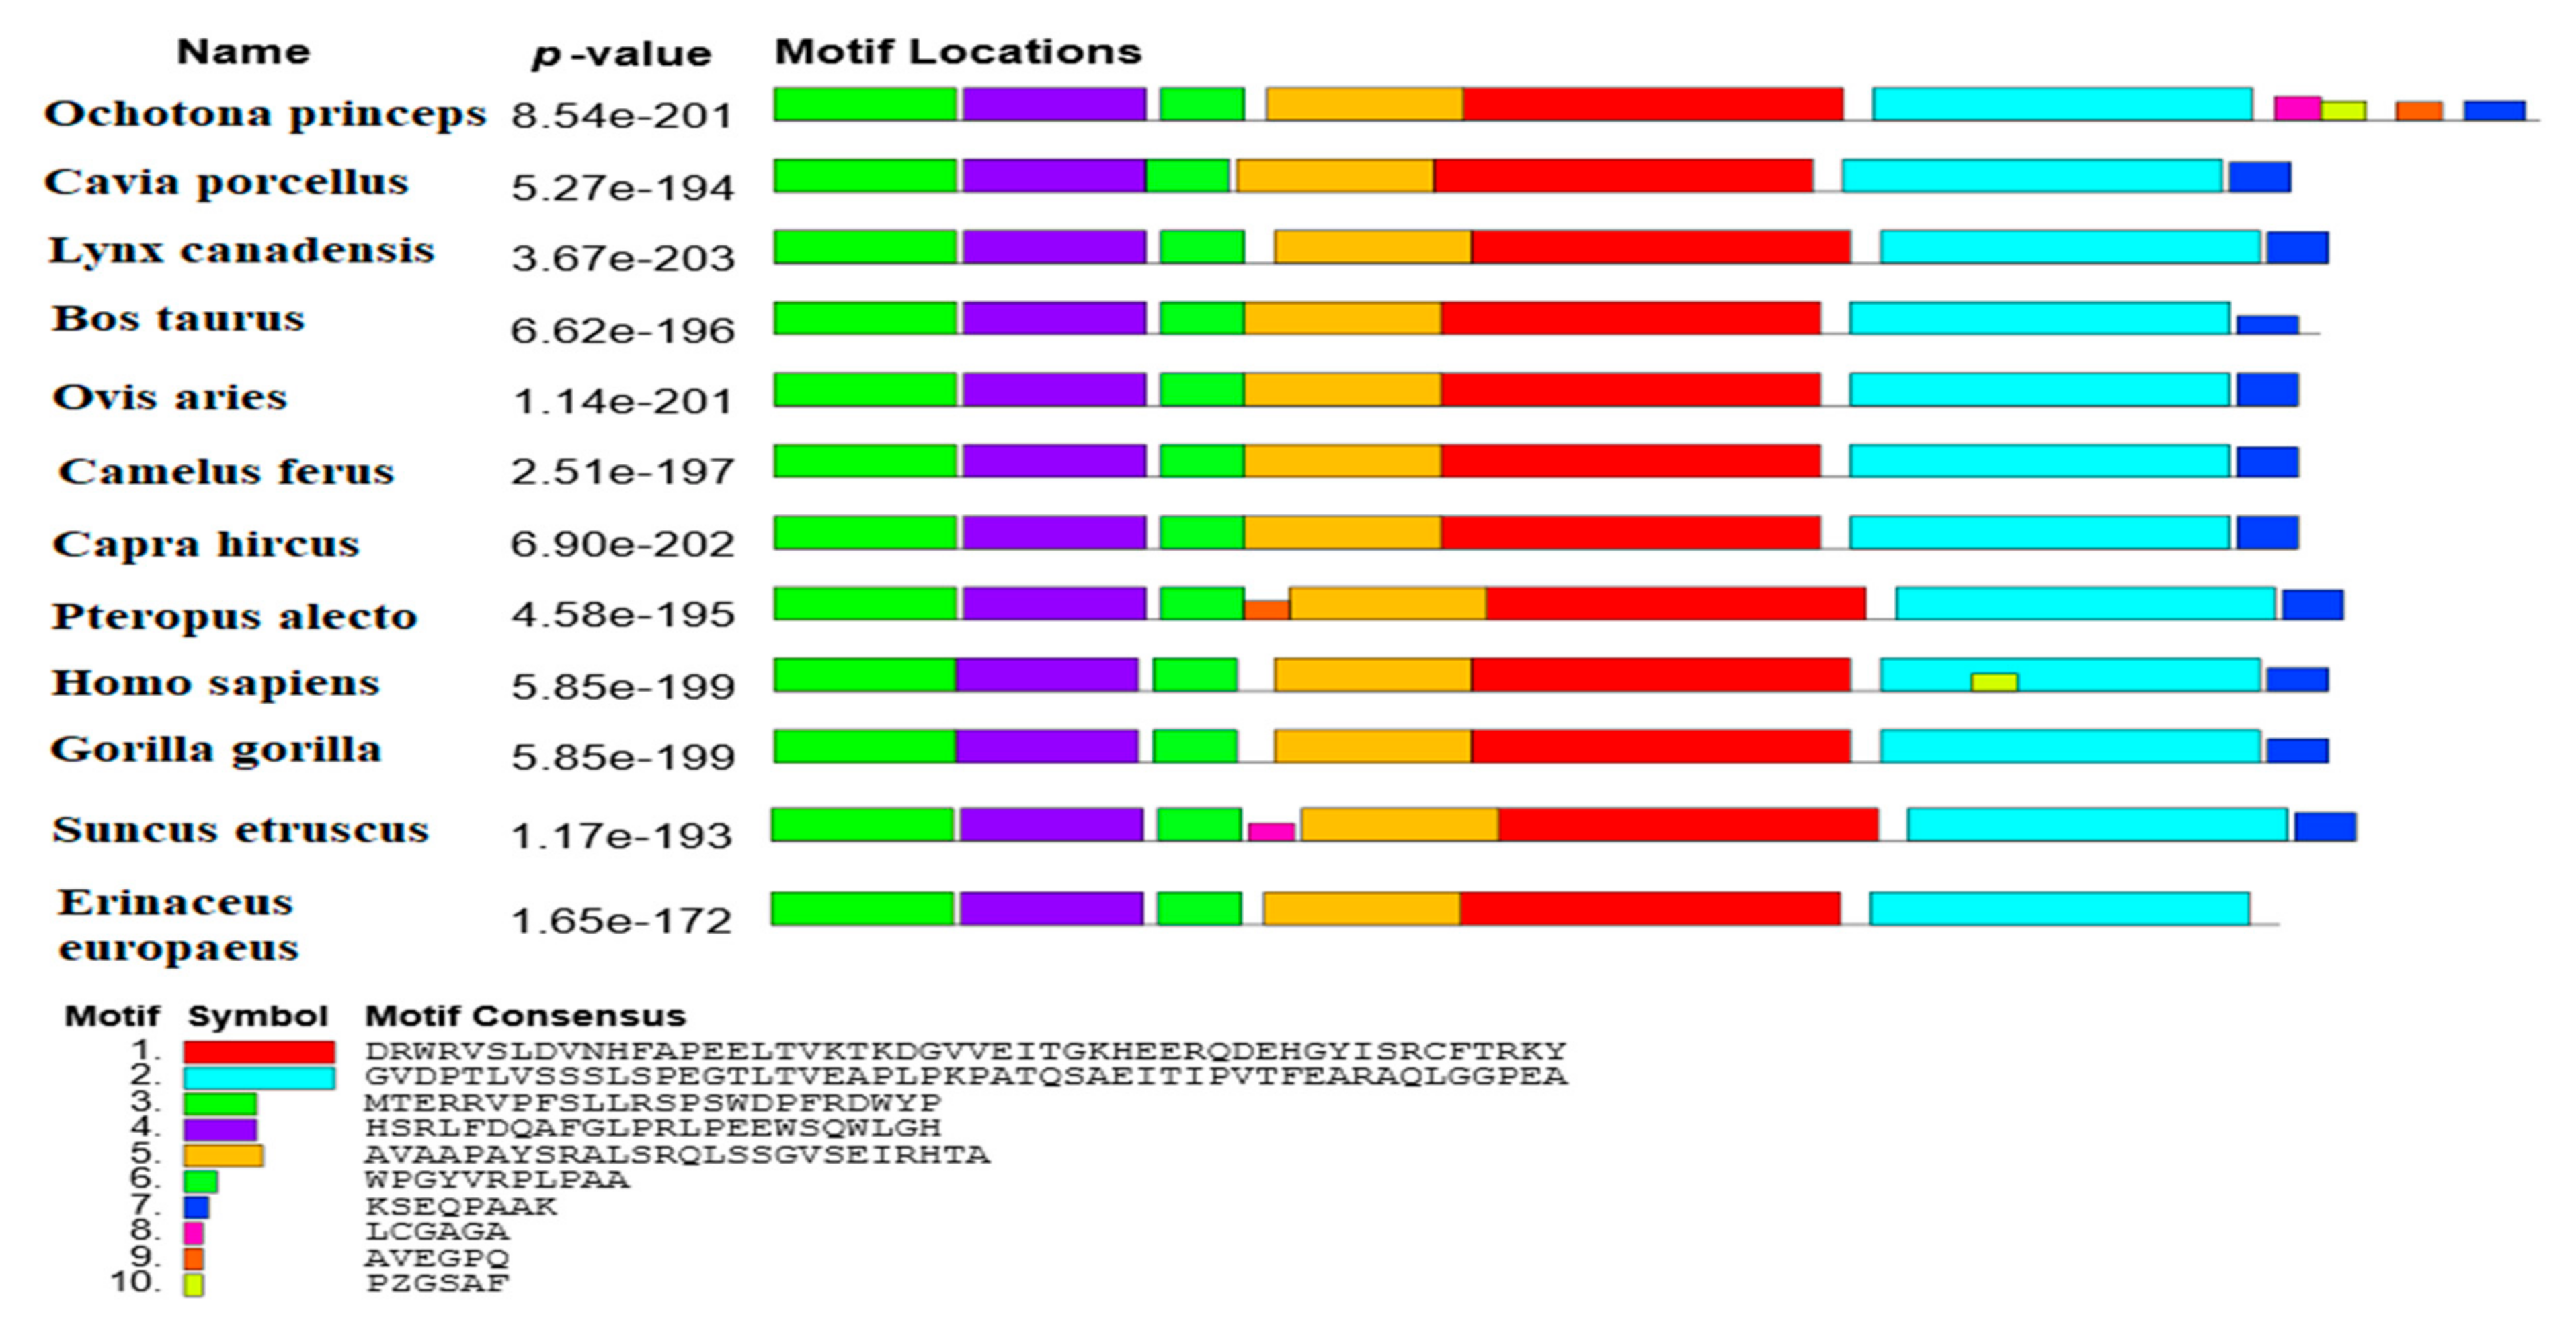
Figure 6.
Protein tertiary structures predicted by Phyre2.
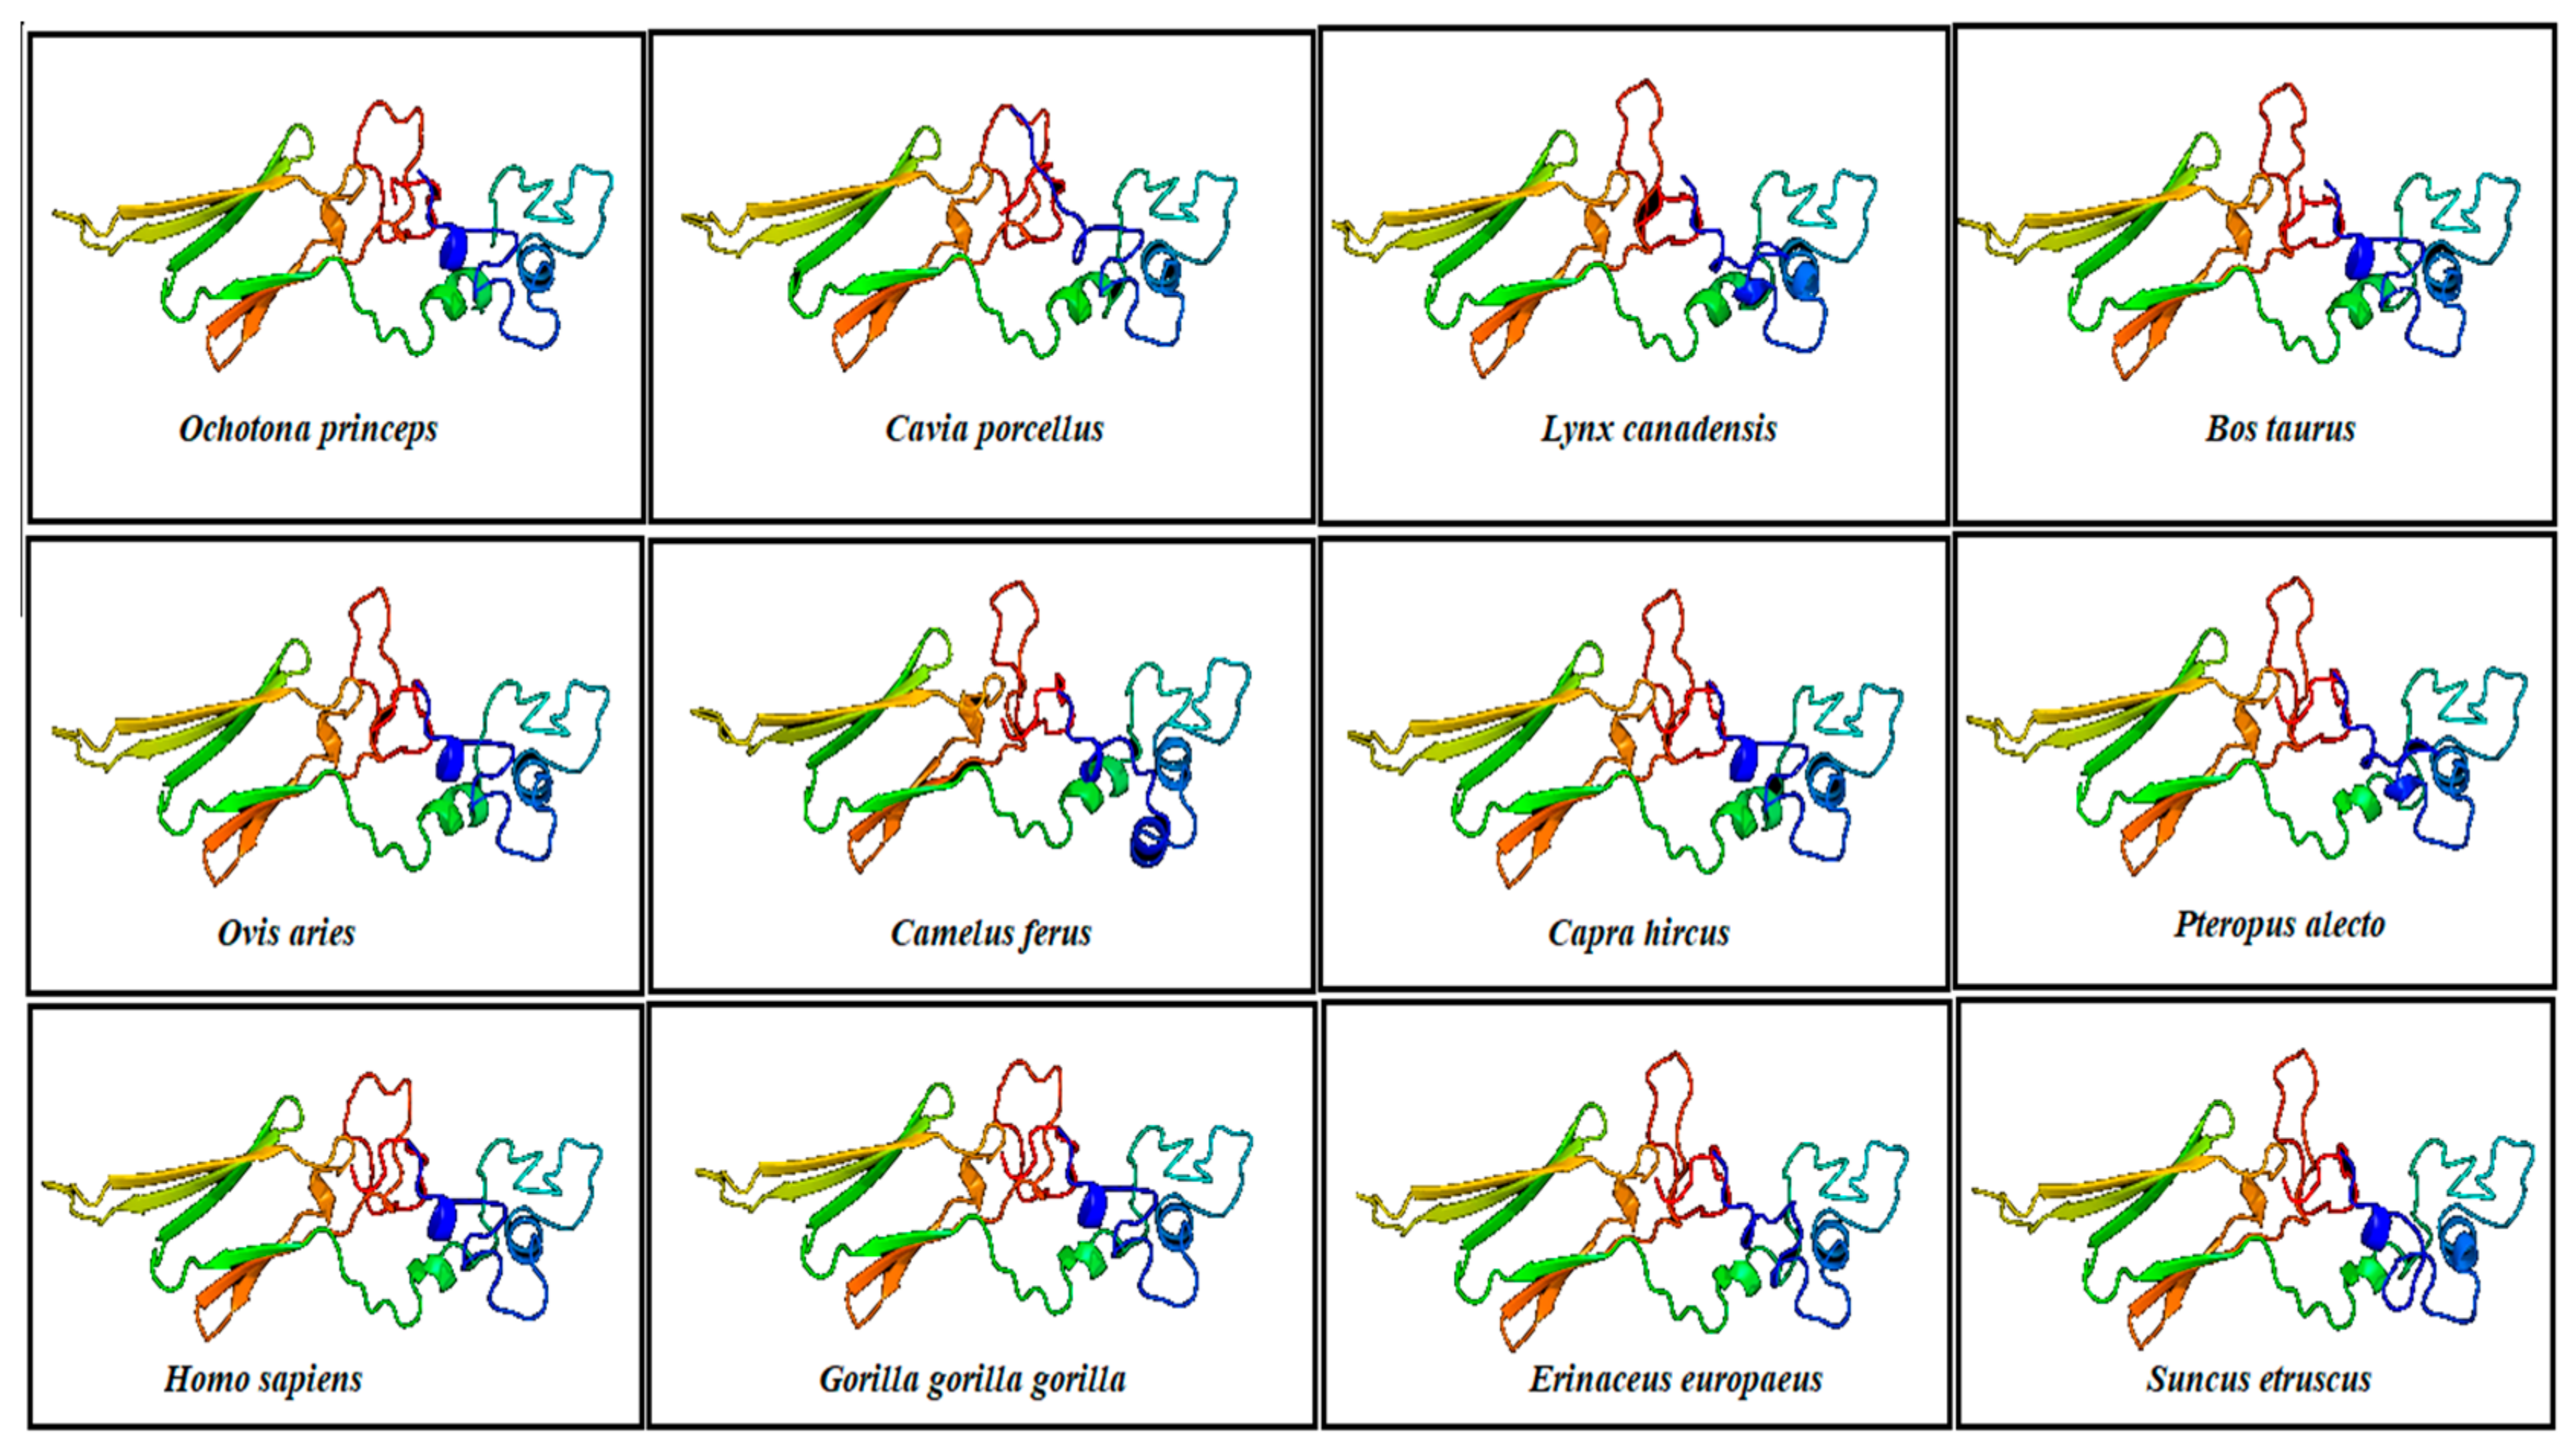

Table 1.
Information about data source, organism nucleotide and amino acid sequence length, and accession ID.
Table 1.
Information about data source, organism nucleotide and amino acid sequence length, and accession ID.
| Species | Protein-ID | Length | Database | Accession-ID | Database |
|---|---|---|---|---|---|
| Ochotona princeps | XP_004587250.1 | 233 | NCBI | XM_004587193.1 | NCBI |
| Cavia porcellus | XP_003470158.1 | 200 | NCBI | XM_003470110.4 | NCBI |
| Lynx Canadensis | XP_030157330.1 | 205 | NCBI | XM_030301470.1 | NCBI |
| Bos Taurus | NP_001020740.1 | 204 | NCBI | NM_001025569.1 | NCBI |
| Ovis aries | XP_027817273.1 | 201 | NCBI | XM_027961472.2 | NCBI |
| Camelus ferus | XP_032315487.1 | 201 | NCBI | XM_032459596.1 | NCBI |
| Capra hircus | XP_017896392.1 | 201 | NCBI | XM_018040903.1 | NCBI |
| Pteropus Alecto | XP_006918629.1 | 207 | NCBI | XM_006918567.3 | NCBI |
| Homo sapiens | NP_001531.1 | 205 | NCBI | NM_001540.5 | NCBI |
| Gorilla gorilla | XP_004045665.1 | 205 | NCBI | XM_004045617.3 | NCBI |
| Erinaceus europaeus | XP_007518007.1 | 199 | NCBI | XM_007517945.2 | NCBI |
| Suncus etruscus | XP_049643837.1 | 209 | NCBI | XM_049787880.1 | NCBI |
Table 2.
Physiochemical characteristics of different organisms.
| Species | AA length | Molecular Weight | Theoretical PI | Instability index | Aliphatic index | Gravy | Localization |
|---|---|---|---|---|---|---|---|
| Ochotona princeps | 233 | 25476.85 | 6.60 | 58.61 | 77.47 | -0.289 | Mitochondria |
| Cavia porcellus | 200 | 22284.03 | 6.12 | 61.85 | 68.25 | -0.562 | Nuclear |
| Lynx Canadensis | 205 | 22720.55 | 6.23 | 65.03 | 67.61 | -0.524 | Mitochondria |
| Bos Taurus | 204 | 22679.34 | 5.77 | 59.53 | 69.36 | -0.597 | Mitochondria |
| Ovis aries | 201 | 22334.03 | 6.22 | 63.46 | 70.40 | -0.568 | Nuclear |
| Camelus ferus | 201 | 22410.17 | 6.09 | 65.52 | 70.85 | -0.551 | Nuclear |
| Capra hircus | 201 | 22349.00 | 6.22 | 62.71 | 68.46 | -0.604 | Nuclear |
| Pteropus alecto | 207 | 22853.71 | 6.32 | 73.49 | 66.43 | -0.549 | Nuclear |
| Homo sapiens | 205 | 22782.52 | 5.98 | 62.82 | 68.54 | -0.567 | Nuclear |
| Gorilla gorilla | 205 | 22782.52 | 5.98 | 62.82 | 68.54 | -0.567 | Nuclear |
| Erinaceus europaeus | 199 | 22032.94 | 6.08 | 68.37 | 75.43 | -0.438 | Nuclear & <break/>Mitochondria |
| Suncus etruscus | 209 | 22988.85 | 6.22 | 69.20 | 65.84 | -0.492 | Nuclear & <break/>Mitochondria |
Table 3.
Positions of homologous super families and domains present in the selected organisms.
| Organism Name | Homologous Super family<break/>HSP20_like_Chaperone<break/>IPR008978 | Domain 1<break/>ACD_HSPB1<break/> IPR037876 | Domain 2<break/>A Crystalline<break/>IPR002068 |
|---|---|---|---|
| Ochotona princeps | 69-189 | 83-168 | 75-183 |
| Cavia porcellus | 62-187 | 79-164 | 71-179 |
| Lynx canadensis | 69-191 | 76-184 | 84-169 |
| Bos Taurus | 67-187 | 72-180 | 80-165 |
| Ovis aries | 67-187 | 72-180 | 80-165 |
| Camelus ferus | 65-187 | 80-165 | 72-180 |
| Capra hircus | 67-187 | 72-180 | 80-165 |
| Pteropus alecto | 72-193 | 78-186 | 86-171 |
| Homo sapiens | 69-197 | 84-169 | 76-184 |
| Gorilla gorilla | 69-197 | 84-169 | 76-184 |
| Erinaceus europaeus | 69-190 | 83-168 | 75-183 |
| Suncus etruscus | 69-190 | 83-168 | 75-183 |
Table 4.
The percentage of amino acids identical across different organisms.
| Ochotona princeps | Cavia porcellus | Lynx Canadensis | Bos taurus | Ovis aries | Camelus ferus | Capra hircus | Pteropus alecto | Homo sapiens | Gorilla gorilla | Erinaceus europaeus | Suncus etruscus | |
|---|---|---|---|---|---|---|---|---|---|---|---|---|
| Ochotona princeps | 100% | 76.56% | 81.58% | 75.31% | 76.98% | 76.15% | 76.56% | 75.73% | 76.15% | 76.15% | 71.54% | 75.31% |
| Cavia porcellus | 76.56% | 100% | 92.46% | 88.28% | 90.79% | 92.05% | 91.21% | 87.44% | 88.28% | 88.28% | 81.58% | 86.19% |
| Lynx canadensis | 81.58% | 92.46% | 100% | 89.12% | 92.05% | 91.21% | 91.63% | 90.37% | 90.37% | 90.37% | 83.68% | 89.53% |
| Bos taurus | 75.31% | 88.28% | 89.12% | 100% | 96.65% | 93.3% | 96.23% | 85.35% | 86.19% | 86.19% | 79.91% | 82.84% |
| Ovis aries | 76.98% | 90.79% | 92.05% | 96.65% | 100% | 95.81% | 99.58% | 87.86% | 89.12% | 89.12% | 82% | 85.77% |
| Camelus ferus | 76.15% | 92.05% | 91.21% | 93.3% | 95.81% | 100% | 95.39% | 89.53% | 87.86% | 87.86% | 82.42% | 85.35% |
| Capra hircus | 76.56% | 91.21% | 91.63% | 96.23% | 99.58% | 95.39% | 100% | 87.44% | 89.53% | 89.53% | 81.58% | 86.19% |
| Pteropus alecto | 75.73% | 87.44% | 90.37% | 85.35% | 87.86% | 89.53% | 87.44% | 100% | 89.12% | 89.12% | 83.68% | 89.12% |
| Homo sapiens | 76.15% | 88.28% | 90.37% | 86.19% | 89.12% | 87.86% | 89.53% | 89.12% | 100% | 100% | 82.42% | 88.7% |
| Gorilla gorilla | 76.15% | 88.28% | 90.37% | 86.19% | 89.12% | 87.86% | 89.53% | 89.12% | 100% | 100% | 82.42% | 88.7% |
| Erinaceus europaeus | 71.54% | 81.58% | 83.68% | 79.91% | 82% | 82.42% | 81.58% | 83.68% | 82.42% | 82.42% | 100% | 82.84% |
| Suncus etruscus | 75.31% | 86.19% | 89.53% | 82.84% | 85.77% | 85.35% | 86.19% | 89.12% | 88.7% | 88.7% | 82.84% | 100% |
Table 5.
The Percentage of amino acids similar across different organisms.
| Ochotona princeps | Cavia porcellus | Lynx canadensis | Bos taurus | Ovis aries | Camelus ferus | Capra hircus | Pteropus alecto | Homo sapiens | Gorilla gorilla | Erinaceus europaeus | Suncus etruscus | |
|---|---|---|---|---|---|---|---|---|---|---|---|---|
| Ochotona princeps | 100% | 75.73% | 80.33% | 74.47% | 75.73% | 75.73% | 75.31% | 76.56% | 75.73% | 75.73% | 71.12% | 76.56% |
| Cavia porcellus | 75.73% | 100% | 78.66% | 74.89% | 76.15% | 78.24% | 76.56% | 75.73% | 75.73% | 75.73% | 69.45% | 75.31% |
| Lynx canadensis | 80.33% | 78.66% | 100% | 76.15% | 77.82% | 77.82% | 77.4% | 78.24% | 77.4% | 77.4% | 71.12% | 77.82% |
| Bos taurus | 74.47% | 74.89% | 76.15% | 100% | 82% | 79.49% | 81.58% | 74.89% | 74.47% | 74.47% | 68.2% | 73.22% |
| Ovis aries | 75.73% | 76.15% | 77.82% | 82% | 100% | 80.75% | 83.68% | 76.15% | 76.15% | 76.15% | 69.03% | 74.89% |
| Camelus ferus | 75.73% | 78.24% | 77.82% | 79.49% | 80.75% | 100% | 80.33% | 76.98% | 75.73% | 75.73% | 69.45% | 75.31% |
| Capra hircus | 75.31% | 76.56% | 77.4% | 81.58% | 83.68% | 80.33% | 100% | 75.73% | 76.56% | 76.56% | 68.61% | 75.31% |
| Pteropus alecto | 76.56% | 75.73% | 78.24% | 74.89% | 76.15% | 76.98% | 75.73% | 100% | 78.24% | 78.24% | 72.38% | 78.66% |
| Homo sapiens | 75.73% | 75.73% | 77.4% | 74.47% | 76.15% | 75.73% | 76.56% | 78.24% | 100% | 85.77% | 70.71% | 78.66% |
| Gorilla gorilla | 75.73% | 75.73% | 77.4% | 74.47% | 76.15% | 75.73% | 76.56% | 78.24% | 85.77% | 100% | 70.71% | 78.66% |
| Erinaceus europaeus | 71.12% | 69.45% | 71.12% | 68.2% | 69.03% | 69.45% | 68.61% | 72.38% | 70.71% | 70.71% | 100% | 73.22% |
| Suncus etruscus | 76.56% | 75.31% | 77.82% | 73.22% | 74.89% | 75.31% | 75.31% | 78.66% | 78.66% | 78.66% | 73.22% | 100% |
Table 6.
All the criteria and percentages for the secondary structure of the organisms.
| Organism Name | Alpha helix | Beta Bridge | Beta Turn | Extended strand | Random Coil |
|---|---|---|---|---|---|
| Ochotona princeps | 26.61% | 0.00% | 0.00% | 14.16% | 59.23% |
| Cavia porcellus | 21.00% | 0.00% | 0.00% | 11.00% | 68.00% |
| Lynx Canadensis | 26.83% | 0.00% | 0.00% | 12.20% | 60.98% |
| Bos Taurus | 21.08% | 0.00% | 0.00% | 17.75% | 61.27% |
| Ovis aries | 20.90% | 0.00% | 0.00% | 14.93% | 64.18% |
| Camelus ferus | 19.90% | 0.00% | 0.00% | 16.40% | 63.68% |
| Capra hircus | 20.90% | 0.00% | 0.00% | 12.94% | 66.17% |
| Pteropus Alecto | 18.36% | 0.00% | 0.00% | 13.53% | 68.12% |
| Homo sapiens | 13.66% | 0.00% | 0.00% | 13.17% | 73.17% |
| Gorilla gorilla | 13.66% | 0.00% | 0.00% | 13.17 | 73.17% |
| Erinaceus europaeus | 16.58% | 0.00% | 0.00% | 17.59% | 65.83% |
| Suncus etruscus | 18.66% | 0.00% | 0.00% | 12.44% | 68.90% |
Disclaimer/Publisher’s Note: The statements, opinions and data contained in all publications are solely those of the individual author(s) and contributor(s) and not of MDPI and/or the editor(s). MDPI and/or the editor(s) disclaim responsibility for any injury to people or property resulting from any ideas, methods, instructions or products referred to in the content. |
© 2025 by the authors. Licensee MDPI, Basel, Switzerland. This article is an open access article distributed under the terms and conditions of the Creative Commons Attribution (CC BY) license (http://creativecommons.org/licenses/by/4.0/).
Copyright: This open access article is published under a Creative Commons CC BY 4.0 license, which permit the free download, distribution, and reuse, provided that the author and preprint are cited in any reuse.


