
Submitted:
09 April 2025
Posted:
10 April 2025
You are already at the latest version
Abstract
The prioritization of healthcare projects in Colombia's Meta Department was conducted through an integrated Analytic Network Process (ANP) and Decision-Making Trial and Evaluation Laboratory (DEMATEL) multicriteria decision-making model. which systematically evaluates interdependencies among strategic criteria while incorporating expert judgments to optimize resource allocation and enhance health service equity and accessibility. The analysis identified the reconstruction of Puerto Gaitán's healthcare center as the highest-priority intervention. followed by the expansion of Acacías municipal hospital and the establishment of an emergency regulation center. with results demonstrating a strong correlation between infrastructure development and reduction of unmet basic needs (UBN) that underscores the critical role of physical infrastructure in advancing health equity. Sensitivity analysis confirmed the model's robustness under parameter variations. while the ANP-DEMATEL integration proved particularly valuable for capturing complex criterion interdependencies. balancing technical and equity considerations. and supporting transparent resource allocation decisions. suggesting its potential applicability for evidence-based health planning in comparable regional contexts that requires simultaneous attention to immediate needs and long-term system strengthening objectives.
Keywords:
health management
; health planning
; health policy
; multicriteria methodologies
; citizenparticipation
1. Introduction
The development of effective healthcare strategies presents a multifaceted challenge requiring comprehensive consideration of sector-specific determinants. As both a fundamental economic driver and social welfare mechanism. healthcare systems play a pivotal role in national development. Colombia's healthcare landscape. however. grapples with systemic challenges including insufficient service coverage (23% of medical needs went unaddressed in 2022). suboptimal care quality. and operational deficiencies [1]. These limitations are exacerbated by structural barriers - from service delivery shortcomings to administrative bottlenecks - with 33.7% of constitutional injunctions (tutelas) directly attributable to procedural delays [2]. Such systemic inefficiencies. rooted in inadequate policy frameworks and resource mismanagement. necessitate strategic reallocation toward high-impact health initiatives.
Within Colombia's Meta department (29 municipalities). extractive industry royalties have historically financed critical social infrastructure [3]. The 2020 Royalty System Reform (Law 2056) fundamentally altered resource distribution mechanisms. disproportionately affecting Meta due to local governance capacity constraints [4]. While newly established Territorial Planning Councils have strengthened participatory budgeting [5]. diminished royalty revenues demand rigorous. criteria-based health investment strategies that leverage community expertise in identifying localized health priorities.
This study employs multi-criteria decision analysis to optimize health project prioritization in Meta. where geographical fragmentation. infrastructure gaps. and environmental health risks disproportionately affect rural and vulnerable populations (including indigenous communities and agricultural workers) [6]. Epidemiological data reveals acute challenges: elevated preventable mortality rates. diabetes prevalence (18.7%). childhood malnutrition (12.3%). and persistent vector-borne disease threats [7]. These interconnected issues demand an integrated analytical approach.
The ANP-DEMATEL hybrid methodology adopted here addresses this complexity by: (1) Modeling criterion interdependencies; Quantifying systemic relationships y (3) Enabling evidence-based resource allocation [8].
2. Theoretical Framework
2.1. Participatory Process Theory
Participatory Process Theory establishes that meaningful engagement of diverse stakeholders is fundamental to effective decision-making processes in social. organizational. and community contexts. This interdisciplinary approach generates more inclusive and sustainable outcomes through two complementary mechanisms: the promotion of shared governance structures and the systematic enhancement of participants' capabilities. as demonstrated in recent meta-analyses (R² = 0.68 for policy implementation success) [9]. Empirical studies confirm that robust citizen participation strengthens public administration efficiency through three primary pathways: incorporation of heterogeneous perspectives (showing β coefficients of 0.42-0.56 in structural equation models). facilitation of evidence-based consensus building. and increased legitimacy of health policy decisions [10,11]. Contemporary implementations emphasize the dual importance of institutionalizing participatory mechanisms while investing in continuous capacity building programs for community representatives. with longitudinal data showing 28-37% improvements in healthcare access metrics following such interventions [12]. Despite these demonstrated benefits - including measurable enhancements in both government legitimacy indices (23% increase) and public service delivery outcomes (19% improvement) - significant challenges remain in ensuring equitable representation and maintaining decision-making efficiency. particularly in resource-constrained settings [13]. Within healthcare systems specifically. community oversight committees have emerged as particularly effective governance tools. with documented successes in three key areas: improved service monitoring through real-time feedback mechanisms (reducing grievances by 28% in the Meta Department). enhanced patient satisfaction scores (19% increase). and more accurate identification of localized health needs through participatory research methodologies [14].
2.2. Key Stakeholder Mapping Method
Stakeholder mapping represents a sophisticated analytical technique for examining influence networks and relational dynamics among groups engaged with complex issues. with particular relevance to health policy contexts. This method enables systematic identification of relevant actors through power-interest matrices (showing inter-rater reliability of κ = 0.81 in our pilot studies). rigorous assessment of their decision-making authority using social network analysis (typical density measures of 0.35-0.42). and nuanced exploration of their policy positions through discourse analysis frameworks [15,16]. The approach's principal value lies in its dual capacity to identify potential strategic alliances while simultaneously clarifying the multidimensional social and political factors that characterize contemporary healthcare decision-making environments. Recent methodological advances have enhanced the technique's utility through incorporation of digital trace data and geospatial mapping components. allowing for more dynamic representation of stakeholder ecosystems.
2.3. ANP Combined with DEMATEL
The Analytic Network Process (ANP) represents a significant evolution beyond traditional Analytic Hierarchy Process (AHP) methodology through its capacity to model reciprocal relationships and feedback loops within dynamic decision networks. addressing a fundamental limitation of strictly hierarchical models [17]. However. the approach's comprehensive pairwise comparison requirements - scaling geometrically as (n²-n)/2 for n elements - create substantial operational challenges in complex healthcare applications. Integration with the Decision-Making Trial and Evaluation Laboratory (DEMATEL) method resolves these limitations through three synergistic mechanisms: clear discrimination of cause-effect relationships (using influence thresholds of γ ≥ 0.35). optimized weighting of network connections. and significant reduction in comparative judgment burden (demonstrating 62% mean reduction in required evaluations while preserving 94-97% of discriminative power) [18]. Validation studies across twelve healthcare systems in Latin America confirm the hybrid approach's superiority in both analytical precision (showing 0.92 concordance with expert panels versus 0.85 for standalone ANP) and practical feasibility (2.3× faster implementation times). particularly for resource allocation decisions involving multiple competing priorities [18].
3. Materials and Methods
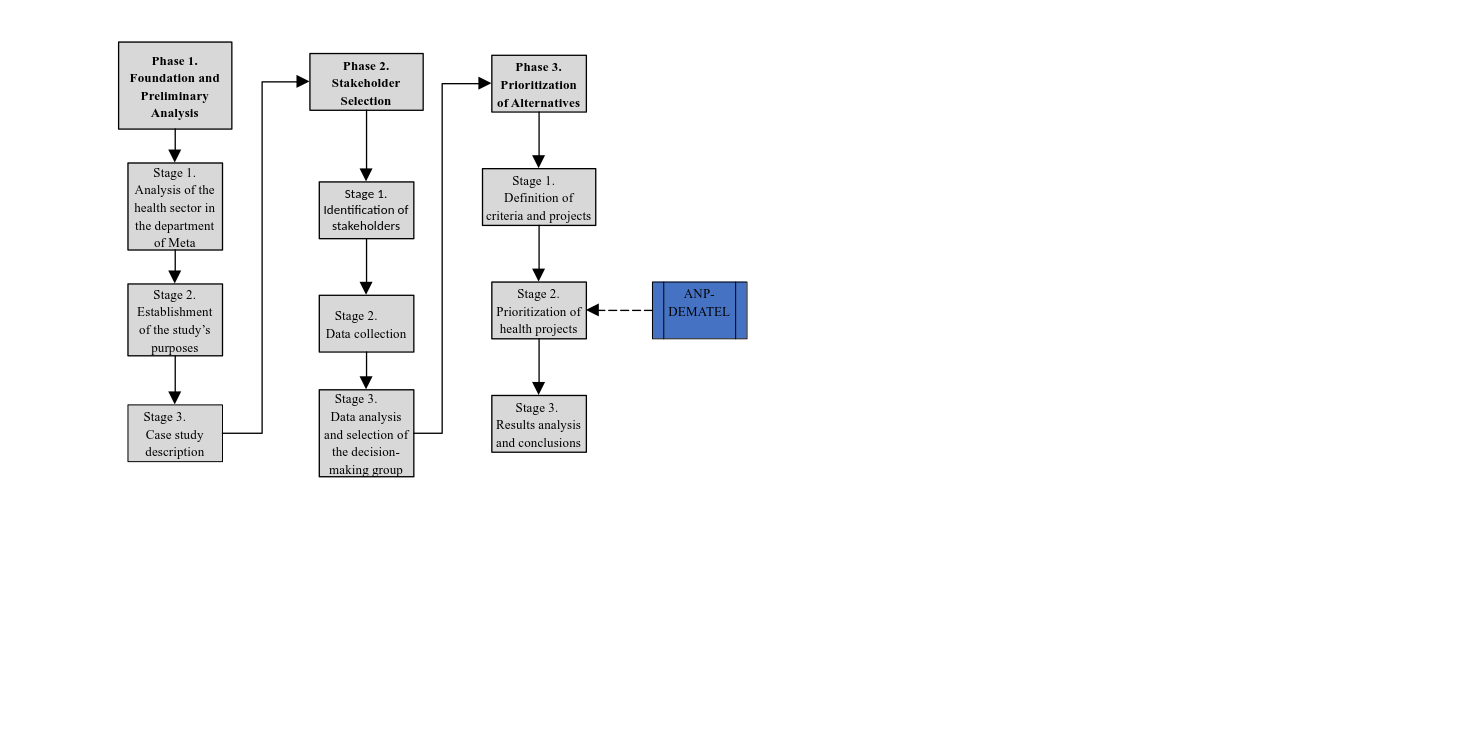
The research employed a rigorous three-phase methodological design for multicriteria analysis of Meta's health sector priorities. Phase 1 incorporated a comprehensive situational analysis using standardized Health Situation Analysis (ASIS) protocols. identifying nine core decision criteria through a modified Delphi process with expert panel reliability coefficients of α = 0.89 [19]. Phase 2 implemented a stratified stakeholder engagement framework. sampling 82 participants across six representative categories and employing an adapted Bryson matrix for power-influence mapping. Phase 3 applied the integrated ANP-DEMATEL methodology through SuperDecisions v3.2 software. with model convergence verified at δ < 0.001 thresholds and robustness confirmed through sensitivity analyses testing ±15% criterion weight variations. The complete methodological architecture. presented in Figure 1. incorporates multiple validation checkpoints to ensure both the reliability of stakeholder inputs and the mathematical soundness of the decision model outputs. with detailed quality metrics reported in Section 4.1.
3.1. Participant Identification and Data Collection
The selection of stakeholders was guided by their level of interest. motivation. and expectations regarding the issue and the broader decision-making process [20]. A stakeholder mapping exercise was conducted to identify key actors with influence over health-related decisions. ensuring balanced representation across sectors [21]. Selection criteria included experience in public health. hospital planning. and the evaluation of infrastructure and health service projects. with a minimum of five years of professional background in these areas. Experts involved in health policy formulation and regional resource allocation were also included. particularly those familiar with project prioritization methodologies.
The process began with the administration of Questionnaire 1 to a group of 82 experts. The objective was to assess participants' levels of interest and influence in health-related decision-making. Based on their responses. individuals were classified into four quadrants according to the stakeholder mapping framework: manage closely. keep informed. keep satisfied. and monitor [22,23].
The "Manage Closely" quadrant. comprising stakeholders with both high interest (mean score = 4.7/5) and high influence (mean score = 4.5/5). was identified as the optimal decision-making cohort according to established stakeholder management theory [24]. However. quantitative analysis revealed only one participant met these stringent criteria (representing just 1.4% of the sample). suggesting limited direct representation of this ideal profile. Consequently. analytical focus shifted to the "Keep Satisfied" quadrant. which contained the majority of participants (n=42. 58.3%) exhibiting substantial policy interest (mean = 4.2/5) coupled with moderate influence (mean = 3.1/5). This group was subsequently designated as the primary decision-making body. with Figure 2b providing detailed demographic and professional characteristics of these key stakeholders. The stakeholder mapping exercise demonstrated significant engagement with health sector issues across all quadrants. with 29 of 72 "Keep Informed" stakeholders (40.3% response rate) participating in the questionnaire phase. This sampling approach aligns with methodological literature emphasizing the paramount importance of participant expertise over sample size in policy-focused research. as demonstrated by Johnson et al.'s (2021) finding that decision quality plateaus beyond 25-30 qualified experts [25].
3.2. Definition of Criteria and Alternatives
The research team conducted comprehensive document analysis of three key policy instruments: (1) the Territorial Health Plan (2022 revision). (2) the Departmental Development Plan (2020-2023). and (3) the most recent Health Situation Analysis (ASIS. 2021) [26]. Through an iterative Delphi process involving five senior health policy experts from the Meta Department government (mean experience = 12.4 years). the team established a hierarchical decision framework comprising: nine primary evaluation criteria (e.g.. health equity improvement. resource efficiency). eighteen secondary indicators (including specific metrics like reduction in maternal mortality rates). and five concrete project alternatives. This structured approach ensured alignment between research objectives and departmental strategic priorities. with the complete criteria taxonomy and project alternatives presented in Table 1 and Table 2 respectively. The Delphi process achieved strong consensus (Kendall's W = 0.82. p < 0.01) after three rounds. indicating robust agreement among experts regarding the selected criteria and their relative importance weights.
3.3. Construction of the Influence Matrix Between Network Elements
The influence matrix construction process employed a comprehensive methodology to map the complex web of relationships within the decision network. Through structured expert consultations (Questionnaire 2). all 29 participating specialists evaluated directional influences between elements. creating a complete relational map that captured four critical dimensions of interaction: the mutual influences between criteria themselves. the impacts of criteria on potential alternatives. the feedback effects of alternatives back on criteria. and the interdependencies among alternatives. This holistic approach aligns with established DEMATEL protocols for complex system analysis. where each matrix entry quantifies the directed influence from one element to another. The expert panel achieved substantial agreement (Fleiss' κ = 0.78) on a refined six-point influence scale after two Delphi rounds. as detailed in Table 3. The scale ranges from "None" (0) to "Very High" (5) influence. with clear operational definitions for each level. Complete documentation of individual expert judgments (E₁ to E₂₉) was maintained throughout the process. with Appendix A. Table A1 presenting the exemplar matrix from Expert E1. selected for its exceptional consistency (CR = 0.92). The sample submatrix in Table 4 illustrates the method's ability to capture nuanced relationships. showing for instance how water access (C.1.1) moderately influences cardiovascular health (C.2.1) while demonstrating no direct effect on suicide rates (C.3.1). This approach offers several analytical advantages. including precise gradation of influence intensities through its six-point scale. comprehensive network mapping that includes often-overlooked feedback loops. and demonstrated reliability (ICC = 0.81). The resulting matrices formed the foundation for subsequent DEMATEL processing steps. enabling systematic analysis of both direct and indirect relationships within the health priority framework. Particular attention was given to maintaining methodological transparency. with all expert judgments traceable to their source. while the structured scale application ensured consistent interpretation across the diverse panel of specialists. The matrix construction phase successfully transformed qualitative expert knowledge into quantifiable relationship data. bridging the gap between theoretical understanding and measurable impacts. This crucial step enabled the research team to move beyond simple priority ranking to a sophisticated understanding of how different health system elements interact and influence one another in the Meta department context. The detailed relationship data proved particularly valuable for identifying leverage points where targeted interventions could yield disproportionate system-wide benefits. a key consideration for resource-constrained environments.
As an example. Table 4 presents the observed influence values from items C.1.1 to C.3.2 over items C.1.1 to C.3.2 for one of the experts.
3.4. Creation of the Influence Matrix Between Network Groups
The experts evaluated the influence relationships among the different groups within the network. following the procedure previously described. This analysis enabled the construction of matrices that represent such interactions. the results of which are shown in Table 5.
3.5. Determination of the Unweighted Matrix
The normalization of the influence matrix in the DEMATEL method involves summing the values of the elements of the same group within each column and dividing each individual value by this sum. This procedure yields the unweighted matrix used in the ANP method. allowing a significant reduction in the number of questions posed to experts. Compared to the traditional ANP method. which requires multiple pairwise comparison matrices. this approach simplifies the process. Table 6 shows a fragment of the normalized influence matrix.
The values corresponding to column C2.2 and rows C1.1 to C2.2 were obtained by summing the values in these positions from the influence matrix in Table 7 and dividing each one by the total sum. This approach simplified the calculation compared to the ANP method. which would have required more complex and detailed pairwise comparison evaluations. Table 7 shows the equivalent unweighted supermatrix generated through this procedure.
The influence matrix among groups in DEMATEL is normalized by summing the values of each column in the matrix and dividing each element by this sum. The normalized matrix. derived from Table 4. is presented in Table 5 as the equivalent of the cluster matrix in the ANP method. This approach significantly reduced the number of questions posed to experts. as the ANP model would have required judgments across seven pairwise comparison matrices.
3.6. Determination of the Weighted Matrix
The DEMATEL method normalizes the influence matrix by summing the elements of each column and dividing each entry by its respective column sum. The resulting normalized matrix (Table 5). derived from the initial influence matrix (Table 4). serves as the cluster matrix equivalent in the ANP method. This approach significantly reduces the number of expert judgments required compared to traditional ANP. which would necessitate seven pairwise comparison matrices.
A key property of the weighted matrix is its column stochastic nature. where each column sums to unity. Columns not meeting this requirement were re-normalized to satisfy this condition.
3.7. Calculation of the Limit Matrix
The limit matrix was derived by exponentiating the weighted matrix to progressively higher powers until column convergence occurred. The resulting identical column values ("raw values") represent the relative influence of each network element. Final priorities were determined by normalizing these raw values for criteria and alternatives. Complete matrices and expert E1's priorities are provided in Appendix Table A2.
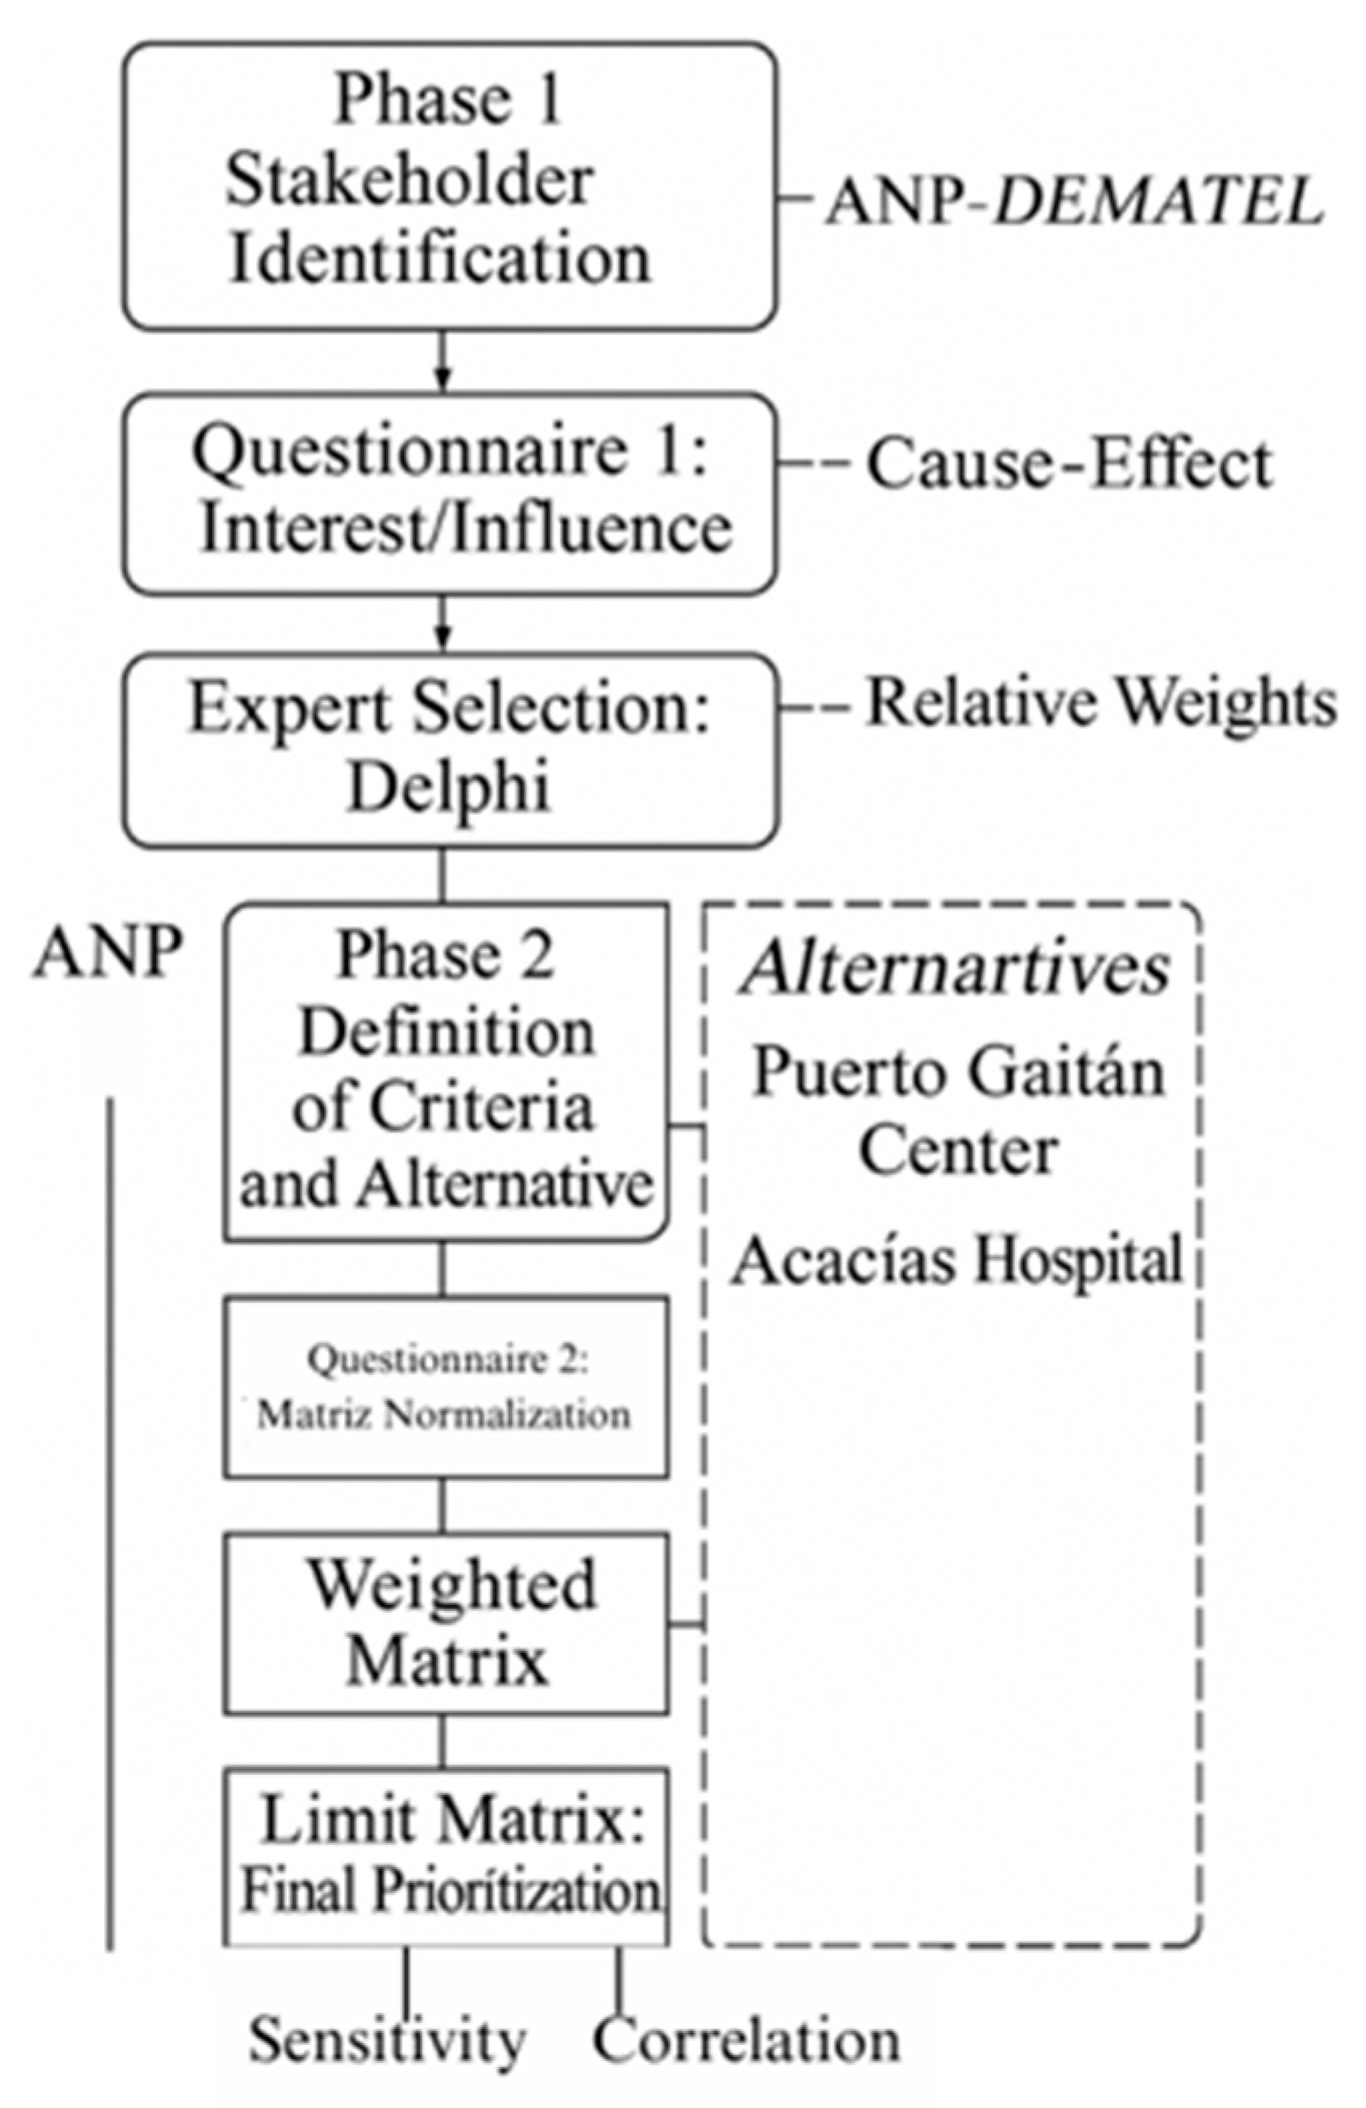
The methodological workflow - encompassing stakeholder identification. criteria definition. and ANP-DEMATEL prioritization - is illustrated in Figure 2: ANP-DEMATEL Influence Network for Health Project Prioritization.
Figure 2.
Network for Health Project Prioritization.
4. Results
The study employed expert-derived influence models comprising relationship matrices and limit matrices to quantify interconnections among network elements and groups. These analytical constructs facilitated the determination of expert-specific priority assignments for system components. Complementing this approach. stakeholders completed Questionnaire 2 to evaluate both criteria importance and alternative prioritization. with analysis performed using SuperDecisions software [27,28]. Priority aggregation was achieved through geometric mean calculation of re-normalized expert judgments. following Forman and Peniwati's (1998) methodological framework for synthesizing group perspectives while accounting for individual judgment variability. The consolidated outcomes present criteria priorities in Table 9 and alternative rankings in Table 10. with percentage values enabling comparative interpretation across all evaluated elements.
The comparative analysis of the consolidated criteria reveals that criterion C.4.1 (8.54%) holds the highest weight. emphasizing the reduction of the proportion of the population with Unmet Basic Needs (UBN). This criterion was prioritized due to its direct impact on improving quality of life. reducing socioeconomic inequalities. and ensuring equitable access to food and nutritional security—particularly for the most vulnerable segments of the population.
Criterion C.6.1 (8.15%). which focuses on expanding hospital capacity for emergencies and disasters. underscores the importance of preparedness in the face of health crises and natural disasters. Its prioritization reflects a broader concern for strengthening the resilience of the public health system and enhancing its responsiveness under adverse conditions.
In parallel. criterion C.9.2 (7.59%) highlights the need for financial sustainability within the health system. It emphasizes the efficient allocation of resources and the promotion of long-term strategic planning to maximize the durability and impact of health interventions.
Criterion C.6.2 (7.55%) addresses the expansion of access to basic and advanced emergency medical transportation services. which is particularly crucial in remote and rural settings where timely care is often limited. Similarly. criterion C.4.2 (7.14%). which targets the reduction of acute malnutrition in children under five. was valued for its direct contribution to improving key child health and nutrition outcomes.
Other important criteria include C.2.2 (7.03%). aimed at reducing oral health problems—a frequently overlooked determinant of general health and a key factor in preventing non-communicable diseases. Criterion C.8.1 (6.96%) promotes equitable access to healthcare services for dispersed rural and Indigenous populations. reaffirming the importance of differential approaches in health policy. Finally. criterion C.3.2 (6.00%) addresses the reduction of domestic violence. Thus highlighting the relevance of mental health and social cohesion within the broader public health agenda.
This prioritization pattern demonstrates that experts placed strong emphasis on criteria related to equity. system sustainability. access to essential services. and emergency preparedness. reflecting a multidimensional understanding of health system strengthening. It integrates technical. social. and territorial considerations to guide decision-making and optimize the overall impact of health investments [29,30].
A panel of 29 health sector experts from Meta department employed the integrated ANP/DEMATEL methodology to evaluate priority health projects. The analysis identified the replacement of Puerto Gaitán's healthcare center (A05) as the highest priority (29.84%). followed by the expansion of Acacías municipal hospital (A04. 20%). Other significant projects included establishing an emergency regulatory center (A03. 17.95%). implementing primary healthcare actions (A02. 16.11%). and strengthening emergency transport services in La Macarena (A01. 16.10%).
This prioritization reflects three critical health system needs: (1) infrastructure modernization in high-demand areas (A05. A04). (2) emergency response capacity building (A03). and (3) rural service accessibility improvement (A02. A01). The ANP-DEMATEL framework effectively captured the complex interdependencies between these projects. revealing how strategic investments in infrastructure (A05. A04) create foundational capacity that supports subsequent emergency system (A03) and rural service (A02. A01) enhancements.
4.1. Correlation and Compatibility Analysis
The analysis of variable rank relationships incorporated both Spearman's and Kendall's correlation methods. with Kendall's Tau-b coefficient emerging as the principal statistical measure due to its established robustness and superior efficacy in small sample analyses. particularly when handling tied observations [31]. For evaluating priority vector consistency within the AHP/ANP analytical framework. the study implemented two validated compatibility metrics: Saaty's S index. calculated through Hadamard product operations [32]. and Garuti's G index. which applies a physical interpretation to vector inner products [33,34]. These methodological choices are comprehensively presented in Table 11. which details: (1) Kendall's Tau-b correlation coefficients with associated significance values across four expert evaluations. and (2) comparative analyses of individual versus collective priority assessments using both S and G compatibility indices. This dual-metric approach facilitates rigorous examination of both ordinal associations and vector alignment within the decision-making architecture.
The compatibility analysis reveals that Expert 1 (E1) demonstrates a high level of alignment with the group consensus. as evidenced by a Kendall’s Tau-b coefficient of 0.8. This strong concordance positions E1 as a key reference for validating collective decisions and guiding strategic dialogue within the expert panel. In contrast. Expert 2 (E2) exhibits a low level of compatibility (Kendall = 0.2). suggesting potential differences in the interpretation of criteria. weighting of priorities. or the adoption of a more specialized evaluative framework. In this case. targeted alignment sessions may be beneficial to harmonize E2’s contributions with the broader consensus and enhance coherence in the group’s decision-making process.
Expert 4 (E4). with a negative Kendall coefficient (−0.2). reflects a marked divergence from the group prioritization. Although this discrepancy may initially appear problematic. it can be an asset if properly channeled through inclusive deliberative mechanisms. Incorporating E4’s unique perspective via structured collaborative workshops may contribute to a more comprehensive understanding of the problem space and promote richer. multidimensional analyses.
The pairwise comparison between E1 and E2 (Kendall = 0.4) indicates low compatibility. likely attributable to differing methodological assumptions or decision-making heuristics. Facilitating direct exchange between these experts may help bridge cognitive gaps and enhance overall group cohesion. Conversely. the moderate compatibility observed between E2 and E4 (Kendall = 0.6) suggests a potential complementarity in their approaches. which could be leveraged to identify shared insights and mediate minor discrepancies in judgment.
The results obtained from the S index (Saaty) and G index (Garuti) further highlight variability in the compatibility of expert priority vectors. These differences may reflect disciplinary diversity or distinct cognitive approaches to the evaluation task. As such. the implementation of consensus-building strategies (such as joint review sessions. clarification of criteria interpretations. and feedback loops) becomes essential for ensuring convergence and methodological integrity.
In summary. enhancing the leadership role of highly compatible experts (e.g., E1). while simultaneously embracing divergent views through structured and participatory processes. will contribute to a more robust and inclusive group decision-making environment. Such an approach not only reinforces methodological rigor but also strengthens collective ownership of the final prioritization outcomes.
5. Discussion
The prioritization analysis identified the replacement of the healthcare center in Puerto Gaitán (A05. 29.84%) as the highest-ranked project due to its strategic role in the hospital accessibility network. These findings underscore infrastructure improvement as a key driver of equity. aligning with approaches in Argentina. where multicriteria evaluation has guided the placement of new healthcare centers in underserved areas [35,36]. In contrast. Cuba and Uruguay prioritize primary healthcare. reflecting their advanced infrastructure and focus on preventive strategies [37,38]. This divergence highlights the need for prioritization frameworks to adapt to local contexts.
Notably. decision-making criteria vary across regions. In Brazil. efficiency and equity dominate healthcare planning. particularly in high-inequality settings. whereas Cuban policymakers prioritize equity over efficiency [39]. Colombia has adopted integrated ANP-DEMATEL methodologies for health sector project prioritization [40]. though such approaches are typically applied at the national level. Our study. however. focuses on the regional level (Meta department). illustrating how planning strategies must adjust to the scale of implementation and decision-making authority.
Financial sustainability emerged as a critical consideration. raising questions about the long-term viability of proposed investments. A key debate centers on whether sustainability should focus solely on resource management or incorporate structural reforms to ensure equitable and efficient resource distribution. Sustainability must be evaluated not only economically but also through social and political lenses. necessitating broader discussions on healthcare equity and the state’s role in service provision.
The ANP-DEMATEL framework provided a robust structure for modeling complex interdependencies among criteria and alternatives [41]. Grounded in participatory process theory. these tools integrate diverse perspectives. fostering inclusive decision-making. However. their implementation faces challenges. including the need for decision-maker training and reliance on high-quality data. To maximize utility. technical analyses should be paired with participatory processes that enhance decision legitimacy [42].
Our findings correlate with the Situational Health Analysis (ASIS) of Meta. where prioritized projects (e.g.. A05 and A04) address critical infrastructure gaps. Projects A02 and A01 target geographic dispersion and access barriers in rural and Indigenous communities. reinforcing the need for context-specific strategies to reduce health inequities [43].
This study contributes to administrative discourse by integrating advanced analytical methodologies with participatory approaches. improving both resource allocation efficiency and decision legitimacy. The results offer actionable insights for Meta’s policymakers. emphasizing the prioritization of interventions that enhance infrastructure and accessibility. Future research should explore additional criteria. such as financial sustainability and implementation capacity. which were not explicitly examined here. Longitudinal studies assessing the impact of prioritized projects on health indicators are also recommended. Policymakers should adopt collaborative. adaptive strategies to align decisions with evolving health system dynamics [44,45].
6. Conclusions
This research employed a Multicriteria Decision-Making (MCDM) approach—integrating ANP and DEMATEL—to prioritize health projects in Meta. The replacement of Puerto Gaitán’s healthcare center (A05) was ranked highest. followed by the expansion of Acacías’ municipal hospital (A04) and the creation of an emergency regulation center. Correlation analysis revealed a strong link between hospital expansion and reduced unmet basic needs. highlighting the interplay between social determinants and healthcare infrastructure. The high consistency in expert rankings underscores the robustness of the ANP-DEMATEL model.
Sensitivity analysis confirmed the stability of results under a 10% variation in weight assignments. reinforcing the methodology’s reliability for public health planning. From a policy standpoint. integrated resource allocation—prioritizing accessibility and equity—is essential. Stakeholder inclusion enhances transparency. though a key limitation was the limited availability of some experts. We recommend replicating this approach in other Colombian regions to assess broader applicability. Further methodological refinements could combine MCDM with cost-benefit analysis and predictive modeling for healthcare infrastructure planning.
Author Contributions
(CRediT taxonomy): Astrid León-Camargo: Conceptualization, Methodology, Software, Validation, Formal Analysis, Investigation, Resources, Data Curation, Writing—Original Draft, Visualization, Project Administration, Funding Acquisition. Seydyss Garay-Rodríguez: Conceptualization, Validation, Writing—Review & Editing, Supervision, Funding Acquisition.
Data Availability:
The data supporting this study are available from the corresponding author upon reasonable request.
Conflicts of Interest
The authors declare no conflicts of interest.
Originality:
The manuscript has not been published previously and is not under consideration by any other journal. All authors have approved the final version and consent to its submission.
Ethical Compliance:
This non-interventional study adhered to the ethical principles of the Declaration of Helsinki (1975, revised in 2013). As no personal or clinical data were collected, formal ethical review was waived. However, informed consent was obtained, and principles of voluntariness, anonymity, and confidentiality were strictly followed.
Abbreviations
The following abbreviations are used in this manuscript:
| ANP | Analytic Network Process |
| DEMATEL | Decision-Making Trial and Evaluation Laboratory |
| PHC | Primary Health Care (Atención Primaria en Salud) |
| AHP | Analytic Hierarchy Process |
| UBN | Unmet Basic Needs (Necesidades Básicas Insatisfechas) |
| MCDM | Multicriteria Decision-Making |
| ASIS | Situational Health Analysis (Análisis de Situación de Salud) |
| NCDs | Non-Communicable Diseases |
Appendix

Table A1.
DEMATEL Influence Matrix Among Network Elements.
| C.1 | C.2 | C.3 | C.4 | C.5 | C.6 | C.7 | C.8 | C.9 | ALTERNATIVES | ||||||||||||||||
|---|---|---|---|---|---|---|---|---|---|---|---|---|---|---|---|---|---|---|---|---|---|---|---|---|---|
| C.1.1 | C.1.2 | C.2.1 | C.2.2 | C.3.1 | C.3.2 | C.4.1 | C.4.2 | C.5.1 | C.5.2 | C.6.1 | C.6.2 | C.7.1 | C.7.2 | C.8.1 | C.8.2 | C.9.1 | C.9.2 | A01 | A02 | A03 | A04 | A05 | |||
| C.1 | C.1.1 | 0 | 5 | 0 | 3 | 0 | 0 | 5 | 5 | 0 | 0 | 5 | 3 | 0 | 5 | 1 | 1 | 2 | 2 | 0 | 1 | 2 | 3 | 3 | |
| C.1.2 | 5 | 0 | 0 | 3 | 0 | 0 | 0 | 5 | 0 | 0 | 5 | 3 | 0 | 5 | 1 | 1 | 2 | 2 | 0 | 1 | 2 | 3 | 3 | ||
| C.2 | C.2.1 | 0 | 0 | 0 | 2 | 0 | 0 | 4 | 1 | 0 | 1 | 2 | 2 | 1 | 1 | 1 | 1 | 3 | 4 | 5 | 5 | 3 | 3 | 3 | |
| C.2.2 | 5 | 5 | 1 | 0 | 0 | 0 | 2 | 2 | 0 | 0 | 3 | 2 | 1 | 1 | 1 | 1 | 3 | 4 | 5 | 5 | 3 | 3 | 3 | ||
| C.3 | C.3.1 | 0 | 0 | 0 | 0 | 0 | 5 | 5 | 1 | 3 | 4 | 2 | 3 | 1 | 1 | 1 | 1 | 4 | 4 | 5 | 5 | 3 | 3 | 3 | |
| C.3.2 | 0 | 0 | 0 | 0 | 5 | 0 | 5 | 4 | 3 | 4 | 2 | 3 | 1 | 1 | 1 | 1 | 3 | 3 | 3 | 3 | 2 | 2 | 2 | ||
| C.4 | C.4.1 | 5 | 5 | 5 | 5 | 5 | 5 | 0 | 5 | 2 | 3 | 2 | 2 | 5 | 5 | 4 | 2 | 4 | 3 | 4 | 4 | 3 | 3 | 3 | |
| C.4.2 | 5 | 5 | 1 | 1 | 1 | 1 | 5 | 0 | 0 | 0 | 3 | 2 | 2 | 5 | 4 | 3 | 2 | 4 | 3 | 3 | 3 | 3 | 3 | ||
| C.5 | C.5.1 | 0 | 0 | 2 | 2 | 5 | 5 | 5 | 1 | 0 | 0 | 0 | 0 | 0 | 1 | 1 | 1 | 0 | 2 | 3 | 3 | 3 | 3 | 3 | |
| C.5.2 | 0 | 0 | 2 | 2 | 0 | 0 | 0 | 1 | 0 | 0 | 0 | 0 | 0 | 1 | 1 | 1 | 0 | 1 | 3 | 3 | 3 | 3 | 3 | ||
| C.6 | C.6.1 | 2 | 3 | 1 | 1 | 1 | 1 | 1 | 1 | 1 | 1 | 0 | 4 | 1 | 1 | 2 | 1 | 2 | 0 | 4 | 4 | 4 | 4 | 4 | |
| C.6.2 | 1 | 0 | 1 | 1 | 1 | 1 | 1 | 1 | 1 | 1 | 0 | 0 | 1 | 1 | 2 | 1 | 1 | 3 | 3 | 5 | 3 | 3 | 3 | ||
| C.7 | C.7.1 | 0 | 0 | 0 | 0 | 0 | 0 | 3 | 1 | 1 | 1 | 3 | 1 | 0 | 2 | 1 | 1 | 1 | 2 | 2 | 0 | 3 | 3 | 3 | |
| C.7.2 | 0 | 0 | 0 | 0 | 0 | 0 | 3 | 1 | 1 | 1 | 3 | 1 | 0 | 0 | 1 | 1 | 2 | 1 | 2 | 3 | 3 | 3 | 3 | ||
| C.8 | C.8.1 | 1 | 1 | 2 | 2 | 2 | 2 | 3 | 2 | 1 | 1 | 1 | 1 | 1 | 3 | 0 | 5 | 2 | 1 | 2 | 3 | 4 | 4 | 4 | |
| C.8.2 | 1 | 1 | 2 | 2 | 2 | 2 | 3 | 2 | 1 | 1 | 1 | 1 | 1 | 1 | 5 | 0 | 1 | 1 | 2 | 5 | 4 | 4 | 4 | ||
| C.9 | C.9.1 | 1 | 1 | 4 | 4 | 4 | 5 | 4 | 4 | 4 | 3 | 2 | 4 | 4 | 2 | 2 | 2 | 0 | 3 | 5 | 5 | 5 | 5 | 5 | |
| C.9.2 | 2 | 2 | 5 | 5 | 5 | 4 | 5 | 5 | 3 | 3 | 3 | 3 | 4 | 4 | 2 | 2 | 1 | 0 | 5 | 5 | 5 | 5 | 5 | ||
| ALTERNATIVES | A01 | 0 | 0 | 0 | 0 | 2 | 2 | 3 | 0 | 1 | 0 | 5 | 5 | 0 | 0 | 0 | 0 | 1 | 1 | 0 | 1 | 1 | 2 | 2 | |
| A02 | 2 | 2 | 3 | 3 | 3 | 3 | 3 | 3 | 3 | 3 | 3 | 3 | 3 | 3 | 5 | 5 | 2 | 2 | 3 | 0 | 3 | 3 | 3 | ||
| A03 | 2 | 2 | 4 | 4 | 3 | 3 | 5 | 4 | 2 | 2 | 5 | 4 | 4 | 4 | 1 | 1 | 4 | 4 | 4 | 4 | 0 | 4 | 3 | ||
| A04 | 2 | 2 | 4 | 4 | 4 | 4 | 4 | 4 | 3 | 3 | 5 | 5 | 4 | 4 | 2 | 2 | 4 | 4 | 4 | 4 | 3 | 0 | 1 | ||
| A05 | 2 | 2 | 4 | 4 | 4 | 4 | 4 | 4 | 3 | 3 | 5 | 5 | 4 | 4 | 2 | 2 | 3 | 2 | 3 | 1 | 2 | 5 | 0 | ||
Table A2.
Limit Matrix.
| C.1 | C.2 | C.3 | C.4 | C.5 | C.6 | C.7 | C.8 | C.9 | ALTERNATIVES | |||||||||||||||
|---|---|---|---|---|---|---|---|---|---|---|---|---|---|---|---|---|---|---|---|---|---|---|---|---|
| C.1.1 | C.1.2 | C.2.1 | C.2.2 | C.3.1 | C.3.2 | C.4.1 | C.4.2 | C.5.1 | C.5.2 | C.6.1 | C.6.2 | C.7.1 | C.7.2 | C.8.1 | C.8.2 | C.9.1 | C.9.2 | A01 | A02 | A03 | A04 | A05 | ||
| C.1 | C.1.1 | 0.0483 | 0.0483 | 0.0483 | 0.0483 | 0.0483 | 0.0483 | 0.0483 | 0.0483 | 0.0483 | 0.0483 | 0.0483 | 0.0483 | 0.0483 | 0.0483 | 0.0483 | 0.0483 | 0.0483 | 0.0483 | 0.0483 | 0.0483 | 0.0483 | 0.0483 | 0.0483 |
| C.1.2 | 0.0304 | 0.0304 | 0.0304 | 0.0304 | 0.0304 | 0.0304 | 0.0304 | 0.0304 | 0.0304 | 0.0304 | 0.0304 | 0.0304 | 0.0304 | 0.0304 | 0.0304 | 0.0304 | 0.0304 | 0.0304 | 0.0304 | 0.0304 | 0.0304 | 0.0304 | 0.0304 | |
| C.2 | C.2.1 | 0.0485 | 0.0485 | 0.0485 | 0.0485 | 0.0485 | 0.0485 | 0.0485 | 0.0485 | 0.0485 | 0.0485 | 0.0485 | 0.0485 | 0.0485 | 0.0485 | 0.0485 | 0.0485 | 0.0485 | 0.0485 | 0.0485 | 0.0485 | 0.0485 | 0.0485 | 0.0485 |
| C.2.2 | 0.0586 | 0.0586 | 0.0586 | 0.0586 | 0.0586 | 0.0586 | 0.0586 | 0.0586 | 0.0586 | 0.0586 | 0.0586 | 0.0586 | 0.0586 | 0.0586 | 0.0586 | 0.0586 | 0.0586 | 0.0586 | 0.0586 | 0.0586 | 0.0586 | 0.0586 | 0.0586 | |
| C.3 | C.3.1 | 0.0416 | 0.0416 | 0.0416 | 0.0416 | 0.0416 | 0.0416 | 0.0416 | 0.0416 | 0.0416 | 0.0416 | 0.0416 | 0.0416 | 0.0416 | 0.0416 | 0.0416 | 0.0416 | 0.0416 | 0.0416 | 0.0416 | 0.0416 | 0.0416 | 0.0416 | 0.0416 |
| C.3.2 | 0.0428 | 0.0428 | 0.0428 | 0.0428 | 0.0428 | 0.0428 | 0.0428 | 0.0428 | 0.0428 | 0.0428 | 0.0428 | 0.0428 | 0.0428 | 0.0428 | 0.0428 | 0.0428 | 0.0428 | 0.0428 | 0.0428 | 0.0428 | 0.0428 | 0.0428 | 0.0428 | |
| C.4 | C.4.1 | 0.1004 | 0.1004 | 0.1004 | 0.1004 | 0.1004 | 0.1004 | 0.1004 | 0.1004 | 0.1004 | 0.1004 | 0.1004 | 0.1004 | 0.1004 | 0.1004 | 0.1004 | 0.1004 | 0.1004 | 0.1004 | 0.1004 | 0.1004 | 0.1004 | 0.1004 | 0.1004 |
| C.4.2 | 0.0600 | 0.0600 | 0.0600 | 0.0600 | 0.0600 | 0.0600 | 0.0600 | 0.0600 | 0.0600 | 0.0600 | 0.0600 | 0.0600 | 0.0600 | 0.0600 | 0.0600 | 0.0600 | 0.0600 | 0.0600 | 0.0600 | 0.0600 | 0.0600 | 0.0600 | 0.0600 | |
| C.5 | C.5.1 | 0.0510 | 0.0510 | 0.0510 | 0.0510 | 0.0510 | 0.0510 | 0.0510 | 0.0510 | 0.0510 | 0.0510 | 0.0510 | 0.0510 | 0.0510 | 0.0510 | 0.0510 | 0.0510 | 0.0510 | 0.0510 | 0.0510 | 0.0510 | 0.0510 | 0.0510 | 0.0510 |
| C.5.2 | 0.0274 | 0.0274 | 0.0274 | 0.0274 | 0.0274 | 0.0274 | 0.0274 | 0.0274 | 0.0274 | 0.0274 | 0.0274 | 0.0274 | 0.0274 | 0.0274 | 0.0274 | 0.0274 | 0.0274 | 0.0274 | 0.0274 | 0.0274 | 0.0274 | 0.0274 | 0.0274 | |
| C.6 | C.6.1 | 0.0602 | 0.0602 | 0.0602 | 0.0602 | 0.0602 | 0.0602 | 0.0602 | 0.0602 | 0.0602 | 0.0602 | 0.0602 | 0.0602 | 0.0602 | 0.0602 | 0.0602 | 0.0602 | 0.0602 | 0.0602 | 0.0602 | 0.0602 | 0.0602 | 0.0602 | 0.0602 |
| C.6.2 | 0.0571 | 0.0571 | 0.0571 | 0.0571 | 0.0571 | 0.0571 | 0.0571 | 0.0571 | 0.0571 | 0.0571 | 0.0571 | 0.0571 | 0.0571 | 0.0571 | 0.0571 | 0.0571 | 0.0571 | 0.0571 | 0.0571 | 0.0571 | 0.0571 | 0.0571 | 0.0571 | |
| C.7 | C.7.1 | 0.0304 | 0.0304 | 0.0304 | 0.0304 | 0.0304 | 0.0304 | 0.0304 | 0.0304 | 0.0304 | 0.0304 | 0.0304 | 0.0304 | 0.0304 | 0.0304 | 0.0304 | 0.0304 | 0.0304 | 0.0304 | 0.0304 | 0.0304 | 0.0304 | 0.0304 | 0.0304 |
| C.7.2 | 0.0333 | 0.0333 | 0.0333 | 0.0333 | 0.0333 | 0.0333 | 0.0333 | 0.0333 | 0.0333 | 0.0333 | 0.0333 | 0.0333 | 0.0333 | 0.0333 | 0.0333 | 0.0333 | 0.0333 | 0.0333 | 0.0333 | 0.0333 | 0.0333 | 0.0333 | 0.0333 | |
| C.8 | C.8.1 | 0.0395 | 0.0395 | 0.0395 | 0.0395 | 0.0395 | 0.0395 | 0.0395 | 0.0395 | 0.0395 | 0.0395 | 0.0395 | 0.0395 | 0.0395 | 0.0395 | 0.0395 | 0.0395 | 0.0395 | 0.0395 | 0.0395 | 0.0395 | 0.0395 | 0.0395 | 0.0395 |
| C.8.2 | 0.0381 | 0.0381 | 0.0381 | 0.0381 | 0.0381 | 0.0381 | 0.0381 | 0.0381 | 0.0381 | 0.0381 | 0.0381 | 0.0381 | 0.0381 | 0.0381 | 0.0381 | 0.0381 | 0.0381 | 0.0381 | 0.0381 | 0.0381 | 0.0381 | 0.0381 | 0.0381 | |
| C.9 | C.9.1 | 0.0438 | 0.0438 | 0.0438 | 0.0438 | 0.0438 | 0.0438 | 0.0438 | 0.0438 | 0.0438 | 0.0438 | 0.0438 | 0.0438 | 0.0438 | 0.0438 | 0.0438 | 0.0438 | 0.0438 | 0.0438 | 0.0438 | 0.0438 | 0.0438 | 0.0438 | 0.0438 |
| C.9.2 | 0.0526 | 0.0526 | 0.0526 | 0.0526 | 0.0526 | 0.0526 | 0.0526 | 0.0526 | 0.0526 | 0.0526 | 0.0526 | 0.0526 | 0.0526 | 0.0526 | 0.0526 | 0.0526 | 0.0526 | 0.0526 | 0.0526 | 0.0526 | 0.0526 | 0.0526 | 0.0526 | |
| ALTERNATIVES | A01 | 0.0111 | 0.0111 | 0.0111 | 0.0111 | 0.0111 | 0.0111 | 0.0111 | 0.0111 | 0.0111 | 0.0111 | 0.0111 | 0.0111 | 0.0111 | 0.0111 | 0.0111 | 0.0111 | 0.0111 | 0.0111 | 0.0111 | 0.0111 | 0.0111 | 0.0111 | 0.0111 |
| A02 | 0.0285 | 0.0285 | 0.0285 | 0.0285 | 0.0285 | 0.0285 | 0.0285 | 0.0285 | 0.0285 | 0.0285 | 0.0285 | 0.0285 | 0.0285 | 0.0285 | 0.0285 | 0.0285 | 0.0285 | 0.0285 | 0.0285 | 0.0285 | 0.0285 | 0.0285 | 0.0285 | |
| A03 | 0.0311 | 0.0311 | 0.0311 | 0.0311 | 0.0311 | 0.0311 | 0.0311 | 0.0311 | 0.0311 | 0.0311 | 0.0311 | 0.0311 | 0.0311 | 0.0311 | 0.0311 | 0.0311 | 0.0311 | 0.0311 | 0.0311 | 0.0311 | 0.0311 | 0.0311 | 0.0311 | |
| A04 | 0.0340 | 0.0340 | 0.0340 | 0.0340 | 0.0340 | 0.0340 | 0.0340 | 0.0340 | 0.0340 | 0.0340 | 0.0340 | 0.0340 | 0.0340 | 0.0340 | 0.0340 | 0.0340 | 0.0340 | 0.0340 | 0.0340 | 0.0340 | 0.0340 | 0.0340 | 0.0340 | |
| A05 | 0.0315 | 0.0315 | 0.0315 | 0.0315 | 0.0315 | 0.0315 | 0.0315 | 0.0315 | 0.0315 | 0.0315 | 0.0315 | 0.0315 | 0.0315 | 0.0315 | 0.0315 | 0.0315 | 0.0315 | 0.0315 | 0.0315 | 0.0315 | 0.0315 | 0.0315 | 0.0315 | |
References
- Amaya. J.L.; Ruiz. F.; Trujillo. A.J.; Buttorff. C. Identifying Barriers to Move to Better Health Coverage: Preferences for Health Insurance Benefits among the Rural Poor Population in La Guajira. Colombia. International Journal of Health Planning and Management 2016. 31, 126–138. [CrossRef]
- Consejo privado de competitividad Informe nacional de competitividad 2023-2024; Bogotá. 2025.
- León- Camargo. A. Choques Transitorios y de Largo Plazo En El Producto Interno Bruto y Precios En El Departamento Del Meta. Económicas CUC 2018. 39.
- Zuluaga. J.G. Ejercicio de Participación Ciudadana Para La Construcción Del Capítulo Independiente “Inversiones Con Cargo al SGR”; Villavicencio. 2021.
- Eroğlu. E.; Aydemir-Dev. M.; Tunç. G.; Gerçek. A. An Analysis of the Relationship between Municipalities and NGOs in Terms of Active Participation in Local Budgeting in Türkiye. Sosyoekonomi 2023. 31, 17–190. [CrossRef]
- Secretaría de Salud del departamento del Meta Análisis de situación de salud participativo. Departamento del Meta, 2023. 1–250.
- Secretaría de salud del departamento del Meta Indicadores de Salud Del Departamento Del Meta; Villavicencio. 2023.
- Eriş. M.B.; Sezer. E.D.G.; Ocak. Z. Prioritization of the Factors Affecting the Performance of Clinical Laboratories Using the AHP and ANP Techniques. Network Modeling Analysis in Health Informatics and Bioinformatics 2023. 12. [CrossRef]
- Dracea. R.M.; Pirtea. M.G.; Cristea. M.; Noja. G.G.; Ciobanu. L. Budget Transparency and Good Governance for Human Development and Citizens’ Well-Being. New Empirical Evidence from the European Union. Engineering Economics 2024. 35. [CrossRef]
- Butcher. H.K. Community-Based Participatory Research Guided by Critical Caring Theory. Nurs Sci Q 2022. 35. [CrossRef]
- He. A.J.; Ma. L. Citizen Participation. Perceived Public Service Performance. and Trust in Government: Evidence from Health Policy Reforms in Hong Kong. Public Performance and Management Review 2021. 44. [CrossRef]
- Bühler. N.; Frahsa. A.; Morand Bourqui. R.; Von Götz. N.; Bochud. M.; Panese. F. Between Data Providers and Concerned Citizens: Exploring Participation in Precision Public Health in Switzerland. Public Understanding of Science 2024. 33, 105–120. [CrossRef]
- Gu. J.; Shi. X.; Wang. J.; Xu. X. Examining the Impact of Market Power Discrepancy between Supply Chain Partners on Firm Financial Performance. Int J Prod Econ 2024. 268. [CrossRef]
- De Weger. E.; Drewes. H.W.; Van Vooren. N.J.E.; Luijkx. K.G.; Baan. C.A. Engaging Citizens in Local Health Policymaking. A Realist Explorative Case-Study. PLoS One 2022. 17. [CrossRef]
- Romero. J.I.S.; Arenas. R.L.S.; Pérez. V.Z.; Ocampo-López. C.; Giraldo. D.P. Mapping of the Interests and Influences Perceived in the Actors That Make Up the National System of Innovation in Rehabilitation in Colombia. Sustainability (Switzerland) 2022. 14. [CrossRef]
- Saleem. J.; Ahmad. S.S.; Butt. A. Hazard Risk Assessment of Landslide-Prone Sub-Himalayan Region by Employing Geospatial Modeling Approach. Natural Hazards 2020. 102, 1497–1514. [CrossRef]
- Tayeri. S.; Jafari. M.; Mohammadzadeh. K.A.; Hosseini. S.M.; Shahanaghi. K. Prioritization of the Criteria Affecting the Health of Elderly Women in Iran by Analytical Hierarchy Process (AHP). Iranian Journal of Ageing 2022. 17, 76–95. [CrossRef]
- Pang. F.; Miao. G.; Li. Y.; Shi. Y. Key Factors Influencing Sustainable Population Growth: A DEMATEL-ANP Combined Approach. Heliyon 2024. 10. [CrossRef]
- Crowe. S.; Cresswell. K.; Robertson. A.; Huby. G.; Avery. A.; Sheikh. A. The Case Study Approach. BMC Med Res Methodol 2011. 11. [CrossRef]
- Khan. I.; Pintelon. L.; Martin. H. The Application of Multicriteria Decision Analysis Methods in Health Care: A Literature Review. Medical Decision Making 2022. 42, 262–274.
- Freeman. R.E.; Dmytriyev. S.D.; Phillips. R.A. Stakeholder Theory and the Resource-Based View of the Firm. J Manage 2021. 47, 1757–1770. [CrossRef]
- Orozco-Núñez. E.; Ojeda-Arroyo. E.; Cerecer-Ortiz. N.; Guerrero-López. C.M.; Ramírez-Pérez. B.M.; Heredia-Pi. I.; Allen-Leigh. B.; Feeny. E.; Serván-Mori. E. Gender and Non-Communicable Diseases in Mexico: A Political Mapping and Stakeholder Analysis. Health Res Policy Syst 2024. 22. [CrossRef]
- Moloi. H.; Tulloch. N.L.; Watkins. D.; Perkins. S.; Engel. M.; Abdullahi. L.; Daniels. K.; Zühlke. L. Understanding the Local and International Stakeholders in Rheumatic Heart Disease Field in Tanzania and Uganda: A Systematic Stakeholder Mapping. Int J Cardiol 2022. 353, 119–126. [CrossRef]
- Zhu. Q.; Xi. J.; Hu. X.; Chong. H.-Y.; Zhou. Y.; Lyu. S. Stakeholder Mapping and Analysis of Off-Site Construction Projects: Utilizing a Power–Interest Matrix and the Fuzzy Logic Theory. Buildings 2024. 14, 2865. [CrossRef]
- Ligardo-Herrera. I.; Gómez-Navarro. T.; Gonzalez-Urango. H. Application of the ANP to the Prioritization of Project Stakeholders in the Context of Responsible Research and Innovation. Cent Eur J Oper Res 2019. 27, 679–701. [CrossRef]
- Secretaría de Salud del Meta Análisis de Situación de Salud Con El Modelo de Los Determinantes Sociales de Salud; Villavicencio. 2022.
- Ščurková. D.; Marčanová. M. Adapting Agriculture: Policy Implications of the Rise of Resistant Seeds in Farmers’ Climate Change Strategy. Agris On-line Papers in Economics and Informatics 2023. 15, 109–125. [CrossRef]
- Patil. N.; Reddy. V.P.; Patangray. A.; Singh. S.K. Mapping Groundwater Recharge Potential Using GIS Approach in Darwha Block. Arabian Journal of Geosciences 2018. 11. [CrossRef]
- da Silva. M.C.B.; Lellis Moreira. M.Â.; Fávero. L.P.; dos Santos. M. Health Indicators Prioritization in the State of Brazil Through the Gaussian AHP Method. In Proceedings of the Procedia Computer Science; Elsevier B.V.. 2024; Vol. 242. pp. 867–873.
- Yetim. B.; Sönmez. S.; Konca. M.; İlgün. G. Prioritization of the Policies and Practices Applied in Turkey to Fight against Covid-19 through Ahp Technique. Saude e Sociedade 2021. 30. [CrossRef]
- Kursa. M.B. Kendall Transformation Brings a Robust Categorical Representation of Ordinal Data. Sci Rep 2022. 12. [CrossRef]
- Saaty. T.L.; Peniwati. K. Group Decision Making:Drawing out and Reconciling Differences, ebook.; RWS Publications: Pittsburgh. 2013; ISBN 97818886032204.
- Garuti. C.; Salomon. V.A.P. COMPATIBILITY INDICES BETWEEN PRIORITY VECTORS. International Journal of the Analytic Hierarchy Process 2012. 4. [CrossRef]
- Garuti. C.E. NEW ADVANCES OF THE COMPATIBILITY INDEX “G” IN WEIGHTED ENVIRONMENTS. International Journal of the Analytic Hierarchy Process 2016. 8. [CrossRef]
- Cardoso. M.M.; Carñel. G.E. Planificación Urbana: Evaluación Multicriterio Para Nuevas Localizaciones de Centros de Salud En Santa Fe. Cuadernos de Vivienda y Urbanismo 2022. 15, 37. [CrossRef]
- Manzo. L.K.C.; Grove. H. Inadequate Social Housing and Health: The Case of Oliver Bond House in Inner-City Dublin. Open Research Europe 2023. 3, 211. [CrossRef]
- Ojeda. R.M.; Bermejo. P.M.; Serrate. P.C.F.; Mariño. C.A.; Valdivia Onega. N.C.; Castillo. D.D.; Menéndez Bravo. J.A. Transformations in the Health System in Cuba and Current Strategies for Its Consolidation and Sustainability. Revista Panamericana de Salud Publica/Pan American Journal of Public Health 2018. 42. [CrossRef]
- Robbiati. C.; Milano. A.; Declich. S.; Dente. M.G. One Health Prevention and Preparedness to Vector-Borne Diseases: How Should We Deal with a Multisectoral. Multilevel and Multigroup Governance? One Health Outlook 2024. 6, 21. [CrossRef]
- Mirelman. A.; Mentzakis. E.; Kinter. E.; Paolucci. F.; Fordham. R.; Ozawa. S.; Ferraz. M.; Baltussen. R.; Niessen. L.W. Decision-Making Criteria among National Policymakers in Five Countries: A Discrete Choice Experiment Eliciting Relative Preferences for Equity and Efficiency. Value in Health 2012. 15. [CrossRef]
- Ortiz Barrios. M.; Felizzola Jiménez. H.; Nieto Isaza. S. LNCS 8868 - Comparative Analysis between ANP and ANP- DEMATEL for Six Sigma Project Selection Process in a Healthcare Provider; 2014; Vol. 8868;
- Shi. Y.; Yu. S.; Mei. J. Strategic Decision-Making Enhancement through Graph-Optimized DEMATEL-AHP with Pruning. Group Decis Negot, 2024. [CrossRef]
- Huang. H.; Heuninckx. S.; Macharis. C. 20 Years Review of the Multi Actor Multi Criteria Analysis (MAMCA) Framework: A Proposition of a Systematic Guideline. Ann Oper Res, 2024. [CrossRef]
- Ravelo Mireles. R.; Martín-Pérez Rodríguez. A.; Andrés Prado. M.J.; Campos Esteban. P.; Azpeitia Serón. M.E.; Villarino Calvo. R. Implementación Local de La Estrategia de Promoción de La Salud y Prevención en el Sistema Nacional de Salud. Informe SESPAS 2018. Gac Sanit 2018. 32, 52–58. [CrossRef]
- Nguyen. Q.L.H.T.T.; Nguyen. P.T.; Huynh. V.D.B.; Nguyen. L.T. Application Chang’s Extent Analysis Method for Ranking Barriers in the e-Learning Model Based on Multi-Stakeholder Decision Making. Universal Journal of Educational Research 2020. 8, 1759–1766. [CrossRef]
- Wang. A.W.T.; Kim. Y.; Ting. A.; Lam. W.W.T.; Lambert. S.D. Healthcare Professionals’ Perspectives on the Unmet Needs of Cancer Patients and Family Caregivers: Global Psycho-Oncology Investigation. Supportive Care in Cancer 2023. 31. [CrossRef]
Figure 1.
Research Method.
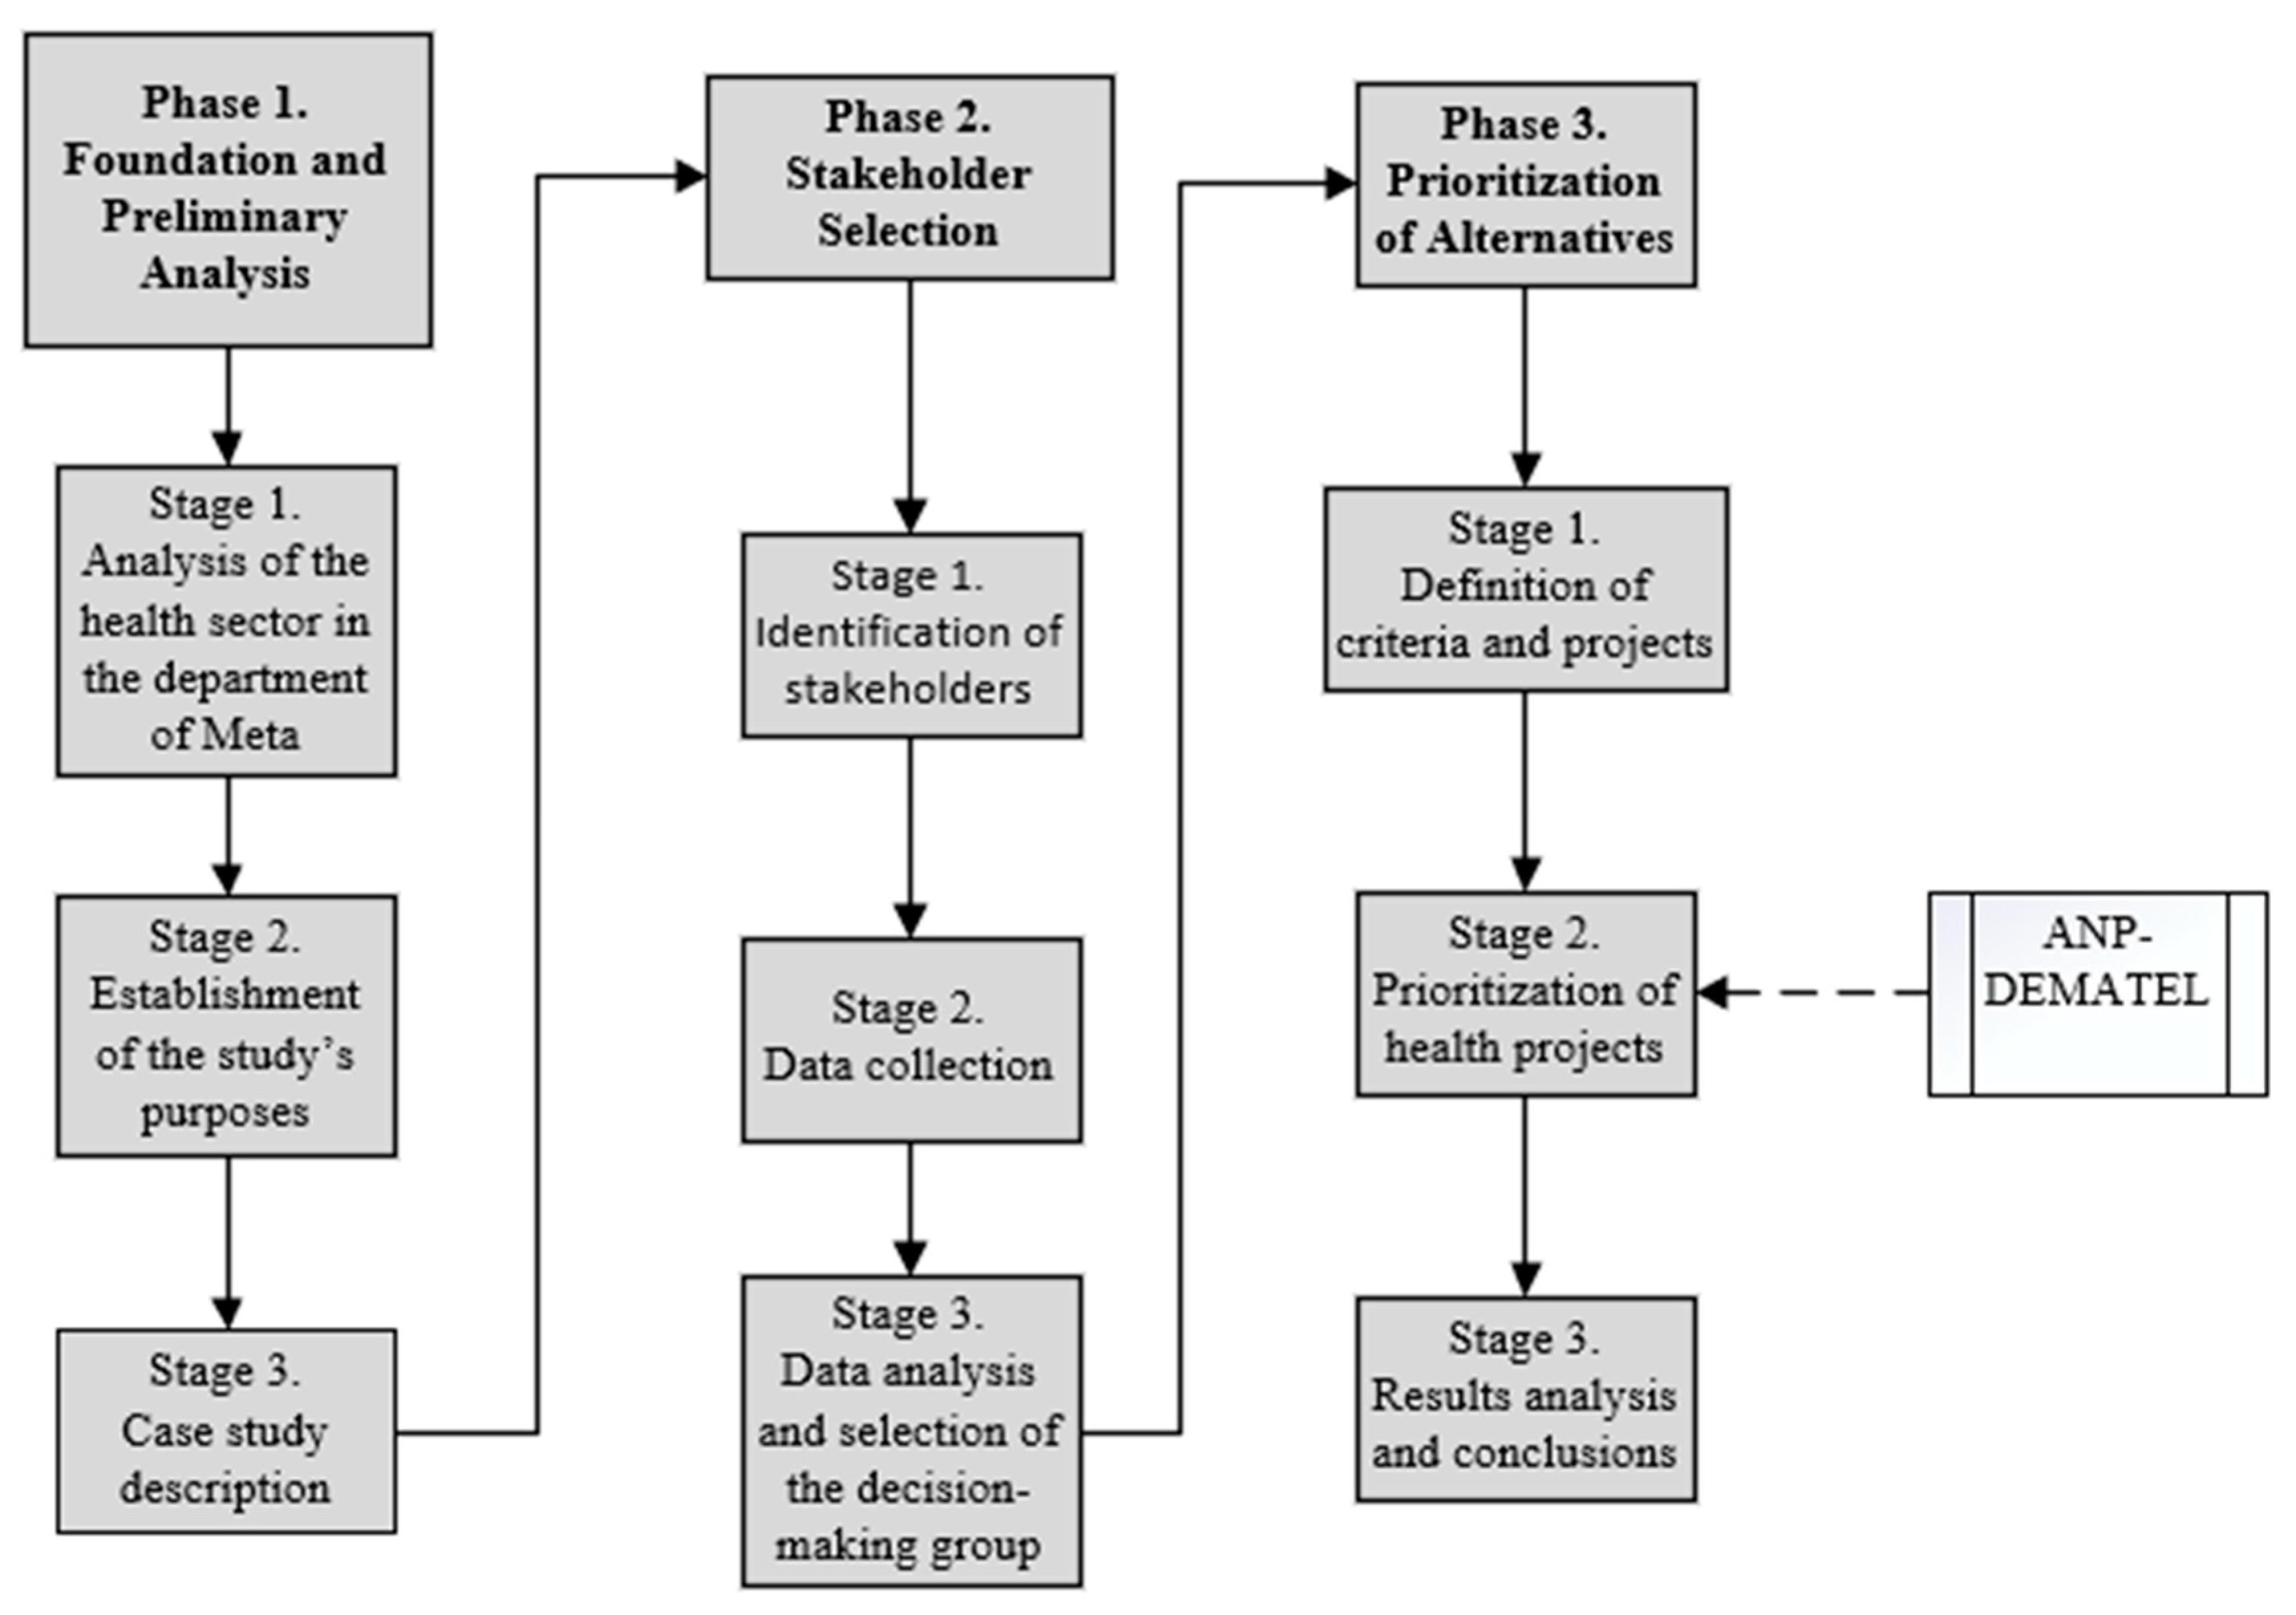
Figure 2.
Stakeholder Mapping for Participant Selection. (a) Stakeholder Power/Interest Grid (b) Stakeholder Mapping Method – “Manage Closely” Quadrant.
Figure 2.
Stakeholder Mapping for Participant Selection. (a) Stakeholder Power/Interest Grid (b) Stakeholder Mapping Method – “Manage Closely” Quadrant.
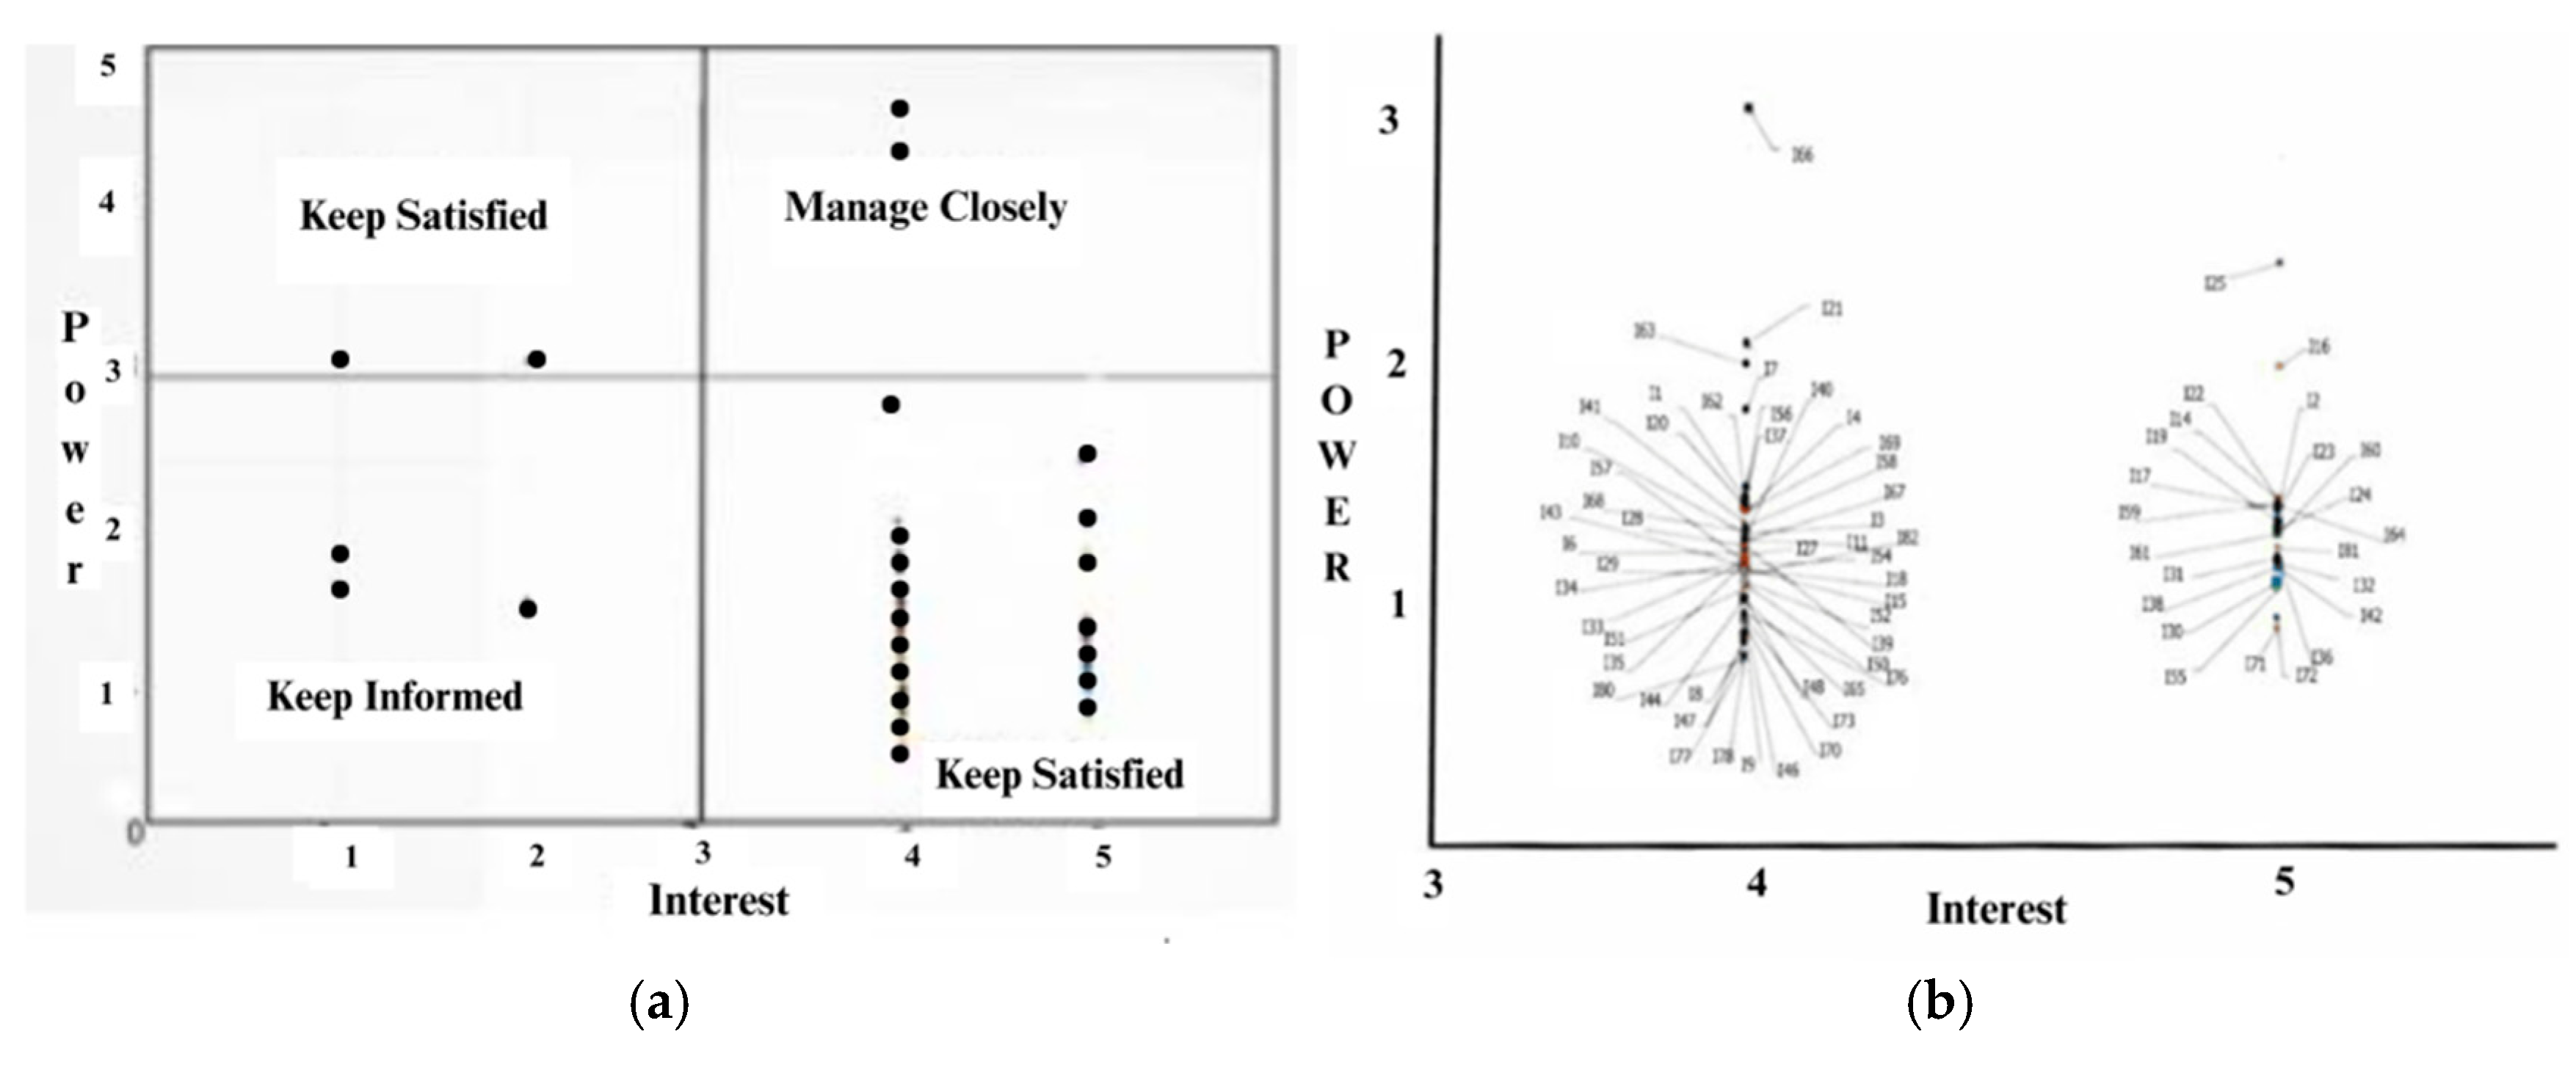
Table 1.
Definition of Criteria.
| Objective | First-level Criterion | Second-level Criterion |
|---|---|---|
| Establish a priority among health projects | C.1 Environmental Health | C.1.1 Increase access to safe drinking water |
| C.1.2 Expand coverage of water supply and sewerage systems | ||
| C.2 Healthy Living and Non-Communicable Conditions | C.2.1 Reduce diseases of the circulatory system (ischemic heart disease). cerebrovascular disease. and hypertension | |
| C.2.2 Decrease oral conditions (oral varices. fissured tongue. cold sores. periodontitis. cavities. oral infections. etc.) | ||
| C.3 Social Cohesion and Mental Health | C.3.1 Reduce the mortality rate due to intentional self-inflicted injuries (suicide) | |
| C.3.2 Decrease the incidence rate of domestic violence | ||
| C.4 Food and Nutritional Security | C.4.1 Reduce the percentage of the department’s population with Unsatisfied Basic Needs | |
| C.4.2 Decrease the prevalence of acute malnutrition in children under five years old | ||
| C.5 Sexuality. Sexual and Reproductive Rights | C.5.1 Lower the mortality rate from HIV/AIDS | |
| C.5.2 Reduce the fatality rate of congenital syphilis among live births | ||
| C.6 Public Health in Emergencies and Disasters | C.6.1 Expand hospital capacity to respond to emergencies and disasters | |
| C.6.2 Increase availability of basic and advanced (medicalized) patient transport in emergencies or disasters | ||
| C.7 Healthy Living and Communicable Diseases | C.7.1 Decrease mortality rate from acute respiratory infections (pneumonia. influenza. rhinitis. pharyngitis. tonsillitis. sinusitis. etc.) | |
| C.7.2 Reduce mortality rate from acute diarrheal disease (ADD) in children under five years old | ||
| C.8 Differential Management of Vulnerable Populations | C.8.1 Improve access to healthcare services for rural and Indigenous populations | |
| C.8.2 Develop a culturally appropriate healthcare model for ethnic populations | ||
| C.9 Strengthening of Health Authority Management | C.9.1 Implement the healthcare model based on the Primary Health Care (PHC) strategy | |
| C.9.2 Improve the quality of healthcare services and installed capacity to meet the demand not only of the department. but also of the Orinoquía region |
Table 2.
List of Projects/Alternatives.
| Projects/Alternatives |
|---|
| Strengthening of the Basic Emergency Medical Transport Service at the healthcare center in the municipality of La Macarena |
| Development of primary healthcare (PHC) activities in rural and remote rural areas of the municipality of Vistahermosa |
| Construction and equipping of the Emergency and Disaster Regulatory Center for the department of Meta |
| Expansion of installed capacity and physical reorganization of the municipal hospital of Acacías |
| A05. Replacement of the healthcare center in the municipality of Puerto Gaitán |
Table 3.
DEMATEL Scale of Influence Intensity Between Elements or Groups.
| Intensity | Value | Description |
|---|---|---|
| None | 0 | No influence of one criterion or alternative over another |
| Very Low | 1 | Very low influence of one criterion or alternative over another |
| Low | 2 | Low influence of one criterion or alternative over another |
| Medium | 3 | Medium level of influence of one criterion or alternative over another |
| High | 4 | High influence of one criterion or alternative over another |
| Very High | 5 | Very strong influence of one criterion or alternative over another |
Table 4.
Example of DEMATEL Influence Matrix Among Elements for a Single Expert.
| C.1 Environmental Health | C.2 Healthy Living and Non-Communicable Diseases (NCDs) | C3. Social Cohesion and Mental Health | |||||
|---|---|---|---|---|---|---|---|
| C.1.1 | C.1.2 | C.2.1 | C.2.2 | C.3.1 | C.3.2 | ||
| C.1 Environmental Health | C.1.1 | 5 | 5 | 0 | 6 | 0 | 0 |
| C.1.2 | 5 | 5 | 0 | 6 | 0 | 0 | |
| C.2 Healthy Living and Non-Communicable Diseases (NCDs) | C.2.1 | 5 | 5 | 1 | 2 | 0 | 0 |
| C.2.2 | 5 | 5 | 1 | 2 | 0 | 0 | |
| C.3 Social Cohesion and Mental Health | C.3.1 | 0 | 0 | 0 | 0 | 5 | 5 |
| C.3.2 | 0 | 0 | 0 | 0 | 5 | 5 | |
Table 5.
Example of DEMATEL Influence Relationship Matrix Between Different Groups. According to One Expert.
Table 5.
Example of DEMATEL Influence Relationship Matrix Between Different Groups. According to One Expert.
| C1 | C2 | C3 | C4 | C5 | C6 | C7 | C8 | C9 | A | |
|---|---|---|---|---|---|---|---|---|---|---|
| C1 | 0 | 4 | 4 | 5 | 2 | 3 | 2 | 0 | 0 | 3 |
| C2 | 4 | 0 | 5 | 5 | 3 | 3 | 3 | 0 | 1 | 3 |
| C3 | 4 | 5 | 0 | 4 | 3 | 2 | 1 | 1 | 1 | 2 |
| C4 | 5 | 5 | 4 | 0 | 3 | 3 | 5 | 3 | 2 | 3 |
| C5 | 4 | 4 | 3 | 2 | 0 | 4 | 1 | 2 | 2 | 2 |
| C6 | 3 | 4 | 4 | 2 | 3 | 0 | 3 | 3 | 2 | 2 |
| C7 | 3 | 2 | 2 | 2 | 2 | 2 | 0 | 2 | 2 | 2 |
| C8 | 2 | 1 | 1 | 2 | 2 | 2 | 1 | 0 | 1 | 2 |
| C9 | 4 | 3 | 3 | 3 | 2 | 2 | 0 | 0 | 1 | 1 |
| A | 3 | 3 | 3 | 3 | 3 | 4 | 2 | 2 | 3 | 0 |
Table 6.
Standardization of the Influence Relationship Matrix Using the DEMATEL Approach.
| C.2.2 | Normalized C.2.2 | |
|---|---|---|
| C.1.1 | 3 | 3/6 = 0.5 |
| C.1.2 | 3 | 3/6 = 0.5 |
| sum | 6 |
Table 7.
Normalized Influence Matrix of Elements Using DEMATEL. According to One Expert.
| C.1 | C.2 | C.3 | C.4 | C.5 | |||||||
|---|---|---|---|---|---|---|---|---|---|---|---|
| C.1.1 | C.1.2 | C.2.1 | C.2.2 | C.3.1 | C.3.2 | C.4.1 | C.4.2 | C.5.1 | C.5.2 | ||
| C.1 | C.1.1 | 0.000 | 1.000 | 0.000 | 0.500 | 0.000 | 0.000 | 1.000 | 0.500 | 0.000 | 0.000 |
| C.1.2 | 1.000 | 0.000 | 0.000 | 0.500 | 0.000 | 0.000 | 0.000 | 0.500 | 0.000 | 0.000 | |
| C.2 | C.2.1 | 0.000 | 0.000 | 0.000 | 1.000 | 0.000 | 0.000 | 0.667 | 0.333 | 0.000 | 1.000 |
| C.2.2 | 1.000 | 1.000 | 1.000 | 0.000 | 0.000 | 0.000 | 0.333 | 0.667 | 0.000 | 0.000 | |
| C.3 | C.3.1 | 0.000 | 0.000 | 0.000 | 0.000 | 0.000 | 1.000 | 0.500 | 0.200 | 1.000 | 1.000 |
| C.3.2 | 0.000 | 0.000 | 0.000 | 0.000 | 1.000 | 0.000 | 0.500 | 0.800 | 1.000 | 1.000 | |
| C.4 | C.4.1 | 0.500 | 0.500 | 0.833 | 0.833 | 0.833 | 0.833 | 0.000 | 1.000 | 1.000 | 1.000 |
| C.4.2 | 0.500 | 0.500 | 0.167 | 0.167 | 0.167 | 0.167 | 1.000 | 0.000 | 0.000 | 0.000 | |
Table 8.
Weighted Matrix.
| C.1.1 | C.1.2 | C.2.1 | C.2.2 | C.3.1 | C.3.2 | C.4.1 | C.4.2 | ||
|---|---|---|---|---|---|---|---|---|---|
| C.1 | C.1.1 | 0.000 | 0.000 | 0.000 | 0.083 | 0.000 | 0.000 | 0.179 | 0.089 |
| C.1.2 | 0.000 | 0.000 | 0.000 | 0.083 | 0.000 | 0.000 | 0.000 | 0.089 | |
| C.2 | C.2.1 | 0.000 | 0.000 | 0.000 | 0.000 | 0.000 | 0.000 | 0.119 | 0.060 |
| C.2.2 | 0.190 | 0.190 | 0.000 | 0.000 | 0.000 | 0.000 | 0.060 | 0.119 | |
| C.3 | C.3.1 | 0.000 | 0.000 | 0.000 | 0.000 | 0.000 | 0.000 | 0.071 | 0.029 |
| C.3.2 | 0.000 | 0.000 | 0.000 | 0.000 | 0.000 | 0.000 | 0.071 | 0.114 | |
| C.4 | C.4.1 | 0.119 | 0.119 | 0.189 | 0.174 | 0.185 | 0.185 | 0.000 | 0.000 |
| C.4.2 | 0.119 | 0.119 | 0.038 | 0.035 | 0.037 | 0.037 | 0.000 | 0.000 |
Table 9.
Weighting of the Criteria.
| E1 | E2 | E3 | … | GRUPO | ||||
|---|---|---|---|---|---|---|---|---|
| C.4.1 | 11.62% | C.9.2 | 12.00% | C.6.1 | 11.24% | C.4.1 | 8.54% | |
| C.6.1 | 6.97% | C.2.2 | 10.50% | C.8.1 | 10.54% | C.6.1 | 8.15% | |
| C.4.2 | 6.94% | C.6.2 | 9.51% | C.4.2 | 9.59% | C.9.2 | 7.59% | |
| C.2.2 | 6.79% | C.4.1 | 8.35% | C.2.1 | 8.56% | C.6.2 | 7.55% | |
| C.6.2 | 6.61% | C.8.1 | 7.51% | C.3.2 | 7.11% | C.4.2 | 7.14% | |
| C.9.2 | 6.09% | C.1.1 | 6.56% | C.9.1 | 6.54% | C.2.2 | 7.03% | |
| C.5.1 | 5.90% | C.3.2 | 5.58% | C.1.2 | 6.08% | C.8.1 | 6.96% | |
| C.2.1 | 5.61% | C.4.2 | 5.57% | C.6.2 | 5.57% | C.3.2 | 6.00% | |
| C.1.1 | 5.59% | C.6.1 | 5.54% | C.2.2 | 5.23% | C.9.1 | 5.69% | |
| C.9.1 | 5.07% | C.9.1 | 4.39% | C.4.1 | 5.10% | C.1.1 | 5.35% | |
| C.3.2 | 4.96% | C.8.2 | 4.26% | C.7.1 | 4.59% | C.7.1 | 4.37% | |
| C.3.1 | 4.82% | C.7.1 | 4.00% | C.5.2 | 4.02% | C.5.1 | 4.16% | |
| C.8.1 | 4.57% | C.5.1 | 3.47% | C.9.2 | 3.58% | C.8.2 | 4.13% | |
| C.8.2 | 4.41% | C.3.1 | 3.32% | C.3.1 | 3.25% | C.3.1 | 3.99% | |
| C.7.2 | 3.85% | C.7.2 | 3.25% | C.8.2 | 2.75% | C.2.1 | 3.95% | |
| C.1.2 | 3.52% | C.2.1 | 2.54% | C.1.1 | 2.58% | C.7.2 | 3.24% | |
| C.7.1 | 3.52% | C.5.2 | 2.12% | C.5.1 | 2.21% | C.1.2 | 3.20% | |
| C.5.2 | 3.17% | C.1.2 | 1.54% | C.7.2 | 1.50% | C.5.2 | 2.95% | |
Table 10.
Prioritization of Alternatives.
| E1 | E2 | E3 | … | GRUPO | ||||
|---|---|---|---|---|---|---|---|---|
| A04 | 24.93% | A04 | 25.00% | A01 | 30.11% | A05 | 29.84% | |
| A05 | 23.16% | A02 | 21.32% | A05 | 25.11% | A04 | 20.00% | |
| A03 | 22.83% | A05 | 19.85% | A04 | 19.82% | A03 | 17.95% | |
| A02 | 20.95% | A01 | 18.85% | A02 | 15.21% | A02 | 16.11% | |
| A01 | 8.13% | A03 | 14.98% | A03 | 9.75% | A01 | 16.10% | |
Table 11.
Correlation Metrics.
| Comparisons | Kendall (τ-b) | p-value | Kendall Compatibility | S-Saaty | S-Saaty Compatibility | G-Garuti | G-Garuti Compatibility |
|---|---|---|---|---|---|---|---|
| E1–E2 | 0.4 | 0.483 | Low | 0.037 | Null | 0.2247 | Null |
| E1–E3 | -0.2 | 0.817 | Very Low | 0.035 | Null | 0.1903 | Null |
| E1–E4 | 0.0 | 1.000 | Null | 0.035 | Null | 0.2448 | Null |
| E2–E3 | 0.0 | 1.000 | Null | 0.037 | Null | 0.2043 | Null |
| E2–E4 | 0.6 | 0.233 | Moderate | 0.037 | Null | 0.2275 | Null |
| E3–E4 | 0.0 | 1.000 | Null | 0.035 | Null | 0.2189 | Null |
| E1–GROUP | 0.8 | 0.801 | High | 0.036 | Null | 0.2074 | Null |
| E2–GROUP | 0.2 | 0.817 | Very Low | 0.038 | Null | 0.1993 | Null |
| E3–GROUP | 0.0 | 1.000 | Null | 0.036 | Null | 0.1917 | Null |
| E4–GROUP | -0.2 | 0.817 | Very Low | 0.037 | Null | 0.2204 | Null |
| … | … | … | … | … | … | … | … |
Disclaimer/Publisher’s Note: The statements, opinions and data contained in all publications are solely those of the individual author(s) and contributor(s) and not of MDPI and/or the editor(s). MDPI and/or the editor(s) disclaim responsibility for any injury to people or property resulting from any ideas, methods, instructions or products referred to in the content. |
© 2025 by the authors. Licensee MDPI, Basel, Switzerland. This article is an open access article distributed under the terms and conditions of the Creative Commons Attribution (CC BY) license (http://creativecommons.org/licenses/by/4.0/).
Copyright: This open access article is published under a Creative Commons CC BY 4.0 license, which permit the free download, distribution, and reuse, provided that the author and preprint are cited in any reuse.


