
Submitted:
21 July 2025
Posted:
23 July 2025
You are already at the latest version
Abstract
Farmers’ markets in Latin America face structural challenges such as informal production, limited value addition, and weak institutional coordination. This article presents a hybrid model combining DEMATEL, ANP, and SBWM to prioritize agri-food transformation strategies focused on quality and safety in the department of Meta, Colombia. The methodology involved stakeholder mapping, criteria validation using the Delphi technique, application of the ANP-DEMATEL model to capture interdependencies among criteria, and assessment of strategic robustness under prospective scenarios using SBWM. Although the farmers' market analyzed operates in an urban setting, its organizational, productive, and strategic foundations are rooted in rural areas, supporting the chosen approach. The results show that the working group strategy consistently ranked highest across all scenarios, while others—such as infrastructure development and participatory workshops—were more sensitive to the weight of certain criteria, particularly C.6.1. Sensitivity analysis confirmed the model’s stability. This article offers both methodological and practical insights into how agri-food strengthening strategies can be prioritized from a territorial, participatory, and context-specific perspective.
Keywords:
ANP-DEMATEL
; SBWM
; farmers’ markets
; rural-based strategies
; agri-food sustainability
; multi-criteria decision n-making methods
; Meta (Colombia)
; prospective scenarios
1. Introduction
Agricultural transformation in rural areas of Latin America faces structural challenges linked to productive informality, limited value addition, inadequate infrastructure, and weak institutional coordination [1]. In the department of Meta, Colombia, these limitations are further exacerbated by the absence of participatory governance frameworks, the declining recognition of ancestral knowledge, and the limited capacity to meet the quality and safety standards required in formal markets [2]. These conditions restrict small producers’ access to marketing opportunities and hinder progress toward several Sustainable Development Goals (SDGs), including no poverty (SDG 1), zero hunger (SDG 2), and decent work (SDG 8) [3,4]. Farmers’ markets, as territorial direct-marketing strategies, have emerged as effective mechanisms to reduce intermediation, promote the consumption of local foods, and strengthen rural economies [5]. However, ensuring their long-term sustainability requires informed decision-making processes that integrate economic, social, cultural, and environmental criteria—especially in contexts marked by actor diversity and future uncertainty [6]. In light of this, the following research question arises: How can strategies for the transformation of agricultural products with quality and safety be prioritized in the department of Meta, considering sustainability and associativity criteria under different future scenarios?
In this context, multi-criteria decision-making (MCDA) methods—such as DEMATEL and ANP—have proven effective for modeling complex relationships between factors and stakeholders in diverse socioeconomic systems [7,8,9]. Nevertheless, few studies have applied these techniques within participatory processes focused on farmers’ markets in Latin America, underscoring the innovative nature of the approach proposed here. Moreover, the inclusion of the Stratified Best–Worst Method (SBWM)—recently used in areas such as the sustainable selection of waste collection technologies under future scenarios [10]—offers a novel tool to capture variations in decision priorities across plausible conditions.
Integrating SBWM with DEMATEL-ANP enables the development of robust multi-criteria models that are adaptable to political, environmental, and economic uncertainties, thus enhancing their potential to inform strategic decisions in rural contexts.
This article proposes a hybrid model that combines stakeholder mapping, needs analysis, scenario building, and multi-criteria techniques (DEMATEL–ANP–SBWM) to prioritize sustainable strategies for agricultural transformation with a focus on quality and safety in the department of Meta. The proposal is grounded in a participatory and associative approach, tailored to local territorial dynamics. The findings aim to provide actionable insights for both public and community actors to promote food sustainability and rural resilience. Although the prioritized farmers’ market operates in an urban setting, its organizational base—a rural producers’ cooperative—and its territorial anchoring in agricultural areas of Meta justify its analysis within conceptual frameworks of rural governance and agri-food sustainability.
2. Theoretical Framework
2.1. Agricultural Transformation, Associativity and the Cooperative Economy
Productive transformation in rural settings requires addressing structural barriers such as informality, market fragmentation, and limited value addition. The theory of the social and solidarity economy posits that collective organizational forms—such as cooperatives—function not only as economic units but also as social institutions that promote equity, participation, and sustainability [11]. In Colombia, peasant cooperatives represent a key mechanism for small-scale producers to access markets, strengthen their market position, and enhance their economic autonomy. This perspective is supported by social capital theory [12], which emphasizes how networks of trust and reciprocity foster cooperation and collective efficacy, particularly in territories excluded from the formal economy.
2.2. Participatory Governance and Rural Civil Society
This article draws on the theory of participatory governance [13], which holds that decision-making in rural contexts must acknowledge polycentrism: the existence of multiple relatively autonomous actors who share responsibilities in resource management and territorial planning. This approach aligns with the concept of rural civil society [14], which underscores the role of peasant and community-based organizations as political agents capable of influencing public decisions, claiming rights, and proposing alternative development models. These theoretical lenses help explain the legitimacy of farmers’ markets as expressions of territorial self-management.
2.3. Farmers’ Markets, Sustainability and the SDGs
From a sustainability perspective, farmers’ markets contribute to several Sustainable Development Goals (SDGs), particularly SDG 1 (no poverty), SDG 2 (zero hunger), SDG 8 (decent work), SDG 12 (responsible consumption), and SDG 15 (life on land). The theory of sustainable food systems [15] highlights how local markets reduce environmental impacts, support agricultural biodiversity, and promote public health by encouraging fresh and locally sourced diets.
2.4. Multicriteria Approaches
Prioritizing strategies to strengthen farmers’ markets requires approaches capable of addressing their structural complexity. Multicriteria decision analysis (MCDA), particularly the AHP and ANP models, enables the structuring of interdependent hierarchies or networks and the participatory weighting of criteria [17]. The Analytic Network Process (ANP), developed by Saaty [18], has been applied in regional planning and agri-food management, offering advantages in modeling feedback and dependencies through convergent supermatrices [19,20]. To analyze cause–effect relationships among criteria, the DEMATEL method is employed; it is especially useful in contexts characterized by dynamic interactions, such as studies on governance and circular agriculture [21,22]. The integration of ANP and DEMATEL facilitates the identification of driving and dependent criteria, enabling the structuring of strategic decisions within interconnected networks, as demonstrated in research on food policy and rural adaptation. Additionally, the Stratified Best–Worst Method (SBWM) allows for the incorporation of uncertainty through prospective scenarios by assigning differentiated weights to criteria. This technique has proven valuable in strategic evaluations related to sustainability and technology selection in rapidly changing contexts [10].
2.5. State of Knowledge: Contributions and Gaps
At the international level, literature on food governance and alternative markets has highlighted the benefits of short supply chains (SSCs) and farmers’ markets, particularly in terms of environmental sustainability, public health, and social equity [16,23]. In Latin America, several studies have examined the conditions for participation, quality, and safety in these markets, but often with limited integration of technical, social, and territorial dimensions.
Although existing research has described the functioning of farmers’ markets in Latin America [24,25], a methodological gap remains: most studies lack prioritization models that incorporate local actors’ perspectives and consider future sustainability scenarios. Moreover, decision-making processes are frequently based on isolated technical criteria, with limited dialogue among organizational, economic, and environmental variables.
3. Materials and Methods
This article adopted a mixed and participatory approach, structured in four methodological phases, described below, aimed at prioritizing strategies for agri-food transformation in the department of Meta (see Figure 1).
Phase 1. Mapping and characterization of stakeholders linked to the cooperative
In the initial phase of the project, a comprehensive process was undertaken to identify and characterize both internal and external stakeholders involved in the strengthening of farmers’ markets. This mapping was conducted through literature review, semi-structured interviews, and the administration of Questionnaire 1 (see Annex Table A1), which was designed based on stakeholders’ analysis methodologies and adapted to the specific context of the cooperative and its institutional environment. The instrument captured key information regarding levels of interest, influence, and expectations concerning the project’s development, following a participatory approach to stakeholder management [26]. The sample consisted of the 26 active cooperative members, considered the strategic core of the research, and was complemented by 15 external stakeholders: unaffiliated producers (40%), local market vendors (27%), public officials involved in rural development programs (20%), and regular consumers (13%). This integration of diverse perspectives enhanced the legitimacy of the process, broadened the understanding of the local agri-food system, and guided the identification of strategies from a participatory, multilevel governance perspective. The collected data were systematized to produce an stakeholder’s map, identify key relationships, and define the strategic group that would participate in the following phases—thus ensuring representation aligned with the dynamics of the local agri-food system [27,28].
During this first phase, organizational, territorial and functional variables of the internal members were also determined. The cooperative members were classified according to their type of production into three main categories: primary producers (44%), secondary producers (44%) and mixed producers (11%). This typology allowed for the establishment of significant differences in terms of geographic location, levels of commercial coordination, and participation strategies. Regarding the positions held within the governance structure, 59% of the stakeholders served exclusively as cooperative members, 15% were members of the Board of Directors, 15% were inactive members, 7% were members of the Supervisory Board, and 4% served as Legal Representative.
Phase 2: Identification and validation of transformation strategies
The second phase focused on identifying and grouping transformation strategies based on the proposals collected through the questionnaires administered to the various stakeholder groups. Open-ended responses were coded using an inductive approach—that is, through direct analysis of participants’ written narratives, without relying on predefined categories. The procedure involved manually reviewing each response, grouping expressions with similar meanings, and constructing categories that reflected recurring patterns in the discourse. This systematization enabled the organization of the information into five strategic dimensions: associativity, marketing, institutional strengthening, quality production, and territorial development. Based on this structure, nine first-level criteria and eighteen second-level criteria were defined and organized according to the overarching goal of strengthening associative and agro-industrial processes in rural territories (see Table 1).
Based on the results of Questionnaire 1, nine strategic alternatives were also defined that summarize the main proposals put forward by the social stakeholders consulted. These strategies emerged from a qualitative analysis of the open-ended responses, which expressed needs, expectations, and possible courses of action. The codification process allowed these proposals to be organized into strategic lines that encompass actions in infrastructure, partnerships, marketing, training, communication, and food sustainability. Table 2 presents these strategies:
Subsequently, in order to validate the formulated criteria and establish their link with the Sustainable Development Goals (SDG), an adapted Delphi technique was used, taking as a methodological basis the proposal of [29]. This technique was applied to a group of nine experts, who evaluated the relationship of each criterion with the SDGs using a dichotomous matrix (“Related” / “Not related”). A consensus threshold of 75% was defined, which was reached in the first round, so no additional rounds were necessary. This methodology allowed for the consolidation of a selection of criteria aligned with both territorial priorities and international sustainability frameworks. The selection of the nine experts was based on their knowledge of the local context and their active participation in processes to strengthen the organizational, commercial, and territorial structure of farmers’ markets. The panel was formed according to criteria of functional diversity, experience in associative processes and track record in strategic planning spaces, following the methodological recommendations for Delphi studies [30]. The group was made up of cooperative members, technical staff from public entities, and representatives of allied organizations.
The selection of the Sustainable Development Goals (SDGs) responds to the identification of structural problems and opportunities for transformation in the rural context of the Meta department, particularly in strengthening farmers’ markets and associative dynamics. First, SDG 1 (No Poverty) is included, as it recognizes that agricultural activity represents a direct path to improving income and reducing poverty in rural populations, especially when supported by organizational structures such as cooperatives. Studies have shown that participation in community agriculture and local markets can generate significant impacts in overcoming rural structural poverty through sustainable employment and income [31]. SDG 2 (Zero Hunger) is also selected due to the central role of agroecological production and food sovereignty in strengthening local food security. Strategies such as “from seed to plate” workshops contribute to diversifying the diet, improving access to healthy foods and promoting sustainable production practices [32]. In direct connection, SDG 3 (Health and well-being) is included due to the focus on food quality and safety, as well as the promotion of fresh and chemical-free foods that benefit both producers and consumers, improving nutrition and reducing health risks [33,34].
SDG 8 (Decent Work and Economic Growth) relates to efforts to improve transformation infrastructure, create local employment, and strengthen the territorial economic fabric through farmers associations. These dynamics allow for more inclusive and sustained growth [35], with the potential for agricultural cooperatives to generate decent employment and reduce structural inequalities. In this sense, SDG 10 (Reduction of inequalities) is also considered, due to the inclusion of traditionally marginalized groups, such as small producers, women and rural inhabitants, promoting their participation in decision-making processes and collective economic strengthening [36]. Furthermore, SDG 9 (Industry, innovation and infrastructure) is essential due to the interest in developing collection centers, pilot processing plants and adequate technical equipment, which contributes to the technical development and added value in farmers production, as indicated in studies on sustainable agro-industrial development [37]. SDG 12 (Responsible production and consumption) is aligned with the agroecological and direct marketing practices implemented by the cooperative, which minimize waste, shorten supply chains and encourage more conscious consumption [32]. SDG 17 (Partnerships for the goals) was included in recognition of the importance of coordinating actions between public, private and social institutions to mobilize resources and knowledge that guarantee the success and sustainability of the proposed strategies, regarding the role of partnerships in the effective implementation of the 2030 Agenda [38].
Based on the validation process using the Delphi approach and the correspondence matrix between sub-criteria and Sustainable Development Goals (see Figure 2), the 18 second-level criteria defined in the previous phase were selected. These criteria were fully incorporated into the ANP-DEMATEL prioritization model, given that they met the established consensus thresholds and reflect both the diversity of strategies and their alignment with the prioritized SDGs.
The selection of the second-level criteria included in the prioritization phase through ANP-DEMATEL was filtered based on the number of relationships validated by consensus with the Sustainable Development Goals. Each point of agreement between a sub-criterion and an SDG was graphically represented in the Delphi matrix, where green dots indicate consensus equal to or greater than 75% among the experts consulted. Since the 18 second-level criteria obtained at least one validation with some priority SDG, it was considered methodologically appropriate to include them in the multicriteria model. This selection criterion ensures consistency between territorial priorities for strengthening farmers’ markets and international sustainability frameworks, and allows for strategies to be evaluated from a comprehensive and contextualized perspective.
Phase 3: Strategy selection through ANP-DEMATEL integration
In this phase, an integrated ANP-DEMATEL approach was implemented to prioritize strategies, considering both the causal structure and the interdependencies between criteria. Questionnaire 2 was used as a data collection instrument, which allowed experts’ assessments to be captured using a scale from 0 (no influence) to 5 (very high influence). Initially, the DEMATEL method was applied to represent the network of cause-effect relationships between the strategic criteria. Based on the experts’ assessments, a matrix of direct relationships was constructed, the normalized version of which gave rise to the total influence matrix. This allowed the identification of driving factors (cause) and dependent factors (effect), establishing the network structure for the next step. On this basis, the Analytic Network Process (ANP) method was used to model the interdependencies. Pairwise comparison matrices between criteria and strategies were constructed and processed in SuperDecisions software version 3.2.0. The ANP-DEMATEL integration combined DEMATEL’s exploratory capabilities with ANP’s own interconnected network modeling, as documented in previous studies [9,29,39].
As a result, direct influence matrices were generated for each expert. Table 3 shows the matrix prepared by one of them, where the relationships between second-level criteria (C.1 to C.9) and strategies (E) are assessed. It clearly identifies the factors that have the greatest impact.
The influence matrices were subsequently generated for each expert. Table 3 shows the matrix prepared by one of them, where the relationships between second-level criteria (C.1 to C.9) and strategies (E) are assessed. It clearly identifies the factors that have the greatest impact.
In order to ensure comparability between experts, this matrix was normalized, obtaining proportional values between 0 and 1. In addition, the relationships between the second-level criteria (e.g., C.1.1, C.1.2) and the first-level criteria were structured using weights obtained from the ANP matrices. Table 4 shows a representative section of this weighting, focusing on criteria C.1 to C.5.
The weighted matrix was raised to successive powers, as recommended in the ANP methodology, until a stable or convergent supermatrix, called the limit matrix, was reached. In this boundary matrix, all elements reflect the cumulative influence of each second-level criterion on the others within the network, thus capturing both direct and indirect influences (Table 5).
The 8 iterations progressively redistribute influences among the system elements, so that reciprocal dependencies and feedbacks are fully integrated. When converging, the limit matrix contains stable values that can be interpreted as the overall weights of each node (subcriteria or strategies) within the system. This allows for a robust ranking of available strategies based on their structural connectivity, that is, the degree of influence they exert and receive within the entire strategic system. The complete matrix is in the annex (Table A3).
Phase 4. Evaluating strategic robustness under future scenarios with SBWM
Once the hierarchy of strategies was established using the ANP-DEMATEL model, the fourth phase focused on evaluating the robustness of these priorities against plausible future scenarios. For this purpose, the Stratified Best–Worst Method (SBWM) was used, an extension of the Best–Worst method that allows uncertainty to be incorporated by simulating different prospective contexts. In this phase we worked with the same 9 experts from phase 3 plus two more.
The SBWM approach combines the logic of comparing extreme criteria (best and worst) with a stratified analysis scheme, which assigns specific weights to decision criteria according to the future context. This article defined three plausible scenarios, considering the difficulties of operating the farmers’ market in urban areas. The three scenarios (S1, S2 and S3) were built from an inductive analysis based on empirical evidence and contextual literature on urban farmers’ markets in Latin America and Colombia, considering scenario planning approaches and territorial analysis [40,41] that recommend building contrasting scenarios:
- (S1) Continuity without additional institutional support: the farmers’ market operates with logistical limitations and without formal state support, facing space restrictions, low visibility and conflicts over urban land use.
- (S2) Institutional support and favorable local regulation: the local government provides incentives and facilitates infrastructure for the establishment of the market, integrating it into urban food supply strategies and recognizing it as a fundamental actor in the solidarity economy.
- (S3) Pressure from urban reorganization and eviction: the market faces the threat of displacement or elimination due to urban renewal policies, real estate expansion, or regulations that restrict its presence in central public spaces.
In each scenario, the 9 experts above, plus 2 experts, identified the “best” and “worst” criteria and completed the corresponding comparison matrices. The generated weight vectors were then integrated by weighting according to the probability of occurrence of each scenario, which allowed estimating the potential impact of contextual change on strategic priorities and building a robust and adaptive ranking of strategies, explicitly incorporating territorial uncertainty [42].
In each scenario, the experts identified the “best” (B) and “worst” (W) criteria and established the required comparisons. The SBWM model is formalized from the following formulation [43,44]:
- Determine the set of criteria C={C1,C2,...,CN}.
- Select the most important criterion CB and the least important (worst) cW.
- Obtain the vector of comparisons of the best with the others: AB=[aB1,aB2,…,aBn].
- Get the vector of comparisons of the others with the worst: AW=[a1W,a2W,...,anw].
- Calculate the optimal weights W1,W2,...,WN that minimize the deviation function ξ under the following restrictions, where the difference between the weight of the “best” criterion and its comparison with the others must not exceed the allowed deviation ξ (Equation 1). The difference between the weight of each criterion and its comparison with the “worst” must also be within the limit ξ (Equation 2). The sum of all weights must be 1, and no weight can be negative (Equation 3).
- Repeat this procedure for each scenario Sk, generating a set of weight vectors w(k).
- Consistency evaluation of comparisons: For each scenario, the consistency ratio (ES) was calculated, defined as the quotient between the minimum optimal deviation (ξ*) obtained in the model and the tabulated consistency index (ICₙ), corresponding to the magnitude of the comparison between the best and worst criteria and to the consistency index table (Equation 4). An ES value < 0.2 indicates an acceptable level of consistency in comparisons, allowing the reliability of expert judgments to be validated [43].
Weighted inter-scenario aggregation: Once the consistency of the weight vectors w(k) in each scenario was verified, a final aggregate vector w* was calculated, weighting each scenario by its probability of occurrence pₖ. This stratified aggregation allows prioritization to be consolidated considering contextual uncertainty (Equation 5).
It is convenient to clarify that the weighted aggregation expression w∗=∑k=1pk⋅w(k) must be complemented with a subsequent normalization in case the sum of the aggregated vectors is not 1.
- 8.
- Final prioritization of strategies: Based on the aggregated vector w*, a final ranking of strategies was established. This ranking reflects the robustness of each alternative in different future scenarios. To do this, the optimal weights for each criterion are multiplied by the corresponding values in the normalized decision matrix, which allows for obtaining the aggregate scores for each strategy and ranking them based on their overall performance.
- 9.
- Sensitivity analysis: A sensitivity analysis is performed to assess the stability of the strategy ranking derived from the SBWM model in the face of variations in critical system parameters, i.e., specific thresholds in parameter variation beyond which a significant change in the ranking of prioritized strategies occurs.
4. Results
The results presented in Table 6 correspond to the overall weightings obtained for the second-level criteria (C.1.1 to C.9.2), from the aggregation of the individual judgments of the experts with ANP-DEMATEL. Each expert built their own decision model, expressing the relationships of influence between the criteria through individual matrices. This matrix was processed using the Aggregation of Individual Judgments (AIJ) approach, through which the geometric means of the normalized priorities were calculated [45]. The obtained weights constitute the limit matrix of the ANP model and reflect the relative importance of each criterion within the decision network. This resulting hierarchy is used as a basis for analysis in the subsequent phase of the SBWM model, where the robustness of the strategies under different forward-looking scenarios is assessed. Thus, the second-level criteria not only structure the ANP-DEMATEL model, but also allow for the projection of its strategic priorities based on uncertain future contexts.
Based on the results of the ANP-DEMATEL model, a baseline scenario or current scenario (OS) was established. This scenario serves as a benchmark for assessing the stability and consistency of strategic priorities in alternative future contexts. For this purpose, the (SBWM) was applied in three prospective scenarios (S1, S2 and S3). In this way, the robustness of the initially established weights was analyzed, comparing how the assignment of optimal weights varies when environmental conditions change. Table 7 presents the results obtained for the first prospective scenario (S1), where coincidentally, like ANP-DEMATEL, (C.6.1) was identified as the “best” criterion and (C.8.2) as the “worst”. From the comparisons provided by the experts, the optimal weights were calculated. The constraint columns show the absolute deviations according to the model equations. The value of ξ 0.0658 reflects the coherence of the system under this scenario. The process is repeated for scenarios S2 and S3.
The consistency of the comparisons made in scenario S1 was assessed using the ES ratio. In this case, a comparison was established between the best criterion (C.6.1) and the worst criterion (C.8.2) was 9, then . This value is below the acceptability threshold (ES < 0.2), indicating that the comparisons made by the experts were consistent and the derived weights are reliable for strategic analysis (Table 8).
Once the consistency of the weight vectors w(k) was verified in each of the scenarios, a final aggregate vector w* was calculated. Future scenarios were weighted based on expert judgments. At this stage, participants were asked about the probability of each of the proposed scenarios occurring. The experts assigned relative values of occurrence: 0.3% for S1 (Continuity without institutional support), 0.4% for S2 (Institutional support) and 0.3% for S3 (Pressure for urban reorganization). The weighted aggregation of the vectors of each scenario was performed, and w* was normalized (Table 9).
To prioritize the strategies, another questionnaire was then administered to the experts, asking them to identify the best and worst strategies for each criterion evaluated. Subsequently, the BWM technique was implemented again for each scenario considered. The resulting matrix (Table 10) was multiplied by the optimal weight matrix of the criteria (Table 9), in order to obtain the aggregate score for each strategy.
As a result, the strategies previously prioritized with ANP-DEMATEL are presented, and those calculated with SBWM (Table 11).
In the ANP-DEMATEL model, the highest-rated strategies were E.2 (infrastructure development) with a weight of 0.1299, followed by E.6 (preparation of ancestral foods) with 0.1278, and E.3 (working tables) with 0.1237. In contrast, in the SBWM model – which incorporates prospective scenarios weighting – E.3 ranked first (0.0669), followed by E.2 (0.0649) and E.8 (participatory workshop “from seed to plate”) with 0.0602. Strategy E.7 (product marketing) ranked last in both models, with weights of 0.0815 and 0.0430, respectively.
To assess the stability of the prioritization model under variations in the criteria, a sensitivity analysis was carried out focusing on criterion C.6.1, which was selected due to its significant weight in the aggregate vector w*. The analysis revealed that strategy E.3 (Working tables) consistently remained in the first position, indicating a high stability of the model in response changes in this criterion. In contrast, strategies E.2 and E.8 revealed variations in their rankings, alternating positions as the weight of the criterion increased. This behavior suggests that their relative priority is partially dependent on the value assigned to local productive transformation. The remaining strategies do not show significant changes in their rankings, which indicates a low sensitivity to the analyzed criterion. Overall, the results confirm the stability of the prioritization structure, although certain specific strategies may vary under scenarios where C.6.1 becomes more relevant (Figure 2).
5. Discussion
The results obtained from the ANP-DEMATEL and SBWM models reveal significant differences in the prioritization of strategies for strengthening farmers’ markets in the department of Meta. In the structural model (ANP-DEMATEL), physical investment and cultural rescue strategies were prioritized, such as infrastructure development (E.2) and the preparation of ancestral foods (E.6), which reflects a vision focused on the transformation of the productive base. This finding coincides with experiences in countries such as Brazil and Uruguay, where the strengthening of rural agro-industries has allowed for the improvement of value addition and food security in peripheral areas through public policies aimed at modular infrastructure and appropriate technologies [37,46]. In contrast, the SBWM model, by incorporating prospective scenarios weighted by experts, provides greater relevance to institutional articulation strategies (E.3: working groups) and participatory training (E.8: from seed to plate). This redistribution suggests that, under conditions of institutional uncertainty or territorial variability, strategies that strengthen organizational capacities and promote collaborative networks acquire greater value. Cases such as Mexico, where sustainable agriculture and local public procurement programs have been accompanied by local governance processes, show similar results [47,48].
The sensitivity analysis confirmed the stability of the model against variations in the weight of criterion C.6.1 (pilot transformation plant), maintaining E.3 as the priority strategy. However, E.2 and E.8 swapped positions in some scenarios, demonstrating a moderate sensitivity that can guide flexible implementation decisions. This flexibility is important in rural areas where resources, political will and the regulatory context are highly variable, as is the case in much of Latin America and the Caribbean [35,49]. Furthermore, the results reflect that strategies such as E.7 (marketing) and E.5 (quality documents) received a systematically low rating. This could be interpreted as a lack of preconditions for their effective implementation, or a perception that these actions do not generate immediate benefits unless structural limitations such as access to equipment, infrastructure, or technical knowledge are first addressed.
These findings not only guide local investment decisions in farmers’ markets, but also directly align with multiple Sustainable Development Goals (SDGs), particularly SDG 2 (zero hunger), SDG 8 (decent work), SDG 9 (resilient infrastructure), SDG 12 (responsible consumption and production) and SDG 17 (partnerships for development) [3,4]. Prioritizing strategies such as working groups, infrastructure, and participatory workshops strengthens coordination between stakeholders, adds local value, and strengthens community capacities—all key elements in achieving the 2030 Agenda.
From a methodological perspective, the combination of DEMATEL–ANP and SBWM provides depth and adaptability to the multi-criteria decision-making process. While DEMATEL allows capturing causal relationships between criteria, ANP manages hierarchical interdependence, and SBWM adds a scenario-based robustness component. This integration has been validated in recent studies for sustainable agri-food planning [50,51], although its direct application to farmers’ markets remains scarce, which reinforces the originality of this article. Limitations of the research include the limited sample size of experts, the reliance on qualitative judgments in the construction of comparison matrices, and the lack of empirical validation of the impacts once the strategies were implemented. Future studies could integrate hybrid models that include dynamic criteria such as input prices, access to credit, or climate variability.
6. Conclusions
This article presents the DEMATEL–ANP and SBWM approaches to prioritizing agricultural transformation strategies in the department of Meta, Colombia, based on criteria linked to quality, associativity, and ancestral knowledge. The results obtained demonstrate that the priorities perceived by the stakeholders vary according to the methodological approach: while the structural model (ANP-DEMATEL) highlights the need for investment in infrastructure and cultural appreciation, the prospective model (SBWM) gives greater importance to institutional coordination and participatory training. The consistency observed in strategy E.3 (working groups) across different models and scenarios reinforces its relevance as a starting point for strengthening farmers’ markets. Likewise, the sensitivity analysis showed that other strategies such as E.2 (infrastructure) and E.8 (participatory workshop) maintain a competitive behavior, allowing flexibility in their implementation according to the available resources and the institutional context.
From a regional perspective, these findings are consistent with experiences in Latin America and the Caribbean, which highlight the key role of local governance, territorial public investment, and agroecological training in energizing farmers-based agri-food systems. The hybrid methodology employed in this article allows prioritization to be adapted to changing contexts, respecting local knowledge and promoting more participatory and sustainable decision-making. In conclusion, the proposed model constitutes a useful tool for decision-makers seeking to strategically allocate resources in rural areas. Its application can be extended to other regions with similar characteristics, contributing to the achievement of the Sustainable Development Goals related to responsible production, partnerships, infrastructure, equality, and food security.
Author Contributions
Author Contributions (CRediT taxonomy): - Conceptualization: Astrid León-Camargo and Juan Manuel Ochoa-Amaya - Methodology, Software, Formal Analysis, Data Curation, Investigation, Writing—Original Draft: Astrid León-Camargo and Luz Gladys Yarime Peña-Ulloa.- Validation, Supervision, Writing—Review & Editing: Juan Manuel Ochoa-Amaya - Visualization, Project Administration: Astrid León-Camargo - Funding Acquisition: Astrid León-Camargo and Luz Gladys Yarime Peña-Ulloa All authors have read and approved the final version of the manuscript.
Funding
This research is part of the project titled “Strategy Model for the Transformation of Agricultural Products with Quality and Safety, Supported by Associativity and Ancestral Knowledge in the Department of Meta” (Code C05-F05-002 2022), funded by the Universidad de los Llanos.
Informed Consent Statement
Informed consent was obtained from all subjects involved in the study.
Data Availability
The data that support the findings of this study are available from the corresponding author upon request. These data include ANP–DEMATEL matrices, SBWM prioritization vectors, and aggregated survey results collected from strategic stakeholders in the regional agri-food system. Due to ethical and confidentiality considerations, the data are not publicly available, as their disclosure could compromise participant anonymity and institutional sensitivities.
Acknowledgments
During the preparation of this manuscript, the authors used ChatGPT (OpenAI, GPT-4o, 2025) for purposes of language editing and textual refinement. The authors have carefully reviewed and edited the content generated and take full responsibility for the final version of this publication.
Conflicts of Interest
The authors declare no conflicts of interest. The funders had no role in the design of the study; in the collection, analyses, or interpretation of data; in the writing of the manuscript; or in the decision to publish the results.
Abbreviations
The following abbreviations are used in this manuscript:
| ANP | Analytic Network Process |
| DEMATEL | Decision-Making Trial and Evaluation Laboratory |
| SBWM | Stratified Best–Worst Method |
| MCDA | Multi-Criteria Decision Analysis |
| SDG(s) | Sustainable Development Goal(s) |
| FAO | Food and Agriculture Organization of the United Nations |
| AIJ | Aggregation of Individual Judgments |
| CCS | Short Supply Chains |
| ICₙ | Consistency Index (used in SBWM consistency calculation) |
| ξ | Deviation (in SBWM optimization equations) |
Appendix A
Table A1. Questionnaire 1 – Identification of stakeholders, strategies and criteria.
- General information: participant’s name, occupation, type of producer (primary, secondary or mixed) and municipality of residence.
- Level of interest in participating in the research process, rated on a scale of 1 (no interest) to 5 (very high interest).
- Farmers’ market needs: Participants were asked to identify up to three priority needs that they perceive as relevant.
- Strategic actions: identification of concrete proposals that could be implemented in the short and medium term to strengthen farmers’ markets.
- Types of support needed: Selection of support types, including infrastructure, equipment, technical training, promotion and sales, financing, and others – with optional justification.

Table A2.
Questionnaire 2 – Evaluation of strategies for farmers’ markets. The questionnaire served as an input for the application of DEMATEL (Decision Making Trial and Evaluation Laboratory), which aims to prioritize the implementation of strategies based on the impact that one has on the others. The following table presents the assigned influence values of each criterion or alternative over the rest.
| Amount | Description | |
|---|---|---|
| None | 0 | No influence of one criterion or alternative on another criterion or alternative |
| Very Low | 1 | Very little influence of one criterion or alternative on another criterion or alternative |
| Low | 2 | Little influence of one criterion or alternative on another criterion or alternative |
| Medium | 3 | Average level of influence of one criterion or alternative on another criterion or alternative |
| High | 4 | Significant influence of one criterion or alternative on another criterion or alternative |
| Very High | 5 | Too much influence of one criterion or alternative on another criterion or alternative |
| Strategies | ||
| E.1 Cultural exchange. Exchange of knowledge and experiences in production and commercial activities. | ||
| E.2 Infrastructure development. Assembly of a collection center and design of a pilot plant for product processing. | ||
The full names of the strategies used are presented in Table 2.
| First-level criteria and strategies | ||||||||||
| C.1 | C.2 | C.3 | C.4 | C.5 | C.6 | C.7 | C.8 | C.9 | E | |
| C.1 | ||||||||||
| C.2 | ||||||||||
| E | ||||||||||
| The full names and definitions of the criterion codes used in the table are presented in Table 1. The letter E identifies the strategies. | ||||||||||
Table A3.
Limit matrix.
| C.1 | C.2 | C.3 | C.4 | C.5 | C.6 | C.7 | C.8 | C.9 | E | |||||||||||||||||||
|---|---|---|---|---|---|---|---|---|---|---|---|---|---|---|---|---|---|---|---|---|---|---|---|---|---|---|---|---|
| C.1.1 | C.1.2 | C.2.1 | C.2.2 | C.3.1 | C.3.2 | C.4.1 | C.4.2 | C.5.1 | C.5.2 | C.6.1 | C.6.2 | C.7.1 | C.7.2 | C.8.1 | C.8.2 | C.9.1 | C.9.2 | E.1 | E.2 | E.3 | E.4 | E.5 | E.6 | E.7 | E.8 | E.9 | ||
| C.1 | C.1.1 | 0,047 | 0,047 | 0,047 | 0,047 | 0,047 | 0,047 | 0,047 | 0,047 | 0,047 | 0,047 | 0,047 | 0,047 | 0,047 | 0,047 | 0,047 | 0,047 | 0,047 | 0,047 | 0,047 | 0,047 | 0,047 | 0,047 | 0,047 | 0,047 | 0,047 | 0,047 | 0,047 |
| C.1.2 | 0,036 | 0,036 | 0,036 | 0,036 | 0,036 | 0,036 | 0,036 | 0,036 | 0,036 | 0,036 | 0,036 | 0,036 | 0,036 | 0,036 | 0,036 | 0,036 | 0,036 | 0,036 | 0,036 | 0,036 | 0,036 | 0,036 | 0,036 | 0,036 | 0,036 | 0,036 | 0,036 | |
| C.2 | C.2.1 | 0,037 | 0,037 | 0,037 | 0,037 | 0,037 | 0,037 | 0,037 | 0,037 | 0,037 | 0,037 | 0,037 | 0,037 | 0,037 | 0,037 | 0,037 | 0,037 | 0,037 | 0,037 | 0,037 | 0,037 | 0,037 | 0,037 | 0,037 | 0,037 | 0,037 | 0,037 | 0,037 |
| C.2.2 | 0,048 | 0,048 | 0,048 | 0,048 | 0,048 | 0,048 | 0,048 | 0,048 | 0,048 | 0,048 | 0,048 | 0,048 | 0,048 | 0,048 | 0,048 | 0,048 | 0,048 | 0,048 | 0,048 | 0,048 | 0,048 | 0,048 | 0,048 | 0,048 | 0,048 | 0,048 | 0,048 | |
| C.3 | C.3.1 | 0,049 | 0,049 | 0,049 | 0,049 | 0,049 | 0,049 | 0,049 | 0,049 | 0,049 | 0,049 | 0,049 | 0,049 | 0,049 | 0,049 | 0,049 | 0,049 | 0,049 | 0,049 | 0,049 | 0,049 | 0,049 | 0,049 | 0,049 | 0,049 | 0,049 | 0,049 | 0,049 |
| C.3.2 | 0,047 | 0,047 | 0,047 | 0,047 | 0,047 | 0,047 | 0,047 | 0,047 | 0,047 | 0,047 | 0,047 | 0,047 | 0,047 | 0,047 | 0,047 | 0,047 | 0,047 | 0,047 | 0,047 | 0,047 | 0,047 | 0,047 | 0,047 | 0,047 | 0,047 | 0,047 | 0,047 | |
| C.4 | C.4.1 | 0,055 | 0,055 | 0,055 | 0,055 | 0,055 | 0,055 | 0,055 | 0,055 | 0,055 | 0,055 | 0,055 | 0,055 | 0,055 | 0,055 | 0,055 | 0,055 | 0,055 | 0,055 | 0,055 | 0,055 | 0,055 | 0,055 | 0,055 | 0,055 | 0,055 | 0,055 | 0,055 |
| C.4.2 | 0,051 | 0,051 | 0,051 | 0,051 | 0,051 | 0,051 | 0,051 | 0,051 | 0,051 | 0,051 | 0,051 | 0,051 | 0,051 | 0,051 | 0,051 | 0,051 | 0,051 | 0,051 | 0,051 | 0,051 | 0,051 | 0,051 | 0,051 | 0,051 | 0,051 | 0,051 | 0,051 | |
| C.5 | C.5.1 | 0,047 | 0,047 | 0,047 | 0,047 | 0,047 | 0,047 | 0,047 | 0,047 | 0,047 | 0,047 | 0,047 | 0,047 | 0,047 | 0,047 | 0,047 | 0,047 | 0,047 | 0,047 | 0,047 | 0,047 | 0,047 | 0,047 | 0,047 | 0,047 | 0,047 | 0,047 | 0,047 |
| C.5.2 | 0,054 | 0,054 | 0,054 | 0,054 | 0,054 | 0,054 | 0,054 | 0,054 | 0,054 | 0,054 | 0,054 | 0,054 | 0,054 | 0,054 | 0,054 | 0,054 | 0,054 | 0,054 | 0,054 | 0,054 | 0,054 | 0,054 | 0,054 | 0,054 | 0,054 | 0,054 | 0,054 | |
| C.6 | C.6.1 | 0,049 | 0,049 | 0,049 | 0,049 | 0,049 | 0,049 | 0,049 | 0,049 | 0,049 | 0,049 | 0,049 | 0,049 | 0,049 | 0,049 | 0,049 | 0,049 | 0,049 | 0,049 | 0,049 | 0,049 | 0,049 | 0,049 | 0,049 | 0,049 | 0,049 | 0,049 | 0,049 |
| C.6.2 | 0,043 | 0,043 | 0,043 | 0,043 | 0,043 | 0,043 | 0,043 | 0,043 | 0,043 | 0,043 | 0,043 | 0,043 | 0,043 | 0,043 | 0,043 | 0,043 | 0,043 | 0,043 | 0,043 | 0,043 | 0,043 | 0,043 | 0,043 | 0,043 | 0,043 | 0,043 | 0,043 | |
| C.7 | C.7.1 | 0,068 | 0,068 | 0,068 | 0,068 | 0,068 | 0,068 | 0,068 | 0,068 | 0,068 | 0,068 | 0,068 | 0,068 | 0,068 | 0,068 | 0,068 | 0,068 | 0,068 | 0,068 | 0,068 | 0,068 | 0,068 | 0,068 | 0,068 | 0,068 | 0,068 | 0,068 | 0,068 |
| C.7.2 | 0,048 | 0,048 | 0,048 | 0,048 | 0,048 | 0,048 | 0,048 | 0,048 | 0,048 | 0,048 | 0,048 | 0,048 | 0,048 | 0,048 | 0,048 | 0,048 | 0,048 | 0,048 | 0,048 | 0,048 | 0,048 | 0,048 | 0,048 | 0,048 | 0,048 | 0,048 | 0,048 | |
| C.8 | C.8.1 | 0,064 | 0,064 | 0,064 | 0,064 | 0,064 | 0,064 | 0,064 | 0,064 | 0,064 | 0,064 | 0,064 | 0,064 | 0,064 | 0,064 | 0,064 | 0,064 | 0,064 | 0,064 | 0,064 | 0,064 | 0,064 | 0,064 | 0,064 | 0,064 | 0,064 | 0,064 | 0,064 |
| C.8.2 | 0,039 | 0,039 | 0,039 | 0,039 | 0,039 | 0,039 | 0,039 | 0,039 | 0,039 | 0,039 | 0,039 | 0,039 | 0,039 | 0,039 | 0,039 | 0,039 | 0,039 | 0,039 | 0,039 | 0,039 | 0,039 | 0,039 | 0,039 | 0,039 | 0,039 | 0,039 | 0,039 | |
| C.9 | C.9.1 | 0,055 | 0,055 | 0,055 | 0,055 | 0,055 | 0,055 | 0,055 | 0,055 | 0,055 | 0,055 | 0,055 | 0,055 | 0,055 | 0,055 | 0,055 | 0,055 | 0,055 | 0,055 | 0,055 | 0,055 | 0,055 | 0,055 | 0,055 | 0,055 | 0,055 | 0,055 | 0,055 |
| C.9.2 | 0,053 | 0,053 | 0,053 | 0,053 | 0,053 | 0,053 | 0,053 | 0,053 | 0,053 | 0,053 | 0,053 | 0,053 | 0,053 | 0,053 | 0,053 | 0,053 | 0,053 | 0,053 | 0,053 | 0,053 | 0,053 | 0,053 | 0,053 | 0,053 | 0,053 | 0,053 | 0,053 | |
| E | E.1 | 0,011 | 0,011 | 0,011 | 0,011 | 0,011 | 0,011 | 0,011 | 0,011 | 0,011 | 0,011 | 0,011 | 0,011 | 0,011 | 0,011 | 0,011 | 0,011 | 0,011 | 0,011 | 0,011 | 0,011 | 0,011 | 0,011 | 0,011 | 0,011 | 0,011 | 0,011 | 0,011 |
| E.2 | 0,014 | 0,014 | 0,014 | 0,014 | 0,014 | 0,014 | 0,014 | 0,014 | 0,014 | 0,014 | 0,014 | 0,014 | 0,014 | 0,014 | 0,014 | 0,014 | 0,014 | 0,014 | 0,014 | 0,014 | 0,014 | 0,014 | 0,014 | 0,014 | 0,014 | 0,014 | 0,014 | |
| E.3 | 0,014 | 0,014 | 0,014 | 0,014 | 0,014 | 0,014 | 0,014 | 0,014 | 0,014 | 0,014 | 0,014 | 0,014 | 0,014 | 0,014 | 0,014 | 0,014 | 0,014 | 0,014 | 0,014 | 0,014 | 0,014 | 0,014 | 0,014 | 0,014 | 0,014 | 0,014 | 0,014 | |
| E.4 | 0,014 | 0,014 | 0,014 | 0,014 | 0,014 | 0,014 | 0,014 | 0,014 | 0,014 | 0,014 | 0,014 | 0,014 | 0,014 | 0,014 | 0,014 | 0,014 | 0,014 | 0,014 | 0,014 | 0,014 | 0,014 | 0,014 | 0,014 | 0,014 | 0,014 | 0,014 | 0,014 | |
| E.5 | 0,013 | 0,013 | 0,013 | 0,013 | 0,013 | 0,013 | 0,013 | 0,013 | 0,013 | 0,013 | 0,013 | 0,013 | 0,013 | 0,013 | 0,013 | 0,013 | 0,013 | 0,013 | 0,013 | 0,013 | 0,013 | 0,013 | 0,013 | 0,013 | 0,013 | 0,013 | 0,013 | |
| E.6 | 0,014 | 0,014 | 0,014 | 0,014 | 0,014 | 0,014 | 0,014 | 0,014 | 0,014 | 0,014 | 0,014 | 0,014 | 0,014 | 0,014 | 0,014 | 0,014 | 0,014 | 0,014 | 0,014 | 0,014 | 0,014 | 0,014 | 0,014 | 0,014 | 0,014 | 0,014 | 0,014 | |
| E.7 | 0,009 | 0,009 | 0,009 | 0,009 | 0,009 | 0,009 | 0,009 | 0,009 | 0,009 | 0,009 | 0,009 | 0,009 | 0,009 | 0,009 | 0,009 | 0,009 | 0,009 | 0,009 | 0,009 | 0,009 | 0,009 | 0,009 | 0,009 | 0,009 | 0,009 | 0,009 | 0,009 | |
| E.8 | 0,011 | 0,011 | 0,011 | 0,011 | 0,011 | 0,011 | 0,011 | 0,011 | 0,011 | 0,011 | 0,011 | 0,011 | 0,011 | 0,011 | 0,011 | 0,011 | 0,011 | 0,011 | 0,011 | 0,011 | 0,011 | 0,011 | 0,011 | 0,011 | 0,011 | 0,011 | 0,011 | |
| E.9 | 0,011 | 0,011 | 0,011 | 0,011 | 0,011 | 0,011 | 0,011 | 0,011 | 0,011 | 0,011 | 0,011 | 0,011 | 0,011 | 0,011 | 0,011 | 0,011 | 0,011 | 0,011 | 0,011 | 0,011 | 0,011 | 0,011 | 0,011 | 0,011 | 0,011 | 0,011 | 0,011 | |
References
- Alsayegh, M. F.; Ditta, A.; Mahmood, Z.; Kouser, R. The Role of Sustainability Reporting and Governance in Achieving Sustainable Development Goals: An International Investigation. Sustainability (Switzerland) 2023, 15. [CrossRef]
- Meliá-Martí, E.; Mozas-Moral, A.; Bernal-Jurado, E.; Fernández-Uclés, D. Global efficiency and profitability: Cooperatives as social innovation agents vs. Joint stock companies in the agri-food sector. Journal of Innovation and Knowledge 2024, 9. [CrossRef]
- Temoso, O.; Myeki, L. W.; Motlhabane, C.; Asante, B. O.; Villano, R. A. The role of commercial agriculture in meeting sustainable development goals in South Africa: Evidence from municipal-level total factor productivity analysis. J Clean Prod 2024, 463, 142723. [CrossRef]
- Ajeigbe, K. B.; Ganda, F. Leveraging Food Security and Environmental Sustainability in Achieving Sustainable Development Goals: Evidence from a Global Perspective. Sustainability (Switzerland) 2024, 16. [CrossRef]
- Neumann, R.; Mehlkop, G. Revisiting farmers markets – Disentangling preferences and conditions of food purchases on countrywide data from Germany. Food Qual Prefer 2023, 106. [CrossRef]
- Manser, G. M. Systematizing authenticity and codifying values: The role of values, standards, and governance at farmers markets. J Rural Stud 2022, 96, 154–166. [CrossRef]
- Du, Y.-W.; Shang, Y.-X.; Li, C.-H. Hierarchical DEMATEL-DTP Method for Identifying Key Factors Affecting Plateau-Characteristic Agroecological Security. Sustainability 2025, 17, 5286. [CrossRef]
- Huang, H.; Heuninckx, S.; Macharis, C. 20 years review of the multi actor multi criteria analysis (MAMCA) framework: a proposition of a systematic guideline. Ann Oper Res 2024. [CrossRef]
- Nguyen, Q. L. H. T. T.; Nguyen, P. T.; Huynh, V. DB; Nguyen, L. T. Application Chang’s extent analysis method for ranking barriers in the e-learning model based on multi-stakeholder decision making. Universal Journal of Educational Research 2020, 8, 1759–1766. [CrossRef]
- Moreno-Solaz, H.; Artacho-Ramírez, M. TO.; Aragonés-Beltrán, P.; Cloquell-Ballester, V. A. Sustainable selection of waste collection trucks considering feasible future scenarios by applying the stratified best and worst method. Heliyon 2023, 9. [CrossRef]
- Chaves Ávila, R.; Luis, J.; Campos, M. Cooperative enterprises and social and solidarity economy entities; Valencia, 2018.
- Putnam, R. D. Bowling alone: The collapse and revival of American community; Simon and Schuster: New York, 2000.
- Ostrom, Elinor. Governing the commons: the evolution of institutions for collective action; Cambridge University Press: New York, 1990.
- Dagnino; Evelina Power to the people?: (con-) tested civil society in search of democracy; Heidi Moksnes and Mia Melin, Ed.; Uppsala Center for Sustainable Development, 2010.
- Šeremešić, S. Agroecological terroir: An approach for scaling-out local food systems. Landbauforschung (Braunschw) 2020, 70, 43–48.
- Neumann, R.; Mehlkop, G. Revisiting farmers markets – Disentangling preferences and conditions of food purchases on countrywide data from Germany. Food Qual Prefer 2023, 106. [CrossRef]
- Saaty, L. T. The analytical hierarchy process. planning, priority setting, resource allocation; McGraw-Hill International Book Company, 1980.
- Saaty, T. L. Relative Measurement and Its Generalization in Decision Making Why Pairwise Comparisons are Central in Mathematics for the Measurement of Intangible Factors The Analytic Hierarchy/Network Process (To the Memory of my Beloved Friend Professor Sixto Rios Garcia); 2008; Vol. 102.
- Kuo, T. C.; Hsu, C. W.; Li, J. AND. Developing a green supplier selection model by using the DANP with VIKOR. Sustainability (Switzerland) 2015, 7, 1661–1689. [CrossRef]
- Dewi, A. C.; Zagloel, T. AND. M.; Ardi, R. A Novel Model for Sustainable Supplier Selection in the Paint and Coating Industry. Sustainability (Switzerland) 2024, 16. [CrossRef]
- Tsai, C. J.; Shyr, W. J. Using the DEMATEL Method to Explore Influencing Factors for Video Communication and Visual Perceptions in Social Media. Sustainability (Switzerland) 2022, 14. [CrossRef]
- Liu, J.; Feng, Y.; Zhu, Q. Involving second-tier suppliers in Green supply chain management: drivers and heterogenous understandings by firms along supply chains. Int J Prod Res 2023, 61, 4765–4785. [CrossRef]
- Manser, G. M. Systematizing authenticity and codifying values: The role of values, standards, and governance at farmers markets. J Rural Stud 2022, 96, 154–166. [CrossRef]
- Gómez, W. A.; Aranda-Camacho, Y.; Barrientos, J. Card Analytical model to assess the functionality of small farmers’ organizations. Agricultural Economics and Natural Resources 2020, 20, 7–35. [CrossRef]
- García Guerrero, J. E.; López, R. R.; González, A. L.; Ceular-Villamandos, N. Indigenous peoples, exclusion and precarious work: Design of strategies to address poverty in indigenous and peasant populations in Ecuador through the swot-ahp methodology. Int J Environ Res Public Health 2021, 18, 1–20. [CrossRef]
- Bryson, J. M. What to do when stakeholders matter: Stakeholder Identification and analysis techniques. Public Management Review 2004, 6, 21–53.
- Frija, A.; Sghaier, M.; Fetoui, M.; Dhehibi, B.; Sghaier, M. Pathways for improving rangeland governance under constraining land tenure systems: Application of a participatory Bayesian Belief approach. Land use policy 2023, 126. [CrossRef]
- Vasile. M.; Duncan. J. We want to be part of the broader project’ Family Farmers and Local Food Governance in Porto Alegre, Brazil. Built Environment 2017, 43, 390–401. [CrossRef]
- Rowe, G.; Wright, G. The Delphi technique: Past, present, and future prospects - Introduction to the special issue. Technol Forecast Soc Change 2011, 78, 1487–1490.
- Hasson, F.; Keeney, S.; McKenna, H. Research guidelines for the Delphi survey technique. J Adv Nurs 2000, 32, 1008–1015. [CrossRef]
- Osabohien, R.; Matthew, O.; Gershon, O.; Ogunbiyi, T.; Nwosu, E. Agricultural Development, Employment Generation and Poverty Reduction in West Africa. Open Agric J 2019, 13, 82–89. [CrossRef]
- Šeremešić, S.; Dolijanović, Ž.; Tomaš Simin, M.; Milašinović Šeremešić, M.; Vojnov, B.; Brankov, T.; Rajković, M. Articulating Organic Agriculture and Sustainable Development Goals: Serbia Case Study. Sustainability (Switzerland) 2024, 16. [CrossRef]
- Greenwald, H. P.; Tao, E.; Tilley, G. Farmers’ Market Incentives for Low-Income Families: Who Uses, How Much, and Why. Am J Prev Med 2022, 62, 864–871.
- Ismail, M. S.; Cuite, C. L. Serving Homebound Seniors: In-Home Senior Farmers’ Market Nutrition Program Enrollment and Fresh Fruit and Vegetable Home Delivery for Homebound Seniors in Central New Jersey. Journal of Human Sciences and Extension 2020.
- Cao, J.; Solangi, Y. A. Analyzing and Prioritizing the Barriers and Solutions of Sustainable Agriculture for Promoting Sustainable Development Goals in China. Sustainability (Switzerland) 2023, 15. [CrossRef]
- UN Women Why gender equality matters across all SDGS. Turning promises into action: gender equality in the 2030 Agenda for Sustainable Development; UN Women: New York, 2018.
- Amiri, H.; Pourebrahim, S.; Danehkar, A.; Mokhtar, M. Bin Location-based planning for sustainable agro-processing industries using land suitability assessment and DANP-VIKOR technique. Arabian Journal of Geosciences 2020, 13. [CrossRef]
- Alsayegh, M. F.; Ditta, A.; Mahmood, Z.; Kouser, R. The Role of Sustainability Reporting and Governance in Achieving Sustainable Development Goals: An International Investigation. Sustainability (Switzerland) 2023, 15. [CrossRef]
- León-Camargo, A.; Garay-Rodríguez, S. Health Project Prioritization in Meta, Colombia, Using Anp-Dematel. Applied Sciences 2025, 15, 7029. [CrossRef]
- Godet, M. Laboratoire d’Investigation Prospective et Stratégique. Zuatzu Business Park- Donostia-San Sebastián January 2007, pp. 1–106.
- Development Planning in Latin America and the Caribbean: Approaches, Experiences, and Perspectives; Máttar J., C. L. M., Ed.; ECLAC, Ministry of Foreign Affairs, 2017. Torkayesh, A. AND.; Malmir, B.; Rajabi Asadabadi, M. Sustainable waste disposal technology selection: The stratified best-worst multi-criteria decision-making method. Waste Management 2021, 122, 100–112. [CrossRef]
- Rezaei, J. Best-worst multi-criteria decision-making method. Omega (United Kingdom) 2015, 53, 49–57. [CrossRef]
- Asadabadi, M. R. The stratified multi-criteria decision-making method. Knowl Based Syst 2018, 162, 115–123. [CrossRef]
- Forman, E.; Peniwati, K. Theory and Methodology Aggregating individual judgments and priorities with the Analytic Hierarchy Process; 1998; Vol. 108.
- Šeremešić, S.; Dolijanović, Ž.; Simin, M. T.; Vojnov, B.; Trbić, D.G. The future we want: Sustainable development goals fulfillment with organic agriculture. Problemy Ekorozwoju 2021, 16, 171–180. [CrossRef]
- Clark, P.; Martínez, L. Local alternatives to private agricultural certification in Ecuador: Broadening access to “new markets”? J Rural Stud 2016, 45, 292–302.
- Wedding, C. S.; Ekumah, B.; Isgren, E.; Akorsu, A. D.; Ato Armah, F.; Tetteh Hombey, C. Every farmer is a farmer? A critical analysis of the emergence and development of Peasant Farmers Association of Ghana. Geoforum 2024, 150. [CrossRef]
- Mendonça, P. M. E.; Grandé, H. M. Civil Society in Latin America: Experiments, Resilience, New Utopias. Voluntas 2023, 34, 900–910. [CrossRef]
- Nguyen, P.-H.; Nguyen, B.-T.; Nguyen, V.-T.; Nguyen, H.-P. A Hybrid GIS-DEMATEL Method to Analyze Land Suitability for Organic Farming: A Case Study from Vietnam. Journal of Southwest Jiaotong University 2020, 55. [CrossRef]
- Huang, J.; Li, L.; Jiang, P.; Zhang, S. DEMATEL-Based ANP Model for Identifying Critical Indicators in Sustainable Emergency Material Reserve Systems. Sustainability 2024, 16, 5263. [CrossRef]
Figure 1.
Decision-making process method.
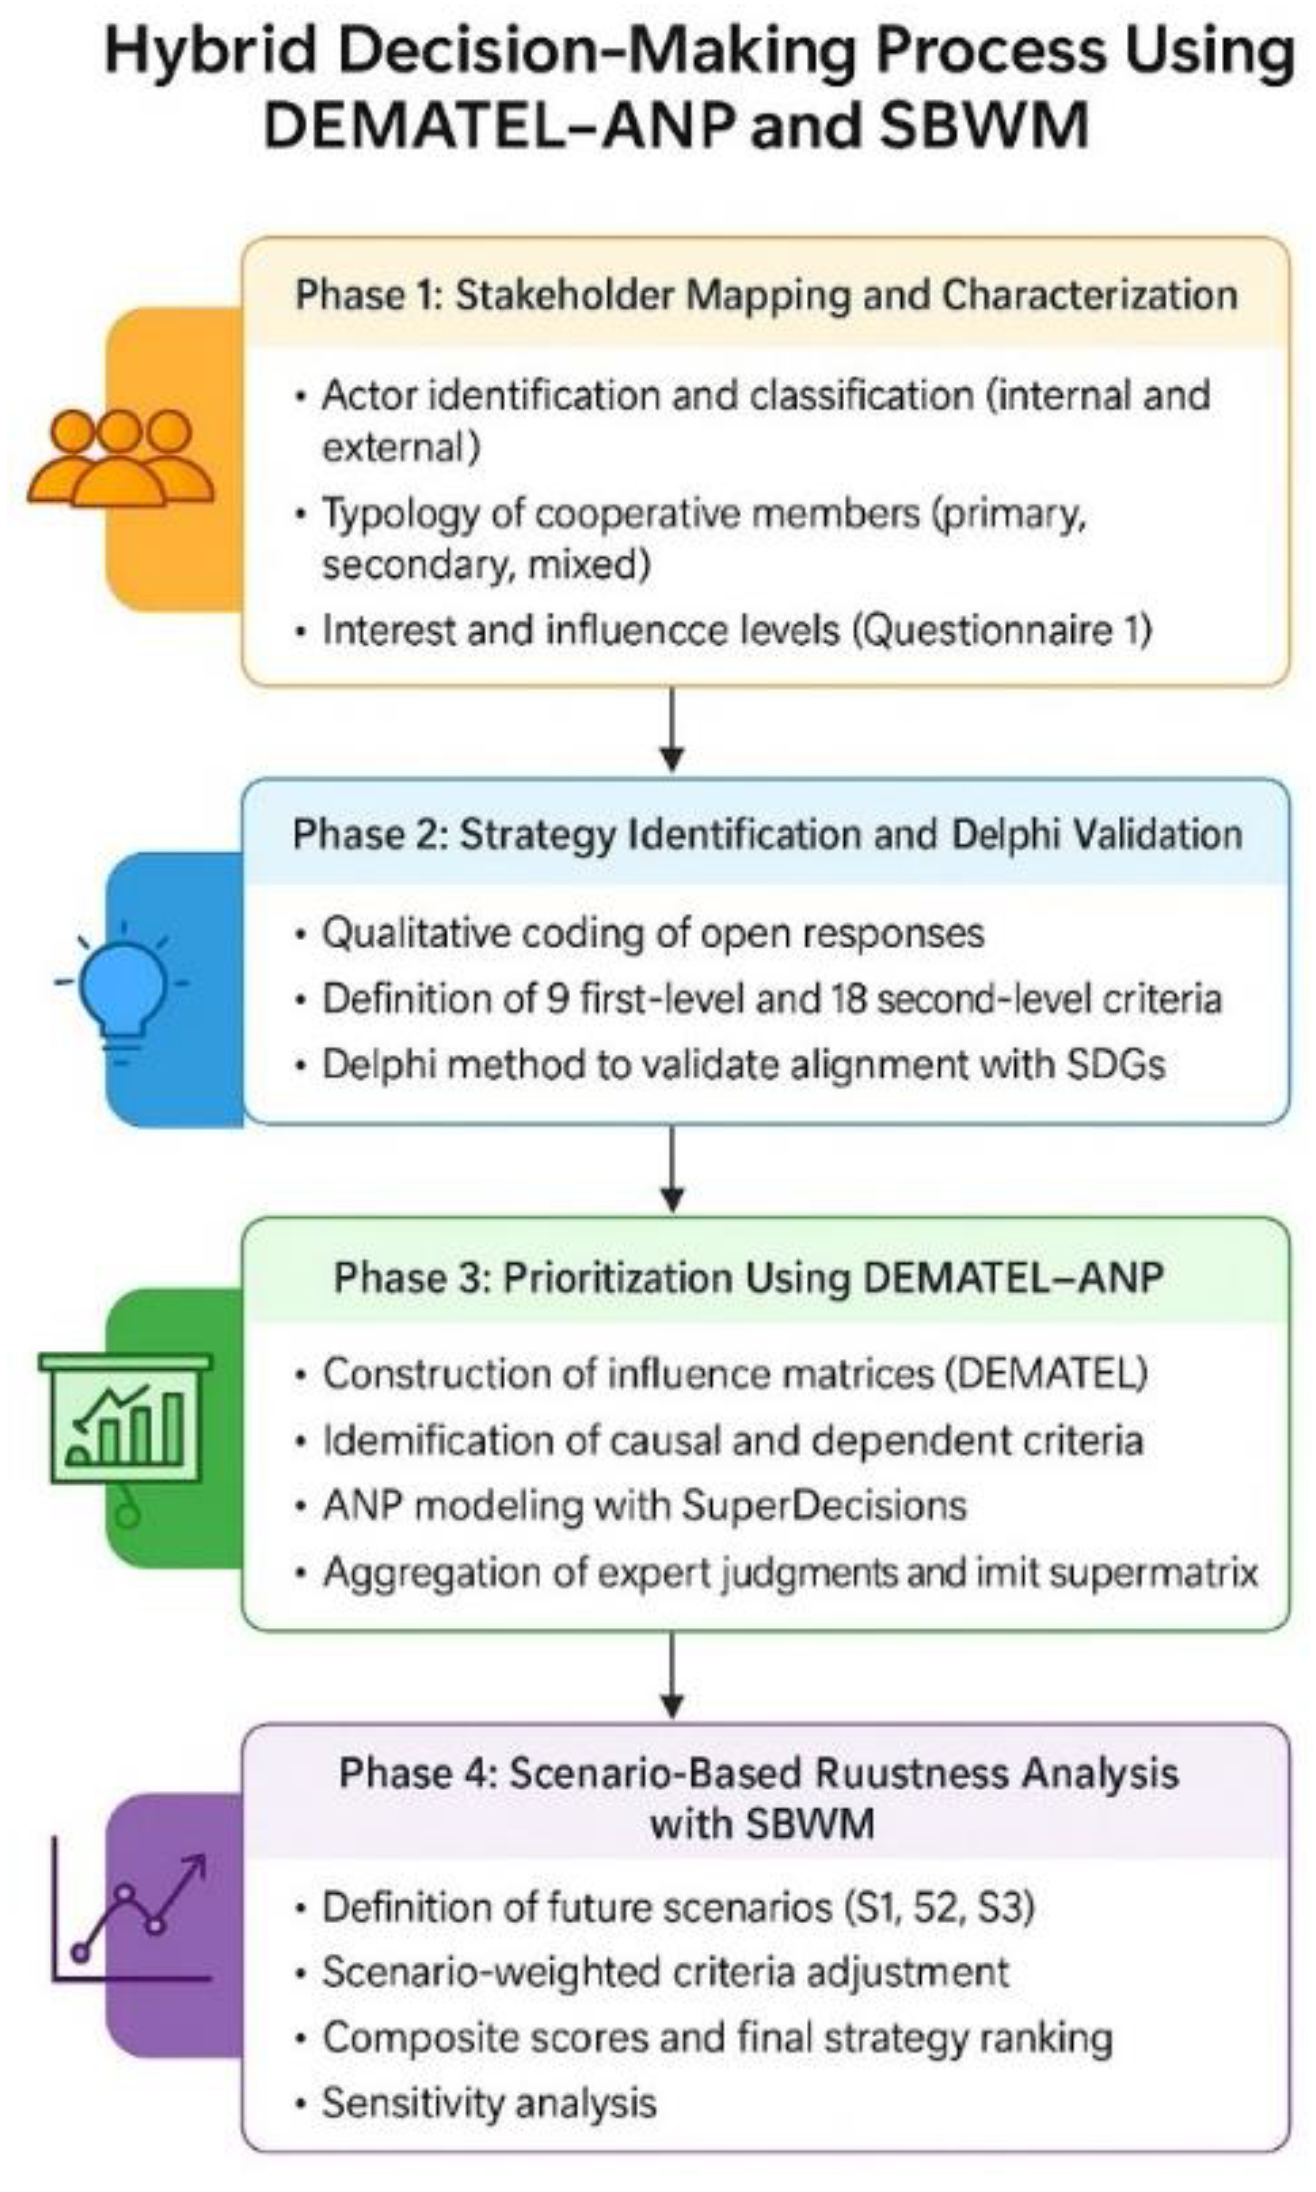
Figure 2.
Correspondence matrix between second-level criteria and the Sustainable Development Goals (SDGs) validated using the Delphi technique.
Figure 2.
Correspondence matrix between second-level criteria and the Sustainable Development Goals (SDGs) validated using the Delphi technique.
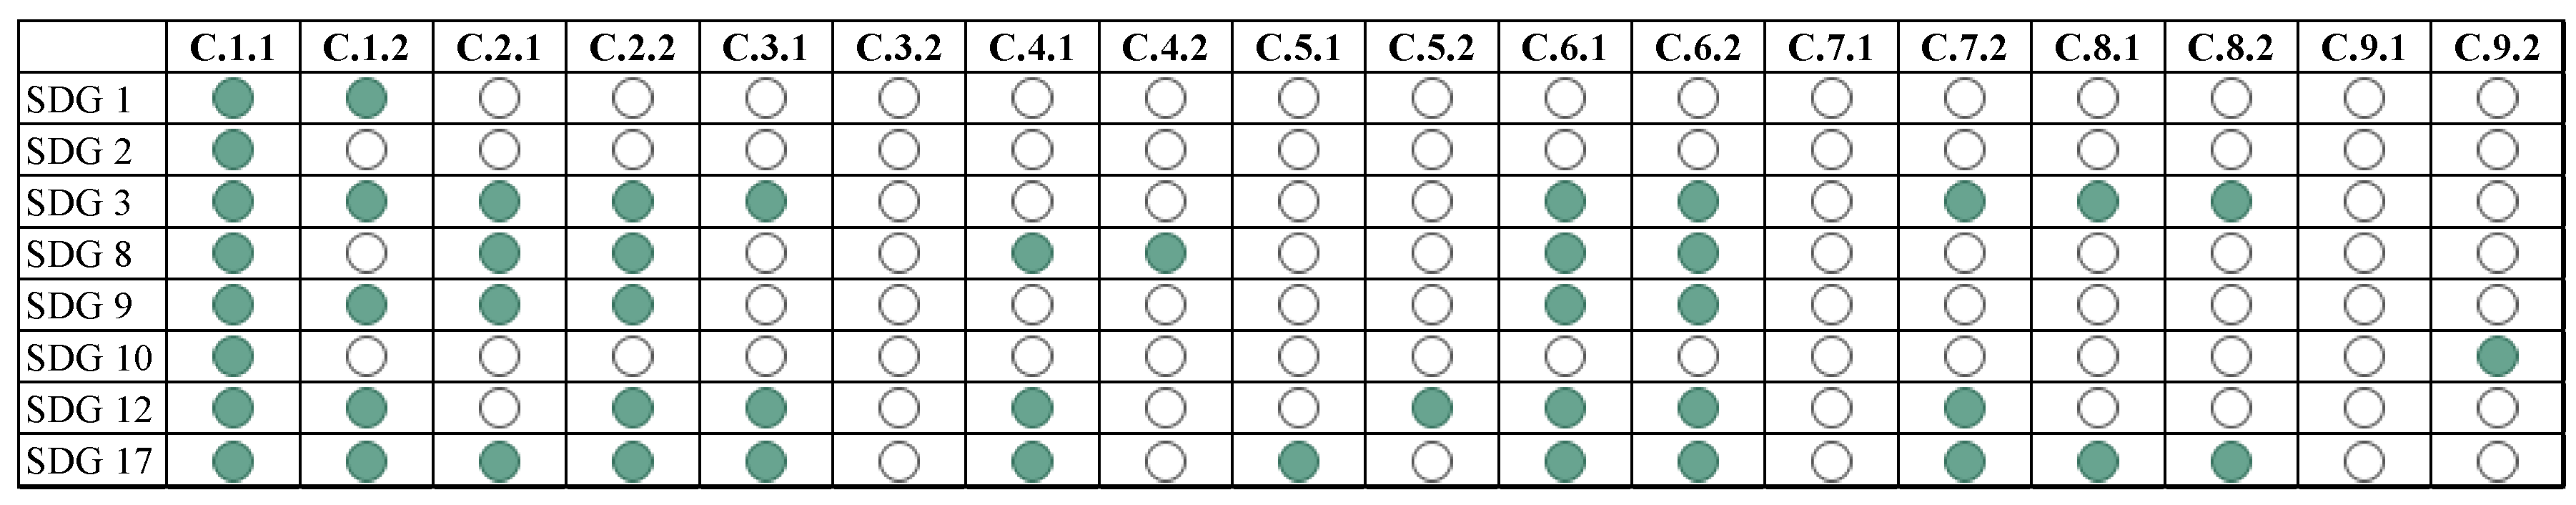
Figure 2.
Sensitivity of the strategies to the weight of criterion C.6.1.
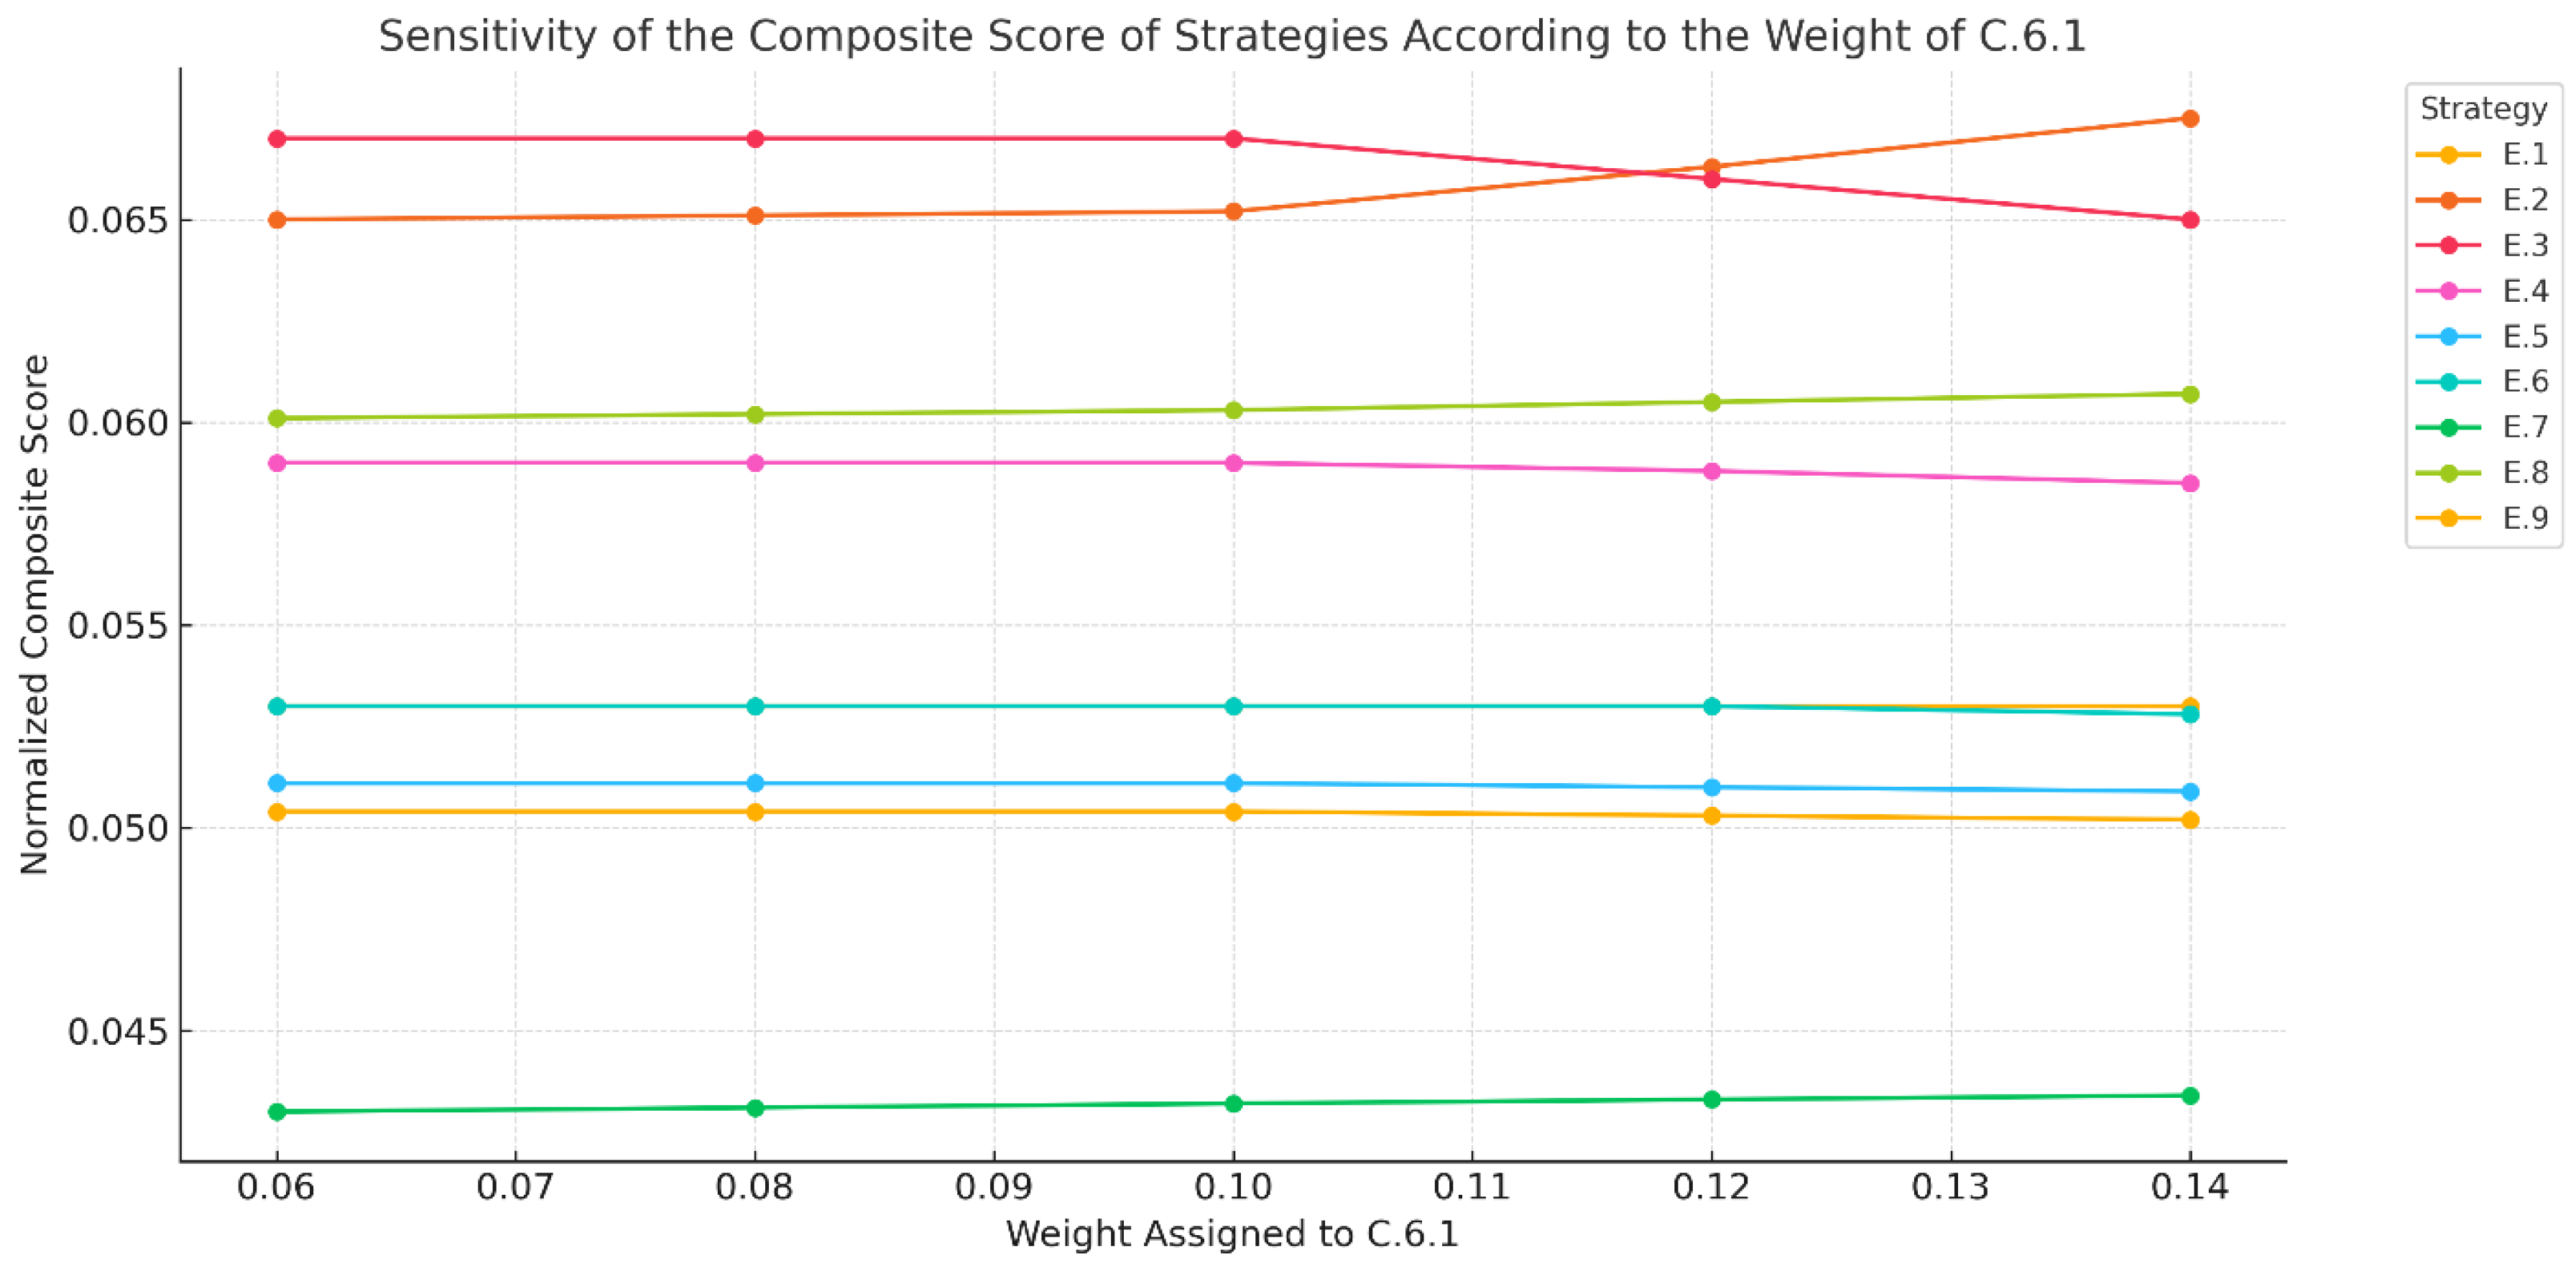
Table 1.
Definition of first and second level criteria.
| First level criterion | Second level criterion |
|---|---|
| C.1 Establishment of alliances with international and national farmers’ markets to identify and replicate their best practices in MercaOrinoquia | C.1.1 Developing alliances with farmers’ markets in other countries to identify their strengths and replicable processes |
| C.1.2 Establishing of alliances with farmers’ markets in other departments to identify their strengths and replicable processes | |
| C.2 Creation of a pilot plant for the development of food production | C.2.1 Implementing of a collection center to improve post-harvest and storage activities for products sold at farmers’ markets. |
| C.2.2 Executing the assembly of a pilot plant for the transformation of products sold in farmers’ markets. | |
| C.3 Development of joint working groups between FAO and public entities (Ministry of Agriculture, Health, Trade and Culture) | C.3.1 Creating a national plan for standardization of processing and marketing of farmers’ markets |
| C.3.2 Developing work between agencies in order to achieve the strengthening of quality, productivity and competitiveness competencies of the members of MercaOrinoquia | |
| C.4 Strengthening the local public procurement component in alliance with MercaOrinoquia (solidarity public procurement) | C.4.1 Preparing a standard document for compliance with quality and safety standards regarding how products should be delivered to participate in solidarity public procurement |
| C.4.2 Developing a training and strengthening program in order to teach participants who wish to learn about the solidarity public procurement program | |
| C.5 Design of quality and safety documents | C.5.1 Designing protocols together with public entities that integrate safety and quality standards |
| C.5.2 Developing a quality and safety plan focused on agricultural food production | |
| C.6 Promotion of the development of new products based on native and ancestral foods of the region | C.6.1 Producing of food and non-food products with raw materials from the region, to increase its supply and implement marketing strategies for these new products |
| C.6.2 Creating a booklet with ancestral foods and a communication strategy to periodically inform about their preparation, history and farmers’ markets | |
| C.7 Expanding the visibility and sales of MercaOrinoquia products | C.7.1 Developing an attractive online presence for the farmers’ market, including the creation of an informative website, social media profiles, and targeted online advertising campaigns |
| C.7.2 Promoting local participation through advertising in traditional media such as newspapers, radio, and brochures distributed in the community. | |
| C.8 Promoting a participatory workshop titled “from seed to plate” | C.8.1 Promoting knowledge and application of sustainable practices in local agriculture, from seed selection to food preparation, to improve community nutrition and well-being |
| C.8.2 Creating a collective diagnosis of the main challenges faced by farmers’ markets from food production to sales in cities | |
| C.9 Acquisition of external funds for the cooperative | C.9.1 Formulating a business plan |
| C.9.2 Participating in financing programs |
Table 2.
List of strategies.
| Strategies |
|---|
| E.1 Cultural exchange. Exchange of knowledge and experiences in production and commercial activities. |
| E.2 Infrastructure development. Assembly of a collection center and design of a pilot plant for product processing. |
| E.3 Work tables. Spaces to coordinate actions with public and private entities. |
| E.4 Public procurement. Government strategy that ensures that public and private entities promoting local policies, programs, and projects acquire goods and services in the same locality where they operate, whether in rural areas, municipalities, or regions. |
| E.5 Safety and quality documents. Design of protocols and plans for quality and safety. |
| E.6 Preparation of ancestral foods |
| E.7 Marketing of products |
| E.8 Participatory workshop entitled “from seed to plate”. It is a concept that encompasses the entire process of food production and consumption, from planting to serving. |
| E.9 Acquisition of external funds for the cooperative |
Table 3.
Expert influence matrix 1 for groups with DEMATEL.
| C.1 | C.2 | C.3 | C.4 | C.5 | C.6 | C.7 | C.8 | C.9 | E | |
|---|---|---|---|---|---|---|---|---|---|---|
| C.1 | 0 | 0 | 3 | 1 | 4 | 5 | 4 | 3 | 2 | 5 |
| C.2 | 0 | 0 | 3 | 5 | 5 | 4 | 4 | 3 | 4 | 0 |
| C.3 | 2 | 3 | 0 | 4 | 3 | 3 | 3 | 3 | 5 | 4 |
| C.4 | 2 | 4 | 4 | 0 | 5 | 5 | 4 | 3 | 3 | 4 |
| C.5 | 3 | 3 | 4 | 3 | 0 | 1 | 4 | 4 | 4 | 5 |
| C.6 | 4 | 4 | 2 | 2 | 4 | 0 | 5 | 4 | 3 | 1 |
| C.7 | 3 | 4 | 5 | 4 | 4 | 5 | 0 | 4 | 3 | 4 |
| C.8 | 5 | 3 | 3 | 4 | 3 | 4 | 4 | 0 | 3 | 4 |
| C.9 | 3 | 4 | 5 | 4 | 4 | 4 | 3 | 4 | 0 | 4 |
| E | 4 | 4 | 4 | 4 | 4 | 4 | 4 | 4 | 4 | 0 |
Table 4.
Weighted matrix of expert 1.
| C.1 | C.2 | C.3 | C.4 | C.5 | |||||||
|---|---|---|---|---|---|---|---|---|---|---|---|
| C.1.1 | C.1.2 | C.2.1 | C.2.2 | C.3.1 | C.3.2 | C.4.1 | C.4.2 | C.5.1 | C.5.2 | ||
| C.1 | C.1.1 | 0.0000 | 0.0000 | 0.0000 | 0.0000 | 0.0505 | 0.0455 | 0.0184 | 0.0161 | 0.0556 | 0.0417 |
| C.1.2 | 0.0000 | 0.0000 | 0.0000 | 0.0000 | 0.0404 | 0.0455 | 0.0138 | 0.0161 | 0.0556 | 0.0694 | |
| C.2 | C.2.1 | 0.0000 | 0.0000 | 0.0000 | 0.0000 | 0.0455 | 0.0404 | 0.0806 | 0.0605 | 0.0595 | 0.0694 |
| C.2.2 | 0.0000 | 0.0000 | 0.0000 | 0.0000 | 0.0455 | 0.0505 | 0.0806 | 0.1008 | 0.0794 | 0.0694 | |
| C.3 | C.3.1 | 0.0427 | 0.0427 | 0.0647 | 0.0517 | 0.0000 | 0.0000 | 0.0645 | 0.0553 | 0.0417 | 0.0476 |
| C.3.2 | 0.0342 | 0.0342 | 0.0388 | 0.0517 | 0.0000 | 0.0000 | 0.0645 | 0.0737 | 0.0417 | 0.0357 | |
| C.4 | C.4.1 | 0.0385 | 0.0385 | 0.0613 | 0.0613 | 0.0673 | 0.0673 | 0.0000 | 0.0000 | 0.0794 | 0.0694 |
| C.4.2 | 0.0385 | 0.0385 | 0.0766 | 0.0766 | 0.0539 | 0.0539 | 0.0000 | 0.0000 | 0.0595 | 0.0694 | |
| C.5 | C.5.1 | 0.0513 | 0.0513 | 0.0460 | 0.0460 | 0.0673 | 0.0673 | 0.0538 | 0.0484 | 0.0000 | 0.0000 |
| C.5.2 | 0.0641 | 0.0641 | 0.0575 | 0.0575 | 0.0539 | 0.0539 | 0.0430 | 0.0484 | 0.0000 | 0.0000 | |
The full names and definitions of the criterion codes used in the table are presented in Table 1. The other criteria and strategies (C.6…E9) are not presented due to space.
Table 5.
Limit matrix.
| C.1 | C.2 | C.3 | C.4 | C.5 | |||||||
|---|---|---|---|---|---|---|---|---|---|---|---|
| C.1.1 | C.1.2 | C.2.1 | C.2.2 | C.3.1 | C.3.2 | C.4.1 | C.4.2 | C.5.1 | C.5.2 | ||
| C.1 | C.1.1 | 0.0000 | 0.0000 | 0.0000 | 0.0000 | 0.0505 | 0.0455 | 0.0184 | 0.0161 | 0.0556 | 0.0417 |
| C.1.2 | 0.0000 | 0.0000 | 0.0000 | 0.0000 | 0.0404 | 0.0455 | 0.0138 | 0.0161 | 0.0556 | 0.0694 | |
| C.2 | C.2.1 | 0.0000 | 0.0000 | 0.0000 | 0.0000 | 0.0455 | 0.0404 | 0.0806 | 0.0605 | 0.0595 | 0.0694 |
| C.2.2 | 0.0000 | 0.0000 | 0.0000 | 0.0000 | 0.0455 | 0.0505 | 0.0806 | 0.1008 | 0.0794 | 0.0694 | |
| C.3 | C.3.1 | 0.0427 | 0.0427 | 0.0647 | 0.0517 | 0.0000 | 0.0000 | 0.0645 | 0.0553 | 0.0417 | 0.0476 |
| C.3.2 | 0.0342 | 0.0342 | 0.0388 | 0.0517 | 0.0000 | 0.0000 | 0.0645 | 0.0737 | 0.0417 | 0.0357 | |
| C.4 | C.4.1 | 0.0385 | 0.0385 | 0.0613 | 0.0613 | 0.0673 | 0.0673 | 0.0000 | 0.0000 | 0.0794 | 0.0694 |
| C.4.2 | 0.0385 | 0.0385 | 0.0766 | 0.0766 | 0.0539 | 0.0539 | 0.0000 | 0.0000 | 0.0595 | 0.0694 | |
| C.5 | C.5.1 | 0.0513 | 0.0513 | 0.0460 | 0.0460 | 0.0673 | 0.0673 | 0.0538 | 0.0484 | 0.0000 | 0.0000 |
| C.5.2 | 0.0641 | 0.0641 | 0.0575 | 0.0575 | 0.0539 | 0.0539 | 0.0430 | 0.0484 | 0.0000 | 0.0000 | |
The full names and definitions of the criterion codes used are presented in Table 1. The other criteria and strategies (C.6…E9) are not presented due to space.
Table 6.
Overall weights of the second-level criteria aggregated using the Individual Judgment Aggregation (IJA) method.
Table 6.
Overall weights of the second-level criteria aggregated using the Individual Judgment Aggregation (IJA) method.
| Criteria | C.6.1 | C.2.1 | C.9.1 | C.6.2 | C.4.1 | C.2.2 | C.7.2 | C.9.2 | C.3.2 | C.4.2 | C.7.1 | C.3.1 | C.5.1 | C.1.1 | C.5.2 | C.8.1 | C.1.2 | C.8.2 |
|---|---|---|---|---|---|---|---|---|---|---|---|---|---|---|---|---|---|---|
| weights | 6,16% | 6,10% | 6,02% | 5,97% | 5,94% | 5,83% | 5,80% | 5,75% | 5,72% | 5,57% | 5,48% | 5,39% | 5,32% | 5,17% | 5,06% | 5,03% | 4,85% | 4,83% |
The full names and definitions of the criterion codes used are presented in Table 1.
Table 7.
Results of the SBWM optimization model for scenario S1.
| Criterion | AB (Best vs Cj) | AW (vs Worst Cj) | Weight w(k) | Restr. Best |wB−aBj* w(k) | | Restr. Worse |wj−ajW* w(k)| | Maximum |wB−aBj*wj|, |wj−ajW*w(k)| |
|---|---|---|---|---|---|---|
| C.1.1 | 5 | 6 | 0.0464 | 0.0328 | 0.0425 | 0.0425 |
| C.1.2 | 4 | 6 | 0.0649 | 0.0606 | 0.0239 | 0.0606 |
| C.2.1 | 5 | 7 | 0.0526 | 0.0639 | 0.0511 | 0.0639 |
| C.2.2 | 6 | 6 | 0.0433 | 0.0605 | 0.0456 | 0.0605 |
| C.3.1 | 6 | 6 | 0.0433 | 0.0605 | 0.0456 | 0.0605 |
| C.3.2 | 6 | 5 | 0.0433 | 0.0605 | 0.0308 | 0.0605 |
| C.4.1 | 7 | 7 | 0.0378 | 0.0658 | 0.0658 | 0.0658 |
| C.4.2 | 6 | 6 | 0.0433 | 0.0605 | 0.0456 | 0.0605 |
| C.5.1 | 5 | 6 | 0.0526 | 0.0639 | 0.0362 | 0.0639 |
| C.5.2 | 4 | 5 | 0.0649 | 0.0606 | 0.0091 | 0.0606 |
| C.6.1 | 1 | 9 | 0.1990 | 0.0000 | 0.0658 | 0.0658 |
| C.6.2 | 3 | 8 | 0.0528 | 0.0405 | 0.0656 | 0.0656 |
| C.7.1 | 4 | 5 | 0.0649 | 0.0606 | 0.0091 | 0.0606 |
| C.7.2 | 5 | 6 | 0.0530 | 0.0657 | 0.0359 | 0.0657 |
| C.8.1 | 7 | 4 | 0.0204 | 0.0566 | 0.0389 | 0.0566 |
| C.8.2 | 9 | 1 | 0.0148 | 0.0658 | 0.0000 | 0.0658 |
| C.9.1 | 5 | 5 | 0.0526 | 0.0638 | 0.0214 | 0.0638 |
| C.9.2 | 5 | 4 | 0.0503 | 0.0524 | 0.0089 | 0.0524 |
| Addition | 1,000 | ξ (must be minimized) | 0,0658 |
The full names and definitions of the criterion codes used are presented in Table 1.
Table 8.
Selection of extreme criteria and assessment of consistency by scenario under the SBWM method.
Table 8.
Selection of extreme criteria and assessment of consistency by scenario under the SBWM method.
| Scenery | Best judgment | Worst criterion | ξ | EN |
|---|---|---|---|---|
| S0 | C.6.1 | C.8.2 | NA | NA |
| S1 | C.6.1 | C.8.2 | 0.0658 | 0.0126 |
| S2 | C.1.2 | C.5.1 | 0.1143 | 0.0219 |
| S3 | C.9.1 | C.3.2 | 0.5605 | 0.1072 |
Table 9.
Optimal weights of the criteria.
| Criteria | C.1.1 | C.1.2 | C.2.1 | C.2.2 | C.3.1 | C.3.2 | C.4.1 | C.4.2 | C.5.1 | C.5.2 | C.6.1 | C.6.2 | C.7.1 | C.7.2 | C.8.1 | C.8.2 | C.9.1 | C.9.2 |
|---|---|---|---|---|---|---|---|---|---|---|---|---|---|---|---|---|---|---|
| Normalized W* | 0,259 | 0,050 | 0,045 | 0,023 | 0,030 | 0,044 | 0,031 | 0,037 | 0,021 | 0,029 | 0,108 | 0,086 | 0,045 | 0,054 | 0,033 | 0,037 | 0,038 | 0,031 |
The full names and definitions of the criterion codes used are presented in Table 1.
Table 10.
Normalized decision matrix of alternatives.
| Criterion | E1 | E2 | E3 | E4 | E5 | E6 | E7 | E8 | E9 |
|---|---|---|---|---|---|---|---|---|---|
| C.1.1 | 0,0525 | 0,1089 | 0,0836 | 0,0710 | 0,0186 | 0,0203 | 0,0070 | 0,0850 | 0,0621 |
| C.1.2 | 0,0992 | 0,0024 | 0,1108 | 0,0987 | 0,0253 | 0,0237 | 0,0220 | 0,0298 | 0,0542 |
| C.2.1 | 0,0605 | 0,0334 | 0,0699 | 0,0165 | 0,0348 | 0,0478 | 0,0546 | 0,0770 | 0,0206 |
| C.2.2 | 0,0720 | 0,0679 | 0,0053 | 0,0720 | 0,0203 | 0,0085 | 0,1136 | 0,0947 | 0,0835 |
| C.3.1 | 0,0427 | 0,0112 | 0,0782 | 0,0522 | 0,0145 | 0,0646 | 0,0041 | 0,0892 | 0,0267 |
| C.3.2 | 0,0928 | 0,0357 | 0,0594 | 0,0648 | 0,0220 | 0,1265 | 0,0928 | 0,0921 | 0,0924 |
| C.4.1 | 0,0838 | 0,1056 | 0,0101 | 0,0232 | 0,0054 | 0,0424 | 0,0465 | 0,0266 | 0,0856 |
| C.4.2 | 0,0500 | 0,0322 | 0,0620 | 0,0167 | 0,0956 | 0,0097 | 0,1182 | 0,0757 | 0,0205 |
| C.5.1 | 0,0008 | 0,0934 | 0,0807 | 0,0864 | 0,0919 | 0,0097 | 0,0429 | 0,0114 | 0,0891 |
| C.5.2 | 0,0873 | 0,0379 | 0,0073 | 0,0369 | 0,0388 | 0,0952 | 0,0763 | 0,0870 | 0,0488 |
| C.6.1 | 0,0168 | 0,0817 | 0,0869 | 0,0665 | 0,0919 | 0,0644 | 0,0626 | 0,0419 | 0,0026 |
| C.6.2 | 0,0151 | 0,0036 | 0,0727 | 0,0373 | 0,0606 | 0,1184 | 0,0299 | 0,0402 | 0,0780 |
| C.7.1 | 0,0321 | 0,0088 | 0,0331 | 0,0191 | 0,1108 | 0,1054 | 0,0758 | 0,0855 | 0,0830 |
| C.7.2 | 0,0261 | 0,1022 | 0,0616 | 0,0957 | 0,1068 | 0,0415 | 0,0132 | 0,0224 | 0,0441 |
| C.8.1 | 0,1146 | 0,0986 | 0,0008 | 0,0605 | 0,0498 | 0,0290 | 0,0144 | 0,0331 | 0,0974 |
| C.8.2 | 0,0453 | 0,0594 | 0,0803 | 0,0431 | 0,1158 | 0,1255 | 0,0301 | 0,0488 | 0,0311 |
| C.9.1 | 0,0399 | 0,0042 | 0,0696 | 0,0596 | 0,0061 | 0,0363 | 0,1088 | 0,0235 | 0,0150 |
|
C.9.2 |
0,0686 | 0,1129 | 0,0277 | 0,0797 | 0,0908 | 0,0310 | 0,0872 | 0,0361 | 0,0653 |
The full names and definitions of the criterion codes used are presented in Table 1.
Table 11.
Prioritized strategies with ANP-DEMATEL and SBWM.
| ANP-DEMATEL | SWBM | ||
|---|---|---|---|
| Strategies | Weights | Strategies | Weights |
| E.2 | 0,1299 | E3 | 0,0669 |
| E.6 | 0,1278 | E2 | 0,0649 |
| E.3 | 0,1237 | E8 | 0,0602 |
| E.4 | 0,1228 | E4 | 0,0591 |
| E.5 | 0,1180 | E9 | 0,0532 |
| E.1 | 0,1041 | E6 | 0,0530 |
| E.9 | 0,0966 | E5 | 0,0511 |
| E.8 | 0,0957 | E1 | 0,0503 |
| E.7 | 0,0815 | E7 | 0,0430 |
The full names and definitions of the Strategies codes used are presented in Table 2.
Disclaimer/Publisher’s Note: The statements, opinions and data contained in all publications are solely those of the individual author(s) and contributor(s) and not of MDPI and/or the editor(s). MDPI and/or the editor(s) disclaim responsibility for any injury to people or property resulting from any ideas, methods, instructions or products referred to in the content. |
© 2025 by the authors. Licensee MDPI, Basel, Switzerland. This article is an open access article distributed under the terms and conditions of the Creative Commons Attribution (CC BY) license (http://creativecommons.org/licenses/by/4.0/).
Copyright: This open access article is published under a Creative Commons CC BY 4.0 license, which permit the free download, distribution, and reuse, provided that the author and preprint are cited in any reuse.


