Submitted:
09 April 2025
Posted:
09 April 2025
You are already at the latest version
Abstract
Triple-negative breast cancer (TNBC) is an aggressive breast cancer subtype with limited treatment options. While immune checkpoint inhibitors (ICIs) targeting PD-1/PD-L1 have shown clinical benefit, response rates remain variable, and mechanisms of resistance are not fully understood. Emerging evidence suggests that the tumor microbiome can influence immune responses and therapy outcomes. This study investigates the role of Staphylococcus aureus in modulating PD-L1 expression and immune evasion in TNBC. We examined the internalization, persistence, and functional impact of S. aureus in three TNBC cell lines (MDA-MB-468, MDA-MB-231, MDA-MB-453) and the non-tumorigenic MCF-12A breast epithelial cell line. Bacterial uptake and intracellular survival were assessed using an optimized gentamicin protection assay, colony-forming unit quantification, and transmission electron microscopy for up to seven days. Flow cytometry was used to analyze PD-L1 and TLR2 surface expression, while western blot assessed STAT1 activation. Cells were infected with viable S. aureus or treated with the TLR2 agonists S. aureus lipoteichoic acid and Pam3CSK4, a synthetic triacylated lipopeptide that specifically activates TLR2, alone or in combination with IFN-γ. Our findings demonstrate that S. aureus invades and persists within breast cells in a subtype-dependent manner. Notably, intracellular S. aureus, in the presence of IFN-γ, induces PD-L1 expression, contributing to immune checkpoint regulation. The degree of PD-L1 upregulation varied across TNBC subtypes, with MDA-MB-468 (basal-like) and MDA-MB-231 (mesenchymal stem-like) cells exhibiting the highest response. In MDA-MB-231 cells, which express high levels of TLR2, TLR2 agonists enhanced PD-L1 expression independently of IFN-γ. Across all cell lines, TLR2 agonists in combination with IFN-γ further increased PD-L1 expression, suggesting a synergistic effect between bacterial signaling and inflammatory pathways. These findings provide evidence that S. aureus modulates immune checkpoint pathways in TNBC, potentially contributing to immune evasion and ICI resistance. This highlights the need for further investigation into microbial influences on tumor progression and suggest that targeting bacterial interactions may enhance immunotherapy efficacy in TNBC.
Keywords:
Triple-negative breast cancer (TNBC)
; Staphylococcus aureus
; Intracellular bacteria
; Bacterial internalization
; PD-L1 expression
; Toll-like receptor 2 (TLR2)
; Immunotherapy
; Host-pathogen interaction
; Bacterial persistence
; Tumor microenvironment.
1. Introduction
Triple-negative breast cancer (TNBC) is an aggressive subtype defined by the absence of estrogen receptor, progesterone receptor, and human epidermal growth factor receptor 2 expression. Lacking targeted therapies, TNBC is associated with high recurrence rates and poor prognosis [1]. Molecular subtyping has further classified TNBC into biologically distinct groups, including basal-like (BL1 and BL2), mesenchymal, and luminal androgen receptor subtypes [2,3], each differing in proliferation rates, immune infiltration, and drug responsiveness.
Immunotherapy targeting the PD-1/PD-L1 immune checkpoint pathway has emerged as a promising approach for TNBC, particularly in patients with high PD-L1 expression [4,5]. PD-1, an immune checkpoint receptor on T cells, interacts with PD-L1 and PD-L2 to suppress immune responses, allowing tumor cells to evade immune detection [6,7]. Immune checkpoint inhibitors (ICIs) block this interaction, restoring T cell function and enhancing antitumor immunity [8]. In TNBC, PD-L1 expression is particularly elevated in basal-like and metastatic tumors [9], making ICIs such as pembrolizumab viable treatment options. However, response rates remain variable, and resistance mechanisms—such as alterations in the interferon-gamma (IFN-γ)/JAK-STAT pathway—pose significant challenges [10,11]. Identifying factors that modulate PD-L1 expression in TNBC is crucial for understanding immune evasion and improving therapeutic outcomes.
Recent studies have reported the presence of bacteria in breast tissue, including breast tumors [12,13,14,15,16,17,18,19,20,21,22,23]. Our meta-analysis of 11 studies using 16S rRNA sequencing on 1,260 fresh breast tissue samples identified Proteobacteria, Firmicutes, Actinobacteriota, and Bacteroidota as dominant phyla, with Staphylococcus and Corynebacterium frequently detected [24]. Notably, analysis of bulk RNA-sequencing data from The Cancer Genome Atlas Breast Cancer (TCGA-BRCA) cohort revealed that high Staphylococcus abundance was associated with proliferation-related gene expression programs and a 4.1-fold increased mortality risk. While microbial influences on tumor progression and therapy responsiveness are well recognized in high-biomass tumors such as colorectal and oral cancers [25,26], the role of bacteria in breast cancer remains poorly understood. Murine studies suggest that intracellular bacteria may promote metastasis [17,27,28,29,30,31], but their impact on immune infiltration and therapy responsiveness in TNBC is unclear.
Staphylococcus aureus, a facultative intracellular pathogen, can persist within host cells, evading immune surveillance and antibiotic treatment. Although traditionally considered extracellular, S. aureus has been detected within epithelial and immune cells, raising concerns about its potential role in cancer pathophysiology. Previous studies suggest that S. aureus toxins can modulate tumor cell proliferation and apoptosis [32], while heat-killed S. aureus and its α-hemolysin toxin have been shown to upregulate PD-L1 expression through Toll-like receptor 2 (TLR2) signaling in other cancer models [30,33]. However, whether S. aureus directly modulates immune checkpoint pathways in human TNBC remains unknown.
In this study, we investigated the internalization, persistence, and functional impact of S. aureus in human breast cells, including three TNBC cell lines—MDA-MB-468 (basal-like 1), MDA-MB-231 (mesenchymal stem-like), and MDA-MB-453 (luminal androgen receptor)—as well as the non-tumorigenic MCF-12A breast epithelial cell line. Using an optimized gentamicin protection assay and advanced imaging techniques, we assessed bacterial uptake and intracellular survival. We further examined the effects of intracellular S. aureus on host cell viability, proliferation, and immune checkpoint regulation, with a particular focus on PD-L1 expression, a key immunomodulatory protein in TNBC. Our results indicate that TLR2 activation by S. aureus enhances PD-L1 expression in a cell line-dependent manner, linking bacterial infection to immune evasion mechanisms. These findings suggest a potential role for S. aureus in modulating TNBC immune responses and highlight the need for further investigation into microbial influences on tumor progression and therapy resistance.
2. Materials and Methods
2.1. Reagents
Interferon gamma (IFN-γ) was purchased from BioLegend (San Diego, CA, USA, Cat# 570204). Purified S. aureus lipoteichoic acid (LTA) (Cat# tlrl-pslta) and the synthetic TLR2 agonist Pam3CSK4 (Cat# tlrl-pms) were obtained from InvivoGen (San Diego, CA, USA).
2.2. Breast Cell Lines
MDA-MB-468, MDA-MB-231, MDA-MB-453 and MCF-12A were obtained from American Type Culture Collection (ATCC, Manassas, VA, USA). MDA-MB-231, MDA-MB-468, and MDA-MB-453 were maintained in Dulbecco’s Modified Eagle’s Medium (DMEM) (Gibco, Thermo Fisher Scientific, Waltham, MA, USA; Cat# 12430062) supplemented with 10% fetal bovine serum (FBS) (Gibco, Thermo Fisher Scientific; Cat# 26140079) and 1% penicillin-streptomycin (Gibco, Thermo Fisher Scientific; Cat# 15140122). MCF-12A cells were maintained in a 1:1 mixture of DMEM and Ham's F12 (Gibco, Thermo Fisher Scientific; Cat# 11765054) supplemented with 20 ng/mL human epidermal growth factor (Sigma-Aldrich, St. Louis, MO, USA; Cat# 01-107), 100 ng/mL cholera toxin (Sigma-Aldrich; Cat# C8052), 0.01 mg/mL bovine insulin (Sigma-Aldrich; Cat# 16634), 500 ng/mL hydrocortisone (Sigma-Aldrich; Cat# H0888), 5% heat-inactivated horse serum (Sigma-Aldrich; Cat# H1138) and 1% penicillin-streptomycin.
2.3. Labelling of S. aureus with eFluor 450
The Staphylococcus aureus ATCC 25923 reference strain was initially cultured on Tryptone Soya Agar (TSA) (Oxoid, Thermo Fisher Scientific; Cat# CM0131). Colonies were then inoculated into 35 mL of Tryptone Soya Broth (TSB) (Oxoid, Thermo Fisher Scientific; Cat# CM0129) in 50 mL tubes and incubated overnight at 37°C under aerobic conditions with agitation (180 rpm). For fluorescent labeling, the overnight culture was adjusted to a concentration of 1.0 × 10⁹ colony-forming units per millilitre (CFU/mL), pelleted by centrifugation at 3,200 × g for 10 minutes, and washed three times with sterile, protein-free phosphate-buffered saline (PBS). The bacterial pellet was resuspended in 750 µL of 10 µM eBioscience Cell Proliferation Dye eFluor 450 (Invitrogen, Thermo Fisher Scientific, San Diego, CA, USA; Cat# 65-0842-90) (according to the protocol provided with the kit) and incubated at 37°C in the dark for 30 minutes with gentle agitation. Excess dye was quenched by incubating the labeled bacteria in DMEM containing 10% FBS for 10 minutes, followed by two additional PBS washes.
For infection, a bacterial suspension was prepared at McFarland standard 0.5, corresponding to approximately 1.5 × 10⁸ CFU/mL, and diluted in DMEM to achieve the desired multiplicity of infection (MOI) before being added to the cells.
2.4. Gentamicin Protection Assay
Breast cell lines were seeded at 1.5 x 10⁵ cells per well in 12-well plates and incubated overnight at 37°C in 5% CO2. The following day, cells were washed with Dulbecco’s Phosphate-Buffered Saline (DPBS) (Gibco, Thermo Fisher Scientific; Cat# 14190144) and infected with eFluor 450-labelled or unlabelled S. aureus in DMEM supplemented with 10% FBS, without antibiotics, at MOIs of 10, 50, or 200 for 2 hours at 37°C in 5% CO₂. To minimize photobleaching, infections were performed in the dark.
Following infection, cells were washed three times with sterile DPBS, incubated in DMEM supplemented with 10% FBS and 200 µg/mL gentamicin (Gibco, Thermo Fisher Scientific; Cat# 15750060200) for 1 hour, followed by two washes with DPBS to eliminate extracellular bacteria. Cells were then incubated in their respective maintenance medium supplemented with either 50 µg/mL gentamicin for 24-hour experiments, or 5 µg/mL gentamicin for experiments longer than 24 hours.
To verify the efficacy of gentamicin in eliminating extracellular bacteria, a minimum inhibitory concentration (MIC) assay was conducted following established protocols [34].
2.5. Measurement of S. aureus Internalization by Flow Cytometry
Breast cell lines were infected with unlabelled or eFluor 450-labelled S. aureus at MOIs of 10, 50 and 200 bacteria per cell. At 24- or 48-hours post-infection, the cells were detached using TrypLE Express Enzyme without phenol red (Gibco, Thermo Fisher Scientific; Cat# 12604021), centrifuged at 300 × g for 5 minutes, and washed twice with DPBS.
To distinguish viable from dead cells, 100 µL of ViaDye Red Fixable Viability Dye (Cytek Biosciences, Fremont, CA, USA, Cat# R7-60008) at a dilution of 1:100,000 in protein-free PBS was added. Cells were incubated in the dark for 20 minutes, followed by two washes with DPBS.
A minimum of 30,000 single-cell events per sample were acquired using a Cytek Aurora spectral flow cytometer (Cytek Biosciences). Cells that were positive for ViaDye Red Fixable Viability Dye were excluded from analysis. The percentage S. aureus-positive cells were determined by comparing eFluor 450 fluorescence intensity to that of cells infected with unlabelled bacteria. The intracellular bacterial load was quantified as the eFluor 450 geometric mean fluorescence intensity (GMFI). All analyses were preformed using FlowJo v10.10.0 (BD Biosciences, San Jose, CA, USA).
2.6. Clearance of Viable Intracellular S. aureus
To assess bacterial clearance, breast cell lines infected with S. aureus at MOIs of 50 and 200 were harvested daily for 7 days. Cells (3 x 10⁴) were lysed with 200 µL of 1% Triton X-100 for 5 minutes. The lysate was serially diluted in sterile PBS, plated onto TSA and incubated at 37°C for 24 hours. After incubation, the number of CFUs were counted, and bacterial concentration was calculated as CFU/mL using the formula: CFU/mL = (number of colonies × dilution factor) / volume plated (mL). At each time point, uninfected lysed cells were used as negative controls.
2.7. Transmission Electron Microscopy
Transmission electron microscopy (TEM) was used to confirm the presence and morphology of intracellular S. aureus within MDA-MB-231 cells. Cells were infected with a MOI of 200 and collected at 24 hours and 7 days post-infection. A total of 5 x 10⁵ cells were fixed in 800 µL of 4% paraformaldehyde and 1.25% glutaraldehyde in PBS with 4% sucrose, pH 7.2 for at least 24 hours at 4oC. Following fixation, cells were washed twice with PBS containing 4% sucrose for 10 minutes each, and then post-fixed in 2% osmium tetroxide for 1 hour on a rotator. Dehydration was performed using a graded ethanol series (70%, 95% and 100% ethanol, three changes of 20 minutes each), followed by 30 minutes in propylene oxide.
For resin infiltration, cells were incubated in a 1:1 mixture of propylene oxide and resin for 1 hour, followed by overnight incubation in 100% resin, and an additional 4-hour change in fresh 100% resin. Cells were then embedded in fresh resin and polymerized at 60°C for at least 48 hours.
After processing, 1 µm sections were cut using an ultramicrotome, stained with toluidine blue, and examined by brightfield microscopy to identify suitable regions for TEM imaging. Ultrathin sections (70 nm) were then cut, mounted on copper grids, and stained with 4% uranyl acetate and lead citrate. Imaging was performed using a Tecnai G2 Spirit 120kV TEM, and images acquired using an AMT digital camera with V7.0.1 software.
2.8. Cytotoxicity and Inhibition of Proliferation
Breast cells were infected with S. aureus at MOIs of 10, 50 and 200 for 2 hours. Uninfected cells served as controls. Following infection, cells were washed twice with sterile DPBS and incubated in DMEM supplemented with 10% FBS and 200 µg/mL gentamicin for 1 hour, following by 2 washes with DPBS and incubation with gentamycin 50 µg/mL for 2 hours. Cells were washed twice with DPBS, detached using TrypLE and counted. Cell counts were normalised to uninfected cells.
To assess the effect of S. aureus infection on cell proliferation, infected cells were seeded at a density of 3.3 × 10³ cells per well in 96-well plates (Corning Incorporated, NY, USA; Cat# 3696). Cells were then incubated in the respective maintenance media supplemented with 5 µg/mL gentamicin for 5 days and cell proliferation was assessed using a crystal violet staining assay, as previously described [35]. Proliferation of infected cells was compared to the uninfected controls.
S. aureus exoproteins were prepared as previously described [36]. Briefly, conditioned TSB from 15-hour S. aureus cultures was centrifuged at 4,000 × g for 10 minutes at 4°C to remove bacterial cells and filtered through a 0.22 μm Acrodisc syringe filter (Pall Corporation, Port Washington, NY, USA; Cat# 4525). Exoproteins were then concentrated using Pierce Protein Concentrators PES with a 3 kDa molecular weight cutoff (Thermo Fisher Scientific; Cat# 88512), and total protein content was quantified using the Pierce BCA Protein Assay Kit (Thermo Fisher Scientific; Cat# 23225). Serial dilutions of the exoproteins were prepared in the respective maintenance media supplemented with 5 µg/mL gentamicin. Cells were seeded at a density of 3.3 × 10³ cells per well in 96-well plates. The following day, the culture media was replaced with S. aureus exoproteins, and cells were treated for 5 days. Cell proliferation was assessed using a crystal violet staining assay, as previously described [35]. Proliferation in exoprotein treated cells was compared to untreated controls.
2.9. Expression of Cell Surface Markers Determined by Flow Cytometry
Cells were infected with various MOIs of unlabeled S. aureus as described previously. Following infection, both infected and uninfected control cells were treated with IFN-γ and incubated for 24 or 48 hours. In parallel, cells were also treated with TLR2 agonists for 24 hours, with or without IFN-γ, to evaluate the impact of TLR2 activation on cellular responses. As part of the control conditions, a subset of uninfected cells was maintained with and without IFN-γ treatment. The surface expression levels of PD-L1 and TLR2 were then measured by flow cytometry.
At the designated time points, 3 × 10⁵ cells from each group were harvested, washed twice with PBS, and stained with 100 µL of ViaDye Red Fixable Viability Dye (1:10,000 dilution). After staining, cells were washed twice with PBS and resuspended in ice-cold FACS buffer (1% FBS and 0.05% sodium azide in PBS).
To reduce non-specific antibody binding, cells were incubated with Human BD Fc Block (1:50 dilution; BD Pharmingen, San Jose, CA, USA; Cat# 564220) for 10 minutes at room temperature. Cells were then washed with FACS buffer prior to antibody staining.
Cells were stained in a final volume of 60 µL with the following antibodies, which were titrated before use to determine optimal dilution: PD-L1, Brilliant Violet 421 anti-human CD274 (1:20 dilution; BioLegend, San Diego, CA, USA; Cat# 329714); TLR2, PE/Cyanine7 anti-human CD282 Antibody (1:20 dilution; BioLegend; Cat# 309722). Cells were incubated in the dark at 4°C for 30 minutes, followed by fixation with 4% paraformaldehyde for 10 minutes. Cells were then washed twice with FACS buffer before flow cytometry analysis.
Flow cytometry was performed using the Cytek Aurora spectral flow cytometry, acquiring a minimum of 30,000 events per sample. Autofluorescence was controlled by including unstained cell controls containing unlabelled bacteria. Heat killed cells (60°C for 5 minutes) containing unlabelled bacteria served as a positive control for the live/dead Viability Dye. Single-stained controls (cells with unlabelled bacteria) were used for compensation and background correction. Marker expression was quantified using the GMFI. All analyses were preformed using FlowJo v10.10.0.
2.10. Western Blot
MDA-MB-468 and MDA-MB-231 were infected with S. aureus at MOI 50, while MDA-MB-453 and MCF-12A were infected at MOI 200, to maximize infection efficiency while maintaining high cell viability. After 24 hours, the cells were washed three times with cold DPBS and lysed using RIPA Lysis and Extraction Buffer (Thermo Fisher Scientific; Cat# 89900) supplemented with Halt Protease Inhibitor Cocktail (Thermo Fisher Scientific; Cat# 78438) and Halt Phosphatase Inhibitor Cocktail (Thermo Fisher Scientific; Cat# 78420). Lysates were homogenized by passage through a 26-gauge needle, and insoluble debris was removed by centrifugation at 17,000 × g for 15 minutes at 4°C. Total protein concentrations were determined using Pierce BCA Protein Assay Kit. Protein amounts of 30 µg and 40 µg were used for p-STAT1 and STAT1 detection, respectively. Proteins were separated by SDS-PAGE on 4–15% Mini-PROTEAN TGX Stain-Free Protein Gels (Bio-Rad Laboratories, Hercules, CA, USA; Cat# 4568084) and transferred onto 0.2 µm polyvinylidene difluoride (PVDF) membranes (Bio-Rad Cat# 1704156) using the Trans-Blot Turbo Transfer System (Bio-Rad). Membranes were blocked with 5% skim milk for at least 1 hour then incubated overnight at 4°C with primary antibodies at 1:1000 dilution in TBST with 0.1% skim milk powder. Primary antibodies were STAT1 monoclonal antibody (Thermo Fisher Scientific; Cat# MA5-15129, clone C.146.9), phospho-STAT1 (Tyr701) monoclonal antibody (Thermo Fisher Scientific; Cat# 33-3400, clone ST1P-11A5). After three washes with TBST, membranes were incubated for 1 hour with 1:1000 goat anti-mouse (H+L)-HRP conjugated secondary antibody (Bio-Rad; Cat# 1721011) and 1:10,000 Precision Protein StrepTactin-HRP conjugate (Bio-Rad; Cat# 1610380) in TBST supplemented with 1% skim milk powder. Detection was performed using Clarity Western ECL Blotting Substrate (Bio-Rad; Cat# 1705060) on a ChemiDoc Gel Imaging System (Bio-Rad). Image Lab Software v6.0.1 (Bio-Rad) was used for band quantification, with β-actin as the loading control for normalization [37].
2.11. Statistical Analysis
Statistical analyses were performed using Prism 10 for macOS (Version 10.4.0 (527), 23 October 2024; GraphPad Software Inc., La Jolla, CA, USA).
3. Results
3.1. Different Breast Cell Lines Exhibit Varying Capacity to Internalize S. aureus
We investigated the internalization of S. aureus ATCC 25923 across triple-negative breast cancer (TNBC) cell lines with distinct molecular subtypes: MDA-MB-468 (basal-like 1), MDA-MB-231 (mesenchymal stem-like), and MDA-MB-453 (luminal androgen receptor), as well as the non-tumorigenic MCF-12A breast epithelial cell line [2,38].
To distinguish intracellular from extracellular bacteria, we employed an optimized gentamicin protection assay (Figure S1). S. aureus was labeled with eFluor 450, enabling flow cytometry and fluorescence microscopy for bacterial tracking. The eFluor 450 labeling did not affect bacterial viability (Figure S1a), and bacterial sensitivity to antibiotics was confirmed via a minimum inhibitory concentration (MIC) assay (Figure S1b). The elimination of viable extracellular bacteria was validated using propidium iodide staining, which selectively labeled dead extracellular bacteria (Figure S1c). Transmission electron microscopy (TEM) further confirmed the intracellular localization of S. aureus (Figure S1d). The presence of viable intracellular bacteria was verified by plating lysed cell contents on agar 24 hours post-infection, which resulted in colony formation (Figure S1e). No colonies were detected in the culture media, confirming elimination of viable extracellular bacteria.
To assess internalization efficiency, breast cell lines were infected with eFluor 450-labeled S. aureus at multiplicities of infection (MOI) of 10, 50, and 200, and the proportion of viable cells harboring intracellular bacteria was quantified via flow cytometry 24 hours post-infection (Figure 1, Figure S2). Unlabeled S. aureus at comparable MOI did not significantly alter cellular autofluorescence (Figure S2).
Higher MOI correlated with an increased percentage of infected cells (Figure 1b, Table S1) and greater eFluor 450 GMFI (Figure 1c, Table S2), indicating a higher intracellular bacterial burden per cell. This trend was consistent across all cell lines, suggesting that S. aureus internalization is a general feature of both malignant and non-malignant breast epithelial cells in this model. However, internalization efficiency varied among cell lines, with MDA-MB-468 and MDA-MB-231 exhibiting the highest intracellular burdens at 24 hours post-infection (Figure 1b and Figure 1c).
At MOI 10, an average of 68% of MDA-MB-468 and 54% of MDA-MB-231 cells were infected, whereas MCF-12A and MDA-MB-453 exhibited significantly lower internalization rates (9% and 0.4%, respectively) (Figure 1c). At MOI 50 and 200, nearly all MDA-MB-468 and MDA-MB-231 cells were infected (>90%), while MCF-12A and MDA-MB-453 maintained significantly lower internalization rates (p < 0.0001) (Figure 1b, Table S1).
GMFI analysis, which estimates bacterial load per cell, revealed that MDA-MB-468 had a significantly higher GMFI than MDA-MB-231 across all MOIs, indicating a greater intracellular bacterial burden (p < 0.0001 for all) (Figure 1c, Table S2). MDA-MB-231 exhibited significantly higher GMFI than both MCF-12A and MDA-MB-453 (p < 0.0001 for all). Notably, despite MDA-MB-453 showing significantly lower susceptibility to S. aureus internalization (Figure 1b), its GMFI remained comparable to MCF-12A across all MOIs (Figure 1c).
The intracellular bacterial load per cell increased in parallel with the percentage of infected cells across all MOIs tested, highlighting a dose-dependent relationship between S. aureus internalization and intracellular burden (Figure 1d).
Overall, these findings highlight cell line-specific differences in S. aureus susceptibility and intracellular bacterial burden, with MDA-MB-468 and MDA-MB-231 demonstrating the highest bacterial uptake.
3.2. Intracellular S. aureus Clearance Varies in a Cell Line-Dependant Manner
Next, we evaluated intracellular S. aureus persistence by quantifying colony-forming units (CFUs) over seven days post-infection following treatment at MOI 50 (Figure 2a) and MOI 200 (Figure 2b). While bacterial loads declined across all cell lines, the clearance rate varied significantly.
At MOI 50, MDA-MB-231 exhibited the slowest clearance (slope: -0.86, 95% CI = -0.92 to –0.80), followed by MCF-12A (slope: -1.29, 95% CI = -1.41 to -1.18), MDA-MB-453 (slope: -1.38, 95% CI = -1.74 to –1.02), and MDA-MB-468, which showed the most rapid bacterial clearance (slope: -2.07, 95% CI = -2.29 to -1.86) (Figure 2a). A similar trend was observed at MOI 200, where MDA-MB-231 again exhibited the slowest clearance (slope: -0.66, 95% CI = -0.73 to -0.59), followed by MCF-12A (slope: -1.06, 95% CI = -1.18 to -0.94), MDA-MB-453 (slope: -1.29, 95% CI = -1.48 to -1.11), and MDA-MB-468, which demonstrated the fastest bacterial clearance (slope: -2.22, 95% CI = -2.74 to -1.70) (Figure 2b). Notably, while viable S. aureus was completely cleared from MDA-MB-231 by day 6 at MOI 50, viable bacteria persisted beyond day 7 at MOI 200.
Together, these findings indicate that intracellular S. aureus clearance is cell line-dependent, with some breast cancer cells exhibiting prolonged bacterial persistence, suggesting potential implications for intracellular bacterial survival and tumor microenvironment interactions. However, the relationship between internalization and clearance rates varied across cell lines, highlighting the complexity of bacterial-host interactions in breast cancer and epithelial cells.
3.3. Intracellular S. aureus Exists in Multiple Forms within Breast Cell Lines
To characterize the intracellular morphology of S. aureus in MDA-MB-231 cells, we performed TEM at 24 hours and 7 days post-infection (Figure 3).
At 24 hours post-infection, S. aureus was detected in both the cytoplasm and phagosomes (Figure 3a). In the cytoplasm, S. aureus was observed in three primary forms: (i) intact bacteria (Figure 3a), (ii) degraded bacteria (Figure 3a), and (iii) cell wall-deficient L-form bacteria (Figure 3b). Within phagosomes, bacteria exhibited two distinct morphologies: (i) those with partially detached cell walls (Figure 3a), and (ii) those with intact cell walls (Figure 3b).
By day 7 post-infection, intracellular S. aureus persisted in MDA-MB-231 cells in four distinct states: (i) intact bacteria within the cytoplasm (Figure 3d), (ii) L-form bacteria within the cytoplasm (Figure 3d), (iii) intact bacteria enclosed in phagosomes (Figure 3e), and (iv) fully degraded bacteria within phagosomes (Figure 3f). Notably, we observed bacterial division within phagosomes (Figure 3e), suggesting that S. aureus is capable of intracellular replication.
Collectively, these findings indicate that S. aureus adopts diverse intracellular morphologies within mesenchymal-like TNBC MDA-MB-231 cells. While some bacteria are sequestered and degraded within phagosomes, others persist in the cytoplasm, including L-forms, which may facilitate long-term survival and immune evasion within host cells.
3.4. S. aureus Induces Cell Line-Dependant Cytotoxicity and Inhibition of Proliferation of Breast Cell Lines
Given the observed differences in S. aureus internalization and clearance among cell lines, we next assessed its impact on cell viability and proliferation at MOIs of 10, 50, and 200. Cell viability was determined by cell counting post-infection, while long-term effects on proliferation were assessed using a crystal violet assay over five days, with uninfected cells serving as controls.
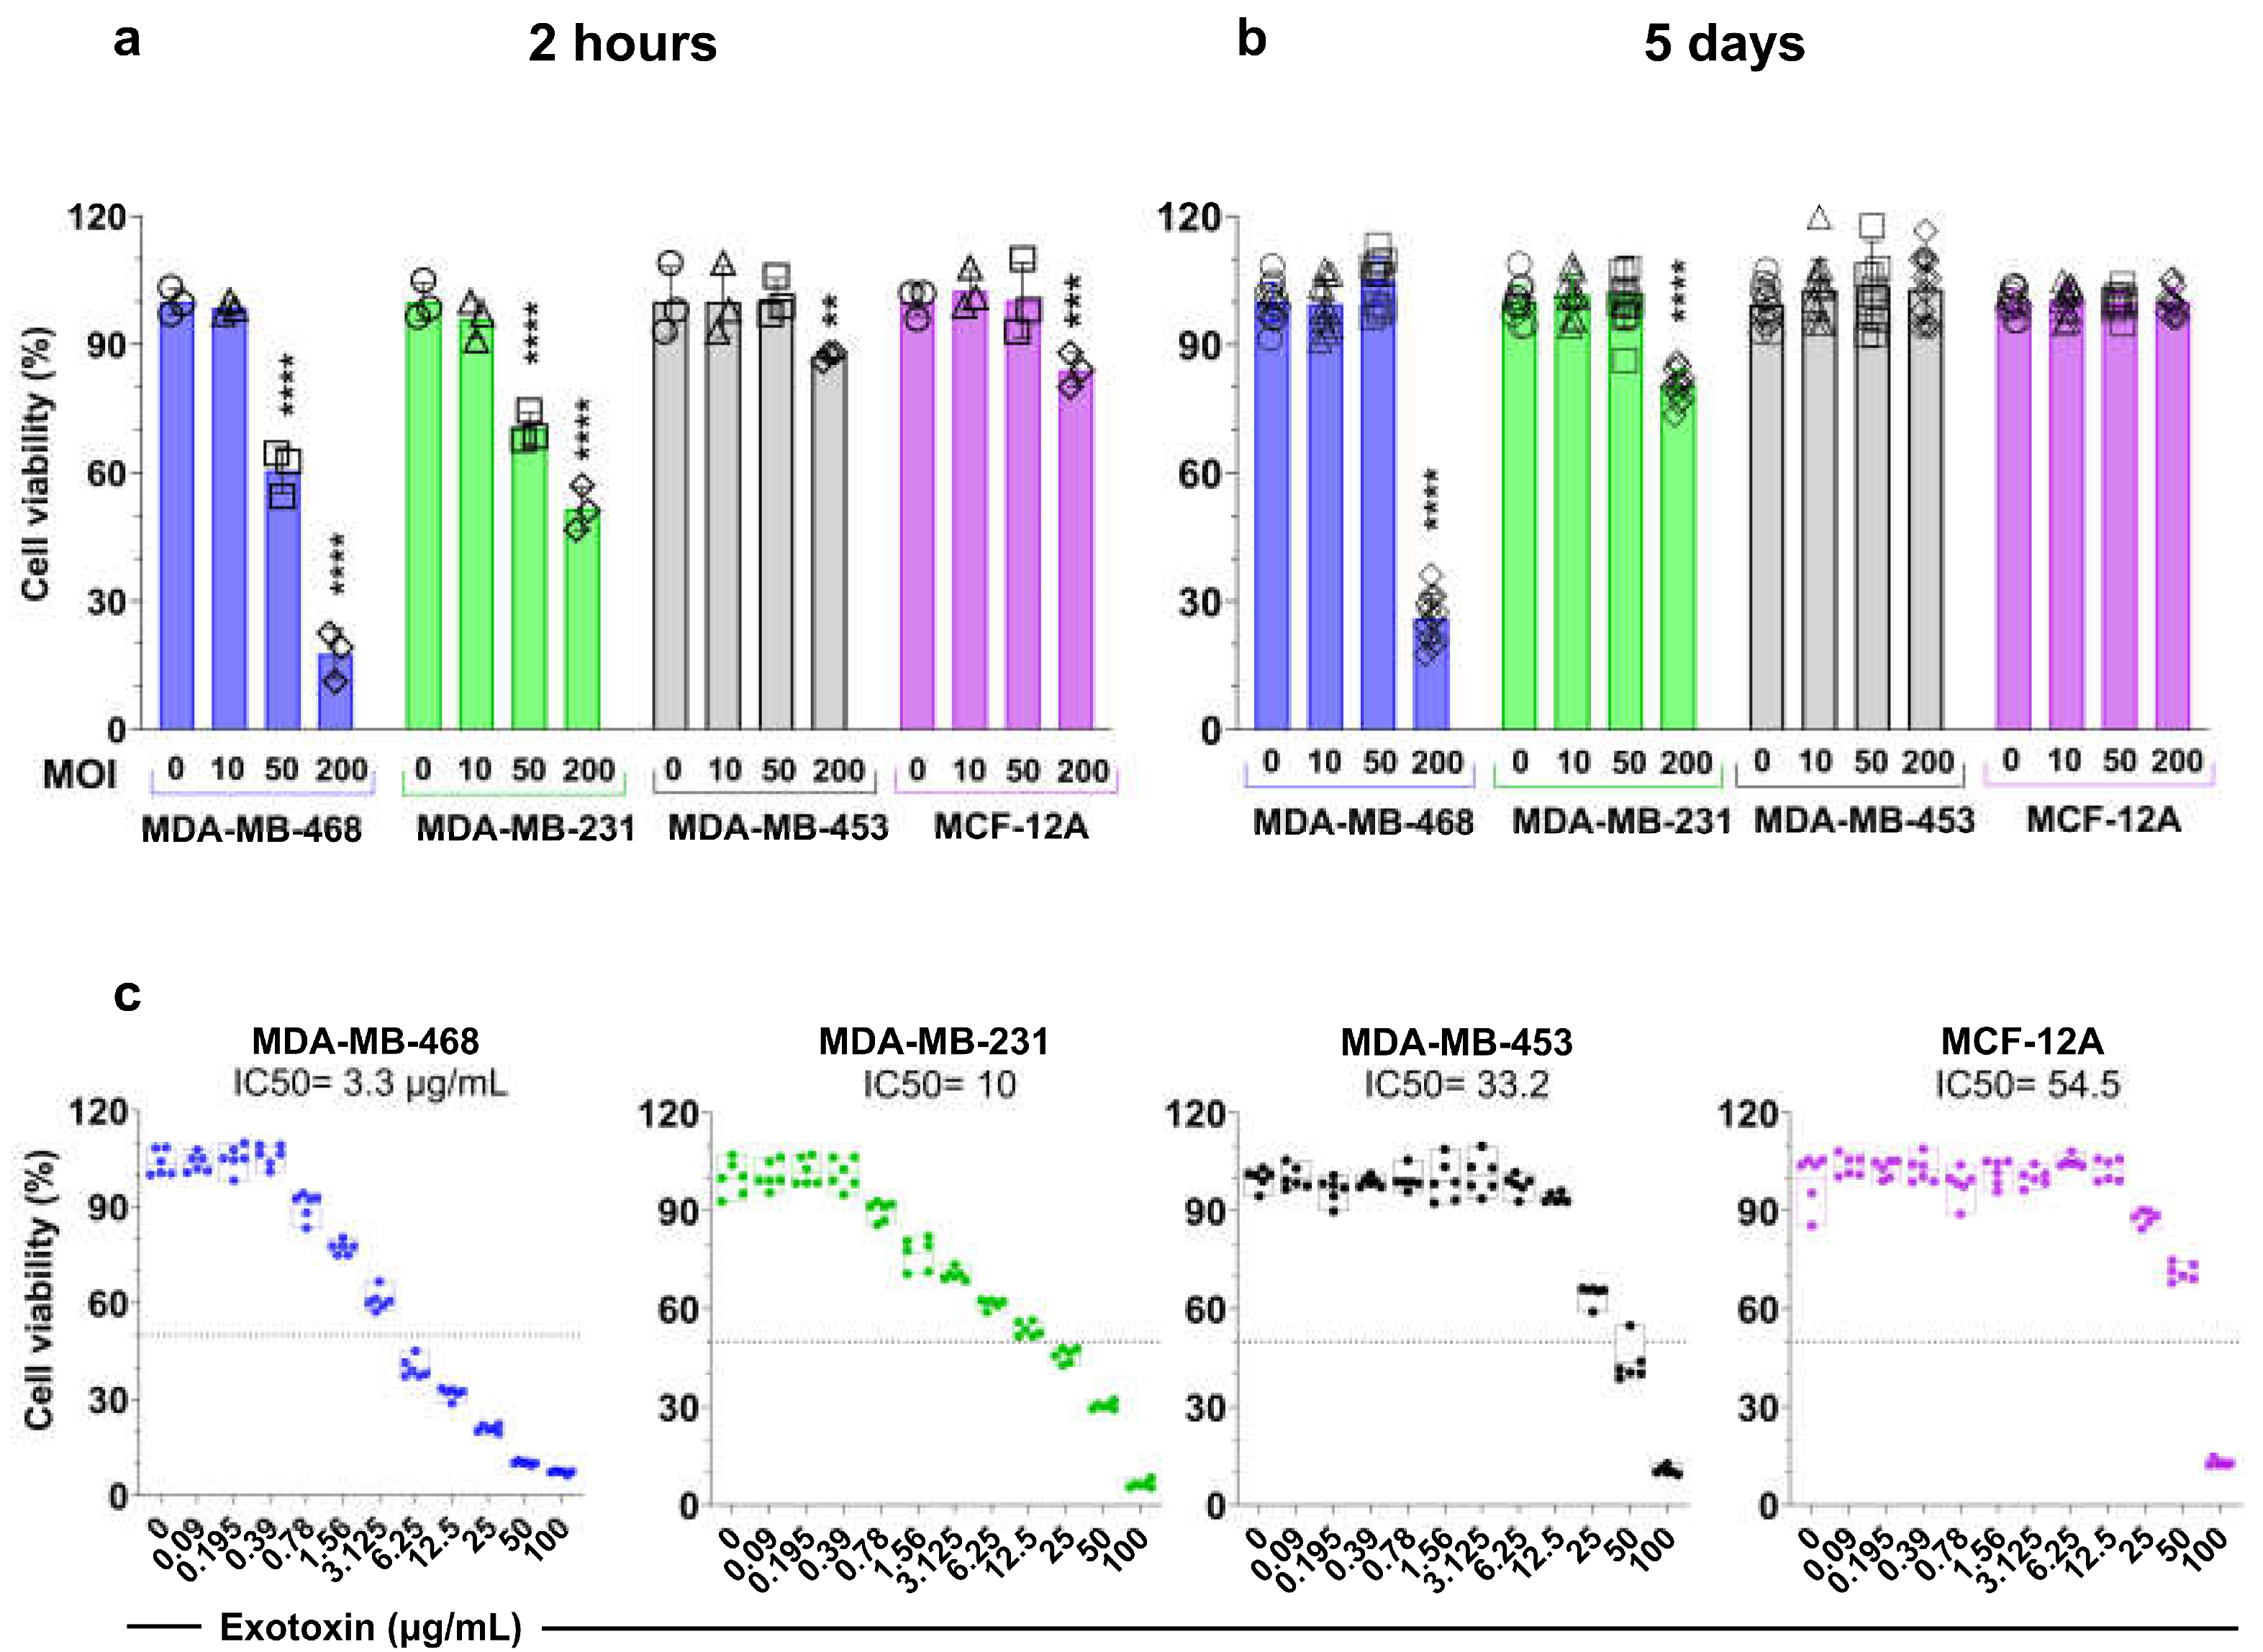
At 2 hours post-infection (Figure 2a), MOI 200 significantly reduced cell numbers across all cell lines (p < 0.01). MDA-MB-468 exhibited the highest susceptibility (~80% reduction), followed by MDA-MB-231 (~50% reduction). In contrast, MDA-MB-453 and MCF-12A were less affected, with approximately 87% and 80% viability, respectively, suggesting lower susceptibility to S. aureus-induced cytotoxicity. At MOI 50, MDA-MB-468 and MDA-MB-231 showed a significant decline in cell numbers (p < 0.0001), whereas MDA-MB-453 and MCF-12A remained unaffected, indicating resistance to moderate bacterial loads. At MOI 10, no significant reduction in viability was observed across any of the cell lines, suggesting that lower infection burdens do not acutely impair survival.
To assess the long-term impact of S. aureus infection, we monitored cell proliferation over five days (Figure 2b). At MOI 10 and 50, all cell lines exhibited proliferation rates comparable to uninfected controls, suggesting tolerance to lower bacterial burdens. However, at MOI 200, proliferation was differentially affected. While MDA-MB-453 and MCF-12A maintained their growth rates, MDA-MB-231 exhibited an approximate 20% reduction (p < 0.0001), and MDA-MB-468 showed a striking 70% decrease (p < 0.0001), consistent with its higher susceptibility to bacterial-induced cytotoxicity. These differences in long-term growth correlated with the initial bacterial burden and cell line-specific responses to infection.
To further investigate the inhibitory effects on proliferation, we assessed whether S. aureus exotoxins (Figure 3c) or purified lipoteichoic acid (LTA) (Figure S3) contributed to growth suppression. The half-maximal inhibitory concentration (IC50) of S. aureus exotoxin varied widely among these cell lines, highlighting differential sensitivity. The IC50 values were 3.3 μg/mL (95% CI: 3–3.5 μg/mL) for MDA-MB-468, 10.0 μg/mL (95% CI: 8.7–11.4 μg/mL) for MDA-MB-231, 33.2 μg/mL (95% CI:31-35.4 μg/mL) for MDA-MB-453, and 54.5 μg/mL (95% CI: 51.4–57.4 μg/mL) for MCF-12A. In contrast, purified S. aureus LTA (1–50 µg/mL) had no significant effect on cell proliferation across all tested cell lines (Figure S3).
Figure 4.
Cytotoxicity and inhibition of proliferation induced by S. aureus infection and exotoxins in breast cell lines. (a) Viability of breast cells 2 hours post-infection with viable S. aureus at MOIs 10, 50, and 200. (b) Long-term effects of S. aureus infection on cell proliferation measured using crystal violet assay, normalizing to uninfected cells. One-way ANOVA with Tukey’s multiple comparisons test was performed to compare between infected cells with different MOIs (10, 50, and 200) and uninfected cells (MOI 0) within each cell line. Data represent the mean ± SD from at least three independent experiments. Statistical significance: **p < 0.01; ***p < 0.001; ****p < 0.0001. (c) Dose-dependent cytotoxicity of total S. aureus exotoxins in breast cells after 5 days using crystal violet assay normalizing to uninfected cells. IC50 values for each cell line are indicated in the figure.
3.4. S. aureus Infection Enhances IFN-γ-Induced PD-L1 Expression in a Breast Cell Line-Dependent Manner
PD-L1 is a key immune checkpoint regulator and a critical target for immunotherapy in TNBC. IFN-γ is a well-established inducer of PD-L1 expression, and previous studies have demonstrated that bacterial components, such as heat-killed S. aureus, can enhance IFN-γ-producing lymphocytes and upregulate PD-L1 expression in TNBC models [39-43]. Based on these previous reports, we investigated whether live S. aureus infection influences PD-L1 regulation in breast cancer cells by modulating IFN-γ signaling.
We first assessed baseline PD-L1 expression across our panel of breast cell lines using flow cytometry (Figure 5a). PD-L1 levels were highest in MDA-MB-231, followed by MCF-12A, while MDA-MB-468 and MDA-MB-453 exhibited low or undetectable expression. Upon IFN-γ stimulation, all cell lines demonstrated a significant increase in PD-L1 expression (p < 0.0001 for all) (Figure 5b), consistent with previous reports [39,40,41,42,43].
As shown in Figure 5b, notably, the magnitude of IFN-γ-induced PD-L1 upregulation was highest in MDA-MB-468 cells, followed by MCF-12A and MDA-MB-453, all of which have lower baseline PD-L1 levels compared to MDA-MB-231. In response to IFN-γ, PD-L1 expression in MDA-MB-468 increased 11-fold at 24 hours (p < 0.0001) and 17-fold after 48 hours (p < 0.0001). MCF-12A exhibited a 5-fold increase at 24 hours (p < 0.0001), while MDA-MB-453 showed a 4.3-fold increase at 24 hours and 4.6-fold increase at 48 hours (p < 0.0001). In contrast, MDA-MB-231 cells, which have highest baseline PD-L1 levels, exhibited a 1.4-fold increase at 24 hours and a 1.6-fold increase at 48 hours (p < 0.0001).
Next, we examined whether S. aureus infection alone induces PD-L1 expression (Figure 5b). Across all cell lines, S. aureus infection for 2 hours did not significantly alter PD-L1 levels at 24- or 48-hours post-infection, regardless of bacterial load. However, when assessing whether S. aureus infection potentiates IFN-γ-induced PD-L1 expression, we observed distinct cell line-dependent effects. In MDA-MB-468 and MDA-MB-231, S. aureus infection significantly enhanced IFN-γ-induced PD-L1 expression. In MDA-MB-468, IFN-γ stimulation of S. aureus-infected cells resulted in a 1.9-fold increase at 24 hours and a 2.9-fold increase at 48 hours relative to IFN-γ-only controls (Figure 5b, Table S3). Similarly, in MDA-MB-231, S. aureus infection potentiated IFN-γ-induced PD-L1 expression in a dose-dependent manner. At 24 hours, PD-L1 levels increased by 1.4-fold (p = 0.008) and 1.5-fold (p < 0.0001) for MOI 50 and MOI 200, respectively, compared to IFN-γ-only controls. At 48 hours, these increases were 1.1-fold (p = 0.012) and 1.4-fold (p < 0.0001), respectively (Figure 5b, Table S4). Notably, the enhancement was more pronounced in MDA-MB-468 than in MDA-MB-231 (Table S3, Table S4).
In contrast, S. aureus infection did not significantly enhance IFN-γ-induced PD-L1 expression in MDA-MB-453 or MCF-12A (Figure 5b, Tables S5–S6). This aligns with our previous observations that these cell lines exhibited lower susceptibility to S. aureus internalization and bacterial load (Figure 1d).
To determine whether the potentiating effect of S. aureus on IFN-γ-induced PD-L1 expression was sustained in MDA-MB-231, we measured PD-L1 levels six days post-infection (Figure 5c, Table S7). While IFN-γ continued to upregulate PD-L1, the additive effect of S. aureus infection was no longer observed. This finding is consistent with our earlier results showing a decline in intracellular bacterial load over time, potentially reducing the impact of S. aureus on IFN-γ-mediated PD-L1 upregulation.
Collectively, these findings suggest that S. aureus infection can enhance IFN-γ-induced PD-L1 expression in a cell line-dependent manner. This effect was observed in MDA-MB-231 and MDA-MB-468 but not in MDA-MB-453 or MCF-12A, highlighting a potential role for intracellular bacteria in modulating the tumor immune microenvironment.
3.5. S. aureus Enhances IFN-γ-Induced PD-L1 Expression via STAT1 Activation
To investigate whether S. aureus infection enhances JAK/STAT pathway activation, leading to increased PD-L1 expression, we performed western blot analysis of total STAT1 and phosphorylated STAT1 (p-STAT1) in infected and uninfected breast cell lines, with and without IFN-γ stimulation (Figure 6, Figure S6).
STAT1 protein levels remained stable across all conditions for each cell line (Figure 6a, 6b). However, p-STAT1 was undetectable in untreated and S. aureus-infected cells, indicating a lack of STAT1 activation in the absence of IFN-γ stimulation (Figure 6a, 6c). Upon IFN-γ stimulation, p-STAT1 levels increased in all tested cell lines compared to untreated controls. Notably, in IFN-γ-treated conditions, S. aureus-infected cells exhibited a further increase in p-STAT1 levels, with a 2.0-fold and 1.8-fold increase in MDA-MB-468 and MDA-MB-231, respectively, compared to uninfected IFN-γ-treated controls (Figure 6c). In contrast, S. aureus infection did not further enhance IFN-γ-induced p-STAT1 expression in MDA-MB-453 or MCF-12A—cell lines that also failed to show an increase in IFN-γ-mediated PD-L1 expression in response to S. aureus.
These findings suggest that S. aureus infection can potentiate IFN-γ-induced PD-L1 expression in breast cell lines through enhanced STAT1 activation, further supporting a role for intracellular S. aureus in modulating immune checkpoint regulation.
3.6. TLR2 Agonists Upregulate PD-L1 Expression in Breast Cell Lines
To assess the impact of TLR2 activation on PD-L1 expression in breast cell lines, we treated the cells with purified S. aureus lipoteichoic acid (LTA) and the synthetic TLR2 agonist Pam3CSK4, both in the presence and absence of IFN-γ (Figure 7).
We first measured TLR2 expression in the breast cell lines by flow cytometry (Figure 7a, Figure S5). Among the tested cell line, MDA-MB-231 exhibited the highest baseline TLR2 expression, followed by MCF-12A, MDA-MB-468, and MDA-MB-453. To determine whether IFN-γ, a known PD-L1 inducer, also modulates TLR2 levels, we measured TLR2 levels after 24 hours of treatment with 5 µM IFN-γ. As shown in Figure 7b, IFN-γ treatment led to a modest increase in TLR2 expression across all cell lines. Notably, MDA-MB-231 cells, which had the highest baseline TLR2 levels, exhibited the most pronounced response with a 1.2-fold increase (p = 0.004). In contrast, the other cell lines—MDA-MB-468 (1.1-fold, p = 0.02), MDA-MB-453 (1.1-fold p = 0.02), and MCF-12A (1.1-fold, p = 0.03)—showed only modest increases, consistent with their lower baseline TLR2 expression.
Next, we examined whether TLR2 activation influences PD-L1 expression. In the absence of IFN-γ, stimulation with 30 µg/mL (but not 1 µg/mL) LTA or 1 µg/mL Pam3CSK4 modestly increased PD-L1 expression in MDA-MB-231 (1.1-fold and 1.3-fold, respectively; p = 0.0097 and p < 0.0001), whereas the other cell lines exhibited minimal to no response (Figure 7b). This suggests that TLR2-mediated PD-L1 induction, independent of IFN-γ, primarily occurs in TLR2-high cells, consistent with previous findings in head and neck cancer cell lines [33].
In the presence of IFN-γ, both 30 µg/mL LTA and 1 µg/mL Pam3CSK4 modestly increased PD-L1 expression across all cell lines (p < 0.05) (Figure 7b). The greatest increase was observed in MDA-MB-453 (1.3-fold for both LTA and Pam3CSK4) and MCF-12A (1.3-fold for both), while a more modest increase was seen in MDA-MB-231 (1.1-fold and 1.2-fold) and MDA-MB-468 (1.1-fold and 1.2-fold). These results indicate that TLR2 signaling enhances IFN-γ-driven PD-L1 upregulation in both TNBC and non-malignant breast epithelial cells.
Overall, these findings suggest that S. aureus-derived LTA and synthetic TLR2 agonists can modulate PD-L1 expression, with IFN-γ further amplifying this effect. The observed synergy highlights a potential role for bacterial infections in promoting immune evasion in TNBC. Further studies are needed to elucidate the downstream mechanisms and functional consequences of this interaction.
4. Discussion
Our study demonstrates that S. aureus can invade and persist within TNBC cells, potentially influencing key tumor-associated pathways. Using an optimized gentamicin protection assay and advanced imaging techniques, we confirmed that S. aureus is not only internalized but remains viable within TNBC cells. This persistence suggests a possible role for intracellular bacteria in tumor progression and immune evasion. Notably, we identified that S. aureus modulates PD-L1 expression through TLR2 signaling in a cell line-dependent manner, providing a mechanistic link between bacterial infection and immune checkpoint regulation in TNBC.
The internalization rates and intracellular burden of S. aureus varied notably among the breast cell lines tested, with MDA-MB-468 and MDA-MB-231 exhibiting significantly higher uptake compared to MDA-MB-453 and MCF-12A. This variability underscores the importance of cellular context in bacterial-host interactions, as emphasized in recent studies [44]. The mechanisms underlying S. aureus internalization into cancer cells remain incompletely understood, though surface receptors are known to play a pivotal role in facilitating bacterial entry and survival. Differences in surface receptor expression—particularly integrins (α5β1, αvβ5), TLRs, particularly TLR2, and the EGFR—are implicated in bacterial adhesion and uptake in non-professional phagocytic cells [45,46,47,48,49,50]. EGFR has been shown to mediate bacterial internalization in osteoblasts and promote bacterial clearance, indicating a dual role in both processes [47]. This may explain why MDA-MB-468 cells, which are characterized by high EGFR and low TLR2 expression, displayed efficient bacterial uptake and rapid clearance in our study [51,52,53,54]. TLR2, which recognizes bacterial LTA, enhances internalization and modulates immune responses [46,50]. Elevated TLR2 levels may prolong bacterial survival by suppressing reactive oxygen species and promoting immunosuppressive cytokine release [55]. This dual function underscores TLR2’s pivotal role in both microbial recognition and immune modulation. Consistent with this, MDA-MB-231 cells—characterized by high TLR2 expression—exhibited increased bacterial uptake and prolonged intracellular survival. In contrast, MDA-MB-453 and MCF-12A cells, which have lower TLR2 expression, demonstrated minimal bacterial internalization and reduced persistence, further supporting the association between TLR2 levels and bacterial behavior. Additional receptors, including CD36 [56], extracellular adherence proteins (Eap) [57], and autolysin (Atl) [58], further facilitate S. aureus adhesion and invasion. In summary, the variability in S. aureus internalization and persistence is closely linked to the receptor landscape of each cell type. While certain receptors like TLR2, EGFR, and integrins play key roles, this process is not mediated by a single receptor alone. Instead, multiple receptors likely act in coordination to facilitate bacterial adhesion, entry, and intracellular survival. Understanding how mammalian cells—including cancer cells, particularly those of the breast—internalize bacteria is of great importance. This complex interplay warrants further investigation to uncover the underlying mechanisms and potential therapeutic implications.
Electron microscopy at 24 hours and 7 days post-infection revealed diverse bacterial morphotypes, suggesting multiple survival strategies. Intact bacteria persisted in both the cytoplasm and phagosomes, indicating intracellular viability, aligning with previous reports of five-day intracellular S. aureus persistence in monocyte phagosomes [59]. Additionally, we identified S. aureus L-forms, which lack a rigid cell wall [60]. These forms, previously detected in breast tumors [19], may enhance immune evasion and antibiotic resistance by reducing metabolism and energy consumption [61,62,63,64]. The presence of degraded bacterial remnants suggests incomplete bacterial clearance, while dividing bacteria indicate active intracellular replication, underscoring the complexity of S. aureus-TNBC interactions and their potential implications for immune modulation and therapy resistance.
We observed cell line-dependent cytotoxicity, with MDA-MB-468 being the most sensitive, followed by MDA-MB-231, MCF-12A, and MDA-MB-453. S. aureus influences tumor biology variably, promoting or inhibiting tumor growth depending on the cancer type and bacterial components involved [32]. Virulence factors such as fibronectin-binding protein A and LTA promote tumor proliferation through TLR/NF-κB and IL-8 signaling [65,66], while exotoxins such as α-hemolysin and staphylococcal enterotoxin B exert anti-proliferative effects [67,68]. In murine TNBC cells, α-hemolysin induces apoptosis and suppresses tumor growth [30]. Our findings reveal that high bacterial loads induce cytotoxicity in MDA-MB-468 and MDA-MB-231, likely due to bacterial invasion disrupting Ca²⁺ homeostasis and toxin release [69]. Despite initial cytotoxicity, all cell lines recovered within 7 days. MDA-MB-231 demonstrated superior recovery, while MDA-MB-468, despite high infection rates, only regained viability after 7 days, suggesting cytotoxicity was driven primarily by extracellular toxins rather than intracellular bacterial burden.
Staphylococcus is one of the most abundant genera identified in breast tissues [24], but the viability of intracellular bacteria and their impact on immune modulation remain unclear. Components such as α-hemolysin and LTA upregulate PD-L1 expression in TNBC and head and neck cancers [30,33,70]. Our findings show that viable S. aureus enhances IFN-γ-induced PD-L1 expression in a MOI-dependent manner, with MDA-MB-468 exhibiting the highest induction, followed by MDA-MB-231. This aligns with reports that high MOI infections activate distinct immune pathways, including the type I IFN pathway [71]. In contrast, MDA-MB-453 and MCF-12A, which had low bacterial uptake, showed no changes in PD-L1 expression with or without IFN-γ, suggesting a dependence on intracellular bacterial presence.
Mechanistically, S. aureus significantly elevated IFN-γ-induced PD-L1 expression via STAT1 activation in MDA-MB-231 and MDA-MB-468. Similar mechanisms have been reported in ovarian and TNBC tumors [72,73]. S. aureus influences IFN-γ signaling through JAK/STAT via TLRs, including TLR9 in dendritic cells [74] and TLR2 in combination with STAT3 in inflammatory conditions [25]. Using the TLR2 agonists Pam3CSK4 and S. aureus LTA, we found that MDA-MB-231, which expresses high baseline TLR2 levels, exhibited moderate PD-L1 upregulation, with a more pronounced effect when combined with IFN-γ. In contrast, TLR2 stimulation alone was insufficient to induce PD-L1 expression in MDA-MB-468, MDA-MB-453, and MCF-12A, likely due to their lower basal TLR2 levels. Notably, IFN-γ treatment upregulated TLR2 expression across all breast cell lines, and co-treatment with IFN-γ and TLR2 agonists significantly enhanced PD-L1 expression. These findings underscore the importance of IFN-γ-mediated TLR2 upregulation in sensitizing cells to bacterial ligands. Our findings were consistent with previous reports that showed Pam3CSK4, and heat-killed S. aureus were sufficient to induce PD-L1 upregulation in head and neck cancer and dendritic cells with high TLR2 expression, even in the absence of IFN-γ [33,75]. These findings suggest that TNBC tumors within chronically inflamed microenvironments may exploit TLR signaling to sustain PD-L1 expression, potentially enhancing immune evasion.
Despite the insights provided, several limitations should be noted. Our in vitro models do not fully recapitulate the tumor microenvironment, including immune-stromal interactions. Studying a single bacterial species in select TNBC cell lines limits generalizability, while high MOIs, though necessary for consistent intracellular infection, may overestimate the impact of S. aureus on PD-L1 expression. Future studies incorporating patient-derived organoids or murine models will be critical for validating these findings in a more physiologically relevant context.
Despite these limitations, our study has important translational implications. The differential bacterial uptake and immune modulation across TNBC subtypes highlight the need for personalized bacterial profiling in immunotherapy. Targeting bacterial interactions with TLR2 could offer novel strategies for modulating PD-L1 expression. However, whether S. aureus-driven PD-L1 upregulation is sufficient to promote immune evasion in vivo remains unclear. Future research should explore the relationship between S. aureus colonization, PD-L1 expression, and immune infiltration in clinical TNBC specimens.
Given distinct molecular subtypes of TNBC, our findings suggest that S. aureus may differentially modulate PD-L1 expression, particularly in basal-like and mesenchymal TNBCs. This could enhance ICI responsiveness in PD-L1-low tumors but may also contribute to adaptive immune resistance. Understanding how bacterial infection influences immune evasion and treatment efficacy is crucial for optimizing immunotherapy strategies.
Finally, targeting the tumor microbiome represents a promising adjunct strategy for TNBC treatment. The impact of antibiotics, probiotics, or microbiome modulation on immune checkpoint regulation in TNBC remains largely unexplored. While antibiotics remain the primary strategy for bacterial clearance, their impact on tumor-associated bacteria is complex. Broad-spectrum antibiotics significantly alter gut microbiota composition [76], which in turn can affect systemic immune responses [77]. Clinical studies in other cancer types suggest that antibiotic use is associated with poorer outcomes in patients receiving ICIs (reviewed in [78]). However, some pooled analyses of randomised controlled trials have failed to demonstrate reduced ICI efficacy in antibiotic users [79]. Prospective studies evaluating the impact of antibiotics on ICI efficacy are needed to validate antibiotic-mediated mechanisms of ICI refractoriness. Emerging research suggests that modulating the microbiome through probiotics or fecal microbiota transplantation may enhance ICI efficacy by promoting beneficial immune interactions. Studies have demonstrated that a diverse gut microbiome, particularly enriched with Akkermansia muciniphila and Bifidobacterium species, correlates with improved responses to immunotherapy [80]. However, whether similar microbiome-driven immune modulation applies to TNBC remains unexplored. Understanding how bacterial infection influences immune evasion and treatment efficacy is crucial for optimizing immunotherapy strategies. A deeper understanding of the tumor-microbiome-immune axis could pave the way for integrating microbiome-targeted interventions with immunotherapy to improve patient outcomes.
5. Conclusions
Our study identifies S. aureus as a previously unrecognized modulator of immune checkpoint regulation in TNBC via TLR2-mediated PD-L1 upregulation. These findings suggest that intratumoral bacteria contribute to immune evasion and therapy resistance, highlighting microbial targeting as a potential strategy to enhance TNBC immunotherapy.
This study is the first to explore viable intracellular S. aureus’ impact on TNBC subtypes and PD-L1 regulation. We demonstrated that S. aureus uptake and clearance vary across TNBC and non-cancerous cell lines, influenced by receptor expression and immune signaling pathways. Our findings underscore the importance of bacterial-tumor interactions in immune modulation and therapy resistance, offering potential therapeutic targets to disrupt bacterial persistence and immune checkpoint regulation in TNBC.
Future studies should determine whether modulating bacterial populations or blocking TLR2 signaling can enhance responses to immune checkpoint inhibitors in TNBC patients. Understanding the role of the tumor-associated microbiome in shaping immunotherapy outcomes may lead to precision oncology approaches integrating microbiome-targeted strategies with existing treatments.
Supplementary Materials
The following supporting information can be downloaded at: www.mdpi.com/xxx/s1, Figure S1 Optimization of gentamicin protection assay. (a) Evaluation of toxicity of eFluor 450 labeling on S. aureus. (b) Determination of S. aureus sensitivity to gentamicin using minimum inhibitory concentration assay. (c) Confirmation of elimination of viable extracellular bacteria using propidium iodide staining. (d) Confirmation of intracellular S. aureus by transmission electron microscopy. (e) Confirmation of viable intracellular S. aureus by plating lysed cell contents on agar 24 hours post-infection. Figure S2 Gating strategy used to identify viable single cells and quantify intracellular eFluor 450-labeled S. aureus by flow cytometry. Figure S3 Effect of lipoteichoic acid (LTA) treatment on cell proliferation. Figure S4 Flow cytometry gating strategy for detecting PD-L1 surface expression. Spectral flow cytometry histograms showing PD-L1 expression in breast cancer cells infected with S. aureus and/or treated with TLR2 agonists. Figure S5 Spectral flow cytometry analysis (histograms) of TLR2 surface expression in TNBC cells treated with IFN-γ. Figure S6 Full Western Blot Images with Molecular Weight Markers and Independent Replicates. Table S1: Comparison between cells with different infection condition within each cell line (rate of infection). Table S2: Comparison between cells with different infection condition within each cell line (GMFI of eFluor 450). Table S3-6: Comparison between cells of fold-change for PD-L1 expression with bacterial infection (MOI 50) and IFN-γ. stimulation for MDA-MB-468 (S3), MDA-MB-231 (S4), MDA-MB-453 (S5) and MCF-12A (S6) at 24 and 48 h. Table S7: Comparison between cells of fold-change for PD-L1 expression with bacterial infection (MOI 200) and IFN-γ stimulation for MDA-MB-231 at 6 days. Table S8: Comparison of fold change of TLR2 expression of cells treated with IFN-γ.
Author Contributions
Conceptualization, E.S., S.K.R. and A.R.T.; methodology, S.K.R., R.L., C.K., G.S., F.W. and E.S.; software, S.K.R., K.K.L.Y. and E.S.; validation, S.K.R., K.K.L.Y., and E.S.; formal analysis, S.K.R., K.K.L.Y. and E.S.; investigation, S.K.R., A.R.T. and E.S; resources, E.S., A.R.T., T.J.P., and S.V.; data curation, S.K.R., K.K.L.Y. and E.S.; writing—original draft preparation, S.K.R. and E.S.; writing—review and editing, S.K.R., C.C., S.V., Y.T., T.J.M, W.V.I. and E.S; visualization, S.K.R., and E.S.; supervision, E.S., A.R.T. and W.V.I.; project administration, E.S.; funding acquisition, E.S., A.R.T. and T.J.P.; All authors have read and agreed to the published version of the manuscript.
Funding
This research received no external funding
Institutional Review Board Statement
Not applicable.
Informed Consent Statement
Not applicable.
Data Availability Statement
The raw data supporting the conclusions of this article will be made available by the authors on request.
Acknowledgements
We acknowledge the facilities, instruments, and expertise provided by Microscopy Australia (ROR: 042mm0k03) at Adelaide Microscopy, University of Adelaide, which is supported by NCRIS, the university, and state government funding. Special thanks to Mr. Christopher Leigh for his assistance with the transmission electron microscopy.
Conflicts of Interest
The authors declare no conflicts of interest.
Abbreviations
The following abbreviations are used in this manuscript:
| EGFR | Epidermal Growth Factor Receptor |
| GMFI | Geometric Mean Fluorescence Intensity |
| ICI | Immune Checkpoint Inhibitor |
| JAK | Janus Kinase |
| LTA | Lipoteichoic Acid |
| MICMOI | Minimum inhibitory concentrationMultiplicity of Infection |
| p-STAT1 | Phosphorylated Signal Transducer and Activator of Transcription 1 |
| PD-L1 | Programmed Death-Ligand 1 |
| STAT1 | Signal Transducer and Activator of Transcription 1 |
| TLR2 | Toll-Like Receptor 2 |
References
- He, Y.; Jiang, Z.; Chen, C.; Wang, X. Classification of triple-negative breast cancers based on Immunogenomic profiling. Journal of Experimental & Clinical Cancer Research 2018, 37, 1–13. [Google Scholar]
- Lehmann, B.D.; Bauer, J.A.; Chen, X.; Sanders, M.E.; Chakravarthy, A.B.; Shyr, Y.; Pietenpol, J.A. Identification of human triple-negative breast cancer subtypes and preclinical models for selection of targeted therapies. The Journal of clinical investigation 2011, 121, 2750–2767. [Google Scholar] [CrossRef]
- Lehmann, B.D.; Jovanović, B.; Chen, X.; Estrada, M.V.; Johnson, K.N.; Shyr, Y.; Moses, H.L.; Sanders, M.E.; Pietenpol, J.A. Refinement of triple-negative breast cancer molecular subtypes: implications for neoadjuvant chemotherapy selection. PloS one 2016, 11, e0157368. [Google Scholar] [CrossRef] [PubMed]
- Debien, V.; De Caluwé, A.; Wang, X.; Piccart-Gebhart, M.; Tuohy, V.K.; Romano, E.; Buisseret, L. Immunotherapy in breast cancer: an overview of current strategies and perspectives. NPJ breast cancer 2023, 9, 7. [Google Scholar] [CrossRef] [PubMed]
- Thomas, R.; Al-Khadairi, G.; Decock, J. Immune checkpoint inhibitors in triple negative breast cancer treatment: promising future prospects. Frontiers in oncology 2021, 10, 600573. [Google Scholar] [CrossRef]
- Zhang, Y.; Chen, H.; Mo, H.; Hu, X.; Gao, R.; Zhao, Y.; Liu, B.; Niu, L.; Sun, X.; Yu, X. Single-cell analyses reveal key immune cell subsets associated with response to PD-L1 blockade in triple-negative breast cancer. Cancer cell 2021, 39, 1578–1593, e1578. [Google Scholar] [CrossRef]
- Kumar, S.; Chatterjee, M.; Ghosh, P.; Ganguly, K.K.; Basu, M.; Ghosh, M.K. Targeting PD-1/PD-L1 in cancer immunotherapy: an effective strategy for treatment of triple-negative breast cancer (TNBC) patients. Genes & Diseases 2023, 10, 1318–1350. [Google Scholar]
- Bastaki, S.; Irandoust, M.; Ahmadi, A.; Hojjat-Farsangi, M.; Ambrose, P.; Hallaj, S.; Edalati, M.; Ghalamfarsa, G.; Azizi, G.; Yousefi, M. PD-L1/PD-1 axis as a potent therapeutic target in breast cancer. Life sciences 2020, 247, 117437. [Google Scholar] [CrossRef]
- Sabatier, R.; Finetti, P.; Mamessier, E.; Adelaide, J.; Chaffanet, M.; Ali, H.R.; Viens, P.; Caldas, C.; Birnbaum, D.; Bertucci, F. Prognostic and predictive value of PDL1 expression in breast cancer. Oncotarget 2015, 6, 5449. [Google Scholar] [CrossRef]
- Nakayama, Y.; Mimura, K.; Tamaki, T.; Shiraishi, K.; Kua, L.F.; Koh, V.; Ohmori, M.; Kimura, A.; Inoue, S.; Okayama, H. Phospho-STAT1 expression as a potential biomarker for anti-PD-1/anti-PD-L1 immunotherapy for breast cancer. International journal of oncology 2019, 54, 2030–2038. [Google Scholar] [CrossRef]
- Dong, Y.; Wang, Z.; Mao, F.; Cai, L.; Dan, H.; Jiang, L.; Zeng, X.; Li, T.; Zhou, Y.; Chen, Q. PD-1 blockade prevents the progression of oral carcinogenesis. Carcinogenesis 2021, 42, 891–902. [Google Scholar] [CrossRef] [PubMed]
- German, R.; Marino, N.; Hemmerich, C.; Podicheti, R.; Rusch, D.B.; Stiemsma, L.T.; Gao, H.; Xuei, X.; Rockey, P.; Storniolo, A.M. Exploring breast tissue microbial composition and the association with breast cancer risk factors. Breast Cancer Research 2023, 25, 82. [Google Scholar] [CrossRef] [PubMed]
- Hoskinson, C.; Jiang, R.Y.; Stiemsma, L.T. Elucidating the roles of the mammary and gut microbiomes in breast cancer development. Frontiers in Oncology 2023, 13, 1198259. [Google Scholar] [CrossRef]
- Hieken, T.J.; Chen, J.; Hoskin, T.L.; Walther-Antonio, M.; Johnson, S.; Ramaker, S.; Xiao, J.; Radisky, D.C.; Knutson, K.L.; Kalari, K.R. The microbiome of aseptically collected human breast tissue in benign and malignant disease. Scientific reports 2016, 6, 30751. [Google Scholar] [CrossRef]
- Kartti, S.; Bendani, H.; Boumajdi, N.; Bouricha, E.M.; Zarrik, O.; El Agouri, H.; Fokar, M.; Aghlallou, Y.; El Jaoudi, R.; Belyamani, L. Metagenomics analysis of breast microbiome highlights the abundance of Rothia genus in tumor tissues. Journal of Personalized Medicine 2023, 13, 450. [Google Scholar] [CrossRef]
- Thyagarajan, S.; Zhang, Y.; Thapa, S.; Allen, M.S.; Phillips, N.; Chaudhary, P.; Kashyap, M.V.; Vishwanatha, J.K. Comparative analysis of racial differences in breast tumor microbiome. Scientific reports 2020, 10, 14116. [Google Scholar] [CrossRef]
- Tzeng, A.; Sangwan, N.; Jia, M.; Liu, C.-C.; Keslar, K.S.; Downs-Kelly, E.; Fairchild, R.L.; Al-Hilli, Z.; Grobmyer, S.R.; Eng, C. Human breast microbiome correlates with prognostic features and immunological signatures in breast cancer. Genome Medicine 2021, 13, 1–17. [Google Scholar] [CrossRef]
- Banerjee, S.; Wei, Z.; Tian, T.; Bose, D.; Shih, N.N.; Feldman, M.D.; Khoury, T.; De Michele, A.; Robertson, E.S. Prognostic correlations with the microbiome of breast cancer subtypes. Cell death & disease 2021, 12, 831. [Google Scholar]
- Nejman, D.; Livyatan, I.; Fuks, G.; Gavert, N.; Zwang, Y.; Geller, L.T.; Rotter-Maskowitz, A.; Weiser, R.; Mallel, G.; Gigi, E. The human tumor microbiome is composed of tumor type–specific intracellular bacteria. Science 2020, 368, 973–980. [Google Scholar] [CrossRef]
- Li, X.; Sun, X.; Zhang, A.; Pang, J.; Li, Y.; Yan, M.; Xu, Z.; Yu, Y.; Yang, Z.; Chen, X. Breast microbiome associations with breast tumor characteristics and neoadjuvant chemotherapy: A case-control study. Frontiers in Oncology 2022, 12, 926920. [Google Scholar] [CrossRef]
- Esposito, M.V.; Fosso, B.; Nunziato, M.; Casaburi, G.; D’Argenio, V.; Calabrese, A.; D’Aiuto, M.; Botti, G.; Pesole, G.; Salvatore, F. Microbiome composition indicate dysbiosis and lower richness in tumor breast tissues compared to healthy adjacent paired tissue, within the same women. BMC cancer 2022, 22, 1–11. [Google Scholar] [CrossRef]
- Hieken, T.J.; Chen, J.; Chen, B.; Johnson, S.; Hoskin, T.L.; Degnim, A.C.; Walther-Antonio, M.R.; Chia, N. The breast tissue microbiome, stroma, immune cells and breast cancer. Neoplasia 2022, 27, 100786. [Google Scholar] [CrossRef] [PubMed]
- Urbaniak, C.; Gloor, G.B.; Brackstone, M.; Scott, L.; Tangney, M.; Reid, G. The microbiota of breast tissue and its association with breast cancer. Applied and environmental microbiology 2016, 82, 5039–5048. [Google Scholar] [CrossRef] [PubMed]
- Rad, S.K.; Yeo, K.K.; Wu, F.; Li, R.; Nourmohammadi, S.; Tomita, Y.; Price, T.J.; Ingman, W.V.; Townsend, A.R.; Smith, E. A Systematic Review and Meta-Analysis of 16S rRNA and Cancer Microbiome Atlas Datasets to Characterize Microbiota Signatures in Normal Breast, Mastitis, and Breast Cancer. Microorganisms 2025, 13, 467. [Google Scholar] [CrossRef]
- Ghosh, S.K.; Shukla, D.; Mahor, H.; Srivastava, S.K.; Bodhale, N.; Banerjee, R.; Saha, B. Leishmania surface molecule lipophosphoglycan-TLR2 interaction moderates TPL2-mediated TLR2 signalling for parasite survival. Immunology 2024, 171, 117–130. [Google Scholar] [CrossRef] [PubMed]
- Wu, J.; Zhang, P.; Mei, W.; Zeng, C. Intratumoral microbiota: implications for cancer onset, progression, and therapy. Frontiers in Immunology 2024, 14, 1301506. [Google Scholar] [CrossRef]
- Laborda-Illanes, A.; Aranega-Martín, L.; Sánchez-Alcoholado, L.; Boutriq, S.; Plaza-Andrades, I.; Peralta-Linero, J.; Garrido Ruiz, G.; Pajares-Hachero, B.; Álvarez, M.; Alba, E. Exploring the relationship between microRNAs, intratumoral microbiota, and breast cancer progression in patients with and without metastasis. International Journal of Molecular Sciences 2024, 25, 7091. [Google Scholar] [CrossRef]
- Fu, A.; Yao, B.; Dong, T.; Chen, Y.; Yao, J.; Liu, Y.; Li, H.; Bai, H.; Liu, X.; Zhang, Y. Tumor-resident intracellular microbiota promotes metastatic colonization in breast cancer. Cell 2022, 185, 1356–1372, e1326. [Google Scholar] [CrossRef]
- Papakonstantinou, A.; Nuciforo, P.; Borrell, M.; Zamora, E.; Pimentel, I.; Saura, C.; Oliveira, M. The conundrum of breast cancer and microbiome-a comprehensive review of the current evidence. Cancer Treatment Reviews 2022, 111, 102470. [Google Scholar] [CrossRef]
- Liu, C.-C.; Wolf, M.; Ortego, R.; Grencewicz, D.; Sadler, T.; Eng, C. Characterization of immunomodulating agents from Staphylococcus aureus for priming immunotherapy in triple-negative breast cancers. Scientific Reports 2024, 14, 756. [Google Scholar] [CrossRef]
- Bawaneh, A.K. Harnessing the Microbiome to Impact Chemotherapy Responsiveness in Triple-Negative Breast Cancer. Wake Forest University, 2022. [Google Scholar]
- Wei, Y.; Sandhu, E.; Yang, X.; Yang, J.; Ren, Y.; Gao, X. Bidirectional Functional Effects of Staphylococcus on Carcinogenesis. Microorganisms 2022, 10, 2353. [Google Scholar] [CrossRef] [PubMed]
- Mann, J.E.; Ludwig, M.L.; Kulkarni, A.; Scheftz, E.B.; Murray, I.R.; Zhai, J.; Gensterblum-Miller, E.; Jiang, H.; Brenner, J.C. Microbe-mediated activation of toll-like receptor 2 drives PDL1 expression in HNSCC. Cancers 2021, 13, 4782. [Google Scholar] [CrossRef] [PubMed]
- Richter, K.; Thomas, N.; Zhang, G.; Prestidge, C.A.; Coenye, T.; Wormald, P.-J.; Vreugde, S. Deferiprone and gallium-protoporphyrin have the capacity to potentiate the activity of antibiotics in Staphylococcus aureus small colony variants. Frontiers in cellular and infection microbiology 2017, 7, 280. [Google Scholar] [CrossRef] [PubMed]
- Palethorpe, H.M.; Smith, E.; Tomita, Y.; Nakhjavani, M.; Yool, A.J.; Price, T.J.; Young, J.P.; Townsend, A.R.; Hardingham, J.E. Bacopasides I and II act in synergy to inhibit the growth, migration and invasion of breast cancer cell lines. Molecules 2019, 24, 3539. [Google Scholar] [CrossRef]
- Shaghayegh, G.; Cooksley, C.; Bouras, G.S.; Panchatcharam, B.S.; Idrizi, R.; Jana, M.; Ellis, S.; Psaltis, A.J.; Wormald, P.-J.; Vreugde, S. Chronic rhinosinusitis patients display an aberrant immune cell localization with enhanced S aureus biofilm metabolic activity and biomass. Journal of Allergy and Clinical Immunology 2023, 151, 723–736, e716. [Google Scholar] [CrossRef]
- Smith, E.; Palethorpe, H.M.; Tomita, Y.; Pei, J.V.; Townsend, A.R.; Price, T.J.; Young, J.P.; Yool, A.J.; Hardingham, J.E. The purified extract from the medicinal plant Bacopa monnieri, bacopaside II, inhibits growth of colon cancer cells in vitro by inducing cell cycle arrest and apoptosis. Cells 2018, 7, 81. [Google Scholar] [CrossRef]
- Rad, S.K.; Yeo, K.K.; Li, R.; Wu, F.; Liu, S.; Nourmohammadi, S.; Murphy, W.M.; Tomita, Y.; Price, T.J.; Ingman, W.V. Enhancement of Doxorubicin Efficacy by Bacopaside II in Triple-Negative Breast Cancer Cells. Biomolecules 2025, 15, 55. [Google Scholar] [CrossRef]
- Jing, X.; Shao, S.; Zhang, Y.; Luo, A.; Zhao, L.; Zhang, L.; Gu, S.; Zhao, X. BRD4 inhibition suppresses PD-L1 expression in triple-negative breast cancer. Experimental cell research 2020, 392, 112034. [Google Scholar] [CrossRef]
- Lee, S.-J.; Jang, B.-C.; Lee, S.-W.; Yang, Y.-I.; Suh, S.-I.; Park, Y.-M.; Oh, S.; Shin, J.-G.; Yao, S.; Chen, L. Interferon regulatory factor-1 is prerequisite to the constitutive expression and IFN-γ-induced upregulation of B7-H1 (CD274). FEBS letters 2006, 580, 755–762. [Google Scholar] [CrossRef]
- Andrieu, G.P.; Shafran, J.S.; Smith, C.L.; Belkina, A.C.; Casey, A.N.; Jafari, N.; Denis, G.V. BET protein targeting suppresses the PD-1/PD-L1 pathway in triple-negative breast cancer and elicits anti-tumor immune response. Cancer letters 2019, 465, 45–58. [Google Scholar] [CrossRef]
- Karasar, P.; Esendagli, G. T helper responses are maintained by basal-like breast cancer cells and confer to immune modulation via upregulation of PD-1 ligands. Breast Cancer Research and Treatment 2014, 145, 605–614. [Google Scholar] [CrossRef]
- Xu, P.; Xiong, W.; Lin, Y.; Fan, L.; Pan, H.; Li, Y. Histone deacetylase 2 knockout suppresses immune escape of triple-negative breast cancer cells via downregulating PD-L1 expression. Cell Death & Disease 2021, 12, 779. [Google Scholar]
- Zhao, H.; Zhang, L.; Du, D.; Mai, L.; Liu, Y.; Morigen, M.; Fan, L. The RIG-I-like receptor signaling pathway triggered by Staphylococcus aureus promotes breast cancer metastasis. International Immunopharmacology 2024, 142, 113195. [Google Scholar] [CrossRef] [PubMed]
- Josse, J.; Laurent, F.; Diot, A. Staphylococcal adhesion and host cell invasion: fibronectin-binding and other mechanisms. Frontiers in microbiology 2017, 8, 2433. [Google Scholar] [CrossRef] [PubMed]
- Alva-Murillo, N.; López-Meza, J.E.; Ochoa-Zarzosa, A. Nonprofessional phagocytic cell receptors involved in Staphylococcus aureus internalization. BioMed research international 2014, 2014, 538546. [Google Scholar] [CrossRef]
- Ji, Z.; Su, J.; Hou, Y.; Yao, Z.; Yu, B.; Zhang, X. EGFR/FAK and c-Src signalling pathways mediate the internalisation of Staphylococcus aureus by osteoblasts. Cellular microbiology 2020, 22, e13240. [Google Scholar] [CrossRef]
- Renard, H.-F.; Boucrot, E. Unconventional endocytic mechanisms. Current Opinion in Cell Biology 2021, 71, 120–129. [Google Scholar] [CrossRef]
- Underhill, D.M.; Ozinsky, A.; Hajjar, A.M.; Stevens, A.; Wilson, C.B.; Bassetti, M.; Aderem, A. The Toll-like receptor 2 is recruited to macrophage phagosomes and discriminates between pathogens. Nature 1999, 401, 811–815. [Google Scholar] [CrossRef]
- Fournier, B. The function of TLR2 during staphylococcal diseases. Frontiers in cellular and infection microbiology 2013, 2, 167. [Google Scholar] [CrossRef]
- Anido, J.; Matar, P.; Albanell, J.; Guzmán, M.; Rojo, F.; Arribas, J.; Averbuch, S.; Baselga, J. ZD1839, a specific epidermal growth factor receptor (EGFR) tyrosine kinase inhibitor, induces the formation of inactive EGFR/HER2 and EGFR/HER3 heterodimers and prevents heregulin signaling in HER2-overexpressing breast cancer cells. Clinical Cancer Research 2003, 9, 1274–1283. [Google Scholar]
- Hyatt, D.C.; Ceresa, B.P. Cellular localization of the activated EGFR determines its effect on cell growth in MDA-MB-468 cells. Experimental cell research 2008, 314, 3415–3425. [Google Scholar] [CrossRef]
- Jin, M.; Wu, X.; Hu, J.; Chen, Y.; Yang, B.; Cheng, C.; Yang, M.; Zhang, X. EGFR-MEK1/2 cascade negatively regulates bactericidal function of bone marrow macrophages in mice with Staphylococcus aureus osteomyelitis. Plos Pathogens 2024, 20, e1012437. [Google Scholar] [CrossRef]
- Goldmann, O.; Lang, J.C.; Rohde, M.; May, T.; Molinari, G.; Medina, E. Alpha-hemolysin promotes internalization of Staphylococcus aureus into human lung epithelial cells via caveolin-1-and cholesterol-rich lipid rafts. Cellular and Molecular Life Sciences 2024, 81, 435. [Google Scholar] [CrossRef] [PubMed]
- Watanabe, I.; Ichiki, M.; Shiratsuchi, A.; Nakanishi, Y. TLR2-mediated survival of Staphylococcus aureus in macrophages: a novel bacterial strategy against host innate immunity. The Journal of Immunology 2007, 178, 4917–4925. [Google Scholar] [CrossRef] [PubMed]
- Truong-Bolduc, Q.; Khan, N.; Vyas, J.; Hooper, D. Tet38 efflux pump affects Staphylococcus aureus internalization by epithelial cells through interaction with CD36 and contributes to bacterial escape from acidic and nonacidic phagolysosomes. Infection and Immunity 2017, 85. [Google Scholar] [CrossRef] [PubMed]
- Haggar, A. Interaction between Extracellular adherence protein (Eap) from Staphylococcus aureus and the human host. Karolinska Institutet, 2005. [Google Scholar]
- Porayath, C.; Suresh, M.K.; Biswas, R.; Nair, B.G.; Mishra, N.; Pal, S. Autolysin mediated adherence of Staphylococcus aureus with fibronectin, gelatin and heparin. International journal of biological macromolecules 2018, 110, 179–184. [Google Scholar] [CrossRef]
- Kubica, M.; Guzik, K.; Koziel, J.; Zarebski, M.; Richter, W.; Gajkowska, B.; Golda, A.; Maciag-Gudowska, A.; Brix, K.; Shaw, L. A potential new pathway for Staphylococcus aureus dissemination: the silent survival of S. aureus phagocytosed by human monocyte-derived macrophages. PloS one 2008, 3, e1409. [Google Scholar] [CrossRef]
- Banville, R.R. Factors affecting growth of Staphylococcus aureus L forms on semidefined medium. Journal of bacteriology 1964, 87, 1192–1197. [Google Scholar] [CrossRef]
- Kawai, Y.; Mercier, R.; Mickiewicz, K.; Serafini, A.; Sório de Carvalho, L.P.; Errington, J. Crucial role for central carbon metabolism in the bacterial L-form switch and killing by β-lactam antibiotics. Nature microbiology 2019, 4, 1716–1726. [Google Scholar] [CrossRef]
- Han, J.; Shi, W.; Xu, X.; Wang, S.; Zhang, S.; He, L.; Sun, X.; Zhang, Y. Conditions and mutations affecting Staphylococcus aureus L-form formation. Microbiology 2015, 161, 57–66. [Google Scholar] [CrossRef]
- Petrovic Fabijan, A.; Martinez-Martin, D.; Venturini, C.; Mickiewicz, K.; Flores-Rodriguez, N.; Errington, J.; Iredell, J. L-form switching in Escherichia coli as a common β-lactam resistance mechanism. Microbiology Spectrum 2022, 10, e02419–02422. [Google Scholar] [CrossRef] [PubMed]
- Kawai, Y.; Mickiewicz, K.; Errington, J. Lysozyme counteracts β-lactam antibiotics by promoting the emergence of L-form bacteria. Cell 2018, 172, 1038–1049, e1010. [Google Scholar] [CrossRef] [PubMed]
- Kong, L.-X.; Wang, Z.; Shou, Y.-K.; Zhou, X.-D.; Zong, Y.-W.; Tong, T.; Liao, M.; Han, Q.; Li, Y.; Cheng, L. The FnBPA from methicillin-resistant Staphylococcus aureus promoted development of oral squamous cell carcinoma. Journal of Oral Microbiology 2022, 14, 2098644. [Google Scholar] [CrossRef]
- Hattar, K.; Reinert, C.P.; Sibelius, U.; Gökyildirim, M.Y.; Subtil, F.S.; Wilhelm, J.; Eul, B.; Dahlem, G.; Grimminger, F.; Seeger, W. Lipoteichoic acids from Staphylococcus aureus stimulate proliferation of human non-small-cell lung cancer cells in vitro. Cancer Immunology, Immunotherapy 2017, 66, 799–809. [Google Scholar] [CrossRef]
- Jean, A.T.S.; Swofford, C.A.; Panteli, J.T.; Brentzel, Z.J.; Forbes, N.S. Bacterial delivery of Staphylococcus aureus α-hemolysin causes regression and necrosis in murine tumors. Molecular Therapy 2014, 22, 1266–1274. [Google Scholar] [CrossRef]
- Mahmoodzadeh Hosseini, H.; Imani Fooladi, A.A.; Soleimanirad, J.; Nourani, M.R.; Davaran, S.; Mahdavi, M. Staphylococcal entorotoxin B anchored exosome induces apoptosis in negative esterogen receptor breast cancer cells. Tumor Biology 2014, 35, 3699–3707. [Google Scholar] [CrossRef]
- Stelzner, K.; Winkler, A.-C.; Liang, C.; Boyny, A.; Ade, C.P.; Dandekar, T.; Fraunholz, M.J.; Rudel, T. Intracellular Staphylococcus aureus perturbs the host cell Ca2+ homeostasis to promote cell death. MBio 2020, 11. [Google Scholar] [CrossRef]
- Terasaki, A.; Ahmed, F.; Okuno, A.; Peng, Z.; Cao, D.-Y.; Saito, S. Neutrophils Expressing Programmed Death-Ligand 1 Play an Indispensable Role in Effective Bacterial Elimination and Resolving Inflammation in Methicillin-Resistant Staphylococcus aureus Infection. Pathogens 2024, 13, 401. [Google Scholar] [CrossRef] [PubMed]
- Lan, H.-R.; Chen, M.; Yao, S.-Y.; Chen, J.-X.; Jin, K.-T. Novel immunotherapies for breast cancer: Focus on 2023 findings. International Immunopharmacology 2024, 128, 111549. [Google Scholar] [CrossRef]
- Devoy, C.; Flores Bueso, Y.; Tangney, M. Understanding and harnessing triple-negative breast cancer-related microbiota in oncology. Frontiers in Oncology 2022, 12, 1020121. [Google Scholar] [CrossRef]
- Wu, B.; Song, M.; Dong, Q.; Xiang, G.; Li, J.; Ma, X.; Wei, F. UBR5 promotes tumor immune evasion through enhancing IFN-γ-induced PDL1 transcription in triple negative breast cancer. Theranostics 2022, 12, 5086. [Google Scholar] [CrossRef]
- Parker, D.; Prince, A. Staphylococcus aureus induces type I IFN signaling in dendritic cells via TLR9. The Journal of Immunology 2012, 189, 4040–4046. [Google Scholar] [CrossRef] [PubMed]
- Wang, J.; Roderiquez, G.; Norcross, M.A. Control of Adaptive Immune Responses by Staphylococcus aureus through IL-10, PD-L1 and TLR2. Scientific reports 2012, 2, 606. [Google Scholar] [CrossRef] [PubMed]
- Fishbein, S.R.; Mahmud, B.; Dantas, G. Antibiotic perturbations to the gut microbiome. Nature Reviews Microbiology 2023, 21, 772–788. [Google Scholar] [CrossRef] [PubMed]
- Levy, M.; Kolodziejczyk, A.A.; Thaiss, C.A.; Elinav, E. Dysbiosis and the immune system. Nature Reviews Immunology 2017, 17, 219–232. [Google Scholar] [CrossRef]
- Pinato, D.J.; Gramenitskaya, D.; Altmann, D.M.; Boyton, R.J.; Mullish, B.H.; Marchesi, J.R.; Bower, M. Antibiotic therapy and outcome from immune-checkpoint inhibitors. Journal for immunotherapy of cancer 2019, 7, 1–8. [Google Scholar] [CrossRef]
- Hopkins, A.M.; Badaoui, S.; Kichenadasse, G.; Karapetis, C.S.; McKinnon, R.A.; Rowland, A.; Sorich, M.J. Efficacy of atezolizumab in patients with advanced NSCLC receiving concomitant antibiotic or proton pump inhibitor treatment: pooled analysis of five randomized control trials. Journal of Thoracic Oncology 2022, 17, 758–767. [Google Scholar] [CrossRef]
- Derosa, L.; Routy, B.; Thomas, A.M.; Iebba, V.; Zalcman, G.; Friard, S.; Mazieres, J.; Audigier-Valette, C.; Moro-Sibilot, D.; Goldwasser, F. Intestinal Akkermansia muciniphila predicts clinical response to PD-1 blockade in patients with advanced non-small-cell lung cancer. Nature medicine 2022, 28, 315–324. [Google Scholar] [CrossRef]
Figure 1.
Internalization of S. aureus in triple-negative breast cancer and non-cancerous breast cell lines (a) Representative flow cytometry scatter plots depicting the percentage of viable eFluor 450-positive cells, indicating intracellular S. aureus, in MDA-MB-468, MDA-MB-231, MDA-MB-453, and MCF-12A cell lines at 24 hours post-infection. Cells were incubated with eFluor 450-labeled S. aureus for 2 hours at multiplicities of infection (MOIs) of 10, 50, and 200, followed by washing and gentamicin treatment to eliminate extracellular bacteria. (b) Quantification of the percentage of infected cells across the different cell lines, highlighting differences in S. aureus internalization efficiency. (c) Geometric mean fluorescence intensity (GMFI) of eFluor 450 in infected cells, representing the intracellular bacterial burden per cell. Statistical comparisons were performed using a mixed-effects model with Tukey’s multiple comparisons test. Data are presented as individual values with standard deviations (SD) from at least three independent experiments. Different letters indicate statistical significance (p < 0.0001) between groups. Detailed statistical analyses are provided in Table S1. (d) Correlation between the percentage of infected cells and intracellular bacterial burden at MOIs of 10, 50, and 200, demonstrating a dose-dependent relationship between S. aureus internalization and bacterial load per cell.
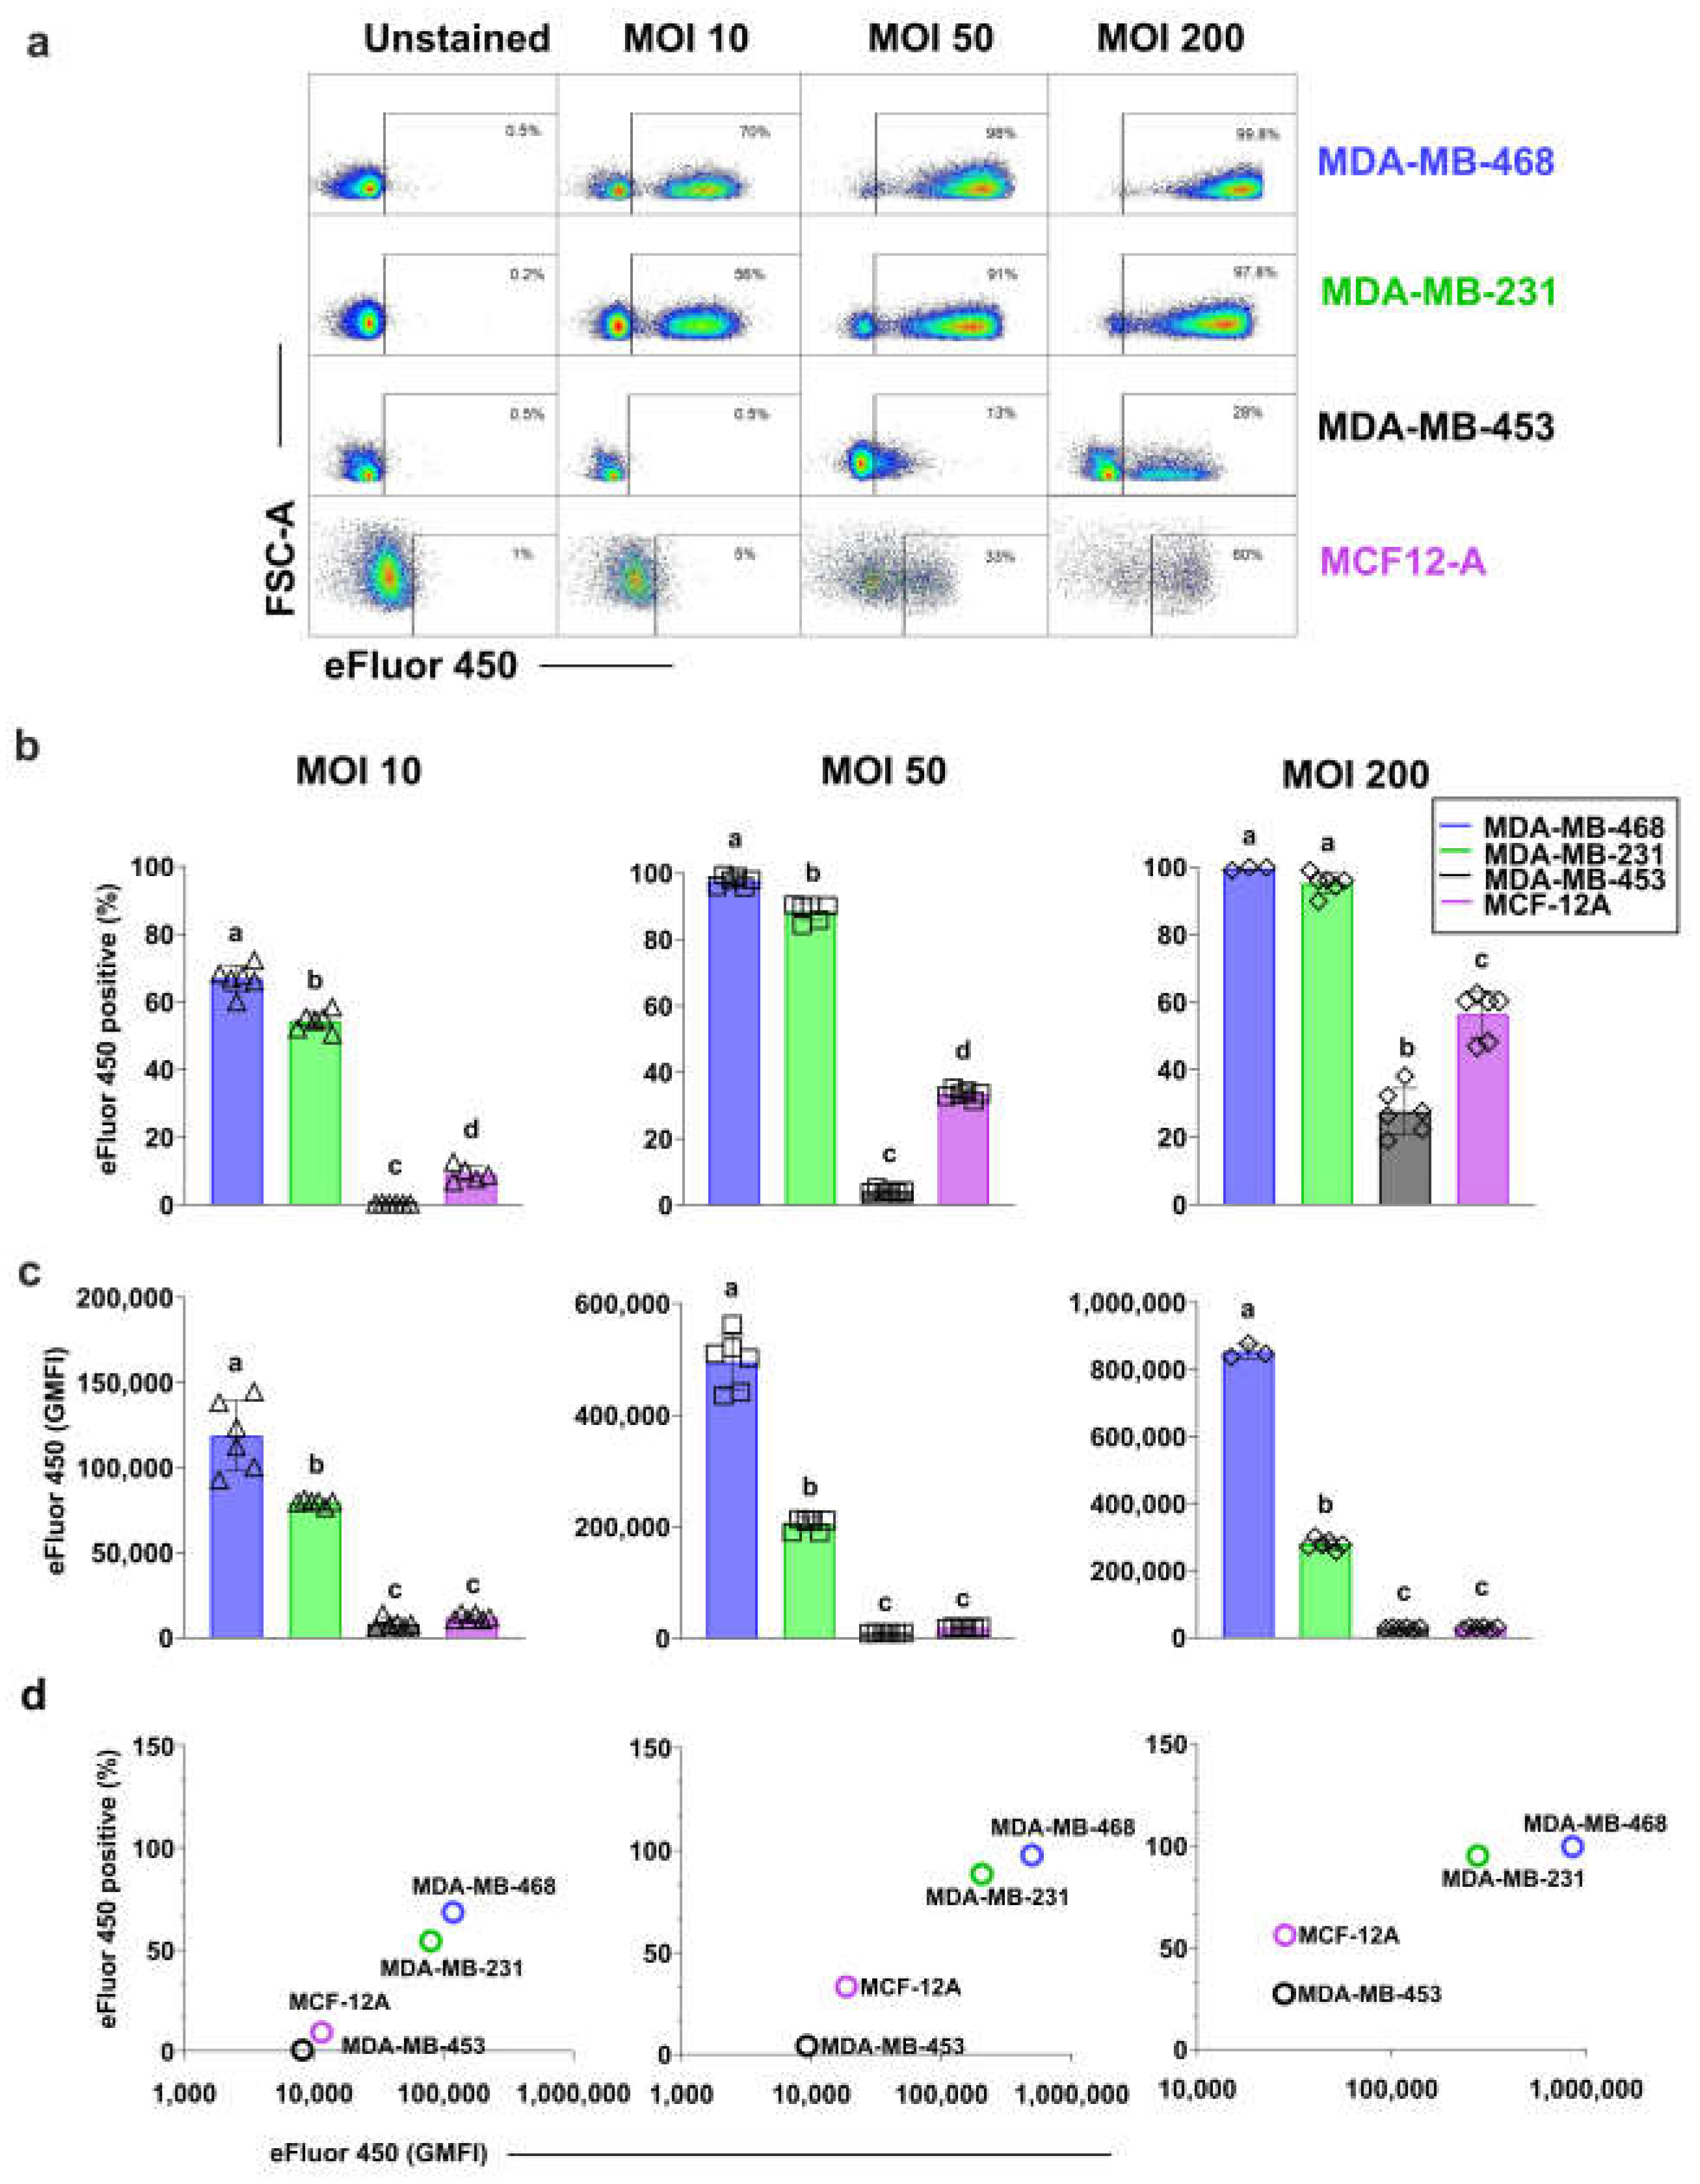
Figure 2.
Intracellular viable S. aureus clearance in triple-negative breast cancer and non-cancerous breast epithelial cell lines. (a) Persistence of viable intracellular S. aureus at MOI 50 and MOI 200 was assessed by quantifying colony-forming units (CFUs) from cell lysates over 7 days. A pseudocount of 1 was added to indicate the absence of bacterial growth. Bacterial clearance rates were estimated using simple linear regression, and two-tailed t-tests were performed to compare slopes between cell lines. All data are presented as mean ± SD of three replicates.
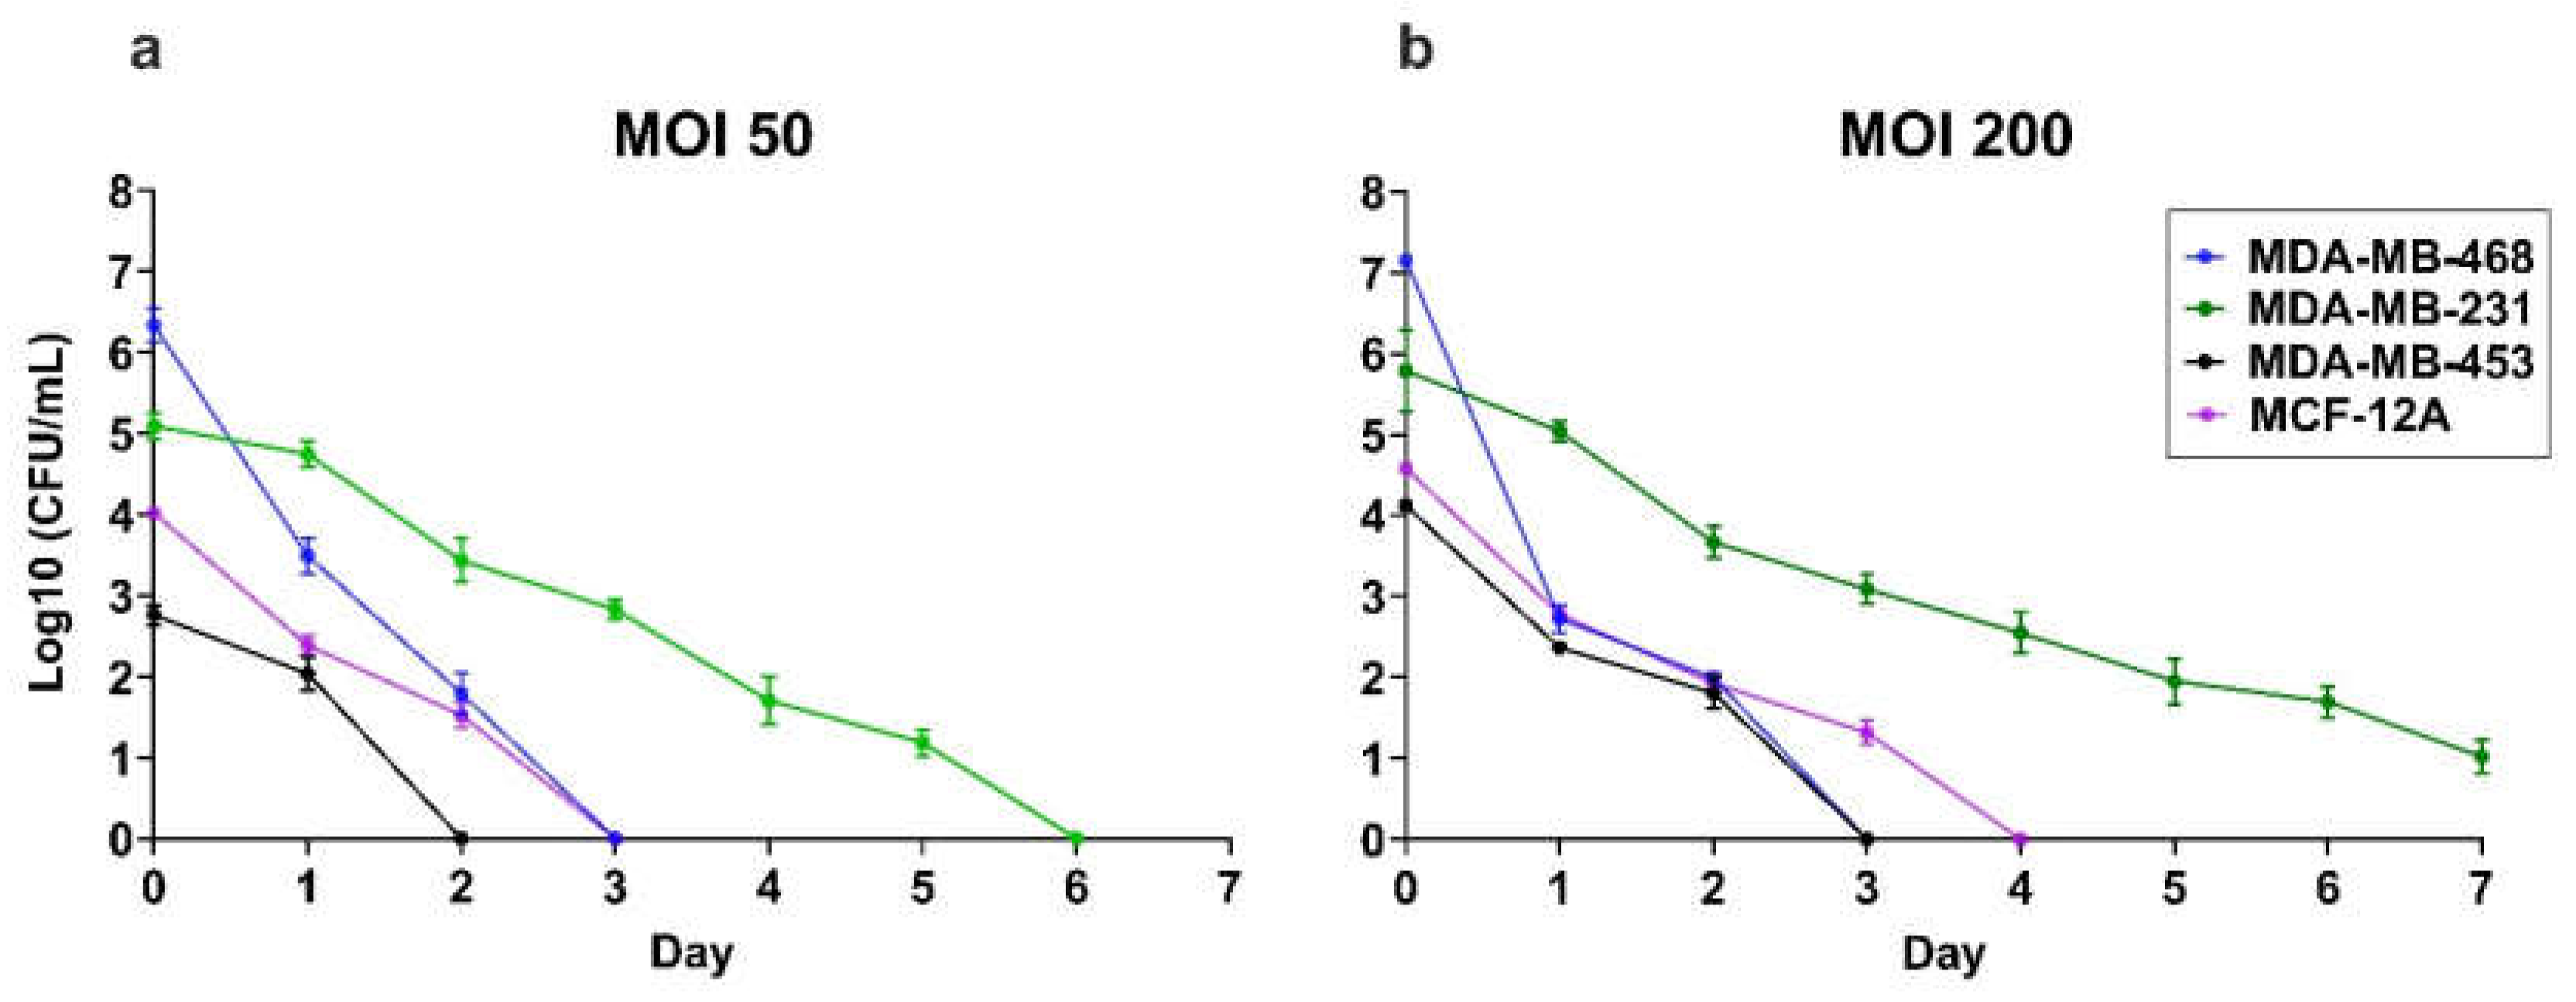
Figure 3.
Morphology of intracellular S. aureus in TNBC Cells. Transmission electron microscopy images of intracellular S. aureus in MDA-MB-231 cells at 24 hours (a–c) and 7 days (d–f) post-infection. (a) S. aureus within the cytoplasm (white arrowhead), appearing as dense, spherical structures with a well-defined cell wall, characteristic of Gram-positive cocci. Some intact bacteria are enclosed within a phagosome (green arrowhead), where a visible separation between the inner cytoplasmic membrane and the thick peptidoglycan layer suggests bacterial adaptation to the intracellular environment. The surrounding host cytoplasm contains intracellular vacuoles and membrane compartments, indicative of potential bacterial containment within a phagosomal or vacuolar compartment. Degraded bacterial remnants dispersed in the cytoplasm (orange arrowheads) suggest partial bacterial degradation. (b) S. aureus enclosed within a phagosome (blue arrowhead), maintaining its characteristic coccoid shape and thick peptidoglycan layer, indicative of intracellular persistence. (c) L-form S. aureus (red arrowhead) within the cytoplasm, distinguished by an irregular shape and the absence of a rigid cell wall. This morphotype suggests bacterial adaptation to intracellular stress, potentially facilitating immune evasion and antibiotic resistance. (d) A mixture of bacterial morphotypes 7 days post-infection, including intact coccoid bacteria (white arrowhead), L-forms (red arrowhead), and partially degraded bacteria (orange arrowhead), highlighting the diverse survival strategies of intracellular S. aureus. (e) Intact S. aureus (blue arrowhead) and actively dividing bacteria within a phagosome (purple arrowheads), indicating ongoing bacterial replication despite the intracellular environment. (f) Degraded bacterial remnants within a phagosome (orange arrowheads), suggesting host-mediated bacterial breakdown, though complete clearance appears incomplete. These images illustrate the morphological diversity of S. aureus within TNBC cells, emphasizing bacterial adaptation, survival, and persistence over time.
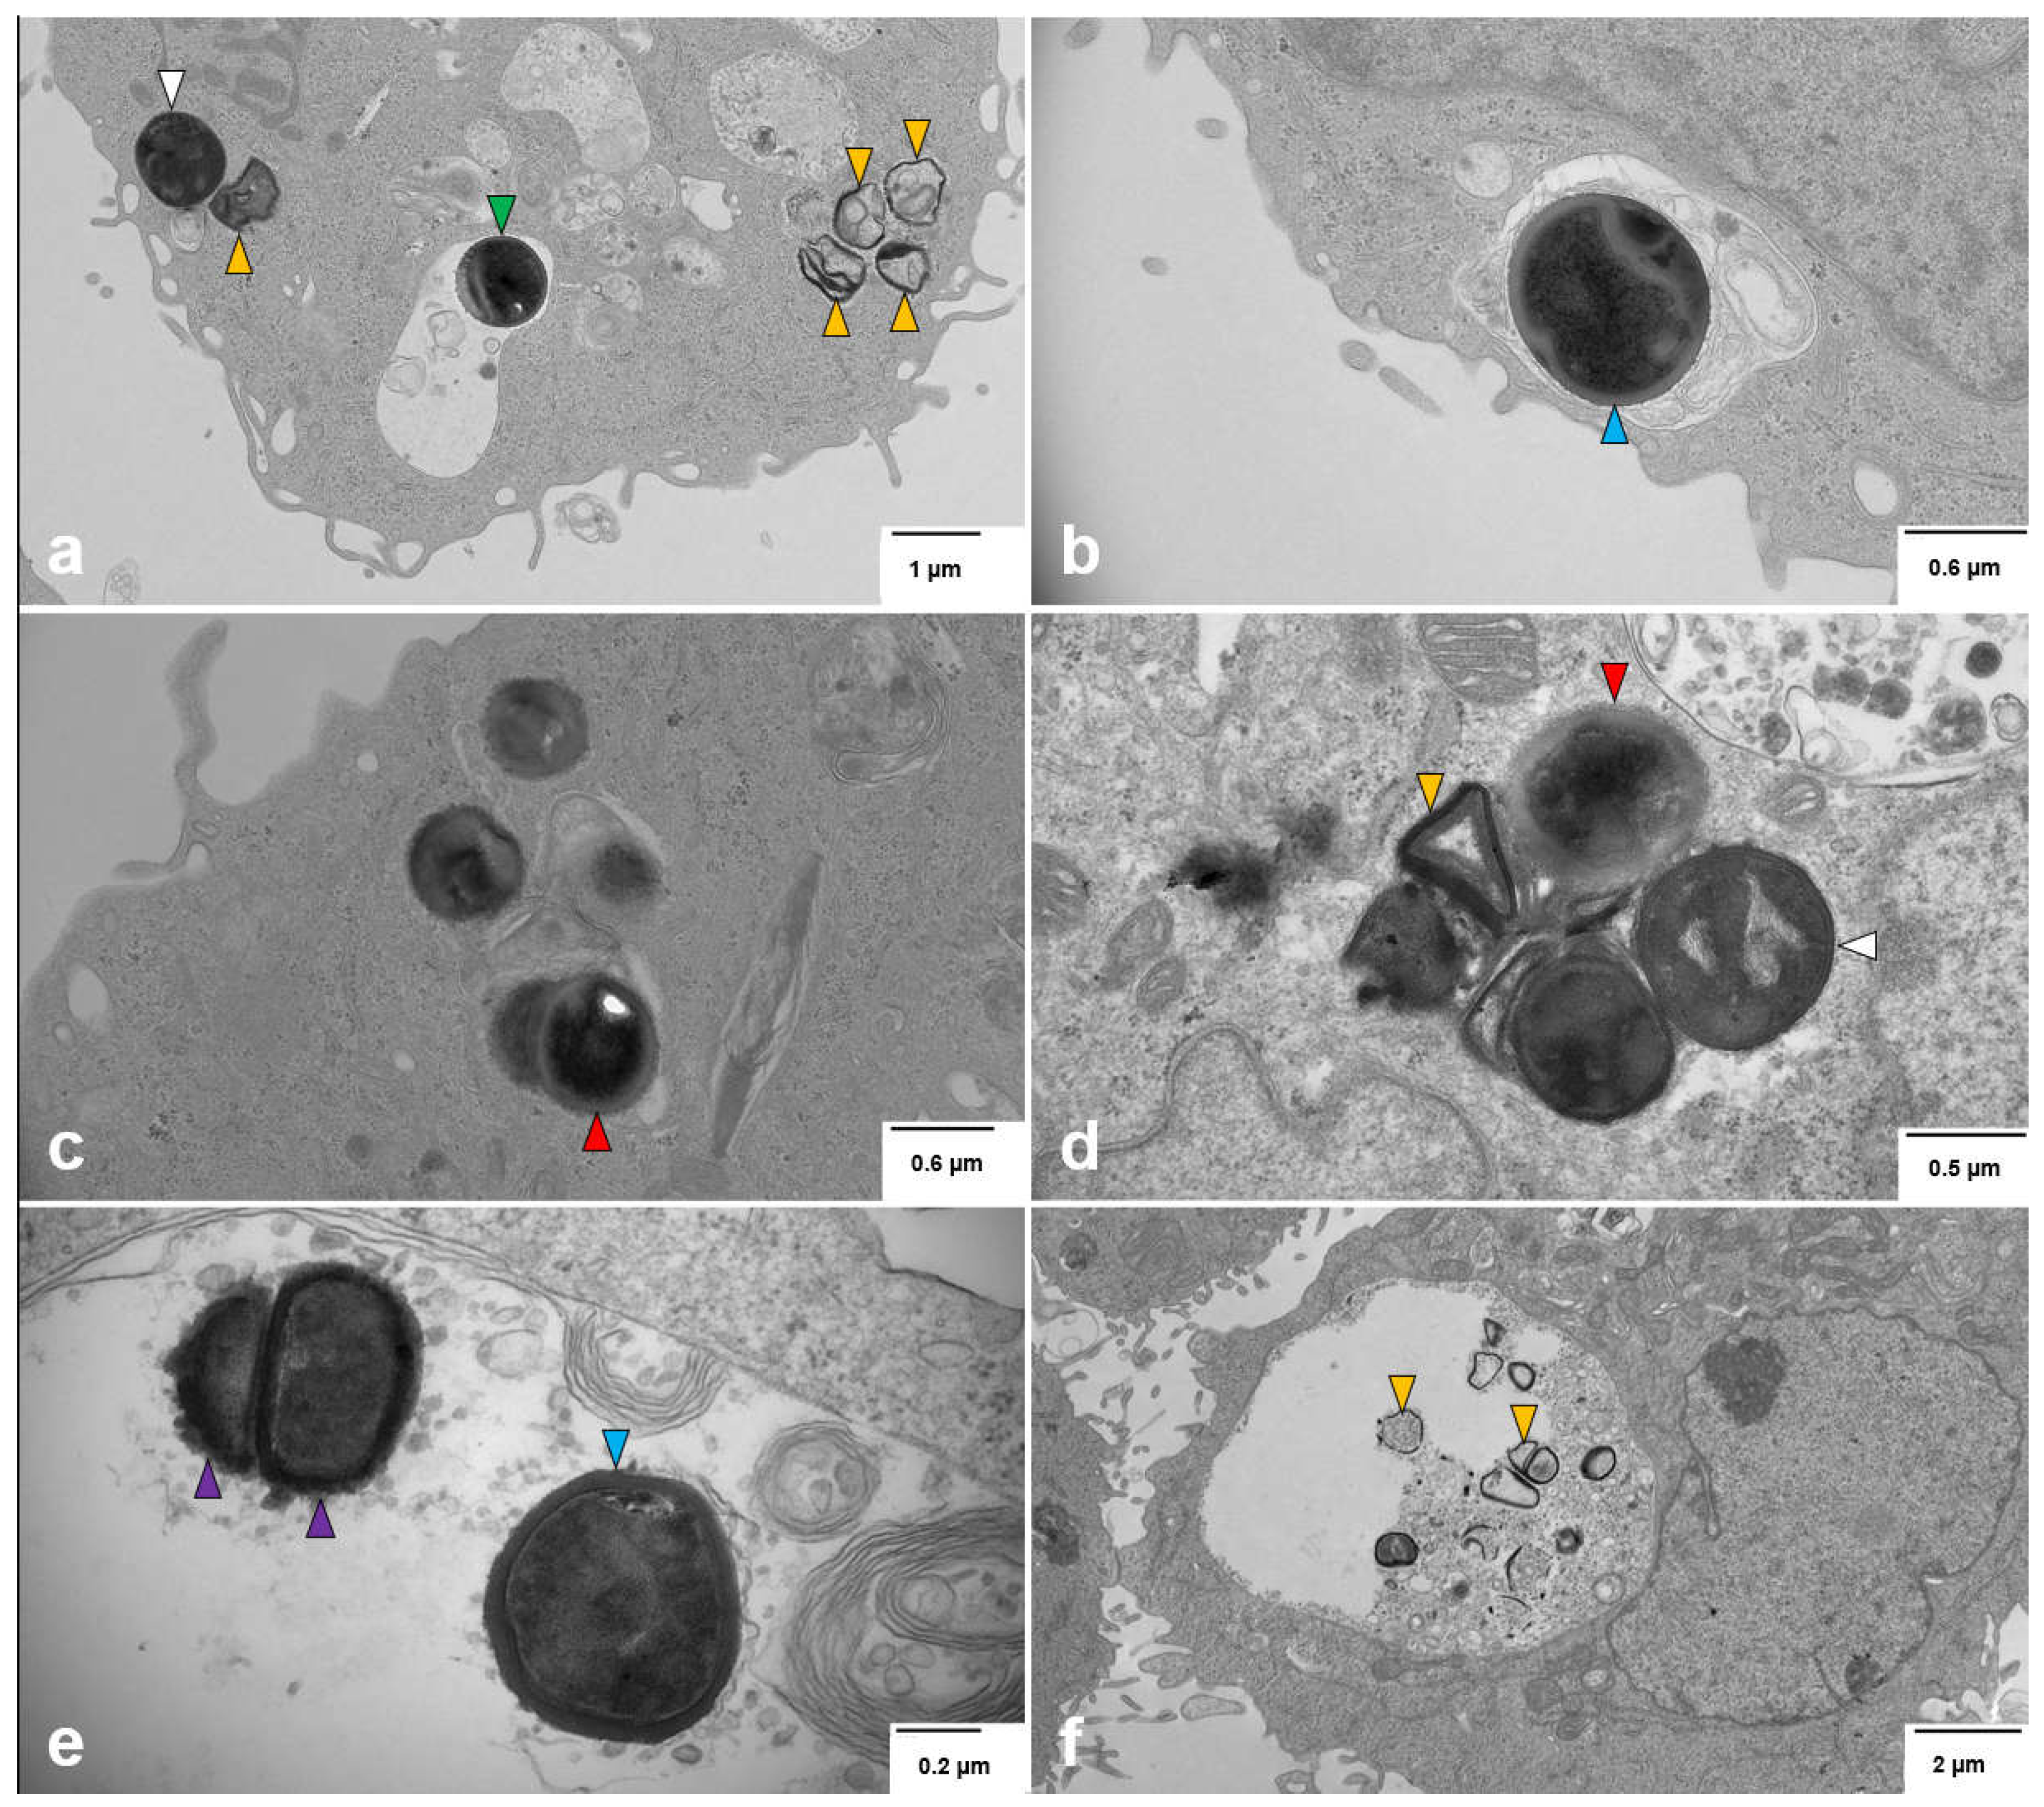
Figure 5.
PD-L1 surface expression and the impact of intracellular S. aureus in breast cell lines (a) Baseline PD-L1 expression in three TNBC cell lines (MDA-MB-231, MDA-MB-468, and MDA-MB-453) and the non-cancerous epithelial cell line (MCF-12A), shown as histograms and geometric mean fluorescence intensity (GMFI). Unstained controls are shown as dashed lines, and PD-L1-stained cells as solid lines, with corresponding GMFI values displayed to indicate relative expression levels. (b) PD-L1 expression across breast cell line with and without IFN-γ (5 μM) stimulation. MDA-MB-468 cells were infected at MOI 5, MDA-MB-231 and MDA-MB-453 at MOI 50 or 200, and MCF-12A at MOI 200, based on optimal infection rates with minimal cytotoxicity. PD-L1 expression was analysed at 24 h and 48 h post-infection. (c) Long-term (7-days) post-infection PD-L1 expression in MDA-MB-231. Cells were infected with S. aureus and then cultured for 6 days without IFN-γ before stimulation with 5 μM IFN-γ for 24 hours. (d) Schematic overview of the experimental design. One-way ANOVA with Tukey’s multiple comparisons was used for statistical analysis. Statistics for relevant comparison were presented in the figures, and full statistics for all comparisons can be found in Table S3-S7. Data represent the mean ± SD from at least three independent experiments. Statistical significance: p > 0.05; *p < 0.05, ** p < 0.01, *** p < 0.001, ****p < 0.0001.
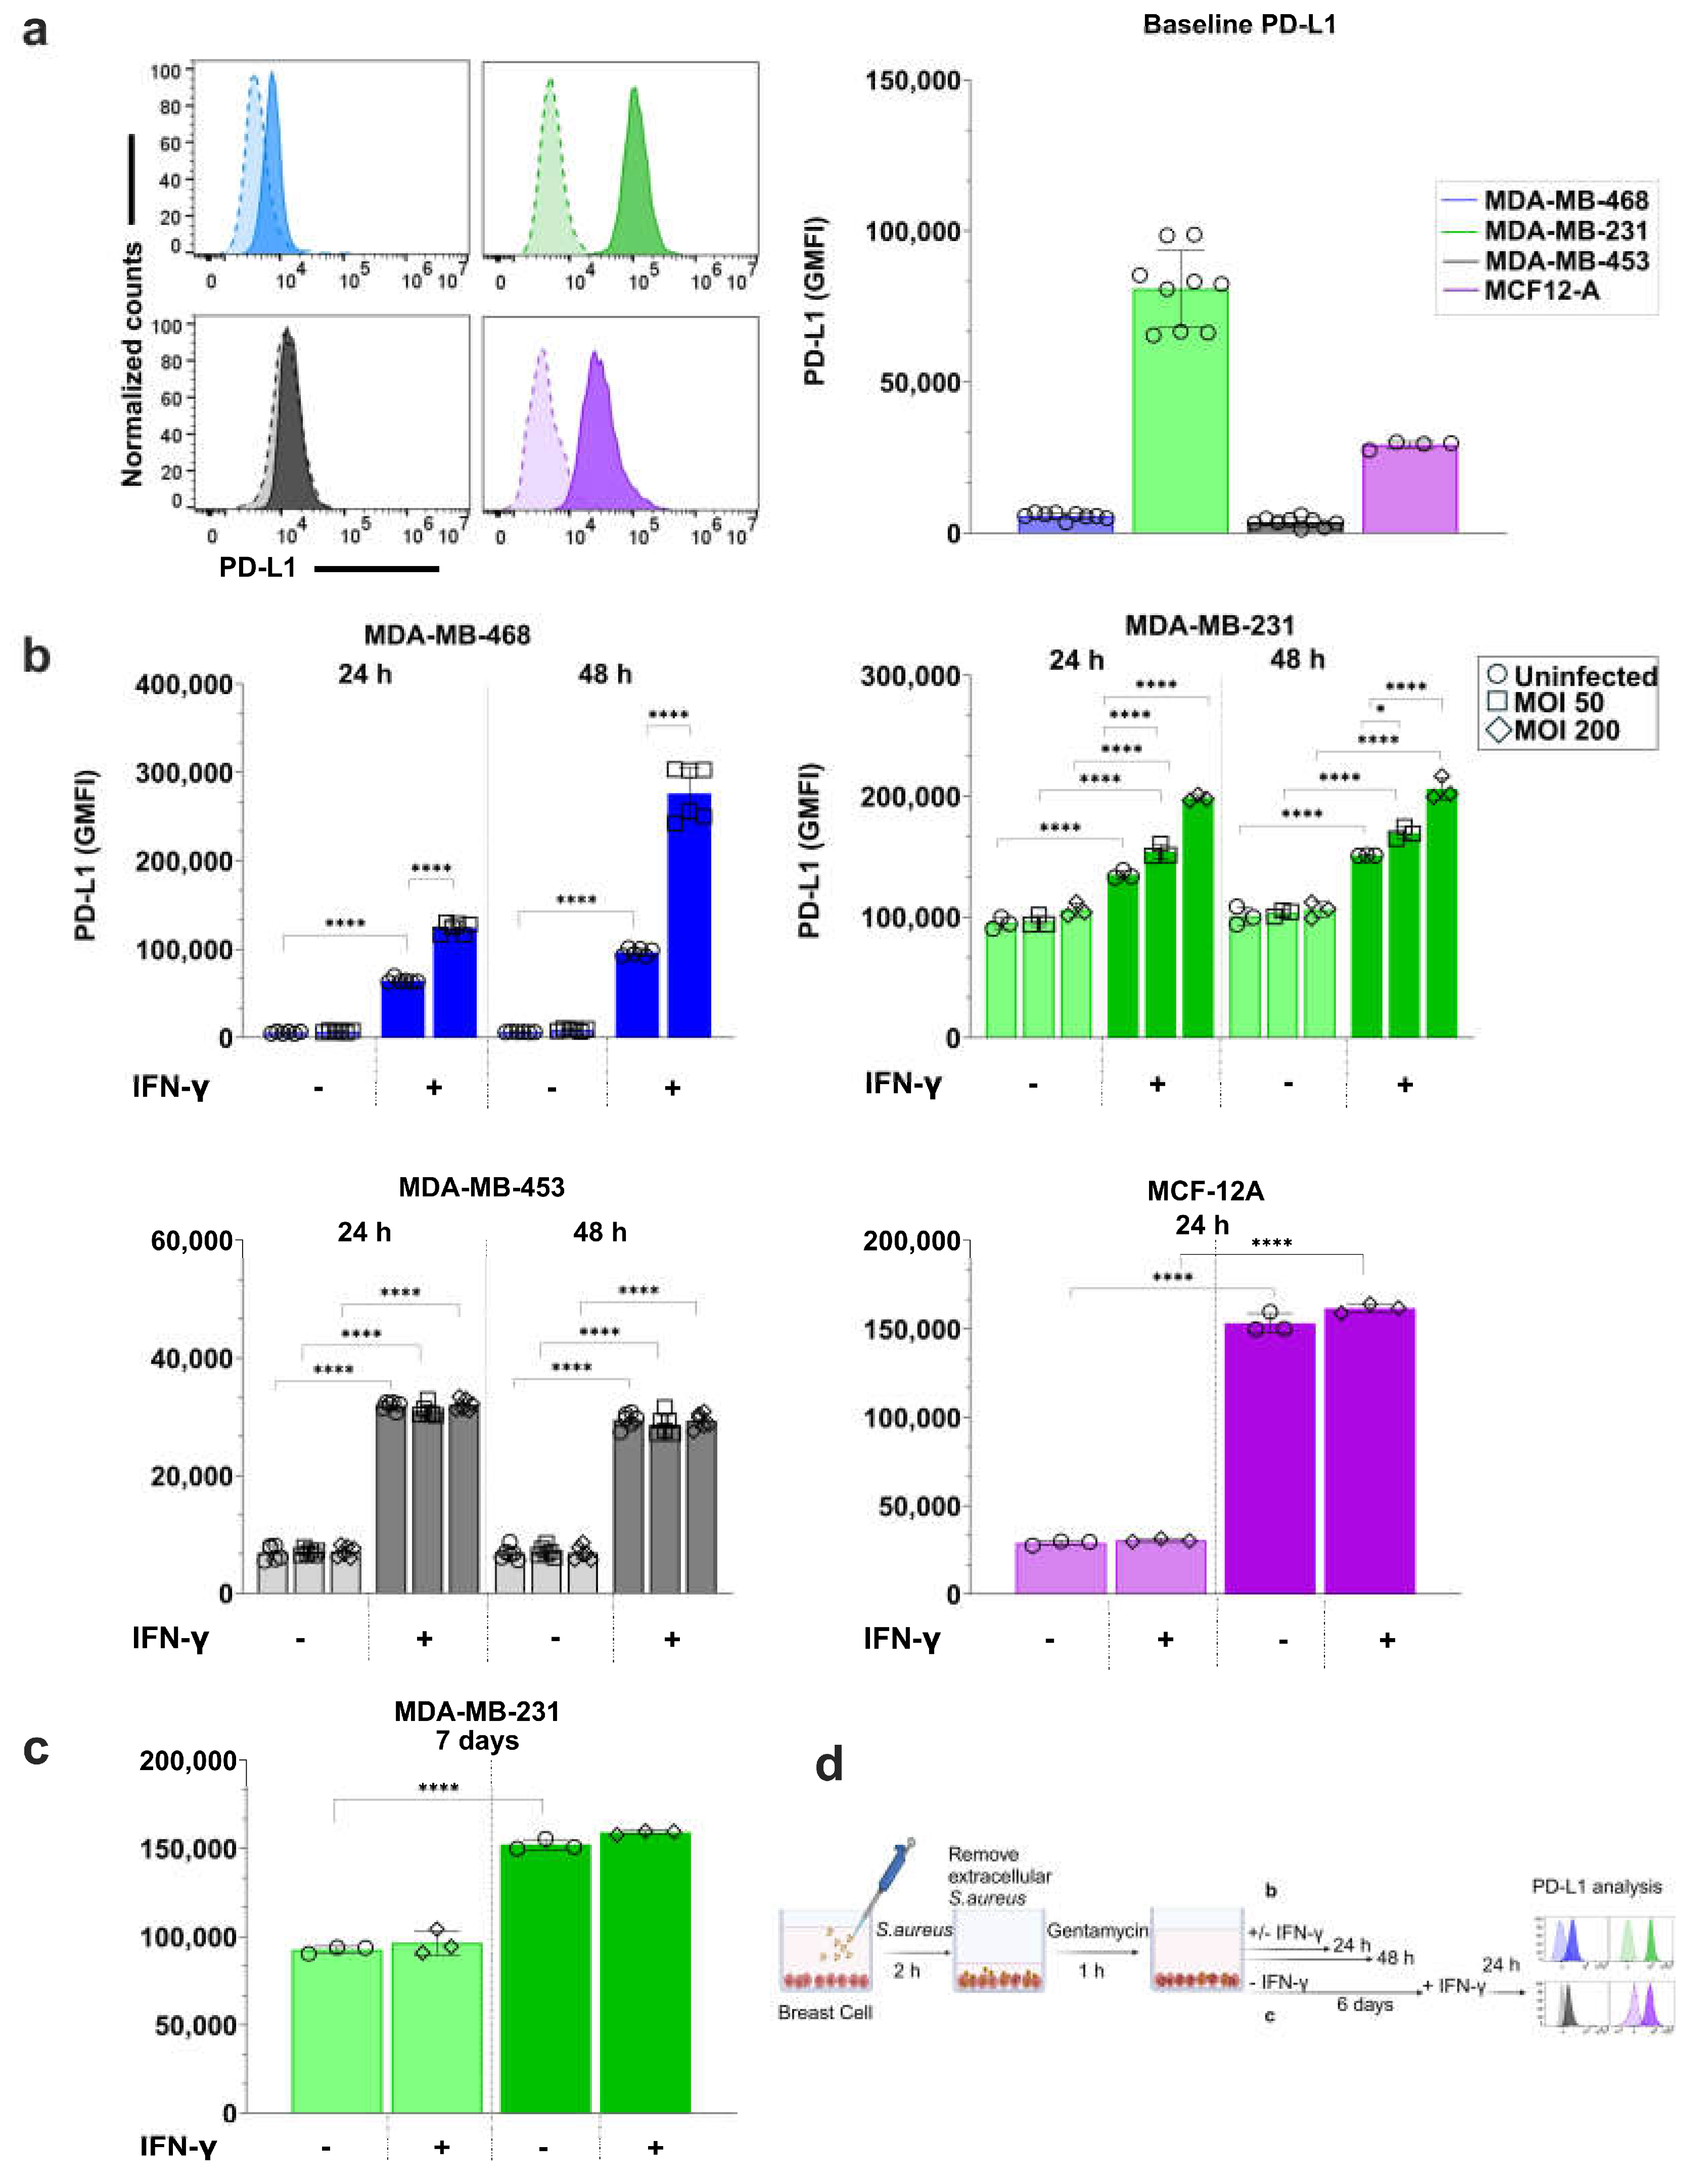
Figure 6.
S. aureus infection enhances IFN-γ-induced STAT1 phosphorylation in breast cell lines. (a) Western blot analysis of total STAT1 and phosphorylated STAT1 (p-STAT1(Y701)) expression in breast cell lines treated with or without IFN-γ, following S. aureus infection at MOI 50 for MDA-MB-468 and MDA-MB-231 and at MOI 200 for MDA-MB-453 and MCF012A. Cells were infected with S. aureus for 2 hours and then treated with 5 μM IFN-γ for 24 hours. Total protein was extracted and analyzed for p-STAT1, STAT1, and β-actin as a loading control. (b) Total STAT1 levels remain unchanged across all conditions. (c) Quantification of relative p-STAT1 levels shows a significant increase with IFN-γ treatment, which is further enhanced in S. aureus-infected MDA-MB-468 and MDA-MB-231 treated with IFN-γ. Data represent mean ± SD from two to three independent experiments. Statistical significance: p > 0.05; **p < 0.01, ****p < 0.0001.
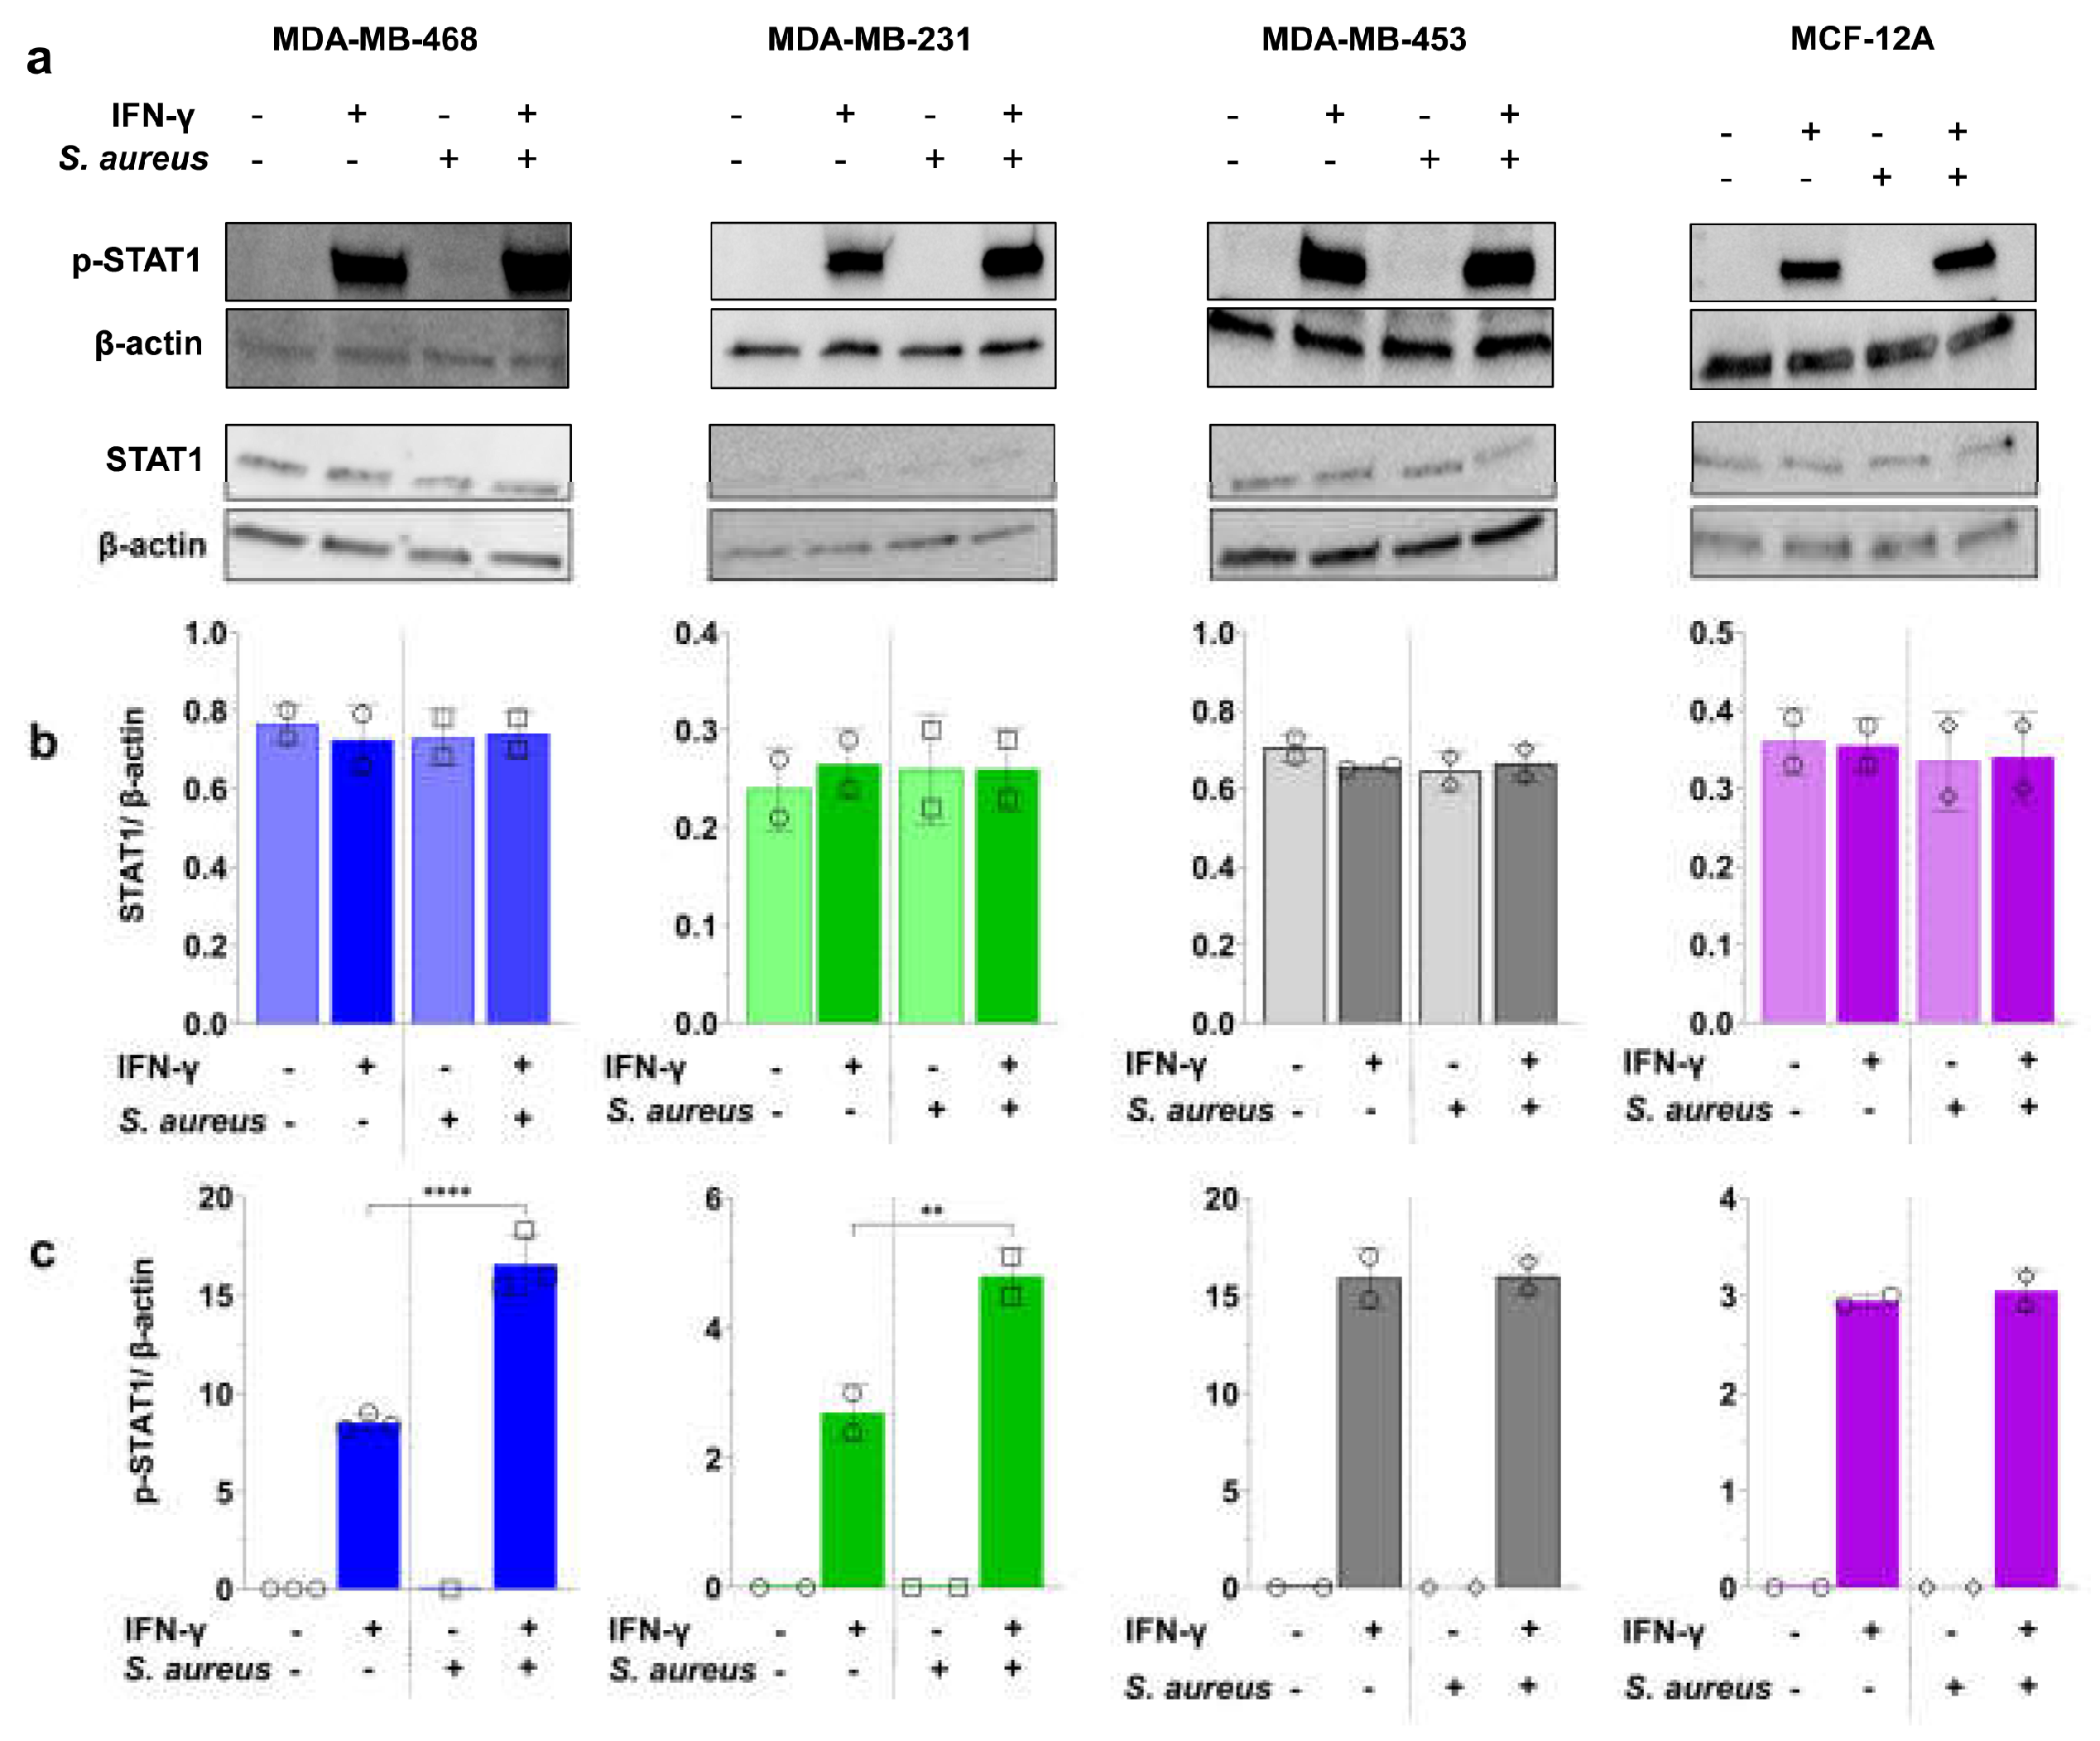
Figure 7.
Baseline TLR2 expression and TLR2 agonist-induced PD-L1 upregulation in breast cell lines. (a) Representative flow cytometry histograms of baseline TLR2 expression in breast cell lines. Unstained controls are shown as dashed lines, and TLR2-stained cells as solid lines, with corresponding GMFI values displayed to indicate relative expression levels (b) TLR2 GMFI in cell lines following 24-hour treatment with 5 µM IFN-γ. (c) PD-L1 GMFI in cell lines following 24-hour treatment with 1 µg/mL or 30 µg/mL purified S. aureus LTA or 1 µg/mL Pam3CSK4, with or without 5 µM IFN-γ-stimulation. Statistical analysis was performed using one-way ANOVA with Tukey’s multiple comparisons test. Data are presented as mean ± SD from at least three independent experiments. Statistical significance: p > 0.05; *p < 0.05; **p < 0.01; ***p < 0.001; ****p < 0.0001.
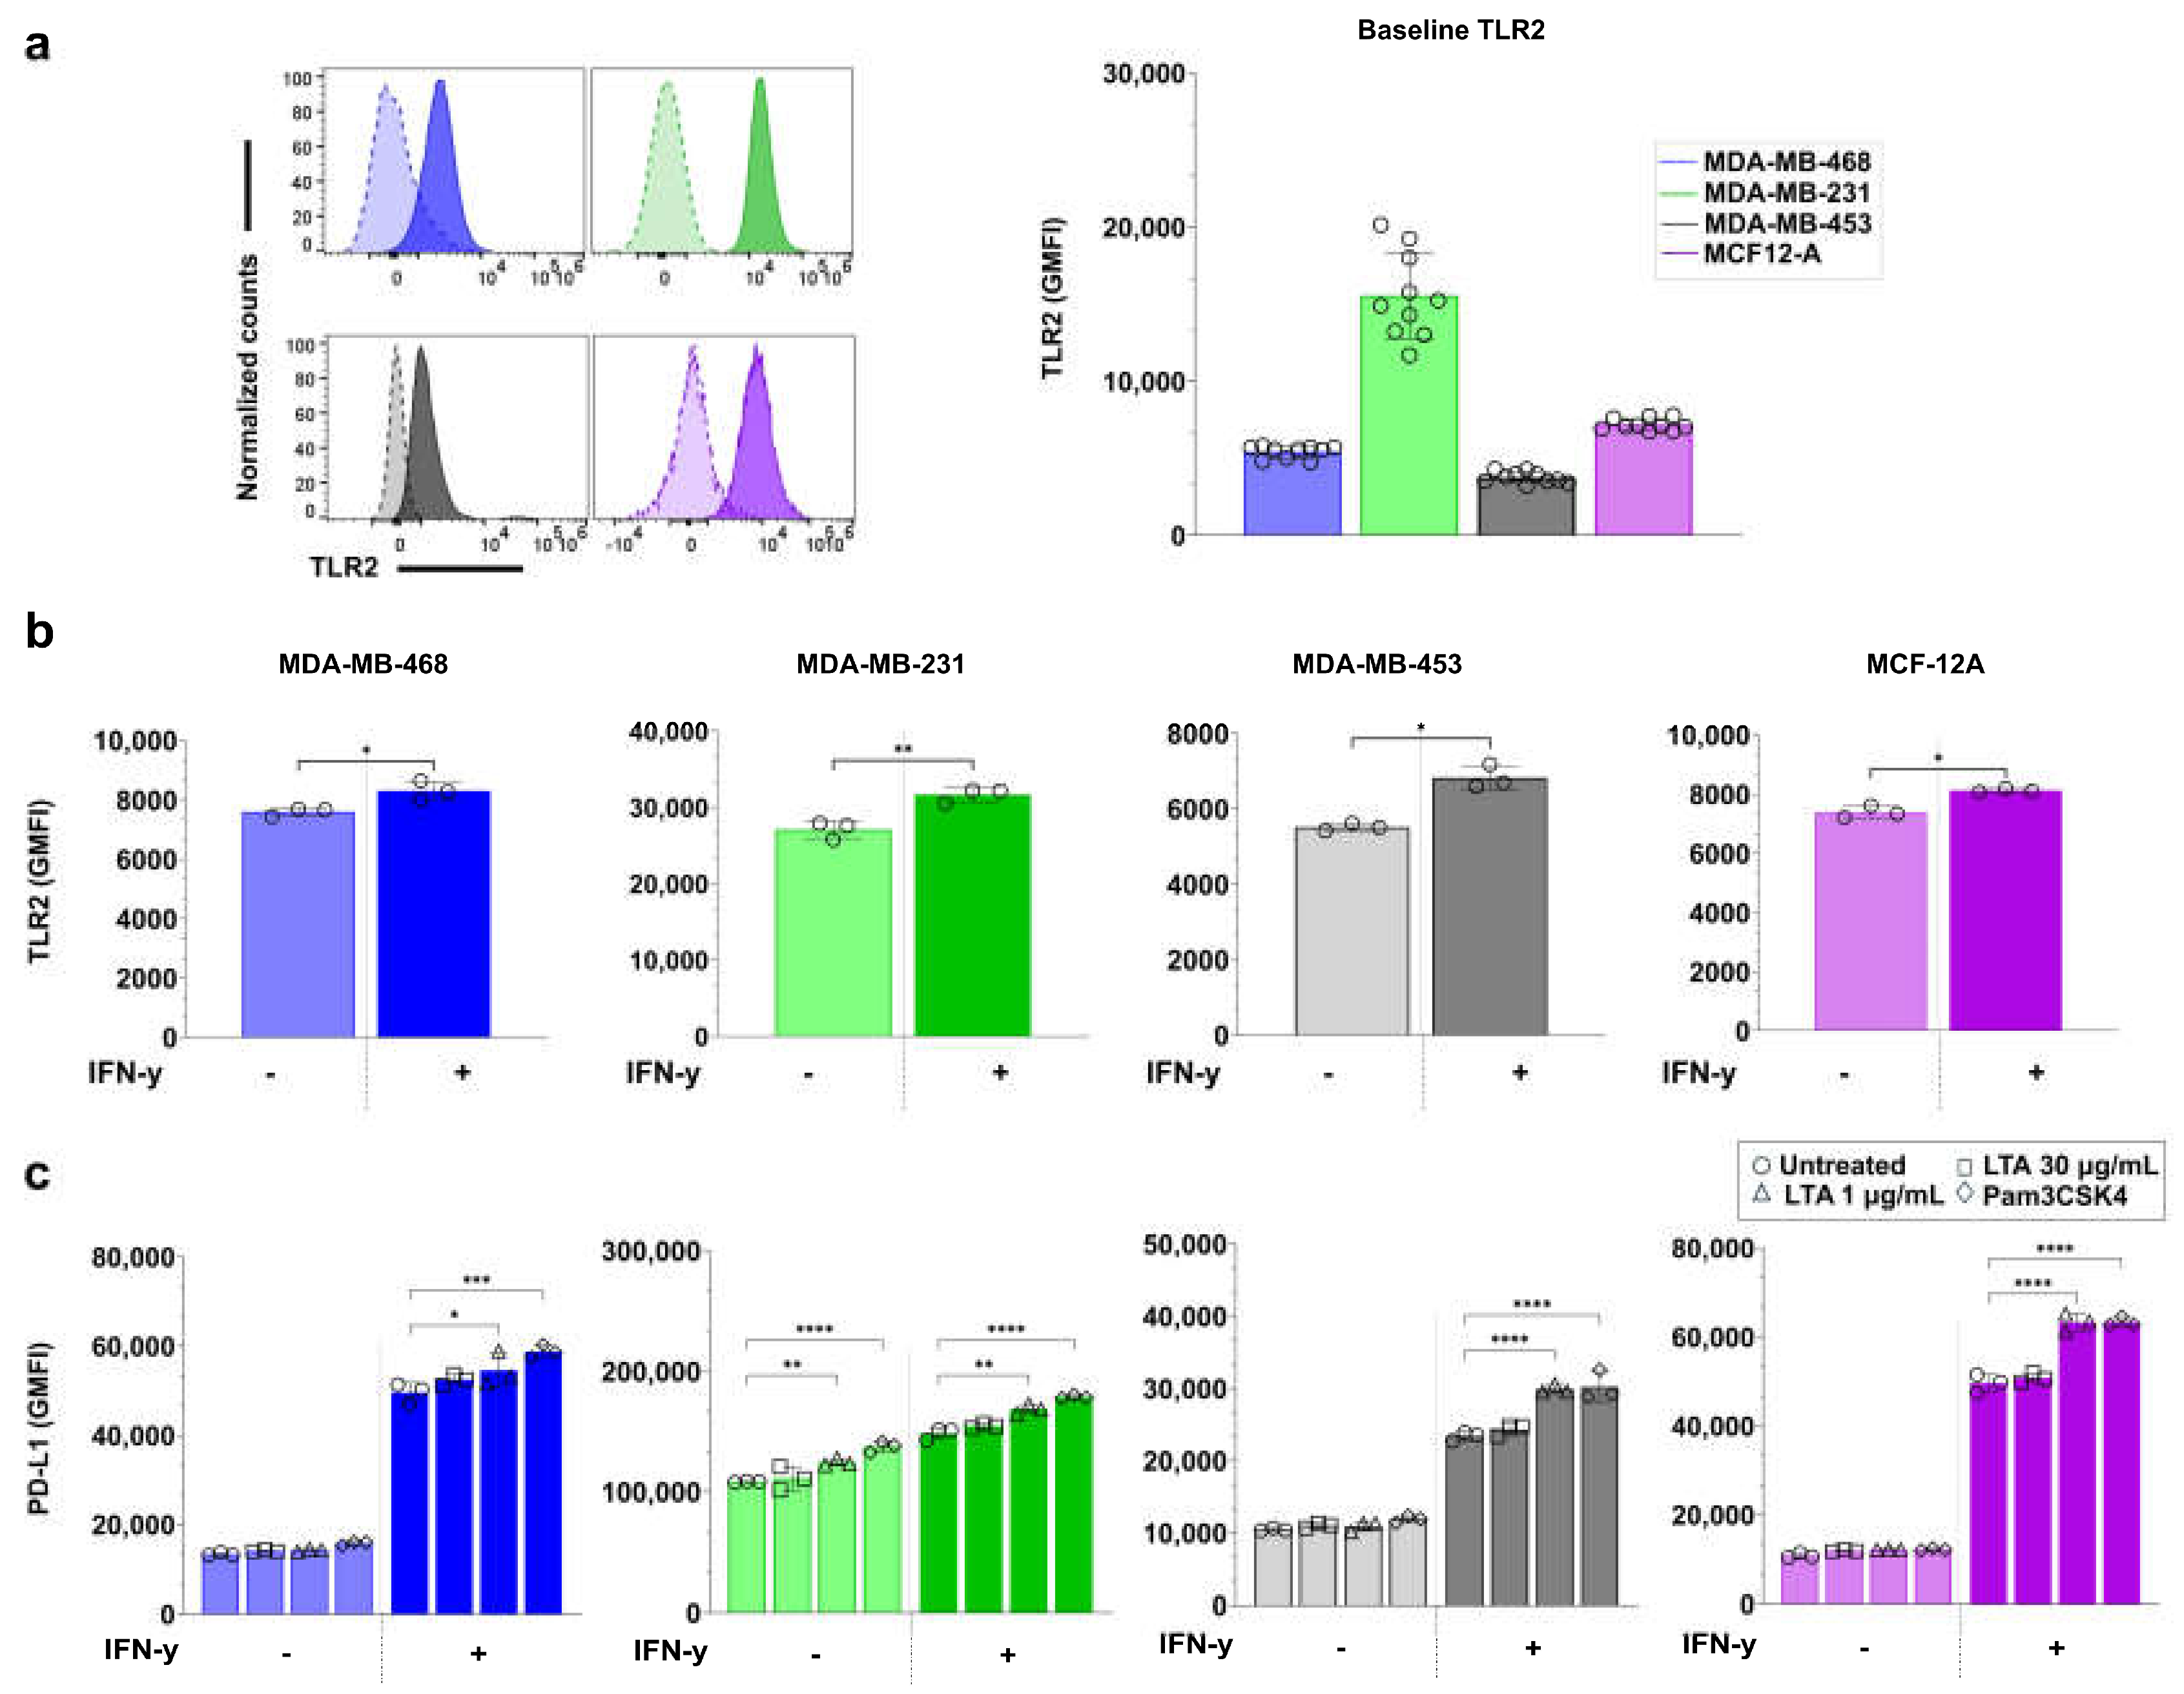
Disclaimer/Publisher’s Note: The statements, opinions and data contained in all publications are solely those of the individual author(s) and contributor(s) and not of MDPI and/or the editor(s). MDPI and/or the editor(s) disclaim responsibility for any injury to people or property resulting from any ideas, methods, instructions or products referred to in the content. |
© 2025 by the authors. Licensee MDPI, Basel, Switzerland. This article is an open access article distributed under the terms and conditions of the Creative Commons Attribution (CC BY) license (http://creativecommons.org/licenses/by/4.0/).
Copyright: This open access article is published under a Creative Commons CC BY 4.0 license, which permit the free download, distribution, and reuse, provided that the author and preprint are cited in any reuse.


