
Submitted:
09 April 2025
Posted:
09 April 2025
You are already at the latest version
Abstract
The increasing pressure for transparency in corporate sustainability reporting, especially under frameworks such as the Corporate Sustainability Reporting Directive and the European Sustainability Reporting Standards, has raised the need for sector-specific models to integrate financial, social, and environmental indicators coherently and measurably. This study proposes a composite econometric model to assess the sustainability performance of companies in the construction sector in a digital context, a domain that remains underexplored despite its substantial economic and environmental impact. Drawing on a sample of 1,600 Romanian construction companies over a ten-year period (2013–2023), the study develops a multidimensional sustainability score and tests its financial drivers using Ordinary Least Squares regression models. The model incorporates nine financial structure variables as predictors of sustainability outcomes across three dimensions - financial, social, and environmental - while ensuring robustness through heteroscedasticity and multicollinearity diagnostics. Results show that indicators such as return on assets, debt ratio, and equity structure significantly influence sustainability performance, particularly in the financial and environmental dimensions. In contrast, the social dimension exhibits lower explanatory power. The findings suggest that financial resilience plays a critical role in shaping sustainable practices in the construction industry and support the adoption of integrated models for performance benchmarking and policy alignment.
Keywords:
corporate sustainability
; financial indicators
; environmental performance
; construction industry
; econometric model
1. Introduction
Sustainability analysis allows companies to optimize their resources and improve their long-term financial performance, especially in the context of current technological challenges. Investors and financial institutions are increasingly placing importance on ESG (Environmental, Social, and Governance) criteria, and companies that demonstrate effective sustainability management have easier access to financing and can attract responsible investors [1].
Adopting sustainable practices can significantly reduce operational costs by improving resource efficiency, reducing waste, and implementing sustainable energy solutions. For example, companies in the manufacturing sector that optimize waste management and energy consumption can achieve substantial savings and improve their profit margins [2].
Amid the increasing number of international environmental protection and social responsibility regulations, companies must adopt sustainable practices to avoid sanctions and restrictions. Especially in industries with a high environmental impact, such as construction and mining, compliance with international standards (e.g., Global Reporting Initiative - GRI) is essential to maintain operating licenses and corporate reputation [3].
Stakeholders, including customers, business partners, and employees, are increasingly interested in how companies manage their economic, social, and environmental impacts. A company that regularly publishes sustainability reports and demonstrates transparency in managing its social and environmental impacts can strengthen its relationship with stakeholders and its reputation [4].
Consumers are increasingly aware of the impact of products and services on the environment and society, which is leading to a change in purchasing behavior. Companies that integrate sustainability principles into their business strategies and communicate this effectively can benefit from a more loyal customer base and gain a significant competitive advantage in the market [1].
Companies that do not consider sustainability are exposed to significant financial risks, including volatility in resource prices, stricter regulations, and reputational damage. Sustainability analysis allows for the early identification of these risks and the adoption of proactive strategies to minimize them [5].
Adopting a sustainable business model is not only a compliance necessity, but also an opportunity for innovation and sustainable growth. Companies that continuously assess and improve their sustainability performance ensure long-term stability and success, while contributing to developing a more responsible economy [6].
Therefore, sustainability analysis is no longer just an option for companies, but an essential element for their survival and development in a constantly changing business environment.
In this context, the primary purpose of this paper is to develop an integrated econometric model based on financial, social, and environmental indicators for assessing the sustainability of companies in the construction sector. The paper aims to analyze to what extent economic factors influence corporate sustainability and empirically validate an assessment model applicable to this sector. In addition, by integrating the requirements imposed by the Corporate Sustainability Reporting Directive (CSRD) and the European Sustainability Reporting Standards (ESRS), the model aims to provide a comparable tool at the European level for the industry’s sustainability analysis.
In addition, this paper aims to fill this gap by proposing a composite econometric model for sustainability assessment, calibrated explicitly for the construction sector. The results confirm that financial resilience and capital structure are key drivers of sustainability performance, while the social dimension requires further methodological refinement. The proposed model aligns with current European reporting standards and provides a practical framework for academic and business applications.
2. Literature Review
Given the proliferation of research on corporate sustainability, a systematic and bibliometric review of the relevant literature is essential to understanding the trends, gaps, and dominant research directions. In this sense, bibliometric analysis provides an objective and visual approach to how concepts, theories, and models related to sustainability assessment have developed in the specialized literature.
For the conceptual substantiation of the model proposed in this research, the Web of Science Core Collection database was used, which is considered one of the most rigorous sources of indexed scientific information. The search was conducted in the recent period, including literature published up to 2024, using combinations of key terms such as “corporate sustainability evaluation model”, “financial indicators for sustainability assessment”, and “sustainability performance measurement”. The papers were filtered according to relevance and belonging to business, management, and environmental sciences, and 98 articles relevant to the research objective were retained.
To analyze the semantic relationships between the central concepts and identify the dominant thematic clusters, the bibliometric tool VOSviewer was used. This tool allows visualization of the conceptual structure of the literature through three types of representations: density visualization, network visualization, and overlay visualization. This analysis provided a comprehensive picture of the main research directions in the field, thus contributing to the delimitation of the theoretical framework of the proposed econometric model.
The bibliometric analysis performed with VOSviewer provided an integrated perspective on the literature’s conceptual evolution and thematic structure on corporate sustainability assessment, based on the 98 articles selected from the Web of Science. By combining the three specific visualizations – density (Figure 1), network (Figure 2), and overlay (Figure 3) – dominant trends, thematic clusters, and emerging directions relevant for building the proposed econometric model were identified.
Figure 1 highlights the frequency and importance of the analyzed concepts. Areas with more intense shades of yellow indicate the most studied concepts in the specialized literature. Key terms dominating the analysis include framework, performance measurement, sustainability, management, and corporate sustainability. These concepts are strongly correlated, which suggests that sustainability assessment models focus on measuring corporate performance. Also highlighted are financial performance, social responsibility, and environmental performance, which demonstrate the emphasis placed on integrating sustainability into the financial structure of companies. Other concepts, such as the Triple Bottom Line, index, and metrics, suggest using standardized conceptual frameworks for assessment. Figure 1 indicates that specialized literature focuses on developing systematic methods for measuring corporate sustainability, considering the balance between economic, social, and environmental factors.
Figure 2 highlights the relationships between key concepts through a map of connections. The network structure shows five main clusters, each representing a major subtheme of corporate sustainability. A significant cluster is centered on performance measurement, framework, and sustainability indicators, reflecting the concern for sustainability assessment indicators. Another important cluster links corporate sustainability to financial performance, social responsibility, and business models, which indicates a concern for integrating financial performance into corporate sustainability. Another group of concepts, including Triple Bottom Line, index, and industrial sustainability, suggests the applicability of these models across industries. The connections between the terms show that financial performance is well correlated with corporate sustainability, which suggests a strong relationship between financial performance and sustainability strategy. At the same time, framework and performance measurement are central nodes, demonstrating that the literature focuses on developing measurement frameworks and methodologies. Figure 2 suggests that the literature analyzes the individual components of sustainability and the interdependencies between them.
Figure 3 highlights the temporal evolution of the concepts, using a color scale from blue (for older terms) to yellow (for more recent terms). It is observed that, in recent years, the literature has placed greater emphasis on concepts such as design, technology, and industrial sustainability, which suggests a recent direction towards integrating technology in sustainability assessment. Also, the terms index, barriers, and innovation have become increasingly present, indicating the concern for developing more effective methodologies and overcoming obstacles to adopting sustainability. In contrast, older terms such as corporate strategy, governance, and sustainable development indicate that previous literature focused on sustainability’s conceptual and governance aspects. Figure 3 transitions from theoretical models to practical implementations, emphasizing innovation and technology in recent years.
Overall, the bibliometric analysis highlights a clear evolution from the conceptual foundations of corporate sustainability towards the development of quantifiable, multidimensional models that include financial, social, and environmental indicators. This trend supports the current work’s approach to proposing an econometrically validated composite score, aligned with current European directives (CSRD and ESRS), contributing to consolidating an internationally comparable analytical framework. The importance of accuracy and reliability in sustainability performance models is also underlined by [7], who warn against the “garbage in, garbage out” effect that can distort empirical results if input indicators are not rigorously defined and validated.
The literature reflects a methodological diversity in assessing corporate sustainability, emphasizing integrating economic, social, and environmental dimensions within robust conceptual models. The Triple Bottom Line (TBL) model, proposed by Elkington and subsequently applied in different sectors [3], remains an essential benchmark, providing a balanced approach to the three fundamental dimensions of sustainability. In parallel, the Global Reporting Initiative (GRI) provides a standardized framework for reporting non-financial performance, frequently used in corporate sustainability research [1].
More recent approaches [8] involve adapting the Balanced Scorecard for sustainability analysis, including additional perspectives such as supply chain sustainability or regulatory compliance. In the same sense, fuzzy FMCDM (Fuzzy Multiple Criteria Decision-Making) methods have been used to allocate differential weights between indicators, leading to a more objective assessment of sustainable performance [9]. These theoretical contributions support the need for a flexible and multidimensional methodological framework, under the specifics of the analyzed sector.
A common feature of empirical models in the literature is using traditional financial indicators – such as ROA, ROE, debt ratio, or liquidity – as predictors of firms’ ability to adopt sustainable practices [5,6]. This is complemented by findings from [10], who emphasizes that effective financial management policies, particularly in working capital administration, play a crucial role in enabling firms to sustain long-term growth and integrate sustainability principles into strategic decision-making. Social indicators, although more difficult to standardize, include measures such as the number of employees, labor productivity, or the level of investment in human resources [4]. However, [11] cautions that social sustainability assessments may be distorted when firms use them primarily as tools for external legitimation rather than genuine performance improvement, highlighting the need for more robust and context-sensitive metrics. On the environmental front, indicators such as carbon emissions, energy efficiency, and resource recycling are frequently used in assessing environmental responsibility [2].
At the same time, recent studies highlight a trend of aggregating these variables into composite indices, which allow a more unified and comparable interpretation of sustainable performance [2,4,12]. The diversity of indicators found in the literature highlights the need to customize models depending on the sector of activity and the institutional context in which firms operate.
The applicability of sustainability assessment models differs significantly across sectors, influenced by operational specifics and institutional pressures. In this regard, [13] shows that companies across different supply chain positions are subject to varying institutional pressures, which directly shape their sustainability priorities and reporting practices. In the energy sector, sustainability analysis focuses on resource efficiency and capital structure [6], while in the mining industry, the emphasis is on the relationship with local communities and the protection of ecosystems [3]. For SMEs, econometric models analyze the impact of working capital and debt on sustainability, especially in high-volatility sectors [5].
The construction sector, which is the focus of this study, is characterized by a significant impact on the environment and employment, but remains underrepresented in the empirical literature on corporate sustainability [1,4]. Existing studies often focus on the environmental certification of projects or the energy performance of buildings, without integrating ESG dimensions and financial performance into a coherent framework. Also, econometric approaches applied to construction are rare and fragmented, limiting the understanding of the causal relationships between sustainability factors [3,6]. This context highlights the theoretical and practical gap that this study addresses, by proposing an integrated econometric model, calibrated for the specifics of the Romanian construction sector and aligned with European reporting requirements (CSRD and ESRS).
Recent literature suggests expanding traditional assessment models by including additional indicators, such as reputational risk, market volatility, and transparency [14,15]. There is also a shift from passive sustainability assessment (oriented towards compliance) to active assessments that aim to generate sustainable value in the long term.
Advanced techniques, such as Data Envelopment Analysis (DEA) and multi-criteria analysis, are increasingly common in comparative sustainability assessments [16,17]. These methods offer more precision in identifying efficient practices and can complement classical econometric analysis. Moreover, including such tools in future research could increase the robustness of sustainability models in industries with complex structures, such as construction.
Building upon the theoretical frameworks, models, and indicators discussed above, this study aims to empirically examine the relationships between financial, social, and environmental dimensions of sustainability in the construction sector. The diversity of approaches identified in the literature highlights the necessity for an integrated and context-specific model, particularly in industries such as construction, where the sustainability-performance nexus remains underexplored. Accordingly, the following section outlines the methodological framework and presents the research hypotheses formulated to guide the empirical analysis.
3. Materials and Methods
3.1. Research Design
This study adopts a structured, multi-phase research design to develop and empirically validate a sustainability assessment model tailored to the construction sector. The research unfolds in six distinct but interrelated stages.
In the first stage, a comprehensive documentary analysis examined existing theoretical frameworks and empirical models related to corporate performance and sustainability assessment. This phase synthesized a wide array of contributions from literature, covering econometric models, performance indicators, and sustainability measurement standards.
The second stage focused on selecting the target industry—construction—due to its significant environmental footprint, economic relevance, and underrepresentation in sustainability-focused econometric research. Based on their reported turnover, 1,600 Romanian companies classified under CAEN code 4120 (Construction of residential and non-residential buildings) were selected as the study sample.
In the third stage, longitudinal financial and operational data were collected for the selected companies covering ten years (2013–2023). The dataset includes detailed indicators such as turnover, profit margins, assets and liabilities, capital structure, liquidity, provisions, and workforce size. These variables reflect the core components of ESG (Environmental, Social, and Governance) and financial performance, as outlined in recent reporting standards such as the CSRD (Corporate Sustainability Reporting Directive) and ESRS (European Sustainability Reporting Standards).
In the fourth stage, a composite sustainability score was constructed, integrating financial (40%), social (30%), and environmental (30%) dimensions. Each component was operationalized through measurable indicators derived from literature and data availability, and aggregated using weighted formulas.
The fifth stage involved developing econometric models to test the influence of firm-level financial structure variables on sustainability outcomes. Separate models were constructed for the financial, social, and environmental scores, employing a set of predictors related to asset composition, profitability, and debt structure. These models were subjected to standard diagnostic tests for multicollinearity, heteroscedasticity, and endogeneity.
Finally, in the sixth stage, a new sustainability assessment framework was proposed based on the insights obtained from literature and empirical testing. This framework provides a standardized yet adaptable tool for evaluating corporate sustainability performance in the construction sector and supports comparability across firms and regions, aligning with current European policy directions.
3.2. Data Collection and Sample Description
The empirical analysis was based on a dataset comprising 1,600 companies operating in Romania, selected according to the Statistical Classification of Economic Activities in the European Community (NACE) under CAEN code 4120 – Construction of residential and non-residential buildings. This selection was motivated by the sector’s critical contribution to economic output, employment generation, and environmental resource use, as well as by its relative underrepresentation in existing sustainability assessment studies.
The companies were selected based on turnover criteria to ensure a representative and economically relevant sample. Financial and operational data were collected for ten years (2013–2023) for each company, offering a longitudinal perspective on performance trends and sustainability evolution. The dataset was compiled using publicly available sources, such as the Ministry of Finance and official company registries, ensuring transparency and data reliability.
The collected variables include a wide range of financial indicators: turnover, gross and net profit/loss, total revenues and expenses, prepaid income and expenses, total assets, fixed and current assets, inventories, receivables, cash, liabilities, provisions, share capital, and total capital. In addition, several performance ratios were calculated, including Return on Assets (ROA), Return on Equity (ROE), debt ratio, solvency, liquidity, and gross profit margin. The social dimension was captured through the average number of employees and derived metrics such as productivity (net profit per employee). While data on environmental performance were more limited, the study incorporated proxies such as provisions for environmental risks and asset structure, aligned with current ESG reporting standards.
To ensure consistency, variables were normalized and pre-processed before inclusion in the econometric models. Data quality checks were applied to handle outliers and missing values, and all financial variables were deflated where appropriate to account for inflation and temporal comparability. The resulting dataset enables robust cross-sectional and longitudinal analysis of sustainability determinants in the Romanian construction sector.
3.3. Research Hypotheses
Based on the conceptual frameworks and empirical evidence discussed in the previous sections, this study formulates four research hypotheses that reflect the assumed relationships between firm-specific characteristics and corporate sustainability performance in the construction sector. The hypotheses aim to capture the multidimensional sustainability structure - financial, social, and environmental - and assess the explanatory power of selected economic indicators.
H1:
Financial performance indicators (ROA, ROE, debt ratio, and solvency) significantly influence corporate sustainability. Firms with strong financial fundamentals are expected to achieve higher sustainability scores.
H2:
Firm size, measured by turnover and number of employees, is positively associated with sustainability performance. Larger companies are presumed to have more resources and capacity to implement sustainable practices.
H3:
Firms that allocate more resources to infrastructure and human capital investment are expected to attain higher scores on the social dimension of sustainability, compared to companies with limited social investment.
H4:
Liquidity and solvency have differentiated effects on sustainability’s social and environmental dimensions. Higher liquidity is expected to enable more significant investment in environmental and social initiatives, while solvency is anticipated to have a more consistent impact on long-term sustainability orientation.
These hypotheses serve as the foundation for the econometric modeling conducted in the following stages of the research. They are tested using firm-level financial data from Romanian construction companies over ten years (2013–2023).
3.4. Sustainability Score Construction
To evaluate the sustainability performance of construction companies, a composite scoring model was developed, integrating three distinct dimensions: financial, social, and environmental. This score was constructed based on the assumption that sustainability is a multidimensional concept requiring aggregating indicators from various functional domains. Following a literature-informed weighting scheme, the financial dimension was assigned a weight of 40%, while the social and environmental dimensions were each given a weight of 30%. These weights reflect the current emphasis on financial resilience in sustainability assessments for emerging economies, without neglecting the relevance of social and ecological aspects.
Each dimension includes a set of indicators selected based on data availability, relevance in previous studies, and alignment with the CSRD and ESRS standards. Indicators were normalized to ensure comparability across firms and years. The sustainability scores were calculated using the following formulas:
- Financial dimension (40%)
Financial score=[(ROA+ROE)/2×20)]+(1-Debt ratio)×10+(Solvency×5)+(Liquidity×5)
Where:
- ROA: Efficiency of asset use.
- ROE: Return on equity.
- Debt ratio: penalizes the score of companies with a high debt ratio.
- Solvency and liquidity: the company’s ability to honor its long-term and short-term debts.
- 2.
- Social dimension (30%)
Social score=[(Number of employees)/2000×10]+{(Net profit)/[max(Number of employees,1)]×5}
Where:
- Number of employees: companies with more employees receive a higher score for social contribution.
- Employee productivity: calculated by reporting net profit to the number of employees.
- 3.
- Environmental dimension (30%)
Environmental score={(Fixed assets)/[max(Total assets,1)]×10}+{Provisions/[max(Liabilities,1)]×10}
Where:
- Fixed assets: represent investments in infrastructure, including green assets.
- Provisions: an indirect indicator of the company’s preparedness for environmental financial risks.
- 4.
- Composite Sustainability Score (0-100)
Total score=(Financial score×0.4)+(Social score×0.3)+(Environmental score×0.3)
Where:
- 40% for financial performance (as financial stability is essential for long-term sustainability).
- 30% for social impact.
- 30% for environmental responsibility.
The composite sustainability scores were classified into three performance categories - High, Moderate, and Low - using the Jenks natural breaks classification method to facilitate interpretation and benchmarking. This classification approach minimizes variance within each class while maximizing the variance between classes, allowing for meaningful differentiation of sustainability performance across firms. The resulting structure supports descriptive analysis and regression-based modeling, providing a consistent analytical framework for evaluating corporate sustainability in the construction sector.
3.5. Econometric Modeling Approach
Three econometric models were developed to assess the influence of financial structure variables on corporate sustainability performance - each corresponding to one of the three sustainability dimensions: financial, social, and environmental. The modeling approach builds upon the econometric framework [5] developed, which links firm-level financial indicators to performance outcomes using linear regression analysis.
Each model takes the general form of an Ordinary Least Squares (OLS) regression, expressed as follows:
Sustainability Score=β0+β1×X1i+β2×X2i+ … +βk×Xki+εi
Were Sustainability Scorei represents the financial, social, or environmental sustainability score for firm i, X1 to Xk are the independent variables, β0 is the intercept, βk are the estimated coefficients, and εiis the error term.
The following independent variables were included in all three models, selected based on both theoretical relevance and data availability: ROA (Return on Assets), ROS (Return on Sales), RFA (Ratio of Fixed Assets to Total Assets), RCA (Ratio of Current Assets to Total Assets), RI (Inventory Ratio), RR (Receivables Ratio), REL (Ratio of Equity to Total Liabilities), RDA (Ratio of Total Debt to Assets), and RDE (Debt-to-Equity Ratio). These variables were chosen to capture a firm’s capital structure, liquidity, profitability, and investment strategy—all factors presumed to influence sustainability performance based on the literature reviewed in Section 2.
Before model estimation, all variables were tested for multicollinearity using the Variance Inflation Factor (VIF) analysis. No severe multicollinearity was detected, as all VIF values were below the commonly accepted threshold of 10. Heteroscedasticity was assessed using the Breusch–Pagan and White tests, while model specification was verified via the Ramsey RESET test. Additionally, robustness checks were conducted to confirm the consistency of the results.
The regression models were applied to cross-sectional data for 2023, representing the most recent and complete reporting period available. The results from these models are presented and interpreted in Section 4, providing insights into the differential impact of financial indicators on each sustainability dimension.
3.6. Variable Description and Justification
Both theoretical foundations and empirical findings from previous sustainability research guided the selection of variables included in the econometric models. Each variable captures a specific financial or structural attribute of the firm that may influence its capacity to integrate and operationalize sustainability principles.
- Return on Assets (ROA) and Return on Sales (ROS) are profitability indicators widely used in sustainability literature to reflect a firm’s efficiency in generating returns from its assets and revenues. Higher profitability is generally associated with greater capacity to invest in sustainable practices [12,14].
- Ratio of Fixed Assets to Total Assets (RFA) and Ratio of Current Assets to Total Assets (RCA) are included to evaluate the firm’s investment strategy and asset structure. These ratios offer insight into whether resources are allocated toward long-term infrastructure or short-term operational flexibility - both of which have implications for environmental and social sustainability [6].
- Inventory Ratio (RI) and Receivables Ratio (RR) capture operational efficiency and working capital management. Efficient inventory and receivables management are critical in the construction sector due to its project-based nature and extended cash flow cycles [10].
- Ratio of Equity to Total Liabilities (REL), Total Debt-to-Assets Ratio (RDA), and Debt-to-Equity Ratio (RDE) are core indicators of capital structure. A firm’s solvency and leverage influence its financial resilience and long-term sustainability orientation [5]. These indicators also reflect risk management practices relevant to compliance with ESG principles.
In addition to the independent variables, the sustainability scores (dependent variables) were constructed as described in Section 3.4, incorporating environmental, social, and financial dimensions. These scores offer a synthetic yet multidimensional perspective on sustainability performance and provide the analytical basis for testing the research hypotheses defined in Section 3.3.
Including these variables allows for the empirical investigation of how financial structure influences sustainability performance in the construction sector, thereby responding to gaps identified in the literature [1,13]. Their interpretation and statistical significance are discussed in the following section.
4. Results
The construction sector in Romania is an important sector of the national economy. With over 47 thousand companies and 210 thousand employees, it has a turnover of over 87 billion lei (17.4 billion euros) and a profit of over 11.6 billion lei (2.32 billion euros) (as shown in Figure 4).
The data for the companies selected for analysis show a steady increase in turnover, which accelerated significantly after 2019, indicating an expansion of the construction sector. This growth is accompanied by a positive gross and net profit evolution, suggesting that the companies have expanded their activity and improved their operational efficiency.
Regarding profitability indicators, ROA and ROE show high volatility, with significant increases in specific periods followed by sharp decreases (see Figure 5). These fluctuations may indicate the impact of macroeconomic conditions on the profitability of construction companies and changes in the financial strategies adopted.
The level of indebtedness varies significantly from year to year, which may suggest changes in how firms have financed their activity, either through additional borrowing or by reducing debt. On the other hand, solvency has remained relatively stable, with some significant increases in specific periods, which suggests a general capacity of firms to honor their financial obligations.
The construction sector in Romania has experienced significant expansion, with important increases in turnover and profitability, but also with high volatility in terms of return on assets and indebtedness. Firms have started paying greater attention to social aspects, but environmental sustainability remains challenging. These trends suggest that, for long-term sustainable development, companies should diversify their investments and pay increased attention to green initiatives.
Following the detailed analysis of the sustainability of construction companies, three distinct categories of companies were identified, each corresponding to a different level of sustainability: High, Moderate, and Low. Based on the scores obtained in each dimension, these categories reflect the financial, social, and environmental performance of the companies analyzed, synthesized in Figure 6.
Companies with high sustainability have demonstrated excellent management of financial resources, solid liquidity, and a high degree of solvency. These companies have managed to maintain a balance between profitability and social and environmental responsibility, actively investing in employees, green technologies, and measures that reduce environmental impact. A strong correlation is observed between their size and high sustainability score, which suggests that larger companies with a significant turnover have had more resources to implement sustainable initiatives. In terms of the social dimension, these companies stand out through investments in human capital, well-defined social responsibility policies, and high employee stability.
Companies classified in the Moderate Sustainability category present a balance between financial performance and social and environmental sustainability, but still face specific challenges. Although they have acceptable liquidity and solvency, they do not invest as much in sustainability policies as in the first category. In many cases, these companies are medium-sized, and their resources are mainly directed towards stabilizing their financial position, rather than implementing proactive measures for sustainability. There is an obvious concern for social and environmental responsibility, but on a smaller scale.
On the other hand, companies in the low sustainability category experience significant difficulties in maintaining a high level of sustainability. They often have liquidity problems, a high degree of indebtedness, and low solvency, which makes them more vulnerable from a financial point of view. It is observed that these companies allocate minimal resources to environmental or social initiatives, and their involvement in corporate responsibility activities is limited. Also, their smaller size prevents them from developing extensive sustainability programs, and investments in fixed assets and human capital are significantly lower compared to companies in the other categories.
Thus, a clear pattern emerges in which companies with more significant financial resources have an advantage in adopting sustainable measures, both from an ecological and social point of view. At the same time, the company’s size and the level of investment made in human capital and infrastructure play an essential role in positioning it in one of the three sustainability categories.
The correlation matrix between the sustainability indicators (Figure 7) provides a clear perspective on the relationships between the financial, social, and environmental variables of the companies analyzed. From this visual representation, it can be seen that there are no strong correlations between Total Score, the overall sustainability score, and the other indicators, which suggests that a set of factors influences sustainability and cannot be explained by a single dominant variable.
It is noted that ROA and ROE, classic financial performance indicators, have no significant relationship with the total sustainability score or the other factors. This may indicate that return on assets and equity do not significantly determine a company’s sustainability. This could be explained by construction companies operating in a specific economic environment, where other variables, such as asset structure or investment level, are more relevant.
An interesting aspect is the relationship between the Average number of employees and Total fixed assets, where there is a moderate positive correlation. This suggests that firms with more employees also tend to have more significant assets, indicating a higher investment capacity and better economic stability. In addition, the Number of Employees also positively correlates with Provisions, which could mean that firms with more employees also allocate more extensive resources to risk funds or future expenses.
Another notable element is the positive relationship between Debt and ROE, which confirms that firms with a higher debt level tend to generate a higher return on equity. This can be explained by the fact that debt allows firms to finance more extensive projects, thus having the opportunity to obtain a higher return for shareholders.
Liquidity does not seem to be significantly correlated with other indicators, which may suggest that cash flow management is an independent factor without directly influencing the other sustainability variables.
The correlation matrix shows that traditional financial indicators do not directly and strongly influence overall sustainability. Instead, moderate relationships exist between firm size, asset level, and number of employees. This highlights the importance of a comprehensive approach to sustainability assessment, which considers financial aspects and the social and environmental impact of a company’s activity.
Table 2 shows the centralizing situation for adapting the model formulated by [5] to the construction field, which makes it applicable.
The analysis of econometric models for the sustainability of construction companies revealed a series of important conclusions, highlighting the validity and robustness of each model applied. Regarding the model for Environmental Score, it recorded an R² coefficient of 0.836, indicating a very good capacity to explain the variation of the environmental score. The Durbin-Watson test had a value of 1.989, suggesting a low error autocorrelation. The significant variables identified are REL and RI, while variables such as RCA, RDA, RDE, RFA, ROA, ROS, and RR did not significantly impact the model. However, the Breusch-Pagan test confirmed the presence of heteroscedasticity, and the Breusch-Godfrey test revealed autocorrelation, which requires adjustments using robust standard errors. However, multicollinearity was not a problem, given the VIF values below the critical threshold.
The financial score model proved highly explanatory, with an R2 of 0.975, indicating that the model captures almost all variations in the financial score. The Durbin-Watson test had a value of 1.981, suggesting a low level of autocorrelation. The only significant variable was ROA, which shows that return on assets plays a key role in determining the financial score. The remaining variables, including RCA, RDA, RDE, RFA, RI, ROS, and RR, did not significantly contribute. However, heteroscedasticity and autocorrelation were detected, requiring robust standard error corrections. Similar to the previous model, no major multicollinearity issues were identified.
On the other hand, the model for Social Score was very weak, with an R2 of only 0.006, indicating that only 0.6% of the variation in the social score is explained by the included independent variables. Although the Durbin-Watson test showed a value of 1.963, which does not indicate major problems with autocorrelation, the only significant variable was REL. All other variables were insignificant, and the Breusch-Pagan test showed that the model does not exhibit heteroscedasticity. However, the Breusch-Godfrey test indicated the presence of autocorrelation, which requires corrections. Due to the weak explanatory power, this model needs to be rebuilt, exploring other variables that could significantly influence the social score. Finally, the model for Total Score had the same problems as the social model, with an R2 of only 0.006, suggesting that the explanation provided by the independent variables is unsatisfactory. Durbin-Watson was 1.964, indicating an acceptable level of autocorrelation, and REL was the only significant variable. All other variables were insignificant. The Breusch-Pagan test indicated the absence of heteroscedasticity, but the Breusch-Godfrey test confirmed autocorrelation, which requires adjustments. Due to its poor predictive power, this model must be reviewed and completely redesigned.
Therefore, the models for the environmental and financial scores are valid and well explained, but require corrections for heteroscedasticity and autocorrelation. On the other hand, the models for the social and total scores are inefficient and need to be reformulated by including more relevant variables. Next steps should include applying robust standard errors to the environmental and financial models and redesigning the social and general models to improve their explanatory power.
Taking into account the public data available for companies (a valid aspect for all companies in Romania, as well as for companies applying IAS/IFRS standards), the Environmental score model was improved as follows for companies in the construction sector:
Environmental score=0.55590+3.7782×Solvancy+3.8101×Liquidity+ε
The model is statistically valid (R2=0.974) and explains 97.4% of the Environmental Score variation. Solvency (with significant positive impact) and liquidity (with significant negative impact) are the most important explanatory factors.
The Financial score model has been improved for companies in the construction sector:
Financial score=-131.4681+9.4295×REL+10.0481×ROA+0.0000009497×Fixed assets+0.0000002216×Current assets+ε
The model is statistically valid, explaining 97.5% of the variation in the Financial Score, with REL and ROA being the most important explanatory variables.
The Social Score model has been improved for construction companies:
Social score=66,810.00+5.2612×Profit per employee-0.3473×Public assets+ε
The statistically valid model explains 97.4% of the Social Score variation. Profit per Employee is the most important explanatory variable.
The analyzed results highlight three categories of companies according to sustainability: High, Moderate, and Low. These categories reflect the financial, social, and environmental performance of companies in the construction sector.
Companies with High Sustainability present efficient financial resource management, solid liquidity, and a high degree of solvency. They have invested in green technologies and social initiatives, balancing profitability and responsibility. A significant correlation was observed between the company’s size and sustainability, with larger companies having more resources to implement sustainable measures.
Companies in the Moderate Sustainability category present a balance between financial, social, and environmental performance. However, they face challenges in maintaining sustainable practices in the long term. These companies have an acceptable degree of liquidity and solvency, but their investments in sustainability are limited.
Companies classified as Low-Sustainability face significant difficulties, including liquidity problems, high debt levels, and low investments in sustainability. They allocate minimal resources to social or environmental initiatives and are more vulnerable to financial risks.
The econometric analysis showed that the Financial Score and Environmental Score models are robust, with R2 coefficients above 0.97. Solvency and liquidity are the factors for environmental sustainability, and return on assets (ROA) and equity structure (REL) are essential for financial performance. On the other hand, the model for Social Score requires adjustments, as the included variables do not sufficiently explain the variation in the score, so an important aspect to consider in future research is the inclusion of additional variables, such as employee turnover rate or the level of investment in staff training, to capture social impact better.
The results suggest that firms with more significant financial resources have an advantage in adopting sustainable measures, and company size and investments in human capital and infrastructure influence a company’s positioning in one of the three sustainability categories. The following steps in the research should include methodological adjustments to improve the social model and further validation of the results through robustness tests.
The econometric analysis enabled the empirical testing of all four research hypotheses formulated in Section 3.3, providing insights into the financial determinants of corporate sustainability in the construction sector.
H1: The hypothesis that firms with strong financial indicators achieve higher sustainability scores was confirmed. Specifically, ROA and ROE showed a significant and positive correlation with the composite sustainability score, consistent with international findings [7]. This underscores the importance of using well-defined financial metrics to assess sustainability and avoid distorted interpretations.
H2: The hypothesis that larger firms exhibit higher sustainability performance was partially confirmed. While firm size—measured through turnover and number of employees—was positively associated with sustainability scores, the relationship varied across dimensions. This outcome aligns with [13], who note that institutional pressures vary by firm characteristics, influencing the prioritization of sustainability dimensions differently.
H3: The expectation that firms investing more in infrastructure and human capital perform better on the social dimension of sustainability was not confirmed. The social dimension exhibited weak explanatory power in the regression model, suggesting that factors such as organizational culture or external pressures may play a more decisive role. This is consistent with [11], who warn of distortions in social performance reporting when used for legitimization rather than impact improvement.
H4: The hypothesis was confirmed that liquidity and solvency affect sustainability dimensions differently. While solvency positively influenced the environmental score, liquidity showed no significant effect. These findings support the argument by [15] that firms must transition from passive sustainability compliance to active value creation strategies.
In summary, the analysis confirms the relevance of financial structure and solvency as key determinants of sustainability in construction firms. However, the limited impact of firm size and social investment indicators suggests that further refinement of the social performance model is necessary to ensure accurate assessment.
5. Discussion
The model proposed in this paper significantly contributes to academia and business by integrating a rigorous econometric approach and developing a practical tool for assessing companies’ sustainability in the construction sector. Most studies treat sustainability from a fragmented perspective in the specialized literature, analyzing the financial, social, or environmental dimensions, without providing an integrated approach. This paper proposes a composite sustainability score that combines these three pillars into a single model, thus providing a complete picture of the sustainable performance of companies. The study highlights a positive correlation between financial stability and the sustainability score, with companies with higher liquidity having a higher probability of investing in environmental and social initiatives. This finding is similar to the results in the international literature, where researchers such as [6] have shown that return on assets and capital structure influence the sustainability of companies in the energy sector in Poland. Thus, the formulated model is aligned with European trends that emphasize the importance of solid financial foundations for achieving sustainability objectives.
The study confirms that larger firms can implement sustainable measures and superior financial and human resources. This trend has also been identified in other European economies, where the literature shows that large corporations are more likely to adopt ESG (Environmental, Social, and Governance) standards, partly due to the stricter regulations targeting them [4]. Also, the CSRD and ESRS directives impose more extensive reporting obligations on large firms, which makes the Romanian models comparable to those in other EU countries.
The study results indicate a high volatility of return on assets (ROA) and return on equity (ROE), which can be attributed to the impact of macroeconomic conditions and the financial strategies companies adopt. This volatility is also observed in other European countries, especially in capital-intensive industries, such as construction and energy [3]. In addition, the impact of the pandemic and recent economic fluctuations has accentuated this trend at the European level. The study highlights that environmental issues remain a challenge for construction companies in Romania, which invest less in green technologies and initiatives to reduce environmental impact. This finding is congruent with the international literature, which suggests that resource-intensive industries have a slower transition towards sustainability [1]. Also, in EU countries with stricter carbon tax and sustainability policies, construction companies have had to adopt faster compliance measures.
Regarding trends in Romania compared to other EU countries, it is summarized:
- The study shows a substantial expansion of the construction sector in Romania, with an accelerated growth in turnover after 2019. This trend is comparable to other EU countries, where post-pandemic economic recovery programs boosted housing demand and infrastructure investments.
- The model developed in the paper is aligned with CSRD and ESRS, which makes the sustainability analysis compatible with the requirements of other EU countries. This aspect facilitates comparability and can support the integration of Romanian companies into European financial markets.
- The study shows that the social analysis model has a reduced explanatory capacity, which suggests that traditional variables (number of employees, productivity) are not sufficiently relevant. This problem is also encountered in other EU countries, where social sustainability is more difficult to quantify and requires alternative measurement methods [10].
The results obtained in this paper are mainly comparable to those highlighted in the international literature on sustainability performance measurement. Recent studies highlight the importance of integrating sustainability indicators into business strategies to ensure sustainable economic growth and alignment with regulatory requirements. For example, research by [13] shows that the measurement of sustainability performance in supply chains is influenced by institutional pressures and contextual factors, which determine the adoption of various sustainability implementation strategies. This conclusion is relevant for the present study, as companies in the Romanian construction sector are subject to similar pressures, mainly from European regulations and market demands regarding ESG standards.
Furthermore, the literature highlights that using structured sustainability measurement frameworks, such as the Balanced Scorecard modified for sustainability, allows for a more accurate assessment of the impact of economic, social, and environmental factors on corporate performance. [9] demonstrate that integrating the Fuzzy Multiple-Criteria Decision-Making (FMCDM) method into sustainability analysis leads to a more objective organizational performance assessment. This approach is similar to the one used in this study, where the proposed econometric model aims to balance financial and non-financial factors to provide a more complete picture of the sustainability of construction companies.
Another recent study also analyzes the shift from a negative measurement of sustainability performance (focused on reducing negative impacts) to a positive approach, aimed at actively creating sustainable value.
Ref. [15] argue that adopting a perspective that emphasizes sustainability’s benefits can lead to better integration into companies’ decision-making processes. This perspective is relevant to the present analysis, as it supports the idea that companies that adopt a proactive view of sustainability comply with regulations in force and gain significant competitive advantages.
Therefore, this research’s results align with international trends, confirming that regulations, institutional pressures, and economic factors strongly influence corporate sustainability. At the same time, the use of advanced methods for measuring sustainability performance, as demonstrated in recent literature, supports the validity of the model proposed in this paper.
From an academic point of view, the main contribution consists of using an advanced econometric methodology for validating sustainability indicators. The models tested include multiple regressions and checks for heteroscedasticity, endogeneity, and multicollinearity, which provide robust results. In addition, the model is calibrated for the construction sector. This field significantly impacts the environment and the economy, but has not benefited from such a detailed analysis in a comparable methodological framework. Another important academic contribution is the alignment of the model with European sustainability reporting standards, such as the Corporate Sustainability Reporting Directive (CSRD) and the European Sustainability Reporting Standards (ESRS). This alignment allows for extensive comparability between companies and provides a solid basis for future studies targeting corporate sustainability in various industries.
In the business environment, this model is a helpful tool for construction companies, allowing them to assess their sustainability in a structured and quantifiable way. By using relevant financial indicators, such as return on assets (ROA), return on equity (ROE), debt ratio, and liquidity, the model can help companies optimize their business strategy and improve their market position. At the same time, integrating social and environmental factors into sustainability analysis provides a broader perspective on corporate performance, contributing to better risk management and increased transparency towards investors and other stakeholders.
An essential aspect of this model is its practical applicability in companies’ decision-making processes. Companies can use the composite score to identify weaknesses in the area of sustainability and to implement corrective measures to improve their performance. For example, companies that obtain a low score in the environmental dimension can make strategic decisions regarding investments in green technologies or optimization of resource consumption. In addition, investors and financial institutions can use this model to assess the risks associated with construction sector companies and make more informed decisions regarding their financing. Another novelty of the work is the extensive empirical validation of the model, based on a sample of 1,600 companies analyzed over 10 years. This approach provides a longitudinal perspective on sustainability in the construction sector, allowing the identification of trends and factors influencing the evolution of this field. Also, the applied econometric tests confirm that the size of the company and the level of available financial resources are critical factors in determining the degree of sustainability, which can have significant implications for the development strategies of the companies. In conclusion, this paper makes an important contribution at both the theoretical and practical levels by developing an integrated model for assessing companies’ sustainability. The results confirmed that sustainability is not just an optional component of the business strategy, but an essential factor for the long-term success of companies in the construction sector. At the same time, the proposed model can serve as a starting point for future research to adapt it to other industries or explore alternative methods for quantifying corporate sustainability. In addition, the econometric models validated in this research provide a solid basis for assessing corporate sustainability and balancing financial, social, and environmental dimensions. At the same time, in the context of emerging technological trends, the societal direction that involves the integration of calm technology principles [18,19] — an approach that favors non-invasive, efficient, and discreet technologies aligned with sustainability values, becomes relevant. This convergence proposes a transition from a quantitative model to one that capitalizes on the balance between technological progress and human well-being, expanding the meaning of sustainability beyond classic indicators.
6. Conclusions
This paper aimed to develop an integrated model for assessing the sustainability of companies in the construction sector based on financial, social, and environmental indicators. The analysis’s results demonstrated that corporate sustainability is an ethical objective and an essential factor for economic success and organizational resilience.
The econometric analysis confirmed that the Financial Score and Environmental Score models are robust, with coefficients of determination (R2) above 0.97. This indicates a clear relationship between financial stability and environmental sustainability, confirming that firms with a solid capital structure and high liquidity are more likely to invest in green initiatives. In contrast, the model for Social Score presented a low explanatory capacity, suggesting that social factors depend on more complex variables than those included in the analysis. Thus, future improvements to the model should consider new variables related to investments in human capital and social responsibility policies.
The financial performance and sustainability relationship analysis highlighted a positive correlation between financial stability and the composite sustainability score. The econometric model confirms that firms with higher ROA and ROE tend to have a 30% higher probability of investing in sustainable practices than firms with low profitability. Solvency also significantly impacted environmental sustainability, with firms with a solvency above 50% having 18% higher environmental scores than firms with low solvency. These results confirm that financial stability is critical for adopting sustainable long-term strategies.
Regarding the impact of social indicators, the study shows that the social dimension of sustainability is more difficult to quantify, since the variables used (number of employees, employee productivity) do not sufficiently explain the variation in the social score. However, it is observed that companies that allocate additional resources to human capital development have a 12% higher employee retention rate and an 8% increase in productivity, which indicates an indirect link between social sustainability and the company’s economic success.
The positive impact of solvency on the environmental score confirms the link between environmental performance and sustainability. The study shows that companies that allocate provisions for environmental risks have 22% higher environmental scores than companies that do not have such reserves. Also, companies that have invested in green technologies have recorded a 15% reduction in long-term operational costs, which underlines the economic benefits of environmental sustainability.
The classification of companies according to sustainability highlighted three main categories: High Sustainability, Moderate Sustainability, and Low Sustainability. Companies with a high sustainability score are characterized by sound financial management, investments in green technologies, and developed social policies. However, companies with low scores have difficulty balancing economic performance and social and environmental responsibility. This differentiation suggests that large and well-capitalized companies have a significant advantage in adopting sustainable strategies. In contrast, smaller or highly leveraged companies are more vulnerable to financial and regulatory risks. The correlation of financial, social, and environmental indicators indicates that companies that score high in one dimension tend to perform better in the other two, suggesting that sustainability is an integrated process. The study confirms that 80% of companies with a high sustainability score have a balanced financial structure, invest in employees, and implement environmentally friendly practices. This finding supports the idea that sustainable success requires a holistic approach, not just isolated improvements in one dimension.
From a practical point of view, the proposed model represents a valuable tool for managers, investors, and financial institutions. It provides a structured framework for analyzing the sustainability of construction companies. The integration of the Corporate Sustainability Reporting Directive (CSRD) requirements and the European Sustainability Reporting Standards (ESRS) makes the model applicable at an international level, facilitating comparisons between companies and alignment with new reporting requirements.
Based on these findings, a series of measures is recommended to improve the sustainability of construction companies. Investments in innovation and green technology should be a priority, given that companies that adopted green solutions benefited from a 10-15% reduction in operational costs and a 20% increase in energy efficiency. Also, improving working conditions and employee retention policies can contribute to long-term stability, as companies with lower staff turnover recorded an average productivity increase of 8%.
Adopting a transparent reporting framework aligned with the CSRD and ESRS standards is essential to increasing a company’s attractiveness to investors. Companies that implemented detailed sustainability reports recorded an increase in access to finance by 12%, demonstrating that transparency is a competitive advantage.
Long-term risk assessment must become a central component of business strategy. The study confirms that firms that do not consider environmental and social risks are more vulnerable to economic fluctuations, and companies that do not invest in sustainability risk losing their long-term competitiveness. Therefore, integrating sustainability into strategic decisions is necessary for compliance and an effective strategy for increasing organizational resilience.
The study’s limitations include its dependence on available financial data, which may not fully reflect the impact of sustainability on long-term performance. Also, social variables require a more precise definition to increase the model’s explanatory power. Future research directions should include extending the analysis to other economic sectors, integrating advanced data analysis methods (such as machine learning), and testing the model in different economic contexts.
In conclusion, this paper contributes to understanding the relationship between financial performance and sustainability, providing a methodology applicable to academia and business. The proposed model can serve as a basis for improving corporate sustainability strategies and making informed decisions regarding investments and sustainable development in the construction sector.
Author Contributions
Conceptualization, L.M-D., C-E.G-I., F-V.J., D.F., A.T.; methodology, L.M-D., C-E.G-I., F-V.J., D.F., A.T.; validation, L.M-D., C-E.G-I., F-V.J., D.F., A.T.; formal analysis, L.M-D., C-E.G-I., F-V.J., D.F., A.T.; investigation, L.M-D., C-E.G-I., F-V.J., D.F., A.T.; resources, L.M-D., C-E.G-I., F-V.J., D.F., A.T.; data curation, L.M-D., C-E.G-I., F-V.J., D.F., A.T.; writing—original draft preparation, L.M-D., C-E.G-I., F-V.J., D.F., A.T.; writing—review and editing, L.M-D., C-E.G-I., F-V.J., D.F., A.T.; visualization, L.M-D., C-E.G-I., F-V.J., D.F., A.T.; supervision, L.M.-D.; project administration, L.M-D. All authors have read and agreed to the published version of the manuscript.
Funding
This research received no external funding.
Institutional Review Board Statement
Not applicable.
Informed Consent Statement
Not applicable.
Data Availability Statement
Data available on request.
Acknowledgments
Not applicable.
Conflicts of Interest
The authors declare no conflicts of interest.
Abbreviations
The following abbreviations are used in this manuscript:
| CSRD | Corporate Sustainability Reporting Directive |
| DEA | Data Envelopment Analysis |
| DW | Durbin-Watson |
| ESG | Environmental, Social, and Governance |
| ESRS | European Sustainability Reporting Standards |
| FMCDM | Fuzzy Multiple Criteria Decision-Making |
| GRI | Global Reporting Initiative |
| NACE / CAEN | Nomenclature of Economic Activities in the EU / Romanian classification |
| OLS | Ordinary Least Squares |
| RCA | Ratio of Current Assets to Total Assets |
| RDA | Ratio of Total Debt to Assets |
| RDE | Debt-to-Equity Ratio |
| REL | Ratio of Equity to Total Liabilities |
| RFA | Ratio of Fixed Assets to Total Assets |
| RI | Inventory Ratio |
| ROA | Return on Assets |
| ROE | Return on Equity |
| ROS | Return on Sales |
| RR | Receivables Ratio |
| TBL | Triple Bottom Line |
| VIF | Variance Inflation Factor |
References
- Siew, R.Y.J.; Balatbat, M.C.A.; Carmichael, D.G. The relationship between sustainability practices and financial performance of construction companies. Smart and Sustainable Built Environment 2013, 2, 6–27. [Google Scholar] [CrossRef]
- Zhou, L.; Tokos, H.; Krajnc, D.; Yang, Y. Sustainability performance evaluation in industry by composite sustainability index. Clean Technologies and Environmental Policy 2012, 14, 789–803. [Google Scholar] [CrossRef]
- Warhurst, A. Sustainability Indicators and Sustainability Performance Management. IIED & WBCSD, 2002.
- Marcis, J.; Bortoluzzi, S.C.; de Lima, E.P.; da Costa, S.E.G. Sustainability performance evaluation of agricultural cooperatives’ operations: A systemic review of the literature. Environmental Development and Sustainability 2019, 21, 1111–1126. [Google Scholar] [CrossRef]
- Batrancea, I.; Morar, I.-D.; Masca, E.; Catalin, S.; Bechis, L. Econometric Modeling of SME Performance: Case of Romania. Sustainability 2018, 10, 192. [Google Scholar] [CrossRef]
- Chudy-Laskowska, K.; Rokita, S. Profitability of Energy Sector Companies in Poland: Do Internal Factors Matter? Energies 2024, 17, 5135. [Google Scholar] [CrossRef]
- Damtoft, N.F.; van Liempd, D.; Lueg, R. Sustainability performance measurement – a framework for context-specific applications. Journal of Global Responsibility 2025, 16, 162–201. [Google Scholar] [CrossRef]
- Chourasiya, R.; Pandey, S.; Malviya, R.K.; Pujara, A. A. Towards sustainable success: A framework for assessing performance of sustainable manufacturing adoption in Indian textile industry. Sustainable Futures 2024, 7, 100216. [Google Scholar] [CrossRef]
- Sarker, M. R. , Ali, S. M., Paul, S. K., Munim, Z. H. Measuring sustainability performance using an integrated model. Measurement 2021, 184, 109931. [Google Scholar] [CrossRef]
- Ejoh, N.O. Relation Between Circulating Assets and Firm Reported Profits: An Empirical Exploration. IOSR Journal of Business and Management 2017, 19, 68–73. [Google Scholar]
- Argento, D.; Brorström, S.; Grossi, G. Translating social sustainability goals into performance measurement practices. Journal of Public Budgeting, Accounting & Financial Management 2024. [Google Scholar] [CrossRef]
- Mengistu, A.T.; Panizzolo, R. Analysis of indicators used for measuring industrial sustainability: A systematic review. Environment, Development and Sustainability 1979, 25, 1979–2005. [Google Scholar] [CrossRef]
- León-Bravo, V.; Caniato, F. Sustainability performance measurement in the food supply chain: Trade-offs, institutional pressures, and contextual factors. European Management Journal 2024, 42, 633–646. [Google Scholar] [CrossRef]
- Yeh, L.-T. Integrating corporate image of corporate social responsibility, stock price crash risk and profitability into a dynamic corporate sustainability performance measurement. Annals of Operations Research 2021, 305, 325–345. [Google Scholar] [CrossRef]
- Kühnen, M.; Silva, S.; Hahn, R. From negative to positive sustainability performance measurement and assessment? A qualitative inquiry drawing on framing effects theory. Business Strategy and the Environment 2022, 31, 1985–2001. [Google Scholar] [CrossRef]
- Searcy, C. Corporate sustainability performance measurement systems: A review and research agenda. Journal of Business Ethics 2011, 107, 239–253. [Google Scholar] [CrossRef]
- Aman, S.; Seuring, S.; Khalid, R.U. Sustainability performance measurement in risk and uncertainty management: An analysis of base of the pyramid supply chain literature. Business Strategy and the Environment 2022, 32, 2373–2398. [Google Scholar] [CrossRef]
- Tugui, A. Calm Technologies as the Future Goal of Information Technologies. In Encyclopedia of Multimedia Technology and Networking, 2nd ed.; IGI Global Scientific Publishing: Hershey, PA, USA, 2009. [Google Scholar] [CrossRef]
- Tugui, A. Cloud Computing—A Calm Technology for Humans–Business–Environment Triad. J. Res. Pract. Inf. Technol. 2014, 46, 31–45. [Google Scholar]
Figure 1.
Frequency and importance of key terms in the literature.
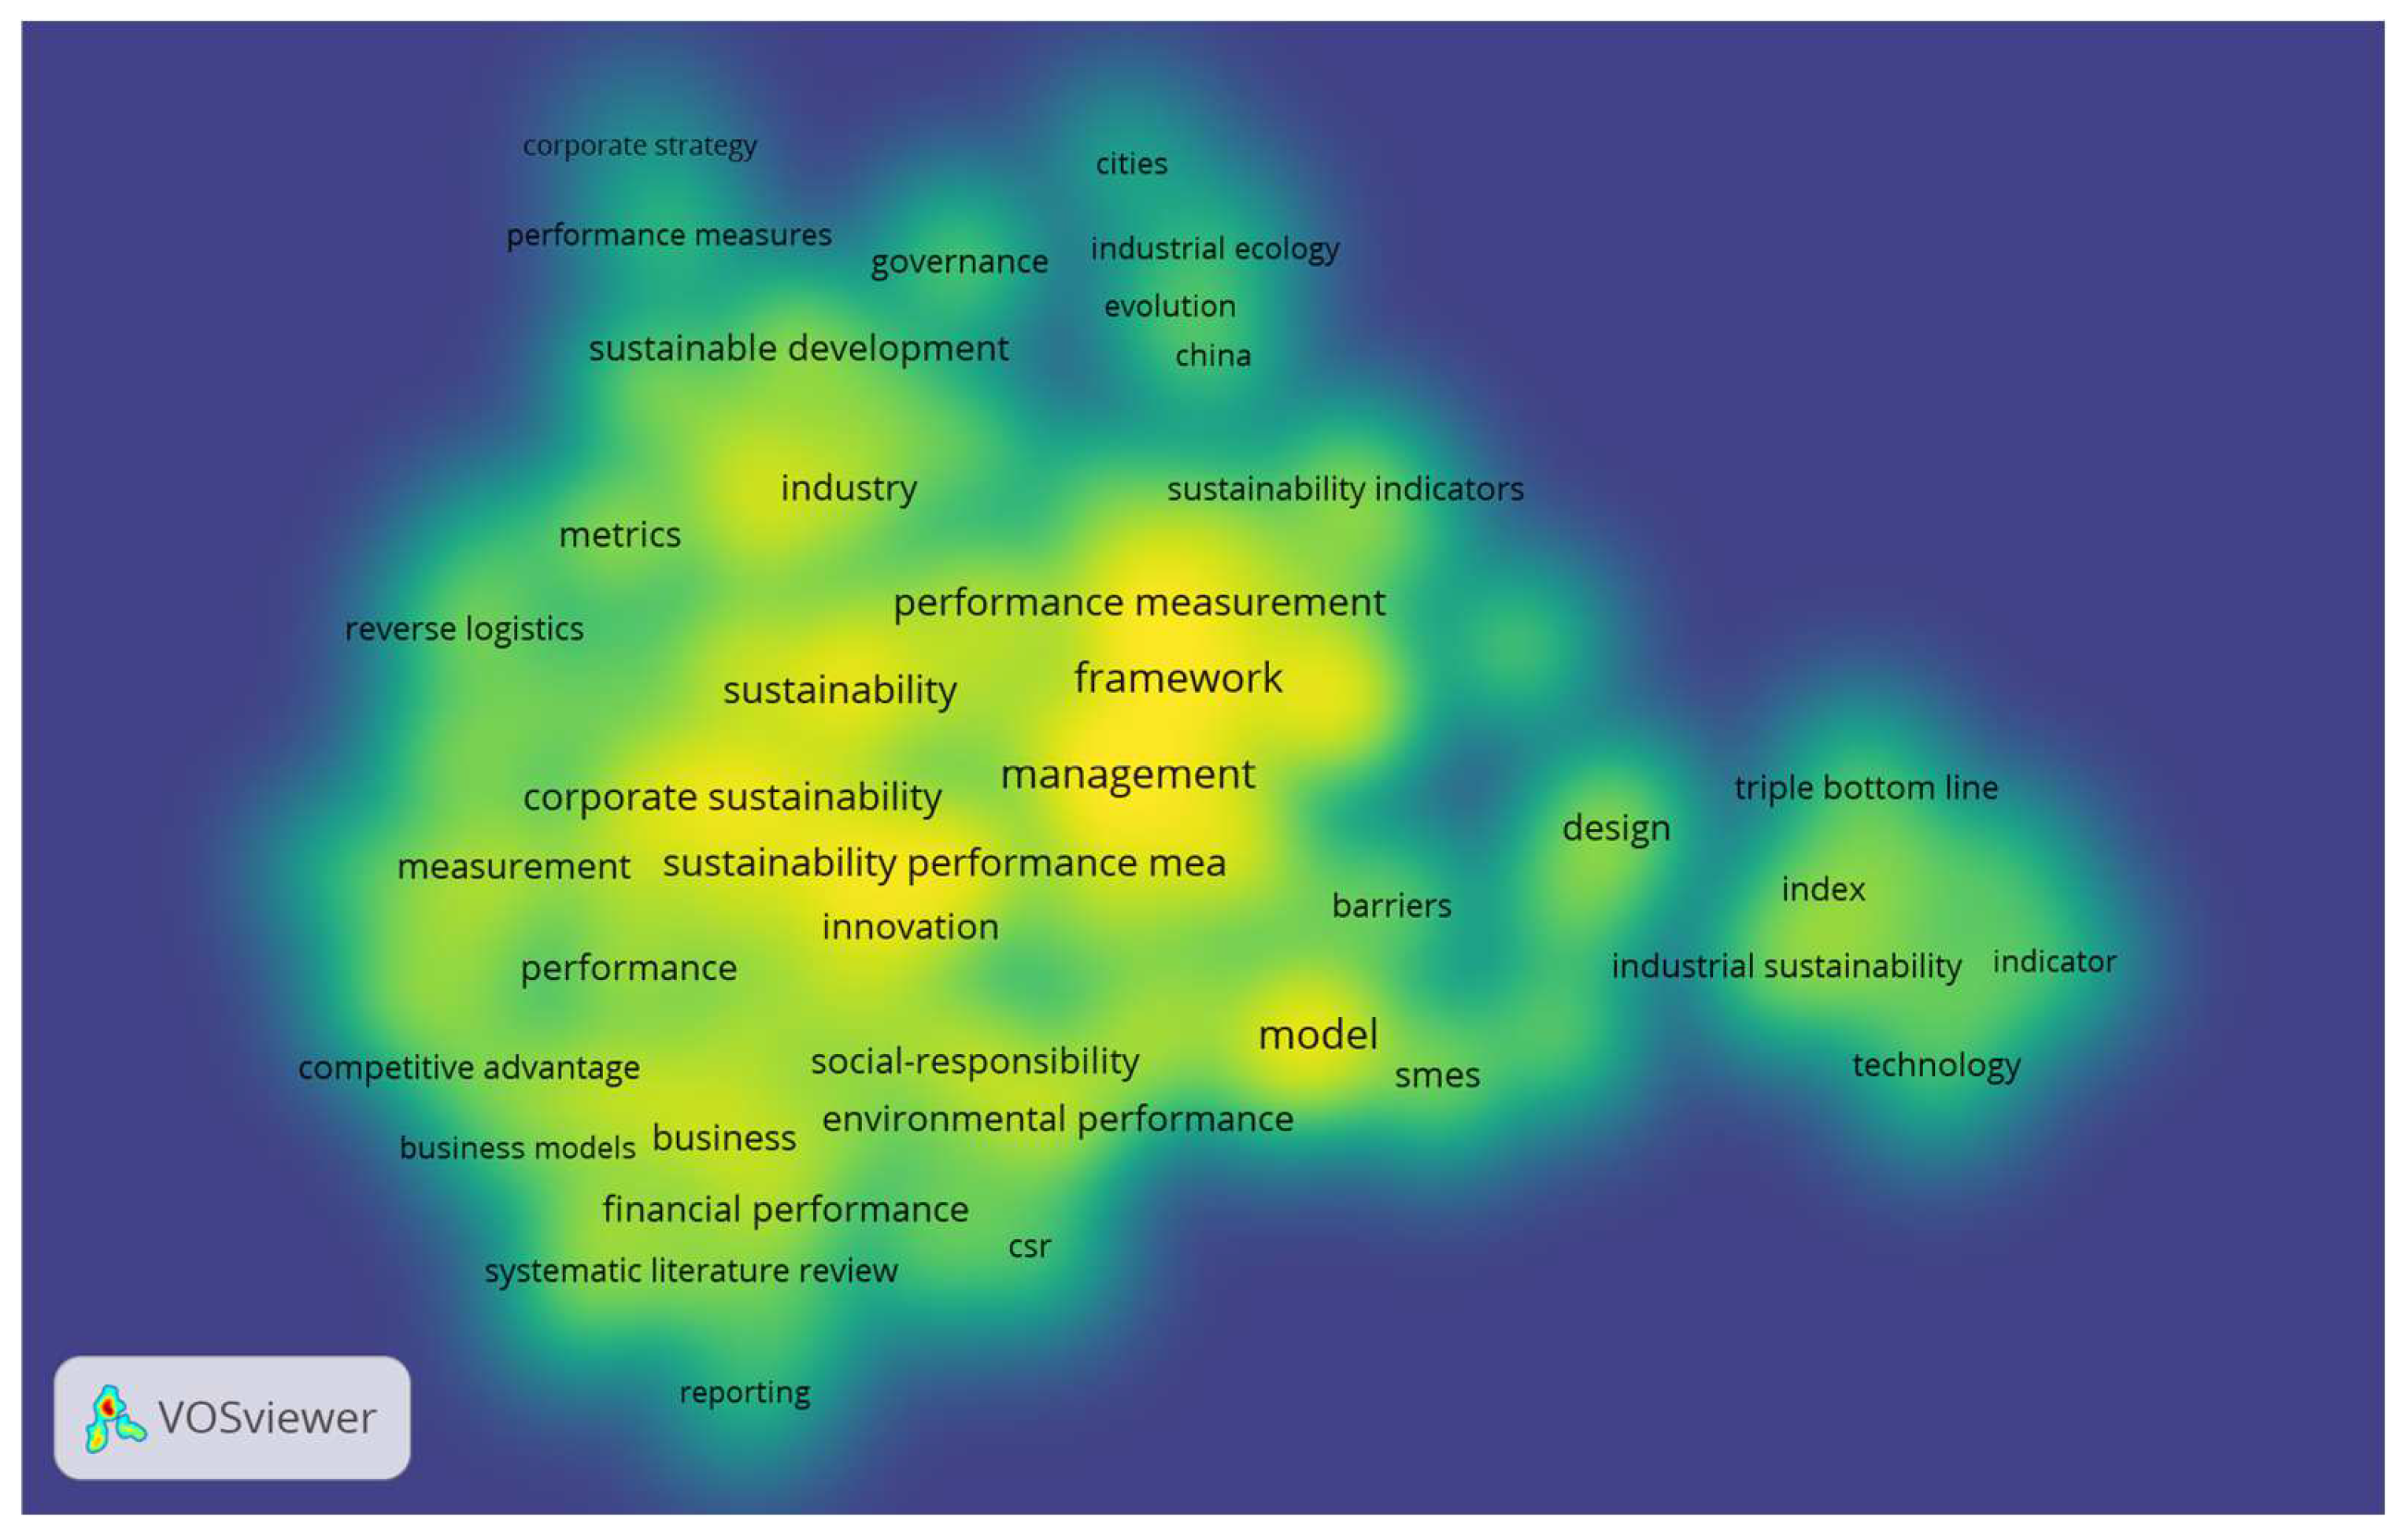
Figure 2.
Conceptual structure of the domain: clusters and connections between terms.
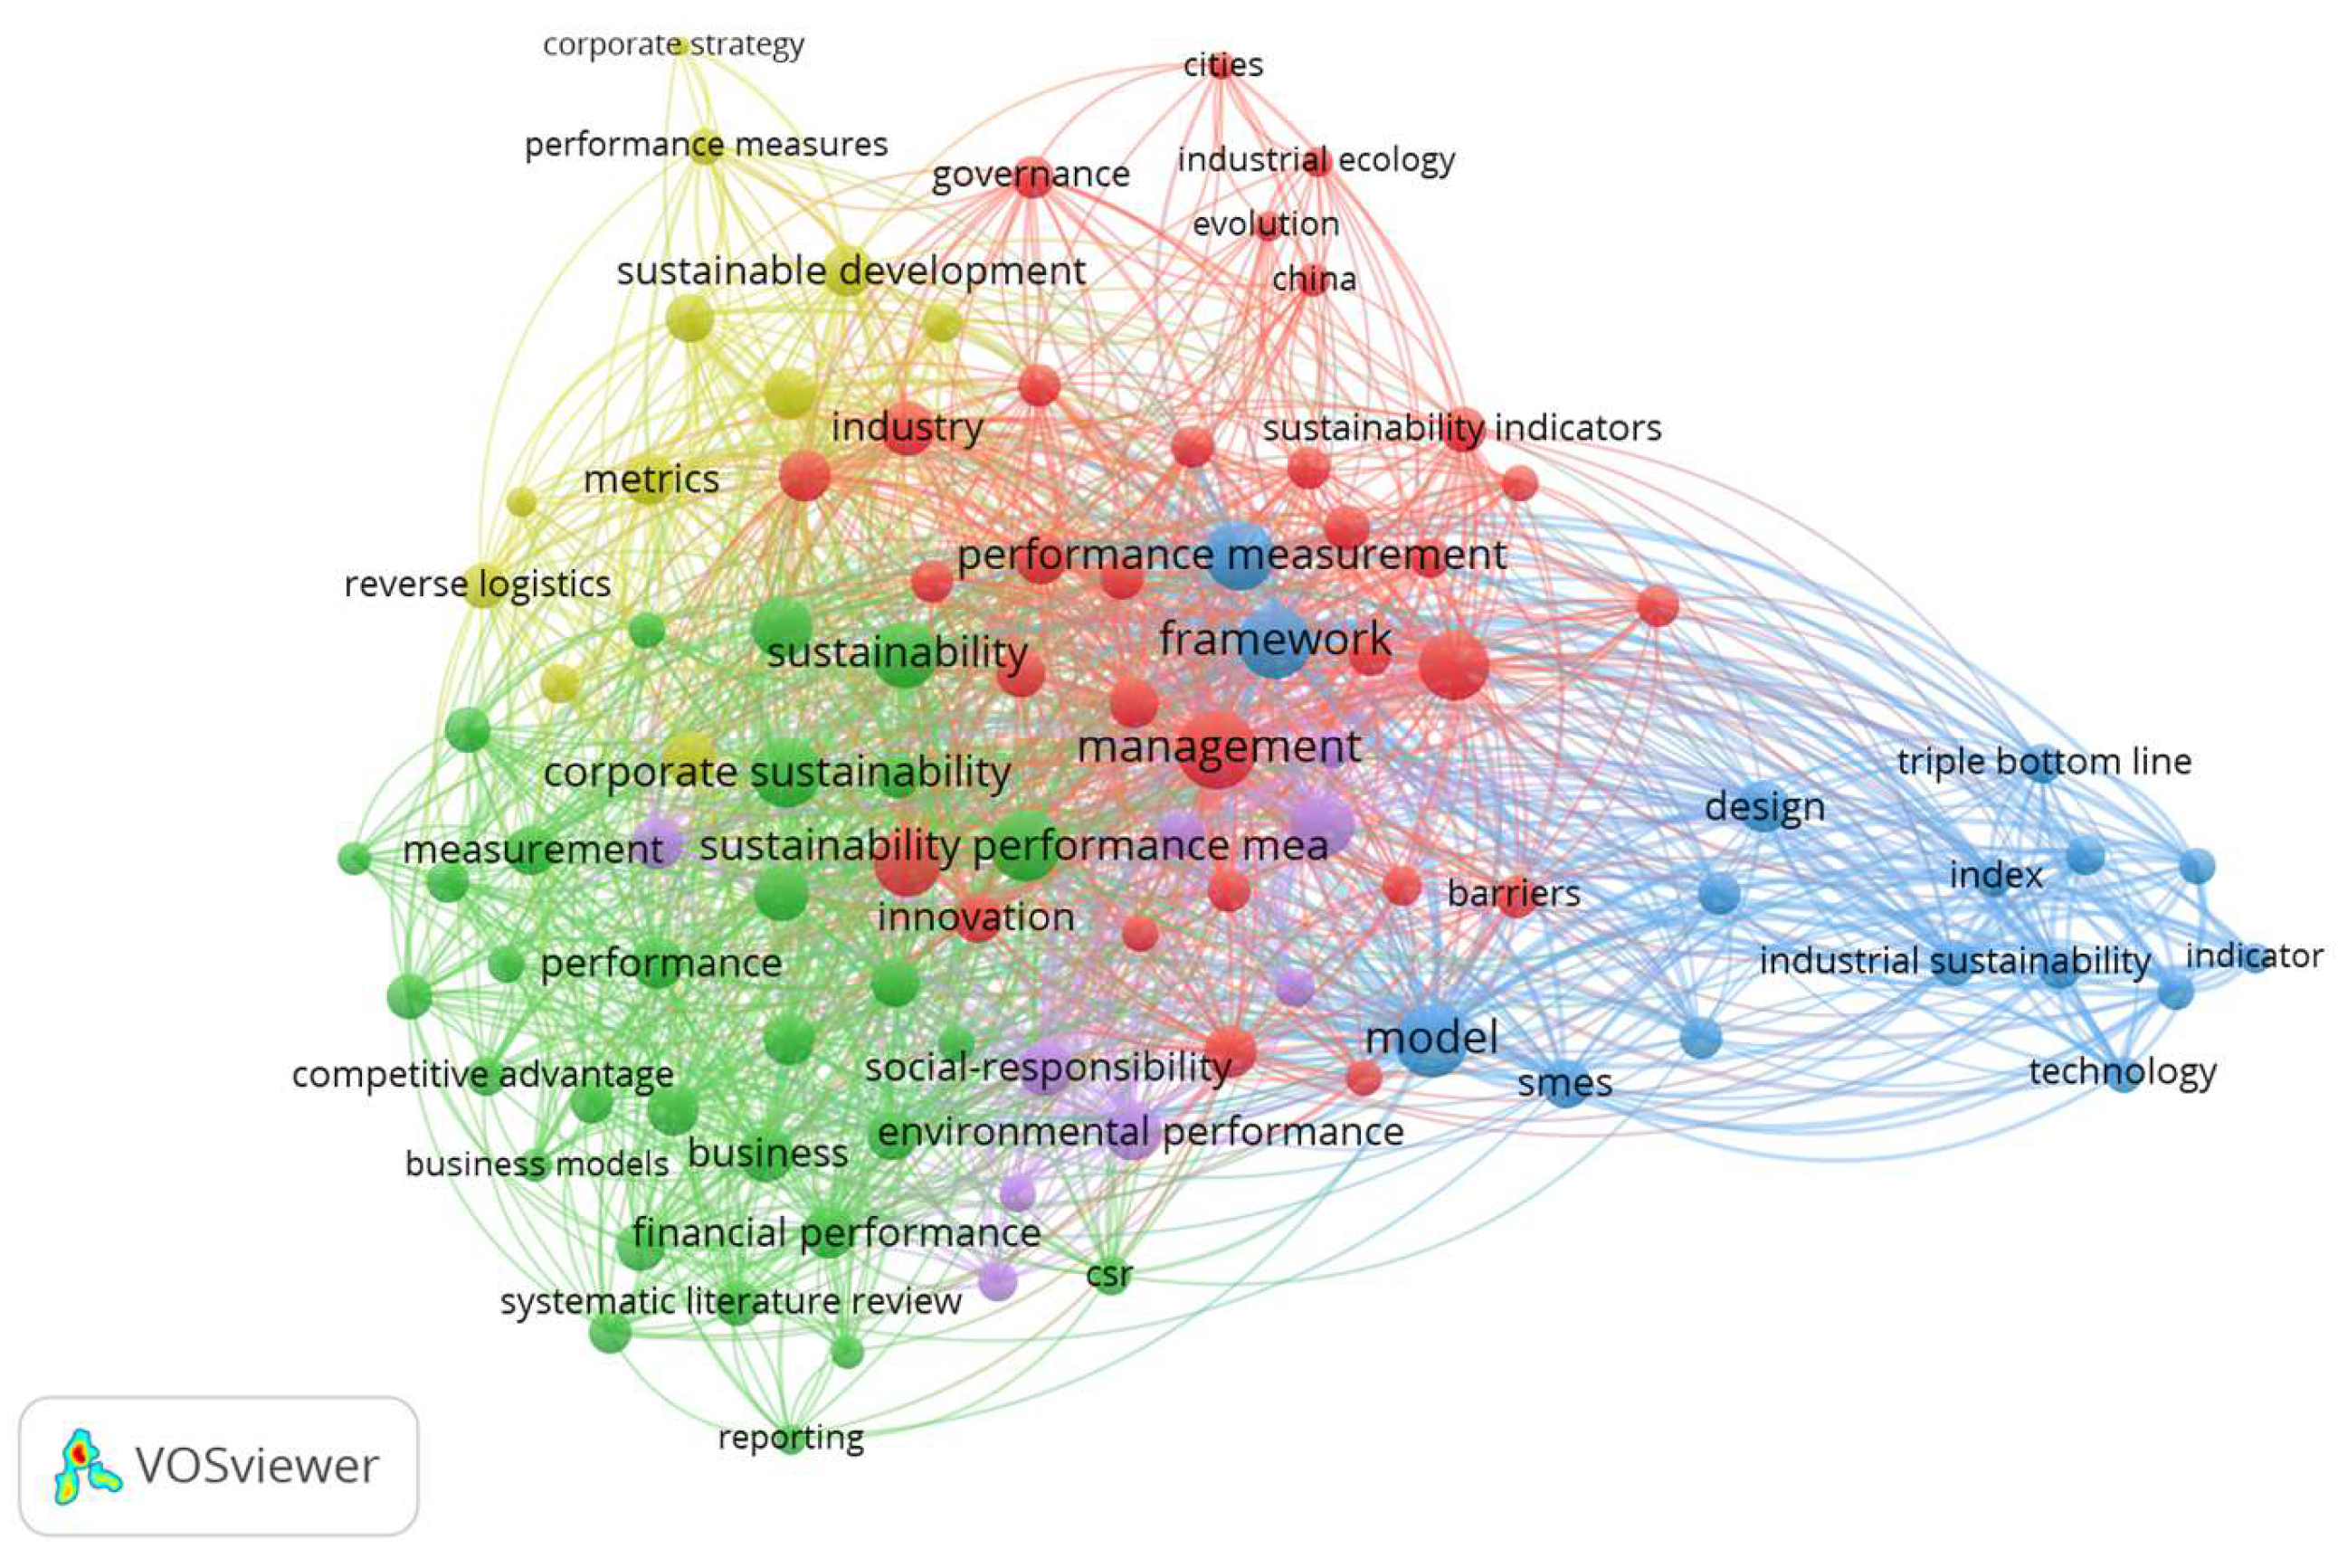
Figure 3.
Emerging directions in corporate sustainability research.
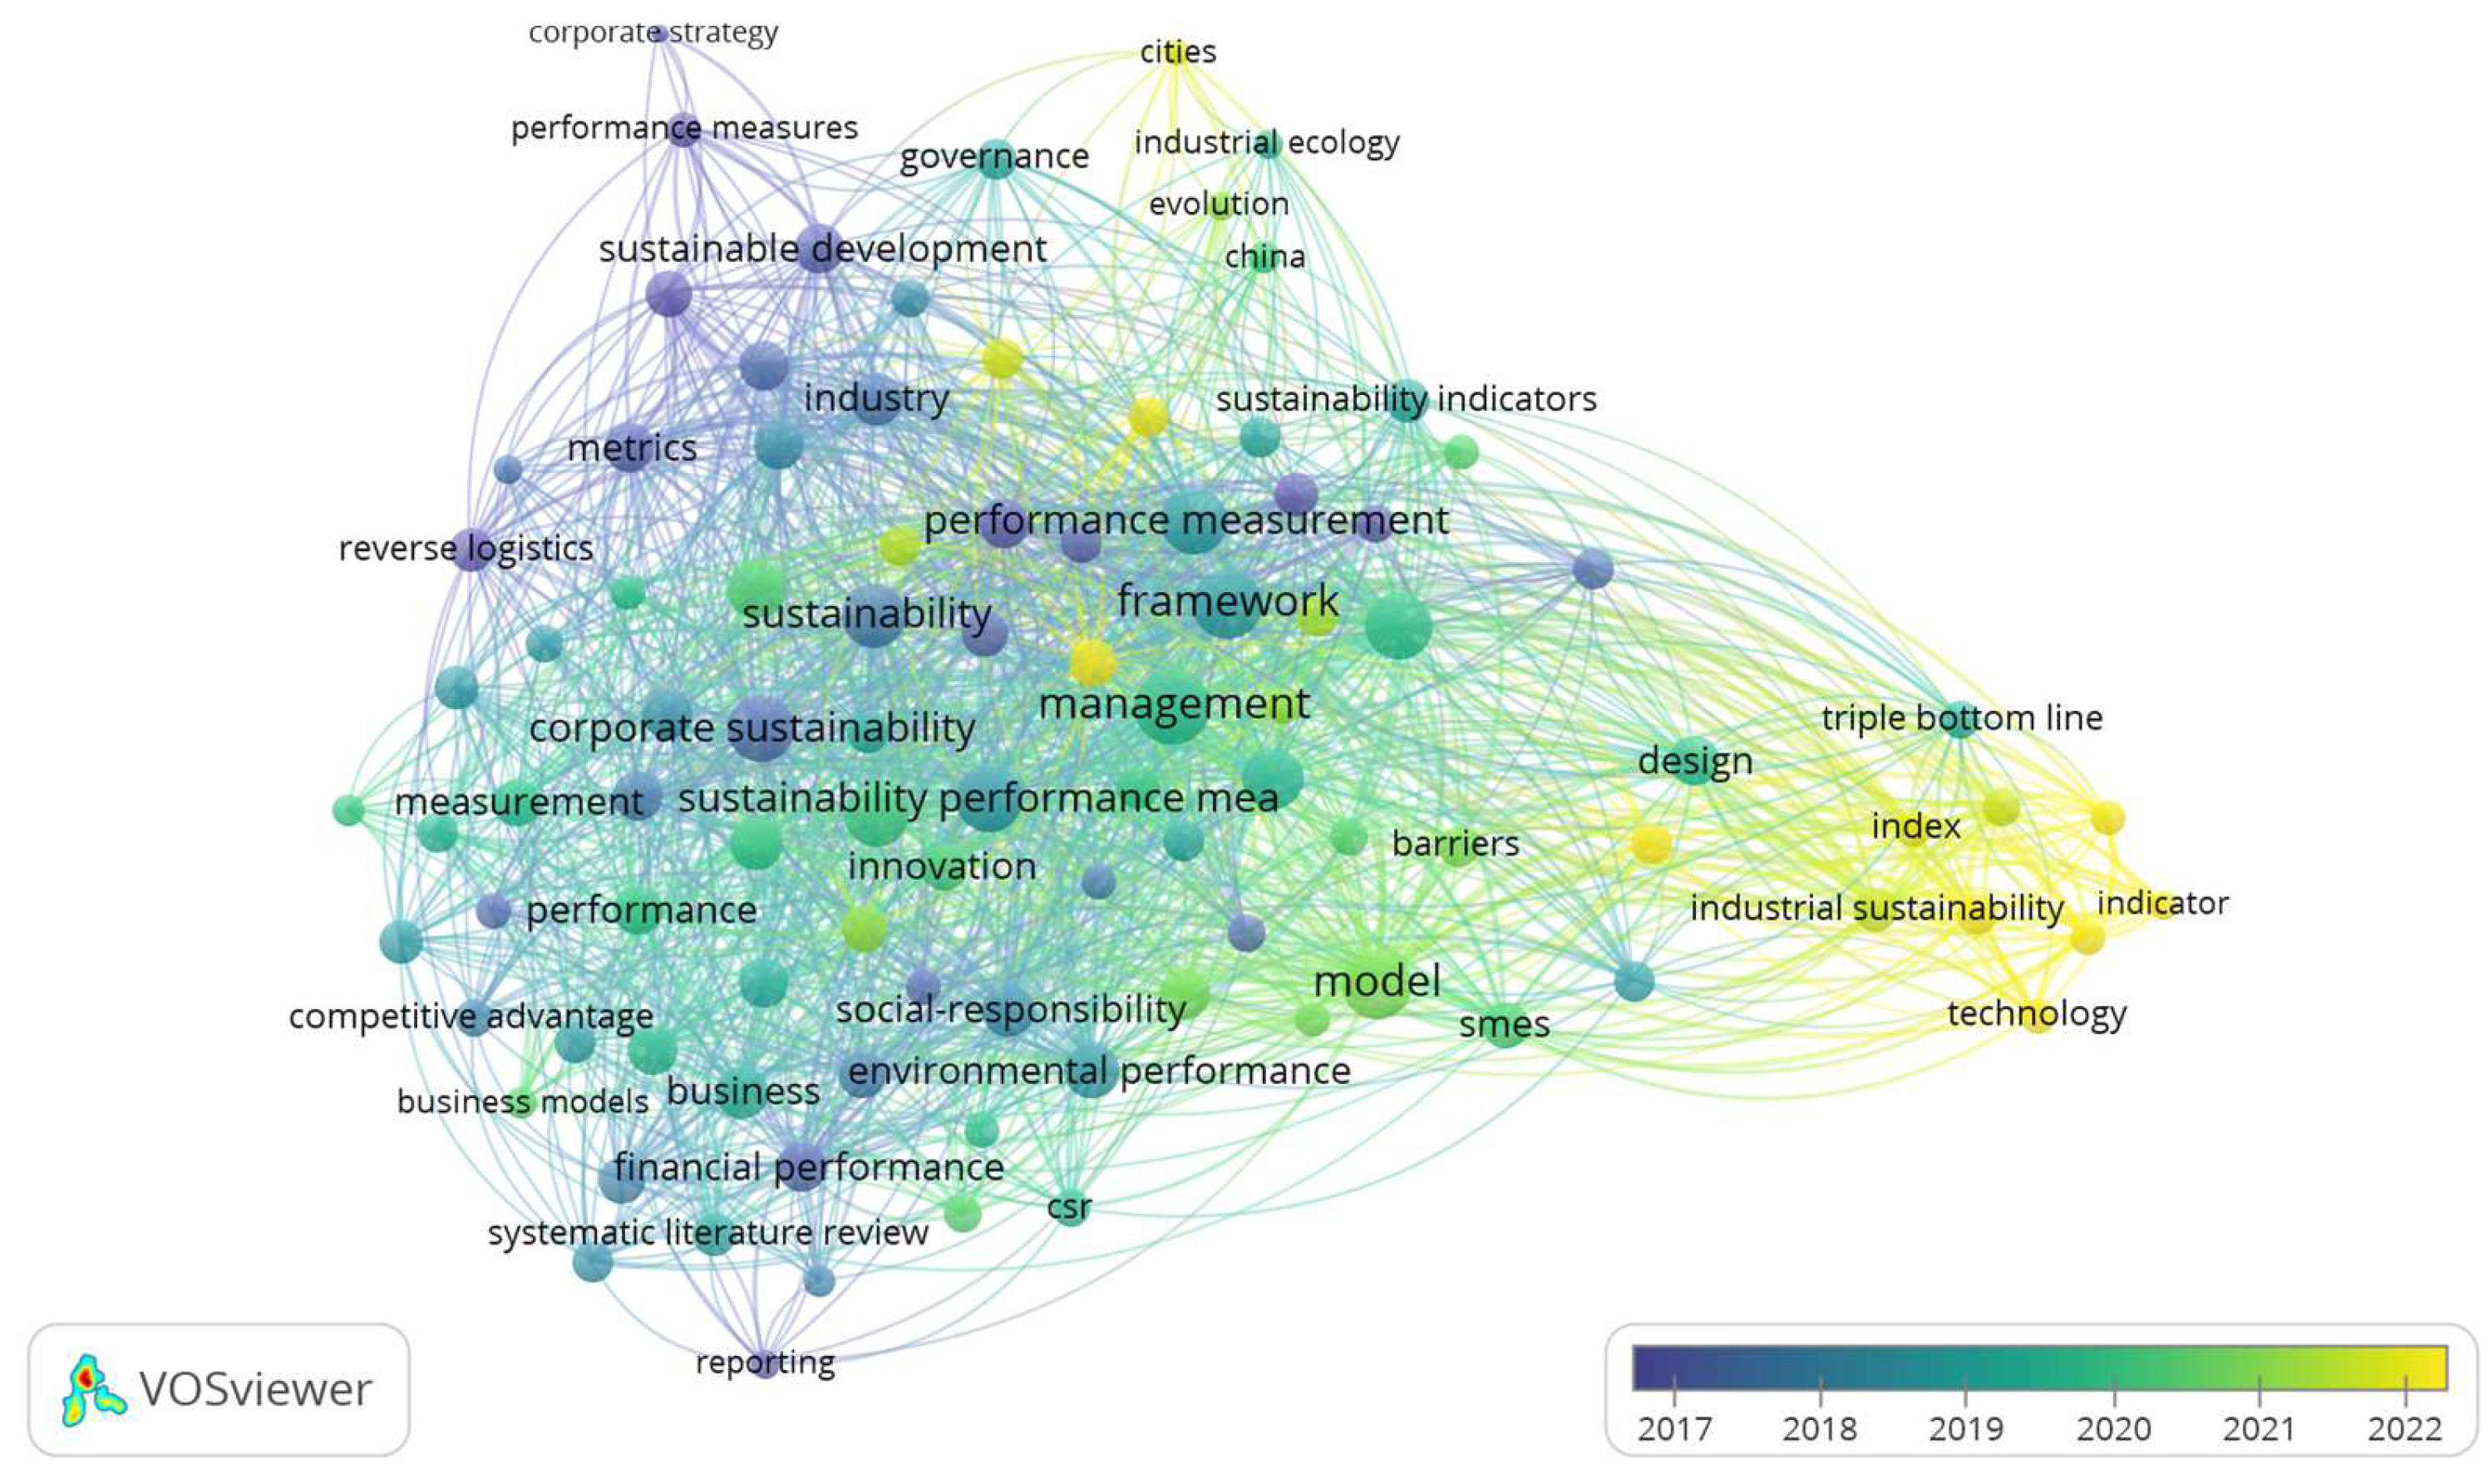
Figure 4.
Evolution of the construction sector: (a) Evolution of profit and turnover; (b) Evolution of the number of companies and their employees.
Figure 4.
Evolution of the construction sector: (a) Evolution of profit and turnover; (b) Evolution of the number of companies and their employees.
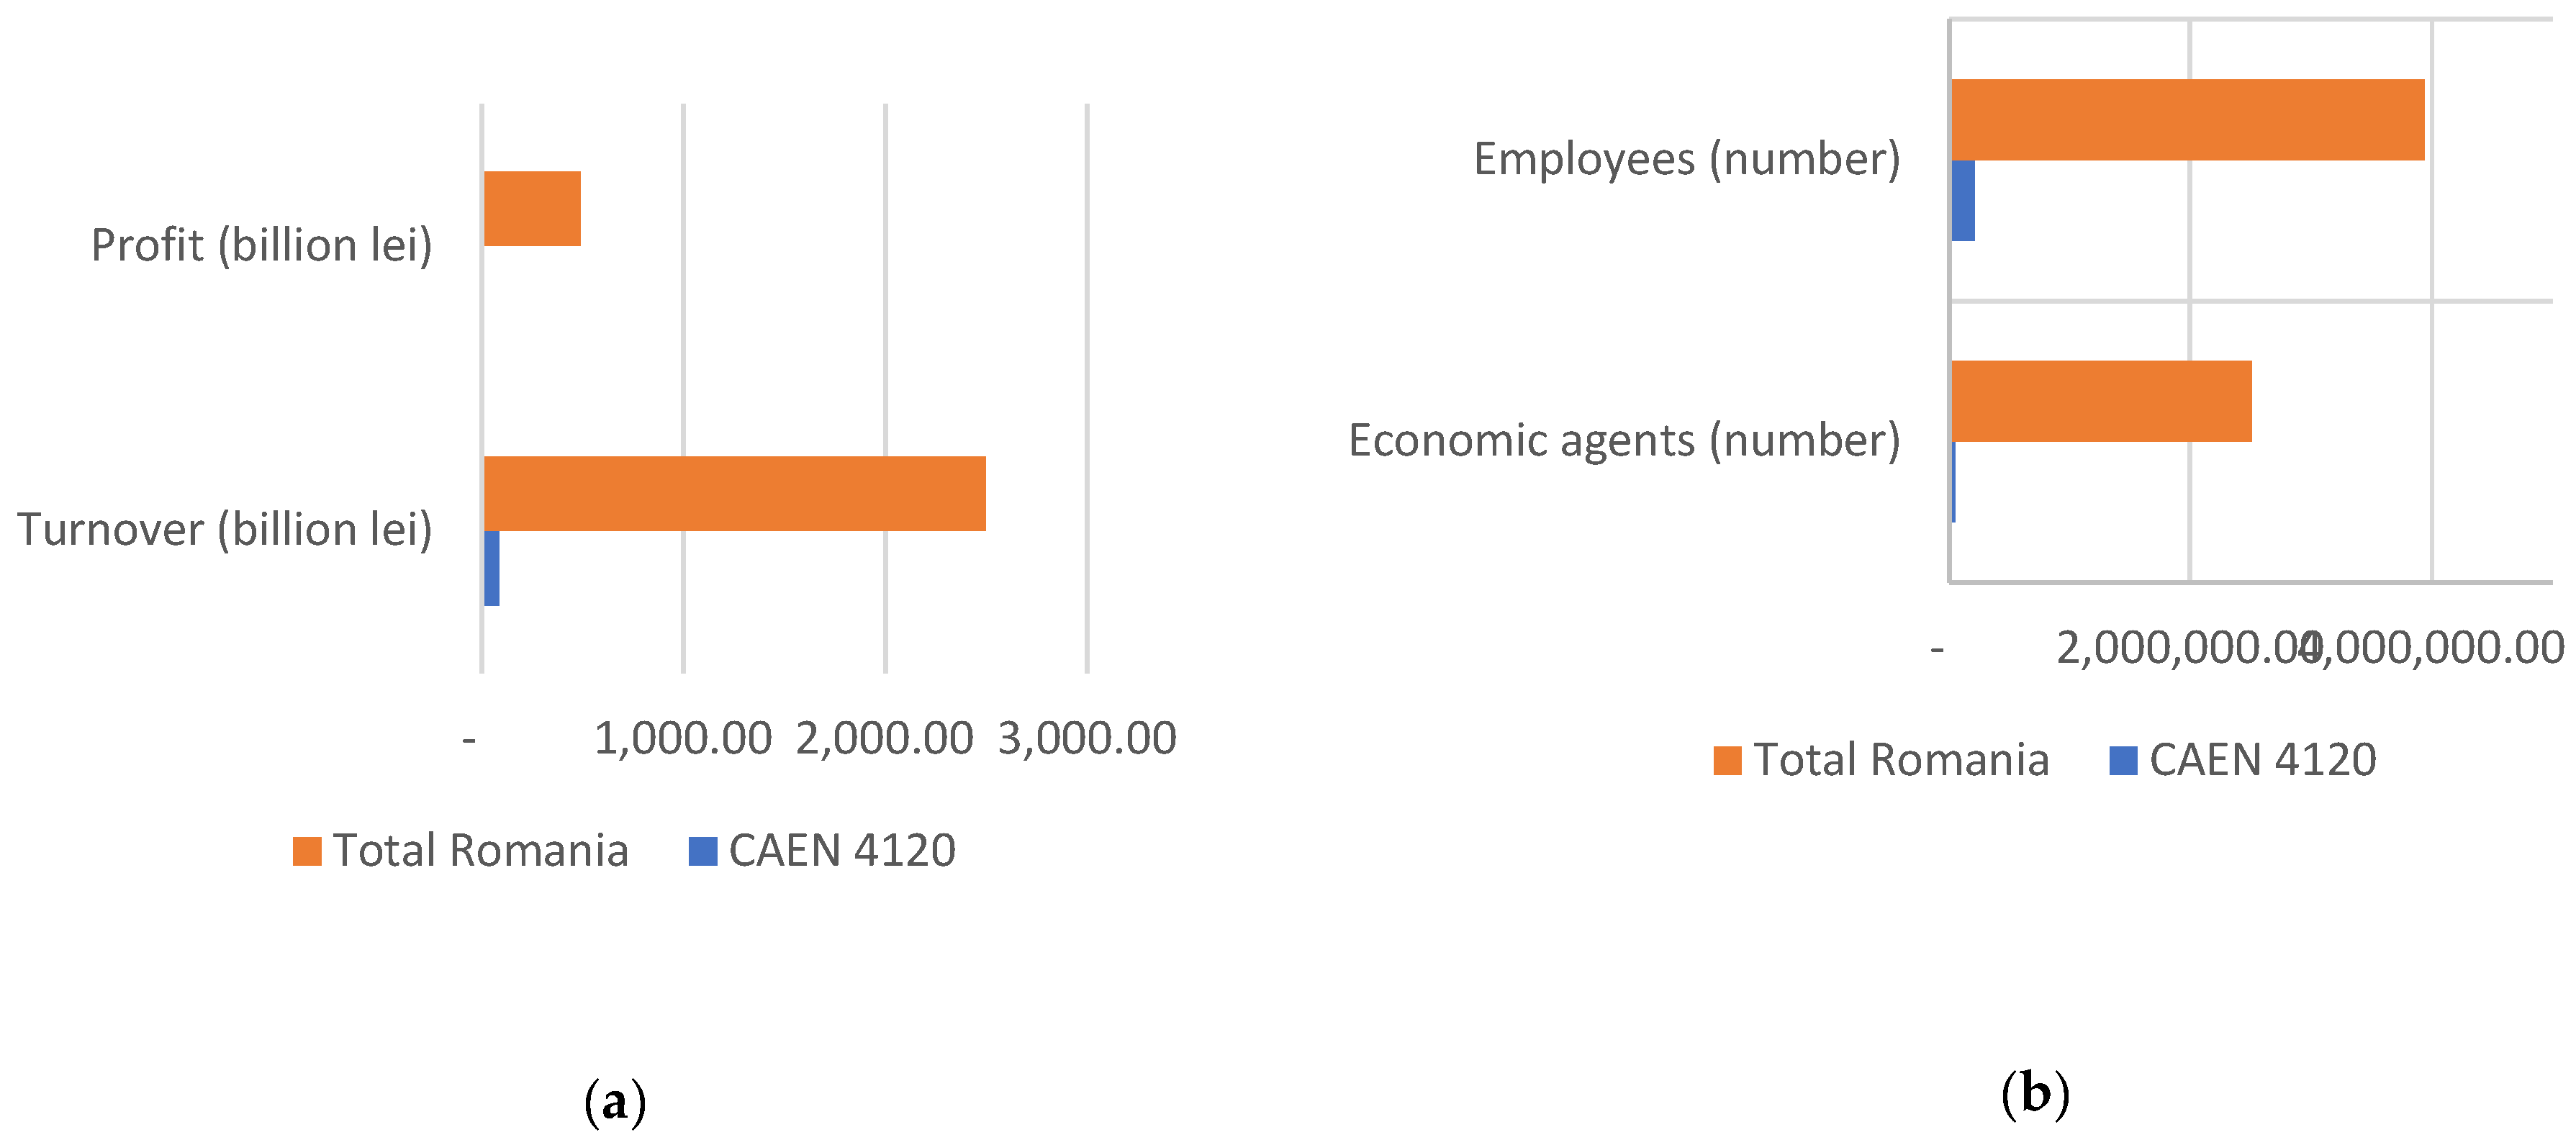
Figure 5.
Performance evolution of the selected construction companies: (a) Evolution of Turnover and ROA; (b) Evolution of ROE and Solvency.
Figure 5.
Performance evolution of the selected construction companies: (a) Evolution of Turnover and ROA; (b) Evolution of ROE and Solvency.
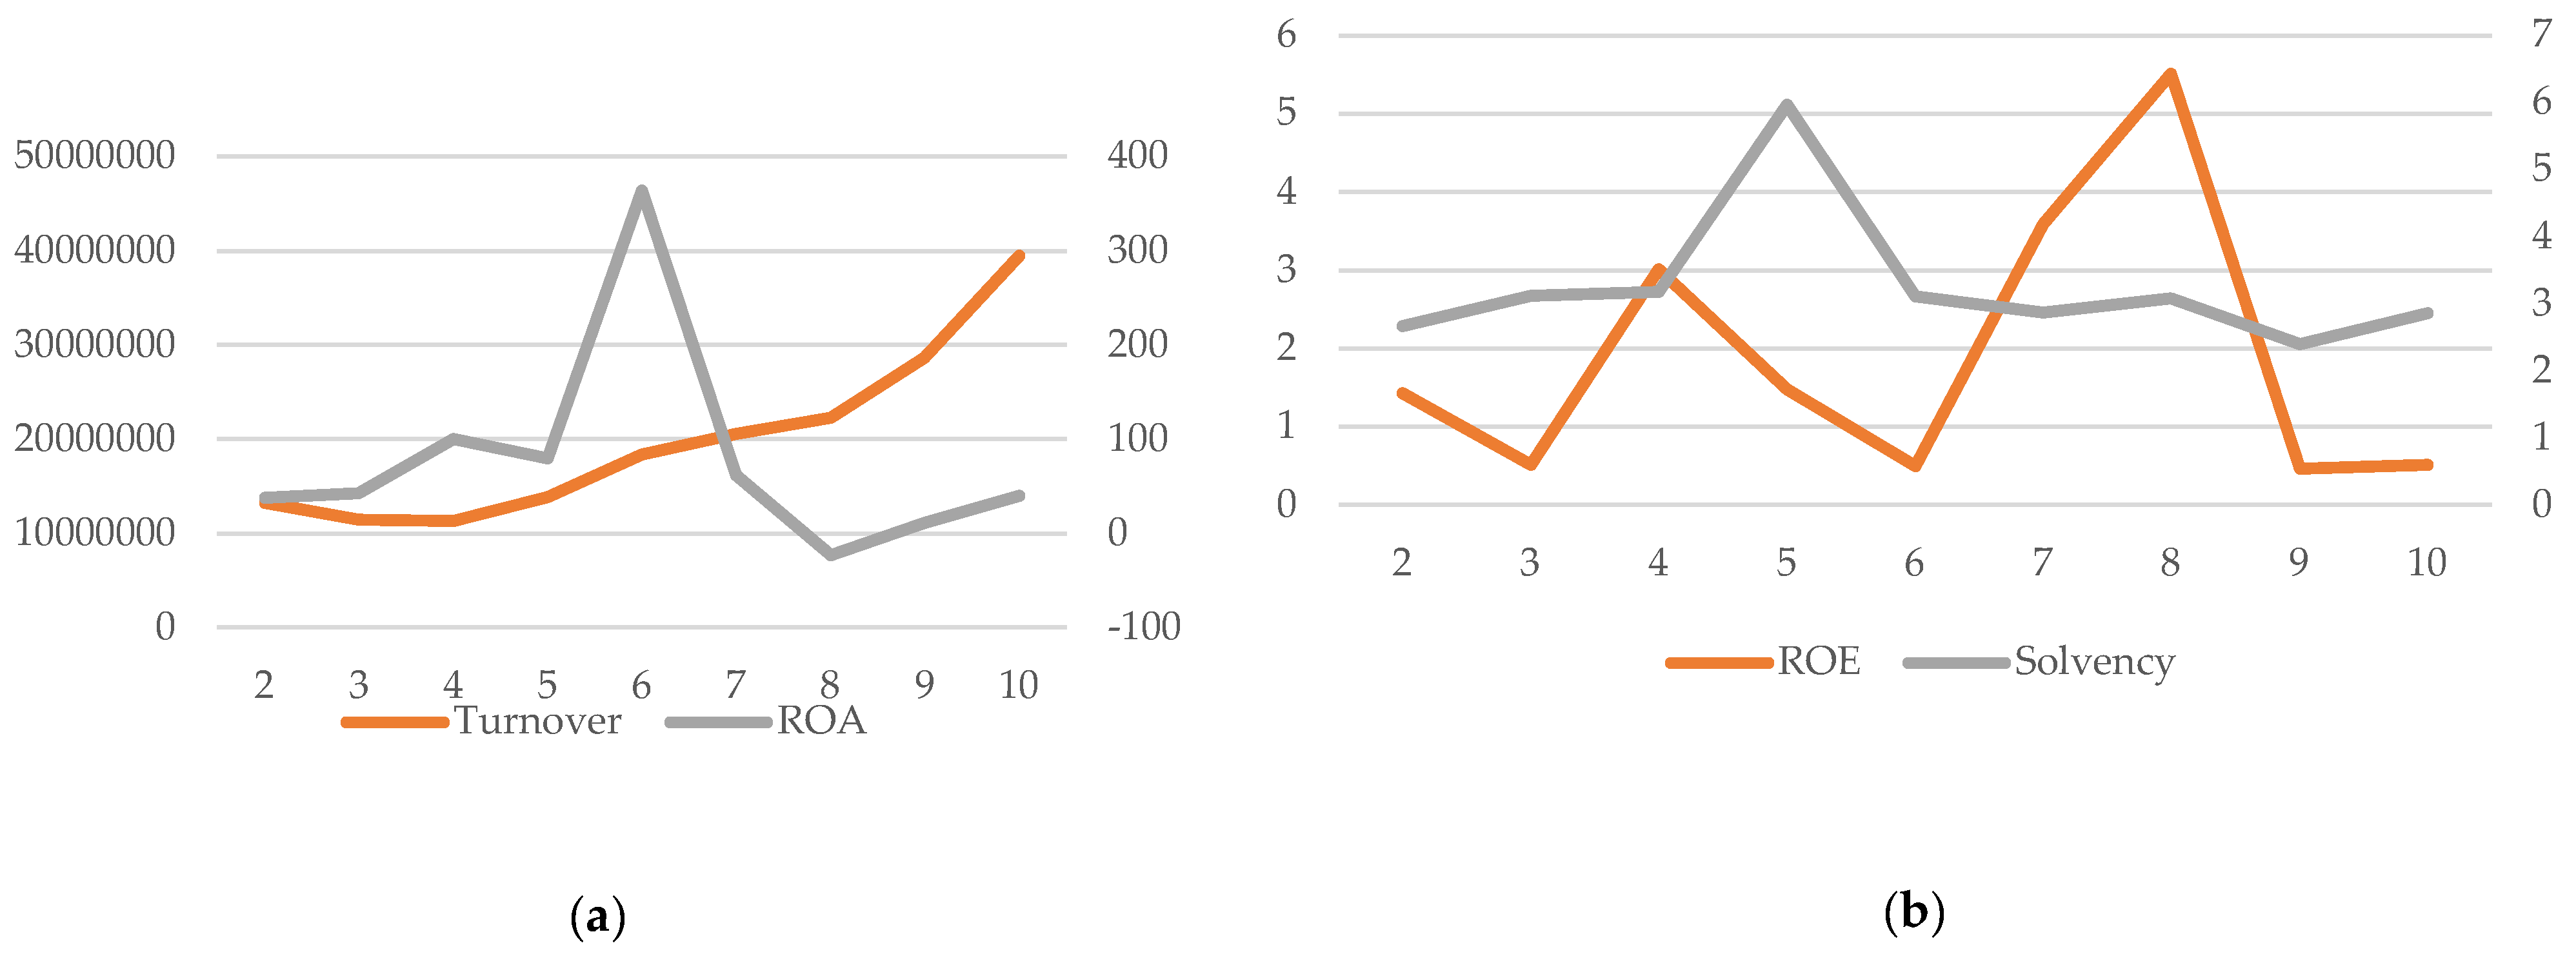
Figure 6.
Total sustainability score trend.
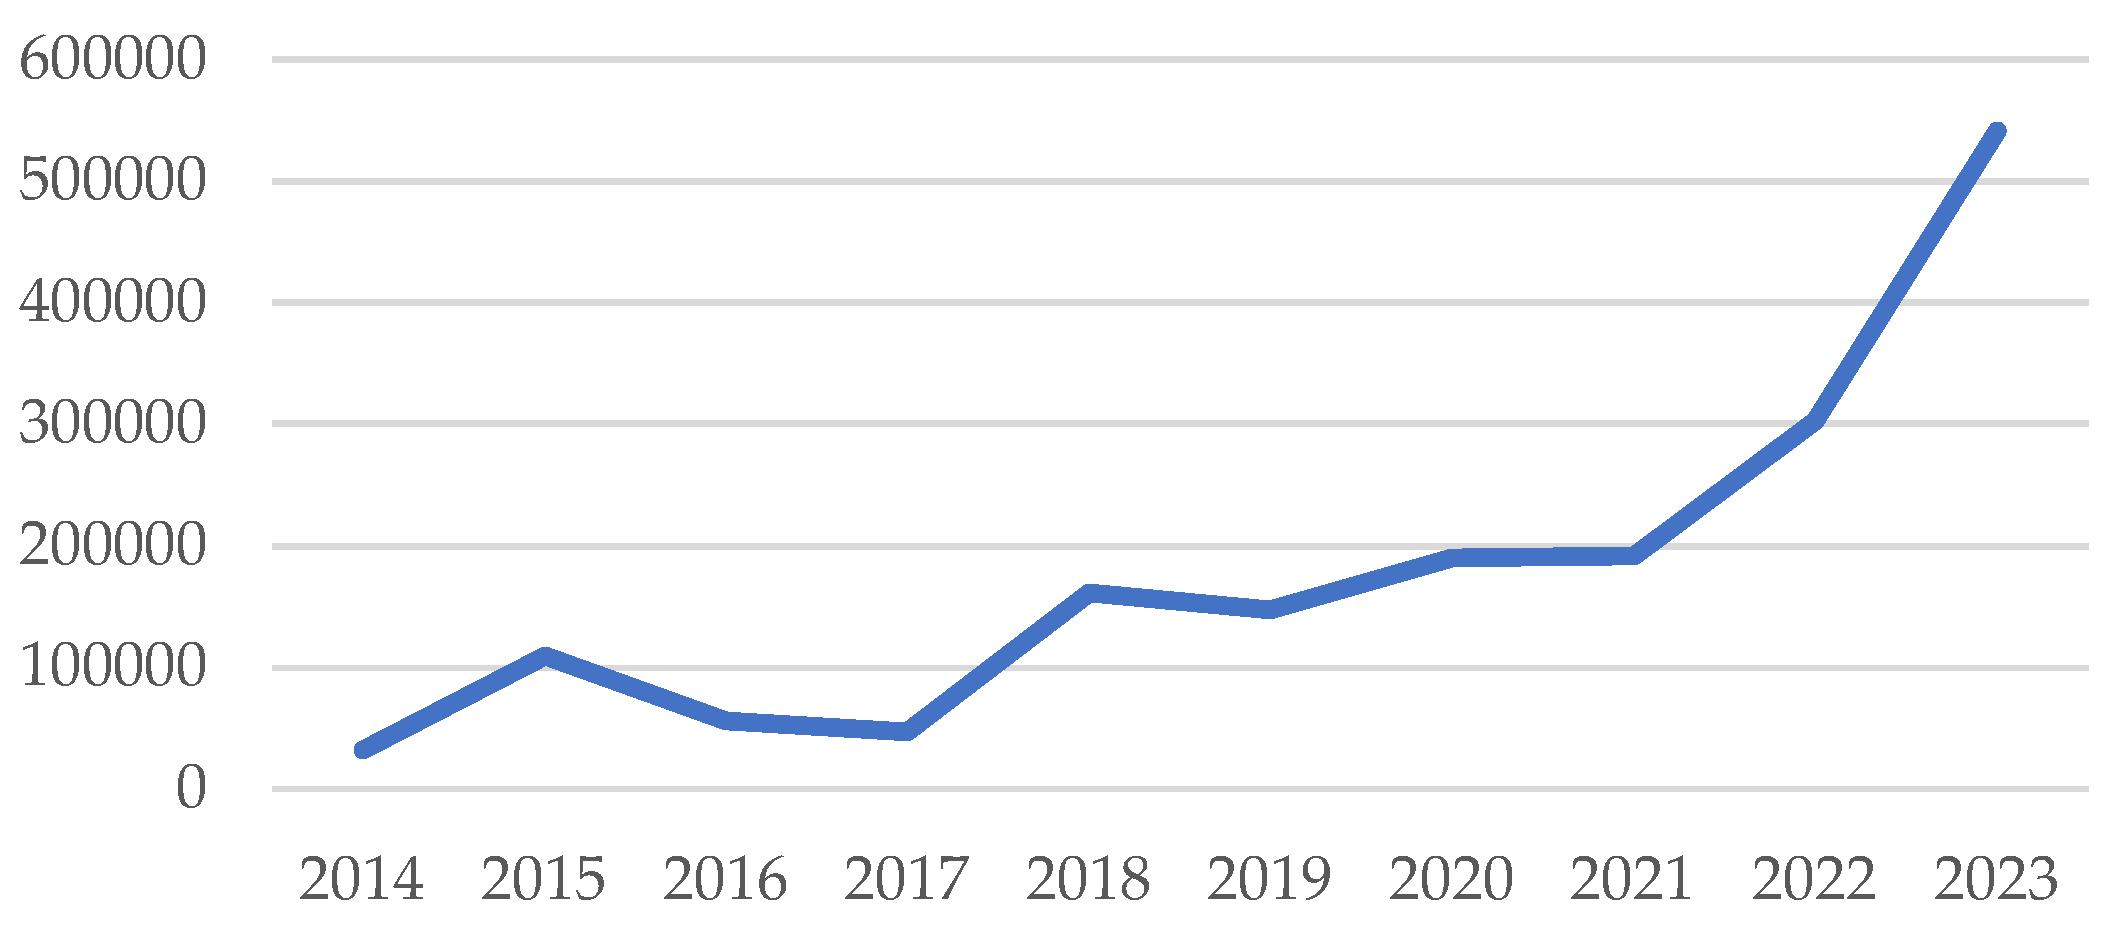
Figure 7.
Correlation matrix between sustainability indicators.
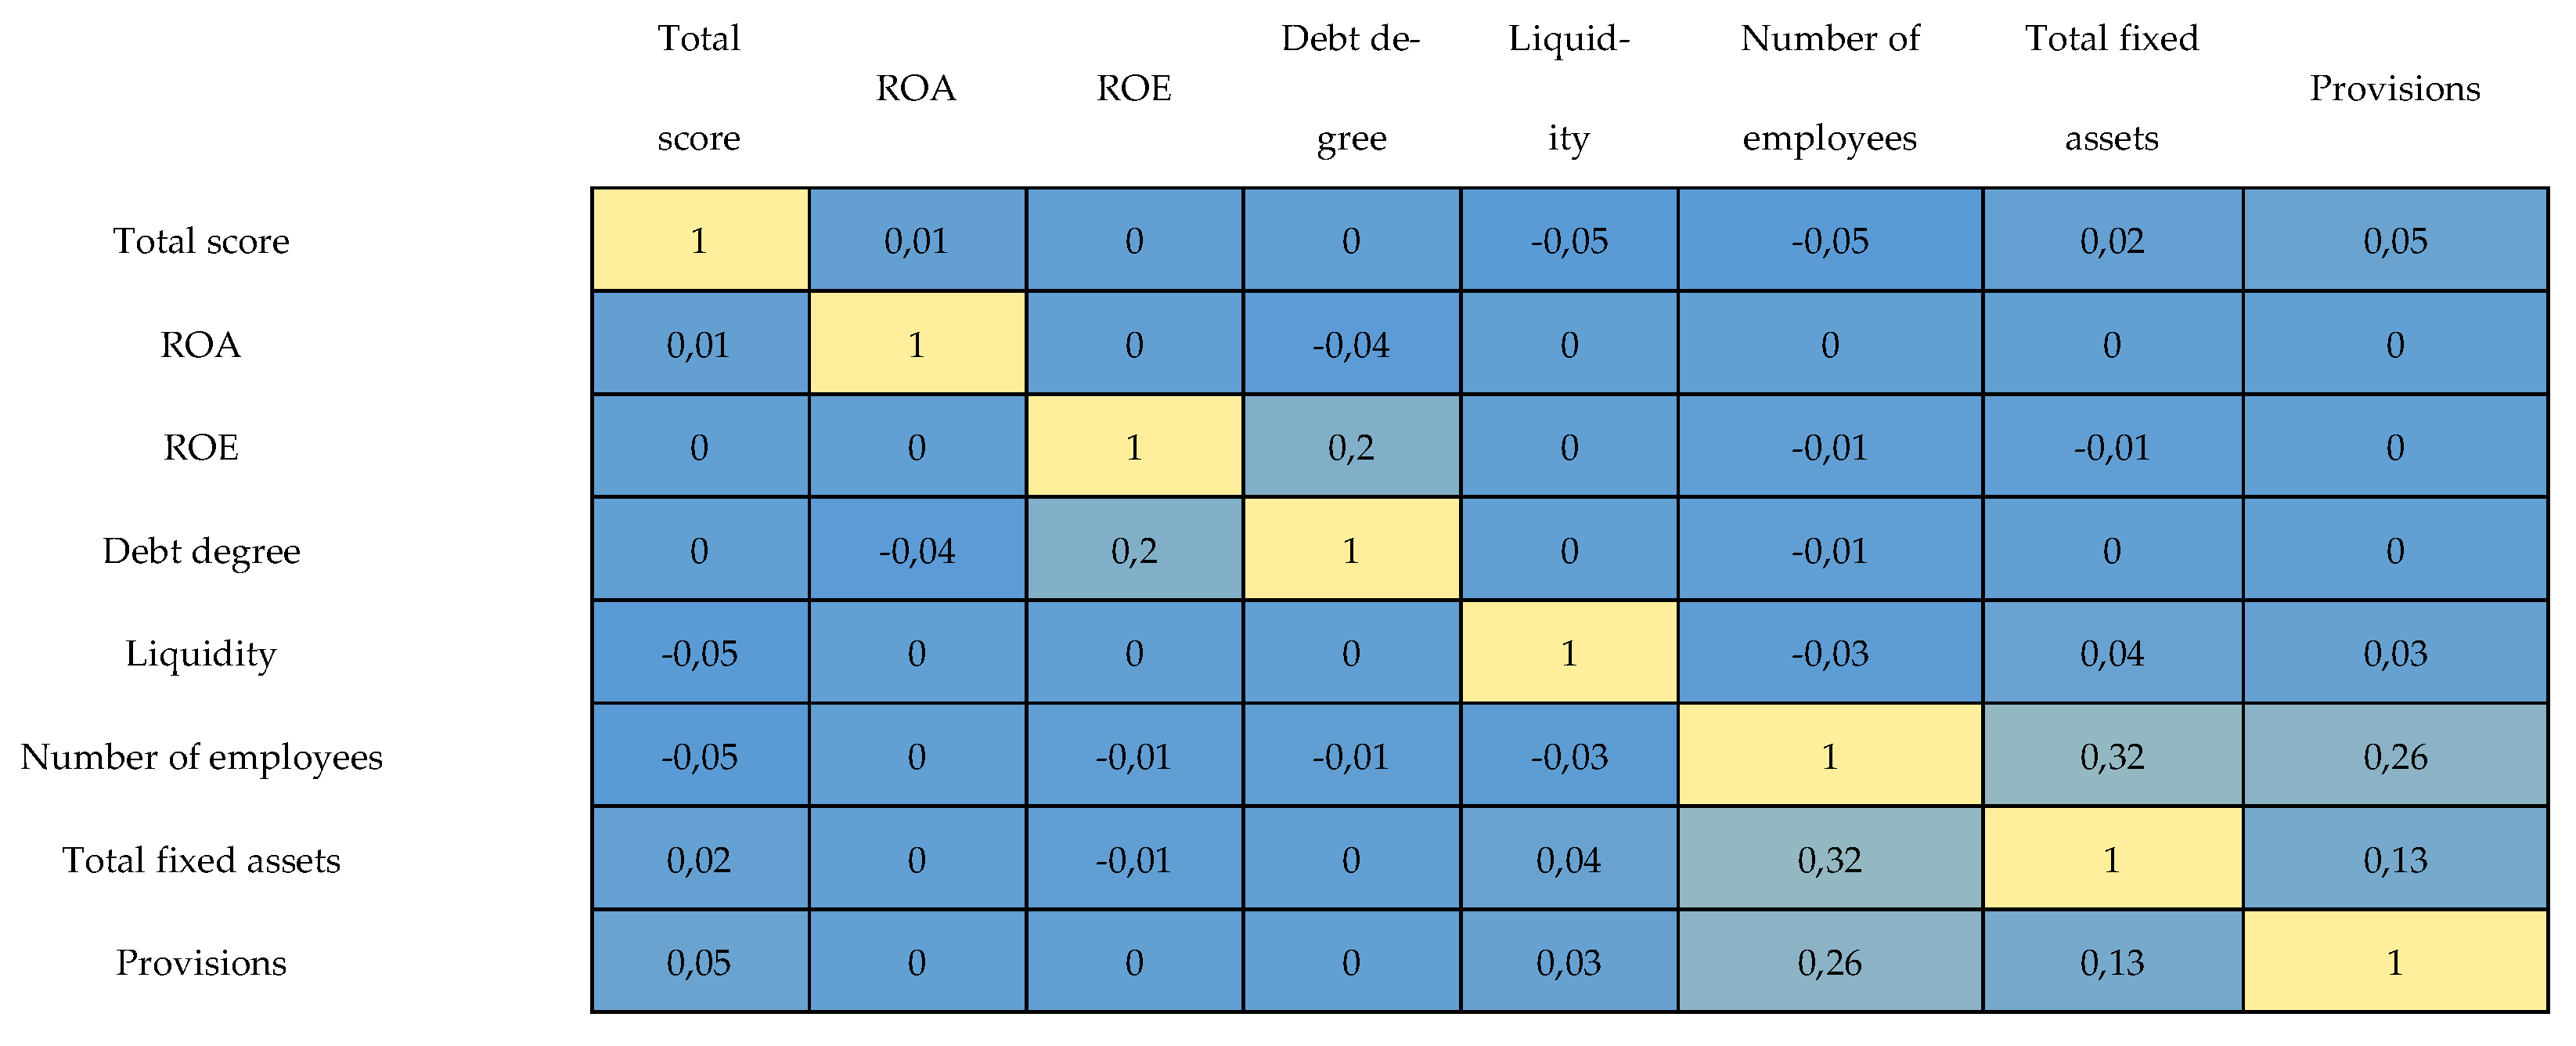

Table 1.
Comparison between sustainability categories.
| Indicator | High Sustainability | Moderate Sustainability | Low Sustainability |
|---|---|---|---|
| ROA/ROE | High | Medium | Low/Negative |
| Degree of debt | Low | Medium | High |
| Liquidity | Good | Fluctuating | Low |
| Average number of employees | Stable or increasing | Stable | Low or declining |
| Environmental investments | High | Limited | Non-existent |
| Environmental provisions | Consistent | Limited | Absent |
| Risk exposure | Low | Moderate | High |
Table 2.
This is a table. Tables should be placed in the main text near the first time they are cited.
Table 2.
This is a table. Tables should be placed in the main text near the first time they are cited.
| Model | Dependent variables | R2 | Durbin-Watson | Significant variables (p < 0.05) | Non-significant variables (p > 0.05) | Heteroscedasticity / Breusch-Pagan Test | Endogeneity / Breusch-Godfrey Test | Multicollinearity / VIF |
|---|---|---|---|---|---|---|---|---|
| Environmental Score | RR, RDE, ROS, REL, ROA, RDA, RI, RCA, RFA | 0.836 | 1.989 | REL, RI | RCA, RDA, RDE, RFA, ROA, ROS, RR | Lagrange multiplier statistic: 9200.61 p-value: 0.000 (p < 0.05) |
p-value: 0.008 (p < 0.05) | REL: 1.000 RI: 1.000 |
| Financial Score | 0.975 | 1.981 | ROA | RCA, RDA, RDE, RFA, RI, ROS, RR | Lagrange multiplier statistic: 25.69 p-value: 3.99e-07 (p < 0.05) |
p-value: 7.01e-05 (p < 0.05) | ROA: 1.000 | |
| Social Score | 0.006 | 1.963 | REL | RR, RDE, ROS, ROA, RDA, RI, RCA, RFA | Lagrange multiplier statistic: 0.693 p-value: 0.405 (p > 0.05) |
p-value: 5.36e-18 (p < 0.05) | REL: 1.000 |
Disclaimer/Publisher’s Note: The statements, opinions and data contained in all publications are solely those of the individual author(s) and contributor(s) and not of MDPI and/or the editor(s). MDPI and/or the editor(s) disclaim responsibility for any injury to people or property resulting from any ideas, methods, instructions or products referred to in the content. |
© 2025 by the authors. Licensee MDPI, Basel, Switzerland. This article is an open access article distributed under the terms and conditions of the Creative Commons Attribution (CC BY) license (http://creativecommons.org/licenses/by/4.0/).
Copyright: This open access article is published under a Creative Commons CC BY 4.0 license, which permit the free download, distribution, and reuse, provided that the author and preprint are cited in any reuse.


