Submitted:
09 April 2025
Posted:
09 April 2025
You are already at the latest version
Abstract
This article explores the implementation of data fusion architectures in IoT systems for precipitation forecasting. IoT networks enable the collection of large volumes of real-time environmental data, which, when combined through data fusion techniques, provide a cohesive and comprehensive dataset for analysis. Using MongoDB as a storage and processing platform, a temporal fusion approach was implemented to analyze seasonal trends and recurring patterns in environmental data.
The study highlights the challenges of integrating heterogeneous data, including the presence of outliers, and proposes solutions based on advanced data analysis and machine learning techniques. Data preprocessing techniques, such as outlier detection and normalization, were applied to enhance data quality before fusion.
Results demonstrate that temporal fusion, combined with machine learning, significantly improves the accuracy and efficiency of precipitation forecasting systems. Key techniques such as Random Forest were employed, and performance was evaluated using metrics like MAE, MSE, R², and Cross-Validation MAE (CV\_MAE). The findings indicate that temporal fusion, especially when combined with exponential smoothing, surpasses other methods, providing a robust approach to precipitation forecasting.
Keywords:
IoT
; data fusion
; precipitation forecasting
; MongoDB
; sensor networks
; data analysis
; environmental monitoring
1. Introduction
The Internet of Things (IoT) has emerged as a transformative technology across various domains, particularly in environmental monitoring and precipitation forecasting. By integrating distributed sensors that measure key environmental variables—such as temperature, humidity, atmospheric pressure, and precipitation—IoT systems enable the creation of more accurate and reliable forecasting models [1,2,3]. However, the data collected from these sensors are often heterogeneous, varying in format, sampling frequency, and units of measurement. This heterogeneity poses significant challenges for data integration, making data fusion a critical component in ensuring the cohesion and quality of the information [1,4].
Another challenge in data processing is handling outliers—anomalous values that deviate significantly from expected patterns. Outliers can arise due to sensor malfunctions, transmission errors, or extreme weather events. If not properly addressed, these anomalies can distort the analysis and lead to inaccurate predictions. In this study, outliers were identified using statistical methods and removed or corrected based on historical data trends to improve model reliability.
This article explores the implementation of a temporal fusion architecture, leveraging MongoDB as a storage and processing platform to handle large volumes of unstructured data. Temporal fusion combines information over time to identify seasonal patterns and trends, which are crucial for accurate precipitation forecasting [2,5]. The article addresses the challenges of integrating heterogeneous data and proposes solutions based on advanced data analysis and machine learning techniques.
Specifically, the Random Forest algorithm is employed for precipitation forecasting, and the performance of the temporal fusion approach is evaluated using metrics such as Mean Absolute Error (MAE), Mean Squared Error (MSE), the Coefficient of Determination (R2), and Cross-Validation MAE (CV_MAE). The validation was conducted using k-fold cross-validation to ensure model robustness. Notably, the inclusion of CV_MAE provides deeper insights into the model’s generalization capability, ensuring its reliability across different data splits.
The results demonstrate that temporal fusion, when combined with machine learning, significantly enhances the accuracy and efficiency of precipitation forecasting systems. By focusing on temporal patterns, this study provides insights into the most effective strategies for integrating IoT data, ultimately contributing to the development of robust early warning systems for extreme weather events [1,2,6].
2. Related Work
The integration of IoT and machine learning for environmental monitoring and precipitation forecasting has been extensively explored in recent years. Various studies have proposed different data fusion techniques and predictive models to enhance precipitation forecasting accuracy.
One common approach involves the use of distributed sensor networks to collect meteorological data from multiple sources. [1] proposed a distributed data fusion framework that integrates heterogeneous environmental data for improved forecasting. Their study highlighted the importance of sensor calibration and real-time data preprocessing in improving prediction reliability. Similarly, [2] highlighted the role of scalable big data platforms in managing large volumes of unstructured environmental data, demonstrating the effectiveness of NoSQL databases like MongoDB for real-time analytics.
Several works have explored different fusion strategies to integrate environmental data. The spatiotemporal data fusion approach proposed by [3] leverages IoT-based big data analytics for improved data integration and analysis. [4] introduced an improved support degree function for data fusion in wireless sensor networks applied to aquaculture, demonstrating how optimized fusion methods can enhance decision-making in environmental applications. [7] explored streaming data fusion techniques for IoT applications, emphasizing real-time data processing for high-frequency environmental monitoring.
Regarding machine learning techniques, the application of time series models such as ARIMA, SARIMA, and Prophet has been widely investigated. ARIMA models, combined with exponential smoothing techniques, have been particularly effective in capturing recent trends while maintaining long-term dependencies [2]. Prophet, despite being robust for handling seasonality and external variables, has shown limitations in scenarios involving rapid environmental changes, as highlighted in previous studies. Additionally, deep learning models have gained attention for their ability to model complex temporal dependencies [2].
Other studies have evaluated different implementations of ARIMA and SARIMA models. [2] investigated the performance of ARIMA and SARIMA from the sktime library, demonstrating their effectiveness in capturing temporal dependencies in meteorological data. Similarly, ARIMA and SARIMA models implemented using statsmodels were analyzed by [2], reinforcing the importance of selecting appropriate libraries and parameter tuning for optimal forecasting performance.
Recent advancements in edge and fog computing have also been incorporated into data fusion architectures. [5] demonstrated how fog-based data fusion can enhance the processing efficiency of heterogeneous IoT sensor networks. Similarly, [6] proposed real-time data management techniques for IoT applications in cloud environments, addressing challenges related to scalability and latency.
Compared to previous studies, this research stands out by implementing a temporal fusion architecture that utilizes MongoDB for scalable data storage and applies machine learning techniques specifically tailored to time-sensitive environmental data. The results underscore the importance of selecting appropriate fusion strategies and predictive models, contributing to the development of more accurate and reliable early warning systems for extreme weather events.
By addressing the limitations of hierarchical fusion and emphasizing the advantages of temporal fusion, this study advances the field of IoT-based precipitation forecasting, providing a structured methodology for integrating heterogeneous sensor data and improving forecasting accuracy.
3. Materials and Methods
3.1. Data Collection
Data were collected from IoT networks composed of sensors distributed in strategic areas, measuring environmental variables such as temperature, humidity, atmospheric pressure, and precipitation. Additional sensors were installed to ensure comprehensive monitoring coverage. Furthermore, historical and real-time data were extracted from meteorological databases, such as the National Institute of Meteorology (INMET), which provides complementary information on regional weather conditions.
To ensure data integrity, each sensor was configured to transmit measurements at regular intervals. The sensors were calibrated according to the specific conditions of the monitored region, ensuring that the readings were accurate and relevant for the parameters required for precipitation forecasting. The goal was to obtain a holistic view of environmental conditions by combining data from multiple variables and sources.
Data collection was carried out using two main monitoring sources: the Automatic Weather Station A711 São Carlos, belonging to the National Institute of Meteorology (INMET), and the BME280 sensor module from Libelium, installed at the Department of Computer Science at UFSCar. Both sources provide essential data for continuous environmental monitoring and predictive analysis of precipitation patterns.
3.2. INMET and the A711 São Carlos Station
The National Institute of Meteorology (INMET) is a Brazilian institution with over a century of operation (since 1909), responsible for monitoring and forecasting weather and climate across the national territory. With a vast network of automatic weather stations, INMET provides fundamental data for various economic sectors, including agriculture, aviation, and water resource management. In this study, we used data from the A711 São Carlos Weather Station, located on the UFSCar campus in São Carlos, SP, at coordinates -21.980044361747296, -47.8836493105919.
The A711 Station performs automatic measurements of various climatic variables and is designed to operate continuously, transmitting collected data at regular intervals to INMET through radio and internet communication systems. This data are essential for local climate analysis, contributing to the creation of predictive models for precipitation forecasting.
Features of the A711 São Carlos Station:
- Monitored Parameters: The A711 Station automatically measures air temperature, relative humidity, precipitation, wind speed and direction, atmospheric pressure, and solar radiation, providing a comprehensive view of local weather conditions.
-
Equipment Used: The station is equipped with high-precision sensors, including:
- -
- Digital Thermometer: Measures air temperature with high precision, essential for analyzing thermal variations that may influence precipitation formation.
- -
- Hygrometer: Captures relative humidity, a critical variable for precipitation forecasting and storm cloud formation.
- -
- Rain Gauge: Collects and quantifies precipitation, a key data point for analyzing rainfall trends.
- -
- Anemometer: Measures wind speed, aiding in storm prediction and identifying high-pressure areas.
- -
- Barometer: Measures atmospheric pressure, a crucial parameter for detecting changes in atmospheric conditions.
- -
- Pyranometer: Measures solar radiation, relevant for climate studies and evaporation analysis.
- Transmission Technology: The A711 Station transmits data automatically to INMET using radio and internet communication, enabling frequent and precise updates, essential for real-time analysis.
The accuracy and continuity of data from the A711 Station are crucial for local forecasts, climate studies, and water resource management in the São Carlos region, providing a reliable database for advanced studies on precipitation monitoring and forecasting.
3.3. Libelium and the BME280 Module
The second data source is the BME280 sensor from Libelium, located at the Department of Computer Science at UFSCar, at coordinates -21.979644891152883, -47.88039120647499. Founded in 2006, Libelium is a Spanish company specializing in the development of sensors and platforms for the Internet of Things (IoT). Among its most notable products is the BME280, a compact and efficient digital sensor widely used in environmental monitoring applications due to its high precision and low energy consumption.
The BME280 was developed by Bosch Sensortec and is known for its versatility and ease of integration into IoT systems, making it suitable for real-time environmental monitoring.
Technical Details of the BME280 Module:
-
Measurements: The BME280 sensor measures temperature, relative humidity, and atmospheric pressure, with advanced specifications:
- -
- Temperature: Measures temperatures in the range of -40°C to 85°C, with an accuracy of ±1°C.
- -
- Humidity: Captures relative humidity between 0% and 100%, with an accuracy of ±3%, essential for analyzing weather conditions and identifying precipitation patterns.
- -
- Pressure: Measures atmospheric pressure from 300 hPa to 1100 hPa, with an accuracy of ±1 hPa, important for predicting climate variations and atmospheric patterns.
- Communication Interface: The sensor uses I2C and SPI interfaces, facilitating integration with microcontrollers and other IoT systems.
- Energy Consumption: The BME280 is highly efficient, consuming only 3.6 µA in continuous measurement mode and 0.1 µA in sleep mode. This efficiency makes it ideal for devices operating in remote environments with long-term monitoring needs.
- Dimensions: The module is extremely compact, measuring 2.5 x 2.5 x 0.93 mm, making it easy to incorporate into portable devices and low-power systems.
Due to its technical characteristics and measurement precision, the BME280 is an excellent choice for real-time environmental monitoring. In the context of this study, the data provided by the BME280 complement the data from the INMET A711 Station, creating an integrated sensor network that provides a comprehensive view of local environmental conditions. This information is essential for data fusion, offering a solid foundation for predictive analysis of precipitation.
The integration of data from these two complementary sources enables broad and precise coverage of the monitored environmental variables, facilitating the creation of predictive models and the detection of seasonal patterns that can anticipate precipitation events.
3.4. Storage Platform: MongoDB
MongoDB was chosen as the storage platform due to its ability to handle large volumes of unstructured data and its flexibility in modeling data in different formats. The nature of IoT data, often composed of temporal, spatial, and heterogeneous information, makes the use of traditional databases less efficient. In MongoDB, data were stored in collections with JSON documents reflecting the different variables monitored by the sensors, such as temperature, humidity, pressure, and precipitation.
The storage structure was organized to facilitate quick and specific queries. Temporal and spatial indexes were created, allowing data retrieval based on time and location parameters, essential for temporal fusion. MongoDB’s aggregation operations were leveraged to perform data preprocessing, such as unit normalization and removal of duplicates or inconsistencies, before conducting more detailed analyses.
3.5. Data Fusion Methods
3.5.1. Temporal Fusion
Temporal fusion was applied to combine data over time, enabling the analysis of seasonal trends and recurring events. This approach was fundamental for identifying patterns that indicate the likelihood of precipitation events, such as heavy rainfall during wet seasons or other relevant meteorological conditions.
In MongoDB, data were organized by timestamp, allowing the fusion of records from different sensors over a specific time period. This enabled the creation of a historical record of environmental conditions that aided in detecting gradual changes and seasonal anomalies. Temporal fusion allowed trends over time, such as increases in precipitation during rainy seasons, to be identified in advance, improving the predictive capability of the system.
Temporal fusion applies time series techniques to model data that varies over time, capturing seasonal patterns, trends, and fluctuations. This technique is useful for applications requiring the identification of recurring patterns and anticipation of changes, such as precipitation forecasting. Temporal fusion enables the identification of changes and trends in time series data, facilitating monitoring and projection of future events.
3.5.2. Exponential Smoothing Functionality
Exponential Smoothing is a technique that assigns decreasing weights to data as they move further back in time, prioritizing more recent observations for future projections. Smoothing is controlled by a smoothing parameter (), where high values of give greater weight to recent data, and low values provide broader smoothing, considering older data. Smoothing can be simple (for mean only), double (mean and trend), or triple (mean, trend, and seasonality), allowing the capture of complex variations in time series.
3.5.3. Algorithms Used in Temporal Fusion
ARIMA with Exponential Smoothing (Sktime)
Explanation: The ARIMA (AutoRegressive Integrated Moving Average) model uses autoregressive, differential, and moving average terms to model time series, while exponential smoothing highlights more recent data, adjusting the model to reflect rapid changes.
Functioning:
- Modeling with ARIMA: The model identifies AR (autoregressive), I (integration), and MA (moving average) components in the time series.
- Application of Smoothing: Exponential smoothing is applied to adjust the weight of more recent observations.
- Forecasting: The final model, combining ARIMA and smoothing, is used to predict future values, balancing long-term trends with recent fluctuations.
SARIMA with Exponential Smoothing (Sktime)
Explanation: SARIMA is an extension of ARIMA that adds seasonal components to the model, making it ideal for data with cyclical patterns. Exponential smoothing adjusts the weights of recent data, allowing for more precise adaptation to seasonal changes.
Functioning:
- Identification of Seasonal Components: The model includes seasonal autoregressive, differential, and moving average terms to capture repetitive patterns.
- Smoothing of Recent Data: Exponential smoothing is applied to adjust the weight of more recent seasonal data.
- Forecasting: The combination of SARIMA and smoothing generates forecasts that capture seasonal trends.
Prophet
Explanation: Developed by Facebook, Prophet is a robust time series model that incorporates long-term trends and seasonality while also allowing the inclusion of external events, such as holidays.
Functioning:
- Modeling of Trends and Seasonality: Terms for long-term trends and seasonal patterns are adjusted.
- Incorporation of Specific Events: External events are included, increasing accuracy in cases with holiday effects or specific dates.
- Forecasting: Generates projections adjusted for seasonality and events.
Time Series K-Means (Tslearn)
Explanation: The Time Series K-Means (TSKMeans) algorithm, implemented in the tslearn library, is an adaptation of the traditional K-Means clustering method for time series data. Unlike standard K-Means, which operates on static feature vectors, TSKMeans considers the temporal structure of the data, making it well-suited for grouping similar precipitation patterns.
Functioning:
- Feature Extraction: The algorithm converts time series data into feature representations using distance metrics such as Dynamic Time Warping (DTW) or Euclidean distance.
- Clustering Process: The data points are iteratively assigned to clusters based on similarity measures, minimizing intra-cluster variance.
- Pattern Identification: The final clusters reveal distinct precipitation trends, which can be further analyzed for forecasting insights.
3.6. Data Analysis
With the fused data, it was possible to apply machine learning techniques to identify environmental patterns and predict precipitation events. Time series analysis techniques were applied to monitor seasonal trends and predict events based on historical patterns. These methods helped forecast the occurrence of precipitation, providing early warnings based on observed climatic variations over time.
3.7. Prediction Method: Random Forest
For precipitation forecasting, the Random Forest algorithm was employed. Random Forest is an ensemble learning method that constructs multiple decision trees during training and outputs the average prediction of the individual trees (for regression tasks). This approach reduces overfitting and improves generalization, making it suitable for handling the complex and heterogeneous data collected from IoT sensors.
3.8. Performance Metrics
The performance of the temporal fusion methods and the Random Forest algorithm was evaluated using the following metrics:
- Mean Absolute Error (MAE): Measures the average absolute difference between predicted and actual values. Lower MAE values indicate better model performance.
- Mean Squared Error (MSE): Measures the average squared difference between predicted and actual values. MSE penalizes larger errors more heavily, making it sensitive to outliers.
- Coefficient of Determination (R2): Indicates the proportion of variance in the dependent variable that is predictable from the independent variables. An R2 value close to 1 indicates a model that explains a large portion of the variance.
- Cross-Validation MAE (CV_MAE): Measures MAE across multiple validation folds, providing a more reliable estimate of the model’s generalization capability and robustness against overfitting.
4. Results
This section presents the outcomes of the temporal fusion approach, as well as the performance of the Random Forest algorithm in precipitation forecasting. The results are evaluated using metrics such as Mean Absolute Error (MAE), Mean Squared Error (MSE), the Coefficient of Determination (R2), and the Cross-Validation MAE (CV_MAE), providing a comprehensive analysis of the effectiveness of the temporal fusion method [1,7].
4.1. Temporal Fusion
The application of temporal fusion allowed the identification of seasonal precipitation patterns and the prediction of rainfall intensity based on historical trends. By comparing historical data with real-time measurements, it was possible to issue early warnings about increased precipitation in at-risk areas, providing sufficient time for preventive actions, such as evacuation or flood preparations [7]. Temporal fusion was essential for detecting increases in rainfall during critical periods, such as the rainy season, improving forecasting capabilities.
Figure 1a, Figure 1b, Figure 2a, and Figure 2b present a detailed performance comparison of the Prophet, ARIMA with Exponential Smoothing (from the sktime library), and INMET models across four key evaluation metrics: Mean Absolute Error (MAE), Mean Squared Error (MSE), Coefficient of Determination (R2), and Cross-Validation MAE (CV_MAE). These bar charts highlight the superior performance of ARIMA with Exponential Smoothing in terms of accuracy, consistency, and generalization capability.
While Prophet achieved lower MAE and MSE values compared to ARIMA with Exponential Smoothing, its performance was still inferior to INMET, which does not employ any data fusion strategy. Furthermore, the R2 score of Prophet was significantly lower, indicating poor explanatory power [1]. Additionally, the CV_MAE results further highlighted the limitations of Prophet, as it exhibited inconsistent performance across multiple validation folds, increasing the risk of overfitting in certain scenarios. This disparity underscores the importance of selecting appropriate algorithms for specific forecasting tasks.
These visualizations provide a comprehensive analysis of the strengths and limitations of each model. The ARIMA with Exponential Smoothing consistently outperformed Prophet and INMET across all metrics, demonstrating its effectiveness in capturing recent trends, seasonal patterns, and long-term dependencies. This highlights the importance of leveraging advanced time series techniques for accurate precipitation forecasting.
4.2. Best Results for Temporal Fusion
The best results for temporal fusion are summarized in Figure 3, Figure 4, and Figure 5, which show the top-performing configurations across the three evaluation metrics. The results demonstrate that fusao_temp_arima_es_sktime outperformed all other methods, highlighting the effectiveness of combining ARIMA with exponential smoothing for precipitation forecasting [7]. The application of exponential smoothing significantly improved the model’s ability to capture recent trends, resulting in more accurate predictions.
Figure 6 evaluates the model’s generalization capacity using CV_MAE. Lower values of CV_MAE indicate consistent predictive performance across different validation folds, reducing the risk of overfitting. This further reinforces the robustness of the ARIMA with exponential smoothing approach.
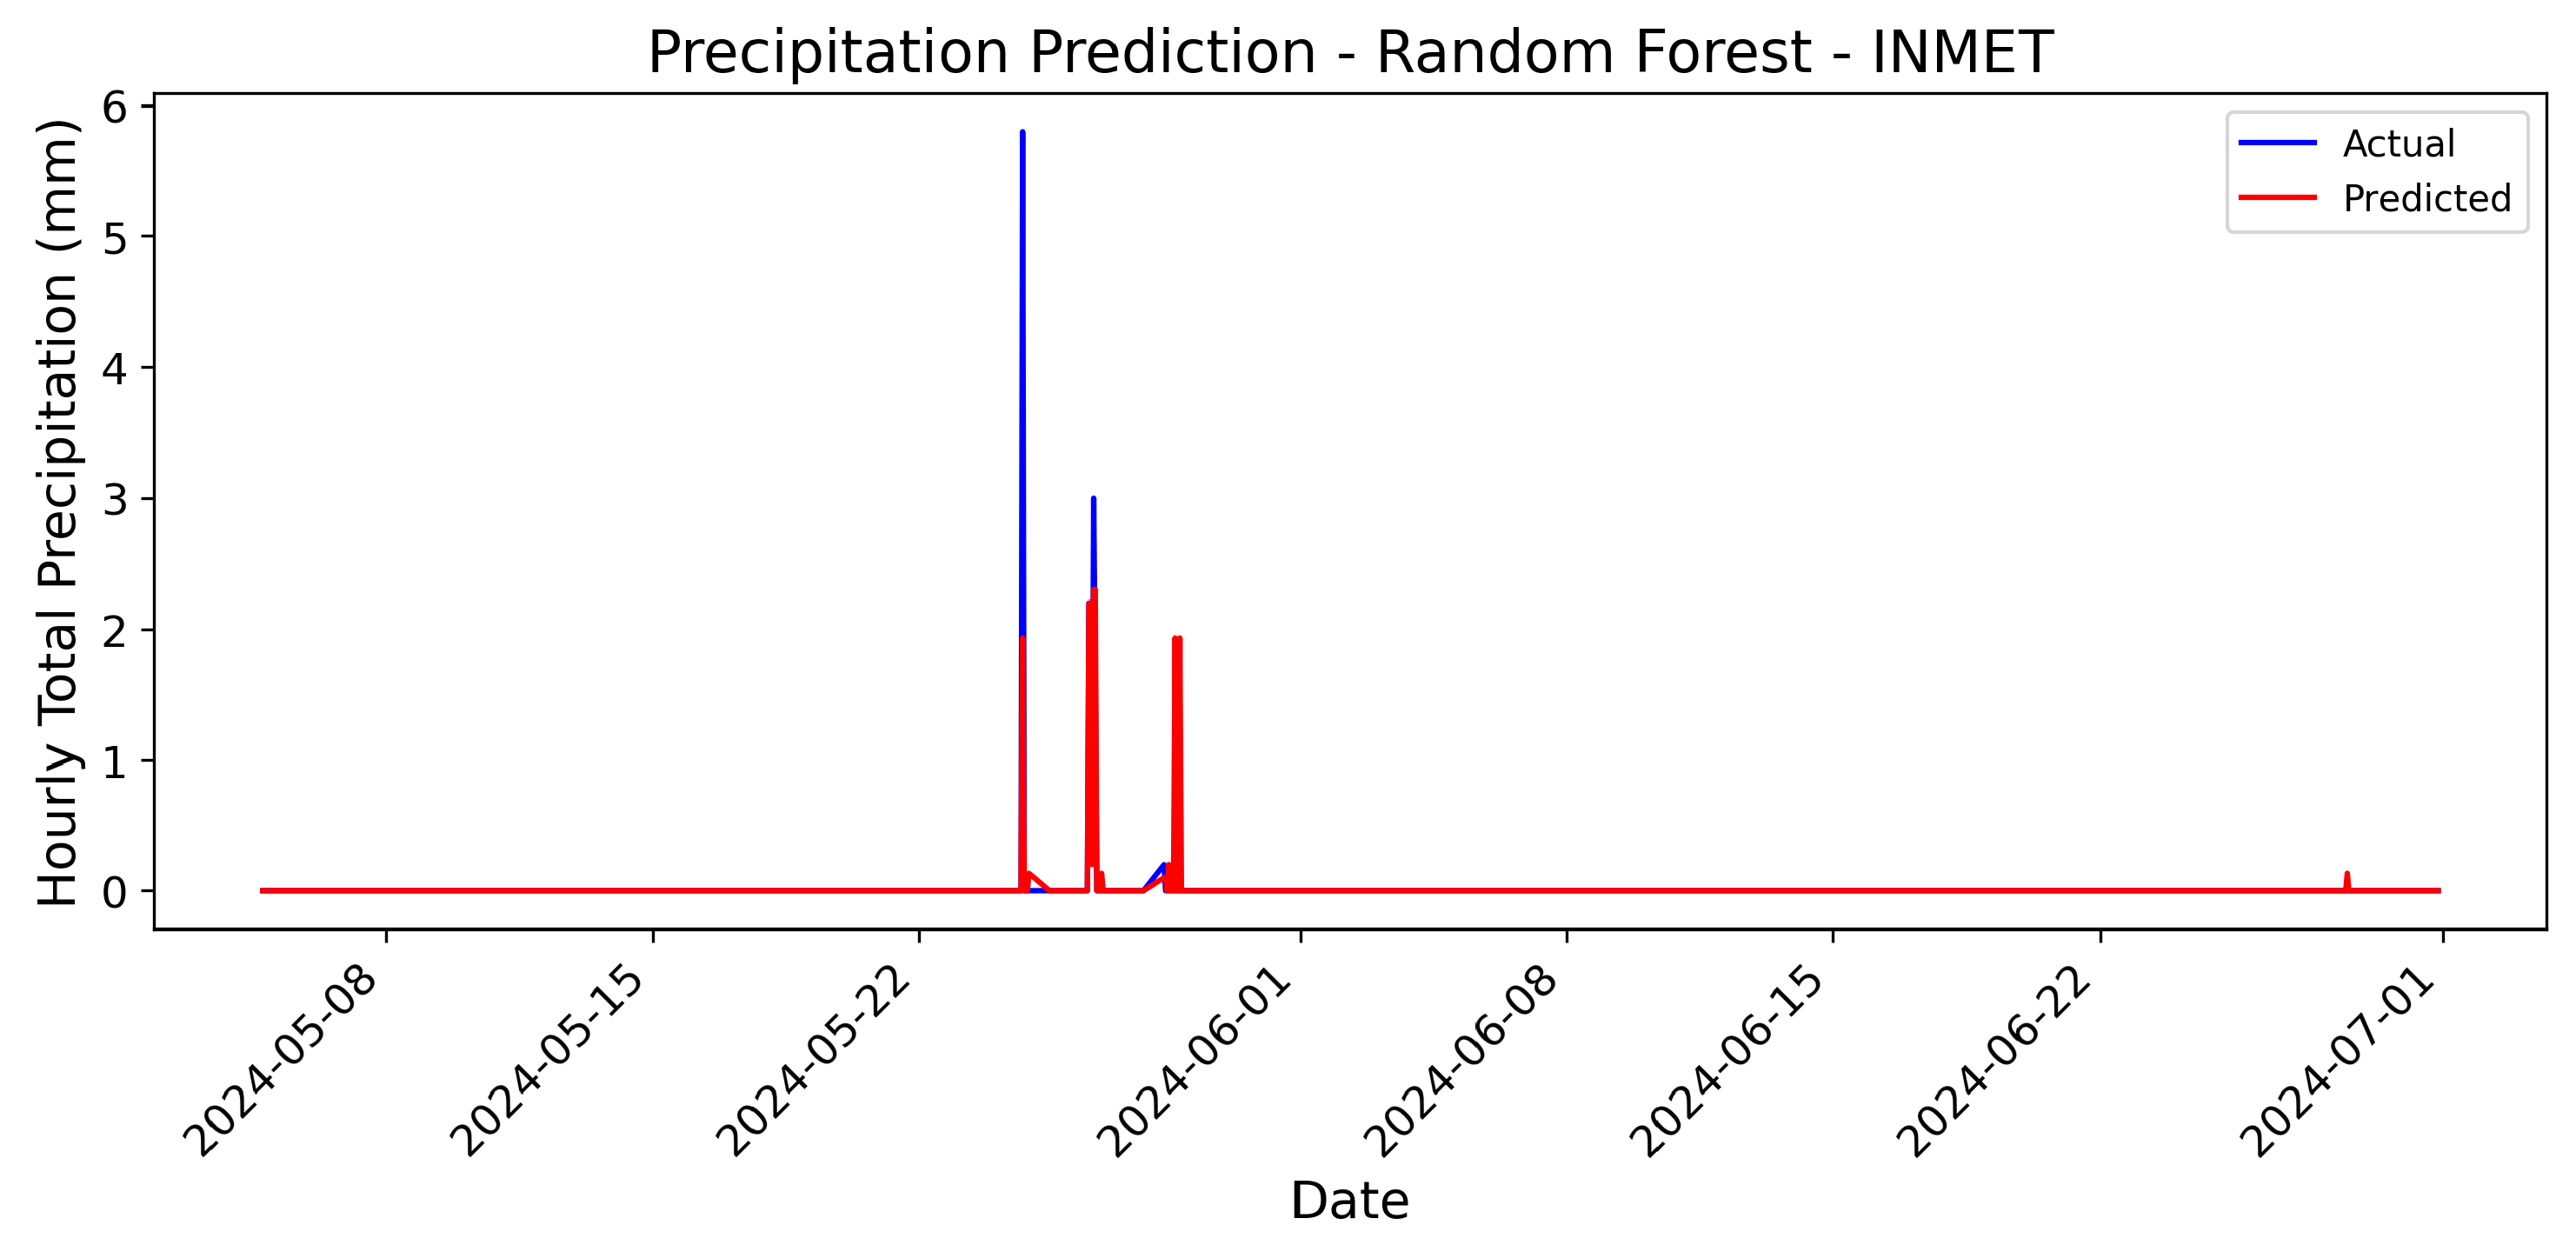
4.3. Model Forecast Comparisons
To further illustrate the predictive capabilities of the models, Figure 7 and Figure 8 present bar charts comparing the precipitation forecasts generated by ARIMA with Exponential Smoothing and Prophet. These visualizations highlight the differences in trend capture and predictive accuracy between the models. The forecasts are based on a time range from 2024-02-14 to 2024-09-02, and both models were applied to normalized data.
Notably, in Figure 7, the real and estimated precipitation values are completely overlapped. This overlap demonstrates the high precision of the ARIMA with Exponential Smoothing model and confirms that there are no graphical errors in the presentation of the results. Such alignment underscores the model’s ability to accurately capture the underlying patterns in the data.
The scale of the forecasts reveals significant differences in the behavior of the two models. Prophet exhibits a much wider range of predicted values, varying from to . This large variation indicates that Prophet tends to overestimate precipitation levels and deviate significantly from the normalized real data. Such behavior is consistent with the model’s tendency to produce larger errors, especially when dealing with normalized datasets. On the other hand, ARIMA with Exponential Smoothing demonstrates a much narrower range, varying from to . This close alignment with the actual normalized data underscores the higher precision of ARIMA in capturing trends and minimizing prediction errors.
It is important to note that the presence of negative values in the forecasts is a result of the normalization process applied to the dataset. Normalization scales the data to a standard range, often introducing negative values when the original data has low variability or when the mean is shifted during preprocessing. Despite this, the normalized scale allows for a fair comparison between the models. The narrow range of ARIMA’s predictions suggests that it is better suited for scenarios where small deviations from the mean are critical, while Prophet’s broader range may be more appropriate for exploratory analyses where extreme values are of interest.
The differences in scale between the two models are not speculative but rather a direct consequence of their methodologies and how they handle normalized data. ARIMA, being a statistical model, relies heavily on the temporal structure of the data and assumes stationarity after transformations such as differencing or normalization. This makes it particularly effective for short-term forecasts with stable patterns. In contrast, Prophet’s flexibility in handling seasonality and outliers can lead to exaggerated predictions when applied to normalized data with limited variability. This behavior is not a flaw in Prophet itself but rather a limitation when using it with preprocessed datasets that suppress the natural variability of the original data.
Given Prophet’s tendency to produce abrupt variations, it is worth considering whether this model is best suited for use with raw, unprocessed data. For instance, when working with precipitation data from the Brazilian National Institute of Meteorology (INMET), which provides high-quality raw measurements, Prophet may perform more reliably without the need for fusion or normalization. Figure 9 presents the forecast generated by Prophet using raw INMET data. Notably, the scale of this forecast is significantly different from the previous models, ranging from 0 to 6, as no normalization was applied. This highlights the importance of understanding the impact of preprocessing techniques on model performance. When using raw data, Prophet’s ability to capture seasonality and variability is better leveraged, resulting in forecasts that align more closely with real-world observations.
In summary, while both ARIMA and Prophet provide valuable insights into precipitation forecasting, their performance varies significantly depending on the preprocessing applied to the data. ARIMA with Exponential Smoothing emerges as the superior choice for normalized datasets, given its ability to closely follow the data with minimal deviation. In contrast, Prophet, despite its flexibility, does not achieve comparable accuracy to ARIMA in contexts similar to this study, even after extensive parameter tuning during experimentation. However, when working with raw INMET data, Prophet’s strengths in capturing seasonality and variability may be better leveraged, provided that the data remains unaltered by fusion or normalization processes.
The bar chart analysis reinforces that ARIMA with Exponential Smoothing captures short-term fluctuations more effectively than Prophet, which struggles to adapt to sudden variations in precipitation patterns. Prophet’s forecasts tend to be smoother and less responsive to abrupt changes, making it less suitable for precipitation forecasting, where capturing rapid shifts is crucial. This further supports the conclusion that Prophet is less suited for this forecasting task, while ARIMA with Exponential Smoothing demonstrates superior accuracy in short-term precipitation prediction.
4.4. Summary of Results
In summary, the results demonstrate that the temporal fusion approach, particularly when combined with the fusao_temp_arima_es_sktime algorithm, significantly outperformed other methods across all evaluation metrics (MAE, MSE, and R²). This highlights the effectiveness of combining advanced time series techniques for accurate precipitation forecasting [1].
Key Findings:
- Superior Performance of ARIMA with Exponential Smoothing: The ARIMA with exponential smoothing algorithm achieved the best results, with the lowest MAE and MSE values and the highest R² score, indicating high predictive accuracy.
- Importance of Temporal Patterns: Temporal fusion effectively captured seasonal trends and recurring patterns, essential for reliable precipitation forecasting [7].
- Algorithm Selection Matters: While Prophet achieved competitive MAE and MSE values, its lower R² score highlighted limitations in explaining variance in certain scenarios. This underscores the importance of selecting appropriate models for specific forecasting tasks.
These findings indicate that temporal fusion, when combined with machine learning, is particularly well-suited for predicting climate changes, especially in the context of precipitation forecasting. Temporal fusion allows for the integration of data over time, capturing seasonal patterns and recurring trends that are crucial for accurate climate predictions.
Additionally, the inclusion of Cross-Validation MAE (CV_MAE) provided deeper insights into the generalization capability of the models. While MAE and MSE evaluate prediction accuracy on a test set, CV_MAE assesses performance across multiple data splits, reducing the risk of overfitting. Lower CV_MAE values indicate more stable and reliable models, further justifying the choice of ARIMA with exponential smoothing as the most effective approach for this application.
By leveraging scalable platforms like MongoDB and advanced analytical techniques, it is possible to create robust early warning systems that support decision-making in various sectors, such as agriculture, water resource management, and disaster preparedness. These findings underscore the importance of selecting appropriate fusion methods and predictive models to enhance the accuracy and reliability of precipitation forecasting systems.
5. Discussion
The data fusion methods and machine learning techniques applied in this study were crucial for improving the accuracy and efficiency of early warning systems for precipitation forecasting. Temporal fusion enabled the integration of heterogeneous data from IoT sensors, creating a cohesive and comprehensive dataset that captures seasonal trends and recurring patterns [1,3,7]. Although the heterogeneity of the data presented initial challenges, normalization and the use of flexible platforms like MongoDB allowed these obstacles to be overcome, resulting in a more robust monitoring system [5,7].
Although hierarchical fusion was initially considered a potential approach for integrating data from geographically distributed sensors, it did not significantly improve precipitation forecasting accuracy [1]. The aggregation of data from different regions, while useful for providing a broad view of environmental conditions, did not capture the fine-grained temporal patterns necessary for precise predictions. In contrast, temporal fusion proved to be far more effective, as it allowed the identification of seasonal trends and recurring patterns that are critical for accurate precipitation forecasting. This highlights the importance of focusing on temporal dynamics when dealing with time-sensitive environmental data.
The results demonstrated that temporal fusion, particularly when combined with advanced time series techniques like ARIMA and exponential smoothing, significantly improved the accuracy of precipitation forecasting [2,7]. The ability to prioritize recent observations while maintaining long-term trends was a key factor in enhancing the model’s predictive capabilities. This approach not only improved the accuracy of forecasts but also enabled the issuance of more timely and accurate alerts about the risk of weather events, such as heavy rainfall and flooding.
A key observation in this study was the poor performance of Prophet compared to ARIMA with Exponential Smoothing. Prophet struggled to adapt to abrupt changes in precipitation patterns, which are common in highly dynamic weather conditions. Its lower R2 score indicates that it had difficulty capturing variance in the data, making it less reliable for precipitation forecasting [1,4]. In contrast, ARIMA with Exponential Smoothing effectively balanced short-term fluctuations with long-term trends, leading to superior predictive performance across all evaluation metrics. This reinforces the importance of choosing forecasting models that can handle the inherent variability of precipitation data.
Furthermore, the addition of Cross-Validation Mean Absolute Error (CV_MAE) provided deeper insights into model generalization. While MAE and MSE evaluate prediction accuracy on a test set, CV_MAE assesses how well a model performs across different data splits, reducing the risk of overfitting. Lower CV_MAE values indicate more stable and reliable models, further justifying the choice of ARIMA with Exponential Smoothing as the most suitable approach for this scenario.
In conclusion, this study’s findings highlight the potential of temporal fusion and machine learning in improving precipitation forecasting. By combining scalable platforms like MongoDB with advanced analytical techniques, it is possible to create robust early warning systems that can mitigate the impacts of weather events and support decision-making in various sectors, such as agriculture, water resource management, and disaster preparedness [3,7]. Additionally, the results indicate that Prophet is not well-suited for precipitation forecasting, and models like ARIMA with Exponential Smoothing should be prioritized for such applications.
6. Conclusions
This study demonstrated that IoT data fusion, combined with machine learning techniques and scalable platforms like MongoDB, significantly enhances precipitation forecasting accuracy [1,3,7]. The study focused on temporal fusion, which integrates data over time to identify seasonal trends and recurring patterns, providing a robust foundation for accurate weather predictions.
One of the challenges addressed in this study was the presence of outliers in the collected data. Outliers, which are anomalous values that deviate significantly from expected patterns, can arise due to sensor malfunctions, transmission errors, or weather events. If not properly handled, these anomalies can distort the analysis and lead to inaccurate predictions. To mitigate this issue, statistical methods were employed to detect and correct outliers based on historical data trends. This preprocessing step was crucial for improving the reliability of the models.
The performance of the forecasting models was evaluated using several metrics: Mean Absolute Error (MAE), Mean Squared Error (MSE), Coefficient of Determination (R2), and Cross-Validation MAE (CV_MAE). Each metric provides unique insights into model performance:
- MAE: Measures the average absolute difference between predicted and actual values. Lower values indicate better accuracy.
- MSE: Penalizes larger errors more heavily, making it sensitive to outliers. Lower MSE values suggest more consistent predictions.
- R2: Indicates the proportion of variance in the dependent variable explained by the model. Higher values signify better explanatory power.
- CV_MAE: Evaluates the model’s generalization capability by assessing its performance across multiple validation folds. Lower CV_MAE values indicate more reliable and robust predictions.
The results highlighted the superior performance of the fusao_temp_arima_es_sktime algorithm, which combines ARIMA with exponential smoothing. This method outperformed all other approaches across all evaluation metrics (MAE, MSE, R2, and CV_MAE), demonstrating its effectiveness in capturing recent trends and seasonal patterns [2,7]. The application of exponential smoothing proved to be a key factor in enhancing the model’s accuracy, as it prioritized recent observations while maintaining long-term trends. This approach enabled the identification of seasonal patterns and the prediction of rainfall intensity, making it a highly suitable method for early warning systems.
Figures presenting the best results for each metric (Best MAE, Best MSE, Best R2, and Best CV_MAE) were included to highlight the top-performing configurations. These visualizations underscore the effectiveness of combining ARIMA with exponential smoothing for precipitation forecasting. Additionally, bar charts comparing the predictions made by ARIMA with Exponential Smoothing and Prophet were provided to illustrate the differences in trend capture and predictive accuracy between the models.
The study also underscored the importance of selecting the right algorithms for specific forecasting tasks. For instance, while Prophet achieved competitive MAE and MSE values, its R2 score was significantly lower, indicating limitations in explaining variance in certain scenarios [1]. This poor performance can be attributed to Prophet’s inability to adapt to sudden variations in precipitation patterns, as it tends to produce smoother forecasts that are less responsive to abrupt changes. In contrast, ARIMA with Exponential Smoothing demonstrated superior accuracy in capturing short-term fluctuations, making it more suitable for precipitation forecasting where rapid shifts are common. These findings empirically confirm that Prophet is not well-suited for this type of task.
Future research may explore integrating new machine learning techniques, such as deep learning models, to further enhance these systems’ predictive capabilities [2]. Additionally, the use of more advanced data normalization and preprocessing techniques may improve the integration of heterogeneous data, leading to even more accurate and reliable forecasts [7]. The combination of temporal fusion with other data integration approaches could also be investigated to leverage the strengths of multiple methods.
In conclusion, the findings of this study emphasize the potential of IoT data fusion and machine learning for improving precipitation forecasting. By combining scalable platforms like MongoDB with advanced analytical techniques, it is possible to create robust early warning systems that can mitigate the impacts of weather events and support decision-making in various sectors, such as agriculture, water resource management, and disaster preparedness [1,3].
References
- Akanbi, A.; Masinde, M. A Distributed Stream Processing Middleware Framework for Real-Time Analysis of Heterogeneous Data on Big Data Platform: Case of Environmental Monitoring. Sensors 2020, 20, 3166. [Google Scholar] [CrossRef] [PubMed]
- Roh, Y.; Heo, G.; Whang, S.E. A Survey on Data Collection for Machine Learning: A Big Data - AI Integration Perspective. IEEE Transactions on Knowledge and Data Engineering 2021, 33, 1328–1347. [Google Scholar] [CrossRef]
- Fawzy, D.; Moussa, S.; Badr, N. The Spatiotemporal Data Fusion (STDF) Approach: IoT-Based Data Fusion Using Big Data Analytics. Sensors 2021, 21. [Google Scholar] [CrossRef] [PubMed]
- Shi, P.; Li, G.; Yuan, Y.; Kuang, L. Data Fusion Using Improved Support Degree Function in Aquaculture Wireless Sensor Networks. Sensors 2018, 18. [Google Scholar] [CrossRef] [PubMed]
- Valente, F.J.; Morijo, J.P.; Vivaldini, K.C.T.; Trevelin, L.C. Fog-based data fusion for heterogeneous iot sensor networks: a real implementation. In Proceedings of the 2019 15th International Conference on Network and Service Management (CNSM). IEEE; 2019; pp. 1–5. [Google Scholar]
- Elbanoby, Y.; Aborizka, M.; Maghraby, F. Real-Time Data Management for IoT in Cloud Environment. In Proceedings of the 2019 IEEE Global Conference on Internet of Things (GCIoT); 2019; pp. 1–7. [Google Scholar] [CrossRef]
- Kenda, K.; Kažič, B.; Novak, E.; Mladenić, D. Streaming Data Fusion for the Internet of Things. Sensors 2019, 19. [Google Scholar] [CrossRef] [PubMed]
Figure 1.
Performance comparison of Prophet, ARIMA with Exponential Smoothing, and INMET across two evaluation metrics: MAE and MSE. Each subfigure highlights the differences in model performance for a specific metric.
Figure 1.
Performance comparison of Prophet, ARIMA with Exponential Smoothing, and INMET across two evaluation metrics: MAE and MSE. Each subfigure highlights the differences in model performance for a specific metric.
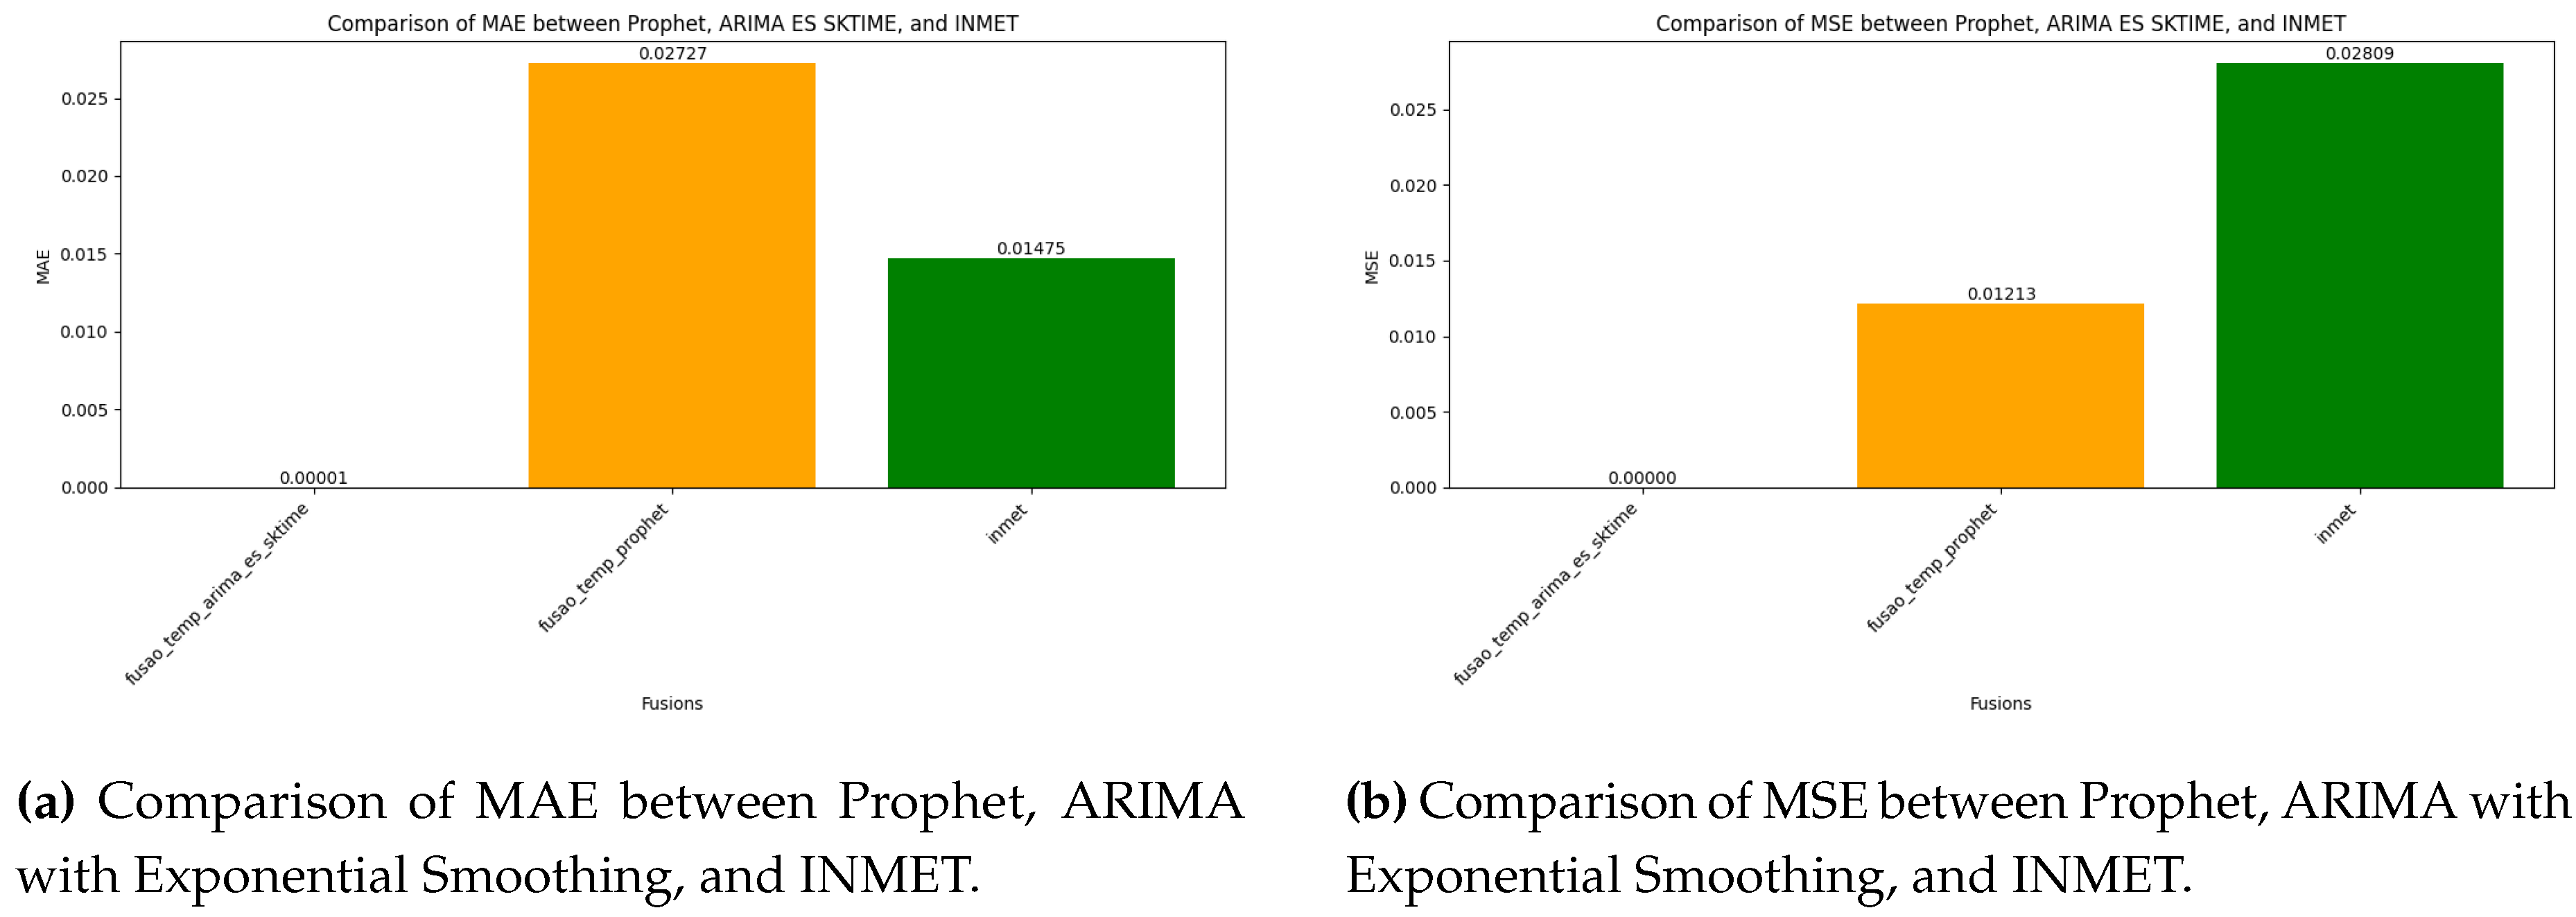
Figure 2.
Performance comparison of Prophet, ARIMA with Exponential Smoothing, and INMET across two evaluation metrics: R2 and CV_MAE. Each subfigure highlights the differences in model performance for a specific metric.
Figure 2.
Performance comparison of Prophet, ARIMA with Exponential Smoothing, and INMET across two evaluation metrics: R2 and CV_MAE. Each subfigure highlights the differences in model performance for a specific metric.
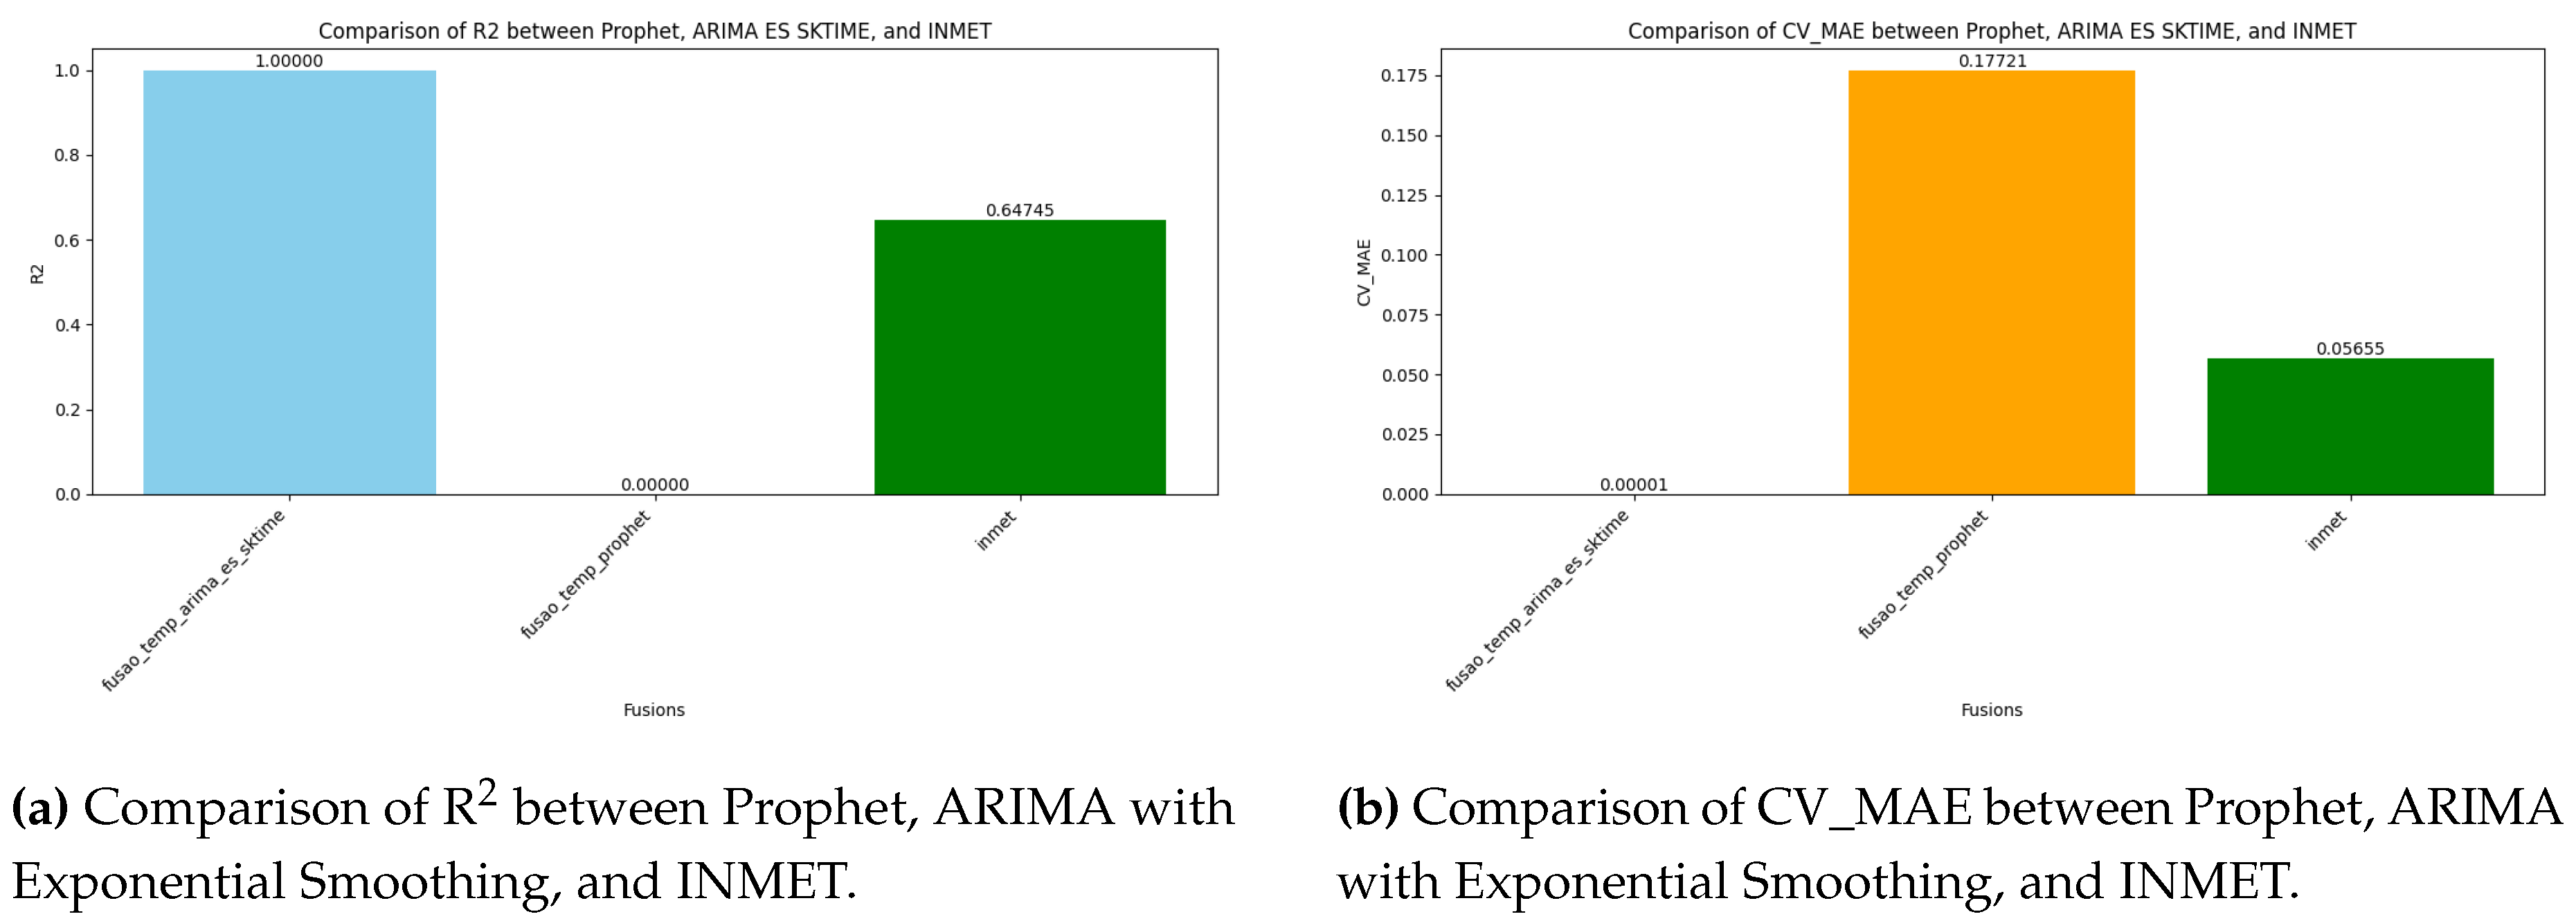
Figure 3.
Best results for temporal fusion based on MAE.
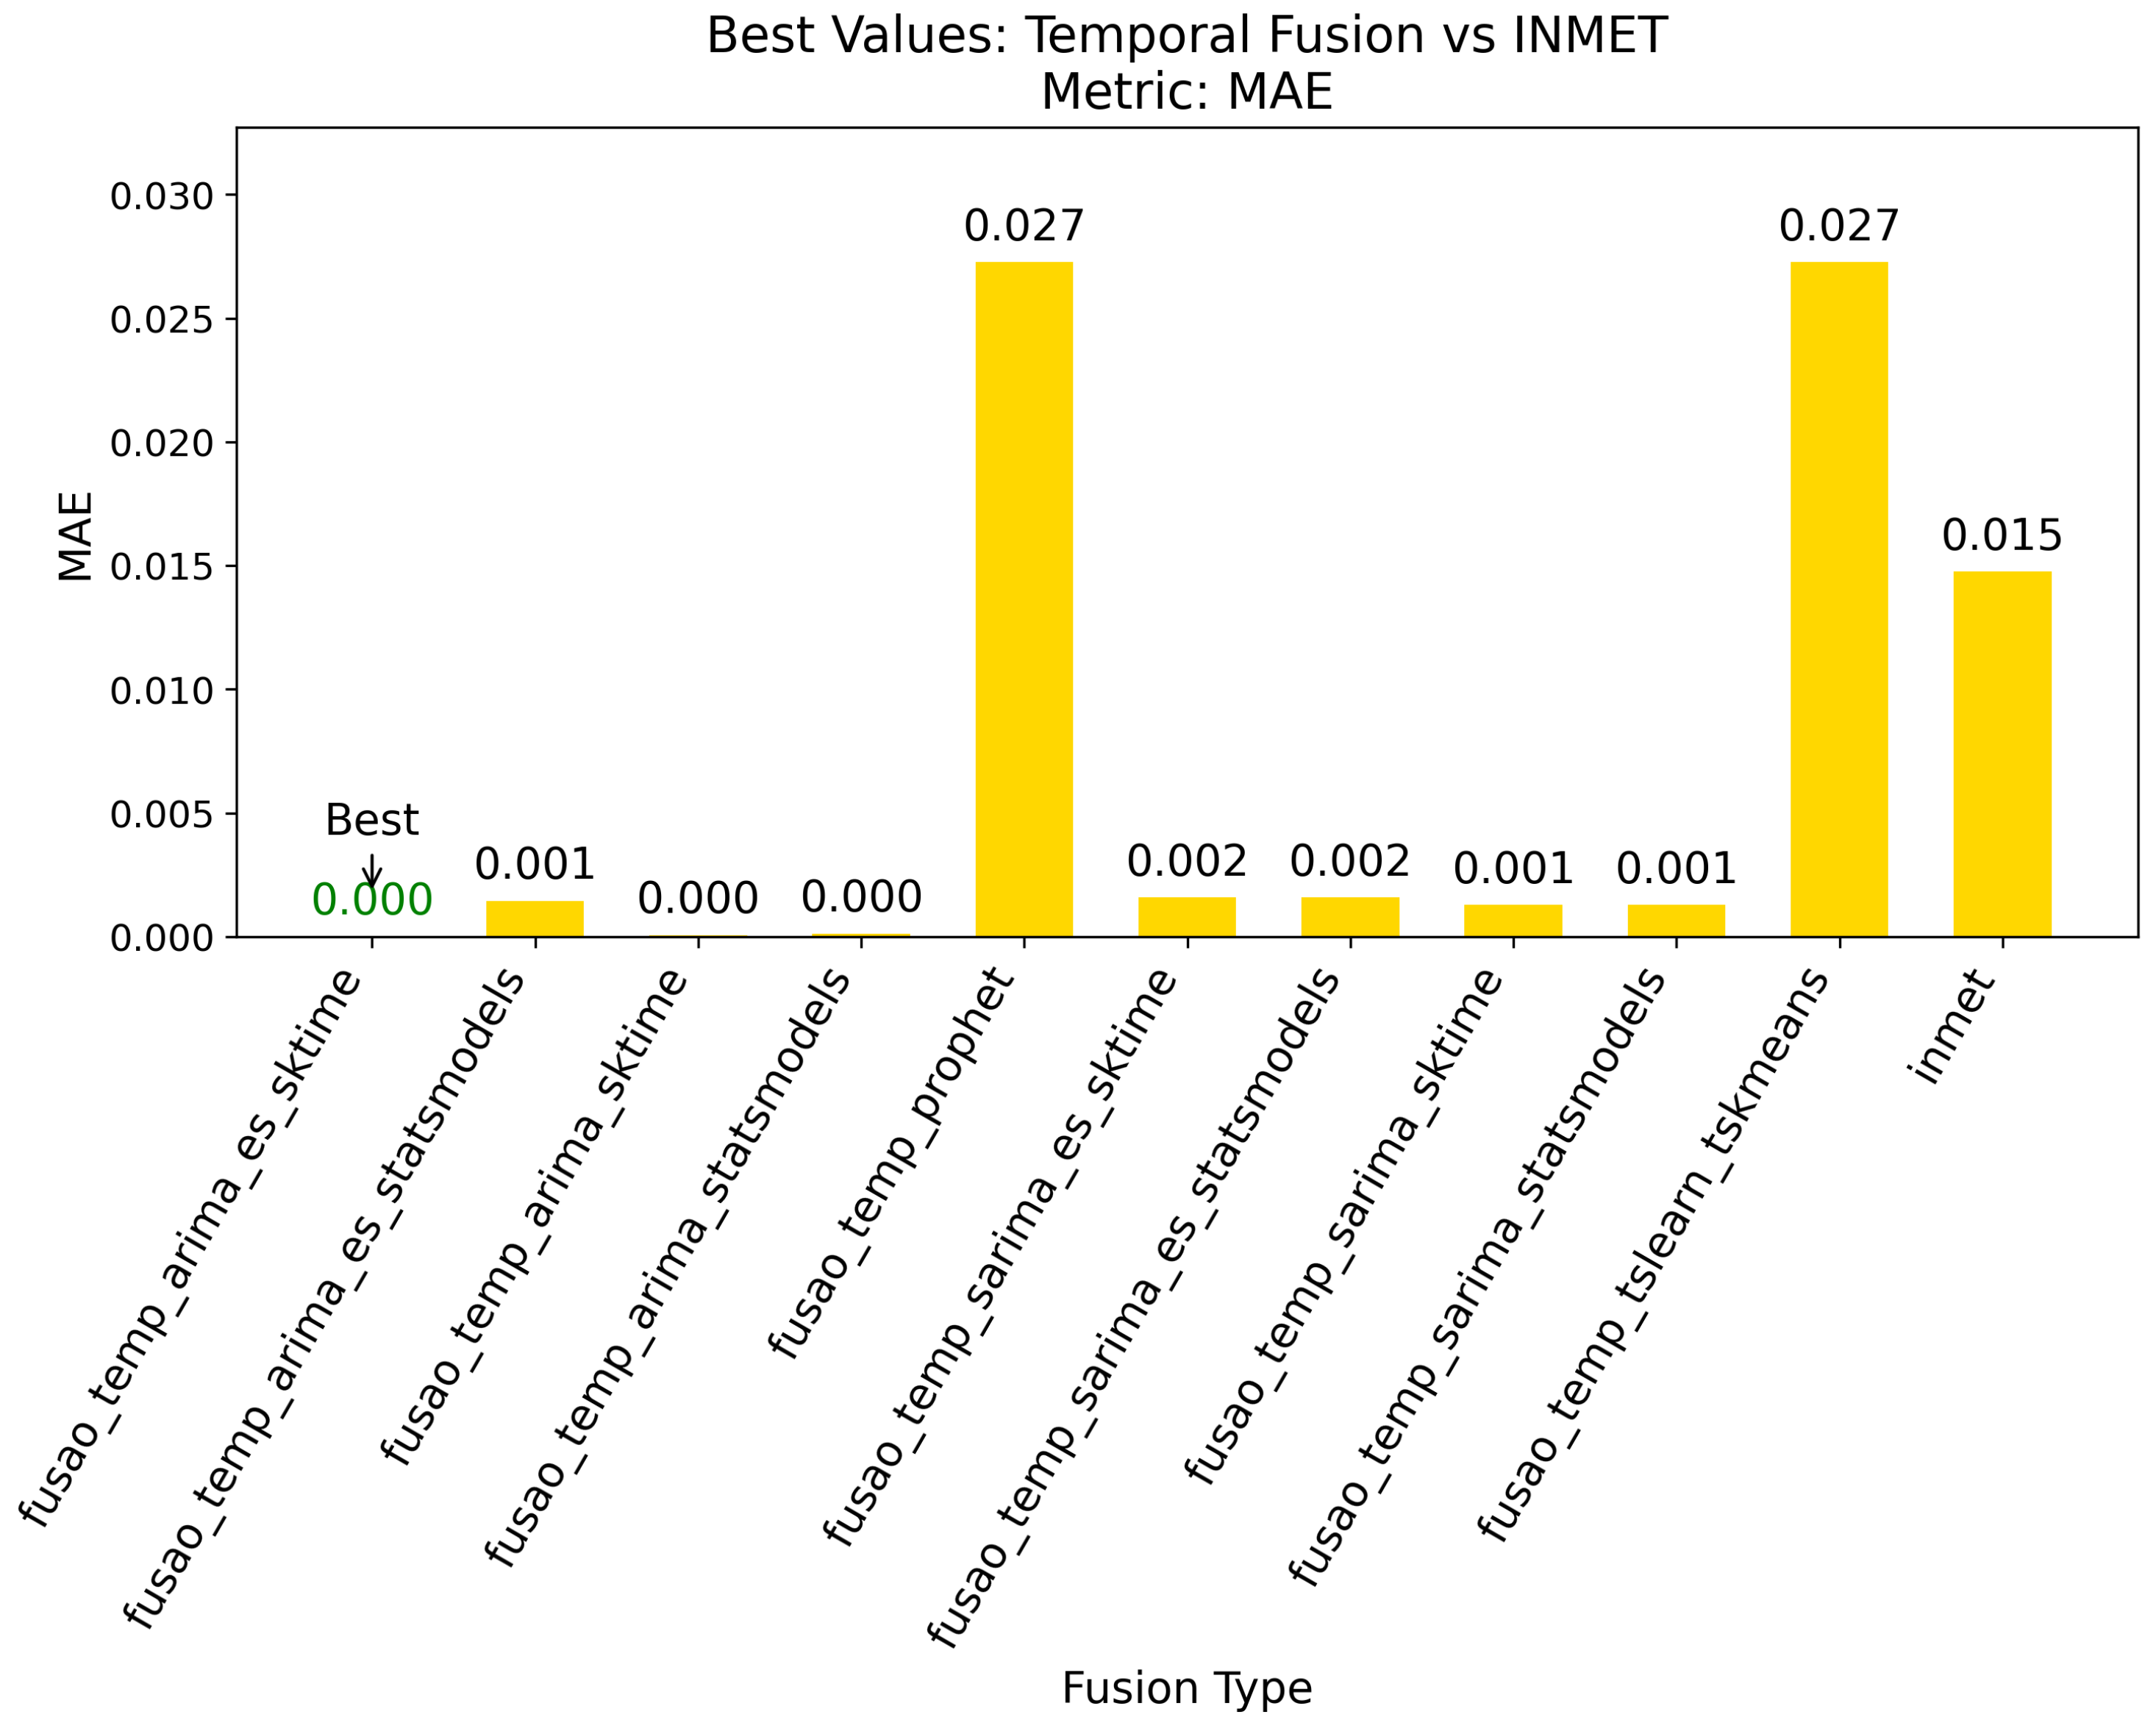
Figure 4.
Best results for temporal fusion based on MSE.
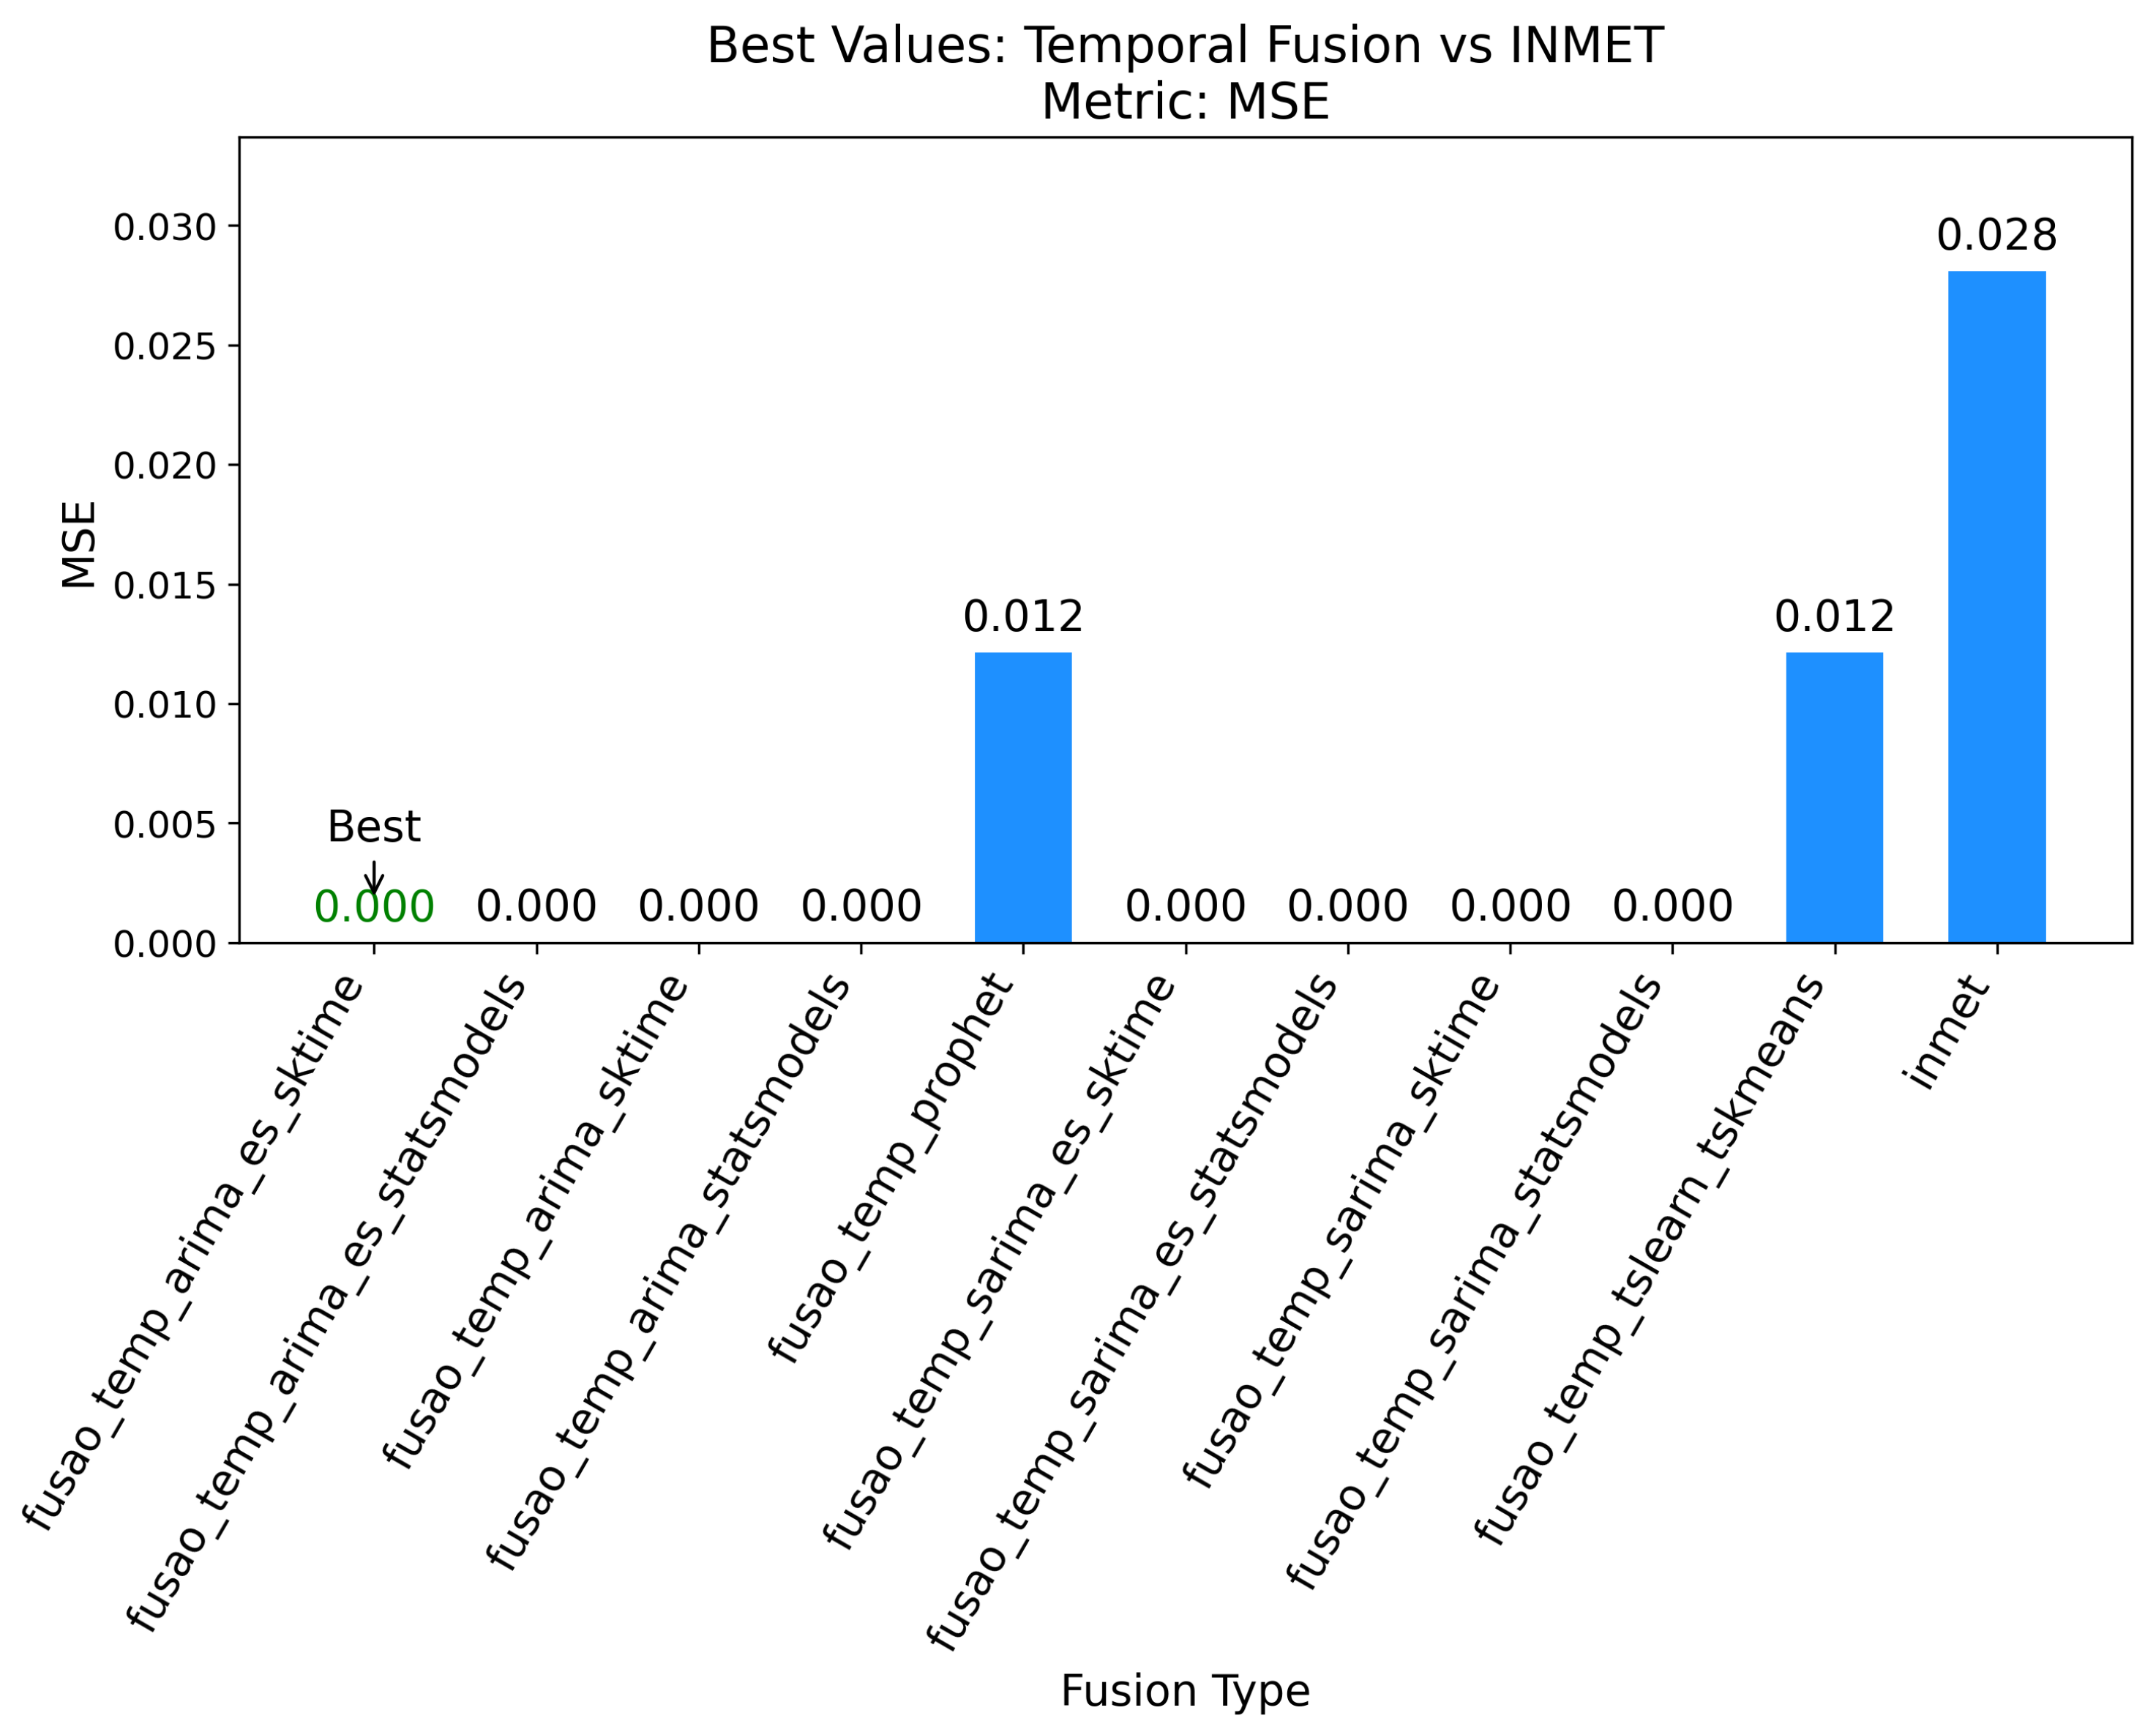
Figure 5.
Best results for temporal fusion based on R2.
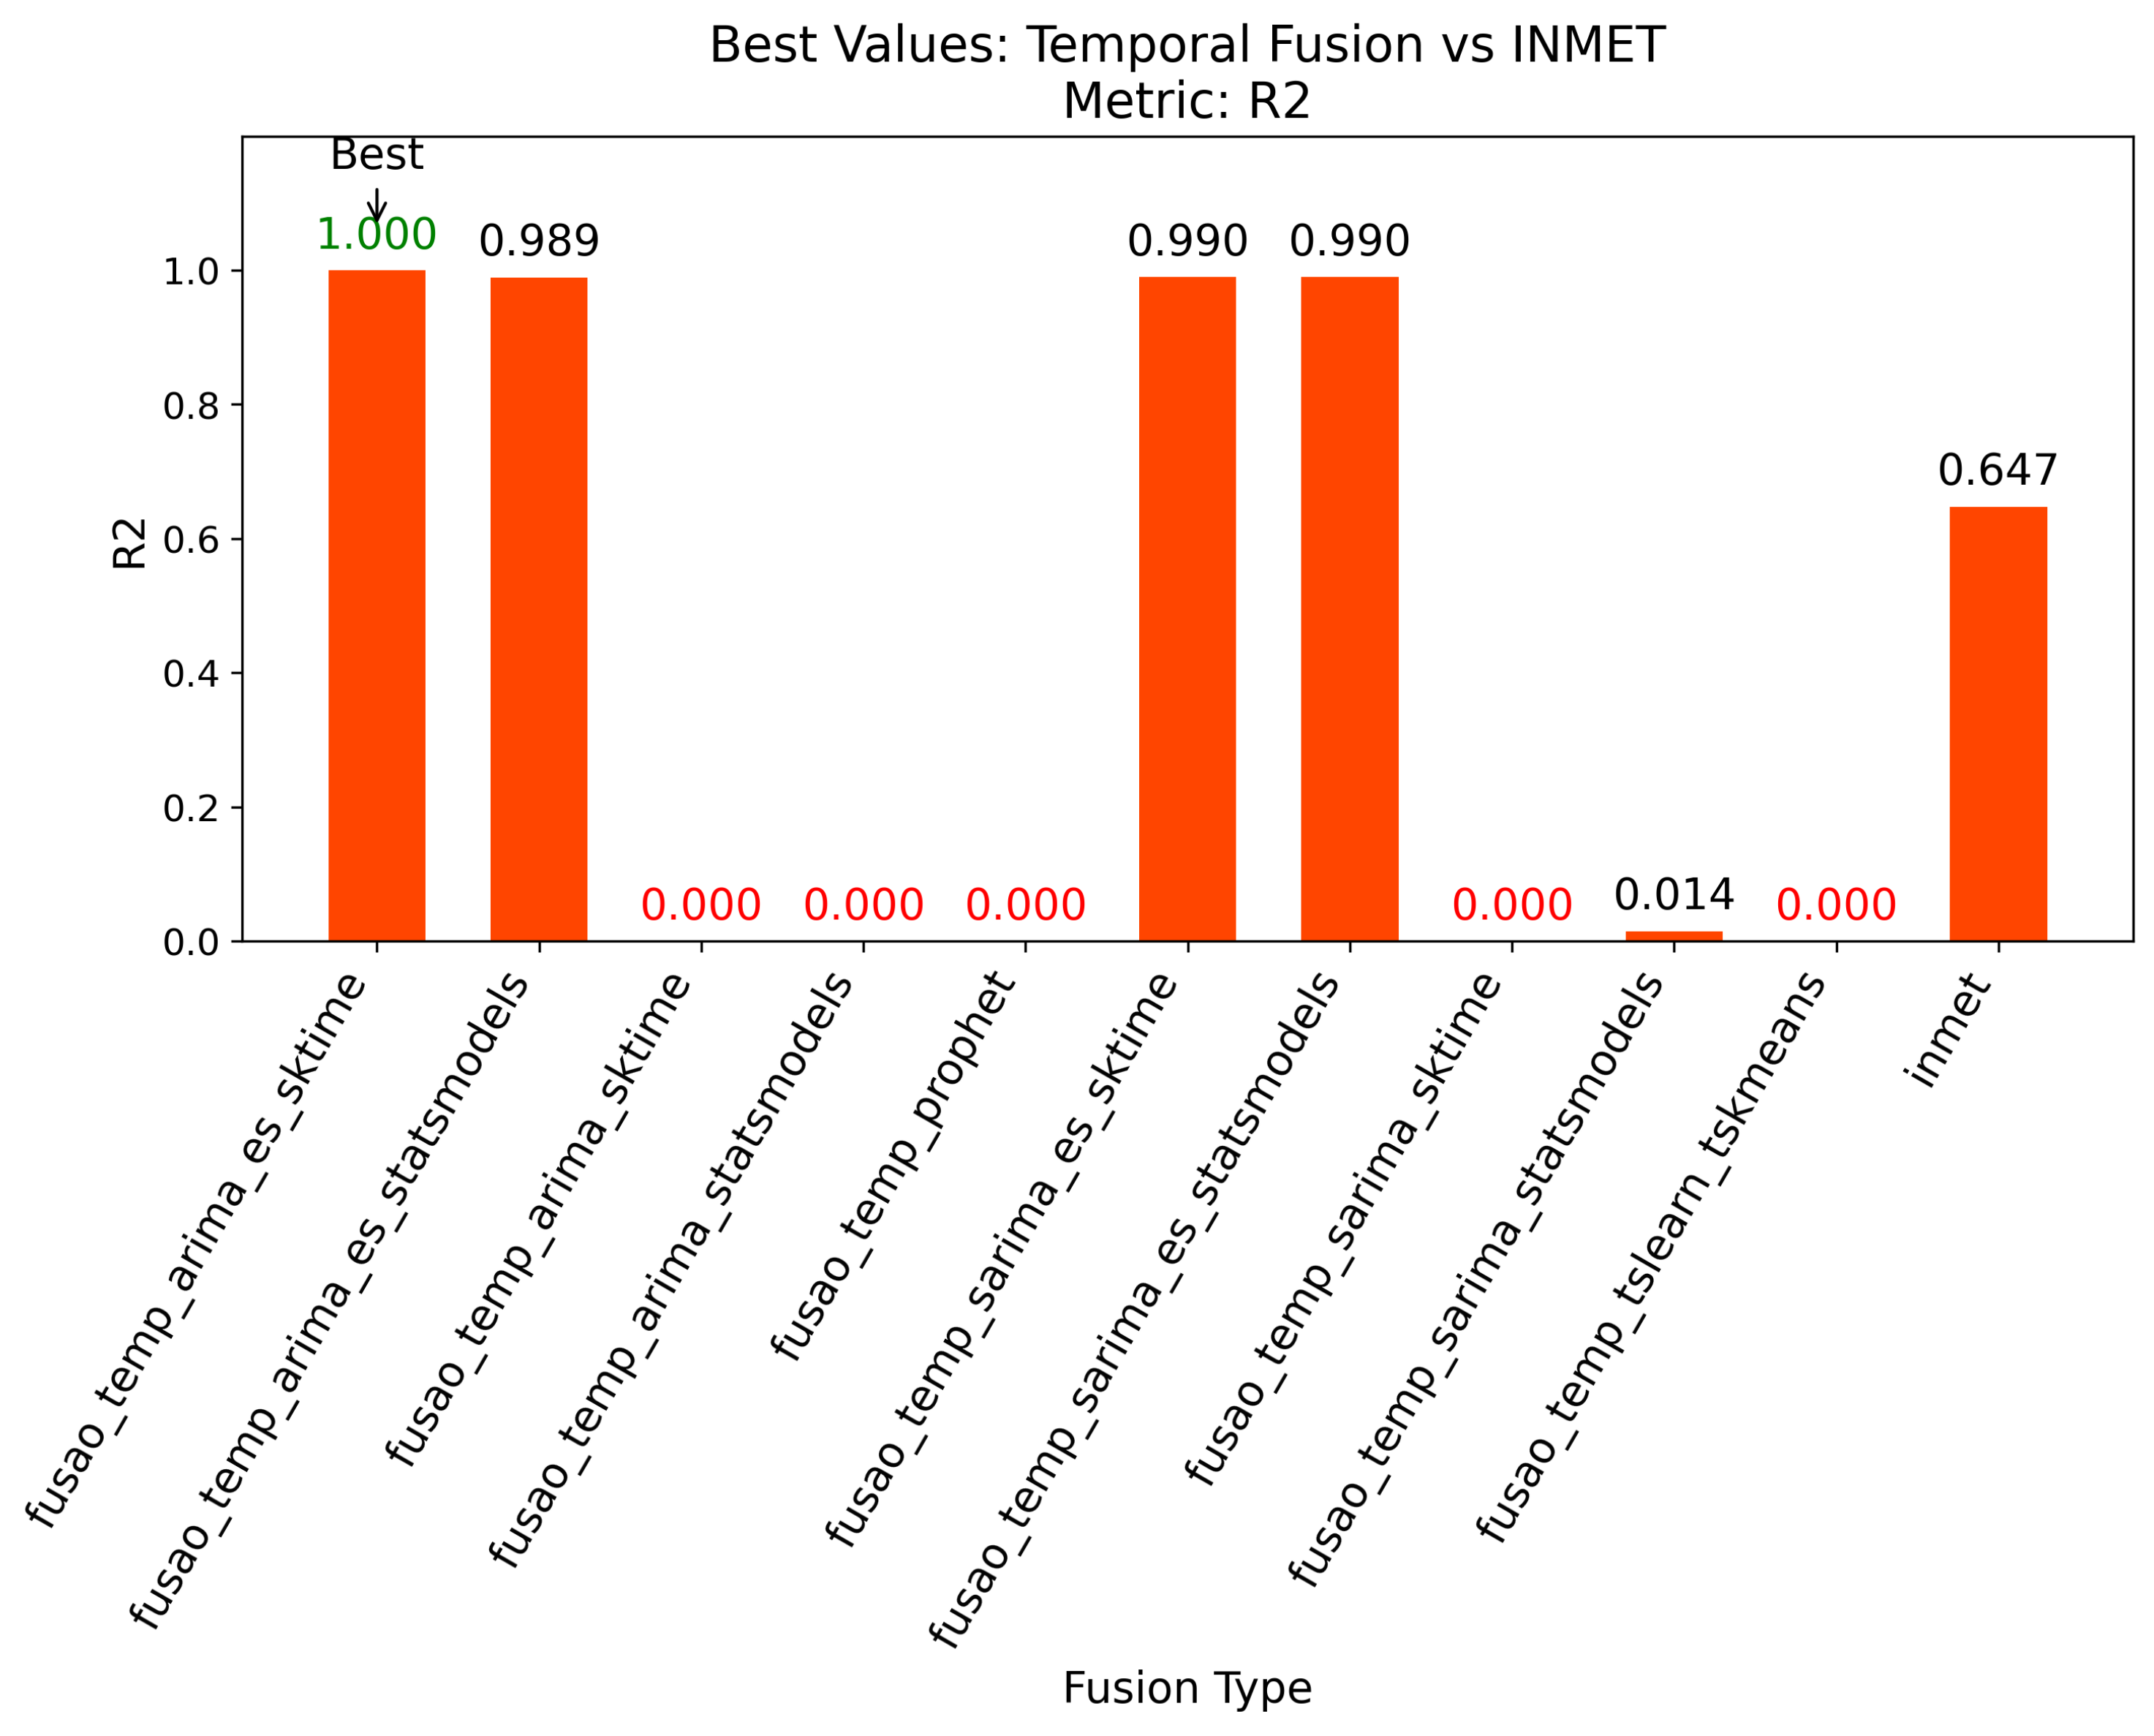
Figure 6.
Best results for temporal fusion based on CV_MAE.
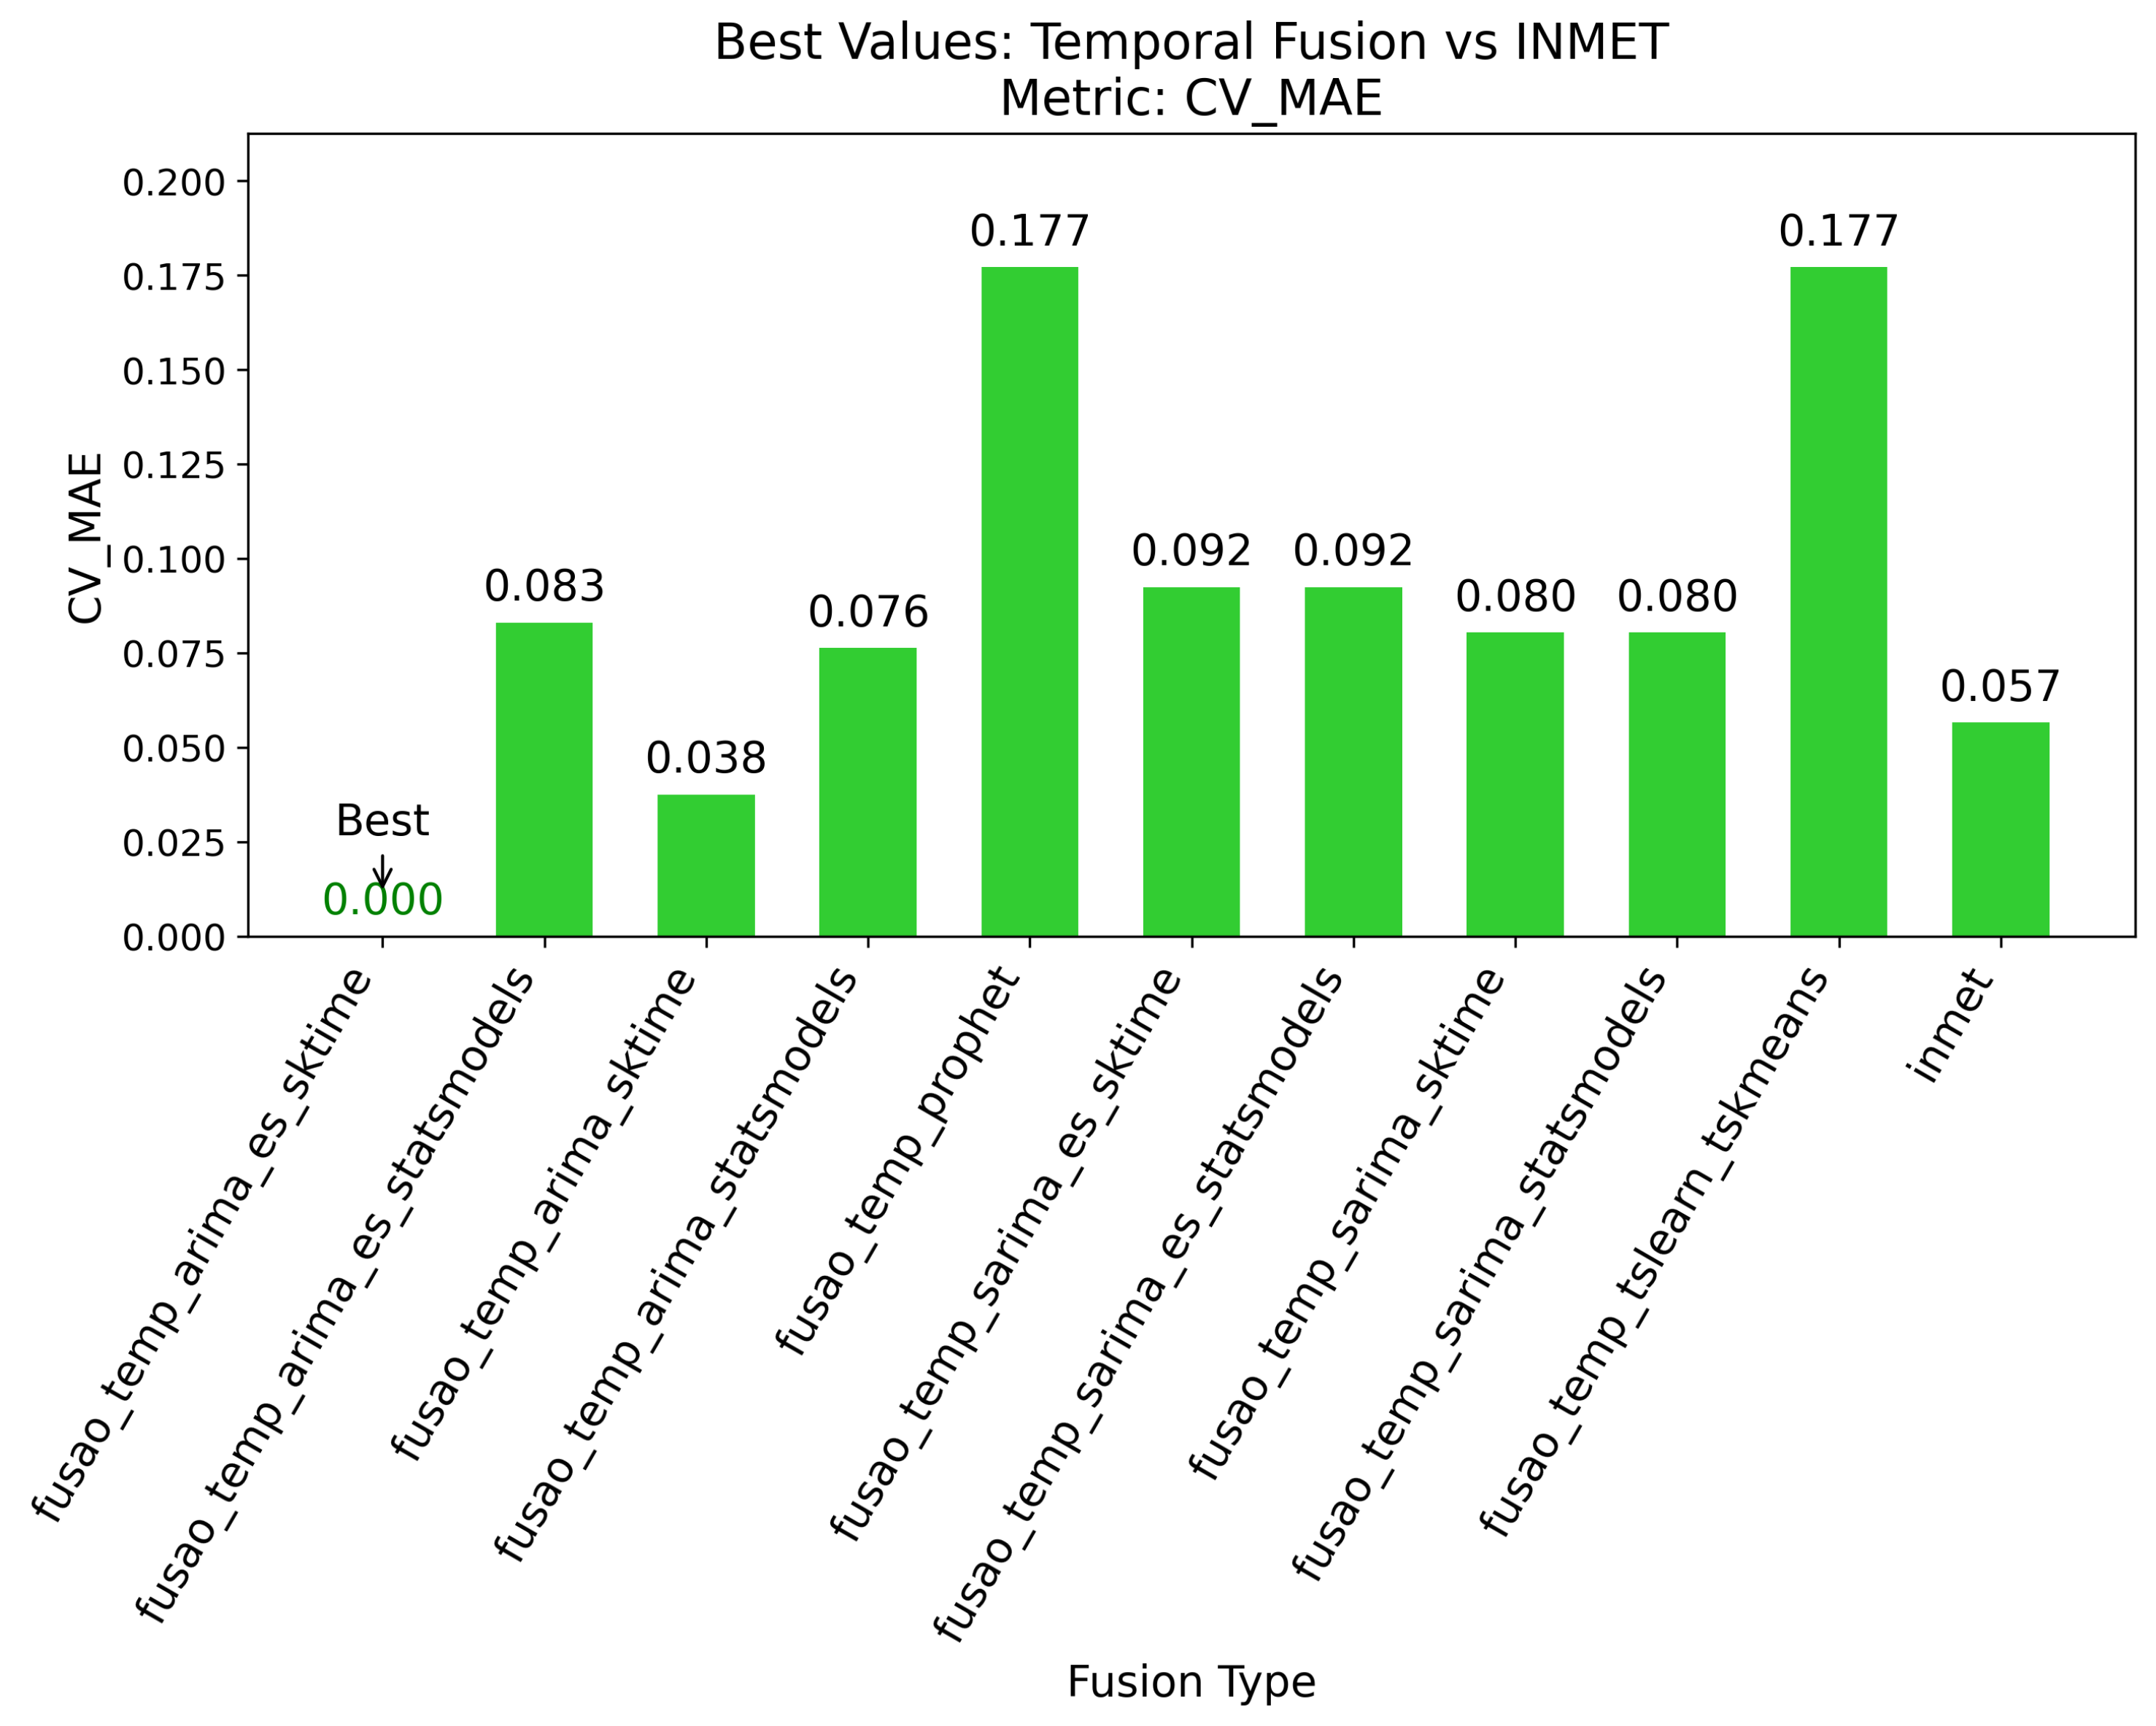
Figure 7.
Precipitation forecast using ARIMA with Exponential Smoothing.
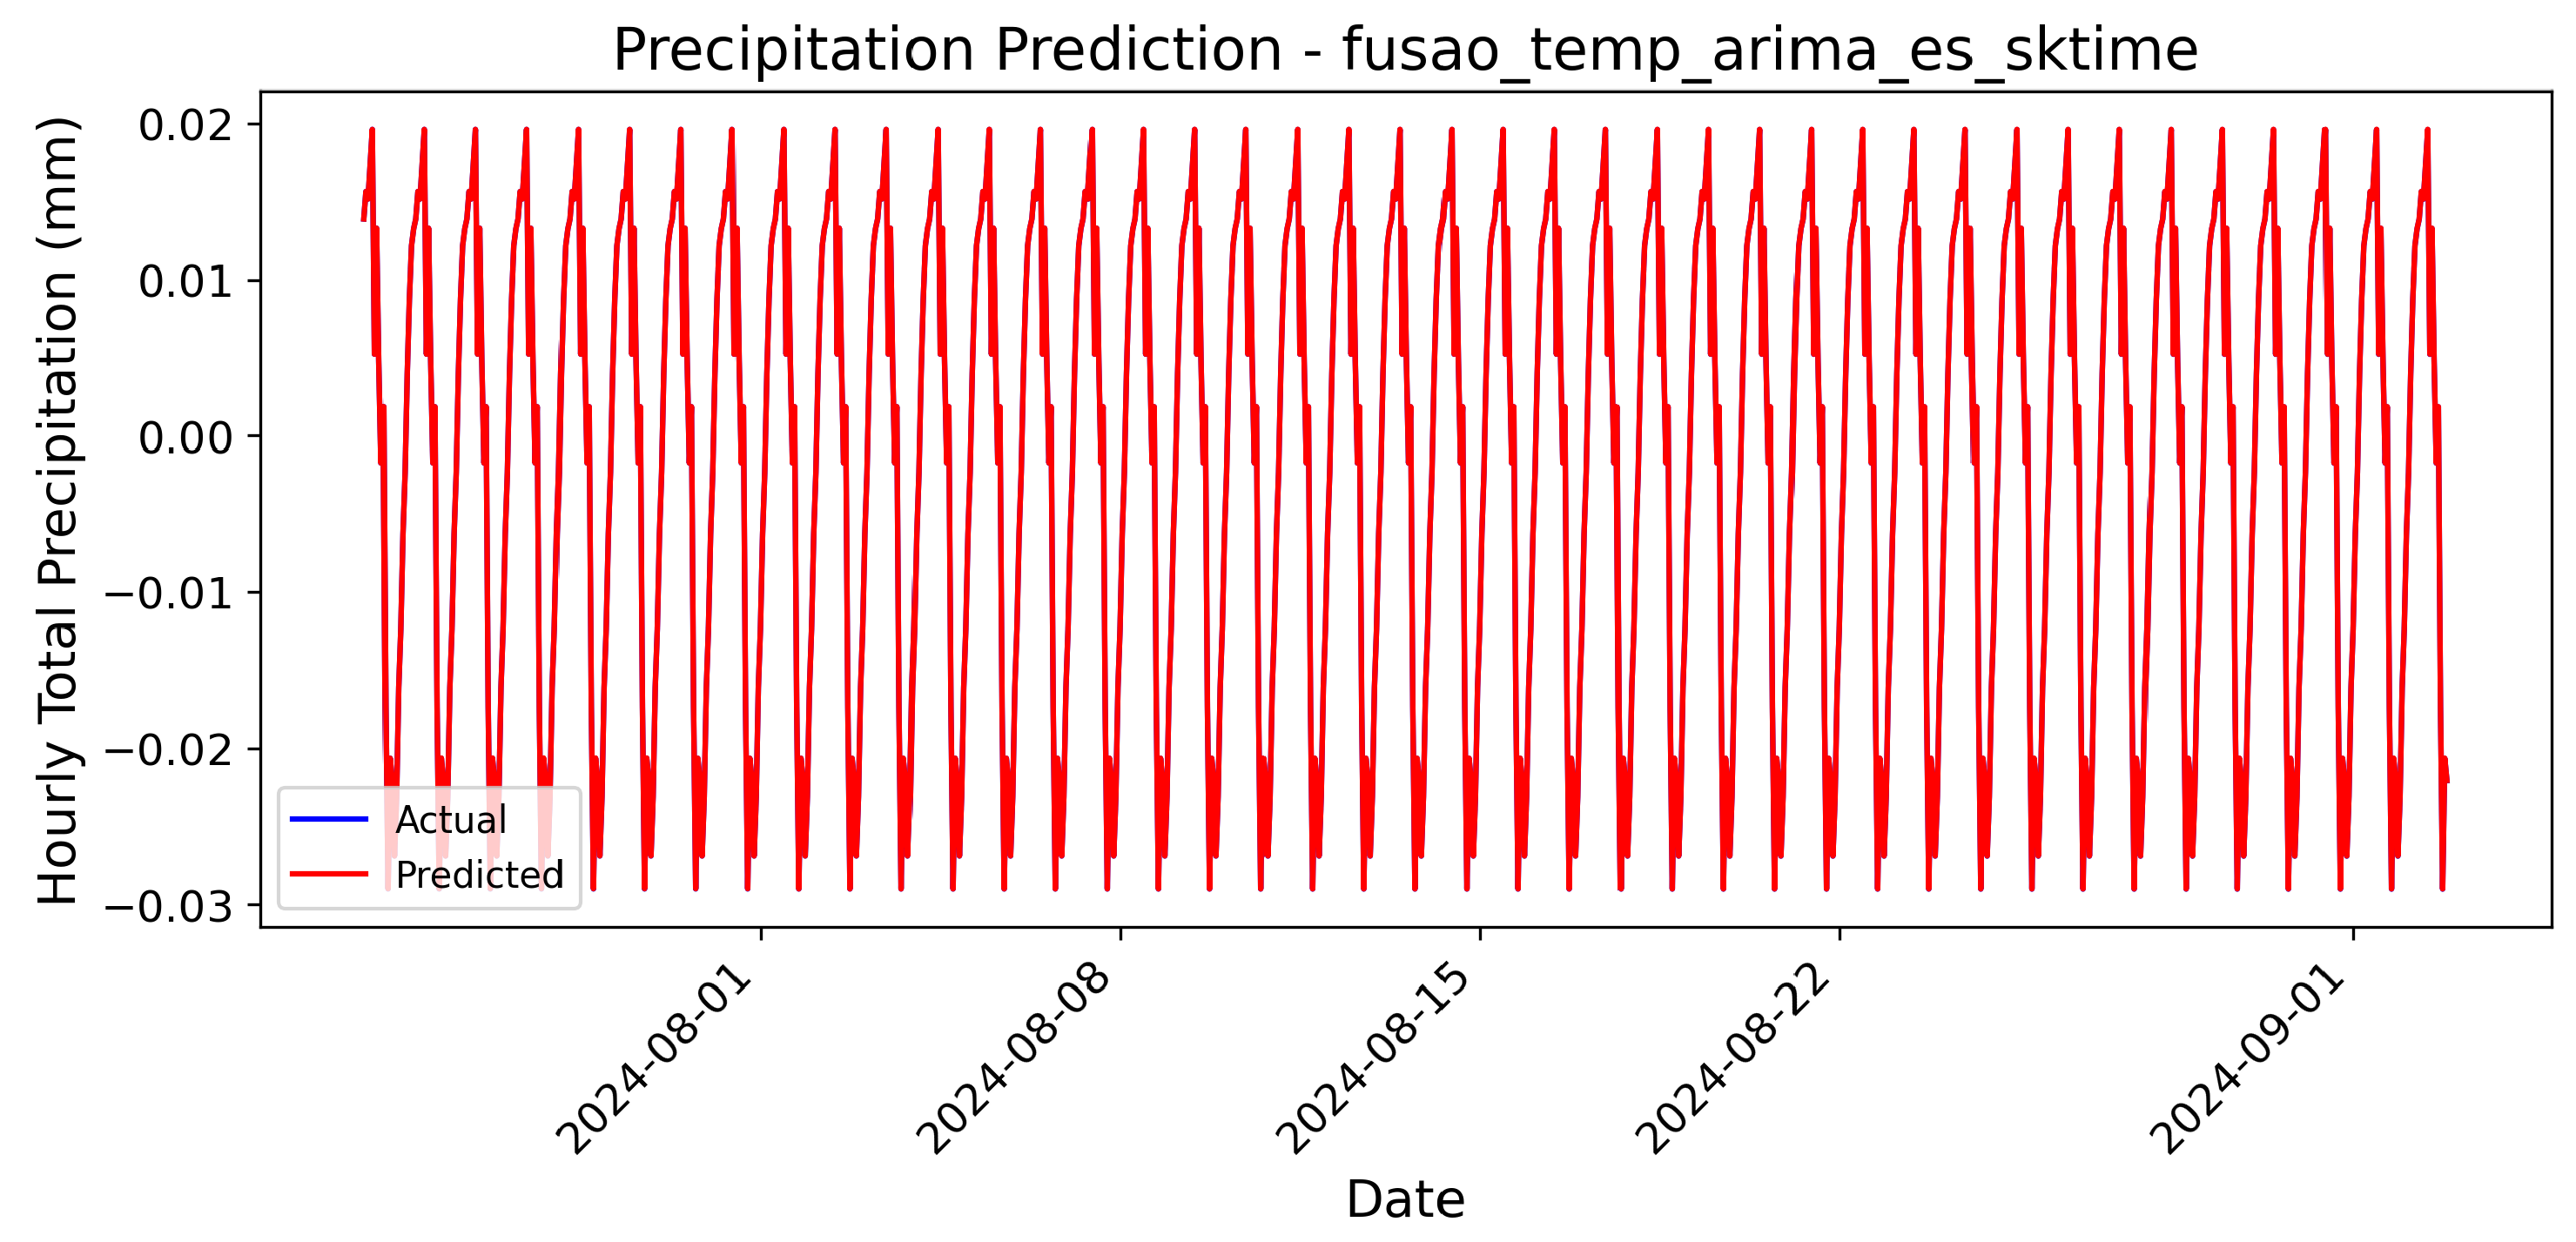
Figure 8.
Precipitation forecast using Prophet on normalized data.
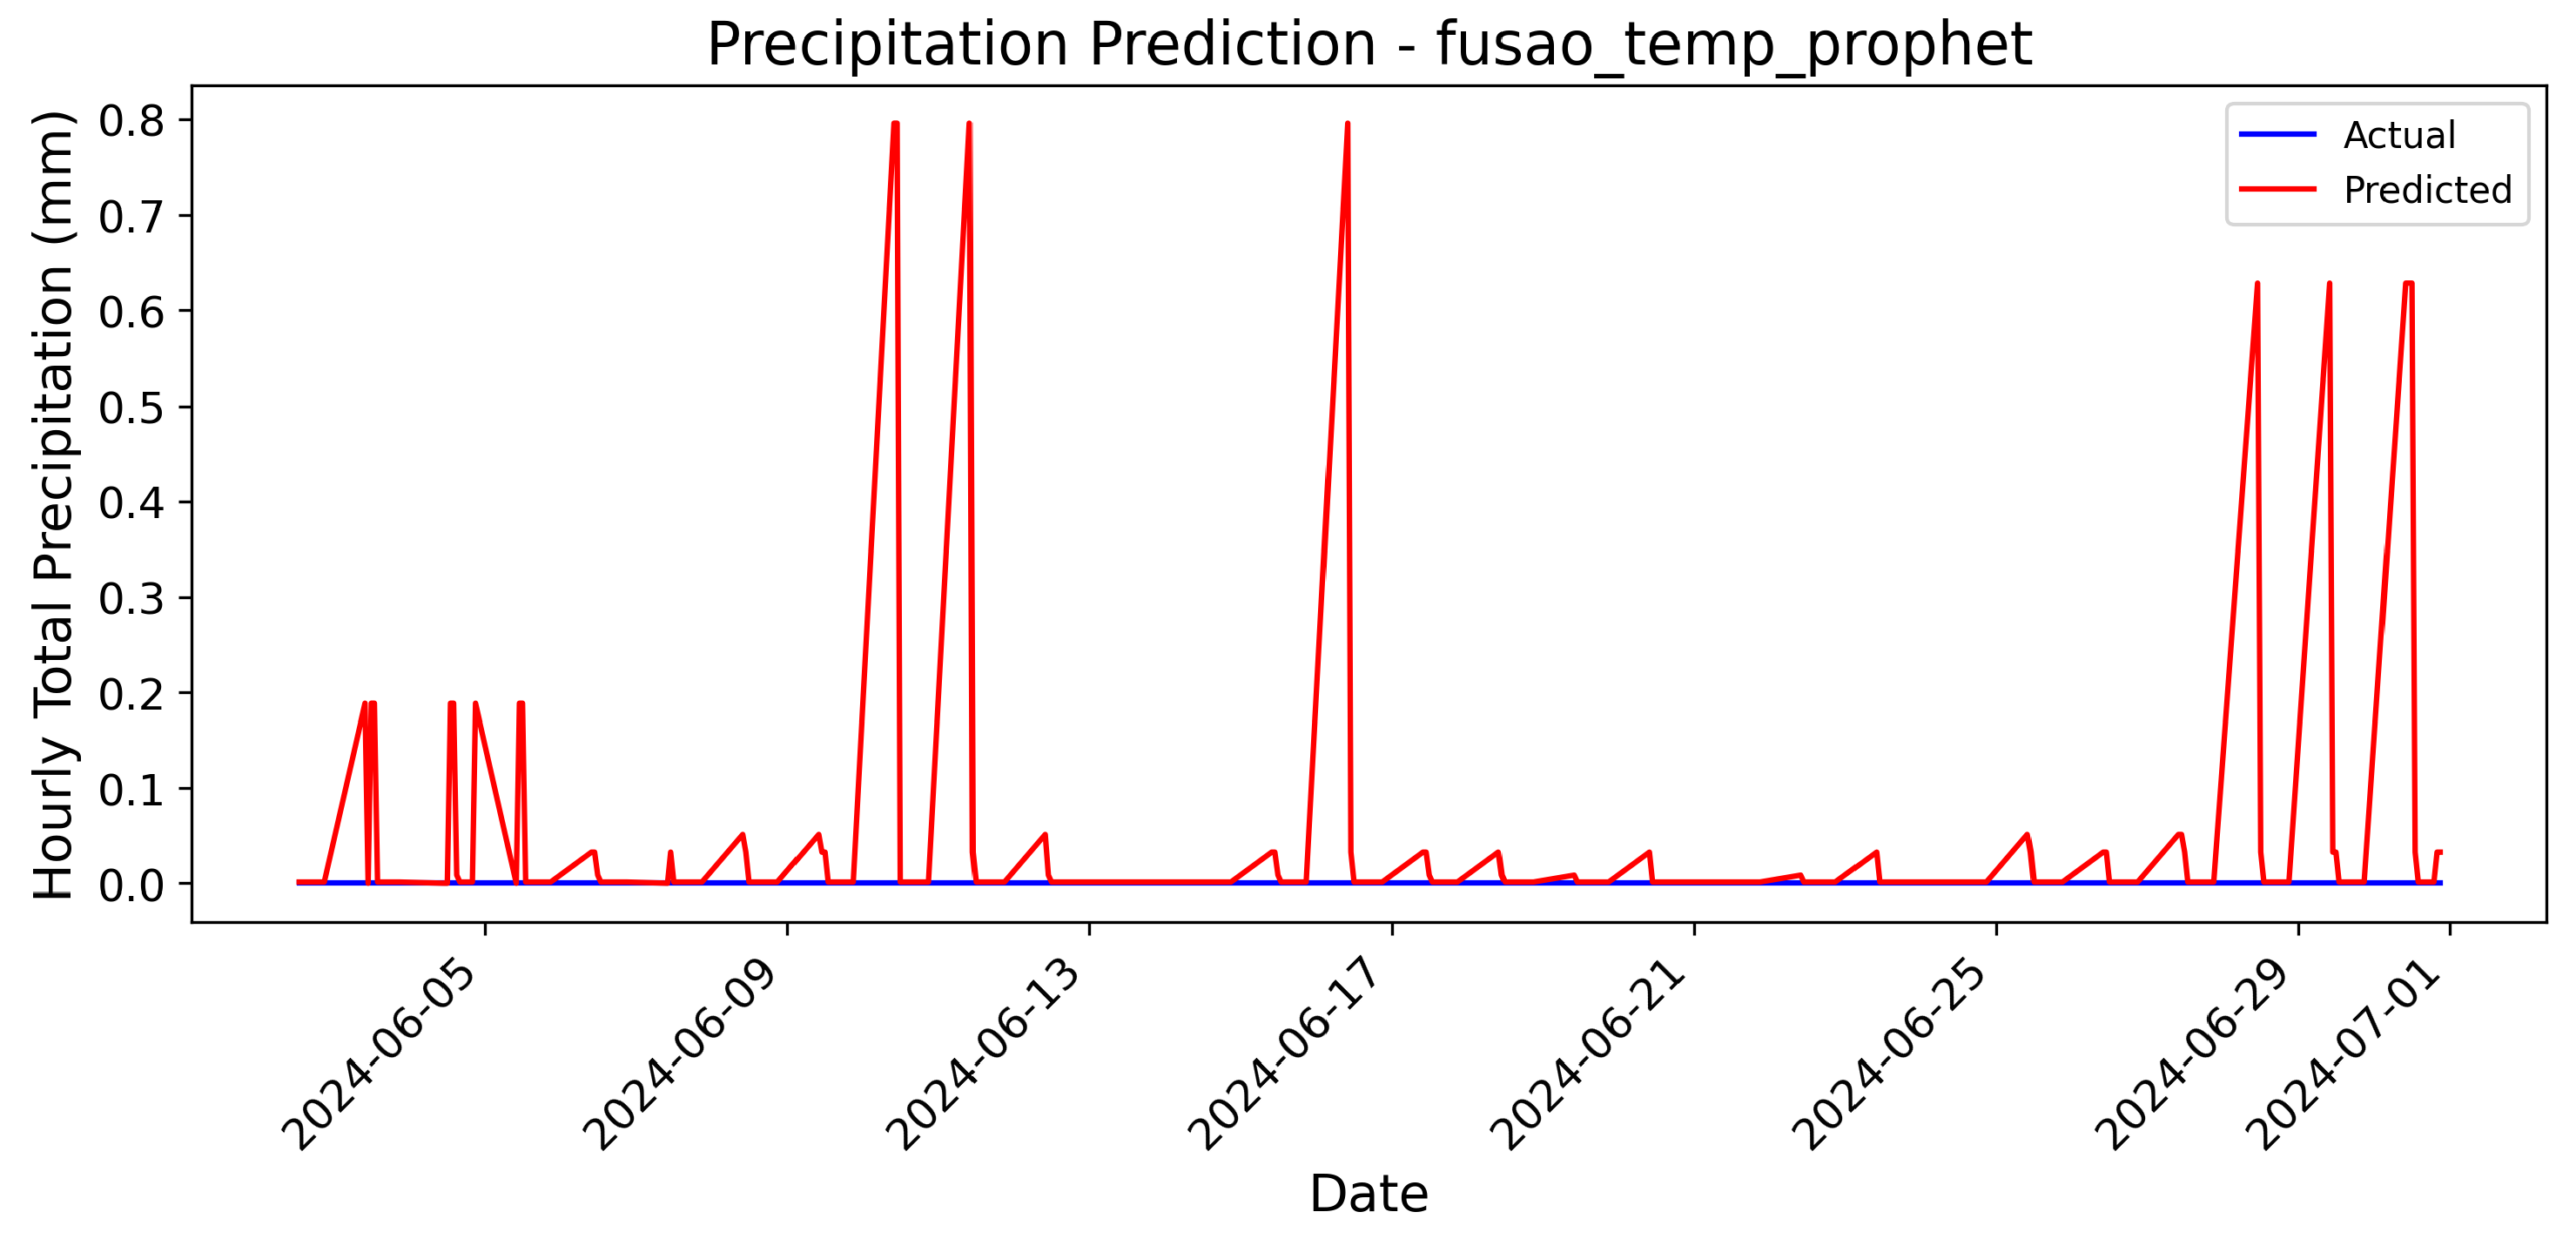
Figure 9.
Precipitation forecast using Prophet on raw INMET data.
Disclaimer/Publisher’s Note: The statements, opinions and data contained in all publications are solely those of the individual author(s) and contributor(s) and not of MDPI and/or the editor(s). MDPI and/or the editor(s) disclaim responsibility for any injury to people or property resulting from any ideas, methods, instructions or products referred to in the content. |
© 2025 by the authors. Licensee MDPI, Basel, Switzerland. This article is an open access article distributed under the terms and conditions of the Creative Commons Attribution (CC BY) license (http://creativecommons.org/licenses/by/4.0/).
Copyright: This open access article is published under a Creative Commons CC BY 4.0 license, which permit the free download, distribution, and reuse, provided that the author and preprint are cited in any reuse.


