
Submitted:
08 April 2025
Posted:
09 April 2025
You are already at the latest version
Abstract
This research analyzes with statistical evidence and complete economic specifications the effects of the U. S. Department of Agriculture’s (USDA’s) monetization of a U. S. commodity to support its Food for Progress projects. Since the beginning of the monetization program, its possible effects on agricultural producers in the receiving countries has been a concern. In this case, the country is Peru and the commodity is crude degummed soybean oil (CDSO). Effects were measured statistically on domestic prices and production in Peru, including effects on substitute commodities. The first stage of the research involved the identification of data needed and subsequent data collection, and model formulation. A 25-year time series was used for the statistical analysis. A sequence of progressively more complete models was used to capture the impact of monetization based on available price information on the monetized commodity and related products in domestic production and consumption. Our model specifications are based on the time series nature of our data and the classical demand and supply models in economic analysis. To account for potential lagged impacts, we employ a distributed lags specification in our time series analysis. The statistical analysis here modifies in important ways the approach of Appendix II of the GAO’s 2017 report on monetization [11]. Differences include: 1) Incorporating quantities and prices of substitutes into price equations in addition to testing the role of time trends in explaining prices. Attempting to explaining price movements only with time trends, as the GAO report did, does not have support in economic theory, and statistically time trends did not prove to have a significant explanatory effect when the other variables were included. 2) Analyzing a wider set of commodities potentially affected by the monetization program. The existence of substitution effects in both production and consumption calls for analysis of monetization effects on a number of locally produced commodities.
Keywords:
Monetization
; producer prices
; substitutes
; Peru
; soybean oil
; imports
1. Introduction
Since 1985 the U. S. Department of Agriculture (USDA) has been authorized to ship and sell (“monetize”) U. S. agricultural commodities on commercial markets in low- and medium-income countries to support its Food for Progress development projects in those countries. These commodities are not delivered directly to the food-insecure poor but rather placed on the countries domestic market through commercial channels. An aim of the program is to support the poor or achieve other development objectives via the projects funded by the revenues from the sales.
Early in the program’s history concerns were voiced about the potential disincentive effects of monetization on local farm production through its possible effects on farmgate prices. In response, legislation in 1997 was amended to include a clause, the Bellmon Amendment, requiring assurance in each case that a disincentive effect of this nature would not occur. In practice, analysis to provide this assurance was rarely carried out but the USDA’s guidance states that the amounts of a commodity monetized should not exceed 5 to 8 percent of the quantity in the local market. The concern has not vanished. A 2017 study [8] estimated with instrumental variables the effects of cereal food aid of all types on a sample of 118 countries over the period 1961-2006. For the aggregate of cereals delivered as aid, the study found disincentives: “We find that U.S. cereal aid reduces cereal production in recipient countries. If the U.S. doubled food aid, production in recipient countries woufall by 1.5% on average.It looks like one MT of U.S. food aid crowds out 2.45 MT of recipient country cereal grains.”
However, commodity-specific studies did not always arrive at the same conclusion. An earlier study by Informa Economics [9] analyzed the effect of monetizations on production but not producer prices in the receiving countries of The Gambia, Guatemala, Liberia, Mozambique and Uganda. No impacts were detected on production of the monetized commodity nor production of substitutes, primarily because the monetized amounts were small in relation to domestic production (of main substitutes if not the monetized commodity). However, it should be pointed out that the method used was simple correlation analysis and not a complete specification of equations following economic theory.
A yet earlier study by a Michigan State University team [5] analyzed the impact of wheat and vegetable oils monetization in Mozambique under USAID’s Title II program, using a type of variance-covariance analysis known as Vector Auto Regression (VAR). It found impacts on local prices in part but not all of the period analyzed but again the methodology did not have an economic specification of the relationships among variables. More informal studies such as [1] have found negative effects of food aid on domestic production. A comprehensive review of the issues by Barrett et al. [2] concluded that “evidence of food aid monetization disrupting markets, destabilizing prices, and decreasing or displacing supply is strong.” Another concern has been the high cost of managing and shipping the monetized commodities, generating inefficiencies in the program [14]. A report of the U. S. Congressional Research Service [13] echoed both issues.
An analysis of the impacts of commodity monetization in Ethiopia and Rwanda [11] found a strengthening of the position of small traders in Rwanda but the potential for creating downward pressure on farm prices in Ethiopia and for displacing regional imports of edible oils in the Rwandan case. The need for vigilance concerning possible effects on farmer prices was underscored by the U. S. General Accounting Office [15].
Consequently, there has been increasing support worldwide for alternative forms of food aid, especially those that can be targeted on the most needy segments of the population, including local and regional purchases (LRP) of food, to support local farmers as well, direct food deliveries [6], food vouchers [4], cash transfers [16], and sales of imported food to local small traders. The World Food Program has been a principal advocate of the LRP approach [16]. A 2021 report of the Congressional Research Service [3] pointed out that in-kind aid, of which monetized agricultural commodities represent an example, may not address the nutrient requirements of needy populations as well as running the risk of depressing prices to local farmers. In any case, U. S. legislation requires that the approach of monetized U. S. farm products continue to be used to support external assistance programs [12].
Accordingly, the present research analyzes the question of whether monetization of this form affects farm prices and production in the recipient country. Given the typically large numbers of farmers in developing countries, the potential of this kind of effect would have the most widespread local consequences and hence is one of the leading concerns about the monetization programs. Previous studies on the topic either have not analyzed specific commodities (but rather a commodity group), and/or have lacked theoretical specification of the analytic basis, and/or did not review potential effects on substitute commodities, and/or have not employed adequate econometric tools. The methodology used in this paper overcomes those defects. The country selected for analysis is Peru and the commodity is crude degummed soybean oil (CDSO). Effects were estimated with time series data for import quantities, import and domestic prices, and production in the recipient country, including for substitute commodities. The analysis incorporates cointegration methods in order to remove potential non-stationarity issues in the form of stochastic trends.
2. Methodology
The first stage of the research involved the identification of data needed and subsequent data collection, and model formulation. The relevant literature and monetization documents indicate that the following data are needed for an impact analysis of monetization a receiving country:
- The amounts, delivery price, and timeline of the monetized commodity
- Production, import, and export data of monetized commodity and its likely substitutes
- Producer and import prices for the commodities identified above
The USDA provided updated estimates of the information in the first bullet point above. The other data collected include:
- Production, import and export data of the monetized commodity and its substitutes, from FAOSTAT and national data.
- Producer prices of these commodities and substitutes, also from FAOSTAT and national data.
A 25-year time series was used for the statistical analysis. For key variables data from other sources, particularly the national statistical institute, were spliced onto the FAOSTAT series, with a five-year overlap between the two series, to extend the FAO series to the year of monetization (2020). With this extension, the regression analysis for each case was based on the 25-year time series.
The statistical analysis here modifies the approach of Appendix II of the GAO’s 2017 report on Monetization [15]. Differences include: 1) Incorporating quantities and prices of substitutes into price equations in addition to testing the role of time trends in explaning prices, and 2) applying appropriate econometric tools. Attempting to explain price movements only with time trends, as the GAO report did, does not have support in economic theory, and statistically time trends did not prove to have a significant explanatory effect when the other variables were included. The paper analyzes a wider set of commodities potentially affected by the monetization program. Historical data were screened to identify relevant substitutes. The existence of substitution effects in both production and consumption calls for analysis of a number of locally produced commodities, as mentioned above.
Because of the likelihood that commercial importers adjust their plans in light of foreseen deliveries of monetization commodities to their countries, a statistical test has been carried out to ascertain whether the monetization amount significantly affected the total import amount of the commodity in question, in the year in which the monetization took place. If that proves not to be the case, then the analysis proceeds on the basis of analyzing the effects of total imports of the commodity in question, on production and prices in the receiving country of that commodity and on its substitutes. That test responds to questions about potentially larger monetized quantities in the future and also elucidates effects on the local producer side of commercial imports.
3. Structure of Peruvian Vegetable Oils Markets
The data used in our analysis come from two sources: FAOSTAT and the Peru Oilseeds and Products Annual Reports by the Global Agricultural Information Network (GAIN), Foreign Agricultural Service of the United States Department of Agricultue, various years.
Peru is an exporter of palm oil. Its exports of this commodity have been increasing and earned $52 million in 2019. However, that amount lags far behind Peruvian exports of fruits, vegetables and coffee. In 2019, by comparison, grape exports were valued at $879 million, blueberry exports at $812 million, and avocado exports at $755 million.
Soybeans and soybean products dominate the agricultural import picture. They are Peru’s leading agricultural imports by value, registering $996 million in 2019 (soybeans, soybean oil and soybean cake). They are followed by maize ($797 million) and wheat ($513 million) in 2019. The other imports of raw agricultural products are well below these products in value, with the next import being rice at $166 million in 2019 and others much lower still.
Peru imports soybeans and soybean products from several countries. The major suppliers in recent years have been Argentina and Bolivia, followed by Paraguay and the United States. As Table 1 shows, the amounts imported by country of origin fluctuate considerably from year to year. Evidently Peruvian importers adapt to variations in supply conditions in the other countries and also may promote competition among those suppliers. Curiously, total imports from the United States of soybean products, even of soybean oil, declined in the first year of the 2019-2020 monetization of CDSO, but in light of the pattern of fluctuations this reduction may not have significance. (It appears that the monetizations in late 2019 were registered officially as landed imports in 2020.)
At the enterprise level, Peru’s import of crude soybean oil is dominated by two entereprises, which together account for more than 80% of those imports by value, as shown in Table 2. In the period of around a decade ago, the top three importing enterprises accounted for about 38%, 24% and 15% of soybean oil imports, so evidently the degree of concentration of this importing sector has increased. The table also underscores the fact that Peru is a price-taker on international markets for soybean products, as shown by the sharp increases paid by Peruvian importers in 2021. This observation is also confirmed by our econometric analysis, which suggest that Peru’s agricultural production and trade are heavily influenced by the international market.
Regarding competition among products in end uses, for well over a decade the poultry industry in Peru has been the principal driver of demand for both soybean cake imports and also for yellow maize, which is mostly imported [7]. They are also feeds in varying proportions for hogs and cattle. Thus for the livestock industry as a whole soybean products and maize are potential substitutes to a degree.
On the consumer side, a Peruvian study reported that, because of similarities in the physio-chemical composition of fatty acids, the substitutes for soybean oil are sunflower oil, maize, and cottonseed oil. The leading brand of vegetable oils in Lima (Primor) markets a mixture of soybean, sunflower and maize oils. The study’s conclusion is that “the threat to the soybean oil industry from substitutes is high” [10]. Another piece of evidence supporting the substitutability of soybean oil on the consumer end is the finding from a recognized survey organization (Ipsos Apoyo) that consumers are largely not loyal to a brand of vegetable oil; in fact “only 41% of housewives are loyal” [10].
Hence for this study both maize and palm oil were posited as potential substitutes for soybean products, with the existence and strength of that possible effect to be measured econometrically.
4. The General Statistical Models
In this section, we present three incremental models to capture the impact of monetization based on available price information on the monetization commodity and related products. Our model specifications are based on the time series nature of our data and the classical demand and supply models in economic analysis. To account for lagged potential impacts, we employ a distributed lags specification in our time series analysis.
Let be the domestic producer price of a certain commodity at time t. Given a time series for t=1,…,T before the monetization, we estimate a time series model
where is a flexible time trend, and the second term is a series of monthly dummies that capture seasonality if monthly data are available (which was not the case for Peru). Possible formulation of the time trend includes linear, quadratic time trend. For further flexibility, we can also consider using splines with multiple knots that span the sample period.
Denote the fitted model (1) based on the pre-monetization data by . The predicted price for the post-monetization periods is then evaluated using the same formula and estimated parameters. Given the post-monetization prices , the impact of monetization is then estimated as
The barebones model (1) runs the risk of oversimplification. At the same time, it only relies on the values of variables over time and dummies and therefore is immune from potential obstacles such as missing variables and/or measurement errors. Its purpose is to establish some kind of baseline upon which richer and more granular models shall be constructed.
Model (1) can be augmented with incorporation of likely contributing factors indicated by economic theory. In particular, we shall consider the world price of the same commodity (expressed in domestic currency multiplied by exchange rate so we don’t need a separate exchange rate), the volume of imports (of the previous period), domestic production , plus imports and domestic productions of other related products and .
The augmented model then takes the form
Note that above we use the summation of imports and domestic production of other related products to reduce the loss in the degrees of freedom. This is beneficial if the times series were not long enough for allowing separate parameters for these variables. Additional covariates can certainly be added if needed. Now the variable I is the dummy for the monetization years and captures the monetization effect, adjusted for time trend, seasonality and other contributing factors. The inter-temporal profile of informs the evolution of this effect post monetization. Moreover, the average of over the post-monetization period estimates the mean or average treatment effect of the monetization.
The specifications above focus on the monetized commodity alone. The estimated impact of monetization can be potentially confounded by changes in time trend. We can further expand the scope of our analysis by including other related commodities as dependent variables. These other commodities can be close substitutes, complements and other major agricultural commodities, in consumption or production. Consider commodities with their prices denoted by . In particular, we index the monetization commodity with . We now have a system of equations:
In this multi-equation system, captures the likely changes in time trend for the -th commodity, and the key parameter estimates the impact of monetization on the monetized commodity. This richer specification allows us to estimate the monetization impacts on the commodity in question and its likely spillover to other commodities. Averaging these estimated inter-temporal profiles gives us the average treatment effect of the problem.
Despite that the price and quantity variables were generally increasing during the sample period, the inclusion of time trends remove the trends. We further consider possible structural breaks in some of our models to account for the potentially abrupt and consistent impacts of monetization for the price and quantity dynamics in question.
5. Identification of Substitute Commodities: The Peruvian Case
According to the USDA data, three roughly equal-sized tranches of Crude Degummed Soybean Oil were delivered to Peru in May 2019, December 2019 and November 2020 respectively. The total quantity is 207,750 metric tons. The monetization prices of these three tranches are $630, $729 and $810, and the total value of monetization is $73,154k. We include in our sample data up to year 2020, when the last tranch of Soybean Oil was delivered.
This commodity is produced only in insignificant quantities in Peru. Hence the substitutes are likely to be on the demand side. The main uses of CDSO are as an input into processed foods and industrial products, as suggested by the companies listed in Table 2. Hence the search for possible substitute products examined the import and production quantities of vegetable oils and also maize because of its versatililty also as an input for various processes.
Table 3 shows these data for a recent year, highlighting potential substitutes for CDSO. It can be seen that the most significant imported products by a large margin are maize, soybeans and soybean oil. On the production side, oil palm and maize dominate as possible substitutes for CDSO. Hence in the estimation of equations variables for these products were included except for “green” maize (in the FAO categorization). That form of maize was not included in the equations below because it is for human consumption, and CDSO is an input into various processing industries. The equations are estimated over four product series: soybeans and soybean oil imports, oil palm fruit production, maize production, and imported maize.
For the estimations, the quantities of soybean cake and soybean oil are converted to their equivalent soybean quantity using the conversion factors of 1.236 and 5.607 respectively, based on the conversion ratios in the soybean processing industry. The price of soybeans is then calculated as the total value of imported soybean products divided by the total quantity of soybean equivalent. During the sample period, the average amount of soybean oil imported increased steadily from around 100k metric tons to 500k metric tons, peaked in year 2019 (526k metric tons, net of monetization). The share of monetized soybean oil in total imports in years 2019 and 2020 are 2.6% and 3.0% respectively. When converted to soybean equivalent, the monetized soybean oil amounts were 1.5% and 1.7% of total imported soybean products (soybeans plus soybean oil and soybean cake).
6. Exploratory Analysis for Peru
We start with some exploratory data analysis. Figure 1 below plots the quantity and price of imported soybean oil, net of monetization, during the sample period. The asterisks show where these variables would be when monetization is taken into account. Not surprisingly, its impact on price is negligible because the plots of plots with and without monetization effectively overlap. However, when commercial imports are used as an explanatory variable, it will be seen that the imports of soybean oil do have a significant impact on domestic variables. Monetized amounts are part of that picture at the end of the time series but it cannot be said that monetization alone is responsible for the observed effects.
Despite fluctuations in import prices, Peru has steadily increased its soybean oil imports during the sample period. During this period, the import of soybean oil increased five times (Figure 1). There was slight decline in year 2020, probably due to the covid-19 pandemic. Also apparent is the opposite directions in which the quantities and prices tend to move in recent years, highlighting increasing sensitivity of imports to international prices.
For the econometric analysis, the FAOSTAT data covered the period 1995 to 2019. To extend them to year 2020, 2015-2019 FAO data were used to create a splice with their counterparts from Peruvian sources.
Figure 2 displays the same kind of information for total soybean products imports, with adjustments for monetization indicated by asterisks. A similar pattern, including the five-fold increase in import quantity, is observed. Again, the monetization appears to have little impact on the average import price --- probably due to its small relative magnitude.
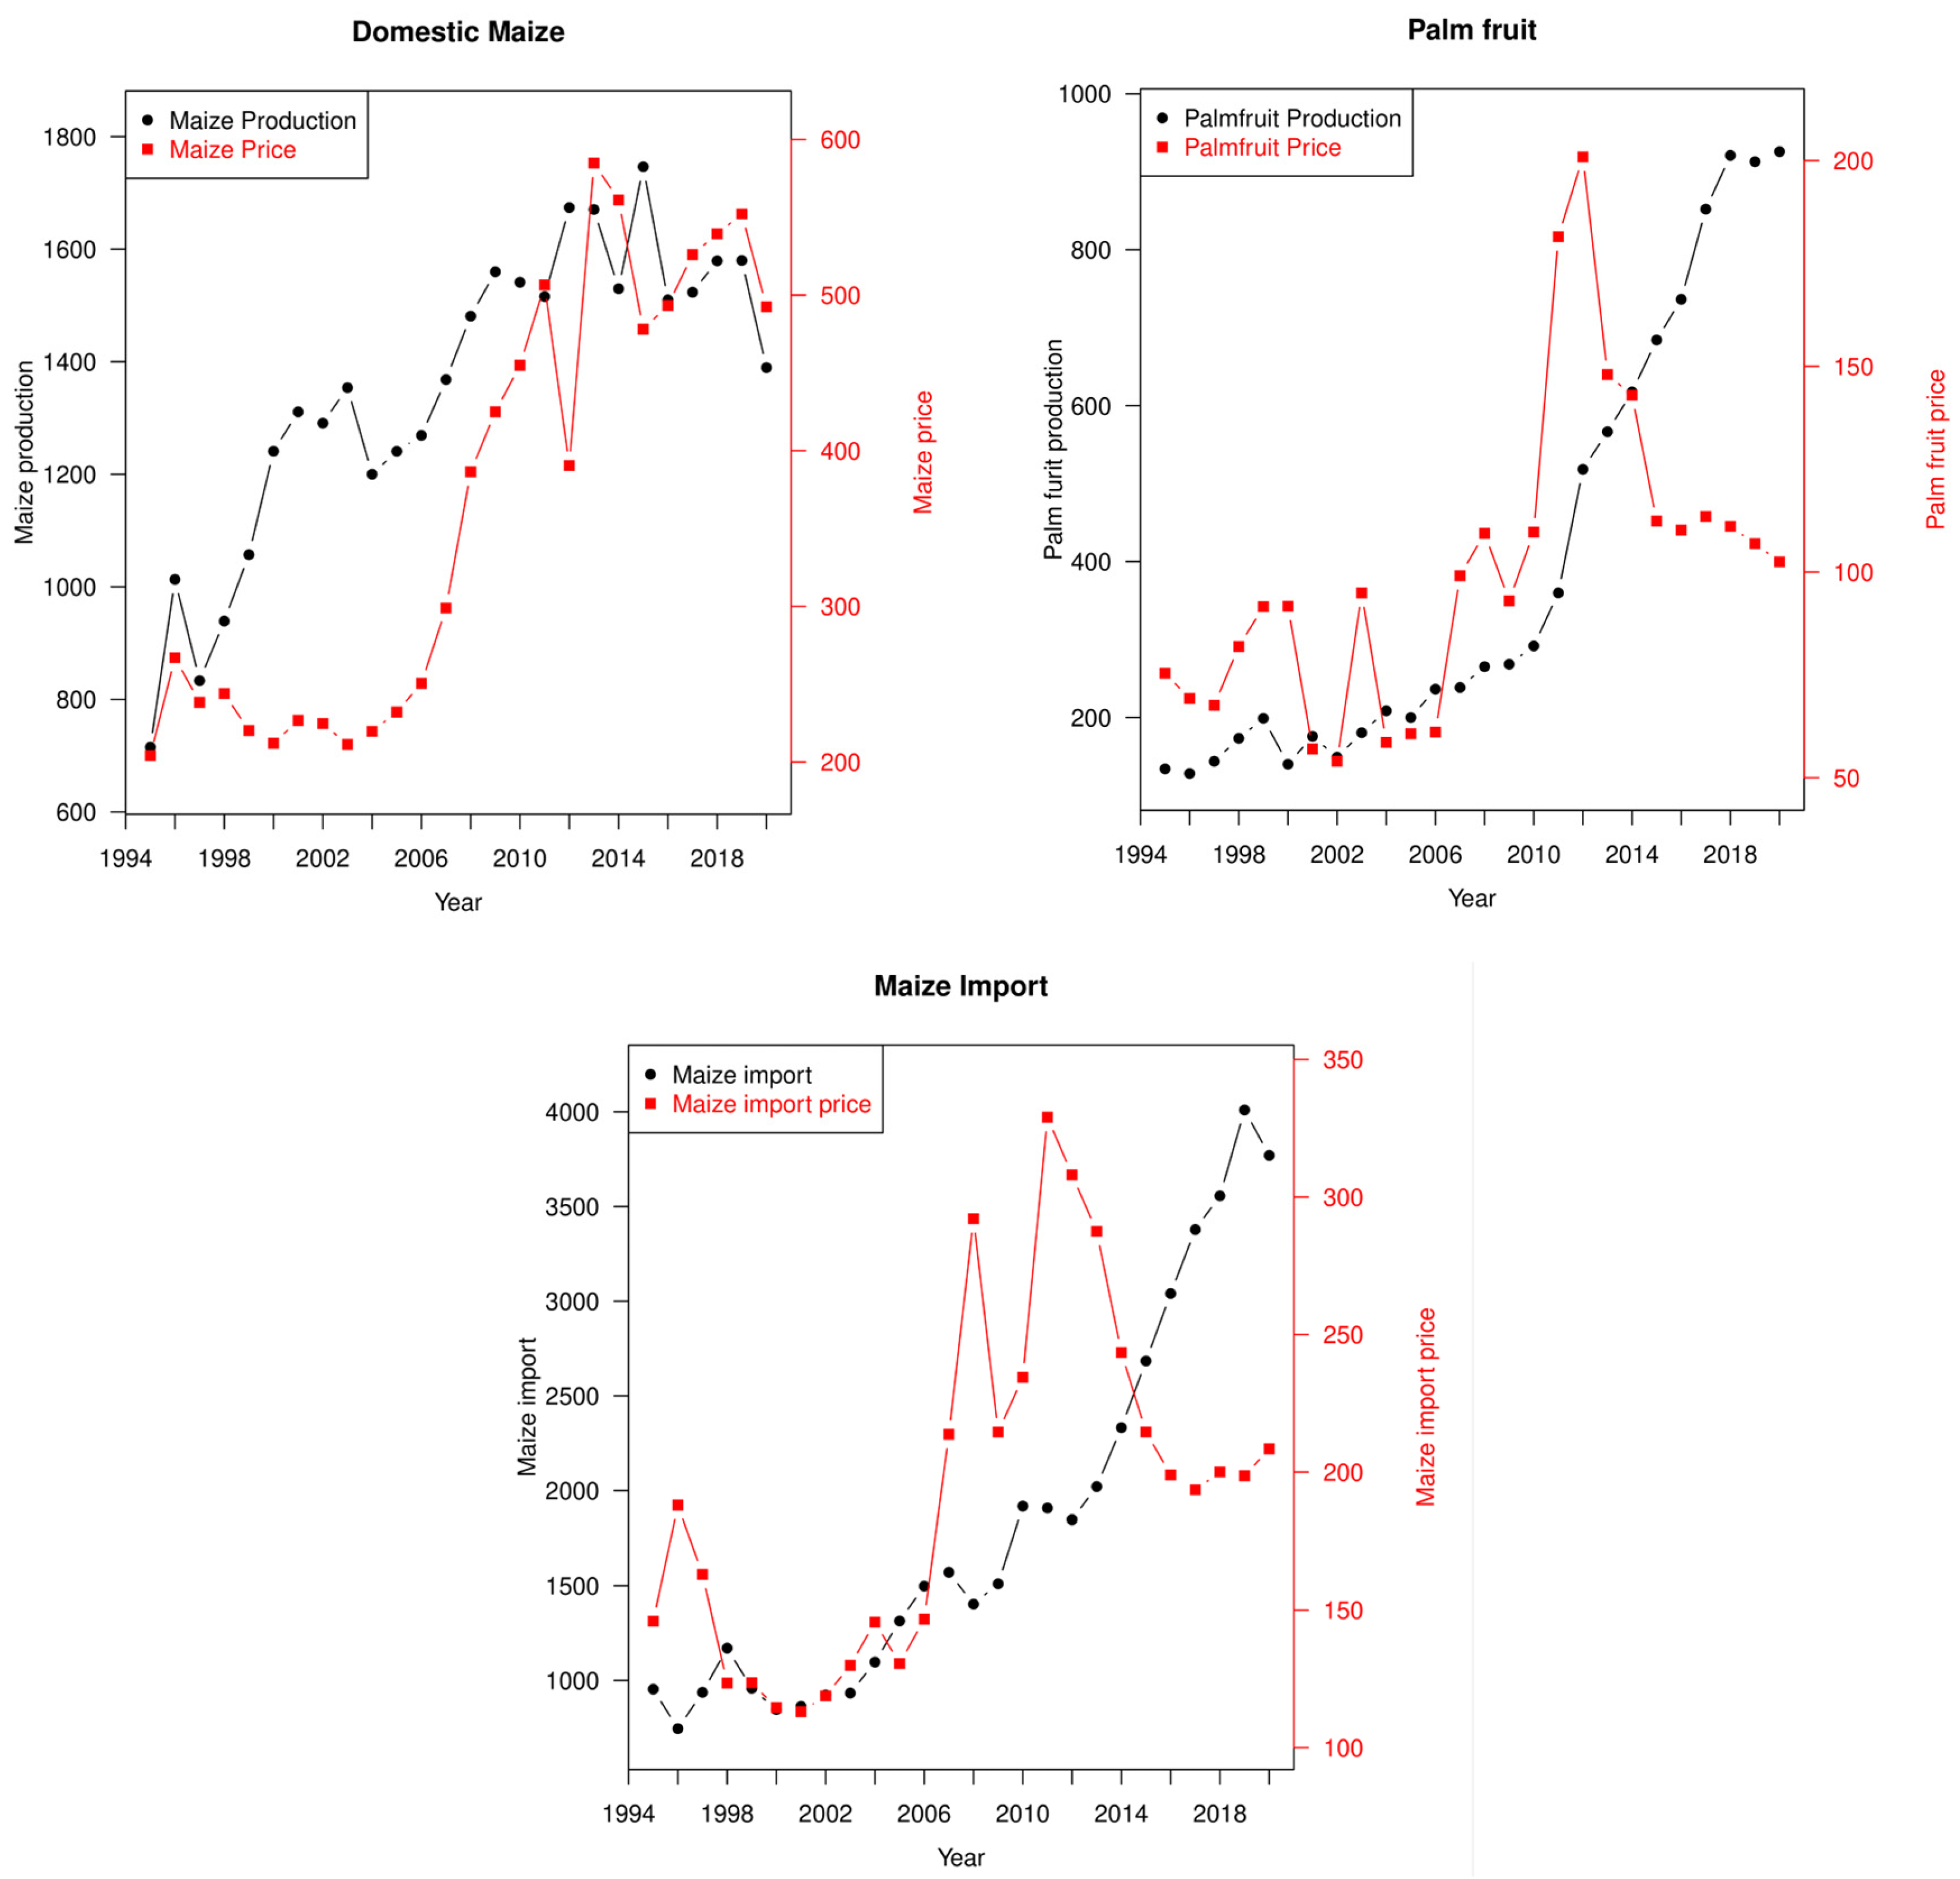
The next figure shows the same information for oil palm, maize production and imported maize. The production and export of palm oil has grown steadily during the sample period, fueled in part by increased international demand. The same period also saw some growth in maize production, but at a slower pace. At the same time, Peru’s import of maize increased substantially during this period, effectively quadrupling. (The oil palm price and production levels shown in the figure are at the farmgate level and hence they are for oil palm fruit –unprocessed).
Two observations are in order. First, the size and structure of Peru’s economy prescribe that its imports and exports are heavily influenced by the international market. This is evident from the fact that the quantity and price of trade-related products (imports of soybean oil, soybean products and maize, and export of palm oil, a major export of Peru) tend to move in opposite directions. Second, most of their quantities exhibit an apparently linear and rising time trend throughout the observation period. As part of the exploratory analysis, we fitted a simple linear time trend model to soybean oil and total soybean products imports to investigate whether there are deviations from the projected trends in the last two years of the sample periods when the monetizations took place. The results for the imports of soybean oil and soybean products are plotted in Figure 4 below.
Figure 3.
Quantity and price of oil palm fruit production, maize production and imported maize.
Also plotted are the 95% confidence interval bands. These quantities are observed to flunctuate modestly around a linear time trend, and during the entire observation periods, the deviations from the time trend seem to have no obvious outliers. Despite the COVID pandemic, the imports of soybean oil and soybean products in the last two years closely follow the linear historical trend, as in earlier years. This reinforces the conclusion that commercial imports of soybean products and oil were adjusted to take into account the (foreseen) monetization amounts. Thus monetization per se did not affect the behavior of these variables and their impacts on the domestic economy, although the increasing total amounts of soybean product imports did have effects, as the econometric analysis shows. Hence the term equations (3) and (4) above did not turn out to be relevant.
Figure 4.
Soybean oil and soybean products imports vs linear time trend.
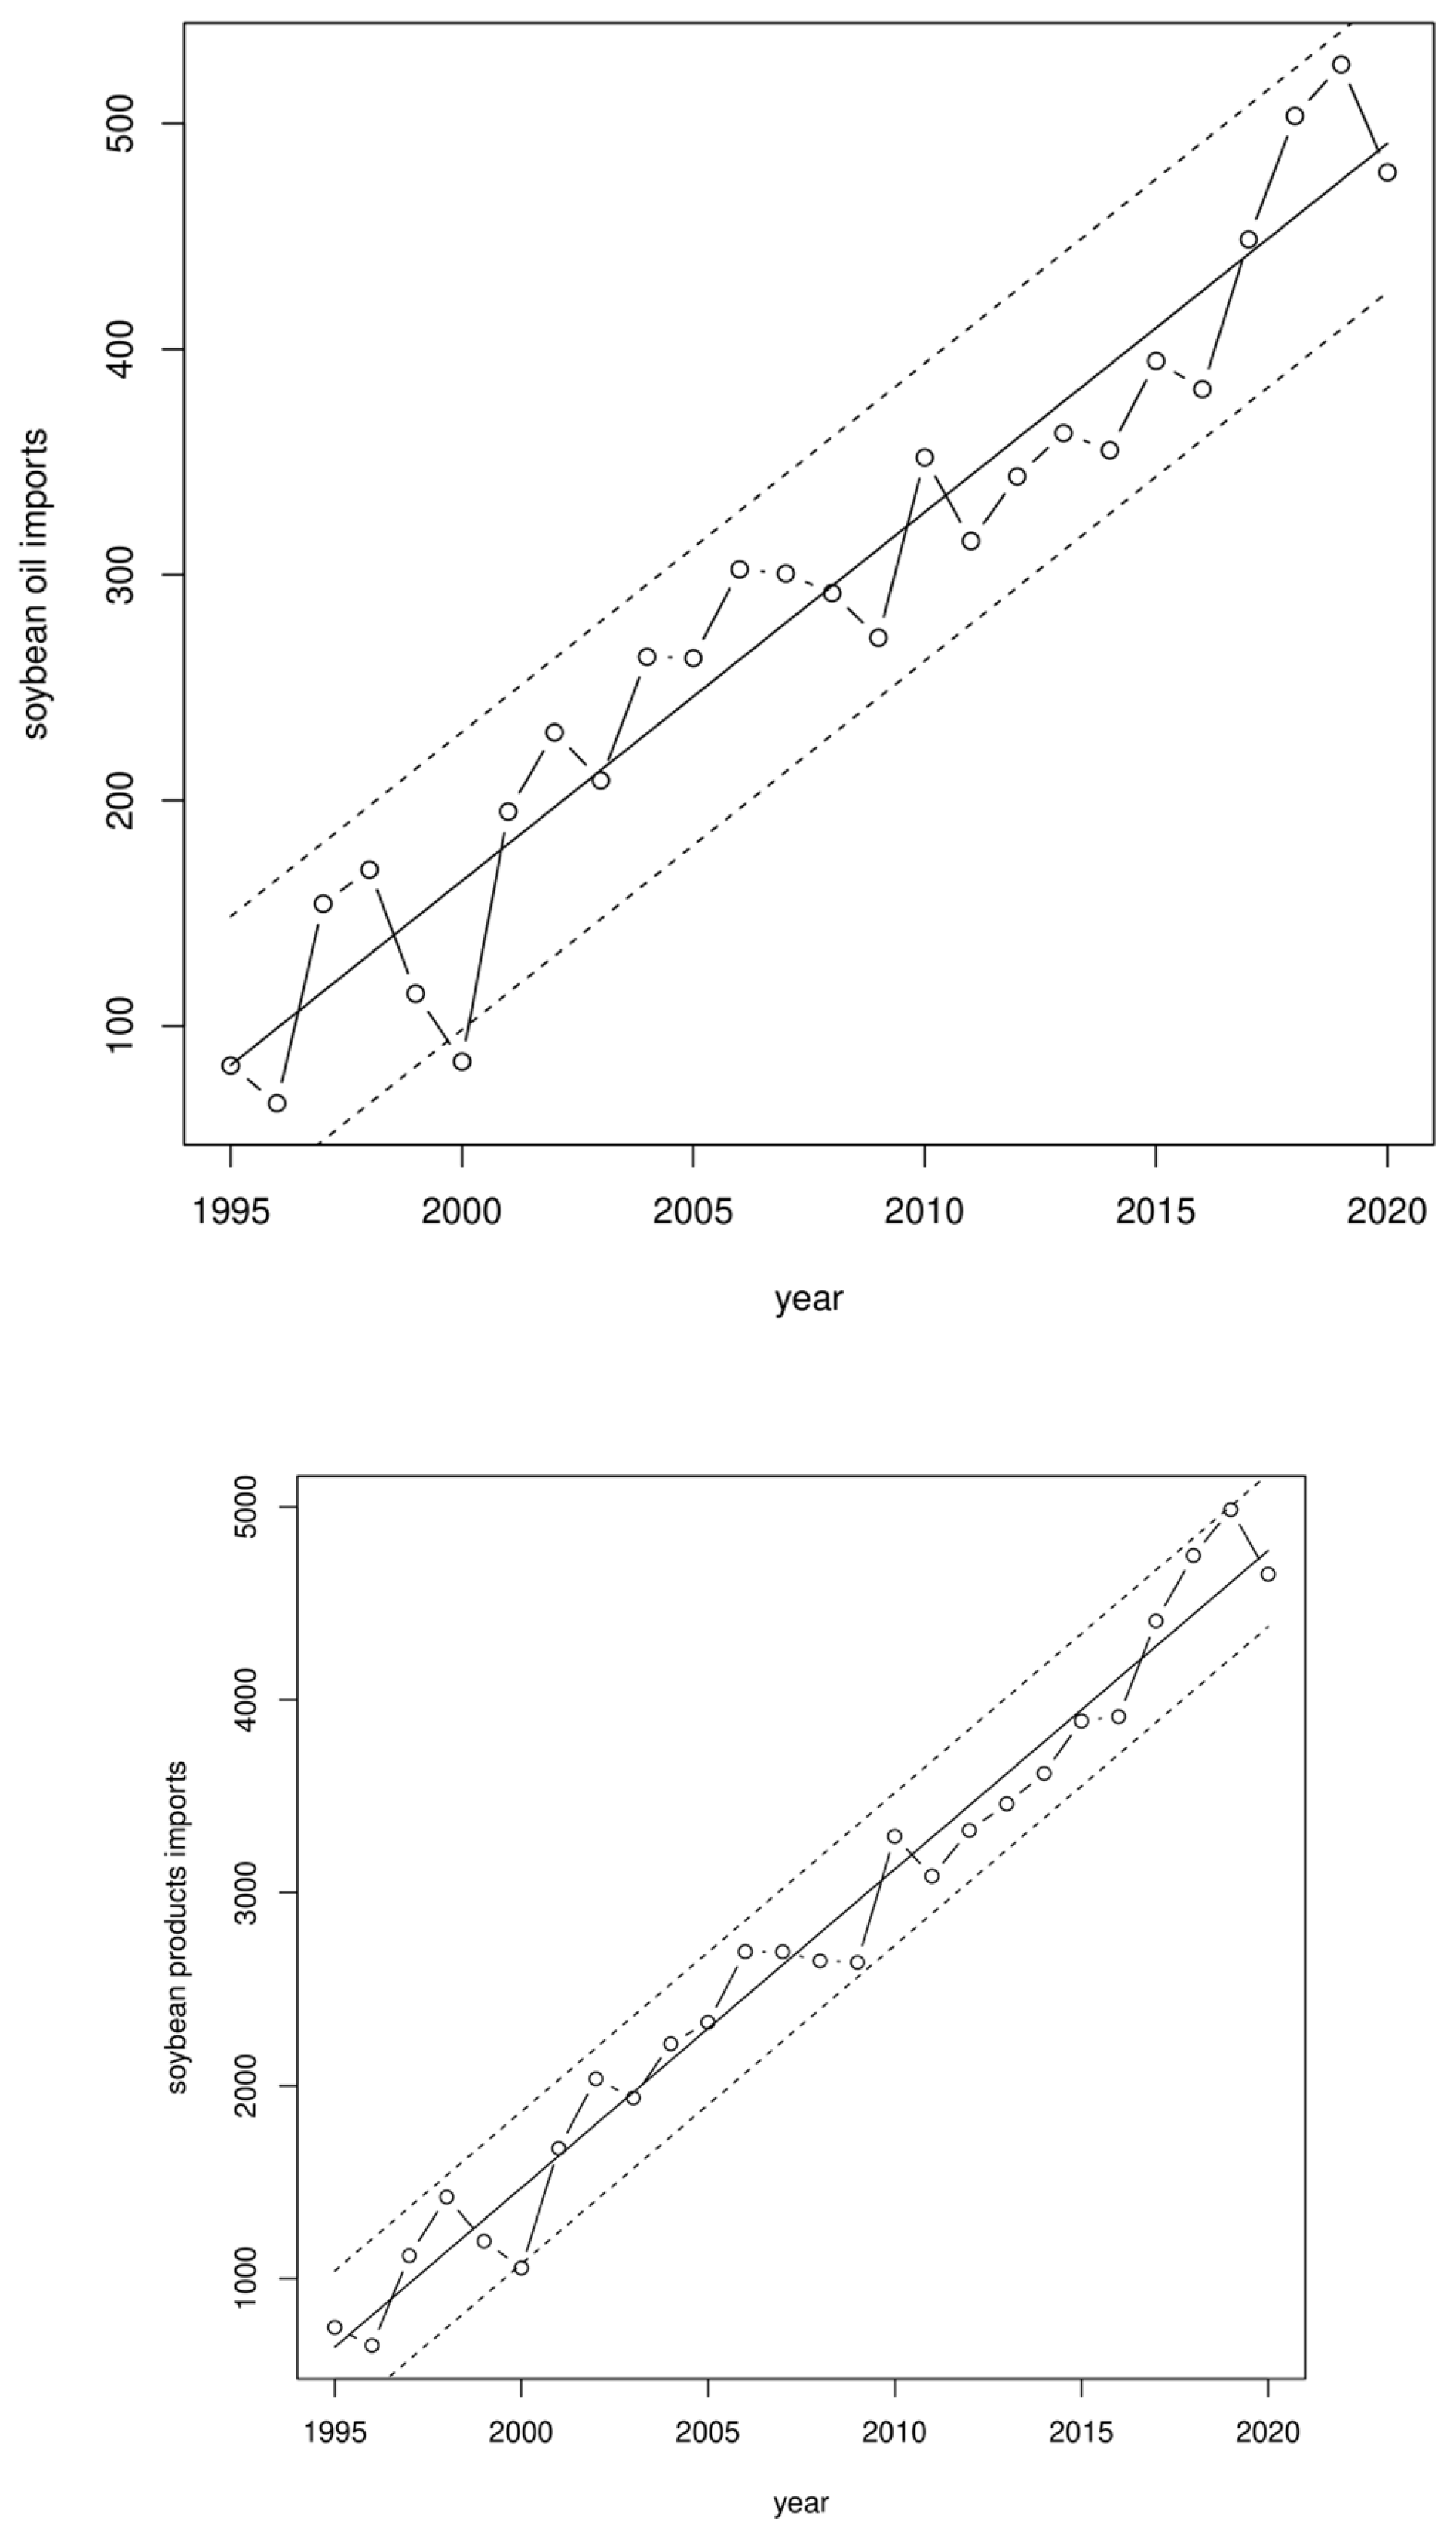
Figure 5 below plots the other quantities against their time trends. A similar pattern is observed, indicating that the monetization did not influence the production or imports of those closely related products either. The declining trend in maize production after 2015 appears to be associated with the rising trend in maize imports in those years, but the variations are within the 95% confidence interval around the time trend.
7. Regression Estimation Results for Peru
We use the following notation on the variables in our regressional analysis: soybean products (), oil palm fruit (), maize production (), and maize imported (). In addition, we use (in US dollars) to denote price, (in 1000 metric tons) for quantity and (in year) for time. For example, and denote the (import) price and quantity of soybean products in year , and and denote the quantities of domestic production and imported maize in year .
8. Oil Palm
Next, regression analyses was used to explore the potential impacts of monetization on the production and prices of palm fruit and maize in Peru.
Regarding oil palm fruit, the following regression equation was considered for its price:
where the subscript indicates that its corresponding quantity is lagged for one period. In this model, the current price of palm oil was regressed on the current quantity, its own lag, current price and quantity of soybean product imports, and a quadratic time trend. The only variable that turned out to be statistically significant was the price of soybean products imports, with a coefficient estimated at 0.51 with a p-value of 0.002. Since processed palm fruit is in direct competition with soybean oil, we also estimated an alternative model, replacing the quantity and price of soybean products with those of soybean oil alone in equation (5). The results are qualitatively similar with the coefficient of the soybean oil price being the only significant one, estimated at 0.12 with a p-value smaller than 0.001. The conclusion is that the domestic Peruvian price of palm oil is affected by the international price of imported soybean products (and soybean oil alone). We also conducted the augmented Dickey-Fuller test of the regression residuals. The test statistic is -3.33 and does not reject the null hypothesis of stationarity at 5% significance level.
Note that the difference in the coefficients above is largely due to the difference in the prices of overall soybean products and soybean oil. The elasticity of oil palm fruit price with respect to soybeans was calculated in these two models, and rather similar results were obtained (0.98 with respect to overall soybean products and 0.91 with respect to soybean oil.)
Two alternative specifications were then considered to explore the robustness of the results vis-à-vis model specification: (i) drop the lagged palm fruit price; (ii) further drop the linear and quadratic time trends. The results remain qualitatively similar, with the coefficient for the soybean products price estimated at 0.52 and 0.54 under these two variants respectively. Both were statistically significant at the 1% level.
The model for production of palm oil is as follows:
The coefficients for lagged palm fruit production and lagged price are both significant in equation (6), estimated at 0.57 and 0.85 respectively, both significant at the 5% level. Similar to the model on price we considered, alternatively, soybean products and soybean oil for the variables and on the right hand side. It turns out that the results are quantitatively similar. In both instances, the only significant variable is the lagged production of palm oil, estimated at 0.61 with a p-value of 0.01. In addition, we also estimated the model without the time trend. The results are again quantitatively similar. Overall, our results suggest that Peru’s production of oil palm fruit is strongly autocorrelated with past production and price, but is not influenced by soybean oil or soybean products. This autocorrelation is not suprising since oil palm is a long-cycle crop. We also conducted the augmented Dickey-Fuller test of the regression residuals. The test statistic is -3.39 and does not reject the null hypothesis of stationarity at 5% significance level.
9. Maize
We next look at the Peru’s maize production. Green maize is also grown in Peru, but on a substantially smaller scale than other maize and is produced for human consumption instead of industrial uses, and hence it is not considered in our analysis. Since Peru imports a considerable amount of maize, we take into account both the imports of maize and soybean products in thr analysis. Our model for Peru’s maize price is as follows:
The estimation results for equation (7) indicate that the only variable with a marginally significant coefficient is the price of (imported) soybean products, estimated at 1.35 with a p-value of 0.07. We repeated the estimation of the model without the lagged maize price, and the results are quantitatively similar with the coefficient for the soybean price estimated at 1.36 with a slightly improved p-value of 0.03. Dropping the time trend variables makes little difference. Hence the price of imported soybean products does have an effect on the price of its substitute, maize. We also conducted the augmented Dickey-Fuller test of the regression residuals. The test statistic is -3.07 and does not reject the null hypothesis of stationarity at 5% significance level.
The model for domestic maize production is as follows:
Besides a significant and increasing time trend, the only other variable that is marginally significant in the estimation of equation (8) is the contemporary maize import quantity, which is estimated at -0.37 (the expected sign) with a p-value of 0.08. This reflects the direct substitution between domestic and imported maize in its uses. We also considered an alternative specification with lagged production on the right-hand side. The results are quantitatively similar, with the coefficient for the maize imports estimated at -0.29 with a p-value of 0.11. We also conducted the augmented Dickey-Fuller test of the regression residuals. The test statistic is -3.41 and does not reject the null hypothesis of stationarity at 5% significance level.
Two similar models for the quantity and price of imported maize were estimated, putting the domestic maize production and price on the right hand side of the equations while keeping other specifications as before. For the import price regression, the only marginally significant variable was the price of soybean products, with a coefficient estimated at 1.36 with a p-value of 0.07. This is not surprising as the import price is largely determined by the international market, where the prices of maize and soybean often move in tandem.
Unlike its domestic production, Peru’s imports of maize can be well predicted by three variables: the previous year’s import, the domestic price, and the imports of soybean products. Their coefficients are estimated at 0.44, 1.34 and 0.44 respectively, all significant at the 5% level. The positive coefficient on the domestic price indicates that Peru’s maize imports are largely driven by domestic demand.
10. Summary and Concluding Remarks
In this study, we systematically have explored the potential impacts of US soybean oil monetization on Peru’s domestric price and product of soybean products and other related products, including oil palm and maize, in the context of complete economic and statistical specifications of the potential relations among the variables. Our main findings are as follows:
- Peru’s production of oil palm fruit, and production and imports of maize are heavily influenced by the international market. This is to be expected due to the size of its economy and strong reliance on the international markets with respect to these commodities.
- The domestic production quantities and prices of soybean and related products appeared to be influenced by the international price of soybean products, confirming that they are closely related substitutes.
- Our investigation indicates the monetization of CDSO in 2019 and 2020 had little effect on the production and trade of these substitutes. In the monetization years there did not exist noticeable deviations from the linear time trend of these variables during the sample period, despite the coincidence of the monetization and covid pandemic in 2019 and 2020. We also estimated the above models with time dummies for these two particular years in our sample. The coefficients of the dummy variables were consistently insignificant across all models.
- As explained above, the lack of the monetization’s disturbance to Peru’s domestric production and price of related agricultural products can be largely attributed to the small scale of monetization relative to the overall soybean imports (less than 3% of soybean oil imports and less than 2% of overall soybean products imports). However, larger monetized quantities could well have affected domestic prices and production of other edible oils because our findings show that the price of imported soybean products does affect domestic prices of maize and oil palm fruit, implying that the monetization of soybean oil in Peru contributed to those effects. Nonetheless, the role of monetization was marginal, owing to the quantities involved as mentioned, and does not appear to have been statistically significant. In addition, these monetizations were announced well ahead of their implementation and their potential impacts, if any, have been anticipated by the domestric producers and market participants and therefore internalized.
- In a broader context, the analytic methodology developed and applied in this paper represents an approach that can be used to analyze other cases, including for changes in trade policies. It represents a rigorous analysis that meets the requirements of the Bellmon Amendment to U. S. food aid legislation and which has not been applied heretofore.
ANNEX: Sources for Peruvian National Data for Splicing the FAO Series
The existing Peruvian data series, while generally comprehensive, were incomplete in a number of respects, often omitting data for one or more years. Therefore it was necessary to use multiple sources to construct the Peruvian national data series for the last six years. The sources were the following:
- For Peruvian agricultural imports:
- --Ministerio de Agricultura y Riego, Boletín Estadístico de Comercio Exterior Agrario, Sistema Integrado de Estadística Agraria, Perú, varias fechas, por ejemplo:
- --Ministerio de Agricultura y Riego, Dirección General de Políticas Agrícolas, Evolución del Comercio Exterior Agropecuario Peruano durante la Situación de Emergencia Sanitaria, Lima, enero de 2021:
- For agricultural import data for the year 2018:
- For production, farmgate prices:
References
- Adan, Mohamed Abdukadir (2023). The Effect of Food Aid on Agricultural Development in Bal’ad District. American Journal of Agriculture 5(3). [CrossRef]
- Barrett, Chris, Stephen B. and Janice G. Ashley, and Erin Lentz (2009). U.S. Monetization Policy: Recommendations for Improvement. Policy Development Study Series. The Chicago Council on Global Affairs. [CrossRef]
- Casey, Alyssa R. and Emily M. Morgenstern (2021). U. S. International Food Assistance: An Overview. Congressional Research Service. Report 45422. Washington, D. C. February 23.
- Catholic Relief Service (2012). Impacts of Food Vouchers on Local Markets, Reflections on CRS’ Experience in Niger. Baltimore.
- Donovan, Cynthia, Helder Zavale and David Tschirley (2010). The Evaluation of the Impacts of Title II Monetization Programs for Wheat and Crude Edible Oils in Mozambique, 1997-2007. Michigan State University International Development Working Paper 103. East Lansing, Michigan.
- Elayah, Moosa, Qais Gaber and Matilda Fenttiman (2022). From food to cash assistance: rethinking humanitarian aid in Yemen. Journal of International Humanitarian Action 7(11). [CrossRef]
- El Sitio Avícola (2013). https://www.elsitioavicola.com/articles/2341/el-mercado-de-granos-de-2013-se-vera-afectado-por-el-sector-avicola-peruano/.
- Gao, Simin, and Barrett E. Kirwan (2017). Does U. S. Food Aid Crowdout Local Food Production? Selected paper prepared for presentation at the Agricultural & Applied Economics Association’s 2017 AAEA Annual Meeting, Chicago, July 30–August 1.
- Informa Economics (2012). The Value of Food Aid Monetization: Benefits, Risks and Best Practices. Prepared for the Alliance for Global Food Security. November.
- Saldaña, Lira, and Jackeline Valery (2017). Estudio de Prefactibilidad para la Instalación de una Planta Productora de Aceite de Soya (Glycine max) Refinado. Trabajo de investigación para optar el título profesional de Ingeniero Industrial. Universidad de Lima, Facultad de Ingeniería y Arquitectura, Carrera de Ingeniería Industrial. Lima. Diciembre.
- Simmons, Emmy (2009). Monetization of Food Aid, Reconsidering U. S. Policy and Practice. Partnership to Cut Hunger and Poverty in Africa. June.
- U. S. Department of Agriculture (2024). Food for Progress Report, Fiscal Year 2023. Washington, D. C.
- Schnepf, Randy (2016). U. S. Food Aid Programs: Background and Issues. Congressional Research Service. Washington, D. C. September 14.
- U. S. General Accounting Office, GAO (2011). International Food Assistance, Funding Development Projects through the Purchase, Shipment, and Sale of U. S. Commodities is Inefficient and Can Cause Adverse Market Impacts. GAO-11- 636. Washington, D. C. June.
- U. S. General Accounting Office, GAO (2017). International Food Assistance:Agencies Should Ensure Timely Documentation of Required Market Analyses and Assess Local Markets for Program Effects. GAO-17-640. Washington, D. C. July 13.
- World Food Program (2025). Website https://www.wfp.org.
Figure 1.
The curves show quantity and price of soybean oil imported, net of monetization. The asterisks indicate inclusion of monetization data in the years when monetization occurred.
Figure 1.
The curves show quantity and price of soybean oil imported, net of monetization. The asterisks indicate inclusion of monetization data in the years when monetization occurred.
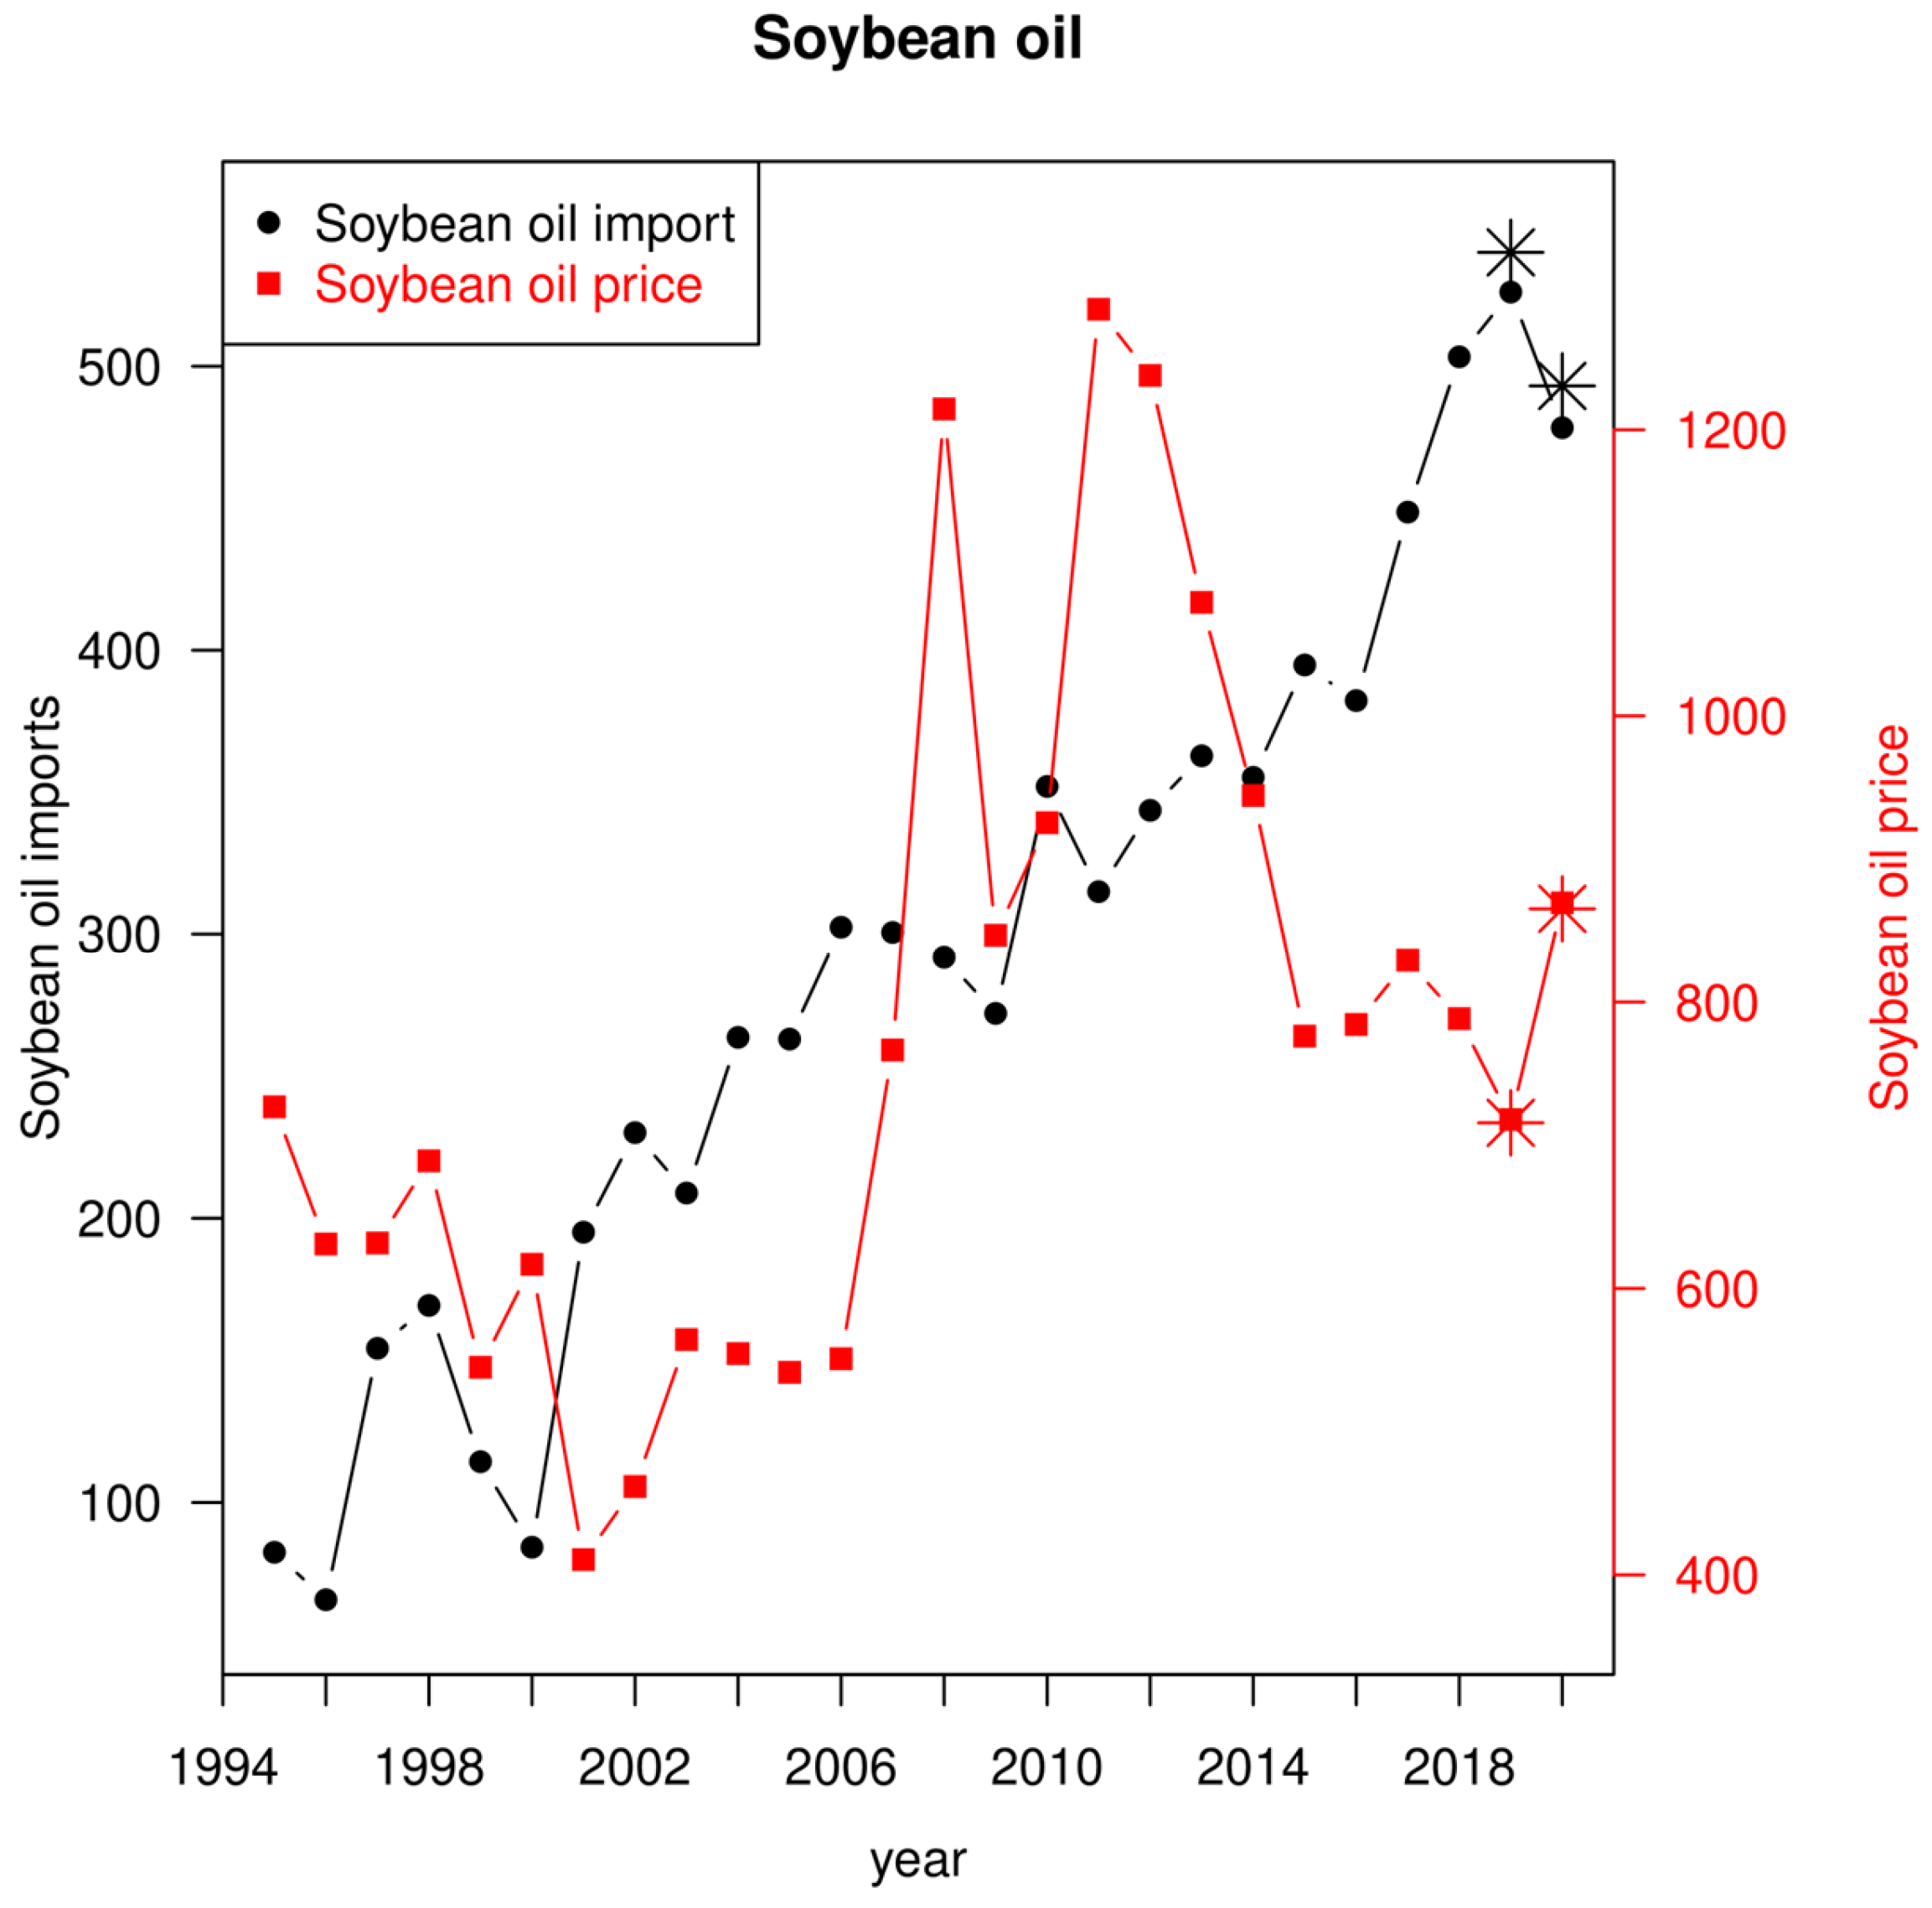
Figure 2.
Quantity and price of soybean products imported. The asterisked points indicate inclusion of monetization data in the years when monetization occurred.
Figure 2.
Quantity and price of soybean products imported. The asterisked points indicate inclusion of monetization data in the years when monetization occurred.
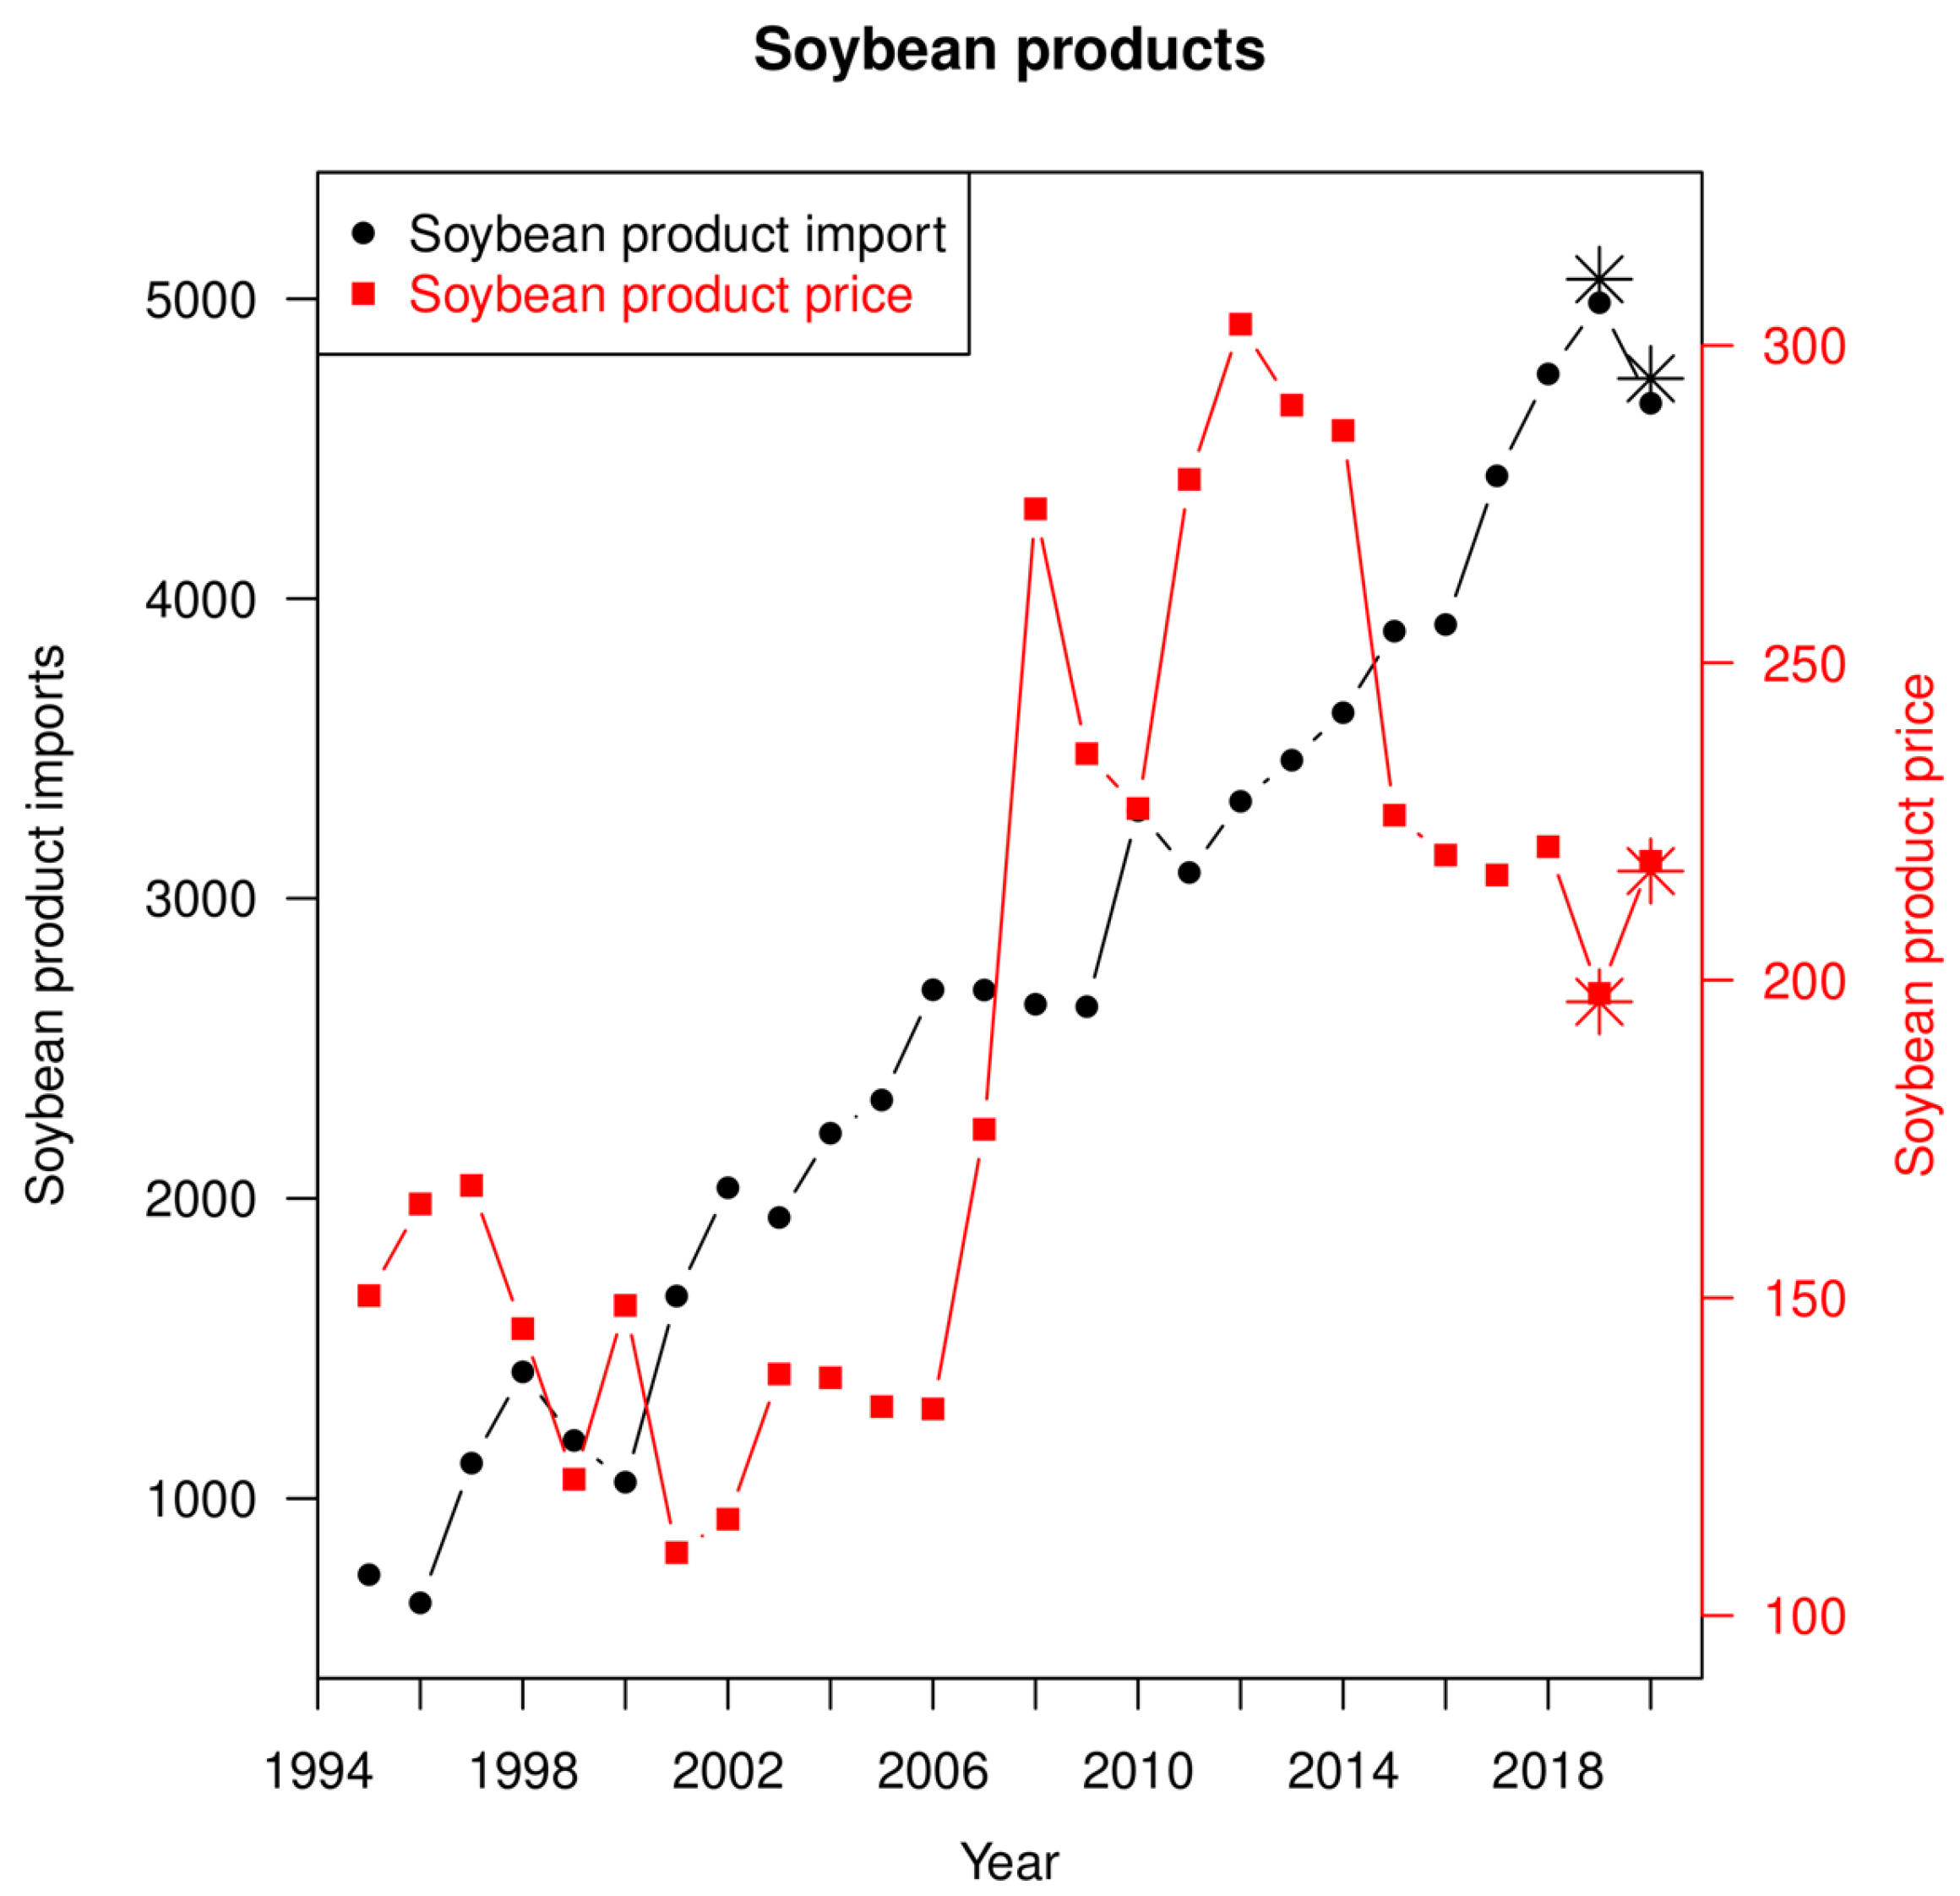
Figure 5.
Oil palm fruit production, maize production and imports vs linear time trends.
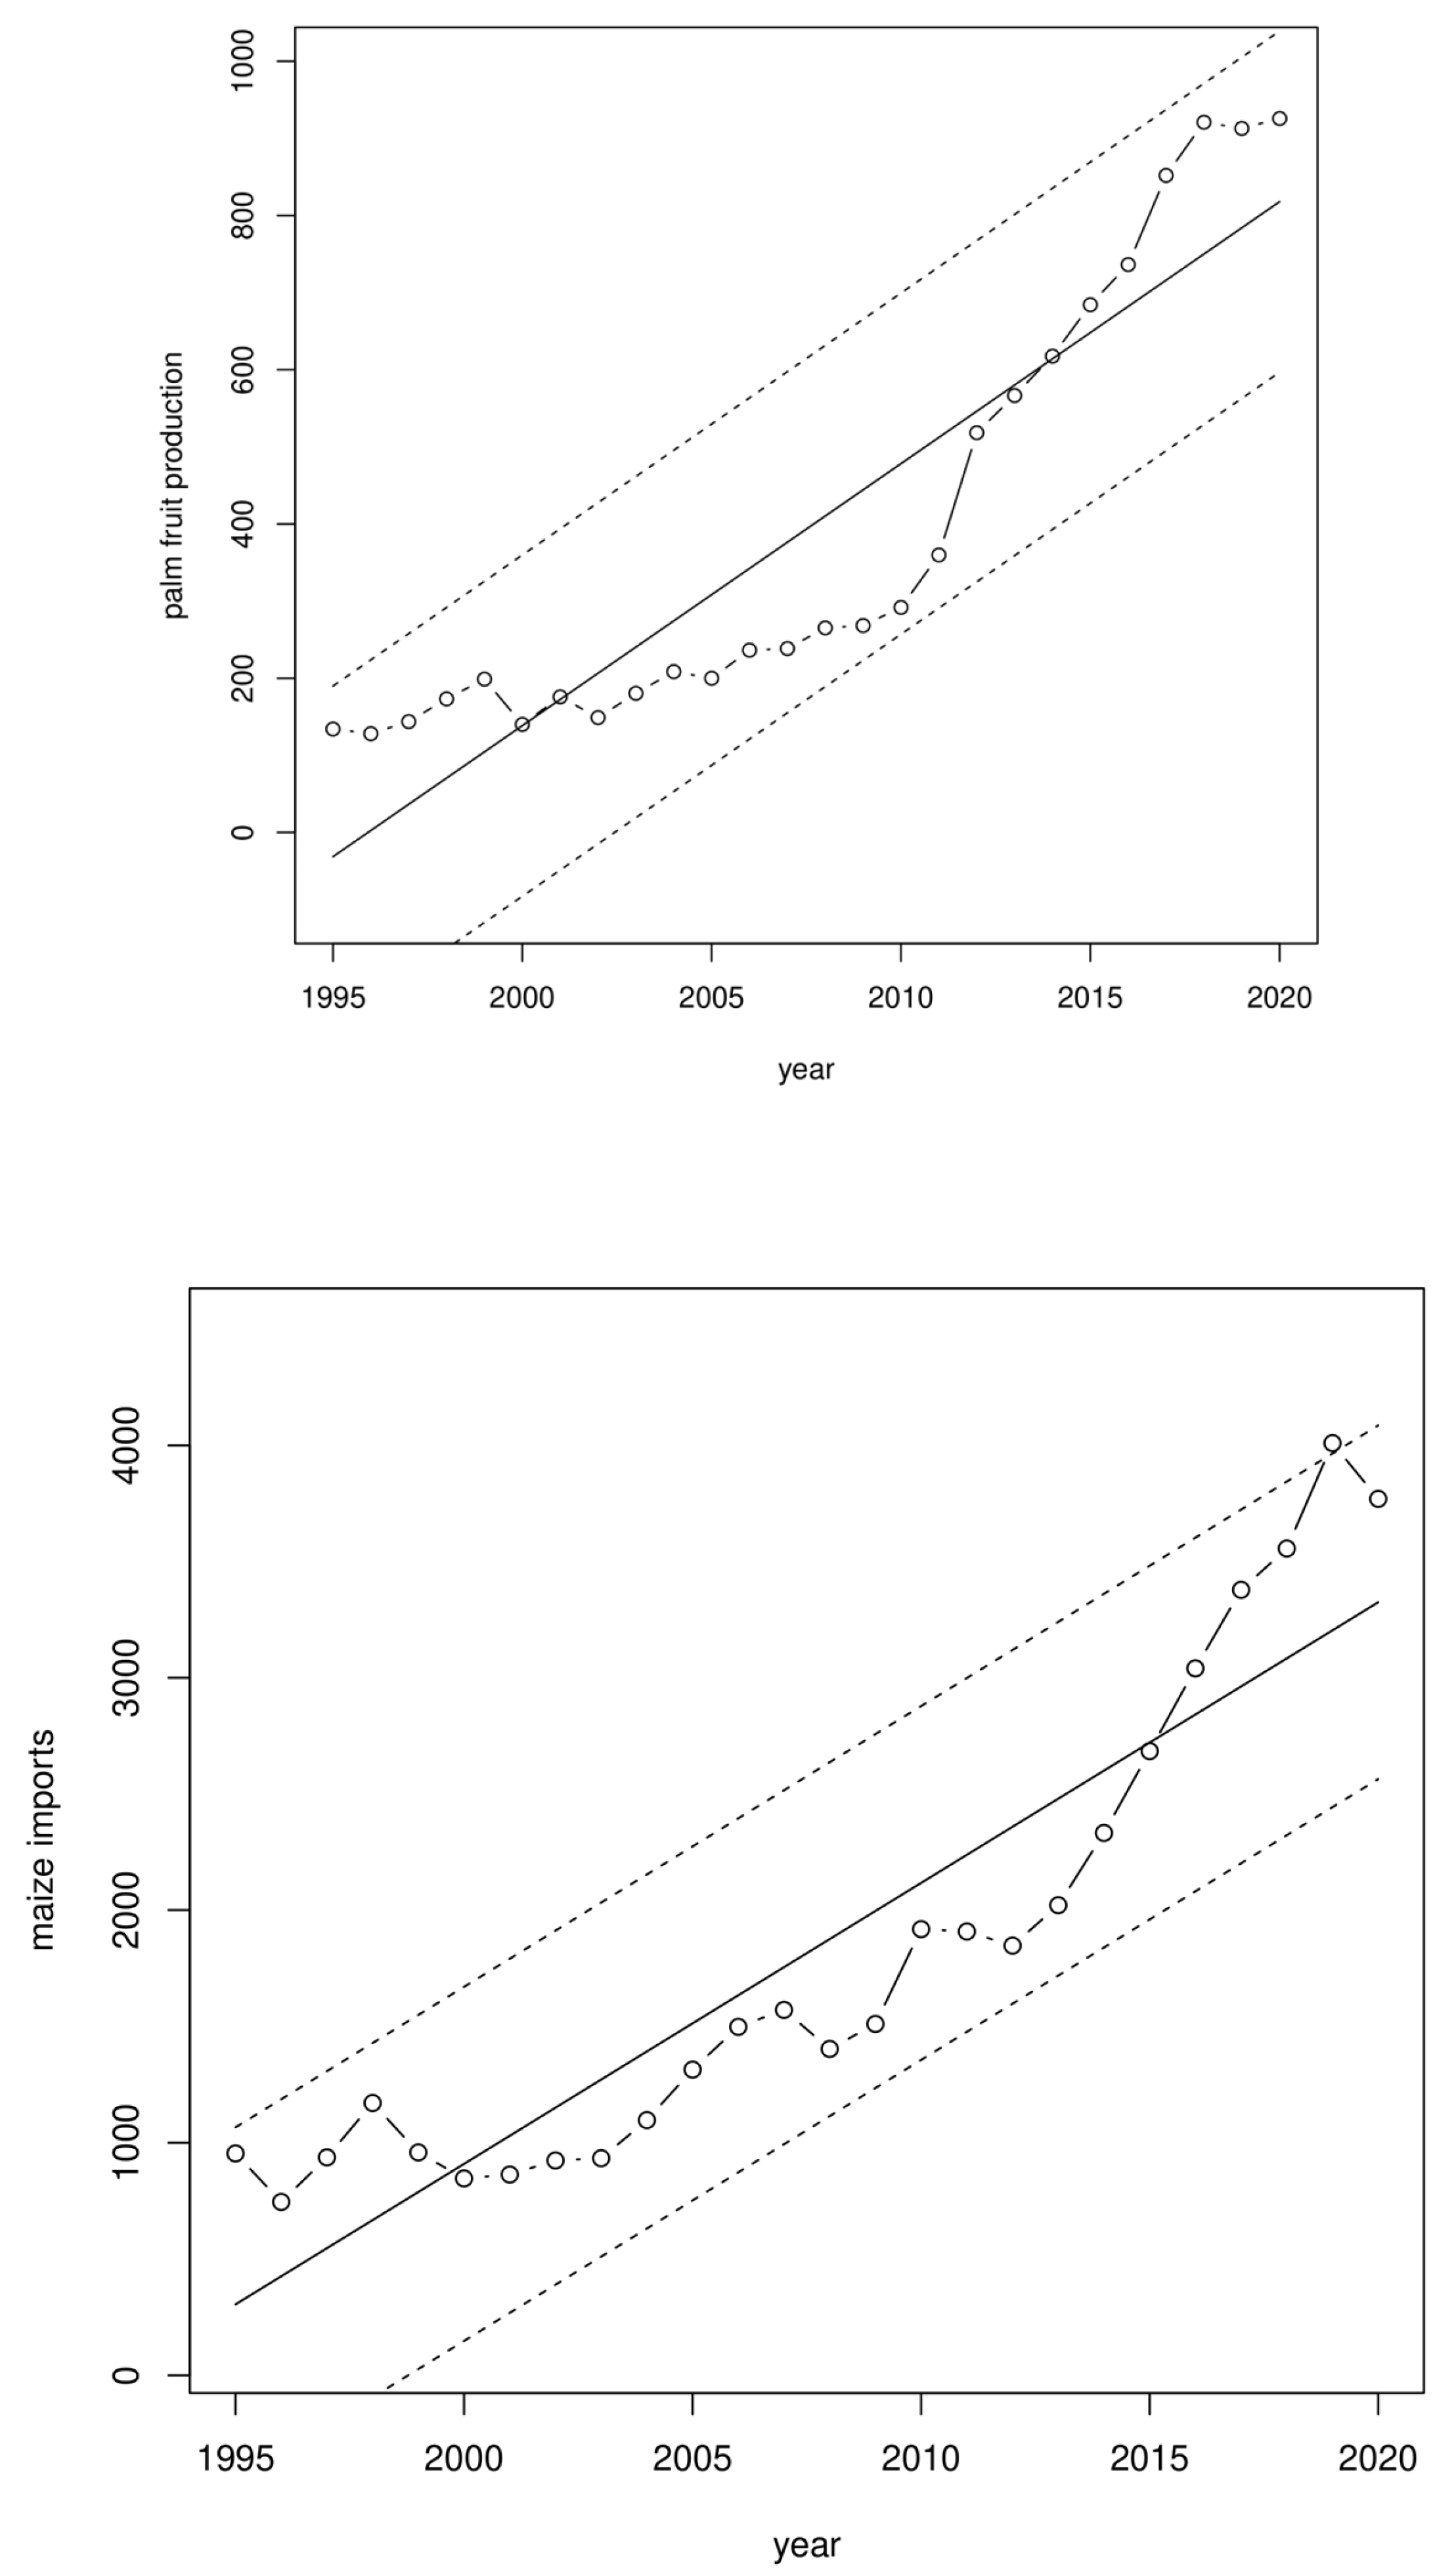
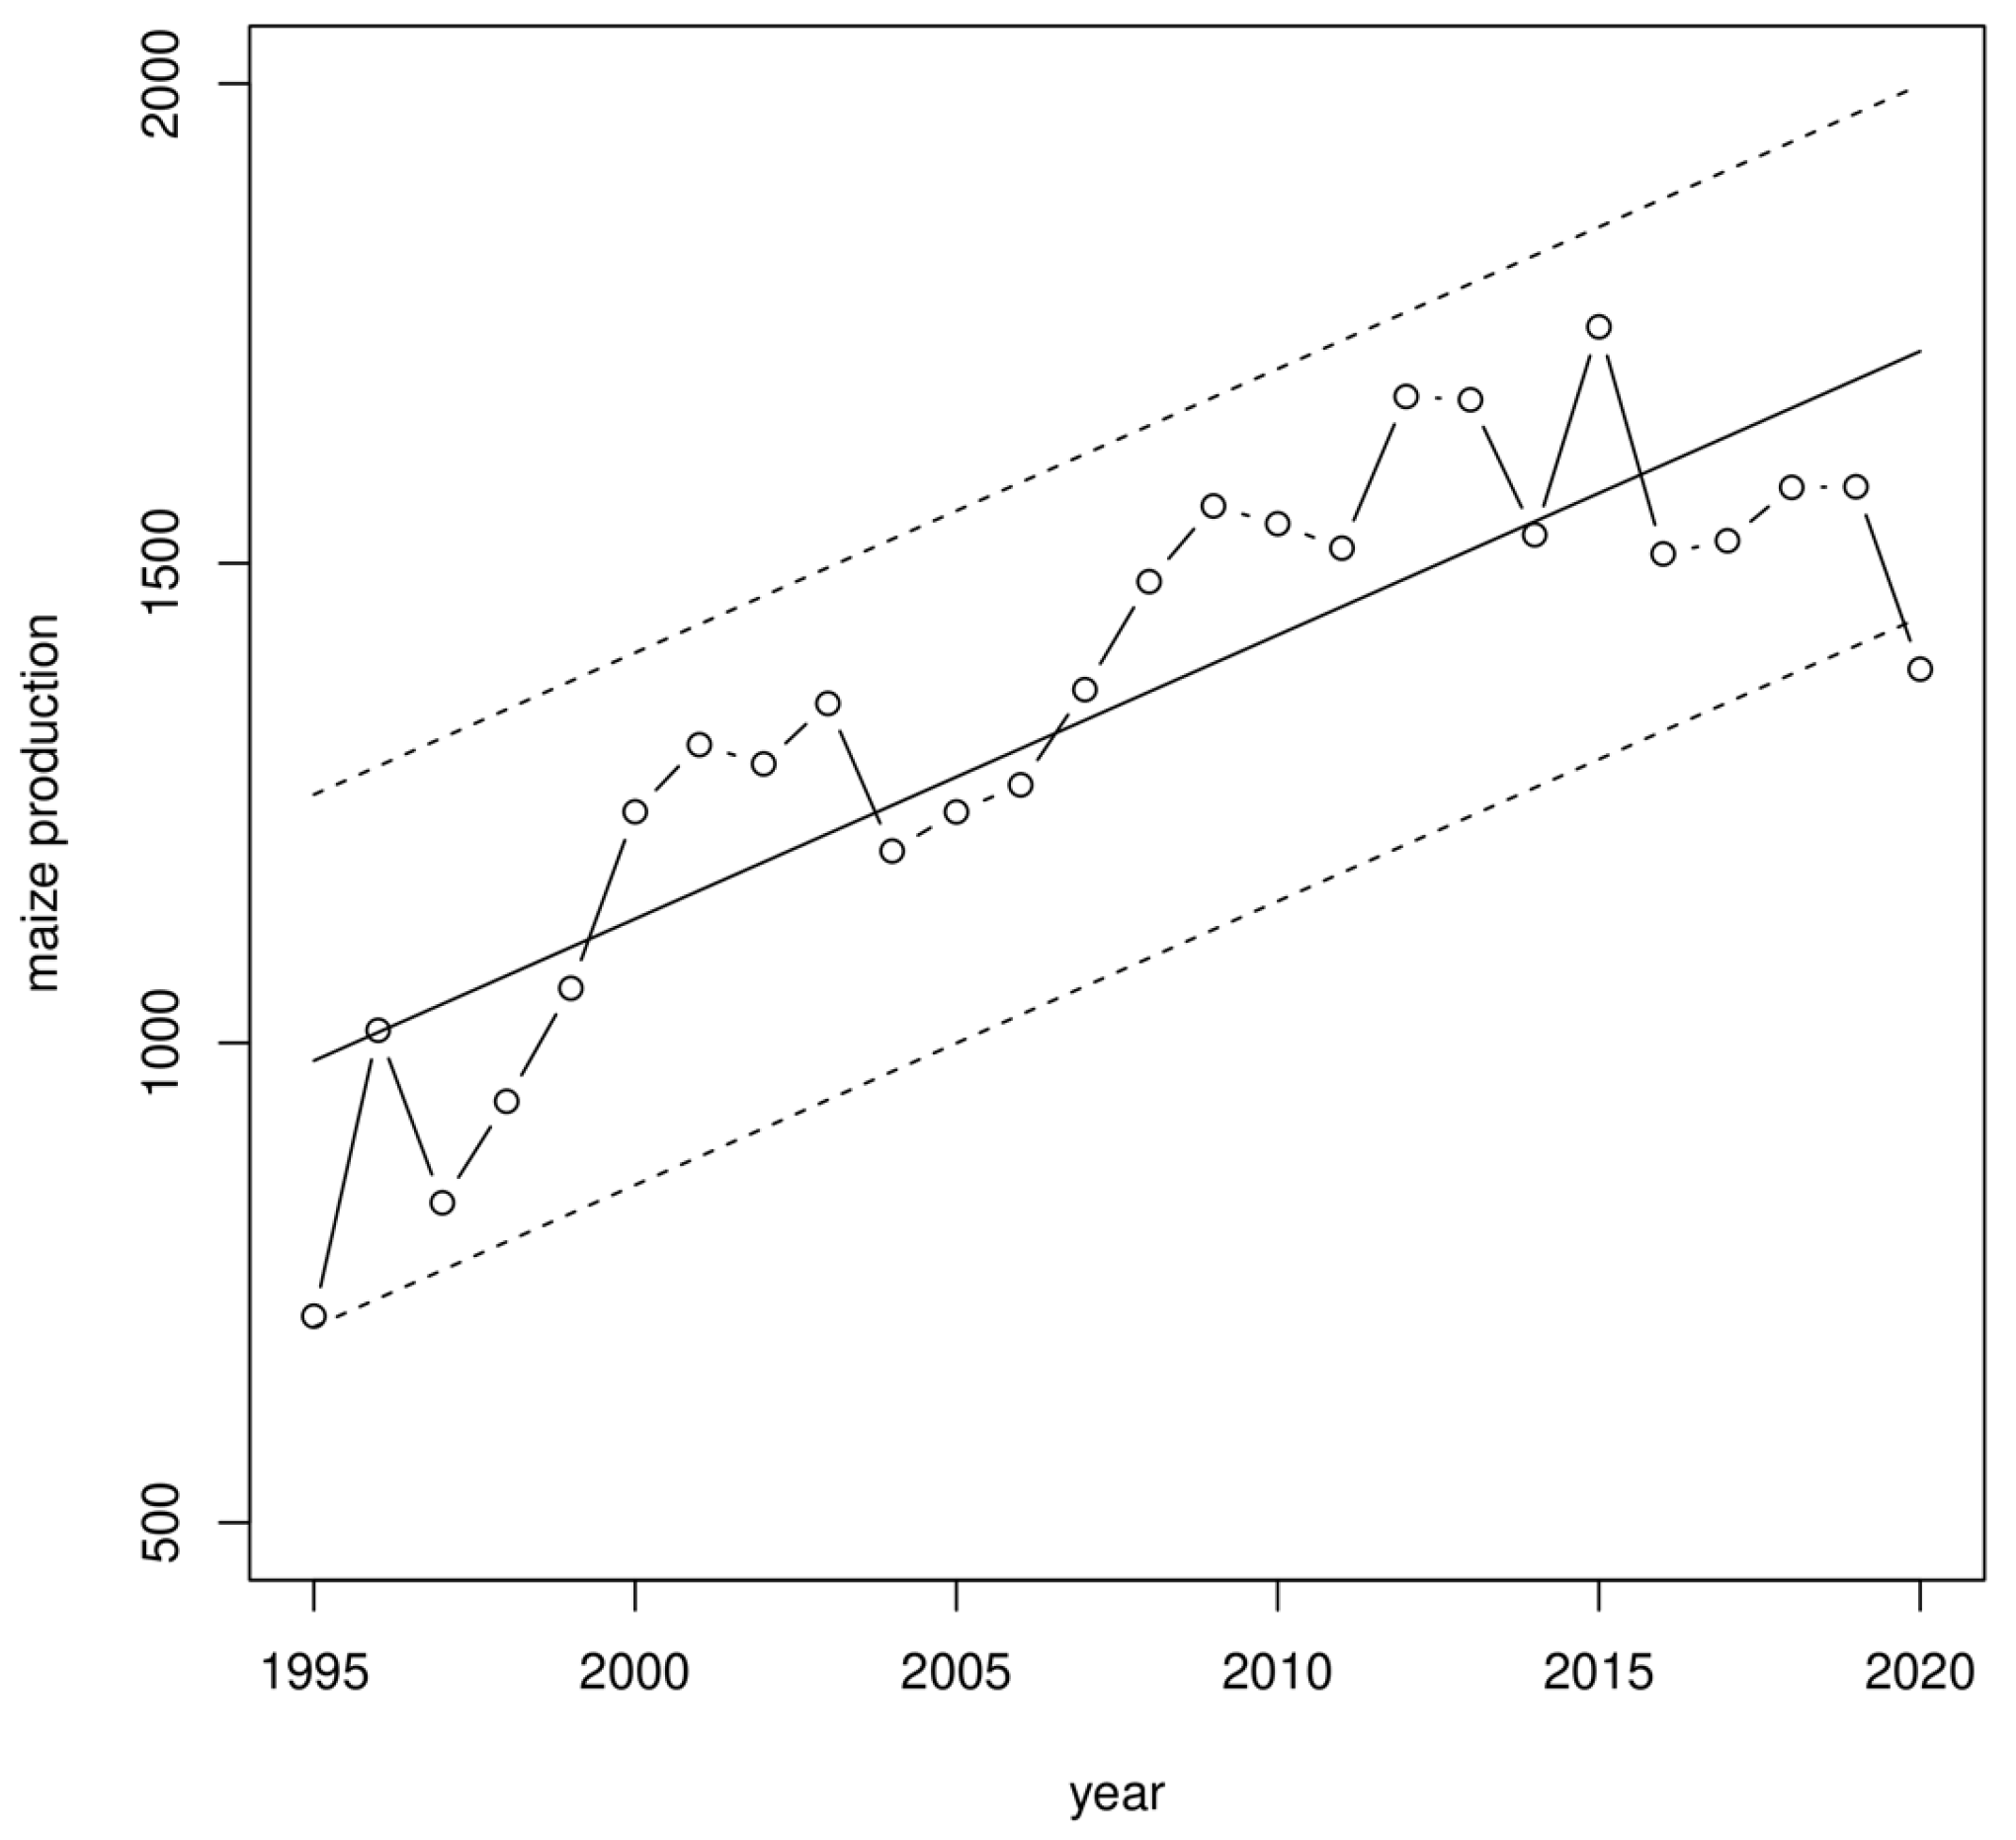

Table 1.
Peruvian Imports of Soybean Products by Supplying Country ($1,000).
| 2014 | 2015 | 2016 | 2017 | 2018 | 2019 | |
|---|---|---|---|---|---|---|
| Argentina | ||||||
| soybean cake | 114645 | 5,595 | 20,242 | 39,039 | 26,366 | 25,110 |
| soybean oil | 236435 | 179,871 | 234,088 | 331,554 | 281,499 | 320,533 |
| soybeans | 29507 | 21,525 | 37 | 166 | 0 | 5,606 |
| total | 380,587 | 206,991 | 254,367 | 370,759 | 307,865 | 351,249 |
| Bolivia | ||||||
| soybean cake | 372,500 | 220,829 | 230,699 | 245,364 | 301,499 | 278,259 |
| soybean oil | 13,260 | 10,774 | 19,329 | 18,018 | 17,029 | 13,049 |
| soybeans | 41,319 | 3,447 | 13,446 | 5,752 | 3,579 | 4,625 |
| total | 427,079 | 235,050 | 263,474 | 269,134 | 322,107 | 295,933 |
| Brazil | ||||||
| soybean cake | 41,319 | 875 | 63 | 59 | 0 | 142 |
| soybean oil | 39 | 11,600 | 11,494 | 21,802 | 20,568 | 23,841 |
| soybeans | 0 | 48 | 0 | 0 | 0 | 0 |
| total | 41,358 | 12,523 | 11,557 | 21,861 | 20,568 | 23,983 |
| Paraguay | ||||||
| soybean cake | 70,162 | 114,452 | 86,149 | 72,617 | 116,484 | 103,837 |
| soybean oil | 4,448 | 0 | 0 | 0 | 784 | 17,710 |
| soybeans | 42,261 | 57,528 | 14,082 | 53,304 | 17,643 | 15,209 |
| total | 116,871 | 171,980 | 100,231 | 125,921 | 134,911 | 136,756 |
| United States | ||||||
| soybean cake | 5,970 | 88,648 | 117,593 | 96,801 | 85,779 | 59,194 |
| soybean oil | 68,743 | 104,093 | 34,703 | 86 | 75,016 | 9,223 |
| soybeans | 24,484 | 57,900 | 61,435 | 56,234 | 100,398 | 116,159 |
| total | 99,197 | 250,641 | 213,731 | 153,121 | 261,193 | 184,576 |
Source: FAOSTAT.
Table 2.
Peruvian Imports of Crude Soybean Oil by Importing Enterprise.
| 2020 | 2021 through July | |||||||
| Enterprise | $ CIF | MT | $ share | Price/kg. | $ CIF | MT | Share $ | Price/kg. |
| Alicorp S.A.A. | 145,531,441 | 184,153 | 41% | 0.79 | 134,684,431 | 122,216 | 49% | 1.10 |
| Cargill Américas Perú S.R.L. | 145,197,074 | 189,707 | 41% | 0.77 | 103,465,410 | 92,451 | 38% | 1.12 |
| ADM Andina S.R.L. | 45,796,578 | 62,818 | 13% | 0.73 | 17,989,123 | 16,880 | 7% | 1.07 |
| Heaven Petroleum Operators S.A. | 12,521,910 | 16,811 | 4% | 0.74 | 12,841,151 | 11,667 | 5% | 1.10 |
| R. Trading S.A. | 1,469,458 | 1,965 | 0% | 0.75 | 1,663,600 | 1,507 | 1% | 1.10 |
| Río Grande Distribuciones E.I.R.L. | 172,584 | 229 | 0% | 0.75 | ||||
| Agropecuaria e Industrias Fafio S.A. | 155,267 | 196 | 0% | 0.79 | ||||
| Others | 881,525 | 1,098 | 0% | 3,573,591 | 2,364 | 1% | ||
| TOTAL | 351,725,836 | 456,976 | 100% | 0.77 | 274,217,306 | 247,086 | 100% | 1.11 |
Table 3.
Peru: Possible Substitutes for CDSO (crude degummed soybean oil). Uses of CDSO: --Margarine, shortening, dressing, baked goods, vegetarian products, animal feed--Paints, resins, plastics, varnishes.
Table 3.
Peru: Possible Substitutes for CDSO (crude degummed soybean oil). Uses of CDSO: --Margarine, shortening, dressing, baked goods, vegetarian products, animal feed--Paints, resins, plastics, varnishes.
| Product | Production (MT) | Imports (MT) |
| Almonds, shelled | 1,284 | |
| Cattle fat | 739 | |
| Cocoa beans | 134,676 | |
| Cocoa butter | 1,445 | |
| Cocoa paste | 1,327 | |
| Cocoa powder and cake | 2,407 | |
| Coconut | 32,923 | |
| Coconuts, dessicated | 985 | |
| Copra | 133 | |
| Groundnuts with shell | 5,705 | |
| Groundnuts, shelled | 13,048 | |
| Linseed | 880 | 2,037 |
| Margarine, short | 2,371 | |
| Maize | 1,569,535 | 3,556,225 |
| Maize, green | 434,969 | |
| Mustard seed | 1,102 | |
| Oil palm fruit | 921,001 | |
| Palm oil | 6,246 | |
| Pig fat | 943 | |
| Rapeseed oil | 284 | |
| Rapeseed cake | 675 | |
| Seed cotton | 44,195 | |
| Sesame seed | 378 | 2,389 |
| Sesame oil | 1,100 | |
| Soybeans | 310,041 | |
| Soybean cake | 1,308,446 | |
| Soybean oil | 503,342 | |
| Sunflower seed | 739 | |
| Sunflower cake | 29,094 | |
| Sunflower oil | 25,647 |
Note: Source, FAOSTAT. Most volumes less than 700 MT have been left out of the table.
Disclaimer/Publisher’s Note: The statements, opinions and data contained in all publications are solely those of the individual author(s) and contributor(s) and not of MDPI and/or the editor(s). MDPI and/or the editor(s) disclaim responsibility for any injury to people or property resulting from any ideas, methods, instructions or products referred to in the content. |
© 2025 by the authors. Licensee MDPI, Basel, Switzerland. This article is an open access article distributed under the terms and conditions of the Creative Commons Attribution (CC BY) license (http://creativecommons.org/licenses/by/4.0/).
Copyright: This open access article is published under a Creative Commons CC BY 4.0 license, which permit the free download, distribution, and reuse, provided that the author and preprint are cited in any reuse.


