Submitted:
08 April 2025
Posted:
09 April 2025
You are already at the latest version
Abstract
Facility agriculture can increase production efficiency and alleviate resource constraints. Its developmental level has become one of the most important indicators of the level of agricultural modernization worldwide. The Chinese government has attached great importance to the development of facility agriculture in recent years. Since 2020, the "No.1 Document" has continuously emphasized and deployed the development of facility agriculture. Global climate change has greatly impacted the traditional agricultural production that is vulnerable to weather changes, while the development of facility agriculture can to some extent alleviate the limitations of climate conditions on agricultural production. However, it is unclear whether facility agriculture can help alleviate the adverse effects of global climate change, i.e., reducing greenhouse gas emissions. In view of this, in this research, based on the data from the latest National Compilation of Cost and Benefit Data on Agricultural Products in 2022, the greenhouse gas emissions and carbon emission indicators of open-field and greenhouse cucumber productions in China were measured using the life cycle assessment method (the full cycle of agricultural ecosystems). Besides, the differences in greenhouse gas emissions between different cultivation patterns and provinces were explored, providing industry-level empirical evidence on how to vigorously develop facility agriculture while addressing global climate change. Finally, further discussions were made on how to reduce carbon emissions from facility agriculture based on the measurement results and conclusions. This research will provide reliable empirical basis for policy making and implementation and relevant academic research.
Keywords:
facility agriculture
; greenhouse gas emissions
; cucumber industry
; carbon assessment
; spatial heterogeneity
1. Introduction
Facility agriculture uses agricultural equipment and engineering technology to realize efficient agricultural production under controlled crop growth conditions. Its developmental level has become one of the most important indicators of the level of agricultural modernization [1,2]. Glass greenhouses appeared in the UK and the Netherlands as early as the 18th century, and modern facility agriculture was generally believed to have originated in the United States, Canada, and Germany in the 1950s. Initially, this technology was used in the planting of value-added vegetables, fruits, and flowers [3]. With the rapid development of globalization and agricultural science and technology, facility agriculture gradually emerges in all parts of the world, including Asia, Africa, and South America. Traditional Chinese facility agriculture can be traced to the Qin Dynasty, more than 2,200 years ago. At that time, the ancestors of the Chinese achieved the winter planting of melons by using the hot springs in the Lishan valley. China's modern facility agriculture begun to rapidly develop in the past 40 years. In view of the general conditions of "large quantities of small farmers, small farmland area per farmer" in China, the government has attached importance to facility agriculture in recent years. From 2020 to the present, the "No. 1 Document" has emphasized and deployed the development of facility agriculture. In 2023, the four major ministries/commissions of the State Council jointly issued the first National Modern Facility agriculture Construction Plan (2023–2030), aiming to standardize all departments and regions in the development of facility agriculture. To sum up, the importance of facility agriculture is continuing to increase globally, and the transformation and upgrading of China's facility agriculture face a good policy opportunity.
However, global climate change cannot be ignored in the development of facility agriculture. As is well known, climate change poses a dual challenge to agricultural production, i.e., agriculture is an important source of greenhouse gases [4], but also the most vulnerable industry to climate change. This forces policy makers and farmers to constantly adjust agricultural practices [5]. Chinese government puts forward the "dual carbon" goal at the 75th United Nations General Assembly, demonstrating the responsibility of China to promote global climate governance. In theory, facility agriculture has outstanding economic and ecological value [6]. Advanced greenhouses such as solar greenhouses and plastic greenhouses can achieve efficient utilization of land resources, improve ecological functions of agriculture [7], and promote energy conservation, emission reduction, and pollution mitigation [8]. For China with limited arable lands, facility agriculture may help ensure the supply of key agricultural products, but also has become a necessary path to realize agricultural modernization. As of 2023, the area of facility agriculture in China has reached over 2.85 million hm2, accounting for more than 80% of the world's total facility agriculture area. Therefore, the issue of greenhouse gas emissions from facility agriculture in China has been attracted much attention, and there is an urgent need for China's empirical evidence to answer how to vigorously develop facility agriculture while addressing climate change.
Theoretical deduction and practical performance are often difficult to fully match, and there is currently no consistent research conclusion on how facility agriculture affects greenhouse gas emissions. Some scholars have found that the concentration of carbon dioxide inside greenhouses is significantly higher than that outside greenhouses, especially in winter when greenhouses are like machines that produce greenhouse gases [9]. There are also studies that have found themulching can disrupt the energy balance on crop surfaces and the balance of soil respiration, damaging soil quality [7]. Besides, rapid expansion of facility agriculture also poses sustained challenges to land management [10]. However, some scholars have found that facility agriculture has a significantly positive effect on carbon emission efficiency in the eastern region of China [2]. Meanwhile, scholars have conducted research based on panel data from nearly 2000 counties in China (2013 – 2017), and found that the rapid development of facility agriculture has a significant effect on carbon emission reduction, although the carbon sequestration effect is not excellent [11].
Based on the existing research results, scholars have presented diverse analytical paradigms and research conclusions regarding technological advantages, ecological effects, and economic benefits of facility agriculture. However, limited by their differentiated policy backgrounds and research perspectives, there is currently a lack of in-depth exploration on whether protective agriculture intensifies or reduces greenhouse gas emissions. In view of this, this study selects China's vegetable industry, and uses the life cycle assessment (LCA) method [12,13] to measure the greenhouse gas emissions and carbon emission indicators of two production patterns: open field and greenhouse production. Then, this study further explores the differences in greenhouse gas emissions between different production patterns and provinces, and proposes emission reduction measures and development strategies based on the analysis results. The aim is to provide a reference for relevant policy making and implementation.
The remaining parts of this article are as follows: The second part systematically explains the reason for selecting the cucumber industry as a representative research object, data source, analysis methods, and calculation steps. The third part calculates the difference in greenhouse gas emissions between open-field and greenhouse production patterns based on dimensions such as carbon sequestration, net greenhouse gas emissions, and carbon emission evaluation, as well as different provinces of China. The fourth part compares the greenhouse gas emissions of open-field and greenhouse productions based on the calculation results, and explores the main contributing factors of carbon emissions and carbon sequestration, to propose corresponding emission reduction measures. The fifth part summarizes the research conclusions and prospects.
2. Data and Research Methods
2.1. Data Source
This study focuses on the vegetable industry and is based on the fact that facility vegetables account for more than 81% of the sown area of facility horticulture in China. At the same time, vegetables are the most widely cultivated and economically important crops other than basic food crops, and China is also the world's largest vegetable producer. In 2021, the sown area of vegetables was about 21,872,210 hm2, and the output reached 775,490,000 tons (Data from the National Bureau of Statistics). Categorical statistics show that cucumbers have the highest unit yield of all facility vegetable varieties. Cucumber, as a typical shallow root crop, has a weak nutrient absorption capacity and is more dependent on nutrient inputs [14]. In summary, the quantitative measurement of greenhouse gas emissions in China's cucumber industry is highly typical and representative.
The data of greenhouse gases related indicators, including yield, output, cost, profit, labor input, fertilization, manure application, pesticide input, plastic film mulching, and diesel consumption in the open-field and greenhouse cucumber productions, are sourced from the National Compilation of Cost and Benefit Data on Agricultural Products in 2022 [13]. Among them, the diesel cost is calculated using the following formula [15]:
Diesel cost = (mechanical cost + irrigation cost – water cost) × 21% + fuel cost. The diesel price data is sourced from the China Oil Price Network database of 2020, covering 23 cucumber producing provinces and 21 greenhouse cucumber producing provinces in China.
2.2. Research Methods
The greenhouse gas emissions are calculated based on LCA, according to the following steps:
2.2.1. Determination of System Boundary and Greenhouse Gases
The cucumber production system is set as the system boundary of this study, including the process from sowing to harvesting of open-field and greenhouse cucumber production. According to the greenhouse gas definition of Liu et al. [16], the net greenhouse gas balance of cucumber production system is calculated according to the following formula:
GHG = GWPNPP + (–) GWPSOC – GWPSOILEXPORT – GWPINPUT
where GHG is the increase or decrease of greenhouse gases in the air, GWPNPP is the warming potential of net primary productivity (including grain, straw residues, and roots), GWPSOC is the warming potential of soil organic carbon (negligible in this short-term experiment), GWPSOILEXPORT is the warming potential of soil CO2 emissions (mainly determined by straw incorporation, negligible in this experiment), N2O (mainly determined by nitrogen application), and CH4 (negligible for non paddy fields), GWPINPUT is the warming potential of indirect inputs including machinery, diesel, electricity, fertilizers, pesticides, manure, human and animal power.
According to the above formula and explanation, this study does not consider the warming potential of soil organic carbon, CO2 and CH4 emissions from soil, but mainly focuses on direct carbon emissions from diesel combustion, direct carbon emissions from labor force and natural manure stacking, indirect carbon emissions from fertilizers, pesticides, and plastic film production, soil N2O emissions caused by nitrogen application, and carbon sequestration of net primary productivity of cucumber. Hectare is selected as the evaluation unit.
2.2.2. Calculation Methods
Greenhouse gas emissions (GHGE) from cucumber production systems are calculated according to the following formulas Liu et al. [16]:
where GHGE (kg·hm-2, measured in CO2-eq) is the greenhouse gas emissions of 1 hm2 of cucumber, CO2input is the greenhouse gas emissions generated by resource input in the planting of 1 hm2 of cucumber, N2Ototal (kg·hm-2, measured in N2O-N) is the total amount of N2O emissions caused by the application of nitrogen fertilizer during the growth season, which can be divided into direct and indirect emissions of N2O, 44/28 is the coefficient of converting N2O-N into N2O, and 265 is the global warming potential of N2O in 100 years [17].
where AIi is the input amount of resource i (labor force, diesel, fertilizers, pesticides, plastic films), and EFi is the greenhouse gas emission parameters of resource i (Table 1).
GHGE = CO2 input + N2Ototal × (44/28) × 265
CO2 input = Σ (AIi × EFi)
N2Ototal = N2Odirect + N2Oindirect = N2Odirect + 1.0% × NH3volatilization + 2.5% × NO3- leaching
N2Odirect = 0. 0073 × nitrogen application rate + 0.75
NH3volatilization = 0.084 × nitrogen application rate + 0.50
NO3- leaching = 0.22 × nitrogen application rate + 0.60
Formulas (3) – (6) are the constructed nitrogen loss models for open-field vegetable production system in China based on meta-analysis according to Wang et al. [15,19,20]. N2Odirect is direct N2O emissions, NH3volatilization is the NH3 volatilization in indirect N2O emissions, NO3-leaching is the NO3- leaching in indirect N2O emissions, and 1.0% and 2.5% are the coefficients of NH3 volatilization and NO3- leaching, respectively [21].
Carbon sequestration (CS) is calculated according to the following formula Liu et al. [16]:
where CS (kg·hm-2, measured in CO2-eq) is the carbon sequestrated by 1 hm2 of cucumber plants, CSNPP (kg·hm-2) is the carbon sequestrated by cucumbers through net primary productivity, Yw (kg·hm-2, fresh weight) is the economic output, and Cf, W, and H are the carbon absorption rate (0.45 kgCE·kg), moisture content (98.3%), and economic coefficient (0.55) of cucumbers, respectively [22].
CS = CSNPP = Cf × Yw × (1 - W)/H
Net greenhouse gas emission (NGHGE) is calculated according to the following formula Liu et al. [16]:
where NGHGE (kg·hm-2, measured in CO2–eq) is the net greenhouse gas emissions of 1 hm2 of cucumber plants. When it is a positive value, it means that this system is a source of greenhouse gases, otherwise it is a sink.
NGHGE = GHGE – CS
2.2.3. Carbon footprint
In this study, the following four indicators were selected to evaluate the carbon footprint of the cucumber production systems.
Land carbon emission intensity (ρ, kgCE·m-2) represents the carbon emissions generated per unit crop planting area. The calculation formula is as follows:
where H is the land area (m2), and GHGE is the net greenhouse gas emissions from 1 hm2 of cucumber plants. The larger the ρ, the more carbon emissions from the production system.
ρ = GHGE/H
Carbon ecological efficiency (ℓC), one of the indicators to evaluate the sustainability of agricultural production [23], refers to the ratio of photosynthesis-induced carbon sinks in crops to total carbon emissions. The calculation formula is as follows:
where CS and GHGE are as described above. If 0 ≤ ℓC < 1, the carbon emissions from cucumber production are greater than the photosynthesis-induced carbon sink. The closer the value is to 0, the lower the sustainability of the production system. If ℓC = 1, the carbon emissions from cucumber production are equal to the photosynthesis-induced carbon sink, and the production system is neutral to the environment. If ℓC > 1, the carbon emissions from cucumber production are less than the photosynthesis-induced carbon sink, and the production system has a positive effect on the environment. The larger the value, the higher the sustainability of the production system.
ℓC = CS/GHGE
Carbon production efficiency (ℓY, kg·kgCE-1) refers to the ratio of economic output to carbon emissions. It indicates the economic output generated by per unit of carbon emissions from the crop production system. The calculation formula is as follows:
where Y and GHGE are as described above. The larger the ℓY, the higher the economic output generated by per unit of carbon emissions of the production system.
ℓY = Y/GHGE
Carbon economic efficiency refers to the ratio of total output value to carbon emissions, measuring the economic benefits brought by every unit of carbon emissions from the crop production system. The calculation formula is as follows:
where ℓI is the carbon economic efficiency (CNY kgCE-1), I is the total output value (CNY), and GHGE is as described above. The larger the ℓI, the higher the economic benefits generated by per unit of carbon emissions from the production system.
ℓI = I/GHGE
3. Results
3.1. Comparison of Greenhouse Gas Emissions by Open-Field and Greenhouse Productions
In the open-field cucumber production, the total carbon emissions per hectare are 4572.67 kgCE·hm-2. Among the components, soil N2O emissions account for the highest proportion (35.93%), followed by fertilizers, plastic films, labor force, diesel, manure, and pesticides. Greenhouse gas emissions generated by chemical fertilizers (soil N2O emissions caused by nitrogen fertilization) account for 64.37%, and greenhouse gas emissions generated by fertilizers (chemical fertilizers and manure) account for 71.21%. This indicates that fertilizers are the main source of greenhouse gas emissions from open-field cucumber production. Greenhouse gas emissions generated by plastic films, labor force, diesel, and pesticides account for 28.79% in total. The photosynthesis-induced carbon sink is 810.48 kgCE·hm-2, which is less than the total greenhouse gas emissions. The net greenhouse gas emissions are 3762.20 kgCE·hm-2, and the carbon ecological efficiency is 0.18. This indicates that for every unit of greenhouse gas emissions generated by open-field cucumber production system, the photosynthesis-induced carbon sink is 0.18 units. The net greenhouse gas emissions are positive and the carbon ecological efficiency is less than 1. This indicates that the open-field cucumber production has negative effects on the natural environment. The land carbon intensity is 0.46 kgCE·m-2, indicating that the greenhouse gas emissions generated by 1 m2 of planting area in the open-field cucumber production system is 0.46 kgCE. The carbon production efficiency is 12.74 kg, indicating that an economic output is 12.74 kg for every 1 kgCE greenhouse gas emission in the open-field cucumber production system. The carbon economic efficiency is 31.78 yuan·kgCE-1, indicating that the economic benefit is 31.78 yuan for every 1 kgCE greenhouse gas emission (Table 2).
In the greenhouse cucumber production, the total carbon emissions per hectare are 8712.86 kgCE·hm-2. Among the components, plastic films account for the highest proportion (38.78%), followed by soil N2O emissions. The greenhouse gas emissions generated by chemical fertilizers (fertilization and soil N2O emissions caused by nitrogen fertilization) account for 38.25%, which is nearly equivalent to the proportion of plastic films. This indicates that plastic films and fertilizers are the main sources of greenhouse gas emissions from greenhouse cucumber production. The photosynthesis-induced carbon sink is 1234.37 kgCE·hm-2, which is less than the total carbon emissions. The net greenhouse gas emissions are 7478.49 kgCE·hm-2, and the carbon ecological efficiency is 0.14. These results indicate that the carbon sink formed by photosynthesis is 0.14 units for every unit of greenhouse gas emissions from the greenhouse cucumber production system. The net carbon emission is positive and the carbon ecological efficiency is less than 1, indicating that the greenhouse cucumber production has negative effects on the natural environment, with a low-level sustainability. The land carbon intensity is 0.87 kgCE·m-2, indicating that 0.87 kgCE of greenhouse gas emissions are generated by every 1 m2 of planting area of the greenhouse cucumber production system. The carbon production efficiency is 10.19 kg, indicating that the greenhouse cucumber production system can achieve an economic yield of 10.19 kg for every 1 kg of greenhouse gas emissions. The carbon economic efficiency is 30.14 CNY·kgCE-1, indicating that the greenhouse cucumber production system can achieve an economic benefit of 30.14 CNY for every 1 kg of greenhouse gas emissions.
Comparing the carbon emission characteristics and carbon emission indicators of open-field and greenhouse cucumber productions, it is found that the total greenhouse gas emissions of greenhouse cucumber production are 90.54% higher than those of open-field cucumber production. The main source of greenhouse gas emissions for open-field cucumber production is chemical fertilizers, while the main sources of greenhouse cucumber production are plastic films and fertilizers. Since the output of greenhouse cucumber production is higher than that of open-field cucumber production, the carbon sequestration of greenhouse cucumber production is 52.30% higher than that of open-field cucumber production. However, because greenhouse gas emissions of greenhouse cucumber production are significantly greater than that of open-field cucumber production, its net greenhouse gas emissions are 98.78% higher than that of open-field cucumber production. From the differences in carbon emission indicators including net greenhouse gas emissions, land carbon intensity, carbon ecological efficiency, carbon production efficiency, and carbon economic efficiency, it can be seen that the sustainability of greenhouse cucumber production is lower than that of open-field cucumber production.
3.2. Spatial Characteristics of Greenhouse Gas Emissions and Evaluation of Open-Field and Greenhouse Cucumber Production
3.2.1. Spatial Characteristics of Greenhouse Gas Emissions
China has a vast land. The economic status and resource endowment of different provinces are different, and the methods, technologies, inputs, etc. for cucumber planting are also different. Therefore, there are significant spatial differences in greenhouse gas emissions. At the same time, there are also significant differences between open-field and greenhouse production.
The greenhouse gas emissions per hectare of open-field cucumber production systems in 23 provinces in China (Figure 1 (a)) are between 2706.14 and 6953.93 kgCE·hm-2. Henan Province has the highest greenhouse gas emissions, 2.57 times that of the Beijing, the province with the lowest greenhouse gas emissions. The greenhouse gas emissions of 11 provinces are above the national average level. These provinces can be divided into four levels. The first level includes Beijing, Hubei, and Shandong, with greenhouse gas emissions of less than 3,000 kgCE·hm-2. The second level includes Heilongjiang, Anhui, Guangdong, Jilin, Ningxia, Chongqing, Liaoning, Jiangxi, and Hebei, with greenhouse gas emissions of 3,000 – 4,000 kgCE·hm-2. The third level includes Gansu, Guangxi, Shanxi, Sichuan, Inner Mongolia, Yunnan, Hainan, and Fujian, with greenhouse gas emissions of 4,000 – 6,000 kgCE·hm-2. The fourth level includes Xinjiang, Shaanxi, and Henan, with greenhouse gas emissions of more than 6,000 kgCE·hm-2.
The greenhouse gas emissions per hectare of greenhouse cucumber production systems in 21 provinces (Figure 1 (b)) range from 5795.20 to 13027.43 kgCE·hm-2, which are generally significantly higher than that of the open-field cucumber production system. Hebei has the highest greenhouse gas emissions, which is 2.25 times that of Tianjin, the province with the lowest greenhouse gas emissions. The greenhouse gas emissions of 7 provinces are above the national average. These provinces can be divided into four levels. The first level includes Tianjin, Inner Mongolia, Hubei, Qinghai, Anhui, Sichuan, Ningxia, Zhejiang, Jiangsu, and Shanghai, with greenhouse gas emissions of less than 7,000 kgCE·hm-2, which is nearly equivalent to the fourth level of open-field production. The second level includes 9 provinces such as Beijing, Jilin, Shaanxi, and Gansu, with greenhouse gas emissions of 7,000 – 9,000 kgCE·hm-2. The third level includes Henan and Liaoning, with greenhouse gas emissions of 10,000 – 11,000 kgCE·hm-2. The third level includes Shandong, Xinjiang, Shanxi, Heilongjiang, and Hebei, with greenhouse gas emissions of more than 11,000 kgCE·hm-2.
(a) Open-field (b) Greenhouse
3.2.2. Spatial Characteristics of Greenhouse Gas Emissions Components
For open-field cucumber production in various provinces, the main greenhouse gas emissions are from chemical fertilizers (Figure 2), including fertilization and soil N2O emissions caused by nitrogen fertilization (1000.25 – 5848.69 kgCE·hm-2, accounting for 36.96% – 84.11%), with significant spatial differences (17 provinces have a proportion more than 60%). Next are labor force, diesel, plastic film, and manure. There are significant spatial differences in greenhouse gas emissions and their proportions among provinces. The contribution of pesticides is the lowest, with greenhouse gas emissions ranging from 8.69 to 89.96 kgCE·hm-2. However, due to the main vegetable producing areas in southern China such as Hainan and Fujian suffer from severe pests and diseases caused by high temperature and humidity, the application rate of pesticides is higher, resulting in a larger contribution of pesticides to the total greenhouse gas emissions.
The components of greenhouse gas emissions from greenhouse cucumber production in each province (Figure 3) show that in terms of fertilizers, greenhouse gas emissions induced by fertilization and the soil N2O emissions caused by nitrogen fertilization are 1618.44 – 4481.63 kgCE·hm-2, accounting for 18.83% – 66.51% of the total emissions, which is smaller than those of the open-field cucumber production. In terms of plastic films, due to the significant increase in the use of plastic films under greenhouse production, it shows a significant difference from open-field production, and the greenhouse gas emissions are generally higher, ranging from 984.68 to 6526.84 kgCE·hm-2. Therefore, plastic films have become one of the main greenhouse gas emission sources of greenhouse cucumber production, with the highest proportion (53.76%) observing in Tianjin and the lowest proportion (14.31%) observing in Zhejiang. Next are labor force, diesel, and manure, showing significant spatial differences, which are similar to those of open-field production. Pesticides has the smallest contribution, with a proportion less than 1% for most provinces (19/21).There were significant inter-provincial differences in each component under both open-field and greenhouse cucumber production patterns. This suggests that there are significant differences in the inputs in cucumber production among provinces.
3.2.3. Spatial Characteristics of Carbon Emission Indicators
The carbon ecological efficiency of China's open-field cucumber production systems is between 0.10 and 0.33, and that of greenhouse cucumber production systems is between 0.09 and 0.26. Both are less than 1, indicating negative effects on natural environment. This suggests that China's cucumber production systems are not conducive to realize environmental sustainability. In terms of spatial distribution, the carbon ecological efficiency of both open-field and greenhouse cucumber productions in China presents a certain geographical proximity, and the overall trend of carbon ecological efficiency of open-field production increases from south to north (Figure 4).
The spatial distribution differences and geographical proximity of carbon production efficiency tend to be consistent with those of carbon ecological efficiency (Figure 5). The carbon production efficiency of open-field cucumber production systems is 7.12 – 23.91 kg·kgCE-1, with the highest in Hubei and the lowest in Henan. The largest difference between provinces is more than 3 times. The carbon production efficiency of greenhouse cucumber production systems is 6.54 – 18.38 kg·kgCE-1, with the highest in Inner Mongolia and the lowest in Heilongjiang. The carbon production efficiency of greenhouse cucumber production in most provinces is significantly lower than that of open-field production.
The carbon economic efficiency of China's open-field cucumber production systems is between 16.11 and 70.05 CNY·kgCE-1, with significant spatial differences. Hubei, Guangdong, and Hebei rank in the top three, while Henan and Hainan rank in the bottom two. The carbon economic efficiency of greenhouse production in most provinces (except for Ningxia, Shaanxi, and Inner Mongolia) (19.57 – 55.01 CNY kgCE-1) is generally lower than that of open-field cucumber production. Inner Mongolia has the highest carbon economic efficiency of greenhouse production, 2.81 times that of Heilongjiang, the province with the lowest carbon economic efficiency of greenhouse production (Figure 6).
4. Discussion
4.1. Growing Patterns and Greenhouse Gas Emissions
This study finds that the total greenhouse gas emissions per hectare of China's open-field cucumber production system are 4572.67 kgCE·hm-2, and the greenhouse gas emission production intensityis 78.47 kgCE·t-1. These results are comparable to the greenhouse gas emissions from open-field organic vegetable production in Liuyang City [26], However, these results are lower than the weighted average greenhouse gas emissions (6,244 kgCE·hm-2) and production intensity (116 kgCE·t-1) in China's vegetable production calculated by Zhang et al. [24], and the average greenhouse gas emissions (5,157 kgCE·hm-2) from open-field vegetable production in the Yangtze River Delta from 2012 to 2016, but about 3.46 and 4.35 times that of Spanish open-field asparagus lettuce and lettuce productions, respectively [25]. This is mainly due to the longer growth period and the higher fertilizer inputs for fruit vegetables compared with those of leafy vegetables [26]. Besides, the net greenhouse gas emissions of open-field cucumber production (3,762.20 kgCE·hm-2) obtained in this study are similar to those of Zhang et al. [24] and the results under the organic cultivation pattern in Liuyang City [26] (3,678.03 kgCE·hm-2), but are lower than those in the pollution-free pattern in Liuyang City (4,700 kgCE·hm-2) [27]. This study finds that the total greenhouse gas emissions per hectare of China’s greenhouse cucumber production system is 8,712.86 kgCE·hm-2. It is equivalent to that of the greenhouse vegetable production system in the Yangtze River Delta in China (8,760 kgCE·hm-2) [28] and is 18.7% of the greenhouse gas emissions per hectare of Iran’s cucumber production system [29]. Besides, it is also far lower than the greenhouse gas emissions per hectare of greenhouse cucumber production in Shouguang, Shandong, China (34,800 kgCE·hm-2) [30] and the greenhouse vegetable production in Beijing (9,073.95 kgCE·hm-2) [31]. These differences are mainly due to the fact that the above studies includes greenhouse gas emissions from the greenhouse construction process into the total emissions. The greenhouse gas emissions from greenhouse cucumber production in this research are significantly higher than those of the greenhouse cucumber production in the suburbs of Nanjing City (1,093.4 kgCE·hm-2) [32]. This is mainly due to the fact that Chen et al. [32] does not consider the soil N2O emissions caused by nitrogen fertilization, while the study results show that soil N2O emissions caused by nitrogen fertilization accounts for 22.19% of the total emissions. The results of this study also show that the total greenhouse gas emissions of greenhouse cucumber production in China are 90.54% higher than those of open-field cucumber production. The net greenhouse gas emissions, carbon ecological efficiency, carbon production efficiency, and carbon economic efficiency are also lower than those of open-field cucumber production. Therefore, the sustainability of greenhouse cucumber production is lower than that of open-field cucumber production. This is consistent with the research results of greenhouse and open-field vegetable production in China [24], Yangtze River Delta [28], and Washington D.C., USA [33].
4.2. Sources of Greenhouse Gas Emissions and the Measures to Reduce
The results of this study show that the main source of greenhouse gas emissions from open-field cucumber production is chemical fertilizers (accounting for 64.37%), including fertilization (accounting for 28.44%) and soil N2O emissions (accounting for 35.93%) caused by nitrogen fertilization. This is consistent with the study results of Hu et al. [27] on the greenhouse gas emission components of open-field production of eight vegetables in Liuyang City, but it is different from the results of Zhang et al. [26] on the open-field production in China. The results also show that fertilizers are the main source of greenhouse gas emissions in China’s open-field cucumber production. This is mainly due to the higher emission coefficient of the selected nitrogen fertilizer (8.30 kgCE·kg-1). The standards in the China LCA Basic Database (CLCD0.7) were selected in this study (1.526 kgCE·kg-1), resulting in a smaller greenhouse gas emissions of chemical fertilizers in the agricultural input stage. In this study, the nitrogen application rate in open-field cucumber production in Inner Mongolia, Henan, Shaanxi, and Xinjiang is higher than that (363 kg·hm-2) recommended for cucumber by Wu [34], indicating that there is great potential in fertilizer and emission reductions for the four provinces. In view of this, for open-field cucumber production, research should be strengthened in terms of optimizing the usage of nitrogen fertilizer and increasing the utilization rate to reduce greenhouse gas emissions.
Among the greenhouse gas emission components of greenhouse cucumber production, plastic film and fertilizers are the main emission sources, accounting for 38.78% and 38.25%, respectively. The contribution rates of plastic films in Beijing, Tianjin, Hebei, Jiangsu, and Sichuan are more than 50%. This result is different from relevant researches. The main source of greenhouse gas emissions from greenhouse cucumber production in Pakistan is diesel [35], while the main sources are fertilizers in Nanjing, China [32] and means of agricultural production in Shouguang, Shandong province, China [30]. Besides, Gao [36] found that the main greenhouse gas emission sources of China's chain greenhouses, bamboo and wood-based greenhouses, and plastic films-based greenhouses are temperature regulation, greenhouse construction, and fertilizers, respectively. The main reason for the difference is the difference in system boundaries between the study and other studies. Some studies include greenhouse construction, while the system boundary of this study is determined as the process from sowing to harvesting, and the greenhouse construction is not considered. The results of this study show that for greenhouse cucumber production, in addition to optimizing the use of chemical fertilizers, reducing the use of plastic films is also a major emission reduction measure. For example, increasing the use of environmentally friendly plastic films, recycling plastic films, and increasing the reuse rate of plastic films.
4.3. Spatial Differences in Greenhouse Gas Emissions
The regional-scale water, soil, and carbon footprints have significant spatial differences, due to regional differences in natural conditions, socio-economics, industrial structure, farming methods, and planting structures [37]. For example, the greenhouse gas emissions from Spanish’s greenhouse tomato production are 3.38 times that of Colombia’s [12,28]. The greenhouse gas emissions from vegetable production in northern China are 9.7% – 30.0% higher than those of southern China, due to the higher (about 18.2% – 58.2%) nitrogen fertilizer application rate in northern China [24]. The greenhouse gas emissions from greenhouse vegetable production in China increase with the increase of latitude, and the provincial differences in the vegetable production in bamboo and wood-based greenhouses and plastic films-based greenhouses are large, with no obvious regularity [36]. The potential value of greenhouse gas emissions from greenhouse tomato production in Beijing (33.3 t·hm-2, 379 kgCE·t-1) is higher than that in Shouguang, Shandong Province (31.7 t·hm-2, 246 kgCE·t-1) [30]. The greenhouse gas emissions from vegetable production in western Chongqing are 29% – 35% higher than those in central, southeastern, and northeastern Chongqing. The results of this study are consistent with previous research results, that is, there are significant spatial differences in greenhouse gas emissions, emission components, and carbon emission indicators of open-field and greenhouse cucumber productions. Among them, carbon ecological efficiency and carbon production efficiency present a certain geographical proximity, and the carbon ecological and production efficiency of open-field cucumber production increase from south to north. This comparison of the spatial characteristics in greenhouse gas emissions and carbon emission indicators of open-field and greenhouse cucumber productions in China has certain reference significance for adjusting China's cucumber production patterns and optimizing the layout of the cucumber industry. For provinces with low carbon ecological efficiency and economic efficiency, adjusting industrial structure and production patterns can be focused. For provinces with low carbon ecological efficiency but high carbon economic efficiency, developing green production technologies and tapping the potential for emission reduction can be focused. For provinces with high carbon ecological efficiency but low carbon economic efficiency, brand building to enhance prices and benefits can be focused. For provinces with high carbon ecological efficiency and high carbon economic efficiency, supports can be increased to make these provinces become main cucumber producing areas.
4.4. Deficiencies and Prospects of the Research
This study analyzes the greenhouse gas emissions from open-field and greenhouse cucumber productions in China. The uncertainties in the analysis mainly come from the inputs selection, system boundary definition, and emission indicator selection. Based on the National Compilation of Cost and Benefit Data on Agricultural Products in 2022, the inputs such as fertilizers, pesticides, labor forces, and plastic films in each province are calculated and analyzed. However, there is no data on diesel and pesticide consumption in this compilation, so estimates based on previous researches are used in this study. The system boundary of this study includes the process from material and manpower inputs to harvesting in open-field and greenhouse cucumber productions. However, there are still some disputes, such as whether infrastructure construction, water consumption, soil carbon sequestration, etc. before planting shall be included, which has impacts on the research results. In terms of emission indicator selection, based on the principle of indicator localization, the emission indicators are selected based on the nitrogen loss model of open-field vegetable system in China established by Wang et al. [19,20]. However, due to the lack of relevant researches, the indicators cannot be further selected based on the characteristics of each province. In fact, there are differences in different regions, and the use of the same parameters may bring certain uncertainty. There are also differences in the emission coefficients of fertilizers, plastic films, and pesticides among different countries and studies. For example, the emission coefficients of plastic films are 22.72 kgCE·kg-1 in Coinvent 2.2, 6.91 kgCE·kg-1 in CLCD0.7, 0.68 kgCE·kg-1 in Chen et al. [32], and 0.1 kgCE·kg-1 in He et al. [38]. This difference can lead to different results. Although there are certain uncertainties, this study can still provide information for understanding the differences in cultivation patterns and spatial characteristics in greenhouse gas emissions in China's cucumber production systems, providing a certain reference for the selection of cucumber production patterns and optimization of industrial layout.
5. Conclusion and Implications
Based on the life cycle assessment method and using the statistical data of the National Compilation of Agricultural Product Cost and Benefit Data (2022), this study conducted a detailed measurement analysis and spatial difference comparison and greenhouse gas emissions and carbon evaluation indicators under the two cultivation modes of traditional open-field production and modern facility agriculture, and summarized the following main research conclusions based on the analysis results:
(1) Taking the cucumber industry as a representative, the average overall greenhouse gas emission (4572.67 kgCE·hm-2) of China's facility agricultural production system was significantly higher than that of the traditional open-field production mode (8712.86 kgCE·hm-2). The main reason for this phenomenon is that the agricultural film and fertilizer used in the production of cucumbers in the facility emit large amounts of greenhouse gases. According to the measurement and comparison of net greenhouse gas emissions, the net greenhouse gas emissions from cucumber production in facilities are also significantly higher than those from open-field production. The underlying logic lies in the fact that although cucumbers can effectively increase carbon sequestration due to the surge in cucumber production under the facility production model, the increase in greenhouse gases caused by the use of agricultural film is even more significant. Finally, combined with the indicators of land carbon intensity and carbon production efficiency, it can be seen that both open-field and facility cucumber have negative environmental externalities, and the facility planting mode is facing more severe environmental sustainability problems.
(2) By comparing the two different cucumber cultivation modes of open field and facility cultivation in each province (city, district), it was found that the greenhouse gas emissions of open field in each province were between 2706.14~6 953.93 kgCE·hm-2, while the greenhouse gas emissions of each province under the facility production system were in the range of 5795.20~13 027.43 kgCE·hm-2. There are no significant regional or seasonal patterns in greenhouse gas emissions under the two models, but there are significant inter-provincial spatial differences in carbon sequestration, carbon ecological efficiency, carbon production efficiency, and carbon economic efficiency under different models, which also provides an objective basis for optimizing the industrial layout according to local conditions. At the same time, in view of the differences in economic development status and resource endowment between different provinces (municipalities and regions), the carbon ecological efficiency and carbon production efficiency of cucumber production in open fields and facilities have certain spatial spillover effects.
Based on the above conclusions, this paper provides the following policy implications:
(1) The yield advantages and economic benefits of facility cultivation mode are obvious, but if we want to give full play to the positive environmental externalities of facility agriculture in the theoretical design, subsequent governments at all levels and relevant executive departments must make reasonable use of various subsidy means and institutional regulations, so as to give full play to the core advantages of facility planting with high yield and high carbon sequestration, and at the same time reasonably reduce the use of agricultural film, vigorously promote drip irrigation, water and fertilizer saving methods, so as to truly achieve advantages and avoid disadvantages, and comprehensively improve the comprehensive benefits of facility agriculture under the goal of Dual carbon strategy .
(2) Facility agriculture is the developing trend of China's agricultural modernization, and the greenhouse gas emissions of facility agriculture show large regional differences in the provincial scale. Therefore, it is necessary for subsequent policymakers to adjust the location layout of facility agriculture differently, such as giving full play to the technical advantages of three-dimensional cultivation and multi-layer planting in coastal areas with obvious geographical advantages, and effectively optimizing the input structure of factors and achieving cost saving and consumption reduction in areas with abundant land resources such as the central and western regions, so as to greatly improve the carbon emission efficiency of facility agriculture in China and promote the sustainable development of facility agriculture.
Funding
This research was funded by the following Research Project: National Social Science Foundation of Chi-na(22BJY150); Modern Vegetable Industry Technology System Research Project of Guangdong(2024CXTD08); Guangdong Key Laboratory of Vegetable New Technology Research Fund Project(2024KF02).
Data Availability Statement
The original contributions presented in this study are included in the article/supplementary material. Further inquiries can be directed to the corresponding author(s).
References
- Huang, Y.; Chen, G.; Huang, Y.; et al. Overview of the development of facility agriculture. Agricultural Biotechnology 2020, 9, 151–154. [Google Scholar]
- Tong,H.T.,Xia,E.J.,Sun,C., et al. Impact of facility agriculture development on agricultural carbon emission efficiency [J]. China Environmental Science,2024,44(12):7079-7094. [CrossRef]
- Guo,S.R.,Sun,J.,Shu,S., et al. Analysis of General Situation,Characteristics,Existing Problems and Development Trend of Protected Horticulture in China. China Vegetables, (18), 1-14. (In Chinese). [CrossRef]
- Arbuckle, J.G.; Morton, L.W.; Hobbs, J. Farmer beliefs and concerns about climate change and attitudes toward adaptation and mitigation: Evidence from Iowa. Climatic Change 2013, 118, 551–563. [Google Scholar] [CrossRef]
- Liu Y, Ruiz-Menjivar J, Zhang L,et al.Technical training and rice farmers' adoption of low-carbon management practices: The case of soil testing and formulated fertilization technologies in Hubei, China [J].Journal of Cleaner Production, 2019, 226(JUL.20):454-462. [CrossRef]
- Xu,Q.,Zhao,Y.J.,Wan,M.,L. et al. Evaluation of the economic benefits of facility agriculture technology in modern crops [J].Water Conservancy & Electric Power Technology & Application, 2024, 6(23). [CrossRef]
- Guangyong L, Xiaoyan L, Cuihong J,et al, Analysis on Impact of Facility Agriculture on Ecological Function of Modern Agriculture [J].Procedia Environmental Sciences, 2011, 10(part-PA):300-306. [CrossRef]
- Dubois T, Hadi B A R, Vermeulen S, et al. Climate change and plant health: impact, implications and the role of research for mitigation and adaptation [J].Global Food Security, 2024, 41(000):5. [CrossRef]
- Peng, P.; Liang, L.; Li, H.L.; et al. Status, Deficiency and Development Suggestions of Protected Agriculture in China. Northern Horticulture (05):161-168. (In Chinese).
- Chen Y, Wang Z, You K, et al. Trends, Drivers, and Land Use Strategies for Facility Agricultural Land during the Agricultural Modernization Process: Evidence from Huzhou City, China. Land. 2024; 13(4):543. [CrossRef]
- Li, J.J.; Wang, P.X.; Zhang, R. Effects of protected agriculture on carbon reduction and carbon sink increase in China: an empirical study based on 1828 county panel data. Chinese Journal of Eco-Agriculture 2024, 32, 1275–1287. (In Chinese) [Google Scholar]
- Bojacá C., R. , Wyckhuys K A. G., Schrevens E. Life cycle assessment of Colombian greenhouse tomato production based on farmer-level survey data. Journal of Cleaner Production, 69: 26-33. [CrossRef]
- Cellura, M. , Ardente F., Longo S. From the LCA of food products to the environmental assessment of protected crops districts: A case-study in the south of Italy. Journal of Environmental Management, 93(1): 194-208. [CrossRef]
- Boulard T., Raeppel C., Brun R., et al. Environmental impact of greenhouse tomato production in France. Agronomy for Sustainable Development, 31(4): 757-777. [CrossRef]
- Wang, X. Z. Environmental cost, emission reduction potential and regulation approaches of vegetable production in China—pepper as a case. Ph.D, China Agricultural University thesis, Beijng. (In Chinese).
- Liu, X.H.; Xu, W.X.; Li, Z.J.; et al. The Missteps, Improvement and Application of Carbon Footprint Methodology in farmland Ecosystems With The Case Study of Analyzing the Carbon Efficiency of China’s Intensive Farming. Chinese Journal of Agricultural Resources and Regional Planning 2013, 34, 1–11. [Google Scholar]
- IPCC. Climate Change 2013: The Physical Science Basis. Contribution of Working Group I to the Fifth Assessment Report of the Intergovernmental Panel on Climate Change [M]. Cambridge: Cambridge University Press, 2013.
- Lal, R. Carbon emission from farm operations. Environment International, 30: 981-990. [CrossRef]
- Wang, X.Z.; Zou, C.Q.; Gao, X.P.; et al. Nitrous oxide emissions in Chinese vegetable systems: a meta-analysis. Environmental Pollution 2018, 239, 375–383. [Google Scholar] [CrossRef] [PubMed]
- Wang, X.Z.; Zou, C.Q.; Gao, X.P.; et al. Nitrate leaching from open-field and greenhouse vegetable systems in China: a meta analysis. Environmental Science and Pollution Research 2018, 25, 31007–31016. [Google Scholar] [CrossRef] [PubMed]
- Perrin, A.; Basset-Mens, C.; Gabrielle, B. Life cycle assessment of vegetable products: a review focusing on cropping systems diversity and the estimation of field emissions. The International Journal of Life Cycle Assessment 2014, 19, 1247–1263. [Google Scholar] [CrossRef]
- Hu, L.; Wen, L.Z.; Peng, Y.P.; et al. Evaluation of Production and Carbon Benefit of Different Vegetables. Journal of Agricultural Resources and Environment 2016, 33, 92–101. [Google Scholar]
- Dubey, A.; Lal, R. Carbon footprint and sustainability of agricultural production systems in Punjab, India and Ohio, USA. Journal of Crop Improvement 2009, 23, 332–350. [Google Scholar] [CrossRef]
- Zhang, F.; Liu, F.; Ma, X.; et al. Greenhouse gas emissions from vegetables production in China. Journal of Cleaner Production 2021, 317, 128449. [Google Scholar] [CrossRef]
- Romero-Gámez, M.; Audsley, E.; Suárez-Rey, E.M. Life cycle assessment of cultivating lettuce and escarole in Spain. Journal of Cleaner Production 2014, 73, 193–203. [Google Scholar] [CrossRef]
- Zhang, F.; Cheng, H.T.; Chen, X.P.; et al. Greenhouse Gas Emissions for Typical Open-Field Vegetable Production in China. Environmental Science 2020, 41, 3410–3417. [Google Scholar]
- Hu, L.; Wen, L.Z.; Peng, Y.P.; et al. Evaluation of Production and Carbon Benefit of Different Vegetables. Journal of Agricultural Resources and Environment 2016, 33, 92–101. [Google Scholar]
- Zhao, M.J.; Wang, X.Z.; Liu, B.; et al. Estimation of reactive nitrogen loss and greenhouse gas emissions from vegetable production in Yangtze River Delta, China. Journal of Agro-Environment Science 2020, 39, 1409–1419. [Google Scholar]
- Khoshnevisan, B.; Rafiee, S.; Omid, M.; et al. Environmental impact assessment of tomato and cucumber cultivation in greenhouses using life cycle assessment and adaptive neuro-fuzzy inference system. Journal of Cleaner Production 2014, 73, 183–192. [Google Scholar] [CrossRef]
- GUO J H. Inputs of Irrigation Water, Fertilizers, Pesticides to and Life Cycle Assessment of Environmental Impacts from Typical Greenhouse Vegetable Production Systems in China [D]. Beijng: China Agricultural University, 2016.
- Song, B.; Mu, Y.Y. The carbon footprint of facility vegetable production systems in Beijing. Resources Science 2015, 37, 175–183. [Google Scholar]
- Chen, L.; Yan, M.; Pan, G.X. Evaluation of the Carbon Footprint of Greenhouse Vegetable Production Based on Questionnaire Survey from Nanjing, China. Journal of Agro-Environment Science 2011, 30, 1791–1796. [Google Scholar]
- Maureira, F.; Rajagopalan, K.; Claudio, O.S. Evaluating tomato production in open-field and high-tech greenhouse systems. Journal of Cleaner Production 2022, 2022, 130459. [Google Scholar] [CrossRef]
- WU, L. Research on China's agricultural nitrogen fertilizer demand and greenhouse gas emission reduction potential based on total amount control [D]. Beijing: China Agricultural University, 2014.
- Qamar Ali, Muhammad Rizwan Yaseen, Muhammad Tariq Iqbal Khan. Energy budgeting and greenhouse gas emission in cucumber under tunnel farming in Punjab, Pakistan [J]. Scientia Horticulturae, 2019, 250: 168-173.
- GAO, X. Quantifying CO2 emission and simulation analysis of its reduction potentials for different types of greenhouse ecosystems in China [D] Nanjing: Nanjing Agricultural University, 2014.
- Sun, J.; Liu, Y.; Zhao, R.Q.; et al. The flow analysis of inter-provincial agricultural water, land and carbon footprints in China based on input-output model. Acta Ecologica Sinica 2022, 42, 9615–9626. [Google Scholar]
- He, X.; Qiao, Y.; Liu, Y.; et al. Environmental impact assessment of organic and conventional tomato production in urban greenhouses of Beijing city, China. Journal of Cleaner Production 2016, 134, 251–258. [Google Scholar] [CrossRef]
Figure 1.
Spatial variation of greenhouse gas emissions per hectare of open-field (a) and greenhouse (b) cucumber production in China.
Figure 1.
Spatial variation of greenhouse gas emissions per hectare of open-field (a) and greenhouse (b) cucumber production in China.
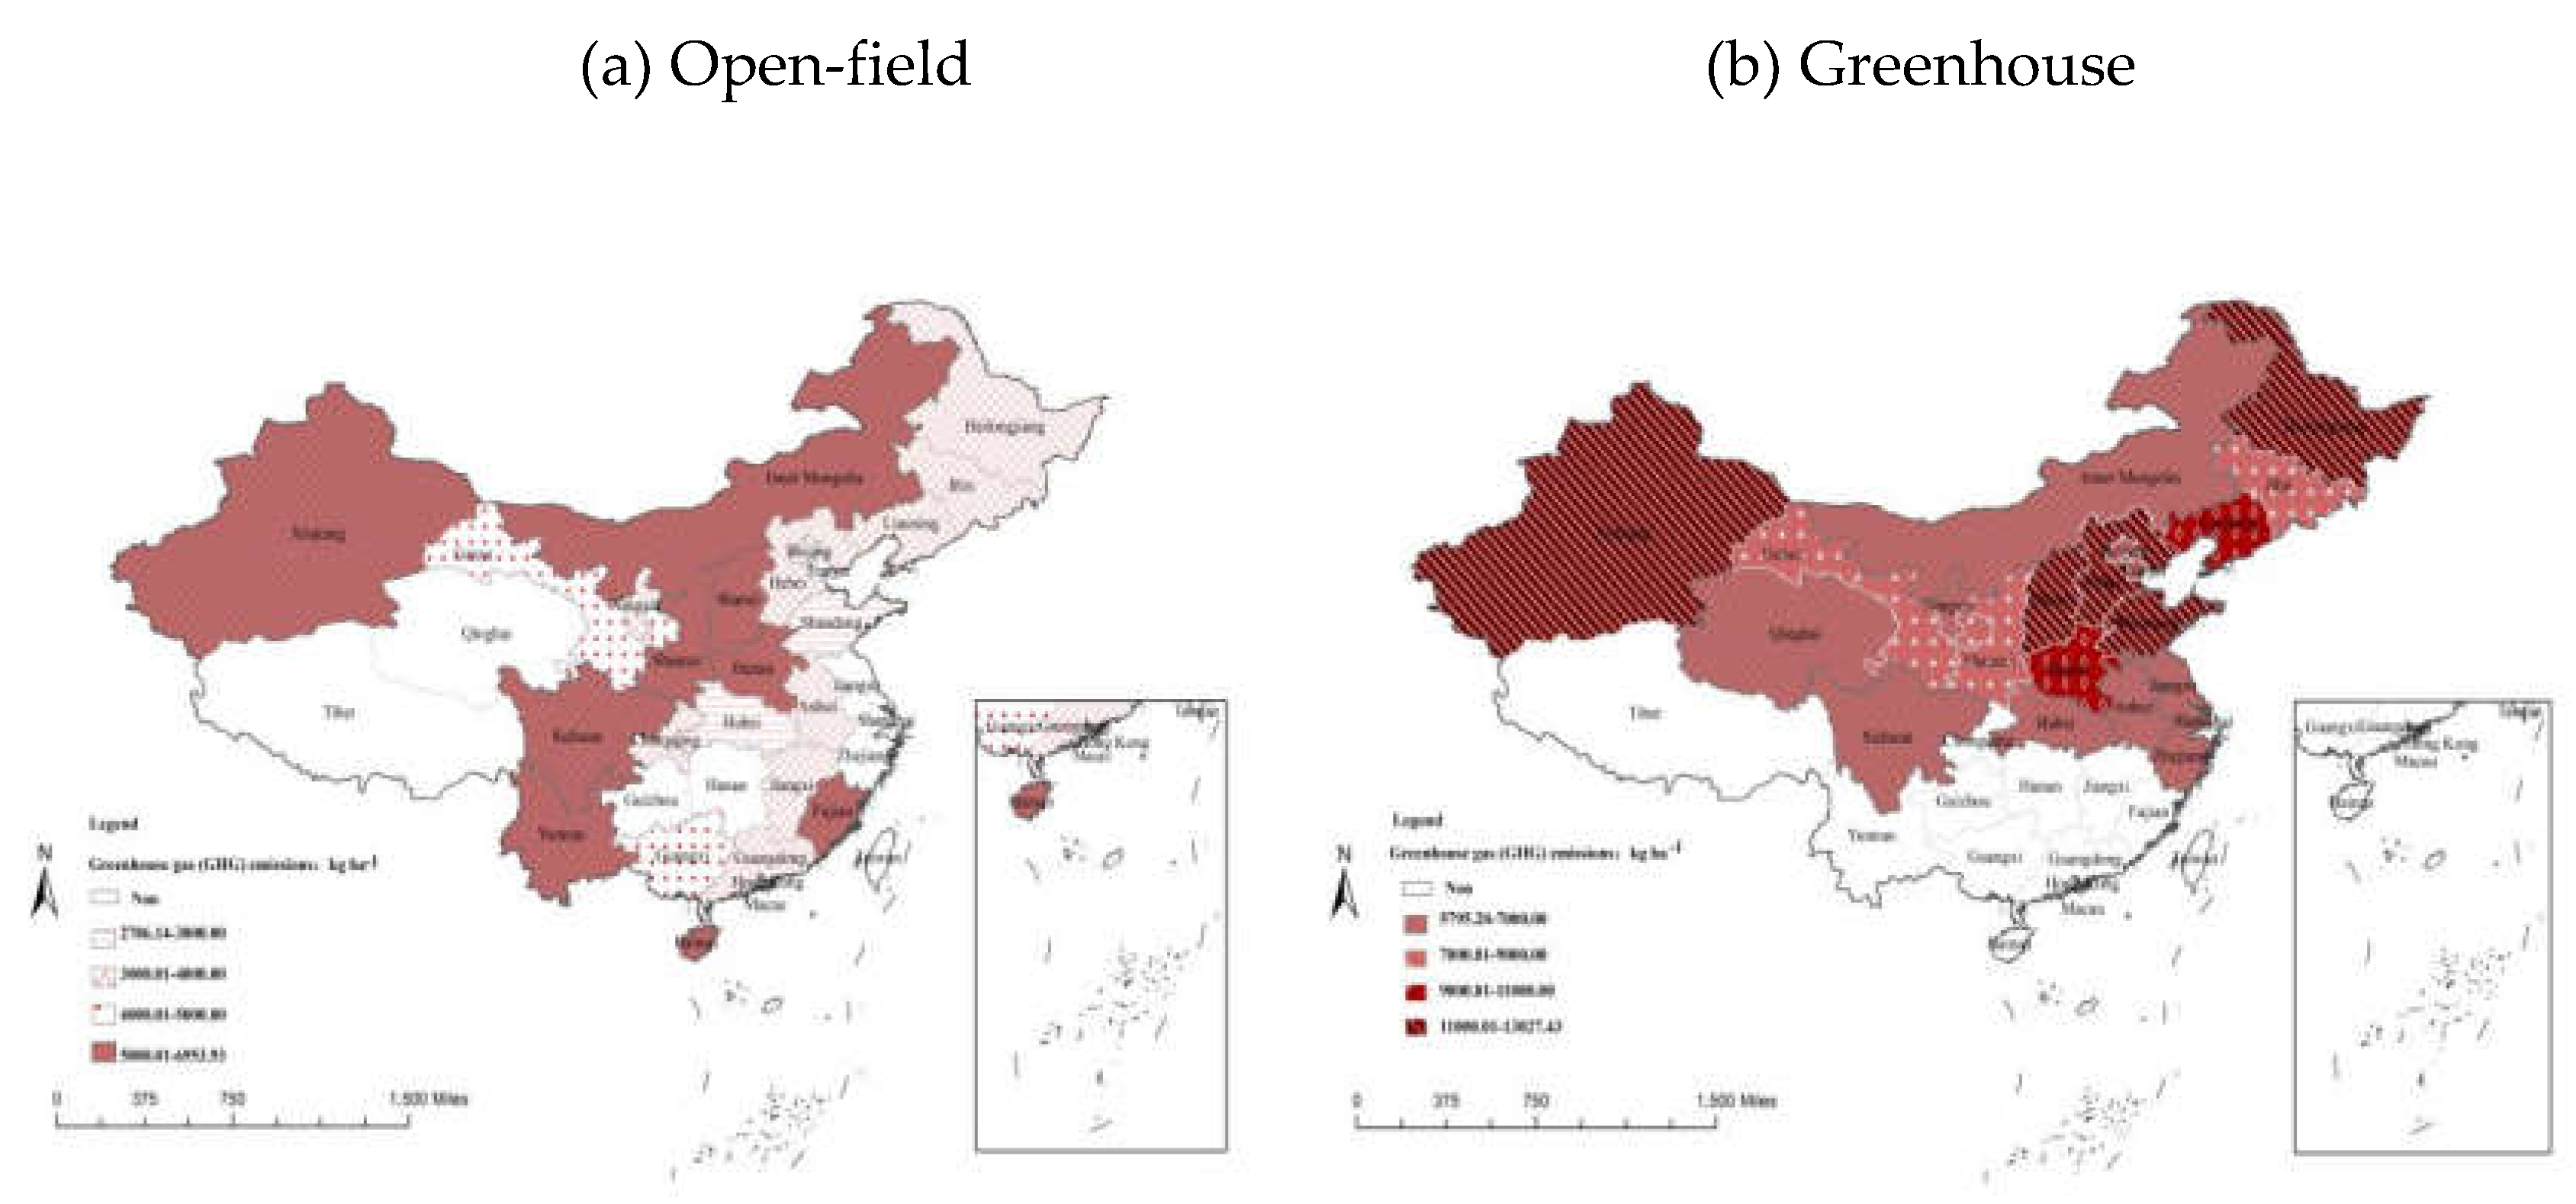
Figure 2.
Greenhouse gas emissions and components of open-field cucumber production in the provinces of China.
Figure 2.
Greenhouse gas emissions and components of open-field cucumber production in the provinces of China.
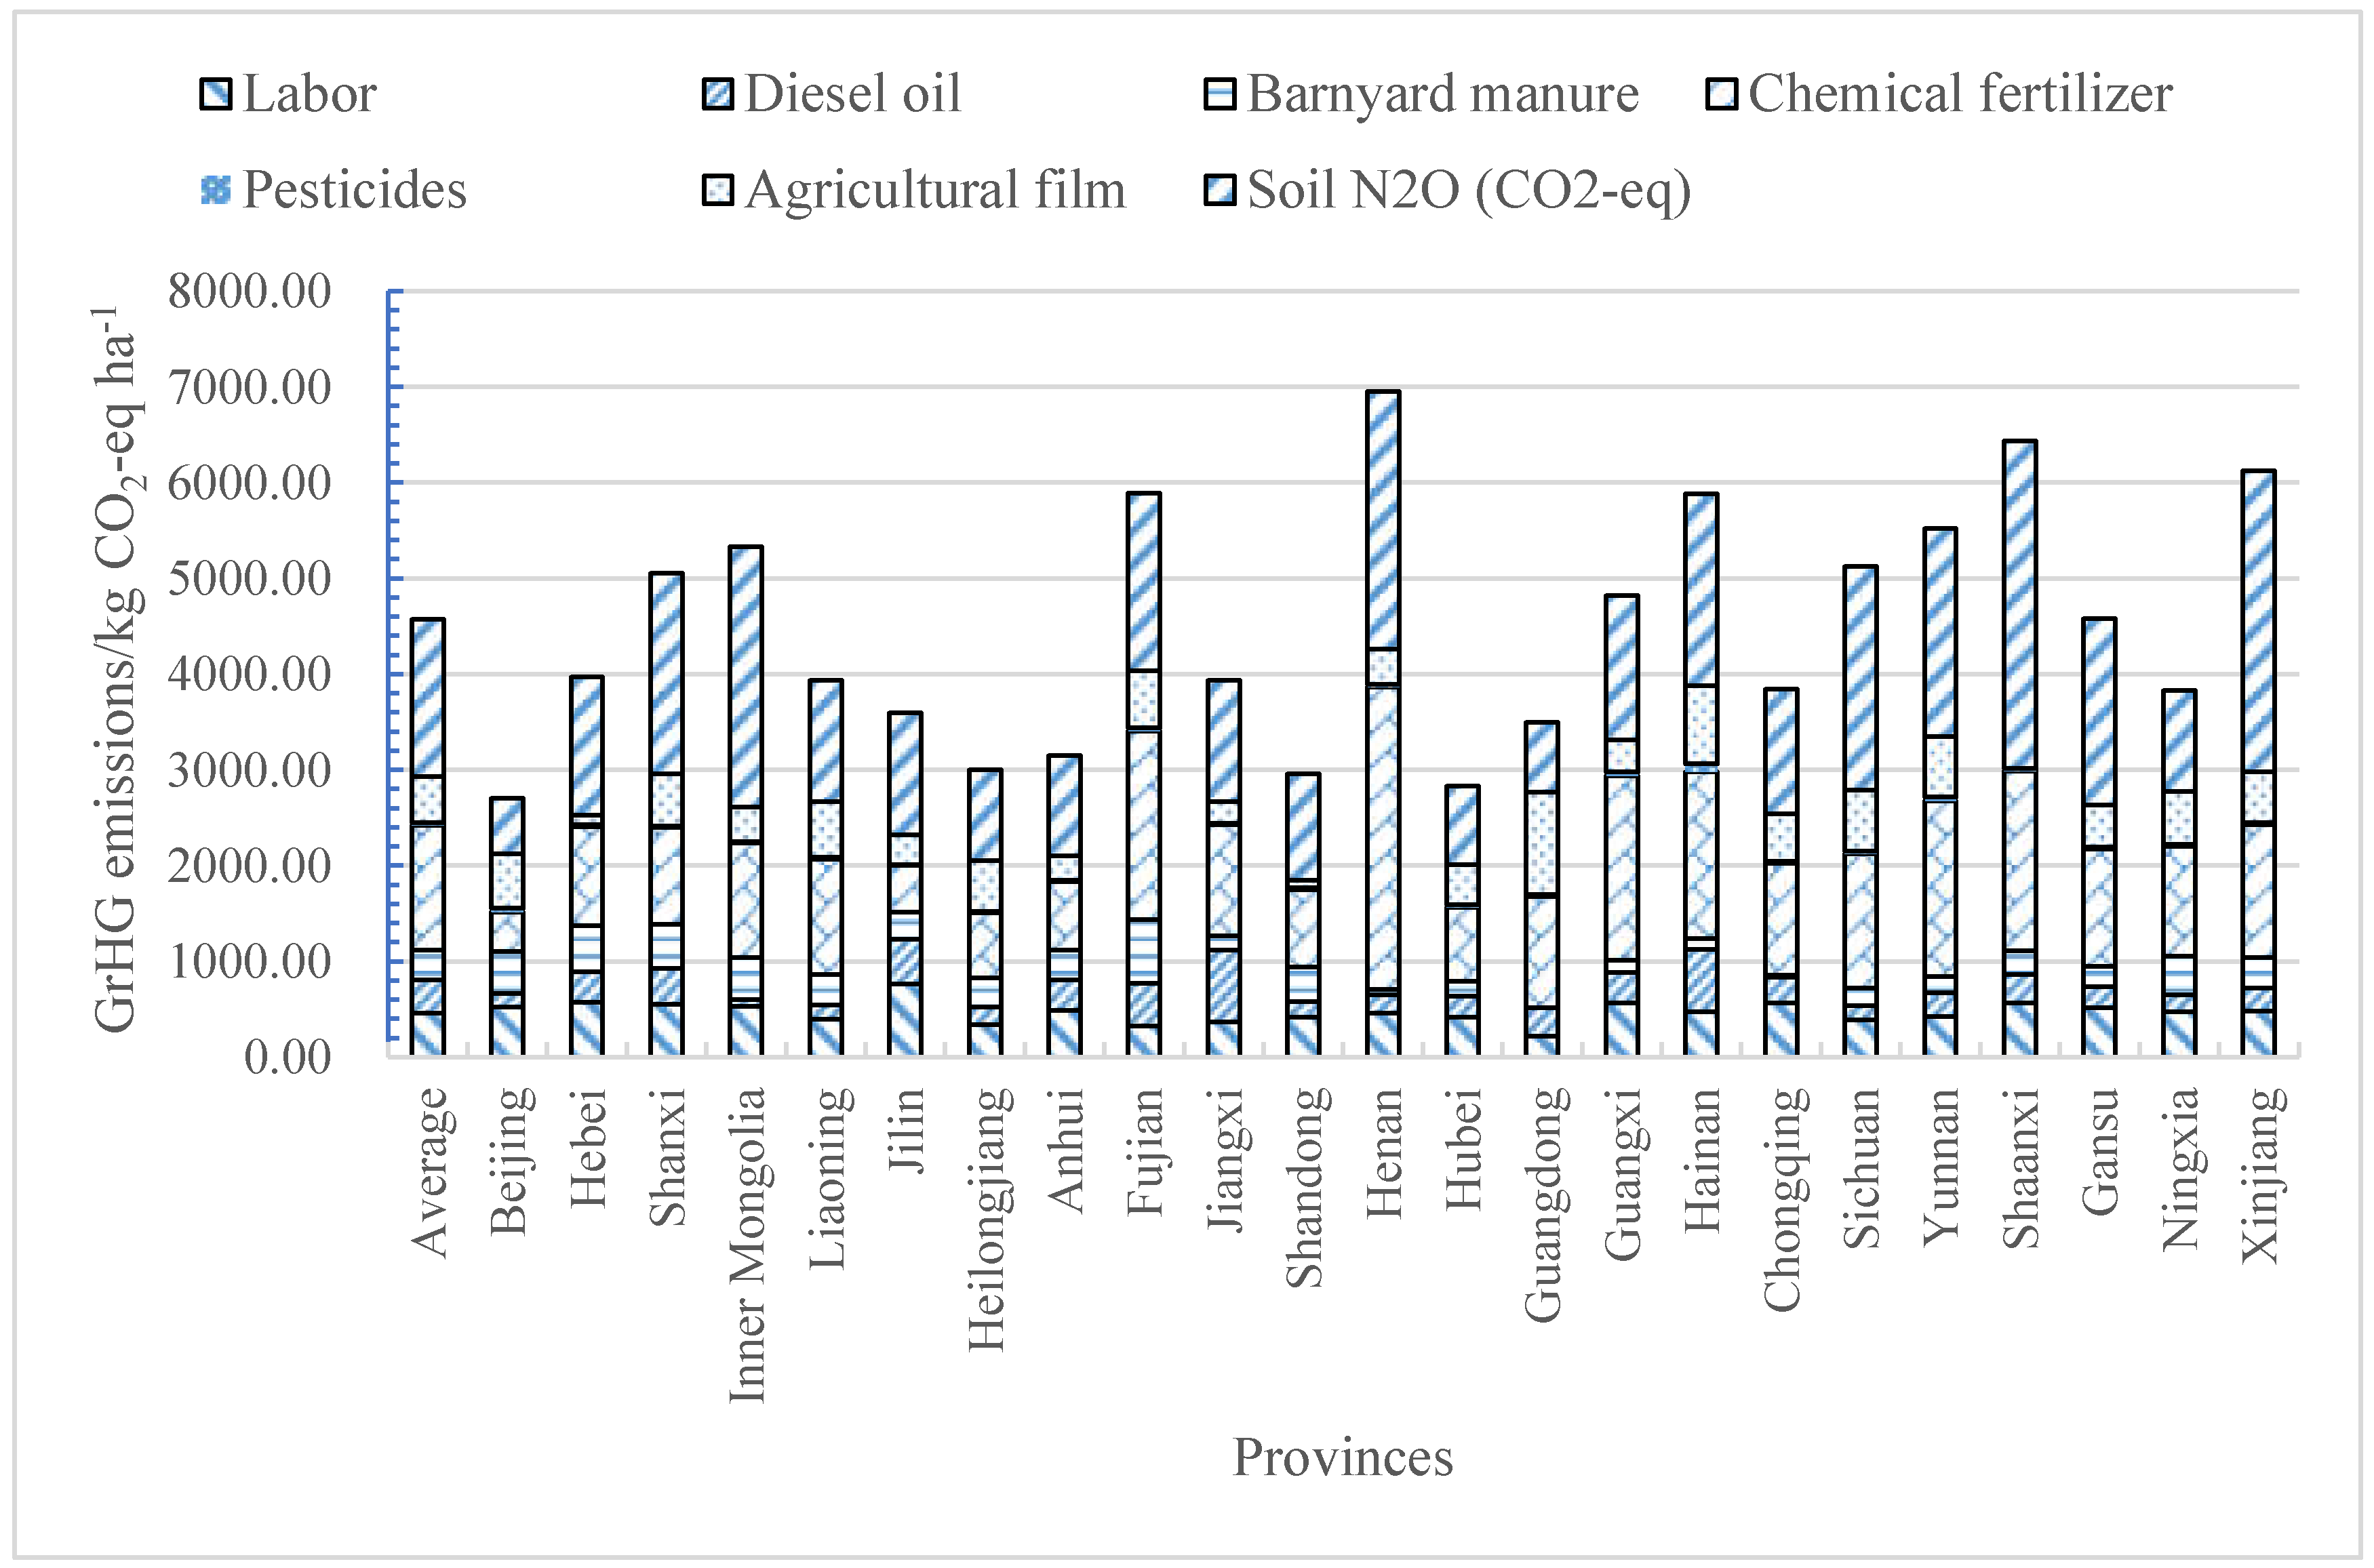
Figure 3.
Greenhouse gas emissions and components of greenhouse cucumber production in the provinces of China.
Figure 3.
Greenhouse gas emissions and components of greenhouse cucumber production in the provinces of China.
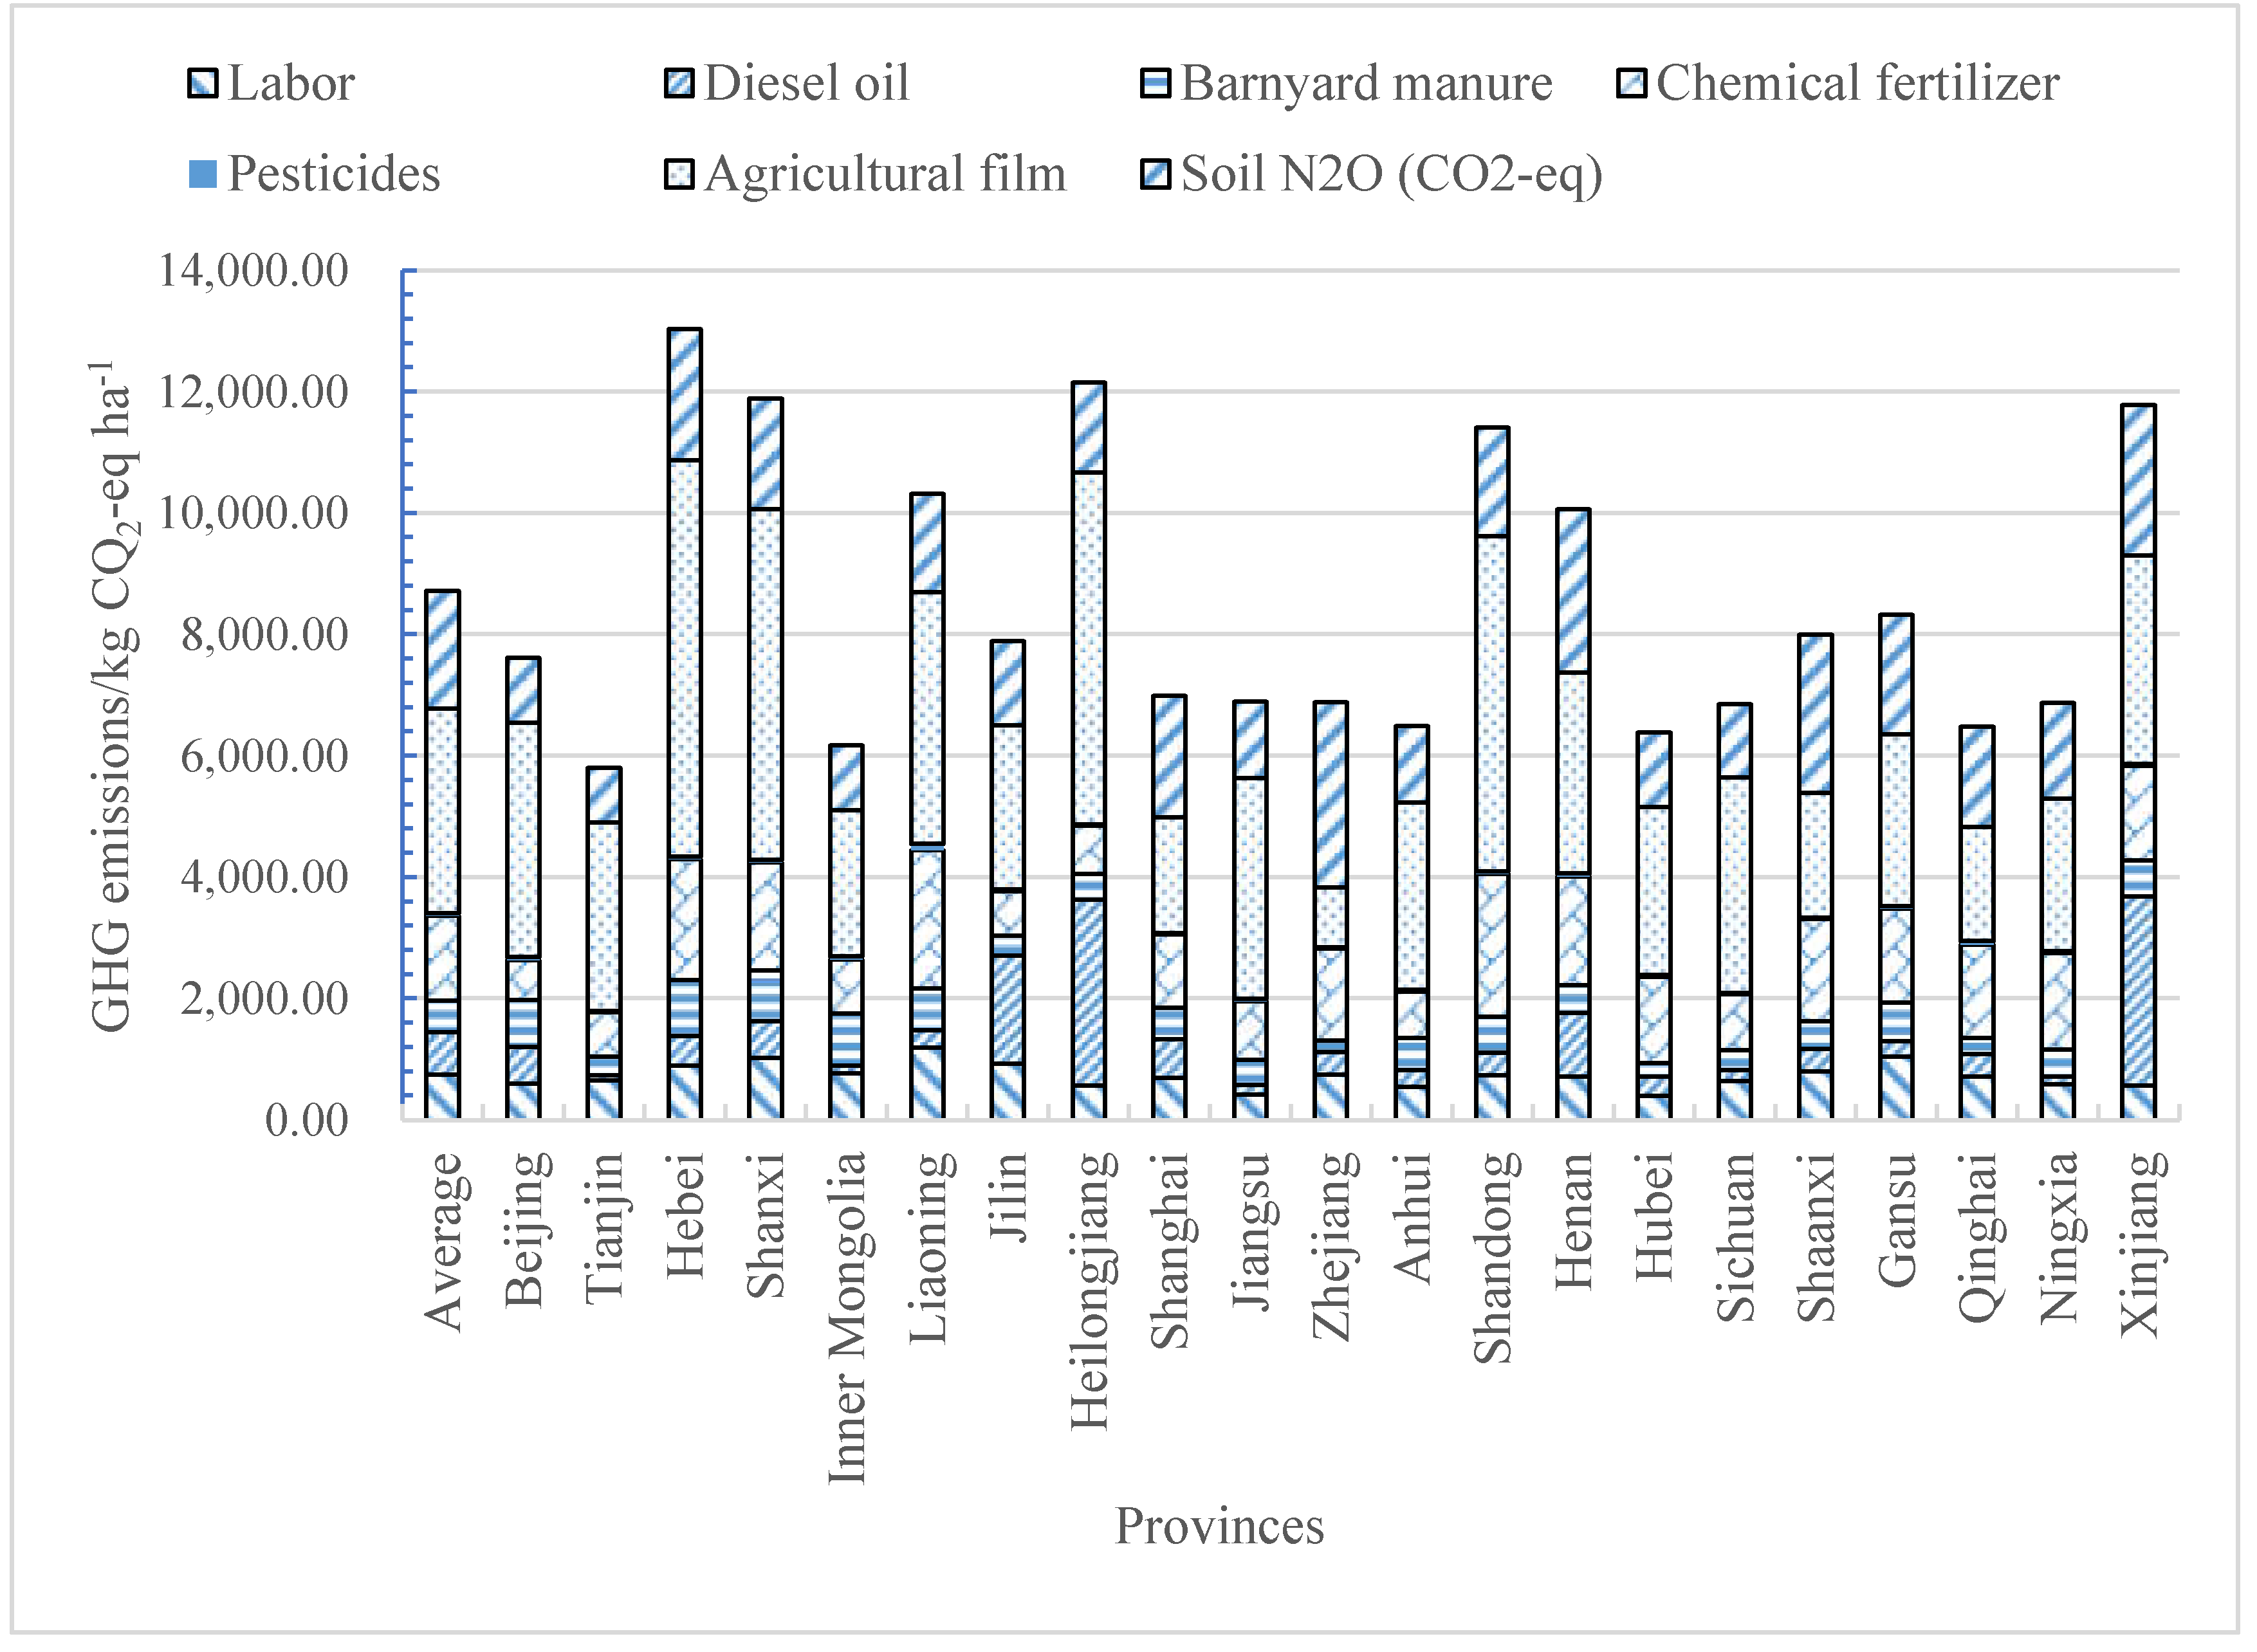
Figure 4.
Carbon ecological efficiency of open-field (a) and greenhouse (b) cucumber production in various provinces of China.
Figure 4.
Carbon ecological efficiency of open-field (a) and greenhouse (b) cucumber production in various provinces of China.
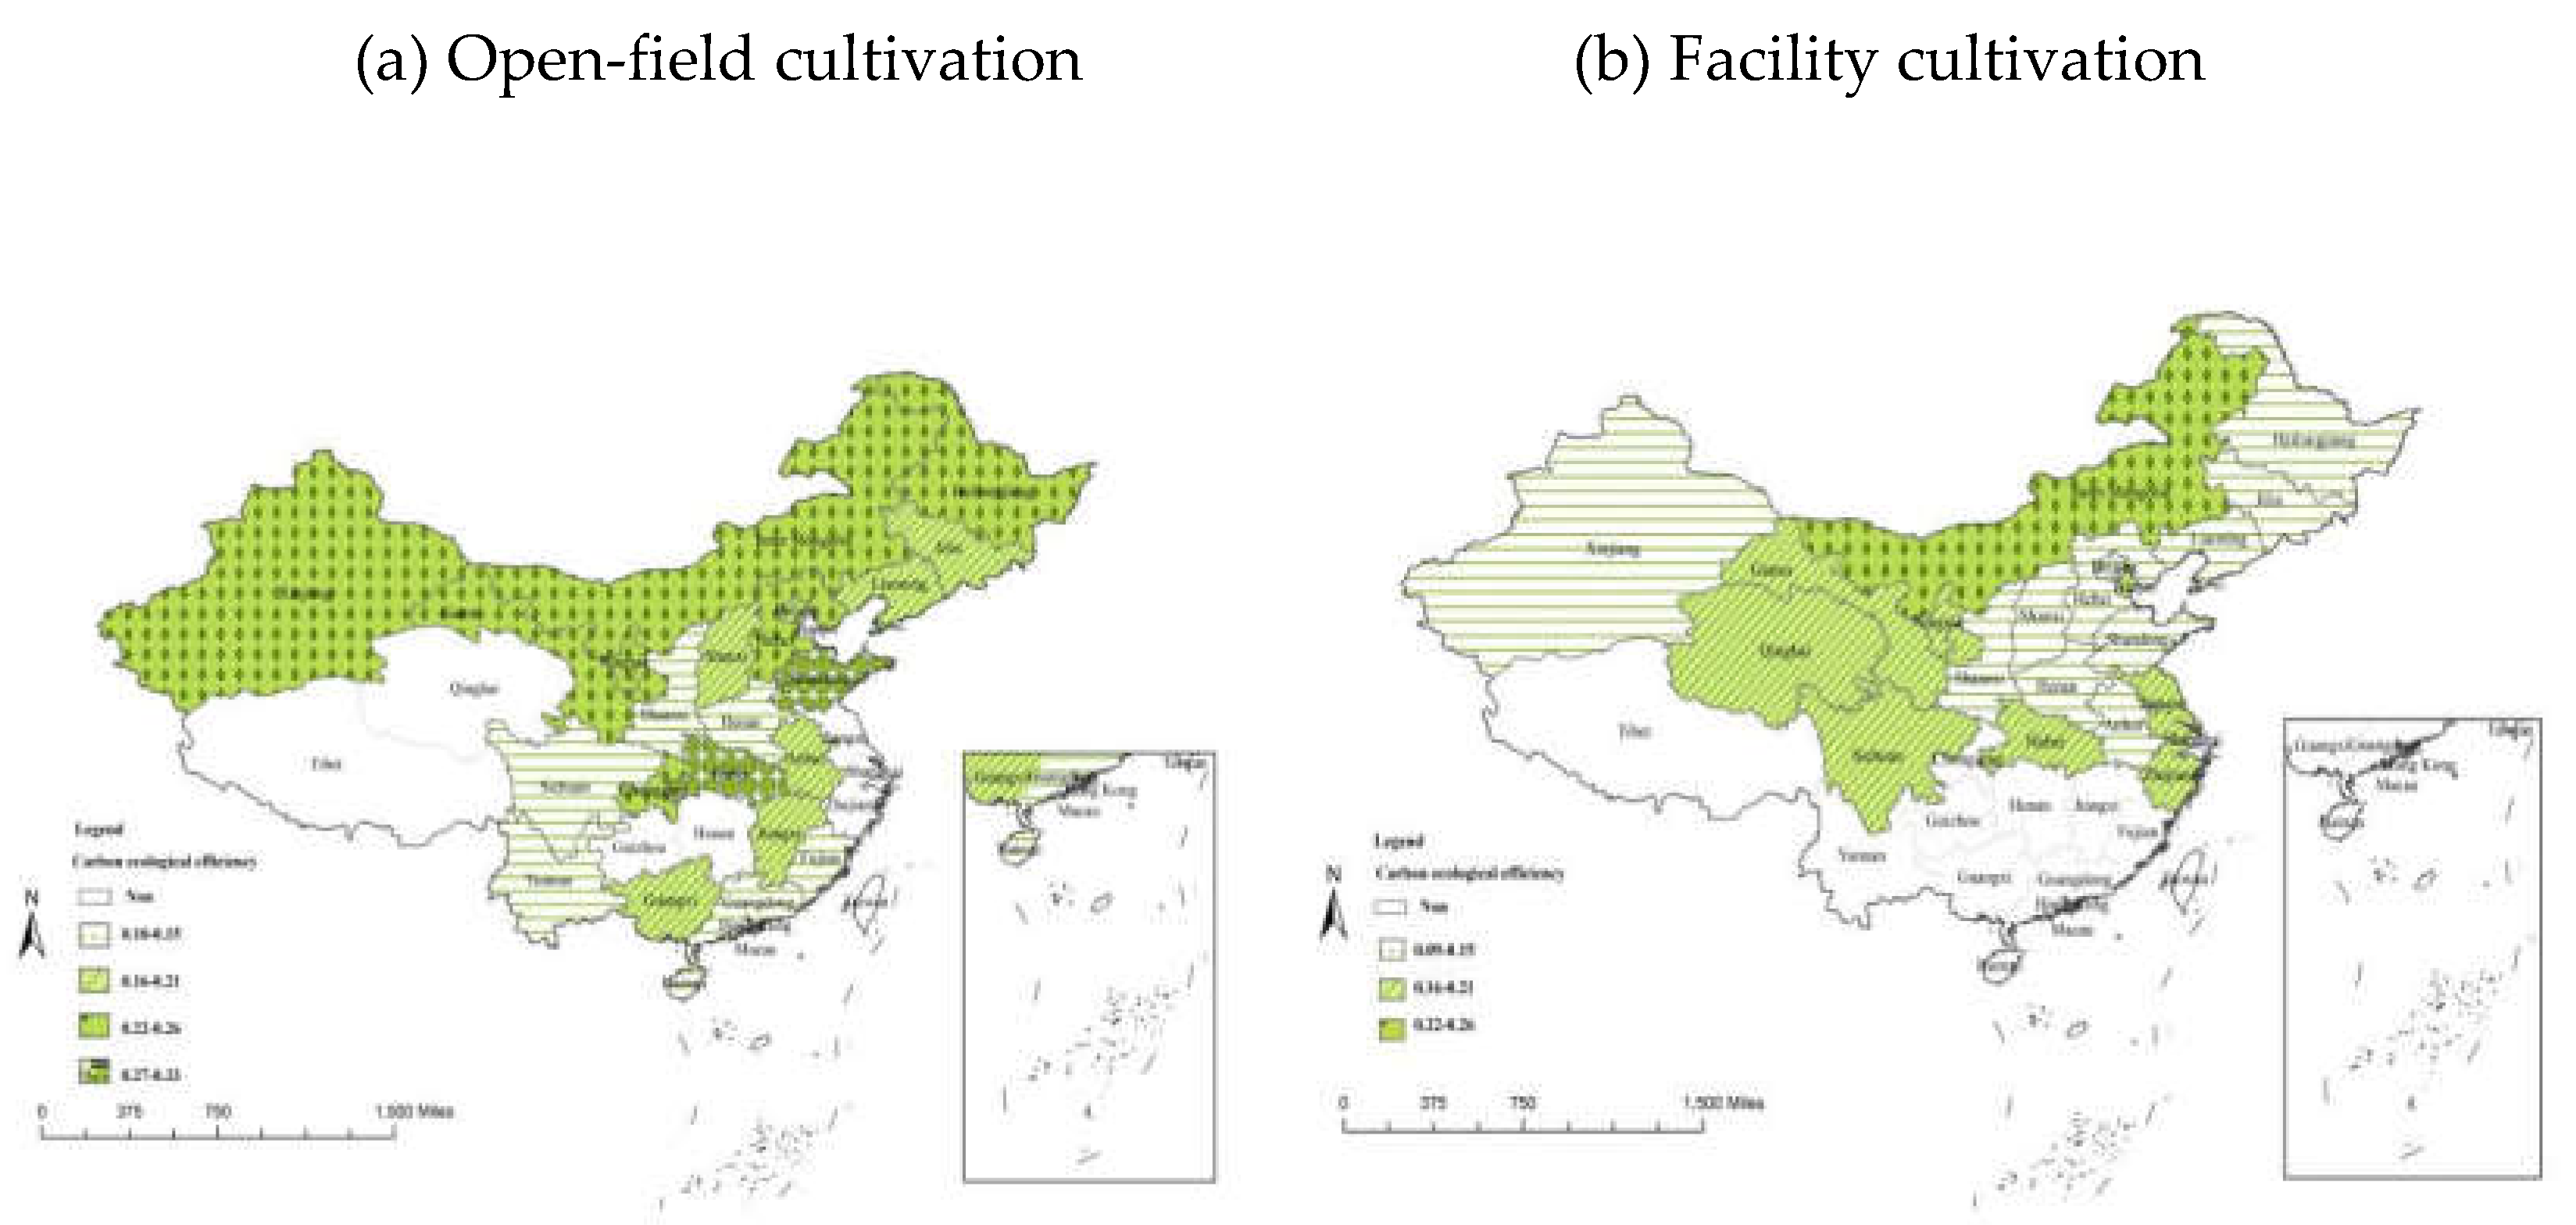
Figure 5.
Carbon production efficiency of open-field (a) and greenhouse (b) cucumber productions in various provinces of China.
Figure 5.
Carbon production efficiency of open-field (a) and greenhouse (b) cucumber productions in various provinces of China.
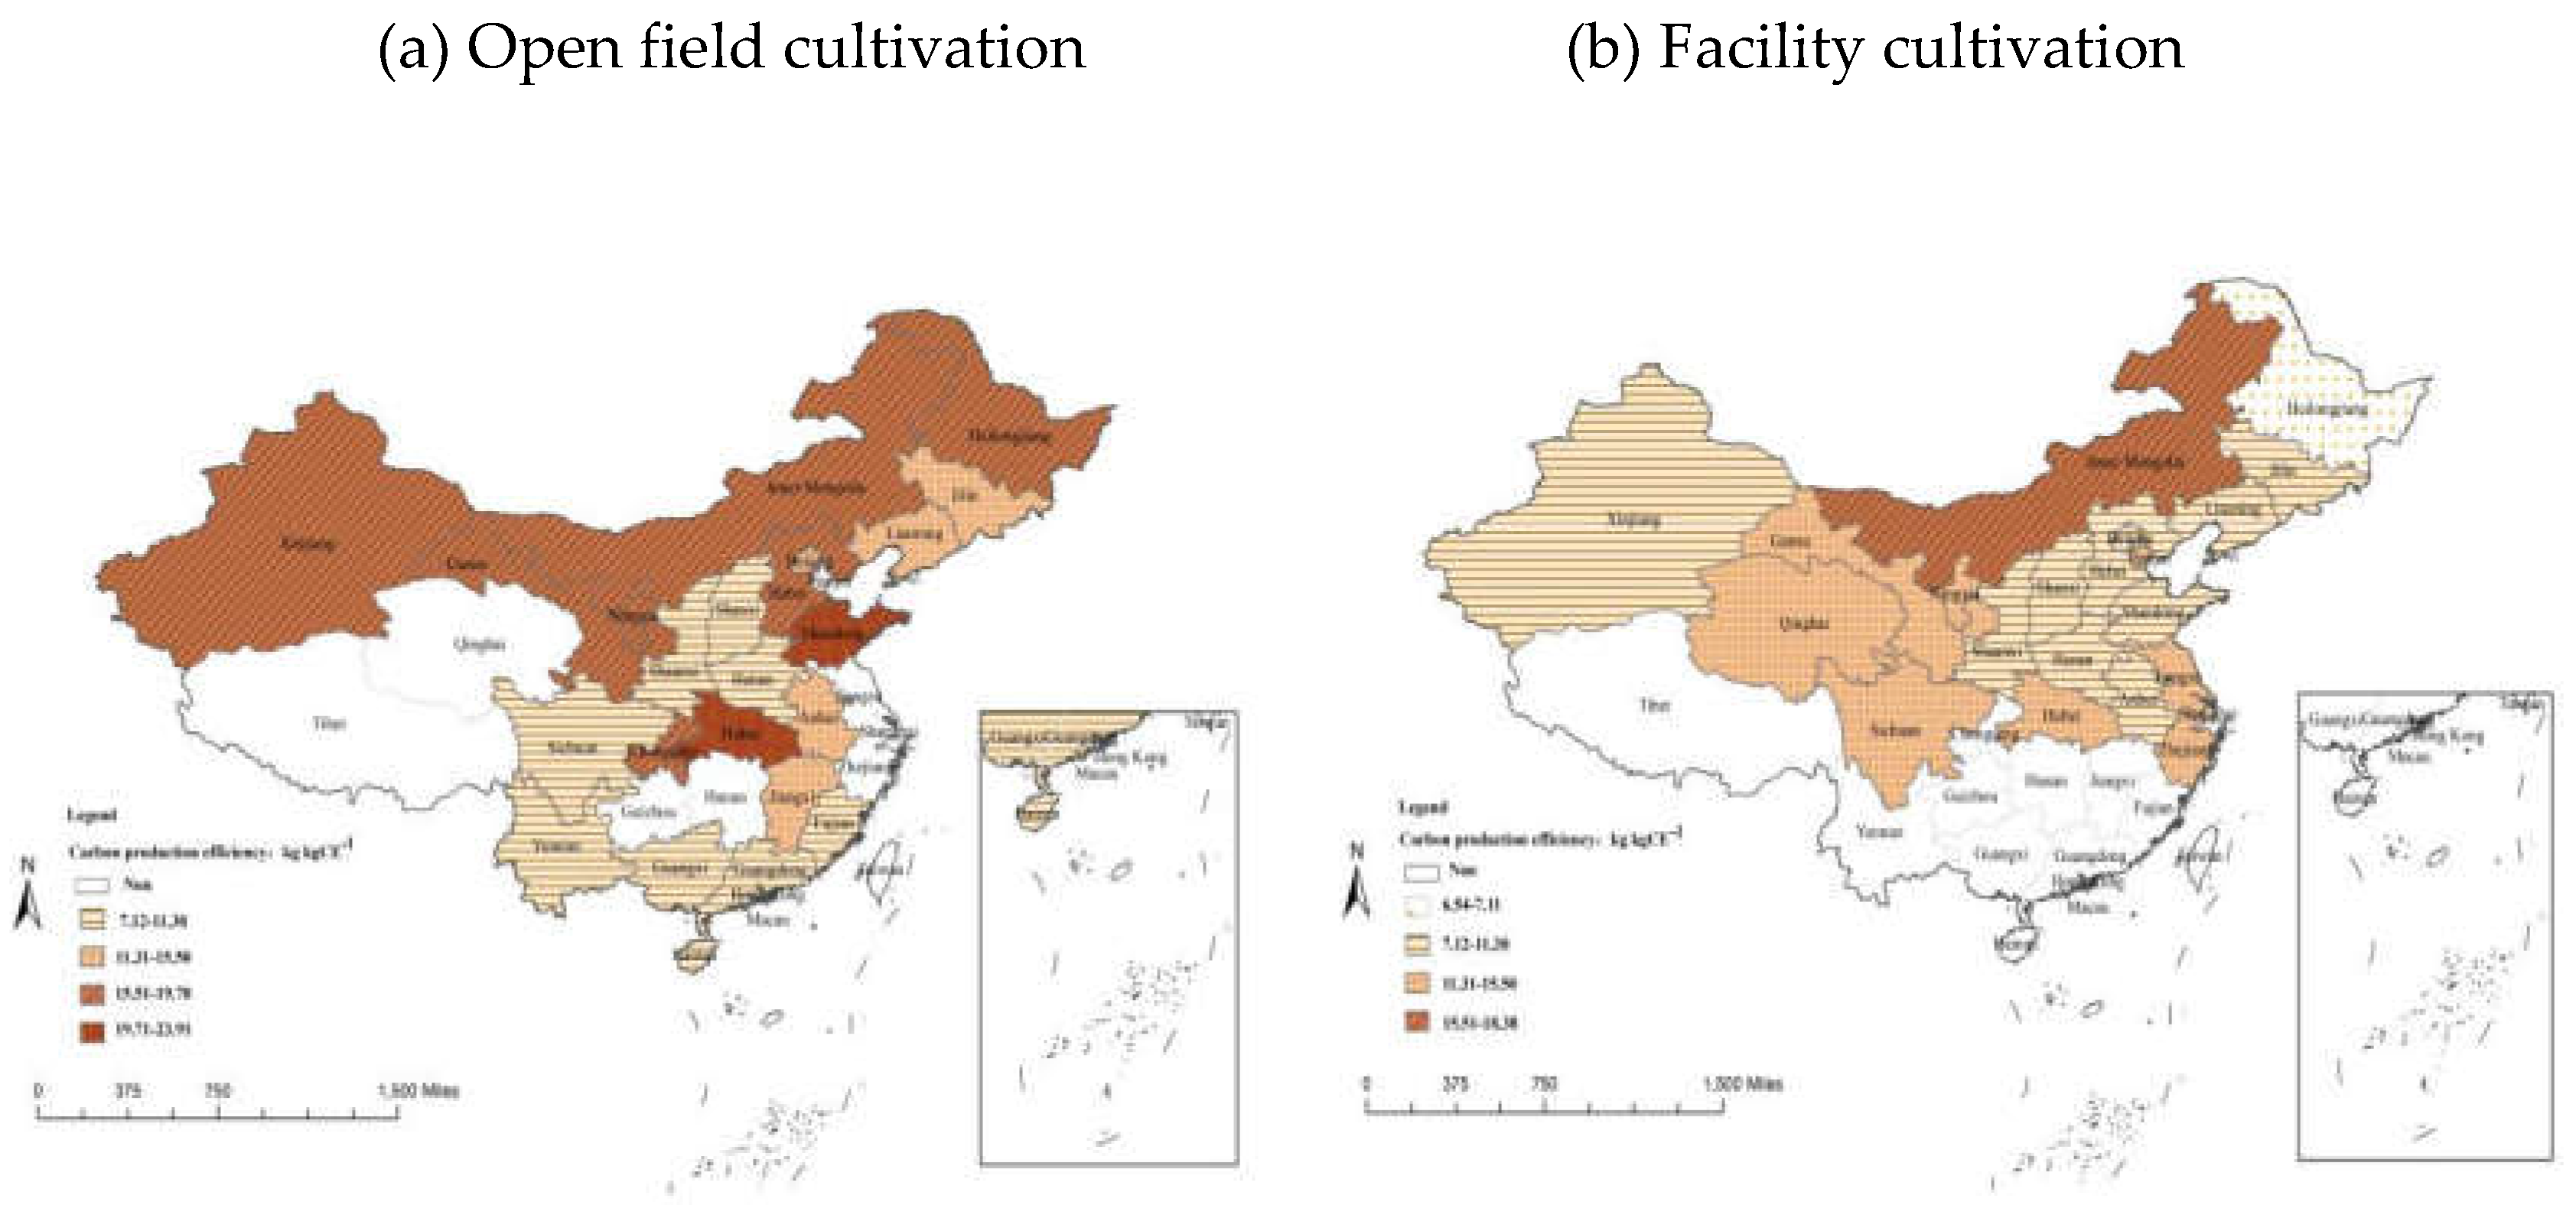
Figure 6.
Spatial distribution of carbon economic efficiency of open-field (a) and greenhouse (b) cucumber productions in various provinces of China.
Figure 6.
Spatial distribution of carbon economic efficiency of open-field (a) and greenhouse (b) cucumber productions in various provinces of China.
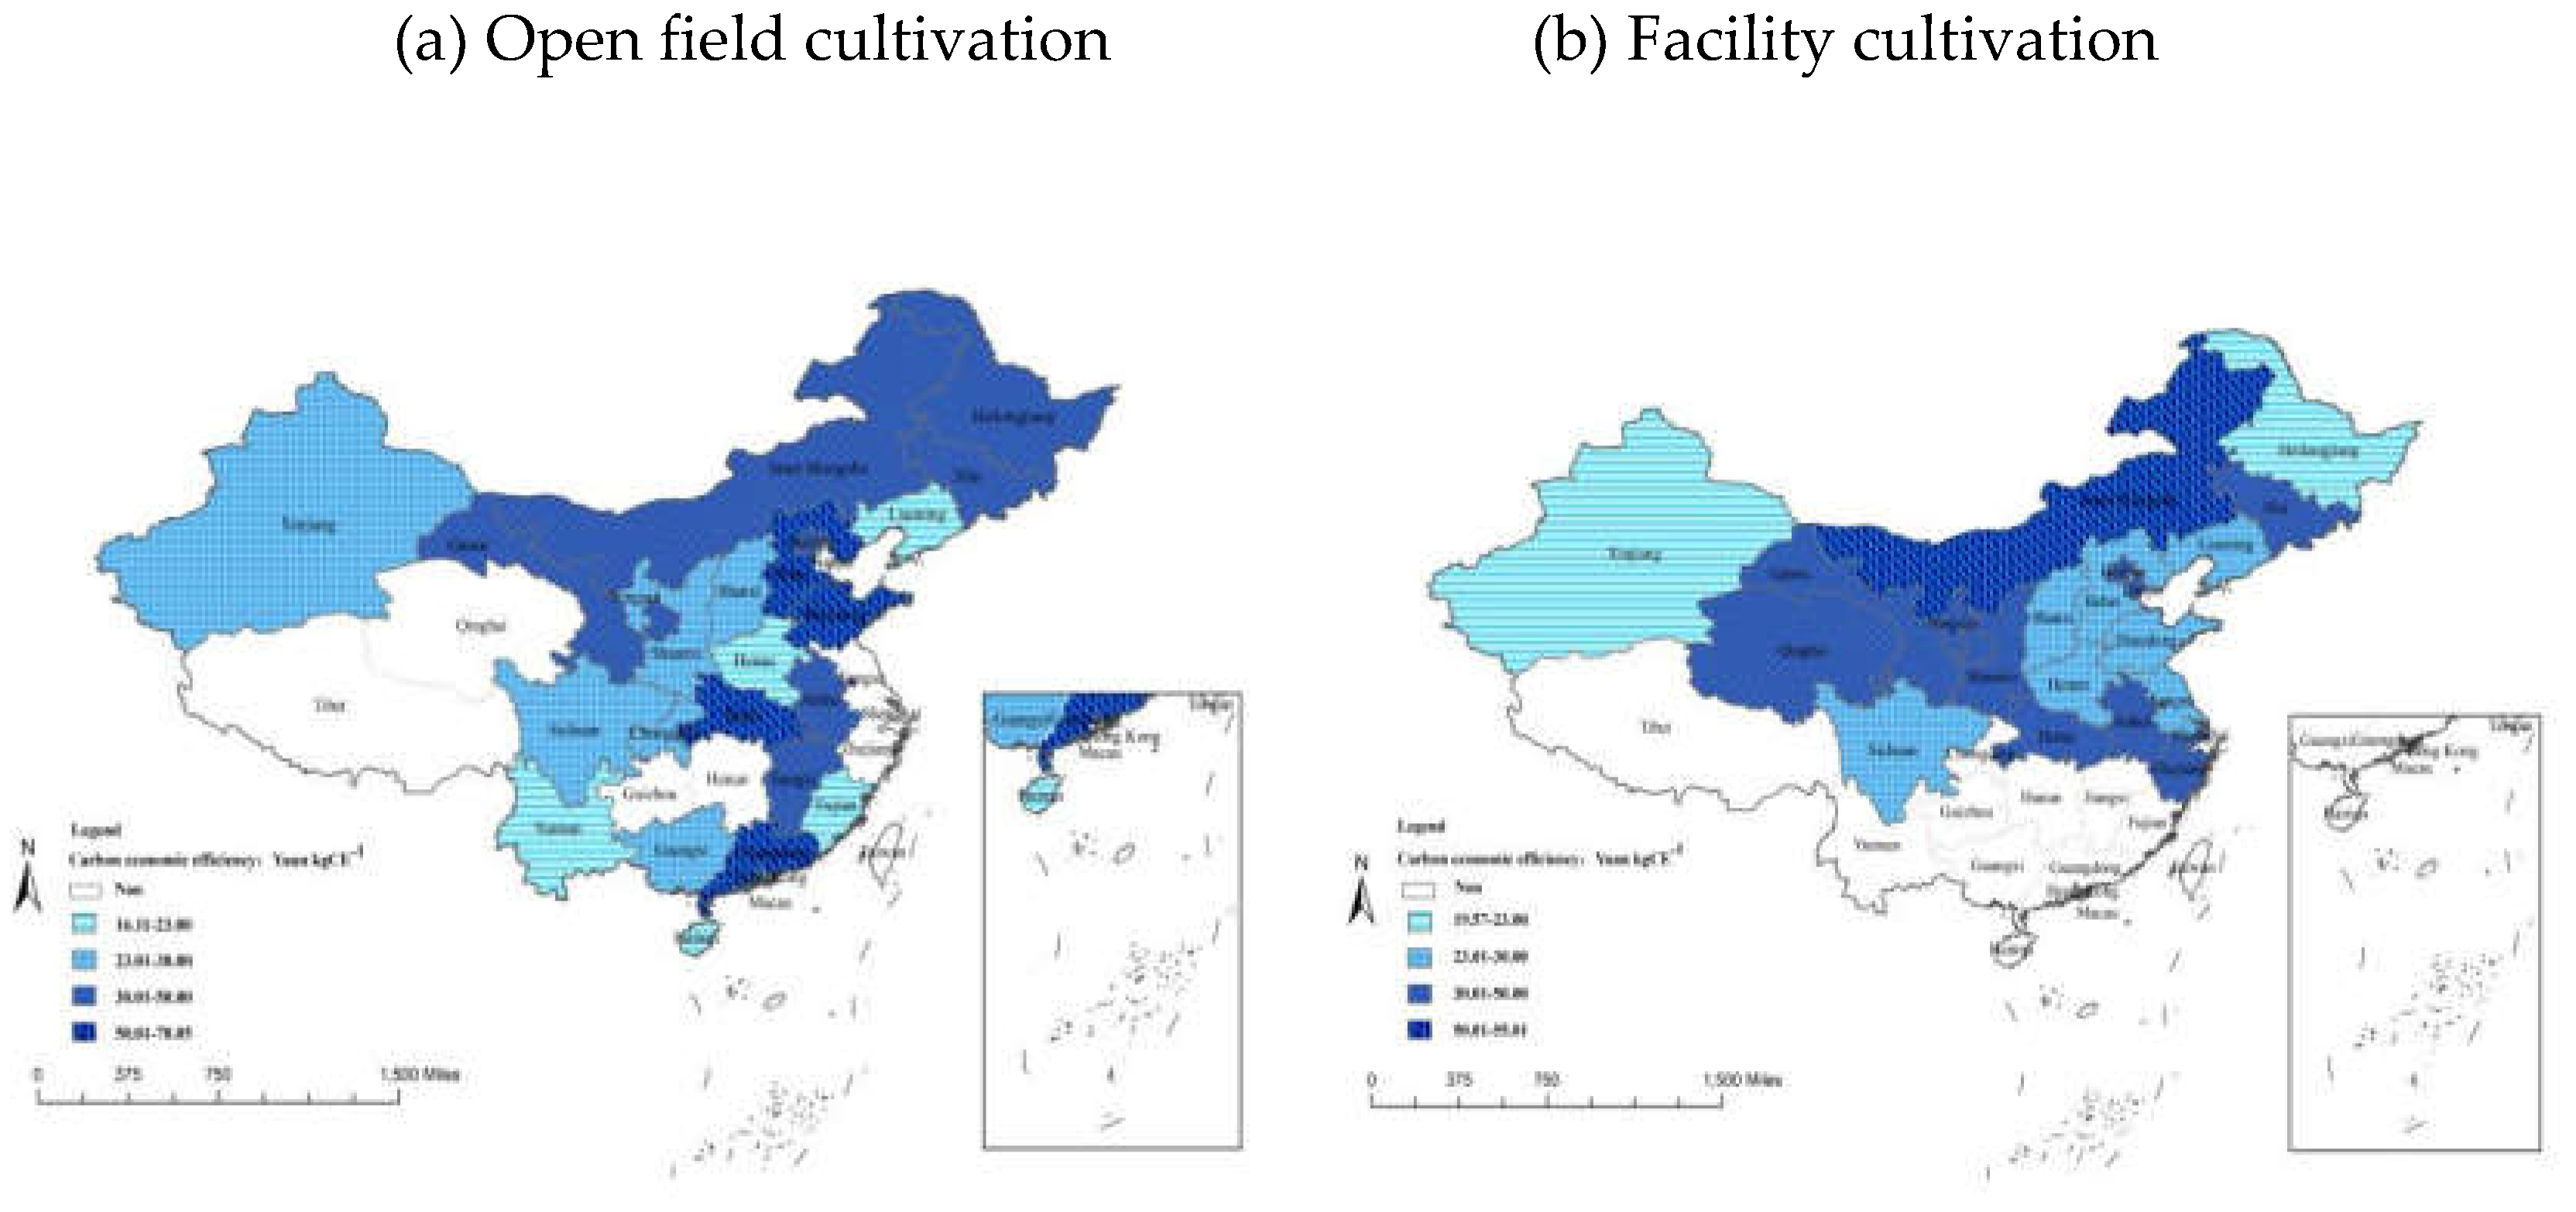

Table 1.
Greenhouse gas emission parameters of different inputs.
| Parameter | value | Data source |
| Nitrogen fertilizer | 1.526 kgCE/kg | CLCD 0.7 |
| Phosphate fertilizer | 1.631 kgCE/kg | CLCD 0.7 |
| Potassium fertilizer | 0.6545 kgCE/kg | CLCD 0.7 |
| Compound fertilizer | 1.772 kgCE/kg | CLCD 0.7 |
| Farmyard manure | 0.027 kgCE/kg | Lal (2004) [18] |
| Plastic film | 6.91 kgCE/kg | CLCD 0.7 |
| Pesticides | 6.58 kgCE/kg | Liu et al. (2013) [16] |
| Diesel oil | 3.32 kgCE/kg | Liu et al. (2013) [16] |
| Labor force | 0.86 kgCE/d | Liu et al. (2013) [16] |
Table 2.
Greenhouse gas emissions and evaluation of open-field and greenhouse cucumber productions.
| Cultivation mode | Labor force | Diesel | Barnyard manure | Chemical fertilizer | Pesticides | Agricultural film | Soil N2O | Total GHG emissions/kg CO2-eq ha-1 | |||||||
| GHG emissions/kg CO2-eq ha-1 | Proportion/% | GHG emissions/kg CO2-eq ha-1 | Proportion/% | GHG emissions/kg CO2-eq ha-1 | Proportion/% | GHG emissions/kg CO2-eq ha-1 | Proportion/% | GHG emissions/kg CO2-eq ha-1 | Proportion/% | GHG emissions/kg CO2-eq ha-1 | Proportion/% | GHG emissions/kg CO2-eq ha-1 | Proportion/% | ||
| Open-field Facility Increase rate of facility to open-field |
456.79 739.30 61.85% |
9.99% 8.49% -15.06% |
348.67 708.44103.19% |
7.63% 8.13% 6.64% |
312.73 519.62 66.16% |
6.84% 5.96% -12.80% |
1300.31 1399.45 7.63% |
28.44% 16.06% -43.52% |
33.39 33.89 1.50% |
0.73% 0.39% -46.73% |
477.83 3378.99 607.16% |
10.45% 38.78% 271.13% |
1642.971933.1717.66% | 35.93% 22.19% -38.25% |
4572.67 8712.86 90.54% |
| Cultivation mode | Carbon fixation/kg CO2-eq ha-1 | Net GHG emissions/ Kg CO2-eq ha-1 |
Land carbon intensity/ Kg CO2-eq ha-1 |
Carbon ecological efficiency | Carbon production efficiency/ kg kg CO2-eq-1 |
Carbon economic efficiency/Yuan kg CO2-eq-1 | |||||||||
| Open-field Facility Increase rate of facility to open-field |
810.48 1234.37 52.30% |
3762.20 7478.49 98.78% |
0.46 0.87 90.54% |
0.18 0.14 -20.07% |
12.74 10.19 -20.07% |
31.78 30.14 -5.14% |
|||||||||
Disclaimer/Publisher’s Note: The statements, opinions and data contained in all publications are solely those of the individual author(s) and contributor(s) and not of MDPI and/or the editor(s). MDPI and/or the editor(s) disclaim responsibility for any injury to people or property resulting from any ideas, methods, instructions or products referred to in the content. |
© 2025 by the authors. Licensee MDPI, Basel, Switzerland. This article is an open access article distributed under the terms and conditions of the Creative Commons Attribution (CC BY) license (http://creativecommons.org/licenses/by/4.0/).
Copyright: This open access article is published under a Creative Commons CC BY 4.0 license, which permit the free download, distribution, and reuse, provided that the author and preprint are cited in any reuse.


