
Submitted:
07 April 2025
Posted:
08 April 2025
You are already at the latest version
Abstract
Background/Objectives: The study aimed to investigate the differences in odor, color, and taste characteristics between raw and bran-fried Acori tatarinowii Rhizoma (RATR and BATR) using advanced sensory evaluation technologies. The objective was to establish a reliable differential analysis method for distinguishing RATR and BATR slices to support quality control in herbal processing. Methods: The Heracles NEO ultra-fast gas-phase electronic nose was employed to analyze odor profiles, while electronic eye and electronic tongue technologies were used to assess color and taste differences, respectively. Odor fingerprint analysis identified key volatile components, and colorimetric and taste measurements were conducted to compare RATR and BATR samples. Conclusions: The integration of Heracles NEO electronic nose, electronic eye, and electronic tongue technologies effectively distinguished RATR from BATR. This approach provides a novel strategy for online quality monitoring in herbal slice production and offers a robust analytical framework for the identification and quality assessment of processed herbal medicines.
Keywords:
Acori tatarinowii Rhizoma
; bran-fried
; Heracles NEO ultra-fast gas-phase electronic nose
; electronic eye
; electronic tongue
; quality control
1. Introduction
Acori tatarinowii Rhizoma (ATR) is the dried rhizome of Acori tatarinowii Schott, a plant belonging to the Araceae family. It is slightly cold in nature, with bitter, pungent, and sour flavors, and is associated with the spleen and stomach meridians. It has the effects of opening orifices, promoting mental clarity, resolving dampness, and stimulating appetite.[1] It is primarily produced in Jiangxi, Sichuan, Hunan, Hubei, and Guizhou provinces.[2] ATR contains various compounds, such as phenylpropanoids, terpenoids, lignans, flavonoids, alkaloids, amides, and organic acids.[3] The processing methods for ATR mainly include bran-fried ATR, fresh ATR, and ginger-processed ATR. When used in its raw form, ATR is more inclined to promote qi movement, open orifices, resolve phlegm, and enhance mental clarity and intelligence. After bran-frying, its dampness-resolving and appetite-stimulating effects are enhanced, making it suitable for conditions such as epigastric stuffiness, loss of appetite, and dysentery with inability to eat. The clinical applications of ATR change after bran-frying, highlighting the importance of accurately distinguishing between different processed forms of traditional Chinese medicinal slices for scientific and rational clinical use.[4]
Odor, color and taste are among the significant characteristics in the traditional empirical identification of Chinese medicine. After being stir-fried with bran, the odor of ATR shifts from 'aromatic' to 'having a roasted aroma', and its color changes from 'off-white or slightly red' to 'yellowish-brown to dark brown on the surface'. The changes in taste before and after processing are not explicitly described in the local standards.[27] And these descriptions are somewhat subjective and vague. The electronic nose is a device that simulates the human olfactory system. It detects odors through a specific array of sensors and uses a pattern recognition system to analyze complex scents.[5] The Heracles NEO ultra-fast gas-phase electronic nose, based on dual fast gas chromatography technology, is specifically designed for odor and aroma analysis. It achieves the separation and identification of volatile organic compounds (VOCs) based on the principles of gas chromatography, reflecting the overall information of VOCs in samples through odor fingerprint spectra.[6] Equipped with dual chromatographic columns (weak and medium polarity) and dual FID detectors, it can separate more compound signals. The selected chromatographic peaks serve as sensors, and through chemometrics, principal component analysis, and discriminant factor analysis, various models are established to achieve the discriminant analysis of odor substances.[7] The Heracles NEO ultra-fast gas-phase electronic nose boasts high sensitivity, rapid analysis, high throughput, real-time detection, and powerful data processing and analysis capabilities.[8,9] Compared to GC-MS and GC-IMS, its advantages include not only qualitative and quantitative analysis of samples but also aroma sensing technology and the olfactory recognition threshold of specific compounds, enabling sensory description of the sample's fragrance. To date, it has been utilized in food, medicine, cosmetics, and other fields. [10,11,12]
Electronic sensory evaluation systems primarily consist of E-nose, E-eye and E-tongue, which are capable of assessing the odor, color, and taste of samples. Intelligent sensory analysis technology, based on human sensory bionics, integrates sensor arrays with data processing units and pattern recognition systems to detect samples. [18,19] This technology offers advantages such as high precision and excellent reproducibility, providing a scientific and data-driven complement to traditional sensory evaluation methods. It is increasingly being applied in the production and development of food and pharmaceutical products. [20,21,22,23]
This study integrates Heracles NEO ultra-fast gas-phase electronic nose, electronic eye and electronic tongue technologies to analyze the differences in odor components, colorimetric variations and taste profiles of RATR and BATR. The aim is to distinguish between raw and bran fried ATR slices based on odor, color and taste, providing a reference for quality control of ATR medicinal materials.
2. Materials and Methods
2.1. Materials
ATR was purchased from Kangmei (Bozhou) Huatuo International Traditional Chinese Medicine City Commercial Co., Ltd. Detailed sample batch information is provided in Table 4. The samples were identified by Professor Deng Kezhong from Jiangxi University of Chinese Medicine, confirming their origin as the dried rhizomes of ATR Schott, a plant of the Araceae family. The n-alkane mixture reference standards (nC6 to nC16) were obtained from Restek Corporation, USA, batch number A0200647.
2.2. Preparation of Raw and Bran-Fried ATR
Ten batches of ATR medicinal materials were prepared, with detailed information provided in Table 4, which were raw products (R1-R5) and bran-fried ATR slices (B1-B5) processed under the ATR section and the general rules for bran-frying, according to the methods outlined in Part I of the 2020 edition of the Chinese Pharmacopoeia [1].
2.3. Preparation of Test Samples
Take raw and bran-fried ATR samples, grind them into powder, sieve through a No. 5 sieve, seal, and store in refrigeration for later use. For analysis, weigh 0.25 g of the sample powder into a 20 mL headspace vial, seal it with an aluminum crimp cap lined with silicone, and set aside.
2.4. Determination of Detection Conditions
Through single-factor experiments, the Heracles NEO detection conditions for raw and bran-fried samples were determined as follows, sample vial volume of 20 mL, sample weight of 0.25 g, incubation temperature of 45 °C, incubation time of 5 minutes, incubation oven rotation speed of 250 r/min, trap initial temperature of 40 °C, trap final temperature of 250 °C, trap split flow rate of 10 mL/min, trap duration of 14 seconds, injection port temperature of 200 °C, injection port pressure of 10 kPa, injection volume of 500 μL, injection rate of 125 μL/s, injection time of 9 seconds, valve temperature of 250 °C, initial column temperature of 50°C, column temperature program of 1.0 °C/s to 80 °C, then 3.0°C/s to 250°C, held for 21 seconds, acquisition time of 110 seconds, FID gain of 12.As shown in Table 3.

Table 5.
Electronic nose experimental parameters.
| Condition | Parameter | Condition | Parameter |
|---|---|---|---|
| Sample vial | 20 ml | Trap temperature | 40 ℃ |
| Sample amount | 0.25 g | Column front pressure | 57 kPa |
| Injection volume | 500 μl | Trap time | 14 s |
| Incubation temperature | 45 ℃ | Valve temperature | 250 ℃ |
| Incubation time | 5 min | Initial column oven temperature | 50 ℃ |
| Injection speed | 125 μL/s | Column temperature program | 3.0 ℃/s |
| Injection time | 9 s | Acquisition time | 110 s |
| Inlet temperature | 200 ℃ | FID gain | 12 |
| Inlet pressure | 10 kPa | FID offset | 1000 |
2.5. E-Eye Analysis
After turning on the instrument, the 24-color calibration plate was placed in the instrument for calibration. The lens exposure and focal length were adjusted to appropriate settings, using a 5nm aperture, D65 light source, and both top and bottom illumination. Images were captured in single snapshot mode. The raw and bran-fried ATR samples, ground and sieved through a No. 5 sieve, were evenly placed in a petri dish for image acquisition. The average value was taken after three parallel measurements, and the color codes and proportions of each sample were recorded. Each color code was represented by three indicators: lightness value (L*), red-green value (a*), and yellow-blue value (b*) [17]. The L* value ranges from 0 to 100, corresponding to colors from black to white; a* ranges from positive to negative, corresponding to colors from red to green; and b* ranges from positive to negative, corresponding to colors from yellow to blue. The total color value (E*ab) was calculated using the formula E*ab =[( L*)2+( a*)2+( b*)2]1/2, The greater the value of E*ab, the lighter the color. In addition, the total color difference (ΔE*ab) can be used to represent the color difference between two color codes. However, it cannot indicate the color bias. The calculation formula is as follows: E*ab =[( L*)2+( a*)2+( b*)2]1/2.
2.6. E-Tongue Analysis
The taste characteristics of ATR samples were analyzed with a S-5000Z taste sensor, E-tongue instrument (INSENT Inc., Atsugi-shi, Japan) that is equipped with five chemical sensors for bitterness and aftertaste bitterness (aftertaste-B), astringency and aftertaste astringency (aftertaste-A), umami and richness, saltiness, and sourness, as well as two reference electrodes.[24] The ATR slices were pulverized and passed through a No. 3 sieve. Precisely weighed, 2 g of the powdered sample was mixed with 100 mL of purified water, thoroughly stirred, and sonicated for 10 minutes. The mixture was then centrifuged at 3000 r/min for 5 minutes, and the supernatant was filtered through filter paper to obtain the test solution.[25]
2.7. Data Analysis
The collection of electronic nose information is achieved by recording the odor chromatograms on the MXT-5 column. Calibration is performed using the n-alkane standard solution (nC6 to nC16). The retention time is converted into the Kovats retention index, and qualitative results are obtained through the AroChemBase database.
3. Results
3.1. Analysis of Ultra-Fast Gas-Phase Electronic Nose Detection
Following the detection conditions specified in section "3.6.5," the raw and bran-fried ATR slice samples from each batch were analyzed to establish odor fingerprint spectra. The calibration mixture of n-alkanes (nC6~nC16) and reference standards were placed in headspace vials and analyzed under the same incubation and analysis conditions as the samples. The retention times of the chromatographic peaks of raw and bran-fried ATR slices were converted into Kovats retention indices. Qualitative analysis of the volatile components in the samples was conducted by referencing the AroChemBase database,[13] and changes in odor components between raw and bran-fried ATR slices were compared. Multivariate statistical analysis of the odor fingerprint spectra of each sample was performed using Alpha Soft 17.0 software (Toulouse, France) to compare sample differences and identify distinctive odor marker compounds.
3.2. Establishment of Odor Fingerprint Spectra
Based on the detection and analysis results from the Heracles NEO ultra-fast gas-phase electronic nose, odor fingerprint spectra for raw and bran-fried ATR slice samples were established using signals collected from the MXT-5 column. The results are shown in Figure 1 and Figure 2.
In the images, different colors represent different samples: red represents Hunan, blue represents Sichuan, green represents Jiangxi, purple represents Guizhou, and black represents Hubei. From the overlapping gas chromatograms, it can be observed that the detection results of the two groups of samples are generally similar, with the peaks of higher response values having nearly identical retention times, but significant differences in peak areas. From the spectra, the chromatographic peaks are generally higher between 70-80 seconds, with a characteristic peak near 80 seconds. Analysis of this peak reveals that the chromatographic peak of the samples from Jiangxi is significantly higher than those from the other four regions. Between 80-100 seconds, the chromatographic peaks of all groups are relatively low, with no significant differences among the groups. Analysis of the original spectra shows that the differences between raw and bran-fried ATR are mainly reflected in changes in peak height. In terms of peak height differences, the chromatographic peak heights of bran-fried ATR from all five regions are significantly increased compared to the raw samples, with the most noticeable difference observed in the samples from Hunan before and after processing.
3.3. Analysis of Odor Changes
The Heracles NEO ultra-fast gas-phase electronic nose can provide sensory information on volatile components. By comparing the gas chromatograms of ATR samples before and after processing on the MXT-5 column, as shown in Figure 1 and 2, and combining the information from the Arochembase database, qualitative analysis results were presented in Table 1.
Calibration was performed using the n-alkane standard solution (nC6 to nC16), converting the retention times into retention indices, and then qualitative identification was carried out using the Kovats retention index. Compounds were qualitatively analyzed in the Arochembase database.[14] The results showed that raw ATR exhibited 12 odor components, while bran-fried ATR exhibited 15 odor components. Among these, 12 odor components were common to both, including benzaldehyde, o-dichlorobenzene, L-limonene, undecane, 2,6-dimethoxyphenol, decanal, geranial, methyl eugenol, 2-dodecanol, methyl dodecanoate, 4-undecalactone, and tributyl phosphate, which have odors such as almond and bitterness. Additionally, bran-fried ATR exhibited three new odor components, such as methanol, 2-propanol and 2-cyclopentenone, which have a pungent odor, consistent with the traditional description of the roasted aroma produced after bran-frying.[26]
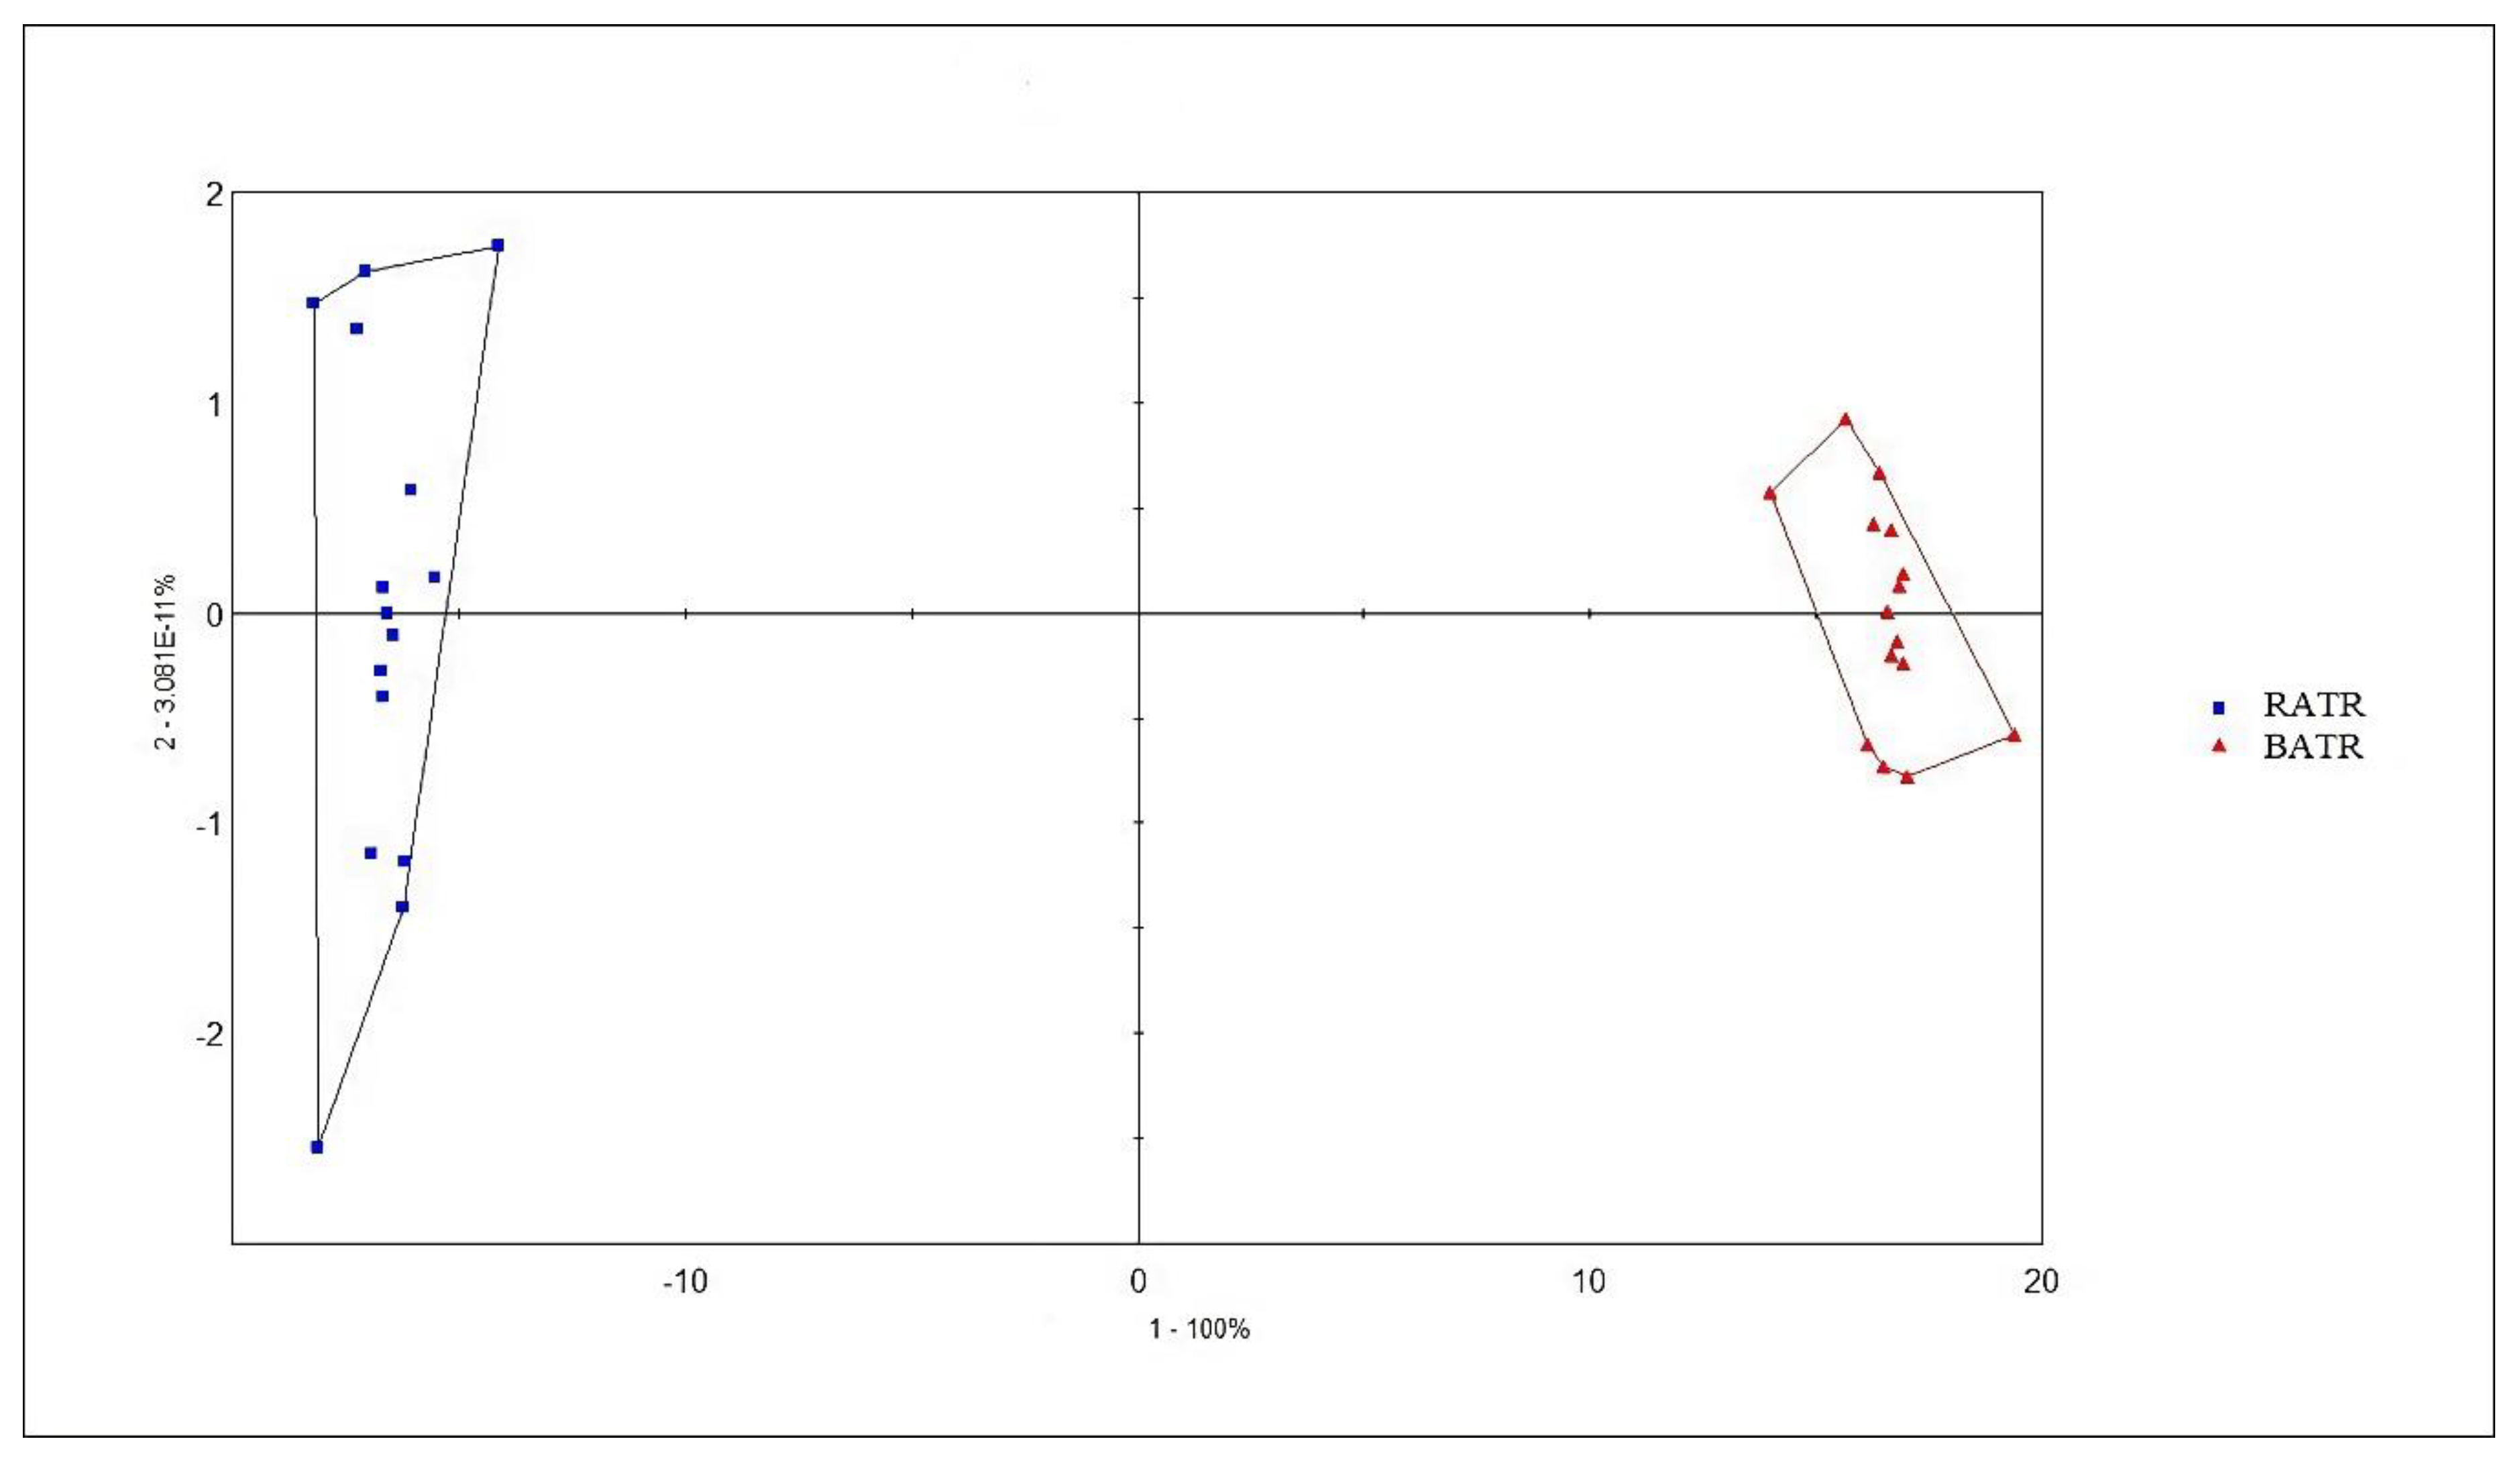
3.4. Principal Component Analysis (PCA) of the Heracles NEO Electronic Nose
PCA is an unsupervised pattern recognition method that reduces the dimensionality of data by extracting several factors with larger eigenvalues that can reflect sample information variables for linear classification. It can intuitively display differences between samples in multidimensional space and also show the distribution between variables.[15] The chromatographic peaks separated by the ultra-fast gas-phase electronic nose were used as influencing factors for PCA, and the results are shown in Figure 3 and 4. In the PCA model, the contribution rate of the first principal component (PC1) was 99.937%, the second principal component (PC2) was 0.03826%, and the third principal component (PC3) was 0.007046%. The cumulative contribution rate of the principal components reached 99.9823%, effectively distinguishing between raw and bran-fried ATR.
In this study, chemometric analysis was conducted using the Alphasoft 11.0 software integrated with the Heracles Neo ultra-fast gas-phase electronic nose. PCA analysis of raw and bran-fried ATR samples demonstrated that the Heracles NEO ultra-fast gas-phase electronic nose can rapidly distinguish between raw and bran-fried processed samples of ATR.
Figure 5.
DFA analysis of raw and bran-fried ATR.
3.5. Discriminant Factor Analysis (DFA) of the Heracles NEO Electronic Nose
PCA is an unsupervised pattern recognition method that reduces the dimensionality of data by extracting several factors with larger eigenvalues that can reflect sample information variables for linear classification. It can intuitively display differences between samples in multidimensional space and also show the distribution between variables.[15] The chromatographic peaks separated by the ultra-fast gas-phase electronic nose were used as influencing factors for PCA, and the results are shown in Figure 3 and 4. In the PCA model, the contribution rate of the first principal component (PC1) was 99.937%, the second principal component (PC2) was 0.03826%, and the third principal component (PC3) was 0.007046%. The cumulative contribution rate of the principal components reached 99.9823%, effectively distinguishing between raw and bran-fried ATR. In this study, chemometric analysis was conducted using the Alphasoft 11.0 software integrated with the Heracles Neo ultra-fast gas-phase electronic nose. PCA analysis of raw and bran-fried ATR samples demonstrated that the Heracles NEO ultra-fast gas-phase electronic nose can rapidly distinguish between raw and bran-fried processed samples of ATR.
3.6. E-Eye Analysis
L* represents lightness, ranging from 0 (black) to 100 (white). a* represents the green-red axis, where negative values indicate green and positive values indicate red. b* represents the blue-yellow axis, where negative values indicate blue and positive values indicate yellow. E*ab represents the total color difference, which is a measure of the overall deviation in color. The lightness values range from 58.65 to 64.85, indicating that the raw samples are relatively light in color. The lightness values range from 48.91 to 53.50, showing a significant decrease compared to the raw samples. This suggests that bran-frying darkens the color of the samples. The a* values range from 5.83 to 6.41, indicating a slight red dominance. The a* values range from 7.41 to 8.34, showing an increase in red dominance compared to the raw samples. This suggests that bran-frying enhances the red component of the color. The b* values range from 13.95 to 15.22, indicating a slight yellow dominance. The b* values range from 13.79 to 17.29, showing a slight increase in yellow dominance compared to the raw samples. The E*ab values range from 78.48 to 85.74. The E*ab values range from 70.11 to 79.13. The overall color difference is lower for bran-fried samples, indicating a more consistent color profile after processing. This suggests that bran-frying also enhances the yellow component of the color. The chromaticity values of samples R1 to R5 and B1 to B5 are presented in Table 2, and images and PCA of the electronic eye are shown in Figure 6 and 7.
3.7. Correlation Analysis of E-Nose and E-Eye
A correlation analysis was conducted between the chromaticity and chemical components of odor in ATR before and after stir-frying with bran. The peak areas of 15 odor components and the corresponding chromaticity parameters (L*, a*, b*, E*ab) were input into Origin Pro 2021 software to generate a visualized heatmap. The results are presented in Figure 8. It was observed that odor components 1, 2, and 3 exhibited significant correlations with chromaticity values, all showing negative correlations with L. These findings are consistent with the results obtained from the electronic nose analysis.
3.8. E-Tongue Analysis
The acidity of the raw samples is consistently negative, with relatively high absolute values ranging from -18.65 to -26.31, indicating a low level of acidity. The bitterness values are all positive, ranging from 2.23 to 2.95, suggesting a moderate bitter taste in these samples. Astringency values are also negative, ranging from -2.39 to -2.75, indicating a weak astringent sensation. The aftertaste values are close to zero, implying a subtle aftertaste. Umami values are positive, ranging from 4.28 to 7.06, indicating a noticeable umami taste. The richness values are low, ranging from 0.11 to 0.22, suggesting a light and delicate mouthfeel. Saltiness values vary between positive and negative, but with small absolute values, indicating an indistinct salty taste. After bran-frying, the acidity remains negative, with values ranging from -19.27 to -23.09, but the absolute values are slightly lower than those of the raw samples, indicating a marginally higher acidity compared to the raw state. Bitterness values are all positive, ranging from 2.14 to 3.73, and generally higher than those of the raw samples, suggesting an enhanced bitter taste post-processing. Astringency values remain negative, ranging from -1.91 to -3.14, but with smaller absolute values, indicating a slightly stronger astringent sensation. Aftertaste values are higher, particularly for Aftertaste-A, indicating a more pronounced aftertaste. Umami values remain positive, ranging from 4.89 to 6.89, similar to those of the raw samples. Richness values are higher, ranging from 0.23 to 0.49, suggesting a more complex mouthfeel. Saltiness values vary between positive and negative, but with larger absolute values, indicating a more noticeable salty taste in some samples. In summary, the raw samples exhibit low acidity, moderate bitterness, weak astringency, a subtle aftertaste, and a light mouthfeel. In contrast, the bran-fried samples show slightly higher acidity, stronger bitterness, slightly stronger astringency, a more pronounced aftertaste, and a richer mouthfeel. The results are presented in Table 3 and Figure 9.
Table 3.
E-tongue data of raw and bran fried ATR.
| NO. | Type | Sourness | Bitterness | Astringency | Aftertaste-B | Aftertaste-A | Umami | Richness | Saltiness |
|---|---|---|---|---|---|---|---|---|---|
| 1 | R1 | -22.68 | 2.23 | -2.65 | -0.44 | 0.24 | 5.53 | 0.17 | -2.31 |
| 2 | R2 | -26.31 | 2.95 | -2.58 | 0.46 | 0.63 | 7.05 | 0.17 | 2.64 |
| 3 | R3 | -25.72 | 2.89 | -2.41 | 0.33 | 0.78 | 7.06 | 0.22 | 4.07 |
| 4 | R4 | -25.27 | 2.33 | -2.75 | -0.39 | 0.51 | 6.55 | 0.11 | 1.72 |
| 5 | R5 | -18.65 | 2.35 | -2.39 | -0.2 | 0.56 | 4.28 | 0.14 | -1.11 |
| 6 | B1 | -20.42 | 2.65 | -2.47 | 0.19 | 0.8 | 5.25 | 0.25 | 1.02 |
| 7 | B2 | -19.27 | 2.94 | -2.61 | 0.49 | 0.82 | 4.99 | 0.36 | 0.76 |
| 8 | B3 | -20.6 | 3.47 | -2.19 | 0.87 | 0.85 | 5.61 | 0.4 | 2.33 |
| 9 | B4 | -23.09 | 3.73 | -1.91 | 1.11 | 1.21 | 6.89 | 0.49 | 5.35 |
| 10 | B5 | -20.21 | 2.14 | -3.14 | -0.12 | 0.34 | 4.89 | 0.23 | -1.69 |
4. Discussion
Currently, there is extensive research on the chemical components of ATR, but studies on its odor components, color and taste between before and after bran stir-frying are relatively limited. This study developed a differential analysis method for the odor of raw and bran-stir-fried ATR slices using the Heracles NEO ultra-fast gas-phase electronic nose. The volatile components in five batches of raw and bran-fried ATR samples were analyzed. The odor fingerprint spectra of raw and bran-stir-fried ATR slices were determined, and 15 odor chemical components were identified. Among these, methanol, 2-propanol, and 2-cyclopentenone were newly identified odor components after bran stir-frying. Combined with chromaticity measurements using an electronic eye, a correlation analysis between odor components and chromaticity values was conducted, further confirming methanol, 2-propanol, and 2-cyclopentenone as differential odor components between raw and bran-stir-fried ATR. After bran stir-frying, ATR tends to enhance its dampness-resolving and stomach-opening effects, better meeting clinical treatment needs. Volatile components are the main active constituents responsible for the dampness-resolving effect of ATR. Previous studies have found that the main volatile components, such as β-asarone, α-asarone, and trans-methylisoeugenol, increase in content after bran stir-frying.[28] It is hypothesized that the enhanced dampness-resolving and stomach-opening effects of bran-stir-fried ATR may be related to the increase in the types and content of these volatile components. However, the underlying mechanisms require further investigation through modern pharmacological studies.
Based on the E-eye analysis, Bran-frying results in a noticeable darkening of the samples, an increase in red dominance, and a slight increase in yellow dominance. The bran-fried samples exhibit a more consistent color profile, as indicated by the lower range of E*ab values compared to the raw samples. This analysis provides valuable insights into the color changes associated with the bran-frying process, which can be crucial for quality control and standardization in the production of ATR slices.
The E-tongue analysis results show that Raw samples exhibit low acidity, moderate bitterness, weak astringency, a subtle aftertaste and a light mouthfeel. In contrast, the bran-fried samples show slightly higher acidity, stronger bitterness, slightly stronger astringency, a more pronounced aftertaste and a richer mouthfeel. This provides technical support for identification and quality control of RATR and BATR.
This study speculates that the newly identified odor components after bran stir-frying may result from complex chemical reactions between bran and ATR during high-temperature stir-frying. Changes in the composition and content of volatile components during the stir-frying process are the material basis for the altered properties and efficacy of bran-stir-fried ATR. Further research is needed to explore the patterns of component changes during bran stir-frying and to elucidate the processing mechanisms by combining pharmacological studies. This research provides a feasible strategy for identifying ATR before and after processing, addressing the limitations of traditional morphological identification. It also offers reference value for the application of sensory technologies such as E-nose,E-eye and E-tongue in the detection of other food and pharmaceutical products. By analyzing the odor, color and taste of RATR and BATR, this study lays a solid foundation for research on the quality standards and optimization of processing techniques for ATR slices. Additionally, it provides a reference for further studies combining pharmacological research to clarify the pharmacodynamic material basis and elucidate the processing mechanisms of bran-stir-fried ATR.
5. Conclusions
This study demonstrates that bran stir-frying significantly alters the odor, color, and taste profiles of ATR slices, with newly identified volatile components (methanol, 2-propanol, and 2-cyclopentenone) contributing to the differential odor. The darkening, increased redness, and enhanced bitterness/astringency of bran-fried ATR correlate with its traditional efficacy in dampness-resolving and stomach-opening effects. The integration of E-nose, E-eye, and E-tongue technologies provides a robust method for distinguishing raw and processed ATR, offering valuable insights for quality control and standardization. Further pharmacological research is needed to elucidate the mechanisms underlying these changes and optimize processing techniques. This approach also holds promise for applications in other food and pharmaceutical products.
Author Contributions
Conceptualization, J.-L.Z. and L.-Y.Z.; methodology, K. S., Y.-N.L. and Z.-J.Y.; software, Y.-N.L.; validation, Y.-N.L., J.-L.Z., L.-Y.Z. and S.-L.M.; formal analysis, L.X.; investigation, L.X., Z.-J.Y. and Y.C.; resources, Z.-J.Y.; data curation, Y.C.; writing—original draft preparation, Y.-N.L.; writing—review and editing, Y.-N.L. and S.-L.M.; visualization, Z.-J.Y. and R.-P.W.; supervision, J.-L.Z.; project administration, L.-Y.Z. and J.-L.Z.; funding acquisition, J.-L.Z. All authors have read and agreed to the published version of the manuscript.
Funding
This research was funded by the Jiangxi TCM Standardization Research Program (No. 2025A15), Chinese Medicine Concoction Technology Inheritance and Innovation Project of the State Administration of Traditional Chinese Medicine (NO.GZY-KJS-2022-051), Standardization project of Jiangxi Provincial Standard Committee of Traditional Chinese Medicine (NO.2023A19), Jiangxi Province High-level Undergraduate Teaching Team of ‘Undergraduate Teaching Team of Proprietary Chinese Medicines’ (NO.2252201013), Jiangxi University of Chinese Medicine Virtual Teaching and Research Office (NO.2252300109), The first scientific and technological innovation team (NO.CXTD22003), Scientific and technological research project of Jiangxi Provincial Department of Education (NO.GJJ218920), University-level scientific research project of Nanchang Medical College (NO.NYXJ-2024-061), Scientific and technological research project of Jiangxi Provincial Department of Education (NO.GJJ218920), and the APC was funded by Jinlian Zhang.
Institutional Review Board Statement
Not applicable.
Informed Consent Statement
Not applicable.
Data Availability Statement
The authors confirm that the data supporting the findings of this study are available within the article.
Acknowledgments
Thanks go to the Research and Development Center of Jiangzhong Pharmaceutical company for help and encouragement.
Conflicts of Interest
The authors declare no conflict of interest.
Abbreviations
The following abbreviations are used in this manuscript:
| ATR | Acori tatarinowii Rhizoma |
| VOCs | Volatile organic compounds |
| BATR | Bran-fried acori tatarinowii Rhizoma |
| RATR | Raw acori tatarinowii Rhizoma |
References
- Chinese Pharmacopoeia Commission. Pharmacopoeia of the People’s Republic of China [M]. Beijing: China Medical Science Press, 2020.
- Qiu, L.Y.; Yang, G.; Jin, Q.; et al. Chemical constituents and anti-inflammatory activity of Acori tatarinowii Rhizoma rhizomes [J]. Chinese Traditional and Herbal Drugs, 2022, 53, 4617–4624. [Google Scholar]
- Li, P.H.; Sun, Y.; Feng, X.L.; et al. Prediction and analysis of quality markers of Acori tatarinowii Rhizoma based on fingerprint, chemical pattern recognition, and network pharmacology [J]. China Journal of Chinese Materia Medica, 2024, 33, 1174–1184. [Google Scholar]
- Zhao, Y.; Li, J.; Cao, G.S.; et al. Ethnic, botanic, phytochemistry, and pharmacology of the Acorus L. genus: A review [J]. Molecules 2023, 28, 20–21. [Google Scholar] [CrossRef]
- Shuba, A.; Umarkhanov, R.; Bogdanova, E.; et al. Possibilities of an electronic nose on piezoelectric sensors with polycomposite coatings to investigate the microbiological indicators of milk [J]. Sensors, 2024, 11, 3634. [Google Scholar] [CrossRef]
- Cai, W.T.; Feng, T.; Song, S.Q.; et al. Research progress of machine learning in predicting food flavor [J]. Food Science, 2024, 12, 11–21. [Google Scholar]
- Zha, S.H.; Wang, J.L.; Zhou, S.Y.; et al. Rapid identification of American ginseng originated from varied places based on Heracles ultra-fast gas phase electronic nose [J]. Science and Technology of Food Industry, 2023, 44, 284–291. [Google Scholar]
- Nai, G.Y.; Zhang, H.L.; Yue, Y.Y.; et al. Influences of different aging containers on the wine quality analyzed by electronic nose and HS-SPME-GC-MS [J]. Journal of Anhui Agricultural University, 2024, 51, 152–158. [Google Scholar]
- Sipos, L, Végh, R, Bodor, Z, et al. Classification of bee pollen and prediction of sensory and colorimetric attributes-A sensometric fusion approach by e-nose, e-tongue, and NIR [J]. Sensors 2020, 20, 67–68.
- Shen, C.; Cai, Y.; Wu, X.; et al. Characterization of selected commercially available grilled lamb shashliks based on flavor profiles using GC-MS, GC×GC-TOF-MS, GC-IMS, E-nose, and E-tongue combined with chemometrics [J]. Food Chemistry, 2023, 423, 136257. [Google Scholar] [CrossRef]
- Wang, Q.; Chen, X.; Zhang, C.; et al. Discrimination and characterization of volatile flavor compounds in fresh oriental melon after forchlorfenuron application using electronic nose (E-nose) and headspace-gas chromatography-ion mobility spectrometry (HS-GC-IMS) [J]. Foods, 2023, 12, 1272. [Google Scholar] [CrossRef]
- Wei, G.; Dan, M.; Zhao, G.; et al. Recent advances in chromatography-mass spectrometry and electronic nose technology in food flavor analysis and detection [J]. Food Chemistry, 2023, 405, 134814. [Google Scholar] [CrossRef] [PubMed]
- Qin, Y.W.; Fei, C.H.; Su, L.L.; et al. Rapid identification of odor difference markers in Curcuma wenyujin before and after vinegar processing based on Heracles NEO ultra-fast gas chromatography electronic nose [J]. Chinese Traditional and Herbal Drugs, 2022, 53, 1313–1319. [Google Scholar]
- Wu, W.Q.; Mao, Y.N.; Li, H.; et al. Identification of the quality of Lonicera japonica powder using Heracles II ultra-fast gas phase electronic nose [J]. China Journal of Chinese Materia Medica, 2019, 44, 5129–5133. [Google Scholar]
- Yimenu, S.M.; Kim, J.Y.; Kim, B.S. Prediction of egg freshness during storage using electronic nose [J]. Poultry Science, 2017, 96, 3733–3746. [Google Scholar] [CrossRef] [PubMed]
- Li, Y.; Gong, J.W.; Fei, C.H.; et al. Rapid identification and odor difference markers of three Schisandra medicinal pieces using fast gas phase electronic nose combined with artificial neural network [J]. Chinese Traditional and Herbal Drugs, 2022, 53, 1303–1312. [Google Scholar]
- Zhang, X.; Li, X.Q.; Wang, Y.; et al. Dynamic correlation study between HPLC fingerprint changes and appearance color during the stir-frying process of Gardeniae Fructus Praeparatus [J]. Chinese Traditional and Herbal Drugs, 2018, 49, 4029–4037. [Google Scholar]
- JIANG S, ZHU Y W, PENG J Y, et al. Characterization of stewed beef by sensory evaluation and multiple intelligent sensory technologies combined with chemometrics methods[J]. Food Chemistry 2023, 408, 135193. [CrossRef]
- ROSA A R D, LEONE F, CHELI F, et al. Fusion of electronic nose, electronic tongue and computer vision for animal source food authentication and quality assessment-a review[J]. Journal of Food Engineering 2017, 210, 62–75. [CrossRef]
- Wang Tielong, Xu Lingyun, Yang Guanshan, et al. Research progress of intelligent sensory analysis technology in food flavor [J]. Journal of Food Safety and Quality Inspection 2023, 14, 37–43.
- OUYANG Q, ZHAO J W, CHEN Q S, et al. Instrumental intelligent test of food sensory quality as mimic of human panel test combining multiple cross-perception sensors and data fusion[J]. Analytica Chimica Acta 2014, 841, 68–76. [CrossRef]
- FIKRI N A, ADOM A H, SHAKAFF A Y M, et al. Development of human sensory mimicking system[J]. Sensor Letters 2011, 9, 423–427. [CrossRef]
- GHASEMI-VARNAMKHASTI M, MOHTASEBI S S, SIADAT M. Biomimetic-based odor and taste sensing systems to food quality and safety characterization: an overview on basic principles and recent achievements[J]. Journal of Food Engineering 2010, 100, 377–387. [CrossRef]
- JIANG S, ZHU Y W, PENG J Y, et al. Characterization of stewed beef by sensory evaluation and multiple intelligent sensory technologies combined with chemometrics methods[J]. Food Chemistry 2023, 408, 135193. [CrossRef] [PubMed]
- Zhu, Y. W. Zhou, X. R., Chen, Y. P., Liu, Z. Y., Jiang, S., Chen, G. L., & Liu, Y. Exploring the relationships between perceived umami intensity, umami components and electronic tongue responses in food matrices[J]. Food Chemistry 2022, 368, 130849. [Google Scholar]
- Sichuan Provincial Food and Drug Administration. Sichuan Province Traditional Chinese Medicine Decoction Pieces Processing Standards [M], Chengdu: Sichuan Science and Technology Press, 2015,372.
- Henan Provincial Food and Drug Administration. Henan Province Traditional Chinese Medicine Decoction Pieces Processing Standards [M], Zhengzhou: Henan People's Publishing House, 2005,36.
- Chen Zhilin, Du Hongzhi, Wan Wanruo, et al. Analysis of volatile components in Acorus tatarinowii before and after bran-frying by gas chromatography-mass spectrometry [J]. Guizhou Science 2021, 39, 45–48.
Figure 1.
Odor fingerprints of 5 batches of RATR.
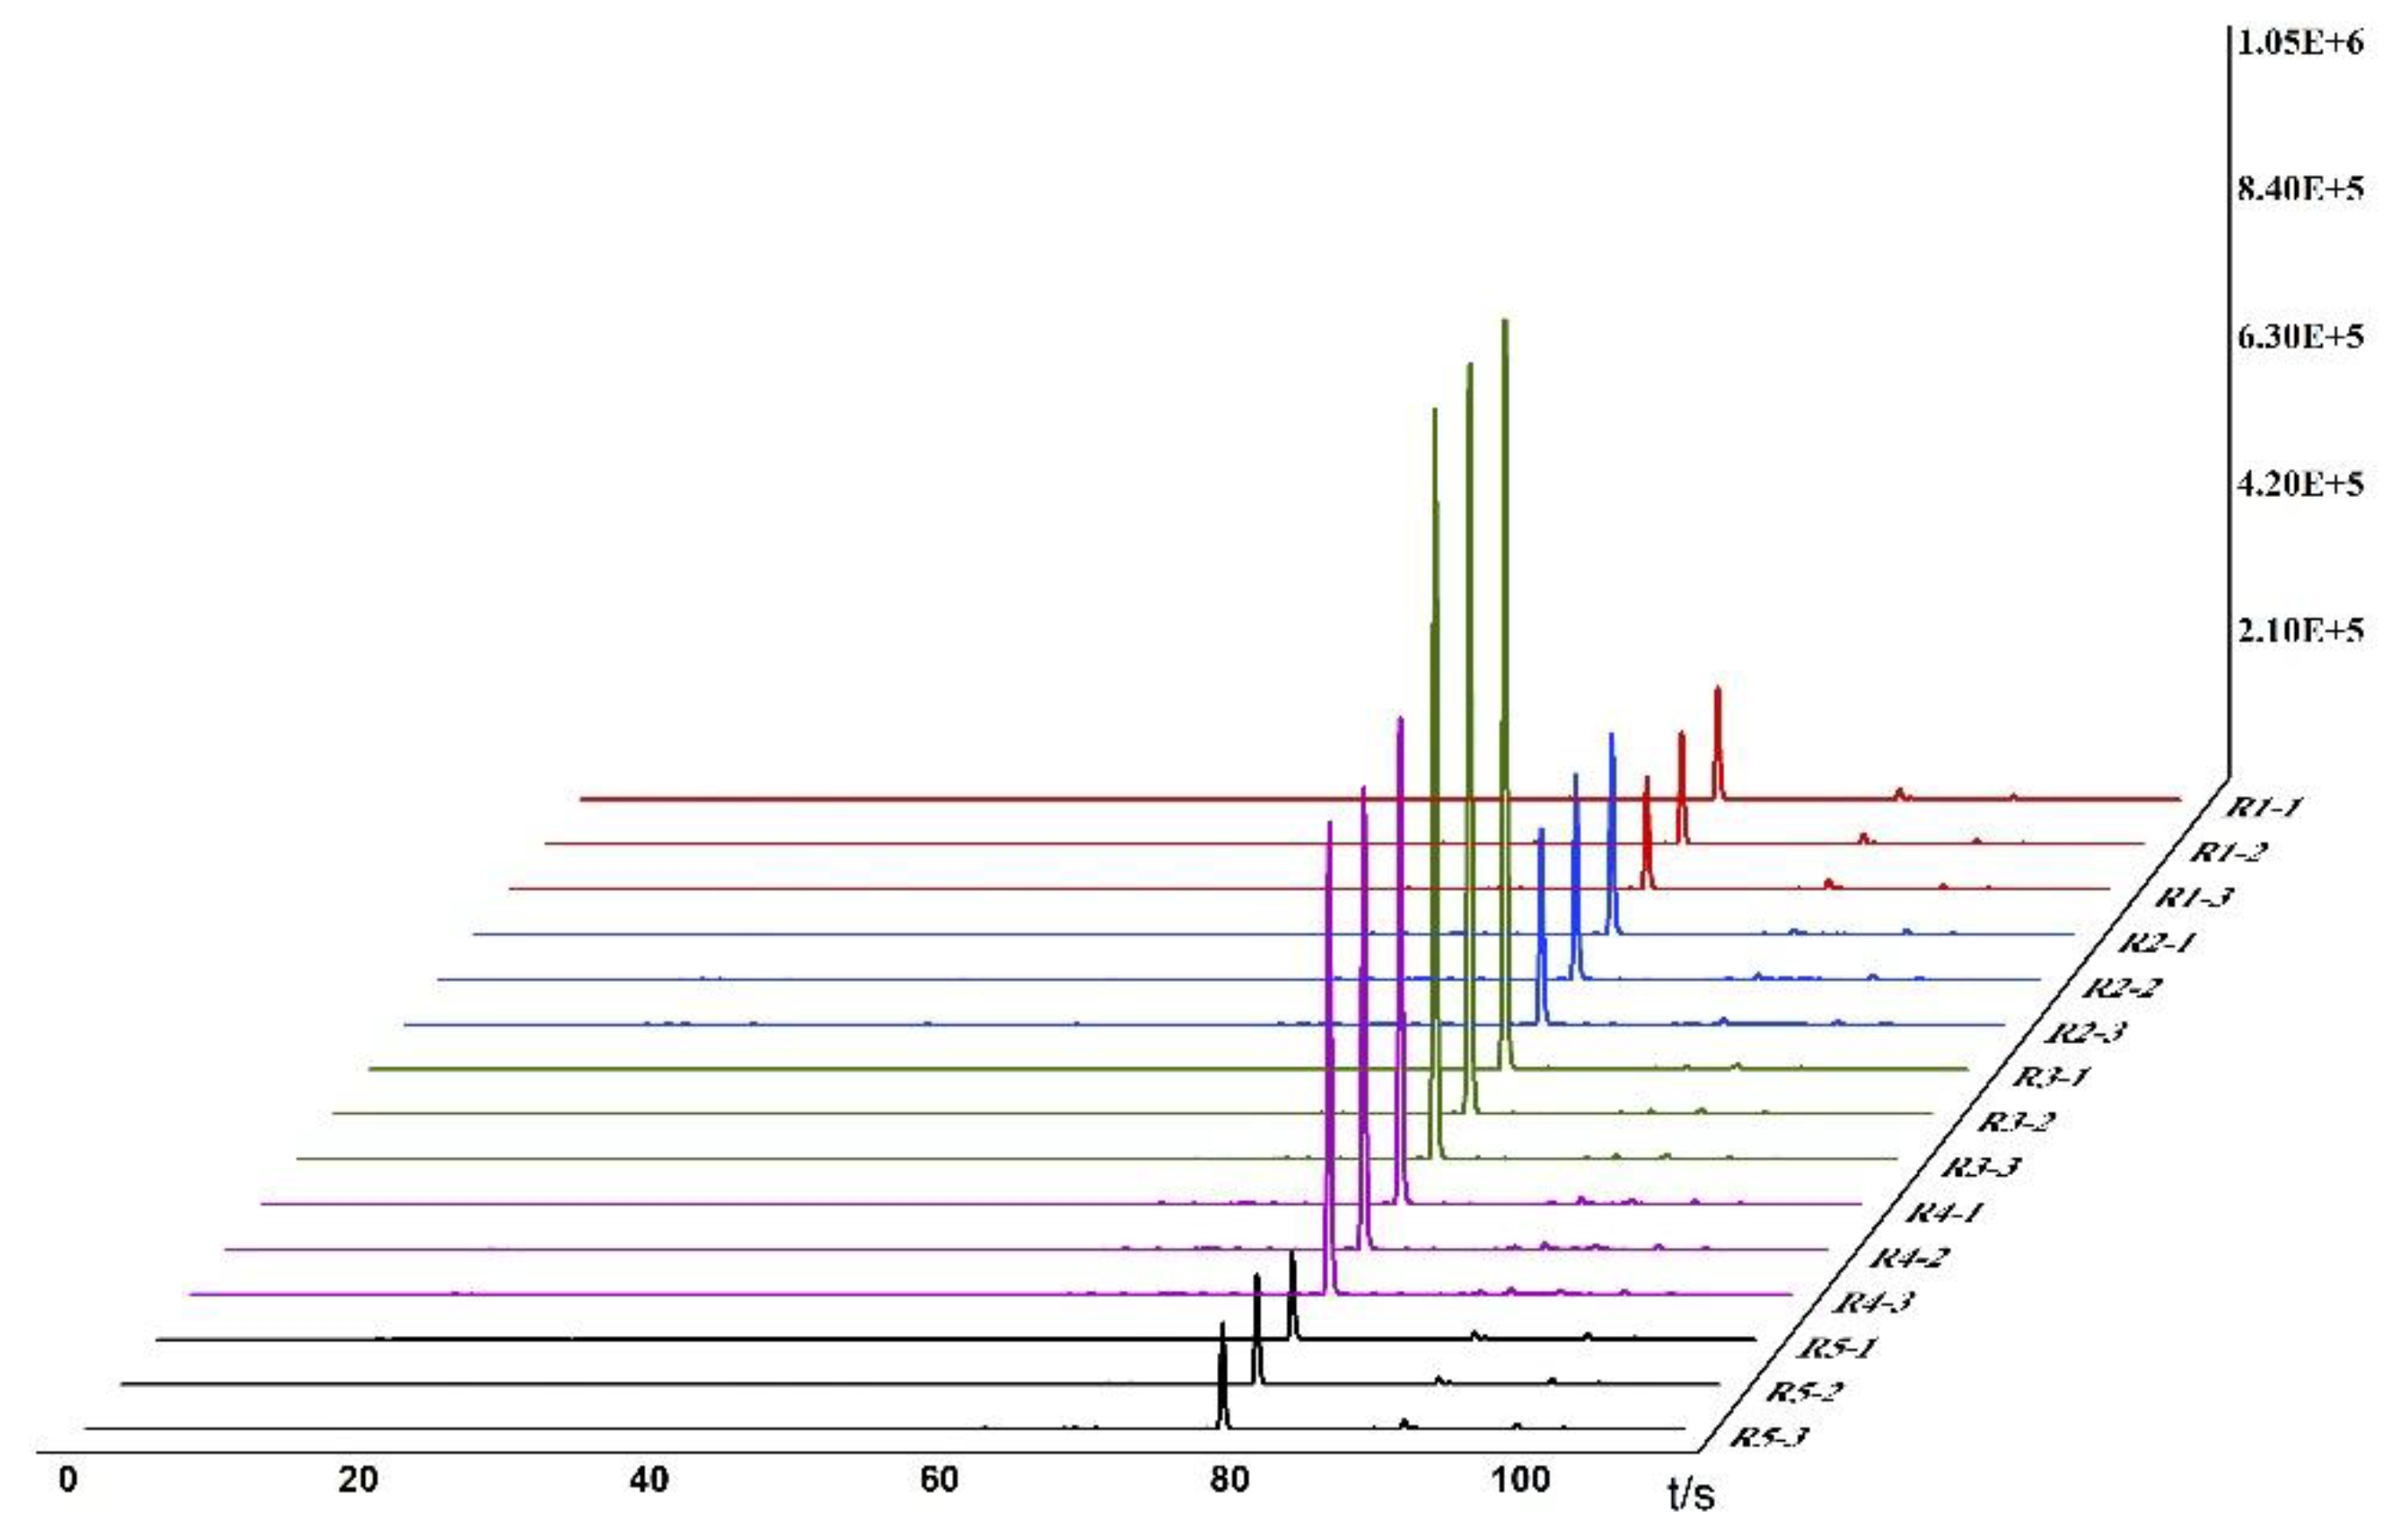
Figure 2.
Odor fingerprints of 5 batches of BATR.
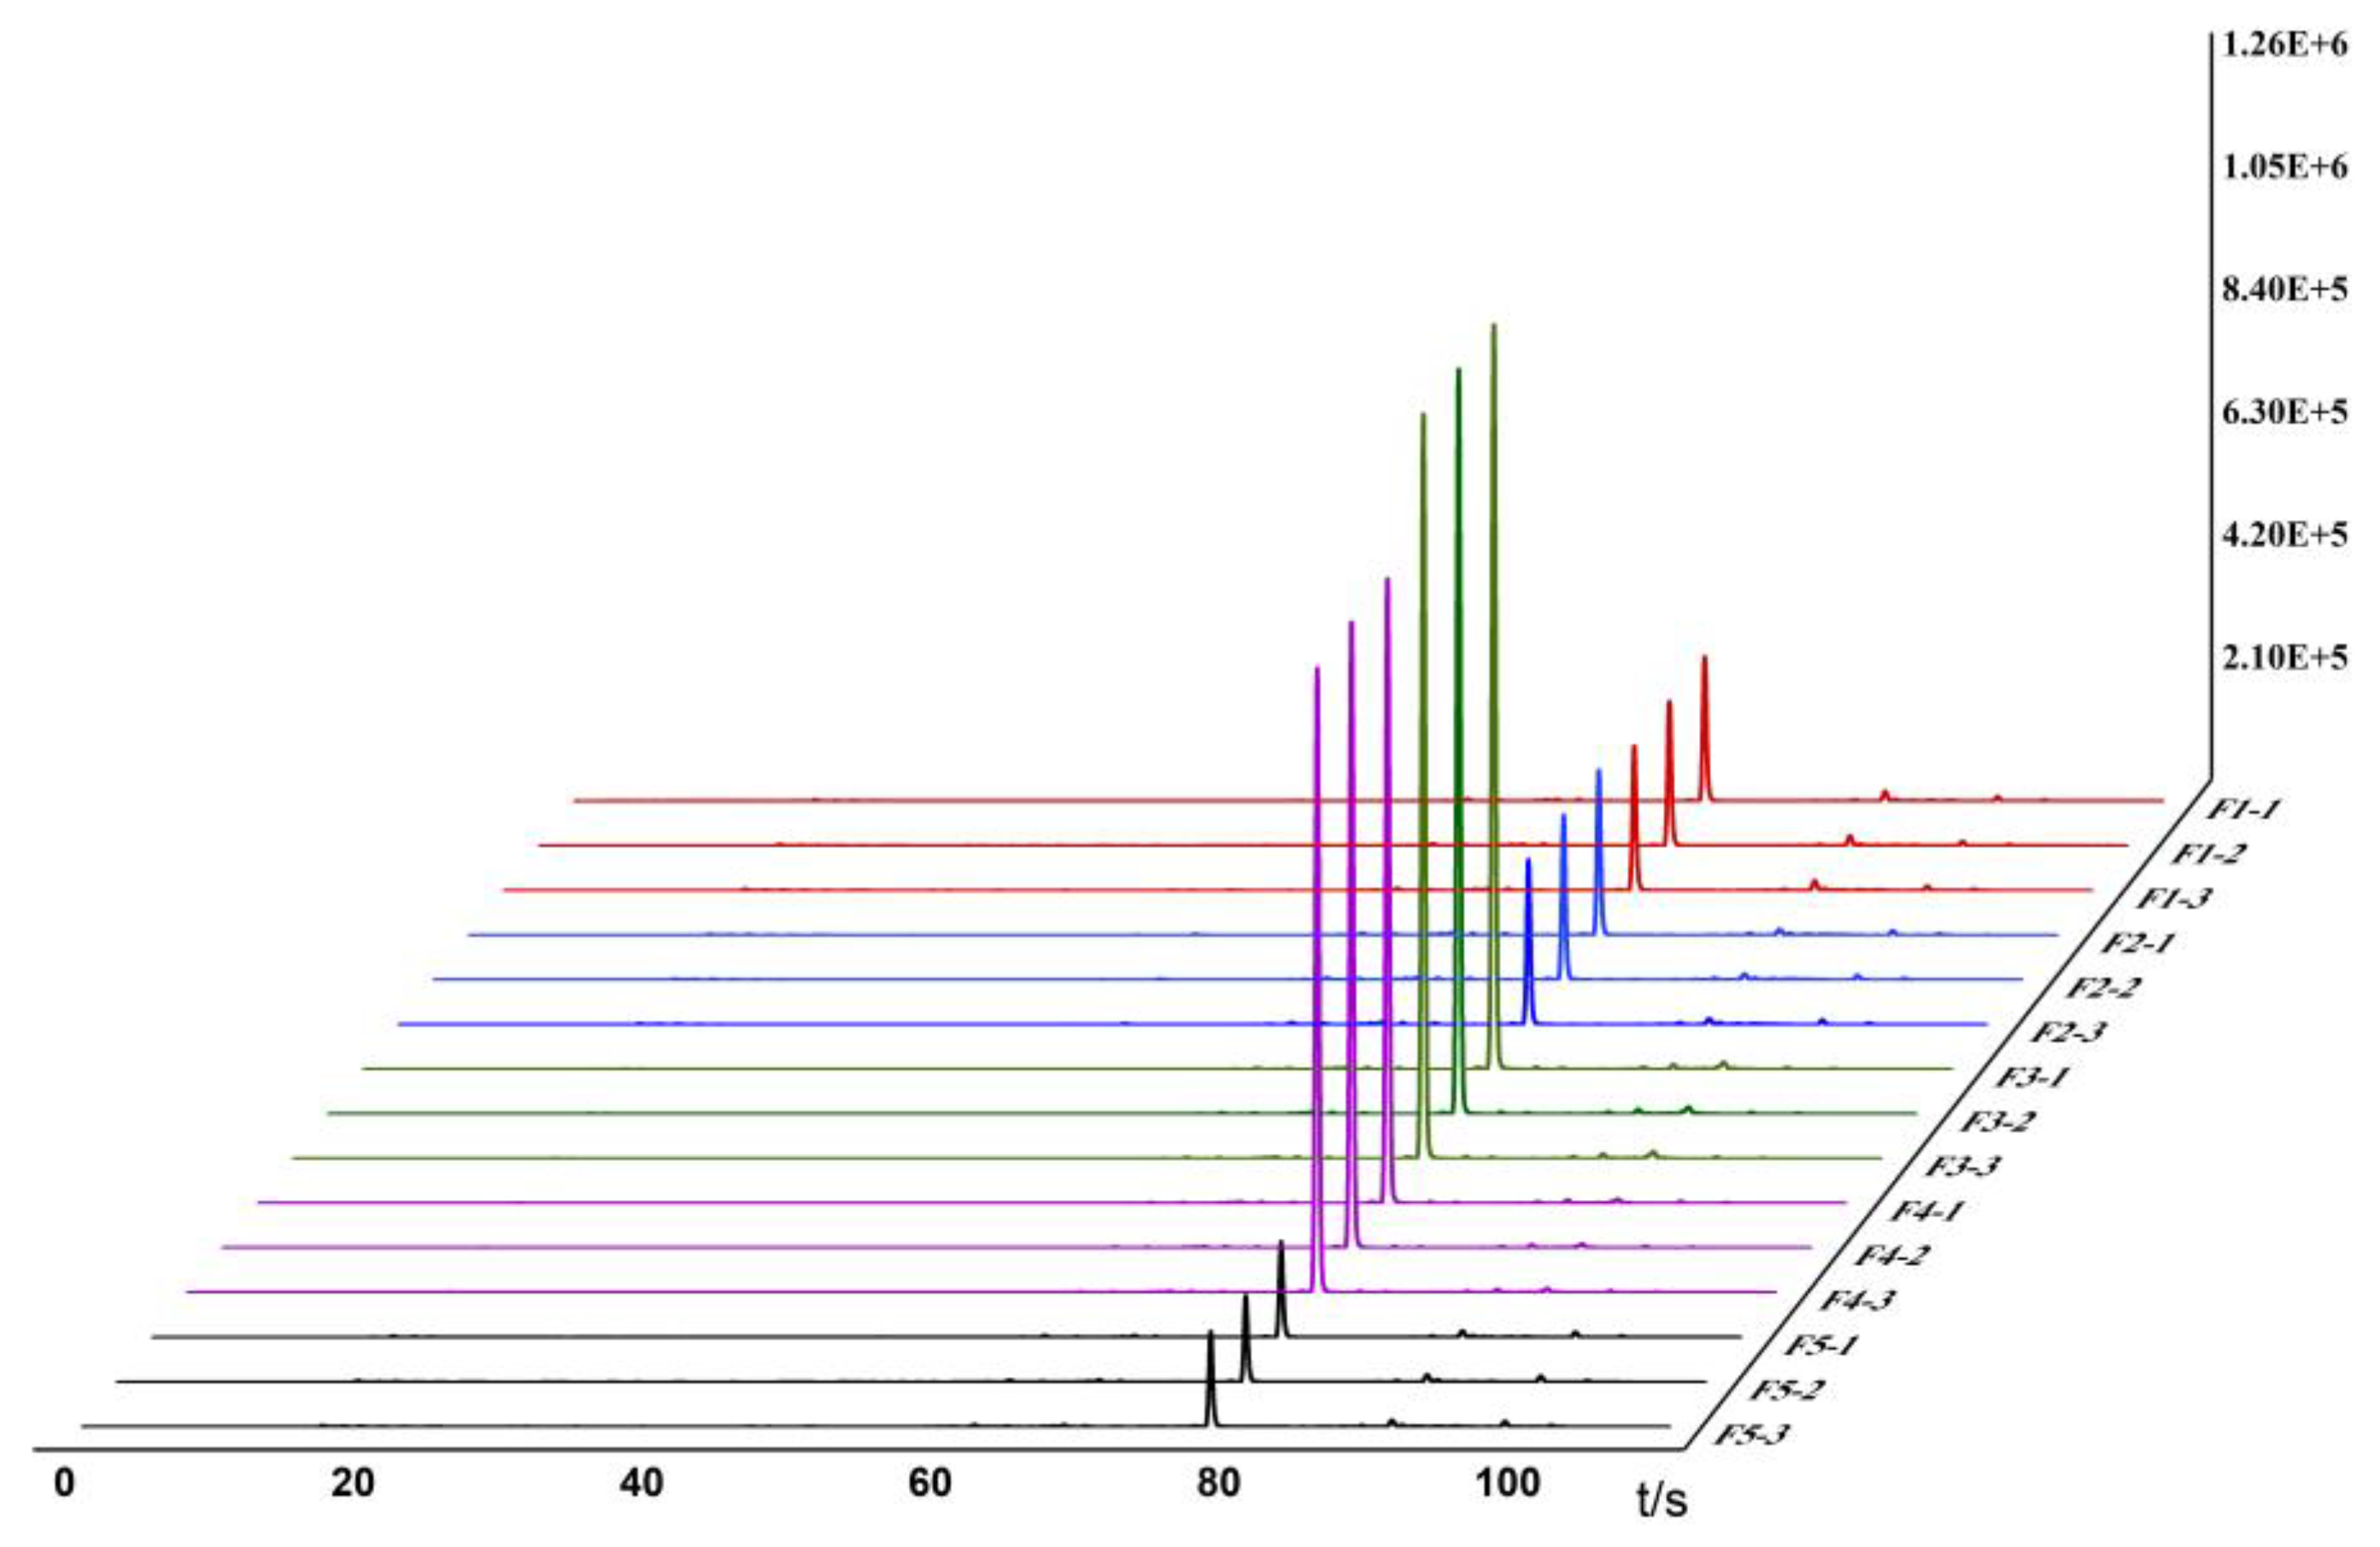
Figure 3.
PCA analysis of raw and bran-fried ATR.
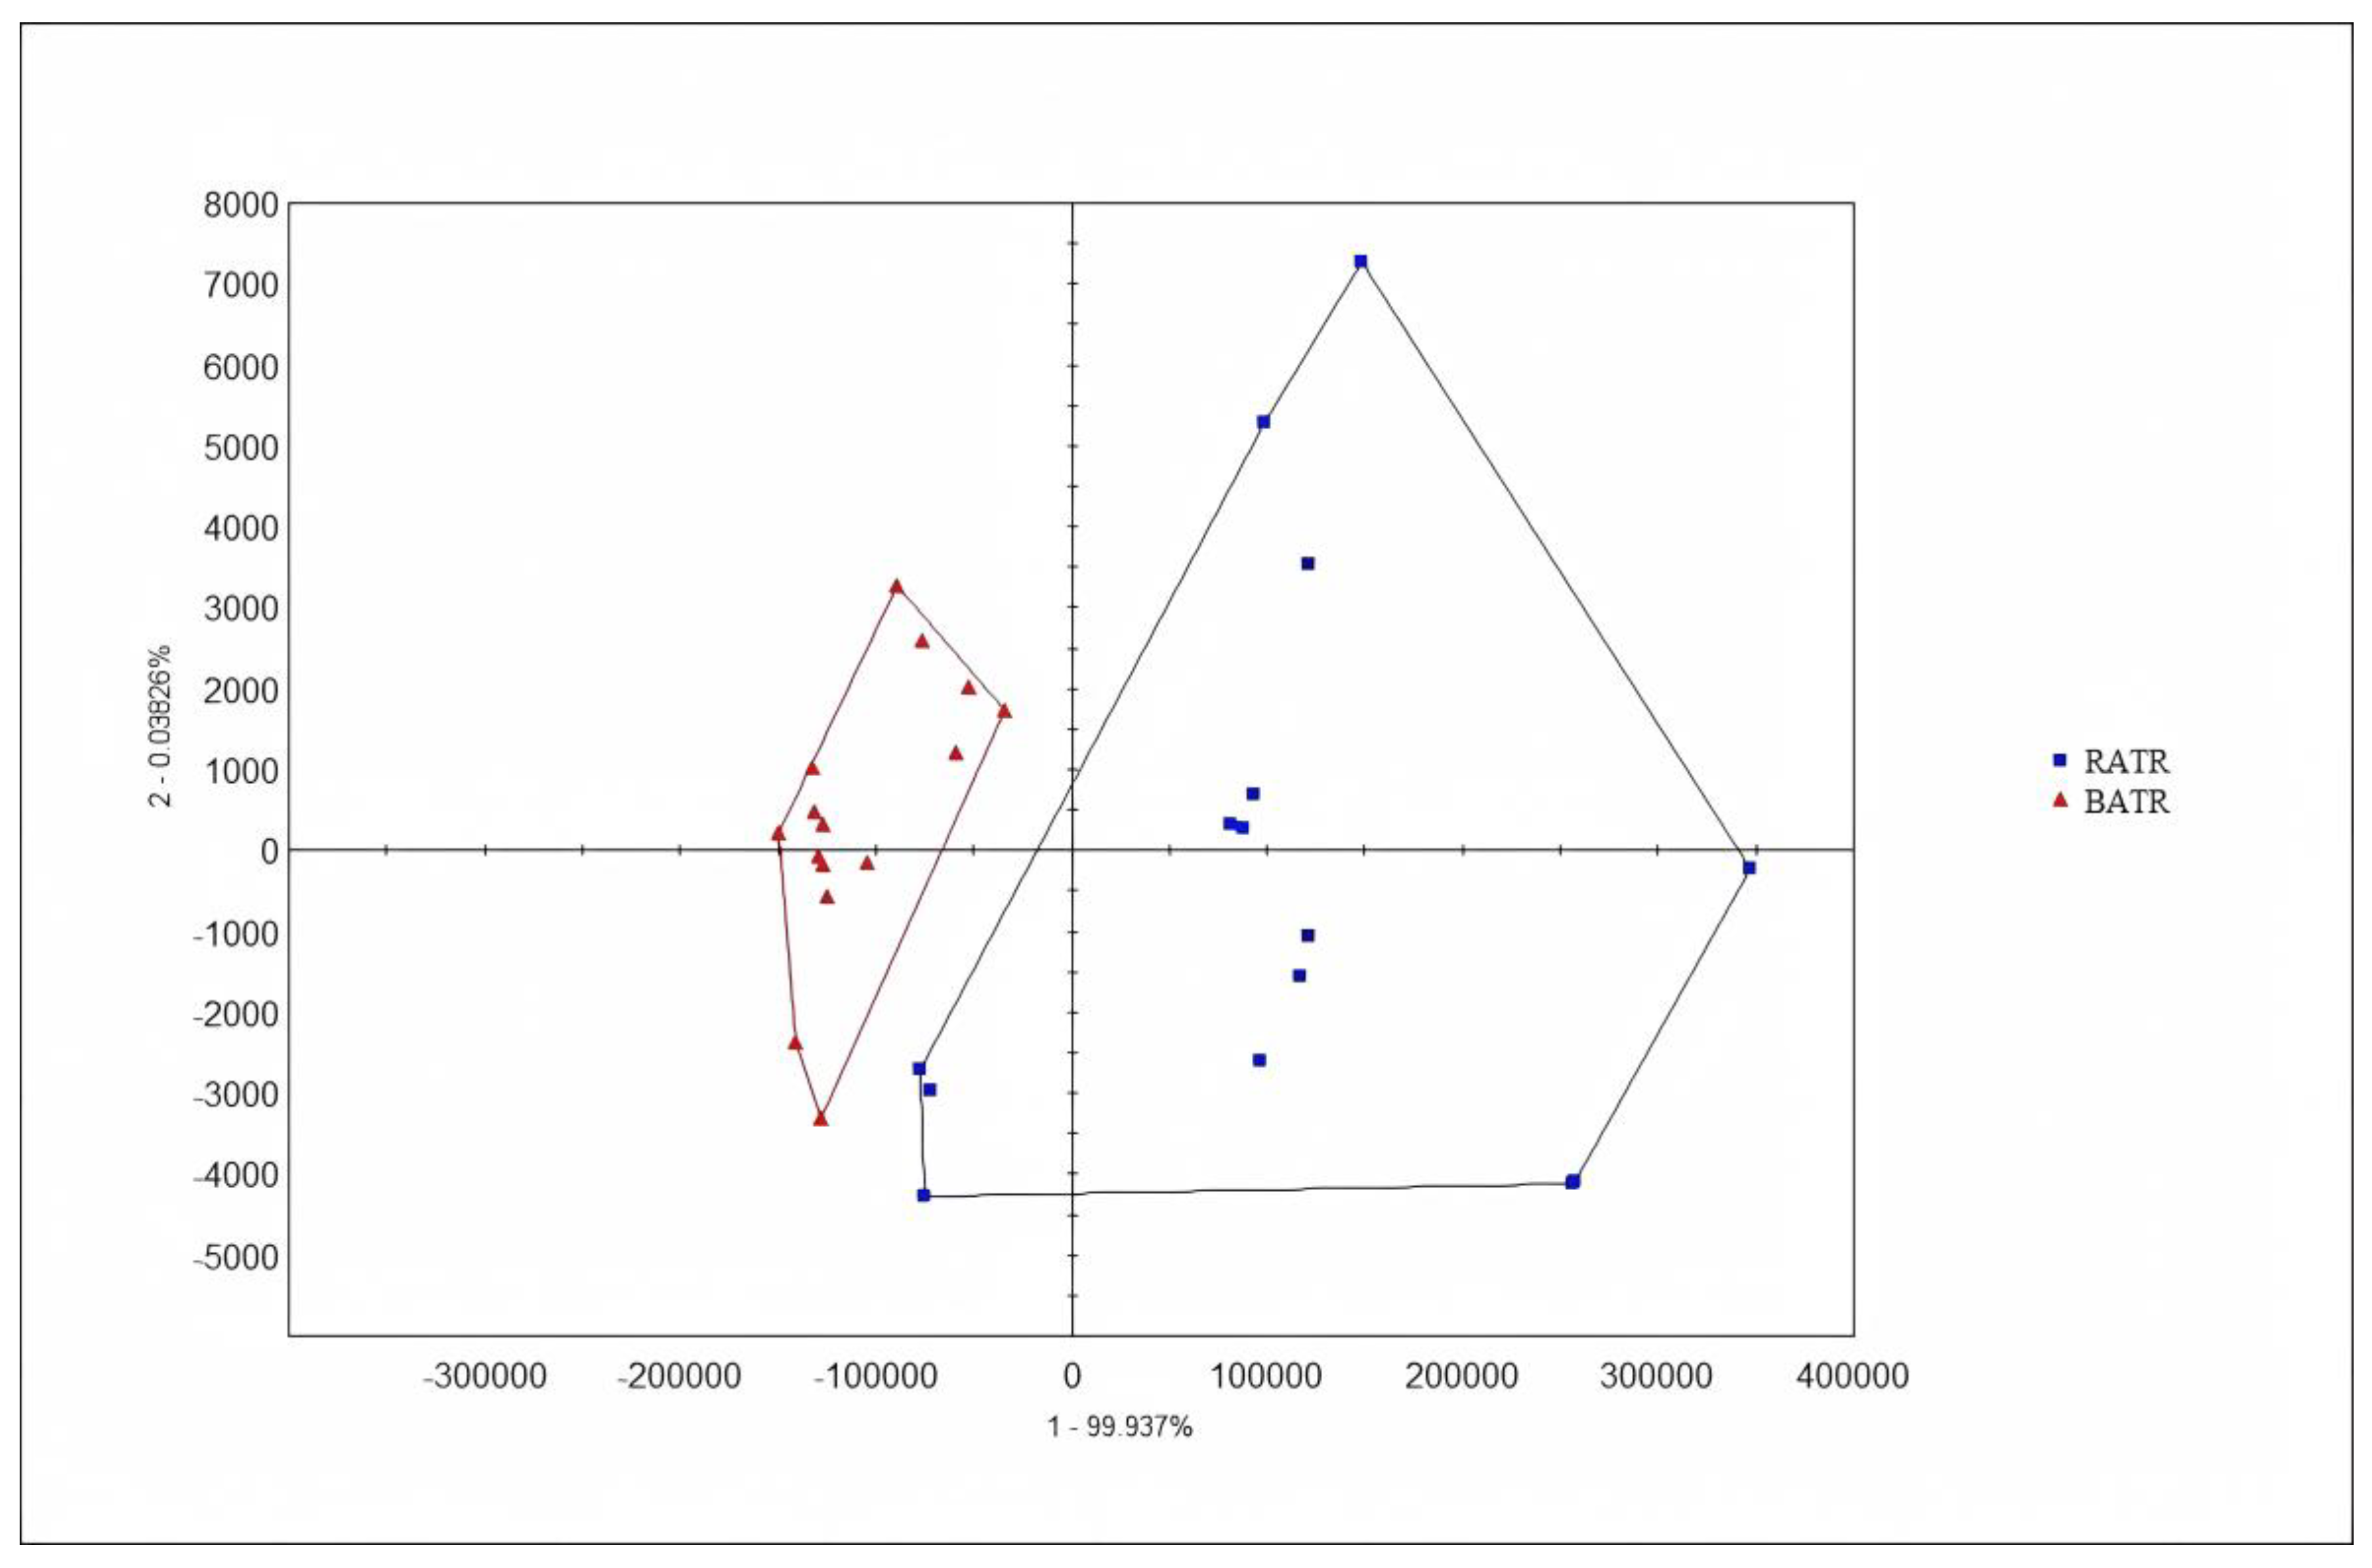
Figure 4.
3D PCA analysis of raw and bran-fried ATR.
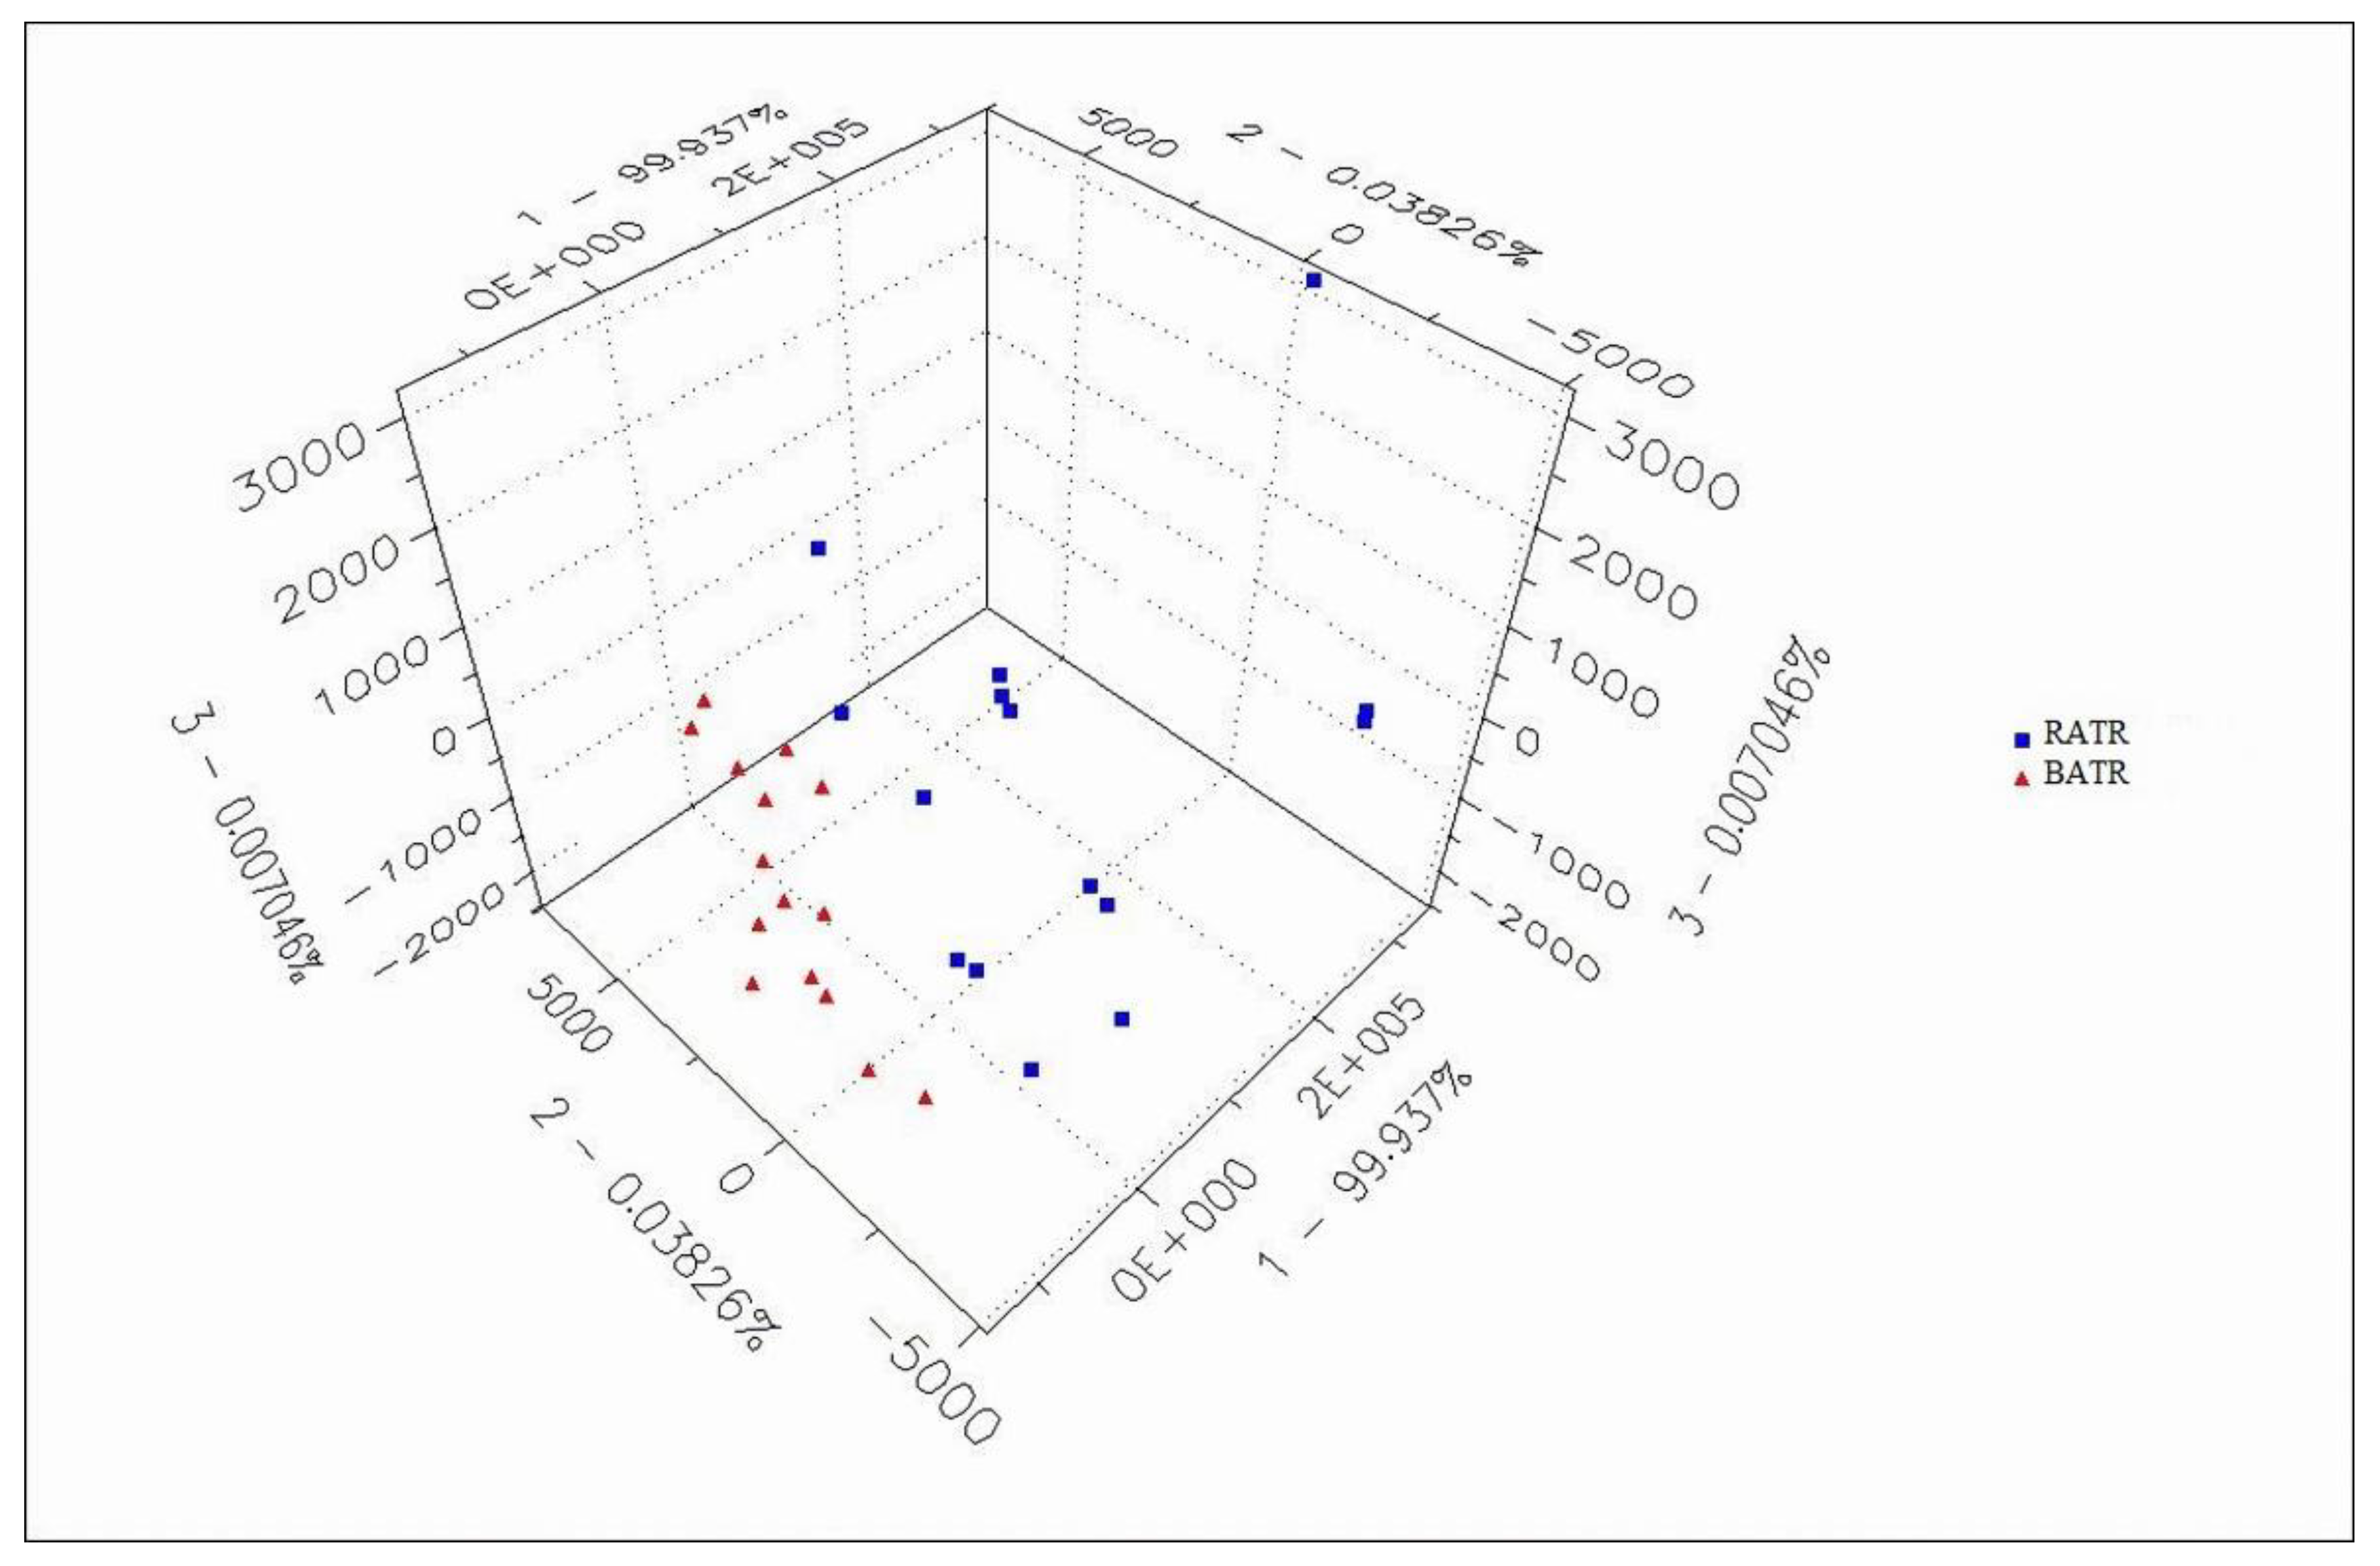
Figure 6.
E-eye pictures of raw and bran fried ATR.
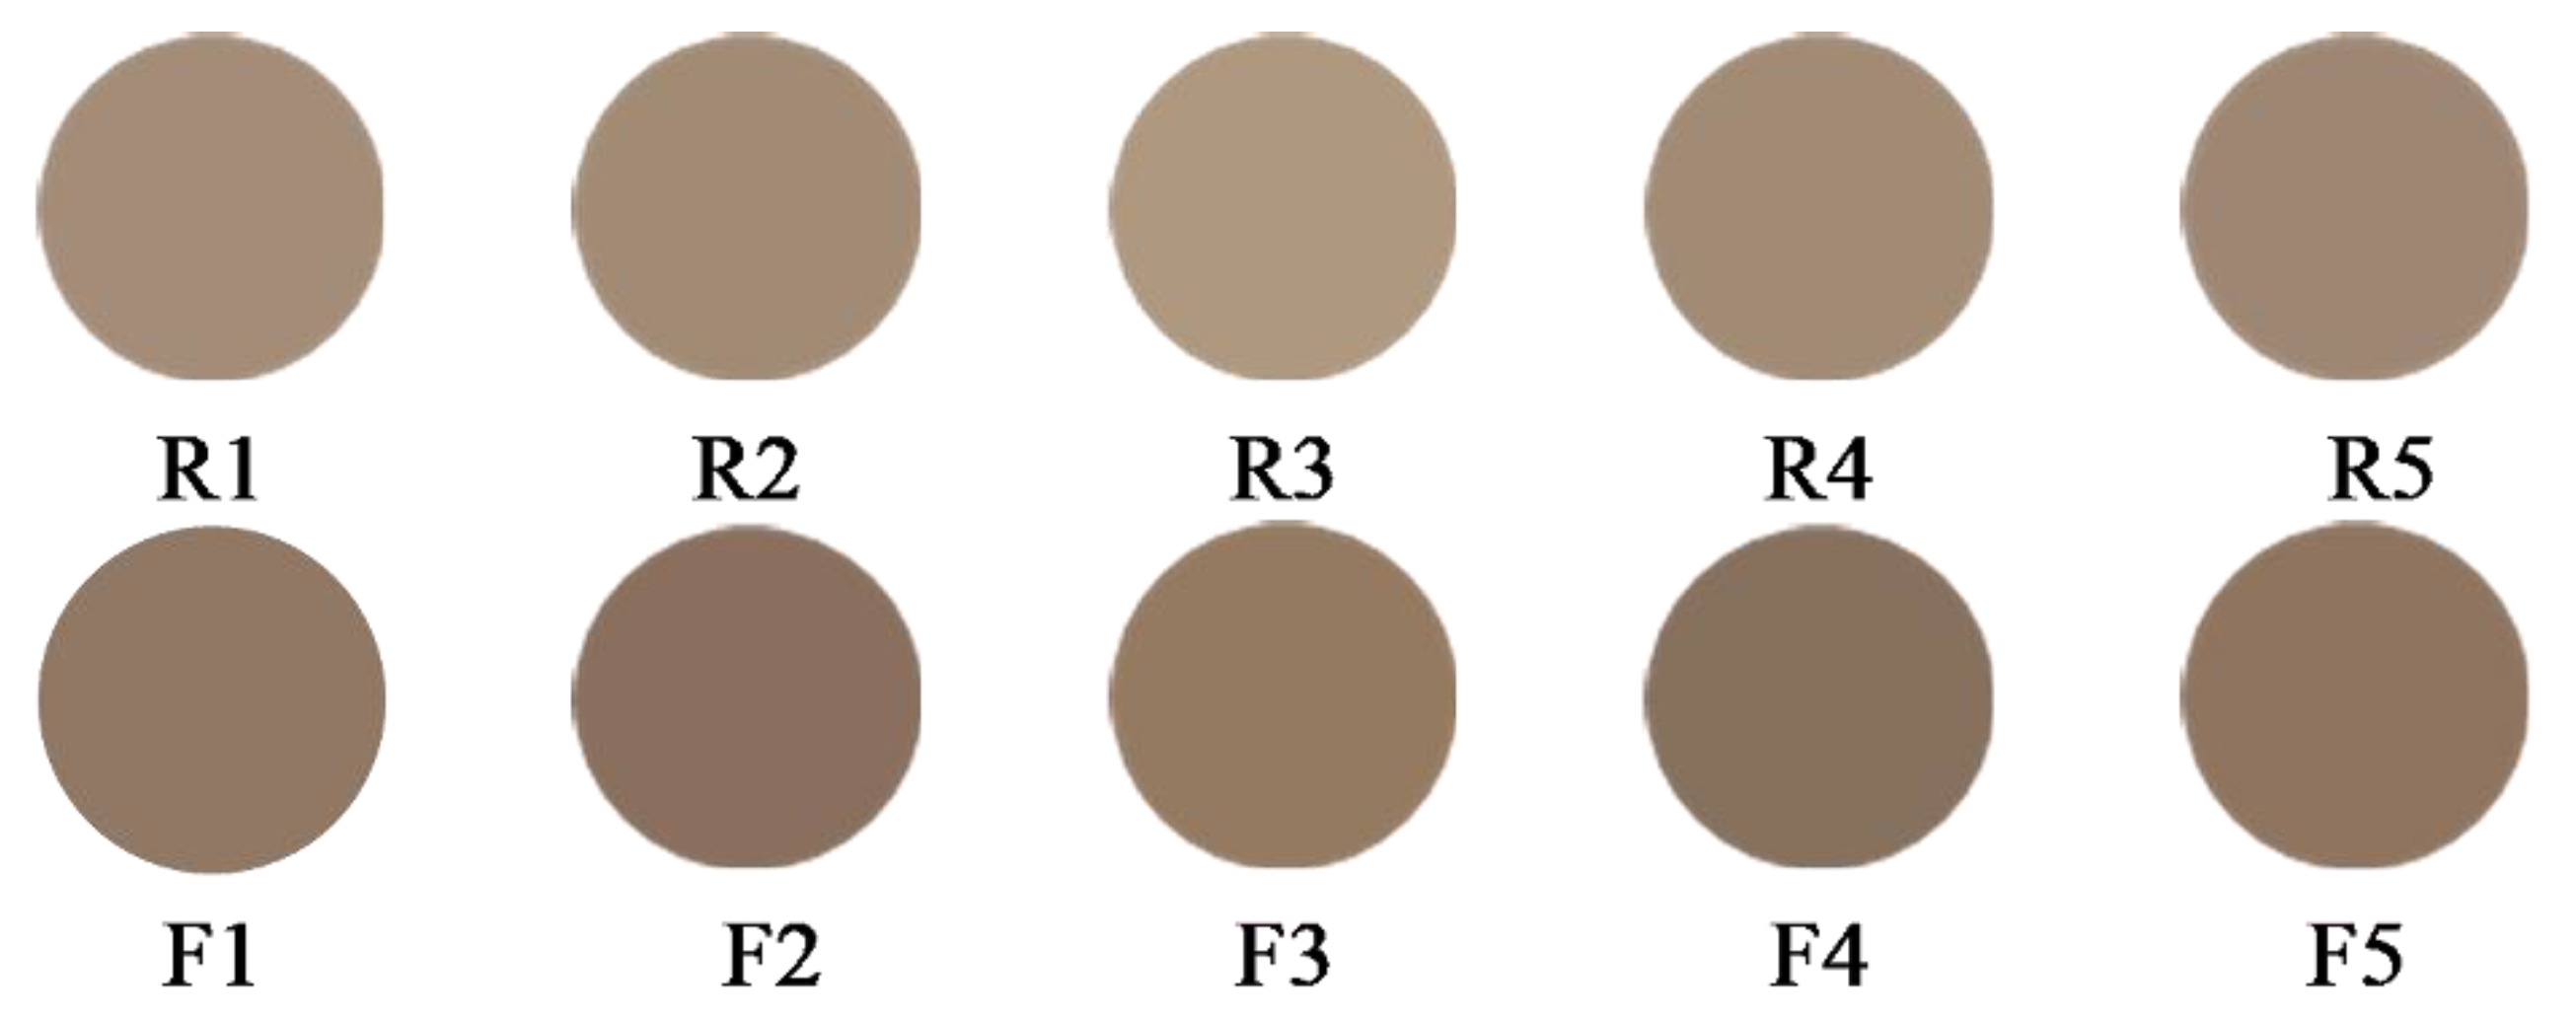
Figure 7.
PCA of E-eye between raw and bran fried ATR.
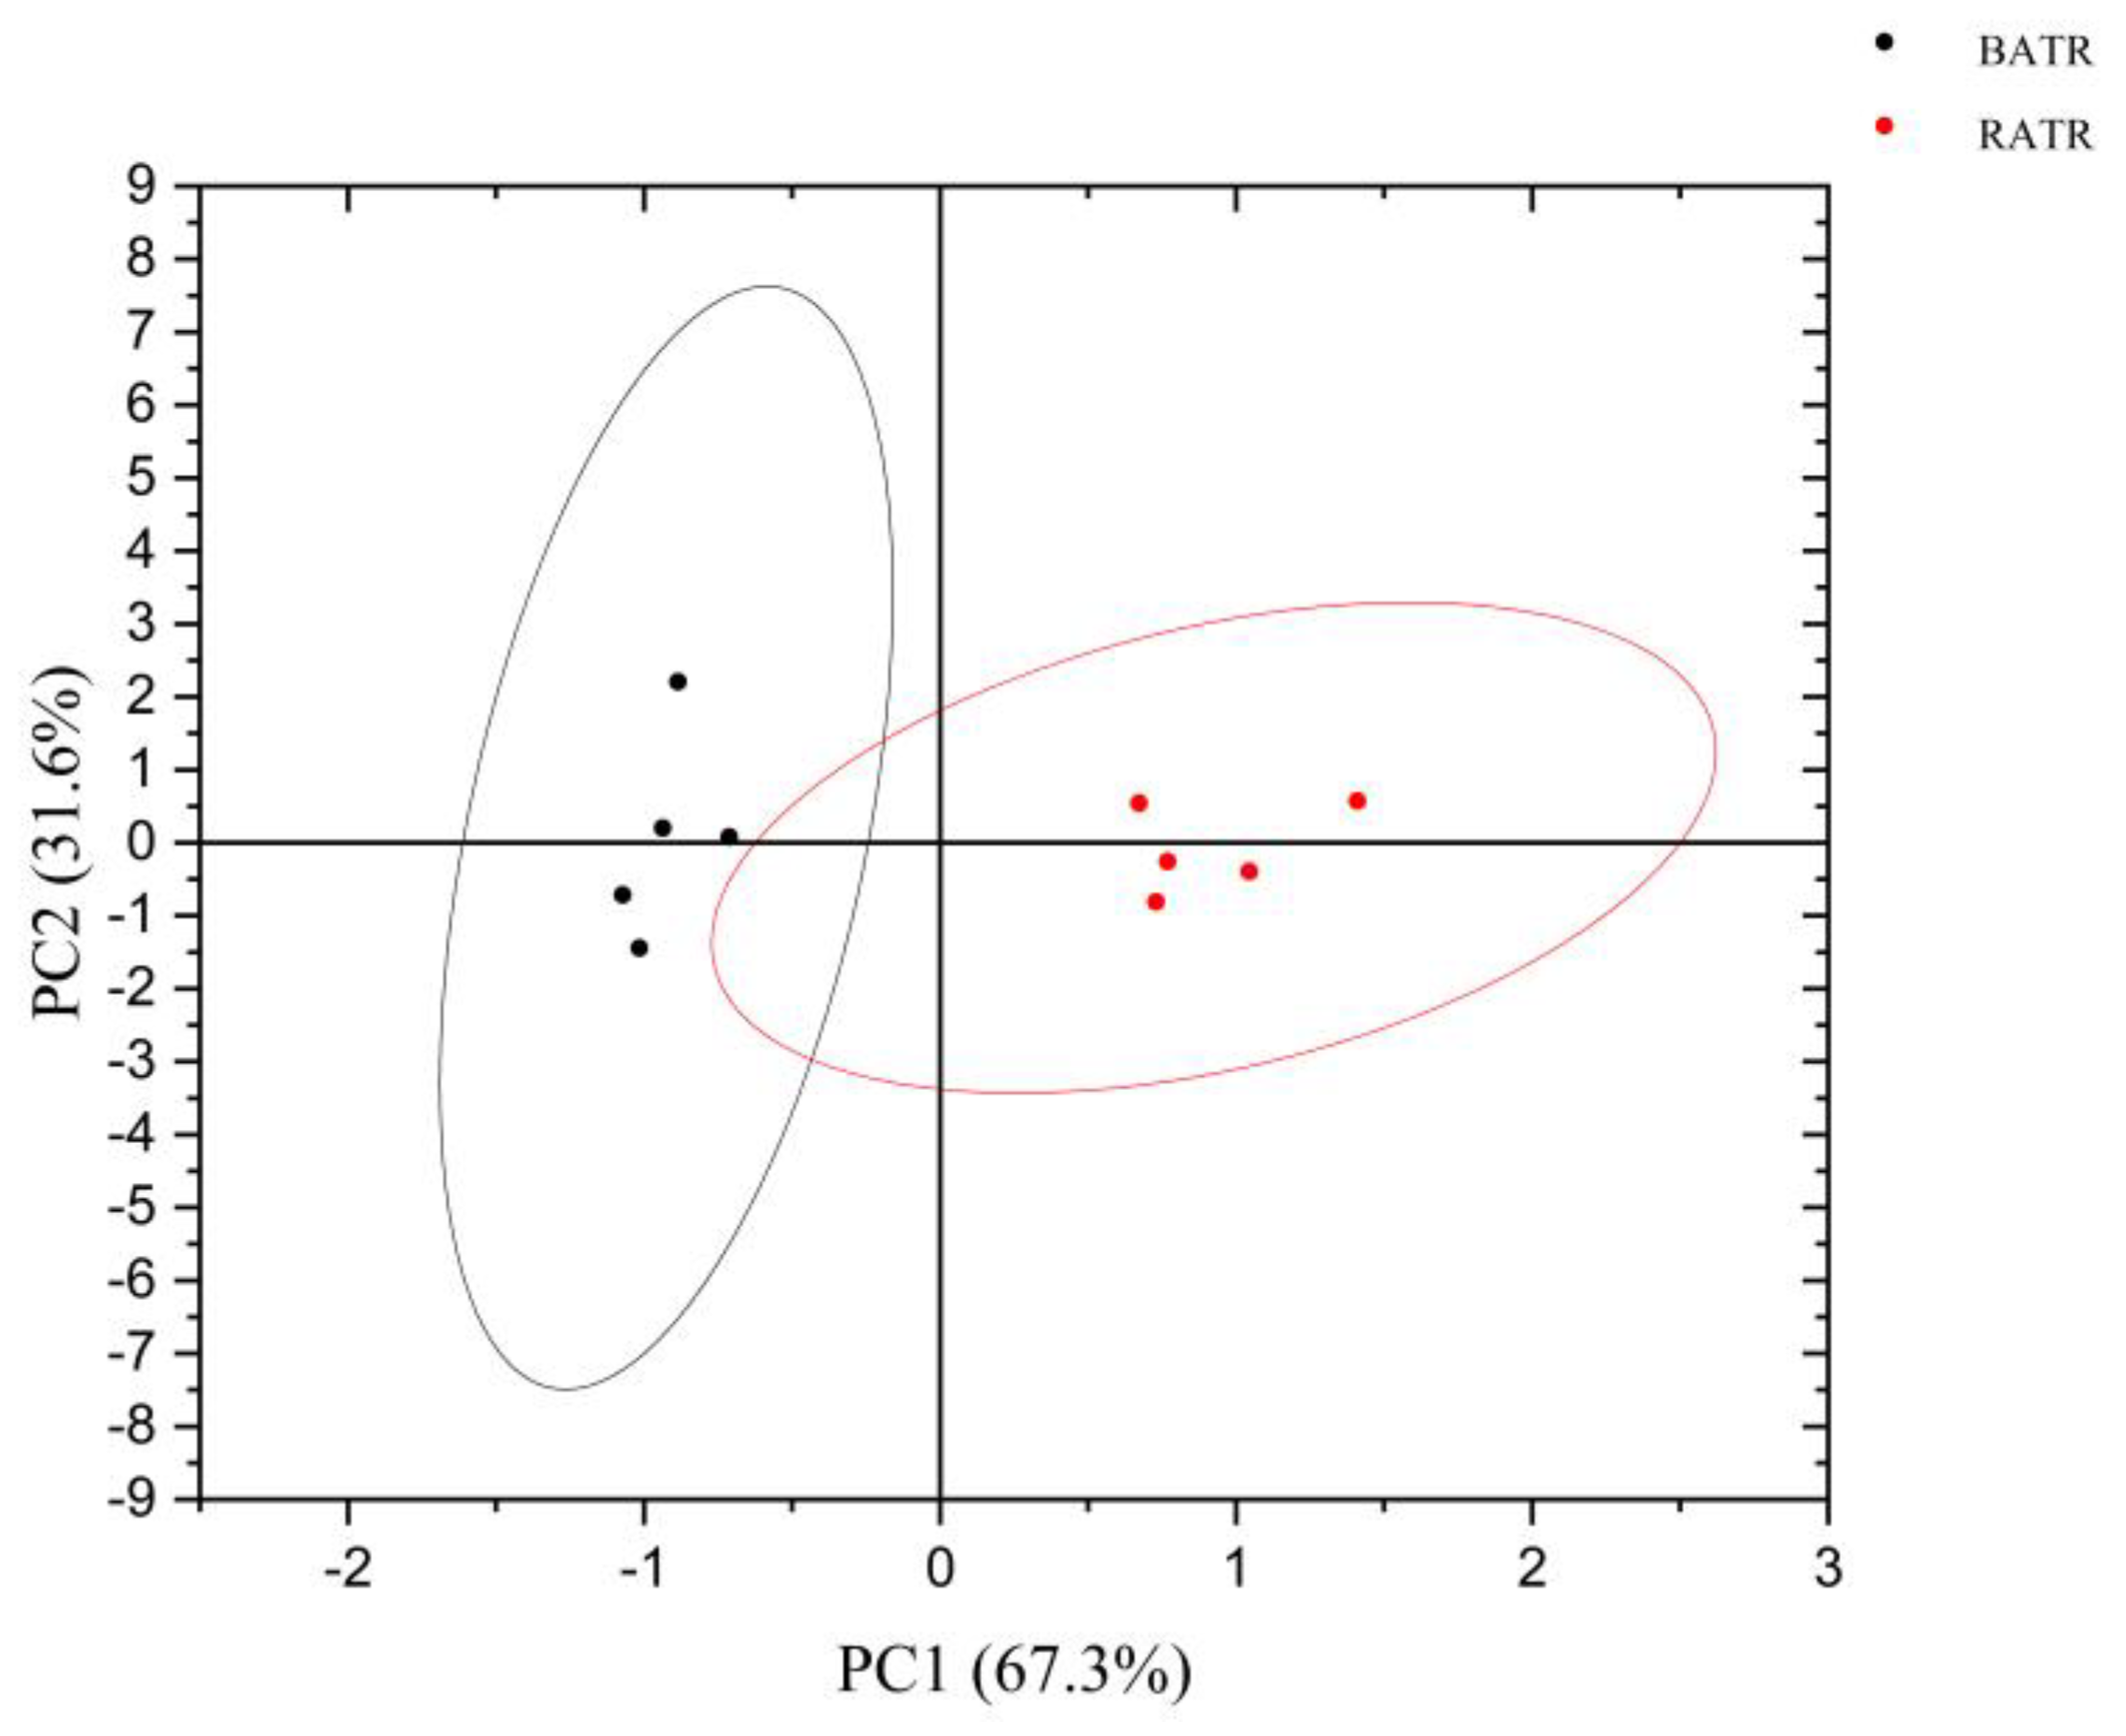
Figure 8.
Heat map of Pearson correlation coefficient between chromaticity values and Odor Components of raw and bran-fried ATR.
Figure 8.
Heat map of Pearson correlation coefficient between chromaticity values and Odor Components of raw and bran-fried ATR.

Figure 9.
Radar fingerprint of E-tongue data between RATR and BATR.
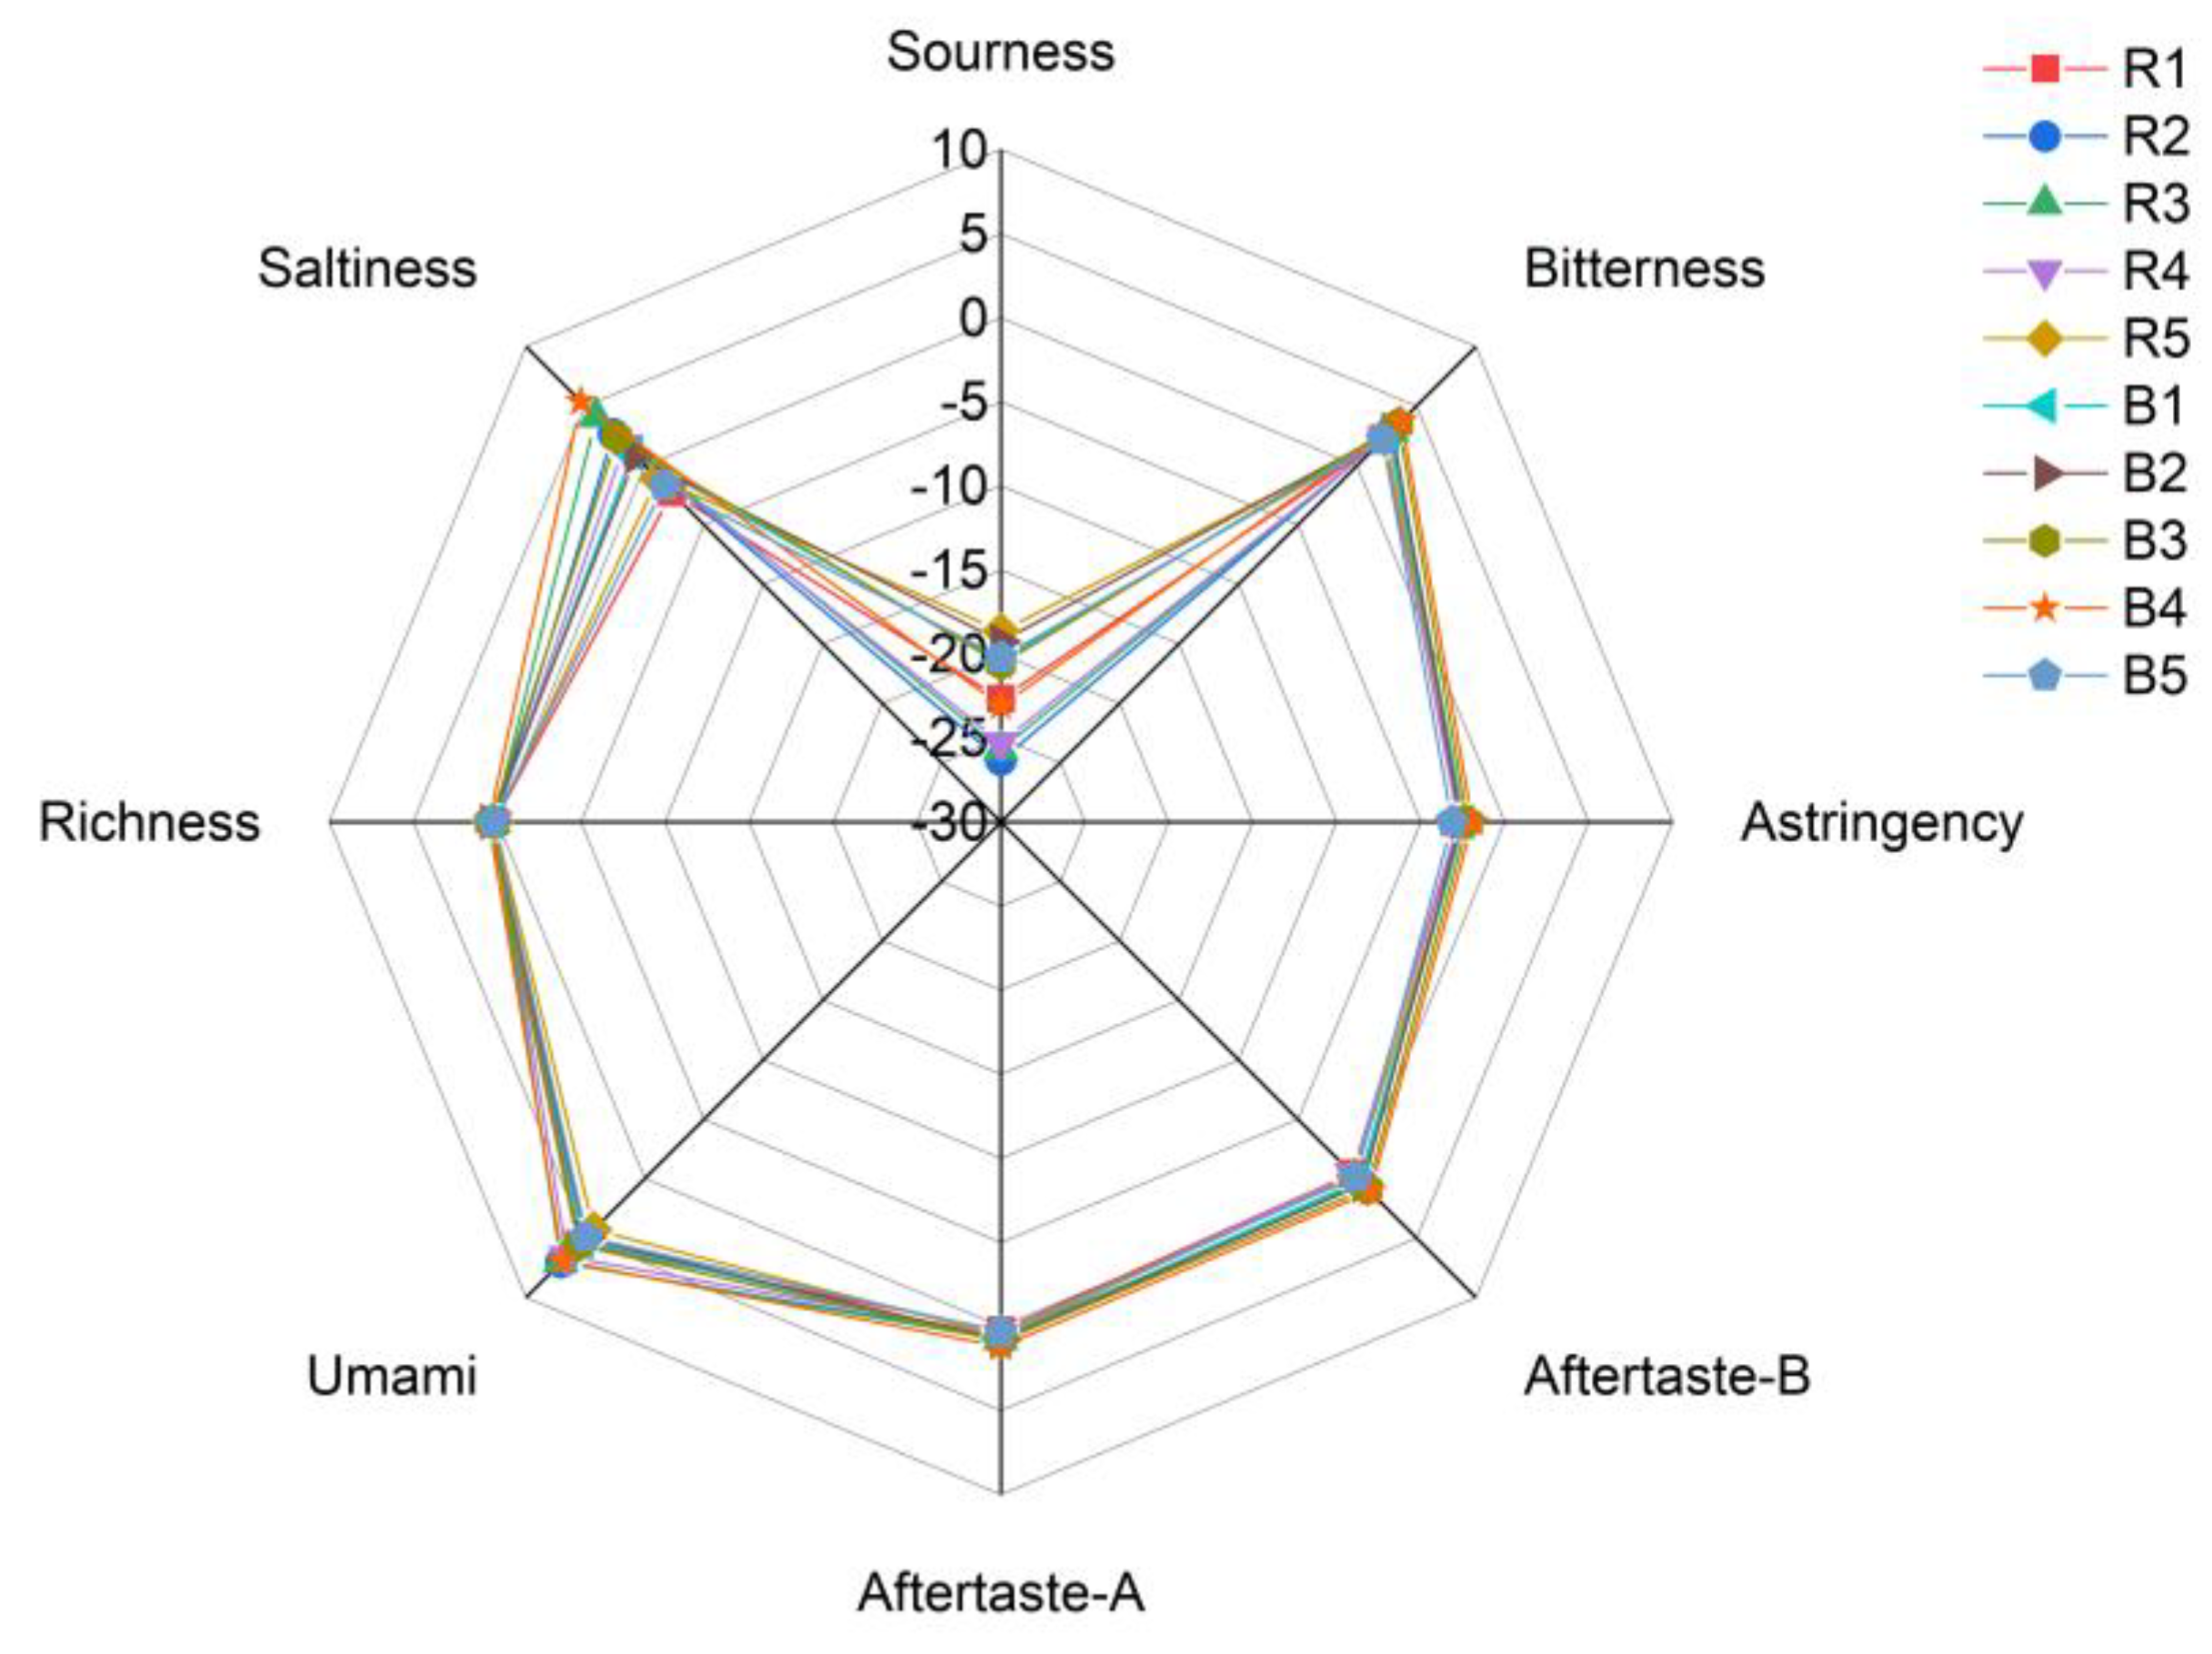
Table 4.
Sample source information of ATR.
| Serial Number Number | Origin | Serial Number | Origin | Batch Number |
|---|---|---|---|---|
| R1 | Hunan | B1 | Hunan | 20231024004 |
| R2 | Sichuan huan | B2 | Sichuan | 20231024013 |
| R3 | Jiangxi | B3 | Jiangxi | 20231024001 |
| R4 | Guizhou | B4 | Guizhou | 20231024010 |
| R5 | Hubei | B5 | Hubei | 20231024007 |
Table 1.
Possible compounds and sensory description information in raw and bran-fried ATR.
| No. | Molecular Formula | tR/s | RI | Possible Compound | Relevant Index | Odor Information | RATR | BATR |
|---|---|---|---|---|---|---|---|---|
| 1 | CH4O | 16.63 | 436 | Methanol | 91.06 | Alcoholic; spicy, etc. | − | + |
| 2 | C3H8O | 19.25 | 489 | 2-Propanol | 89.63 | Acetone; alcohol; ethanol, etc. | − | + |
| 3 | C5H6O | 50.28 | 842 | 2-Cyclopentenone | 74.89 | / | − | + |
| 4 | C7H6O | 61.84 | 968 | Benzaldehyde | 91.21 | Almond; bitter, etc. | + | + |
| 5 | C6H4Cl2 | 67.68 | 1041 | o-Dichlorobenzene | 88.15 | Aromatic; aromatic hydrocarbon odor | + | + |
| 6 | C10H16 | 68.04 | 1051 | L-Limonene | 91.13 | Orange; mint, etc. | + | + |
| 7 | C11H24 | 71.72 | 1106 | Undecane | 81.56 | Alkane; fusel alcohol, etc. | + | + |
| 8 | C8H10O3 | 77.15 | 1197 | 2,6-Dimethoxyphenol | 87.03 | Sesame oil; phenol, etc. | + | + |
| 9 | C10H20O | 78.30 | 1219 | Decanal | 98.35 | Aldehyde; candle, etc. | + | + |
| 10 | C10H16O | 81.23 | 1274 | Geranial | 96.69 | Orange; mint, etc. | + | + |
| 11 | C9H12O3 | 83.02 | 1310 | Methyl eugenol | 85.42 | Aromatic; spicy odor | + | + |
| 12 | C12H26O | 88.67 | 1427 | 2-Dodecanol | 93.53 | Coconut; candle, etc. | + | + |
| 13 | C13H26O2 | 92.97 | 1521 | Methyl dodecanoate | 95.87 | Coconut; cream, etc. | + | + |
| 14 | C11H20O2 | 94.93 | 1562 | 4-Undecanolide | 92.79 | Apricot; coconut; peach, etc. | + | + |
| 15 | C12H27O4P | 98.61 | 1639 | Tributyl phosphate | 80.19 | Odorless | + | + |
“RI” represents retention index, “+” indicates the detected component, “−” indicates that the component is not detected.
Table 2.
Chromatic values of raw and bran fried ATR.
| No. | Chromatic values | |||
|---|---|---|---|---|
| L* | a* | b* | E*ab | |
| R1 | 61.01 | 5.83 | 14.17 | 81.01 |
| R2 | 59.97 | 6.41 | 15.22 | 81.6 |
| R3 | 64.85 | 6.20 | 14.69 | 85.74 |
| R4 | 60.11 | 6.33 | 14.24 | 80.68 |
| R5 | 58.65 | 5.88 | 13.95 | 78.48 |
| B1 | 52.19 | 7.59 | 15.16 | 74.94 |
| B2 | 49.69 | 7.82 | 14.41 | 71.92 |
| B3 | 53.50 | 8.34 | 17.29 | 79.13 |
| B4 | 48.91 | 7.41 | 13.79 | 70.11 |
| B5 | 51.23 | 7.88 | 15.31 | 74.42 |
Disclaimer/Publisher’s Note: The statements, opinions and data contained in all publications are solely those of the individual author(s) and contributor(s) and not of MDPI and/or the editor(s). MDPI and/or the editor(s) disclaim responsibility for any injury to people or property resulting from any ideas, methods, instructions or products referred to in the content. |
© 2025 by the authors. Licensee MDPI, Basel, Switzerland. This article is an open access article distributed under the terms and conditions of the Creative Commons Attribution (CC BY) license (http://creativecommons.org/licenses/by/4.0/).
Copyright: This open access article is published under a Creative Commons CC BY 4.0 license, which permit the free download, distribution, and reuse, provided that the author and preprint are cited in any reuse.


