Submitted:
07 April 2025
Posted:
08 April 2025
You are already at the latest version
Abstract
In a greenhouse setting, we tested for the first time whether there was a difference in the accumulation of trigonelline (TRG) in the leaves of two cultivars of hemp (Cannabis sativa L.), i.e., ‘Jin Ma’ and ‘NWG’ under water-deficit stress by withholding water. Detectable levels of TRG were recorded in the leaves of both cultivars. The level of TRG increased 451% in response to the water-deficit stress treatment (1.64±0.51 OD262/gFW-1 to 7.41±3.64 OD262/gFW-1) in which leaf relative water amount (RWC) decreased 58.8%. However, there was no difference in TRG accumulation between the hemp cultivars. In summary, water-deficit stress influences the TRG and RWC in the leaves of C. sativa but the cultivars did not have any impact on the TRG and RWC lev-el. It is proposed that TRG provides a readily measured water-deficit stress biochemi-cal marker for commercial C. sativa.
Keywords:
trigonelline
; relative water amount
; hemp
; drought
1. Introduction
Trigonelline (TRG) (N-methyl nicotinic acid), was first detected in Trigonella joenum-graecum L. seeds [11] and has since been found in the seeds, leaves, roots, stems, and flowers of a wide range of plants in a range of 0.3-13 μmol/gFW [2,5,21]. The pyridine-nucleotide cycle produces nicotinic acid, which synthesizes TRG [26 Zheng et al., 2004. TRG behaves as a biochemical drought stress marker and regulator of the cell cycle when reacting as a solute responding to drought stress [5]. Being a storage form of nicotinic acid, by demethylation, TRG can reappear in the nicotinamide metabolic pathway [6]. Even though the effect of different abiotic stresses such as salinity, temperature, and drought on TRG accumulation and synthesis [4] has been characterized in several plants, its role in Cannabis sativa L. has not been studied. Moreover, although TRG has been identified in the inflorescence of C. sativa [22], the occurrence of TRG in the leaves of C. sativa has not been reported even though this plant produces a variety of secondary metabolites. Some of the common secondary metabolites found in C. sativa include cannabinoids, flavonoids, stilbenoids, terpenoids, alkaloids and lignans [8], and more than 480 chemical compounds in C. sativa have been identified [7]. Several factors, such as types of tissues, age, variety, nutrition, light, water, harvesting time, and storage facilities, determine the concentrations of these chemical compounds [13,14,19]. For example, stressful conditions facilitate the increase of cannabinoids in C. sativa [17].
Variation in the accumulation of TRG in response to soil moisture has been reported in five different cultivars of Panicum virgatum L. [21]. However, variation of TRG occurred in the leaves between upland and lowland cultivars of P. virgatum. The conditions of Schwartz et al.’s (2014) [21] experiment showed that the upland cultivars (Blackwell’, Cave in Rock’ and ‘Trailblazer’) of P. virgatum contained a higher amount of TRG compared to the lowland cultivars (‘Alamo’ and ‘Kanlow’). However, higher experimental levels of moisture led to higher levels of detectable TRG in lowland compared to upland cultivars.,
Investigating the detection of TRG in C. sativa may provide knowledge needed to regulate and manipulate its biosynthetic pathways. This experiment tested the null hypothesis that there is no significant difference in the TRG accumulation in response to water-deficit stress in the leaves of C. sativa cultivars in a greenhouse setting. Under both control and water-deficit stress conditions, leaf samples from two cultivars of C. sativa (‘Jin Ma’ and ‘NWG’) were evaluated to measure TRG accumulation.
2. Results
2.1. Data Analyses
A two-way ANOVA model in R, version 4.2.2 (R Core Team 2022) was performed to test for significant differences in relative water amount (RWC) and TRG between cultivars (2 treatment levels) and water-deficit stress treatment (two levels) treatments and their interaction. The package ‘car’ [9] was used to perform the Type II sums of squares which were used to test the ANOVA analysis. The ‘cld’ function from the package ‘multicompView’ [15] was used to create a compact letter display that visually represented significant differences. The packages ‘ggplot’ [23] ‘ggthemes’ [1] were used to generate a bar plot that visualized the mean RWC and TRG with a standard error bar with a significance letter display on top of the bar. The ‘emmeans’ package [20] was used to determine the least-square means. To create a density plot of the TRG, the ‘ggdensity’ function in the ‘ggpubr’ package was used [12]. A value of 10 was added to the raw data prior to analysis followed by use of the ‘moments’ package [3] to measure the skewness prompting a log transformation of the TRG data.
2.2. Results
2.2.1. TRG vs. Treatments
The water-deficit stress treatment led to a 451% increase in the trigonelline (TRG) amount of C. sativa (p=0.01448) (Table 1). The water-deficit stress treatment had a mean TRG level in the leaves of 7.41±3.64 OD262/gFW-1 ( Figure 1a). Conversely, the control treatment had a mean TRG level in the leaves of 1.64±0.51 OD262/gFW-1 (Figure 1). However, there was no difference in TRG amount between C. sativa cultivars alone or in interaction with the water-deficit stress treatments.
2.2.2. RWC vs. Treatments
The water-deficit stress treatment led to a 58.38% reduction in the relative water amount (RWC) of C. sativa (p=0.01328) (Table 2). The water-deficit stress treatment had an RWC level with a mean of 36.8±14.83% (Figure 3). Conversely, the control treatment had a RWC level with a mean of 63.03±9.27% (Figure 1b). However, C. sativa cultivars alone or in an interaction with the water-deficit stress treatment had a significant effect on the RWC.
These results indicate that TRG and RWC were related to the water-deficit stress treatment without distinction between the two cultivars (Figure 2).
3. Discussion
Hemp (C. sativa) seed, roots, stem can accumulate TRG [2]. To our knowledge, this is the first report of accumulation in leaves as a response to water-deficit stress. Detectable amounts of TRG were observed in both ‘Jin Ma’ and ‘NWG’ cultivars of C. sativa. TRG levels were solely affected by withholding water in the water-deficit stress treatment. This finding demonstrates that the availability of water to hemp plants, rather than differences between the cultivars, affected TRG accumulation. The outcome supports the null hypothesis of the experiment. Both cultivars had a detectable level of TRG. Previous studies show that the amount of TRG was reported within the range from 200-800 μg/g-1 and 2-10 μg/g-1 under drought stress and under interspecific competition stress, respectively [6,18]. This result shows that the level of TRG varies depending on the environment. The range of the reported amount of TRG of this study was 4-12 OD262/gFW-1. The difference between the units of the previous study and our study is that pure samples were used for detecting the TRG in [6,18] but not in this study. In other words, our number is the absorbance at 260 mm, which measures the extinction coefficient of TRG of an ion-exchange chromatography purified quaternary ammonium compound (QAC) fraction which was not the case for the earlier studies. Even though cultivars were not different in accumulation of TRG, the water-deficit stress level influenced the amount of TRG accumulation in C. sativa. In our study, the amount of TRG was higher in both cultivars of C. sativa when they were under water-deficit stress, compared to when the cultivars were watered as usual. This outcome confirms the observations from other species that accumulation of TRG in plant tissues occurs when plants are in a condition of water-deficit stress [18,24]. Hence, tissue accumulation of TRG could be considered a worthwhile marker of drought stress [16].
There was a difference in the relative water amount (RWC) between the treatments, confirming the efficacy of the water-deficit stress treatment. The differences in the mean of RWC between treatments showed that C. sativa under control treatment had a higher leaf RWC compared to when C. sativa was under water-deficit stress treatment. The level of RWC was low under water-deficit stress, which was the same case as the study conducted by Shwartz et al. on the grass Panicum virgatum [21].
4. Materials and Methods
The greenhouse experiment was conducted in the Tree Improvement Center (TIC) at Southern Illinois University Carbondale (SIUC) from November 30, 2023, to January 22, 2024. The study was conducted by imposing a water-deficit stress treatment by withholding water on two cultivars of C. sativa (‘JinMa’ and ‘NWG’). ‘JinMa’, is a fiber cultivar originating in China, whereas ‘NWG’ is a US-bred variety that is grown for both seed and fiber . Both the cultivars have less than 0.3% delta-9 tetrahydrocannabinol (THC) by dry weight and so are considered commercial hemp used for industrial, rather than 28, purposes [10].
First, the seeds of the two cultivars were sown into two different flats and placed under a light source on November 30, 2023. The flats were filled with vermiculite and Miracle Grow™ potting soil (0.18:0.06:0.12 NPK) [21]. The flats were watered daily, taking care to provide enough moisture for seed germination without overwatering. After the emergence and establishment of seedlings, they were transplanted into 10.16 cm radius × 30.48 cm deep containers (Stuewe and Sons, Ray Leach, Tangent, Oregon) at a planting density of 8 individuals per pot (0.10 square meter), filled with a 1:1:1 ratio of silt loam field soil:sand:potting mixture. Pots were blocked by replicate and treatments were replicated ten times. Two hemp cultivars X 2 water treatment levels X 10 replicates yielded a total of 40 pots. Minimum and maximum temperatures in the greenhouse were recorded daily. Light intensity was recorded at noon every 2-3 days using a LI-COR Light Meter (Model LI-250) to describe the maximum amount of light the plants received. The average daily high temperature was 28.52℃ and daily low temperature was 18.8℃. The average daily light intensity was 23.32 umol/ m2/s measured four times over the course of the experiment in the afternoon. Plants were watered twice a day, once in the morning at 8:00 am and again in the afternoon at 3:00 pm, until the soil mixtures in the pot were moist. Once plants were well established, the water-deficit stress treatment began 45 days following transplanting [21], i.e., January 15, 2024. Pots were watered as usual for the control treatment and were not watered for seven days for the water-deficit stress treatment. The treatment design was a fully factorial combination of C. sativa cultivars (JinMa’ and ‘NWG’) with control and treatment (no water).
Relative water amount (RWC) and trigonelline (TRG) were measured seven days after the water-deficit stress treatment was imposed. To measure the relative water amount, forty (40) fully expanded leaves (one leaf per plant from the base of the plant stem) were placed into a tared flask that contained chloroform and distilled water (3:2 v/v, respectively). Relative water amount of each sample was calculated as, RWC= (fresh mass – dry mass)/ (water saturated mass – dry mass) ×100 [20]. Trigonelline levels were measured using an ion exchange chromatography following established protocols [25]. The entire second fully emerged leaf from the bottom of the stem of each plant was collected for extraction of TRG. Leaves were placed into separate vials each containing 10 mL of methanol and stored by placing the vials at 4°C in the dark. For each of the vials, a phase separation was done through adding methanol, distilled water, and chloroform (5:3:2 v/v, respectively) [25]. Afterwards, trigonelline was purified by Dowex-1-OH ion exchange chromatography and quantified.
5. Conclusions
Our study shows that the accumulation of TRG in the leaves of C. sativa occurs concomitantly with a decline in the relative water amount (RWC) measured within leaves. The results showed that both cultivars of C. sativa can accumulate TRG. In our experiment, water-deficit stress played a more important role in TRG accumulation than cultivar identity. Moving forward, understanding the effect of the C. sativa cultivars on TRG and RWC accumulation can play an important role in making proper decisions on selecting cultivars to find physiological markers like TRG and RWC.
Author Contributions
Conceptualization, S.A, A.J.W., K.L.G., J.F.D.C.L.F., D.J.G. ; methodology, S.A, A.J.W; formal analysis, S.A., D.J.G.; investigation, S.A, A.J.W; resources, S.A, A.J.W., K.L.G., J.F.D.C.L.F., D.J.G.; data curation, S.A.; writing—original draft preparation, S.A.; writing— S.A, A.J.W., K.L.G., J.F.D.C.L.F., D.J.G..; supervision, D.J.G.
Funding
School of Biological Sciences, Southern Illinois University Carbondale.
Data Availability Statement
Ahmed, Shamim. (2024). The Competitive Response of Hemp (Cannabis sativa L.) with Different Agricultural Weed Species. MS. Thesis, Southern Illinois University -Carbondale.
Acknowledgments
We thank Farmtiva and New West Genetics for providing the JinMa and NWG hemp seed, respectively.
Conflicts of Interest
The authors declare no conflicts of interest.
Abbreviations
The following abbreviations are used in this manuscript:
| TRG | Trigonelline |
| RWC | Relative Water Amount |
References
- Arnold, J. B., & Arnold, M. J. B. (2015). Package ‘ggthemes’. [CrossRef]
- Ashihara, H., & Watanabe, S. (2014). Accumulation and function of trigonelline in non-leguminous plants. Natural product communications, 9(6), 1934578X1400900616. [CrossRef]
- Asquith, W. H. (2014). Parameter estimation for the 4-parameter Asymmetric Exponential Power distribution by the method of L-moments using R. Computational Statistics & Data Analysis, 71, 955-970.Barger, G. (1914). The simpler natural bases. Longmans, Green. [CrossRef]
- Boyer, J. S. (1982). Plant productivity and environment. Science, 218(4571), 443-448. [CrossRef]
- Chen X, Wood AJ. (2004) Purification and characterization of S-adenosyl-L-methionine nicotinic acid-N-methyltransferase from leaves of Glycine max. Biologia Plantarium, 48, 531-535. [CrossRef]
- Cho Y, Njiti V, Chen X, Triwatayakorn K, Kassem M, Meksem K, Lightfoot DA, Wood AJ. (2002) Quantitative trait loci associated with foliar trigonelline accumulation in Glycine max L. Journal of Biomedicine and Biotechnology, 2, 151-157. [CrossRef]
- ElSohly, M. A., Slade, D. (2005). Chemical constituents of marijuana: The complex mixture of natural cannabinoids. Life sciences, 78(5), 539-548. [CrossRef]
- Flores-Sanchez, I. J., Verpoorte, R. (2008). Secondary metabolism in cannabis. Phytochemistry reviews, 7, 615-639. [CrossRef]
- Fox, J., Friendly, G. G., Graves, S., Heiberger, R., Monette, G., Nilsson, H., ... & Suggests, M. A. S. S. (2007). The car package. R Foundation for Statistical computing, 1109, 1431. [CrossRef]
- Griffin, J., Roozeboom, K., Haag, L., Euler, A., Shelton, M., Myers, T., ... & Wilson, C. (2021). 2020 Kansas State University Industrial Hemp Dual-Purpose and Fiber Trial. Kansas Agricultural Experiment Station Research Reports, 7(9), 3. [CrossRef]
- Jahns, E. (1885). Ueber die alkaloide des bockshornsamens. Berichte der deutschen chemischen Gesellschaft, 18(2), 2518-2523. [CrossRef]
- Kassambara, A. ggpubr: ’ggplot2’ Based Publication Ready Plots (2020). URL https://CRAN.R-project.org/package=ggpubr. R package version 0.4.0. [CrossRef]
- Keller A, Leupin M, Mediavilla V, Wintermantel E (2001) Influence of the growth stage of industrial hemp on chemical and physical properties of the fibres. Ind Crops Prod 13:35–48. [CrossRef]
- Kushima H, Shoyama Y, Nishioka I (1980) Cannabis XII: Variations of cannabinoid amounts in several strains of Cannabis sativa L. with leaf-age, season and sex. Chem Pharm Bull 28:594–598. [CrossRef]
- Mangiafico, S.S. Summary and analysis of extension program evaluation in R; Rutgers Cooperative Extension: New Brunswick, NJ, USA, 2016; p. 775.
- Miller KD, Ebbs SD, Gibson DJ, Wood AJ, Young BG. (2011) Evaluation of physiological parameters for the prediction of seed yield and quality for soybean (Glycine max) plants grown in the presence of weed competition. Plant Biosystems, 145, 1-11. [CrossRef]
- Pate DW (1999) The phytochemistry of Cannabis: Its ecological and evolutionary implications. In: Ranalli P (ed) Advances in hemp research. Haworth Press, NY, pp 21–42. [CrossRef]
- Pfeiffer TL, Cho Y, Gibson DJ, Young BG, Wood AJ. (2001) Utility of trigonelline as a biochemical marker for interspecific weed competition between soybean and the weed common waterhemp. Biologia Plantarum, 44, 619-622. [CrossRef]
- Ross SA, ElSohly MA (1996) The volatile oil composition of fresh and air-dried buds of Cannabis sativa. J Nat Prod 59:49–51. [CrossRef]
- Russell, V.L. Least-Squares Means: The R Package lsmeans. J. Stat. Soft 2016, 69, 1–33. [CrossRef]
- Schwartz, L. M., Wood, A. J., Gibson, D. J. (2014). Trigonelline accumulation in leaves of Panicum virgatum seedlings. Natural Product Communications, 9(8). [CrossRef]
- Spano, M., Di Matteo, G., Ingallina, C., Botta, B., Quaglio, D., Ghirga, F., ... & Sobolev, A. P. (2021). A multimethodological characterization of Cannabis sativa L. inflorescences. [CrossRef]
- Wickham, H. (2006). An introduction to ggplot: An implementation of the grammar of graphics in R. Statistics, 1-8.
- Wood AJ. (1999) Comparison of salt-induced osmotic adjustment and trigonelline accumulation in two soybean cultivars. Biologia Plantarum, 42, 389-394.
- Wood, A. J., Saneoka, H., Rhodes, D., Joly, R. J., & Goldsbrough, P. B. (1996). Betaine aldehyde dehydrogenase in sorghum (molecular cloning and expression of two related genes). Plant physiology, 110(4), 1301-1308. [CrossRef]
- Zheng, X. Q., Nagai, C., Ashihara, H. (2004). Pyridine nucleotide cycle and trigonelline (N-methylnicotinic acid) synthesis in developing leaves and fruits of Coffea arabica. Physiologia Plantarum, 122(4), 404-411. [CrossRef]
Figure 1.
(a) Mean±standard error of log transformed trigonelline (TRG) amount in C. sativa leaves under control and water-deficit stress treatment (p=0.01448); (b) Mean±standard error relative water amount (RWC) in C. sativa leaves under control and water-deficit stress treatment (p=0.01448).
Figure 1.
(a) Mean±standard error of log transformed trigonelline (TRG) amount in C. sativa leaves under control and water-deficit stress treatment (p=0.01448); (b) Mean±standard error relative water amount (RWC) in C. sativa leaves under control and water-deficit stress treatment (p=0.01448).
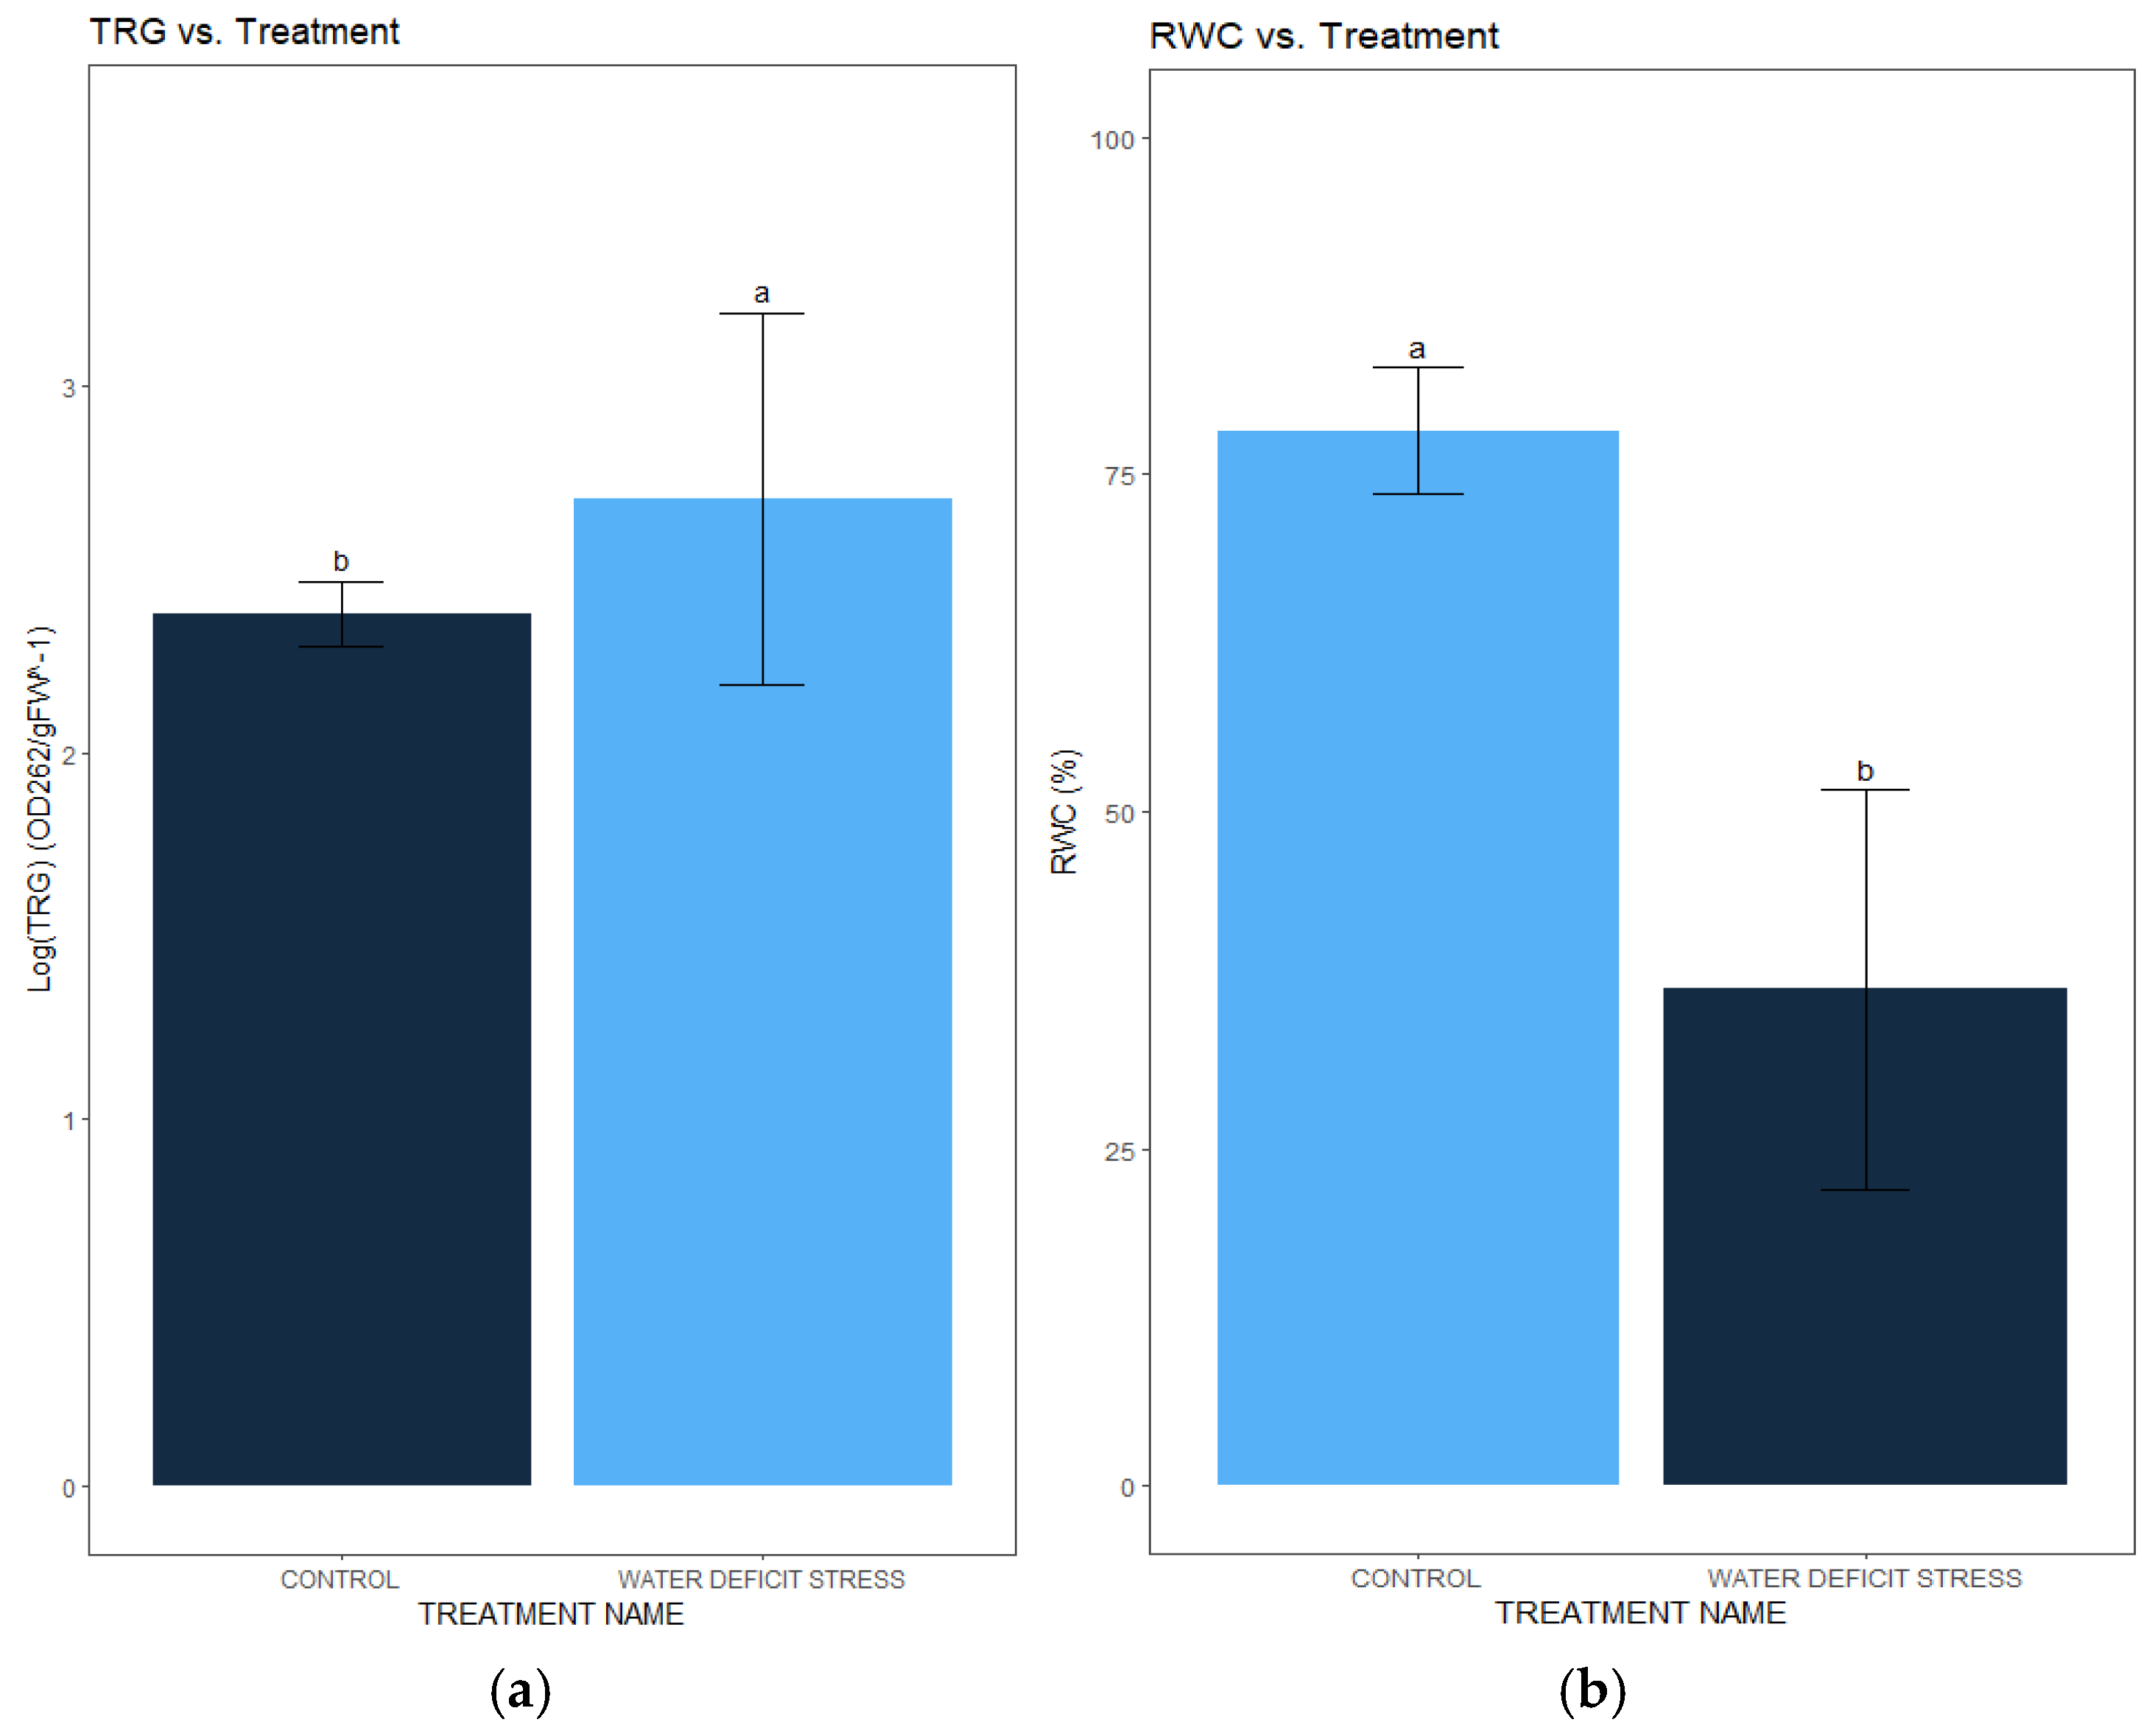
Figure 2.
Trigonelline (TRG) and relative water amount (RWC) for each of the cultivars of C. sativa under control and water-deficit stress treatments (mean± standard error).
Figure 2.
Trigonelline (TRG) and relative water amount (RWC) for each of the cultivars of C. sativa under control and water-deficit stress treatments (mean± standard error).
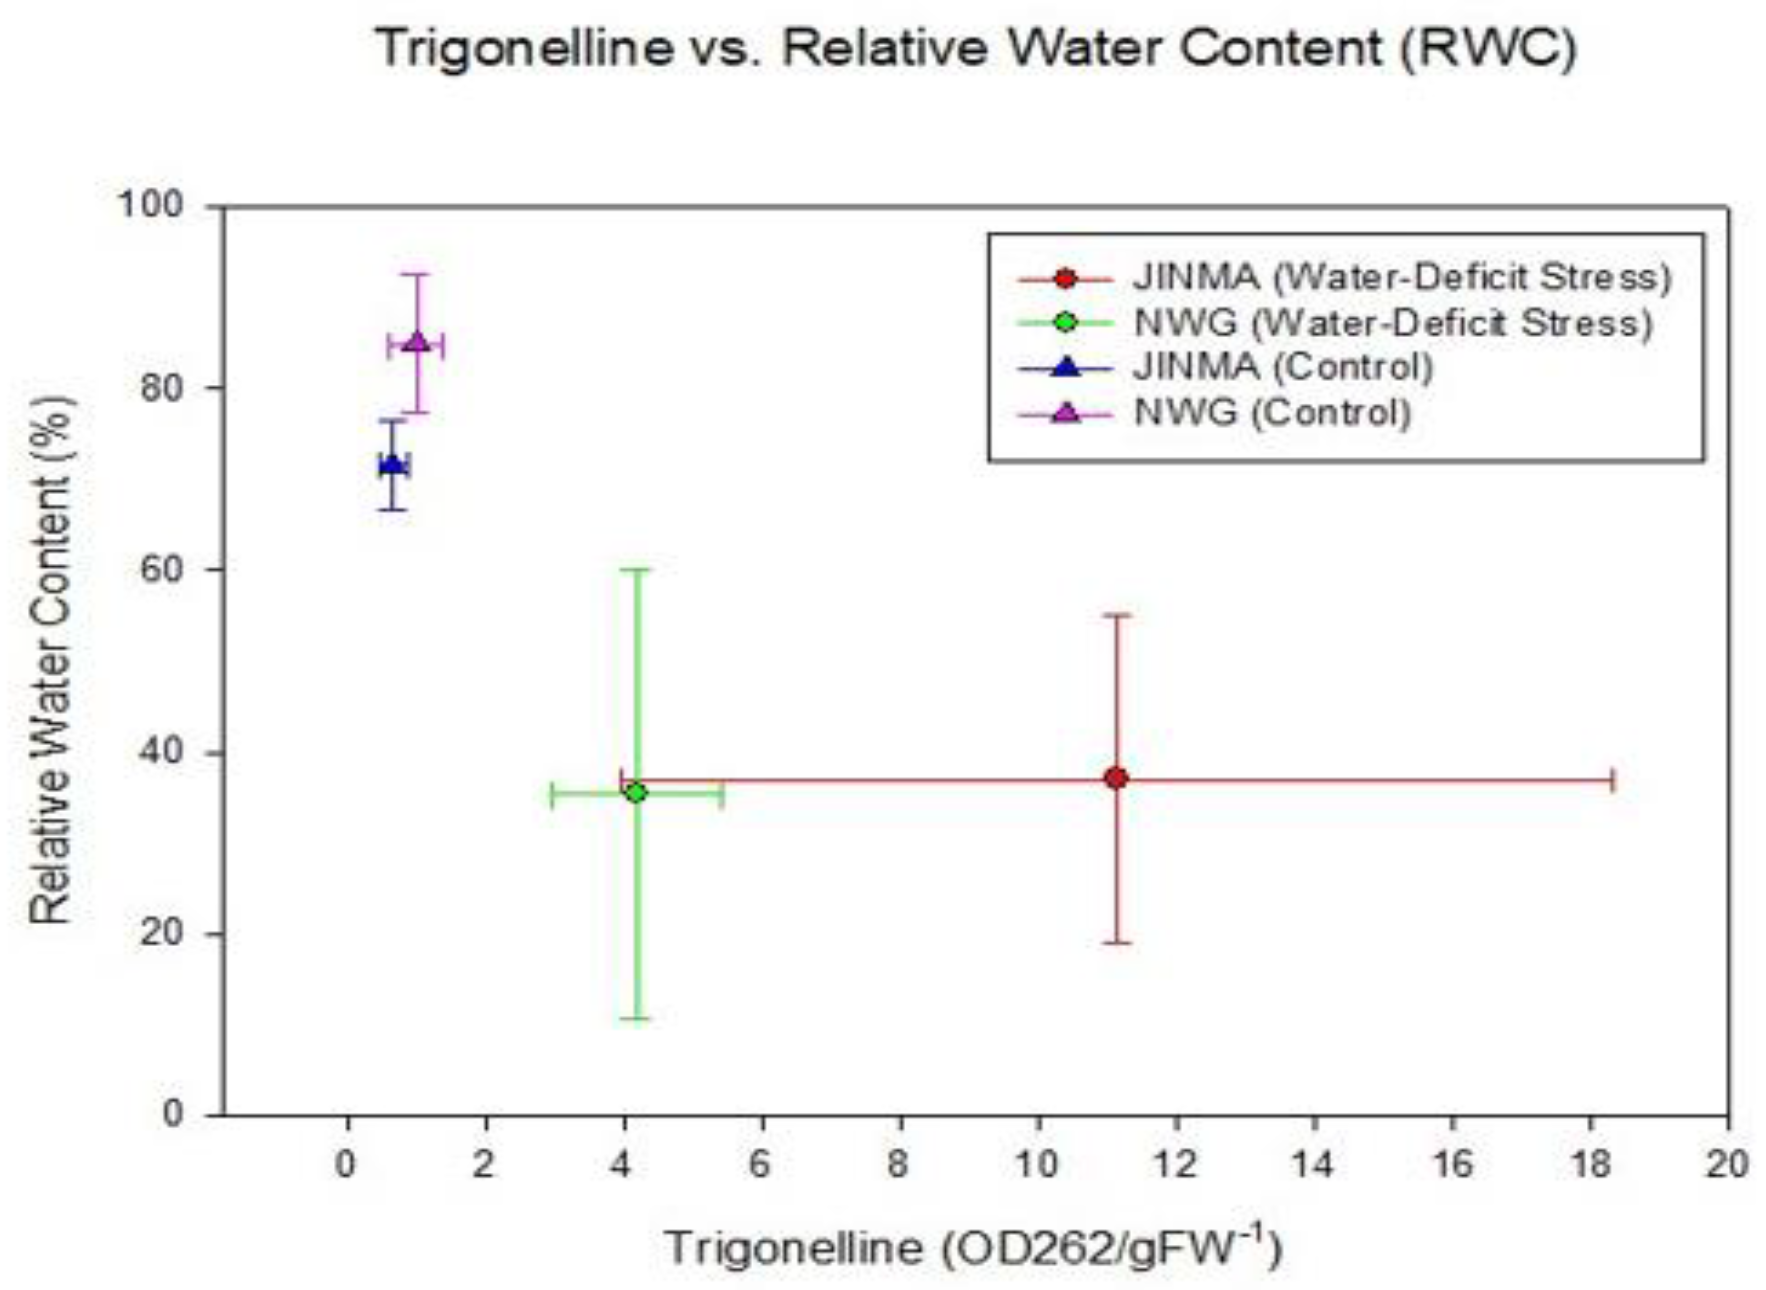

Table 1.
Results of 2-way ANOVA testing for differences in trigonelline (TRG) amount of C. sativa as a result of cultivar identity and water-deficit stress treatment.
Table 1.
Results of 2-way ANOVA testing for differences in trigonelline (TRG) amount of C. sativa as a result of cultivar identity and water-deficit stress treatment.
| Effect | Sum Sq | Df | F Value | p-Value |
|---|---|---|---|---|
| Water-deficit Stress Treatment | 0.9147 | 1 | 6.6412 | 0.01448 |
| Cultivar | 0.0235 | 1 | 0.1707 | 0.68204 |
| Water-deficit Stress Treatment: Cultivar | 0.0555 | 1 | 0.4033 | 0.52965 |
| Residuals | 4.683 | 34 |
Table 2.
Results of 2-way ANOVA testing for differences in relative water amount (RWC) of C. sativa as a result of cultivar identity and water-deficit stress treatment.
Table 2.
Results of 2-way ANOVA testing for differences in relative water amount (RWC) of C. sativa as a result of cultivar identity and water-deficit stress treatment.
| Effect | Sum Sq | Df | F Value | p-Value |
|---|---|---|---|---|
| Water-deficit Stress Treatment | 17189 | 1 | 6.7854 | 0.01328 |
| Cultivar | 409 | 1 | 0.1615 | 0.69018 |
| Water-deficit Stress Treatment:Cultivar | 472 | 1 | 0.1864 | 0.66851 |
| Residuals | 91195 | 36 |
Disclaimer/Publisher’s Note: The statements, opinions and data contained in all publications are solely those of the individual author(s) and contributor(s) and not of MDPI and/or the editor(s). MDPI and/or the editor(s) disclaim responsibility for any injury to people or property resulting from any ideas, methods, instructions or products referred to in the amount. |
© 2025 by the authors. Licensee MDPI, Basel, Switzerland. This article is an open access article distributed under the terms and conditions of the Creative Commons Attribution (CC BY) license (https://creativecommons.org/licenses/by/4.0/).
Copyright: This open access article is published under a Creative Commons CC BY 4.0 license, which permit the free download, distribution, and reuse, provided that the author and preprint are cited in any reuse.


