
Submitted:
07 April 2025
Posted:
08 April 2025
You are already at the latest version
Abstract
Fossil gases account for more than one-third of all CO2 emissions caused by human activity. Previously, irreversible materials were used to capture CO2. Such sorbents cannot be reused, resulting in an increase in solid waste. For successful carbon sequestration, reversible sorbents are needed, yet very few examples of such sorbents are known. Chitin and Chitosan both have amino- groups with the potential to capture CO2 in an ‘acid-base’ reaction on the surface of the sorbent. In our study, CO2 sorption-desorption data for natural chitosan and its blends with pure and modified polysulfone has shown reversibility of the process and high sorption capacity. Blends show higher sorption capacity than pure chitosan, due to slower swelling in water, and slower loss of sorbent’s surface. Pure chitin derived from shells has a much lower sorption capacity than chitosan due to much higher molecular weight. Hydrolysis is required to convert chitin into an effective sorbent.
Keywords:
Chitin
; Chitosan
; biocompatible
; polysulfone blends
; CO2 capturing
; reversible sorbents
1. Introduction
Chitin is a high molecular weight natural polymer with incredible properties such as biocompatibility, non-toxicity, biodegradability, and antimicrobial properties. Chitosan, the most popular derivative of chitin, has numerous applications, and the market for a wide range of products is expanding. As a result, experts worldwide are researching new sources and technologies for chitin and chitosan from various raw materials [1-3]. According to Silva et al. (2017) [4], it was shown that chitin has a strong enough bonding potential to capture CO2, yet the process is reversible and the sorbent can be reused.
Chitosan is the second most abundant polymer in nature after cellulose. Chitosan is obtained through the deacetylation of chitin [5]. D-glucosamine (deacetylated unit) and N-acetyl-D-glucosamine (acetylated unit) are repeating units in the linear copolymer chitosan, and they are joined by a (1-4) glycosidic bond. Chitosan is a molecule that is created when the acetyl-d-glucosamine units of chitin lose their acetyl groups (deacetylation), and the degree of deacetylation is at least 50 percent [6-9]. Chitosan can be processed chemically and industrially considerably more easily than chitin because of these different degrees of deacetylation (DDAs). Chitosan has an amino pKa of 6.3 and acts as a strong base as a result of the primary amines that are created during the deacetylation of chitin [10].
Chitosan has received remarkable attention from the scientific community since it can be easily biodegraded. Current major applications of chitosan include drug delivery systems, scaffolds, or membranes, textile industry, wastewater treatments, agriculture, food, packaging, personal care, and biotechnology [11-12]. In the previous year, several efforts have been undertaken to produce biopolymer-based antimicrobial packaging materials in order to boost food shelf life and quality [13-15].
Amines have filled the role of CO2 capturing group since the conception of carbon capture by Bottoms in the 1930s [16]. According to Robinson et al. (2012), incorporation of post-combustion CO2 capture (PCC) technology into both existing and new coal-fired power plants was crucial, to reduce CO2 emissions in the number of coal-fired power plants [17]. The most common type of PCC is aqueous amine-based PCC. CO2 reduction technology is both promising and close to completion Coal-fired power plants emit a significant amount of pollution. Separation is one of the components of PCC to chemical absorption and re-release of CO2 from a flue gas stream via a two-step heating process for storage or industrial use. PCC has been proven in the industry with absorbents such as aqueous monoethanolamine (MEA), which has been used for decades to remove CO2 from gas streams in small-scale commercial operations such as ammonia manufacturing and natural gas processing [18-19].
The CO2 sorption properties of amino-functionalized activated carbon (AC) were also recently explored [20]. In this study, activated carbon was oxidized by a refluxing H2SO4/HNO3 mixture. The carboxylated AC was then stirred into solutions of triethylenetetramine (TETA) and chitosan. The amine loading greatly increased the CO2 sorption capacity of the materials despite reducing the mean pore size and diameter [21].
The attempt to use chitosan as a solid-state CO2 sorbent has been explored by Gao et al. (2015) [22]. Pohako (2016) [23] prepared chitosan ion-gels for the preparation of inverse supported ionic liquid phase (SILP) materials for CO2 absorption. The SILPs prepared were characterized by a CO2 absorption efficiency of 0.1 to 0.8 mol kg-1 at 1 bar. This study showed that chitosan as a renewable and environmentally friendly polyamine increases the absorption efficiency of the prepared reverse SILP materials.
Several attempts were made to create silica-based or composite materials with different types of matrixes covered by chitosan [24]. This produces sorbents with high sorption capacity. However, because of matrixes used, these sorbents are not reversible and cannot be reused.
Lopes et al. (2022) [25] combined ionic liquids (ILs) with chitin and chitosan biopolymers for CO2 sorption. Four acetate-based ILs were chosen for this study to investigate the solubility of chitin, chitosan, and carboxymethyl-chitosan. Several Nuclear Magnetic Resonance (NMR) techniques, including 1H, 13C, nuclear Overhauser effect spectroscopy, and spin-lattice relaxation, were carried out to analyze the dissolution using carboxymethyl-chitosan and biopolymer monomer units as models. ILs have received a lot of interest as more environmentally friendly alternatives to conventional solvents in various fields [26-28]. In comparison to volatile organic solvents, one of their key characteristics that contributes to less air pollution is their low vapor pressure [29]. Moreover, ILs are significantly effective at dissolving biopolymers like chitin and chitosan [30-34].
Despite the increased interest in using biopolymers to capture CO2, the regeneration of the materials is still an energy-intensive process, and because of their limited solubility, chitin-based products are only occasionally used [35]. The energy cost associated with the CO2 capture materials' regeneration is still a deal-breaker for the majority of CO2 capture methods [36]. Using amine-based materials in direct air capture methods results in a contribution of total regeneration energy that is estimated to be between 60 and 70 percent of the cost [37]. An ideal sorbent in this context should be recycled with minimal energy expenditure, preferably at room temperature, in order to generate a competitive material.
Smit et al. (2014) [38], who used pure water as a model for the kinetics of carbon capture, have shown that carbon dioxide reacts with water to form carbonic acid as the rate-determining step and then further dissociates to form the carbamate and bicarbonate forms. The formation of carbamate is an indication of reversible sorption, whereas bicarbonates and carbonates are formed in the irreversible carbon capturing [39].
Several methods to effectively evaluate the efficacy of a particular sorbent, including spectroscopic studied such as Fourier-Transform Infrared Spectroscopy (FTIR), NMR, as well as thermogravimetric analysis (TGA), and Intelligent Gravimetric Analyzer (IGA) by Hidden Isochema have been used to study the gravimetric mass transfer in materials as a function of time and/or temperature during the sorption and desorption processes.
Earlier tests by our research group in 2012, for chitosan of molecular weight of approximately 11,000 Daltons demonstrated that it is a biocompatible, biodegradable, and most importantly, reversible sorbent [39]. By using IGA, it was shown that pure chitosan has a CO2 capacity of up to 0.66g CO2/g chitosan. The moist reaction conditions like fossil gases on power plants, however, shown fast loss of sorption capacity due to swelling in water vapors and reduce of sorption surface over time. In attempt to solve the problem, this study probes polysulfone blends that contain both pure and modified chitosan with functional groups in reversible carbon sequestration. Additionally, chitin's capacity to capture carbon dioxide was enhance through hydrolysis. Seafood waste products offer a substantial untapped source of chitin because the Delmarva Peninsula generates the most seafood waste. Utilizing this waste as potential source of sorbent would resolve additional ecological challenges. A comprehensive analysis was also carried out to evaluate and pinpoint the most concentrated sources of chitin in this region. Chitin can be recovered from shrimp shells and other crustaceans using alkaline reagents [40-43]. Pure chitin was separated from these biological structures through a standard procedure consisting of decalcification and deproteinization.
2. Materials and Methods
General procedures. Polysulfone (PSf) with a molecular weight of 35,000 Dalton, Chitin with molecular weight of 210,000 Dalton, and chitosan with a molecular weight of 11,000 Dalton (75-85 percent deacetylated) were obtained from Sigma-Aldrich and dried in a vacuum at 120 ℃ for 8 hours before to usage. Airgas provided high-quality nitrogen and carbon dioxide gas tanks. All of the remaining reagents and solvents were obtained from Fisher Scientific and utilized as is. All sorption and desorption investigations for chitosan and blends were conducted using the Hidden Isochema IGA-003 (Intelligent Gravimetric Analyzer) with a seven-channel MS gas analyzer and a combination of nitrogen and moist carbon dioxide at various ratios. Experiments with solutions of hydrolyzed chitin were conducted using the custom system described below. To make blends containing 2.5 - 5 wt. % chitosan, low molecular weight chitosan was dissolved in a minimum amount of 1 % acetic acid water solution.
Preparation of polymeric blends with Chitosan. All blends were prepared in the lab of Prof. Arun Isloor (NITK, India) , as previously described in the literature by him [44], and sent to our lab for tests.
A homogeneous solution was obtained by dissolving 3.9 g of polysulfone in 15.6 ml of N-Methyl-2-pyrrolidone (NMP) at 60 °C. Subsequently, 5 ml of chitosan solution (11,000 Dalton) and a further 5 ml of NMP were added while vigorously stirring at the same temperature. The product precipitated in the homogenous polysulfone solution after each addition. For 12 hours, the resulting turbid solution was agitated at 70 °C to create a homogenous solution. After filtering the homogenous viscous solution with a G4 sand filter at about 50 °C, it was cast over a glass plate and placed in a coagulation bath with distilled water at 20 °C. After repeatedly washing the prepared sample with distilled water, it was dried for 24 hours at 30 °C.
The same procedure was used to create a sample with greater chitosan concentrations, but a larger volume of chitosan solution was added to the NMP solution (instead of using 5 ml of chitosan solution to create a sample with 5% chitosan, 10 ml volumes were used).
Chemical modification of Chitosan. Due to poor solubility in only a limited number of organic solvents, chitosan needs chemical modifications to be blended with PSf.
Synthesis of N-Succinyl Chitosan (NSCS). NSCS is an amphiprotic derivative obtained from the N-acylation of chitosan. The synthesis was performed as described in the literature [45]. 1 g chitosan was dissolved under magnetic stirring and room temperature in 100 mL of 1% (w/w) glacial acetic acid solution. Subsequently, a solution of succinic anhydride (1.8 g) in 99.9% acetone (20 mL) was added dropwise and under stirring. The mixture was then exposed to ultrasonic bath at 50 °C for 60 min. The resulting solution was then cooled to room temperature; 95% hydrated ethyl alcohol (100 mL) was added, and the mixture was transferred to a freezer (−20 °C), where it remained for 24 h. After this period, 1 mol/ L aqueous sodium hydroxide solution was added until pH 10. Then, acetone was added until precipitation occurred. The mixture was again placed in the freezer for 48 h. After this period, the product was vacuum filtered using 95% ethyl alcohol (about 1000 mL) to wash the retained solid. The final product was obtained as a yellowish-white powder and dried in vacuum [46].
Synthesis of N-propyl-phosphonic chitosan (NPPCS). 2g of chitosan was mixed with 100 mL of deionized water at 30 ℃, propyl-phosphonic anhydride (0.5 mL, 50% solution in EtOAc) was added dropwise over a period of 10 min at the same temperature, and the clear homogeneous solution was observed once the addition was completed. The reaction mass was stirred at 30 ℃ for 6 hours. The product was precipitated by adding excess of acetone, filtered to remove the solvent, and then washed with 80% acetone in water, 90% acetone in water, and with pure acetone, respectively. Finally, the product was dried at 40 ℃ under vacuum for 24 hours to get desired N-propyl-phosphonic chitosan as white powder. This has yielded approximately 2.4g of product [47].
IGA Analysis. The typical TGA (thermogravimetric analyzer) instrument consists of an analytical balance, a furnace, a way of controlling the gaseous environment of the sample, and a computerized control unit for the whole system and for data collection. The advanced modification of TGA instruments that has been proven useful for CO2 sorption studies is Intelligent Gravimetric Analyzer (IGA). This instrument allows you to control flow, mixture of gases composition and wetness, pressure, and temperature inside the reactor with TGA balance built-in, while also measuring the intensity of Mass spectrometer channels tuned for up to seven different gases, along with a general ESI-MS function. An overview of the research literature has revealed that there are two different types of measurement which are typically made when studying gas sorption with an IGA apparatus: these are sorption cycling and isotherm modelling. Sorption cycling experiments are conducted to determine the stability of a sorbent over a specific lifetime by measuring sorption and desorption as a function of time. This second function was utilized in this project [48-49].
The IGA design incorporates precise computer control and measurement of weight change, pressure, and temperature to enable fully automatic and reproducible determination of gas adsorption-desorption isotherms and isobars. The fully automated instrument designed for this study employs the Hiden IGA (Hiden Isochema Ltd, IGA-003) gravimetric method [50] to continuously weigh the sample in the presence of a carrier gas flow that is regulated upstream in the balance chamber at a constant total pressure. The vapors are introduced from a thermostatic vapor generator and fed into a reactor with a separate isothermal jacket that houses the sample (Figure 1). An independent heating element at the sample position is used for controlled ramp desorption rate. A Hidden HPR-20 series DSMS mass spectrometer was used for gas analysis. Figure 1 illustrates the general scheme of IGA and the example of output.
To imitate the fossil gases of power plant, a mixture of nitrogen and carbon dioxide gases were flown through the system at two ratios: 25% of carbon dioxide for the first 220 min. of the experiment, and 40% of carbon dioxide for the next 220 min. Carbon dioxide was moisturized by passing through vapor generator filled with water. A sample of solid sorbent in form of powder to increase the surface was placed on the sample holder of built-in precise balance. Then the reactor was sealed, and initial weight of the sample was recorded, after the balance was steady for at least 2 min with the flow of nitrogen through the reactor at the same flow as during the experiment.
All experiments were carried out at atmospheric pressure and room temperature, with a gas mixture kept at roughly 15% humidity. The flow of gas was 250 ml/min, while the composition of gases varied at different steps of the experiment, as described above.
FTIR analysis of chitosan samples. Each sample for FTIR measurement was dried under vacuum in a round bottom flask at room temperature for approximately 24 hours or until the mass of the sample becomes constant. The spectrum of each sample was then measured using a Cary 630 FTIR with diamond ATR attachment. The 32 scans spectra were compared with a chitosan standard obtained from Tokyo Chemical Industries (TCI) and dried similarly to the samples above.
Carbon Sorption/Desorption experiments with chitin and chitosan samples
The aim of this procedure was to characterize the ability of pure chitin to react with atmospheric carbon dioxide, since it also has amine groups to capture CO2. This experiment was conducted for pure chitin at atmospheric pressure and room temperature. Also, Chitin was purchased from TCI. Samples were treated at 24, 30, 48, and 72 hours and dried under vacuum for 10 – 12 hours. An FTIR scan was taken of the samples before and after CO2 exposer.
Since chitin is a polymer with a high molecular weight (200,000 Dalton), it is insoluble in the majority of solvents. The long chain polymer was then treated with an acid to initiate a hydrolysis reaction [51], which resulted in the formation of smaller oligomers and short chain structures with more exposed amine binding sites and greater solubility. Reagent grade chitin obtained from Tokyo TCI and chitin extracted from shell waste was used for hydrolysis. This reaction is usually catalyzed by a weak acid or a base [52].
Hydrolysis of Chitin
In a conical flask, 20g of chitin was added to be dissolved in 350mL of 11M HCl. Stir with a magnetic stir bar for one to one and a half hours at 4°C. Secondly, the chitin paste was heated in HCl constantly for two hours at 40°C in a water bath. Third, used an ice bath to chill the hydrolysate to 4°C. Next, while stirring added 50% NaOH dropwise to the hydrolystate until the acid is neutralized (confirm with a pH paper). Ultimately, the precipitate was extracted from the solution using a Buchner funnel and Whatmann filter paper [51]. The hydrolysis process was carried out at various temperatures and periods of time, and the outcomes were evaluated using Matrix-Assisted Laser Desorption/Ionization-Time of Flight (MALDI-TOF).
Preparation of Charcoal-Celite Column
To prepare the slurry, 300g of activated charcoal was mixed with 300g of celite into 2500mL of deionized water. This solution was boiled until thickening occurred giving the slurry consistency. The slurry was cooled in a flask covered with parafilm at room temperature until it was able to be added into the column. Two inches of sand was added into the bottom of the column (5cm x 70cm). Then, the slurry was added into the column in 5 parts to allow even layers of the slurry throughout. Water was continuously running throughout to prevent cracking of the column (Figure 2).
Separation of chitin oligomers on charcoal-celite column
To isolate the individual pieces and assess their respective sorbance capacities, the hydroslate was filtered through a charcoal-celite column using 5 percent, 10 percent, 15 percent, and 20 percent ethanol in water solutions. 50ml fractions were collected and concentrated using a rotary evaporator to ~25ml and freeze dry. Dry Fraction of chitin was used for MALDI. Samples for CO2 sorption (1 gram) was dissolved in deionized water with the gas flow rate 5 PSI as shown in Figure 3. The 10 and 20% fractions were utilized for FTIR and CO2 sorption because they produced a larger yield of hydrolyzed chitin.
Isolation of raw chitin from samples of typical Delmarva Peninsula waste.
In this study, the method used 25% HCl and 20% KOH for demineralization [52] and deproteination [53] respectively. Seven types of shells were tested in this project: whelk (1), hard clam (2), blue crab (3), eastern oyster (4), scallop shell (5), shrimp shell (6), and horseshoe shell (7) as these were all readily-available products in the Delmarva region at the time of testing. Reagent grade chitin was obtained from TCI for comparison.
Decalcification of shell samples
The purpose of the decalcification procedure was to remove the calcium carbonate layer by adding 25% (v/v) HCl, thus isolating the underlying chitin and protein matrix which can be filtered from the suspension, dried, and calculated as a weight fraction of the original raw shell. Samples were prepared by drying about 5g of the raw material in the oven at 50°C until constant mass measurements were achieved indicating that all water had been desorbed. This shell aliquot of known mass was then transferred to a 400mL Erlenmeyer flask with about 10mL of deionized water. The shell portions were then treated with 25% (v/v) HCl until visible effervescence ceased. After this, base solution was added until neutral pH was reached as indicated by phenolphthalein. The suspension was then vacuum filtered and dried in an incubator at 50°C until a constant mass was observed
Deproteination of shell samples
Decalcification by the above procedure simply removed the inorganic CaCO3 layers in the shell samples while leaving the organic material intact—namely a mixture of chitin, proteins, and a small amount of pigments. Additional treatment of this organic material with a diluted base (20% w/v KOH) decomposes the amino acid polymers while leaving the chitin in the sample [54]. For this procedure, approximately 1g of dry, decalcified sample was measured into a 250 mL conical flask and combined with 20% (w/v) KOH to determine optimal conditions. These mixtures were stirred for 1 days and then filtered with a vacuum. The resulting filter cake was dried in an incubator at 50°C until constant mass was attained.
3. Results
For the blends the capacity increases with the increasing concentration of chitosan in the blend. Chitosan has amino-groups capable of CO2 capturing, whereas polysulfone does not. In pure chitosan the concentration of amino groups per weight unit of the sample is the highest and as a result the sorption capacity is the best. In this respect pure chitosan is a better absorbent than the blends. However, in the atmosphere of wet fossil gases, swelling of pure chitosan sample complicates its handling due to fast and significant decrease of sorption surface.
The issue of swelling may be resolved by combining chitosan with the nonpolar polymer polysulfone. However, due to solubility restrictions, only a small amount of chitosan can be mixed with polysulfone. Up to 20% of chitosan can be added to the blend because of the increased solubility of chitosan transformed into NPPCS and NSCS. At room temperature and atmospheric pressure, the sorption rates for a 20% chitosan in polysulfone mix were approximately 0.53g CO2/g blend per hour.
Preparation of NPPCS. Enhancing chitosan's solubility at neutral pH is the purpose of this modification. Figure 4 displays the reaction product. The cyclic anhydride group in propyl-phosphonic anhydride instantly cleaves in water to produce an open hydrated intermediate with a phosphonic acid group. As a result, water becomes somewhat acidic instead of neutral, which increases the solubility of more chitosan [47].
IGA Analysis of chitosan and blends samples. The example of IGA output for sample 1 of pure chitosan is presented in Figure 1. The amount of chitosan was roughly 42 mg, as seen in the first channel Figure 1 (an output example). An external heater regulates the temperature in the IGA system. Using MS channels with signal intensities of m/z = 18 for water and 44 for CO2, the experiment's emissions of carbon dioxide and water were measured. To clean the image for gases of interest, the nitrogen signal at m/z = 28 was automatically eliminated from the spectrum.
As a mixture of carbon dioxide and nitrogen passes through the sorbent, the experiment was designed to begin at room temperature and atmospheric pressure. During the whole experiment the mass gain and lost as a function of time was recorded and at the same time the intensity of CO2 and water peaks in gas analyzed was recorded as well. The weight of the sample increases as 25% CO2 flows through it, and it increases once more when the concentration is raised to 40%. The replica fossil gas mixture was allowed to flow for 400 minutes before the flow was stopped and a room-temperature vacuum was used to clear the system of gases and ensure that there was no more carbon dioxide in the pipes.
Throughout the whole vacuumizing process, the mass of the sorbent containing the adsorbed carbon dioxide remained constant, suggesting that the sorbent retained all of the carbon dioxide that had been absorbed and that the bonds between the carbon dioxide and chitosan are stable and chemical in nature. The system was only filled with dry nitrogen following the application of vacuum, and the nitrogen flow continued into the stage of desorption at atmospheric pressure.
The experiment's desorption process involved raising the system's temperature from ambient temperature to about 90 °C at a rate of 2 °C per minute. While the total release of all absorbed carbon dioxide was recorded at about 80°C, a point at which the weight of sorbent decreased back, the majority of sorbent samples began releasing carbon dioxide above 50°C, as demonstrated by increasing the intensity of the MS channel at m/z = 44. After being taken out of the instrument sample holder, the sorbent was vacuum-dried in an oven once more, making it reusable.
Carbon dioxide sorption and desorption results for pure chitosan (sample 1) and its blends with polysulfone (sample 2 with 2.5 % of chitosan and sample 3 with 5 % of chitosan) are shown in Table 1. While the sorption capacity is the best for pure chitosan (table 1, sample 1). Swelling causes the loss of surface and sorption stops after the first 20 min of the run. Sample 9 has only 20 % of chitosan in it, yet shows sorption capacity compatible with the sample of pure chitosan. The sorbent keeps absorbing CO2 (sample 9 of modified chitosan blended with polysulfone) for first three hours of the experiment, as compared to 20 minutes for the sample of pure chitosan. The amount of CO2 adsorbed per gram of sample per hour was used to determine the sorption capacity for both 25% and 40% of CO2.
In the same table, sample 4 is a modified chitosan into N-Propylphosphonyl Chitosan (NPPCS, Figure 4), followed by samples 5 and 6 with 10 and 20 % ww of NPPCS in polysulfone respectively. Sample 7 is another type of modified chitosan into N-Succinyl Chitosan (NSCS, Figure 4), followed by samples 8 and 9 with 10 and 20 % ww of NSCS in polysulfone respectively.
The need to modify chitosan into samples 4 – 9 is due to fast swelling of pure low molecular weight chitosan in the presence of water vapors. This results in a significant decrease in sorption surface and low sorption capacity. Blending of pure chitosan with polysulfone has a limitation related to the solubility of these polymers, not allowing to incorporate more than 5% ww of chitosan into the blend (samples 2 and 3 in the table 1). Those blends solved the problem of swelling, yet, because no more than 5 % of chitosan can be incorporated, the sorption capacity is reduced. However, when in 5% of chitosan in polysulfone sample 3 the concentration of chitosan is reduced 20 times as compared to pure chitosan (compare entries 1 and 3 of the table 1), sorption capacity is only reduced about 3.2 times, due to larger sorption surface with no swelling. With chitosan modified into NPPCS and NSCS, the solubility increases allowing to incorporate up to 20% of chitosan into the blend (samples 4 – 9). As a result, the sorption capacity can be increase to almost match the one for pure chitosan (sample 9) without swelling problem, yet sorption does not stop after the first 20 min.
FTIR Analysis of Chitosan. As has been shown on Figure 5, two products are possible when primary amine of chitosan reacts with carbon dioxide. The formation of carbamate is an indicator for the reversible carbon sequestration, while the formation of bicarbonate or carbonate points on the irreversible capturing [56].
FTIR analysis of the absorbents after prolonged CO2 capturing did not show the presence of amino groups –NH2. Therefore, the formation of carbamates was the most likely process during CO2 sorption. Figure 5 presents the FTIR difference between carbamate and bicarbonate adsorption product from literature, that was studied for liquid amines. The clear difference between bicarbonate and carbamate can be seen in peaks between 1000 and 1800 cm-1[56-57].
Figure 6 has a typical example of FTIR for chitosan samples after CO2 sorption, confirming the carbamate formation and reversibility.
FTIR Analysis of Chitin
The FTIR spectra of pure chitin samples exposed to CO2 for varying time lengths can be seen in Figure 7. These reveal that no change occurs over the course of 48 hours. Exposure for a longer time at 72 hours a more noticeable change begins to take place in the lower wavenumber region between 650 and 1650 cm-1. Carbon-oxygen stretching vibration was observed in 1260-1300 cm-1. NCOO- moiety was found at 1350-1450 cm-1. Double bonded carbon and oxygen were present at 1550-1600 cm-1. Also, NH stretching occurred between 1600-1650 cm-1. To overcome this drawback, it was discovered that hydrolysis is a chemical reaction that has the potential to boost productivity.
MALDI Analysis of 30, 40, and 50 degree Celsius products of chitin hydrolysis
Partial hydrolysis is typically completed with hydrochloric acid. The products consist of chitin monomers, and small oligomers. So, acid hydrolysis of chitin leads to cleavage of glycoside bonds. MALDI was used to test samples of hydrolysis and separation products, obtained at various temperatures and times, and the results are shown in Figure 8. The majority of the samples have higher concentrations of monomer, dimer, and trimer. Only 20% fraction at 30 degree Celsius for 3 hours and 50 degrees Celsius for one hour had a higher chain polymer of chitin.
FTIR spectra for this experiment and the Absorption capacity of samples can be seen below in Figure 9, Figure 10, and Table 2. According to the literature, the formation of carbamate shows peaks between 1000 to 1600 cm-1 region. Pure chitin spectra of 10 % fraction after CO2 sorption confirms the formation of carbamate (Figure 9). Peaks were upside down to match the peaks from the chitosan sample, which was measured in Transmittance instead of Absorbance. The same results were obtained for all 10 and 20 % fractions of shrimp and crab chitin; however, spectra were measured in Absorbance to match the literature (Figure 10).
Furthermore, Table 2 shows the sorption capacity of 10 and 20 % fractions of pure, shrimp, and crab chitin samples. Which indicate that chitin after hydrolysis can capture CO2 almost as effectively as Chitosan. Although, chitin has benefit over chitosan, which swells after absorbing water vapors. On the other hand, chitin can be dissolved in water so CO2 can be bubbled through it.
| Samples* | Absorption Capacity mg CO2/g sample/hour |
| 10 % Pure Chitin | 0.15 |
| 20 % Pure Chitin | 0.20 |
| 10 % Shrimp Chitin | 0.28 |
| 20 % Shrimp Chitin | 0.30 |
| 10 % Crab Chitin | 0.23 |
| 20 % Crab Chitin | 0.28 |
*Chitin obtained from the separation column after hydrolysis using. 10 and 20 % fractions of ethanol
Percent Chitin Content from shell waste of Delmarva Peninsula
The protein and mineral content were used to calculate the total chitin concentration in each shell type as a final metric of the shell’s industrial feasibility. Below are the concentrations of chitin in the dry raw shell. The highest concentration was found in shrimp shells at about 50% of the dry shell mass as shown in Figure 11.
4. Conclusions
Qualitative carbon sorption experiments were conducted in this study by subjecting pure and modified chitosan and its blends with polysulfone to a steady flow of wet carbon dioxide and nitrogen mixture imitating compositions of fossil gases and recording changes in infrared spectrum. Chitosan has a hydrophilic nature that leads to swelling during the sorption of wet carbon dioxide. Blending pure and modified chitosan with polysulfone helps prevent the swelling and prolong the sorption ability.
Furthermore, it can be concluded from Table 1, the sorption capacity is the best for pure chitosan. For the blends the capacity increases with the increasing concentration of chitosan in the blend. The blend that has 20% of NSCS in polysulfone has sorption capacity almost same as pure chitosan, but much longer sorption ability. Further modifications of chitosan that would increase its amount in the blend to 30% and more would produce sorbents with higher sorption capacity than pure chitosan.
FTIR spectra determined the formation of carbamate which is a reversible way of absorbing carbon dioxide. For all chitosan samples the sorption was reversible, and CO2 can be easily released at ambient temperatures and atmospheric pressure.
Pure chitin was subjected to a continuous carbon dioxide flow in order to perform carbon sorption studies, and changes in the chitin's infrared spectrum were recorded. Nevertheless, these spectra showed minimal CO2 sorption. Chitin is a long-chain polymer that has the ability to hydrolyze into smaller oligomers, potentially boosting the number of carbon sorption reaction sites, according to published research.
Hydrolysis is a procedure that involves the addition of water to break chemical bonds, lowering the molecular weight of the polymer, and dividing it into fractions. chitin was subjected to an acid hydrolysis reaction in which the long chain polymer fractured into smaller oligomers and samples of hydrolysis and separation products collected at various temperatures and times were evaluated using MALDI; the findings are shown in Figure 8. The monomer, dimer, and trimer concentrations are higher in most of the samples. A longer chain polymer of chitin was present in only 20% of the samples that were heated to 30 degrees Celsius for three hours and to 50 degrees Celsius for one hour. Additionally, the synthesis of carbamate, a reversible method of carbon dioxide absorptionwas identified by FTIR spectra. Using more sophisticated instruments like IGA/MS, CO2 may be readily released at room temperature, and the sorption was reversible for all samples.
Different types of shell waste from the Delmarva Peninsula were explored as prospective sources of chitin in this study. It was shown that shrimp, crab, and horseshoe shells offer the best source of chitin on the bases of ease of processing, purity, and yield. Furthermore, Shrimp shell had a greater and very promising chitin yield across all treatments, which makes it the highest potential source of chitin. Therefore, this research is crucial to the development of reusable, reversible, and environmentally acceptable sorbents for efficient carbon sequestration.
Author Contributions
Preeti Sharma: Major researcher, performed experiments and wrote original draft; Victoria V. Volkis: Principle investigator, review, editing and supervision; Benjamin Barnes: Undergrad research assistant, Methodology helped in data collection; Raekayla Johnson: Undergrad research assistant, Methodology helped in data collection. All authors have read and agreed to the published version of the manuscript.
Funding
Title III Program at the University of Maryland Eastern Shore supported this work. BB would like to thank US EPA for scholarship during the project performance. RJ would like to thank UMES LSAMP program for support.
Acknowledgments
The authors would like to thank Dr. Isloor’ s ( NITK, India) group for manufacturing all polymer blends and chemically modifying chitosan samples, provided as a courtesy for our research project. Preeti Sharma would like to thank Department of Natural Sciences at the University of Maryland Eastern Shore for supporting this study.
Conflicts of Interest
The authors declare no conflicts of interest.
References
- Dhanabalan, V.; Xavier, K. A. M.; Eppen, S.; Joy, A.; Balange, A.; Asha, K. K.; Murthy, L. N.; Nayak, B. B. Characterization of Chitin Extracted from Enzymatically Deproteinized Acetes Shell Residue with Varying Degree of Hydrolysis. Carbohydr. Polym. 2021, 253, 117203. [Google Scholar] [CrossRef] [PubMed]
- Dayakar, B.; Xavier, K. A. M.; Das, O.; Porayil, L.; Balange, A. K.; Nayak, B. B. Application of Extreme Halophilic Archaea as Biocatalyst for Chitin Isolation from Shrimp Shell Waste. Carbohydr. Polym. 2021, 2, 100093. [Google Scholar] [CrossRef]
- Rasweefali, M. , Sabu, S., Sunooj, K., Sasidharan, A., & Xavier, K. M. Consequences of chemical deacetylation on physicochemical, structural and functional characteristics of chitosan extracted from deep-sea mud shrimp. Carbohydr Polym. 2021, 2, 2–100032. [Google Scholar] [CrossRef]
- Silva, N. C. M.; De Sá, L. F. R.; Oliveira, E. A. G.; Costa, M. N.; Ferreira, A. T. S.; Perales, J.; Fernandes, K. V. S.; Xavier-Filho, J.; Oliveira, A. E. A. Albizia Lebbeck Seed Coat Proteins Bind to Chitin and Act as a Defense against Cowpea Weevil Callosobruchus Maculatus. J. Agric. Food Chem. 2016, 64, 3514–3522. [Google Scholar] [CrossRef]
- Maliki, S.; Sharma, G.; Kumar, A.; Moral-Zamorano, M.; Moradi, O.; Baselga, J.; Stadler, F.J.; García-Peñas, A. Chitosan as a Tool for Sustainable Development: A Mini Review. Polymers 2022, 141475. [Google Scholar] [CrossRef]
- Rinaudo, M. Chitin and Chitosan: Properties and Applications. Prog. Polym. Sci. 2006, 31, 603–632. [Google Scholar] [CrossRef]
- Mukhtar Ahmed, K. B.; Khan, M. M. A.; Siddiqui, H.; Jahan, A. Chitosan and Its Oligosaccharides, a Promising Option for Sustainable Crop Production- a Review. Carbohydr. Polym. 2020, 227, 115331. [Google Scholar] [CrossRef]
- Hammi, N.; Chen, S.; Dumeignil, F.; Royer, S.; El Kadib, A. Chitosan as a Sustainable Precursor for Nitrogen-Containing Carbon Nanomaterials: Synthesis and Uses. Materials Today Sustainability 2020, 10, 100053. [Google Scholar] [CrossRef]
- Özel, N.; Elibol, M. A Review on the Potential Uses of Deep Eutectic Solvents in Chitin and Chitosan Related Processes. Carbohydr. Polym. 2021, 262, 117942. [Google Scholar] [CrossRef]
- Pillai, C. K. S.; Paul, W.; Sharma, C. P. Chitin and Chitosan Polymers: Chemistry, Solubility and Fiber Formation. Prog. Polym. Sci. 2009, 34, 641–678. [Google Scholar] [CrossRef]
- Sun, Y.; Qing, M.; Chen, L.; Liu, J.; Zhong, F.; Jiang, P.; Wang, G.; Zhuang, L. Chitosan Dissolution with Sulfopropyl Imidazolium Brönsted Acidic Ionic Liquids. J. Mol. Liq. 2019, 293, 111533. [Google Scholar] [CrossRef]
- Zhong, Y.; Cai, J.; Zhang, L.-N. A Review of Chitin Solvents and Their Dissolution Mechanisms. Chin. J. Polym. Sci. 2020, 38, 1047–1060. [Google Scholar] [CrossRef]
- Kumar, S.; Mukherjee, A.; Dutta, J. Chitosan Based Nanocomposite Films and Coatings: Emerging Antimicrobial Food Packaging Alternatives. Trends Food Sci. Technol. 2020, 97, 196–209. [Google Scholar] [CrossRef]
- Perinelli, D. R.; Fagioli, L.; Campana, R.; Lam, J. K. W.; Baffone, W.; Palmieri, G. F.; Casettari, L.; Bonacucina, G. Chitosan-Based Nanosystems and Their Exploited Antimicrobial Activity. Eur. J. Pharm. Sci. 2018, 117, 8–20. [Google Scholar] [CrossRef] [PubMed]
- Silberbauer, A.; Schmid, M. Packaging Concepts for Ready-to-Eat Food: Recent Progress. J. Packag. Technol. Res. 2017, 1, 113–126. [Google Scholar] [CrossRef]
- Bottoms, R.R. , 1930. Process for Separating Acidic Gases. United States patent application. United States Patent US178 3901A.
- Robinson, K.; McCluskey, A.; Attalla, M. I. An ATR-FTIR Study on the Effect of Molecular Structural Variations on the CO2 Absorption Characteristics of Heterocyclic Amines, Part II. Chemphyschem 2012, 13, 2331–2341. [Google Scholar] [CrossRef]
- Gielen, D., Podkanski, J., & Unander, F. International Energy Agency. Prospects for CO2 Capture and Storage; Organization for Economic Co-operation and Development (OECD): Paris Cedex, France, 2004.
- Blomen, E.; Hendriks, C.; Neele, F. Capture Technologies: Improvements and Promising Developments. Energy Procedia 2009, 1, 1505–1512. [Google Scholar] [CrossRef]
- Foungchuen, J.; Pairin, N.; Phalakornkule, C. Impregnation of Chitosan onto Activated Carbon for Adsorption Selectivity towards CO2: Biohydrogen Purification. KMUTNB 2016, 1–13. [Google Scholar] [CrossRef]
- Keramati, M.; Ghoreyshi, A. A. Improving CO2 Adsorption onto Activated Carbon through Functionalization by Chitosan and Triethylenetetramine. Physica E Low Dimens. Syst. Nanostruct. 2014, 57, 161–168. [Google Scholar] [CrossRef]
- Gao, Y.; Chen, X.; Zhang, J.; Yan, N. Chitin-Derived Mesoporous, Nitrogen-Containing Carbon for Heavy-Metal Removal and Styrene Epoxidation. ChemPlusChem 2015, 80, 1556–1564. [Google Scholar] [CrossRef] [PubMed]
- Pohako-Esko, K.; Bahlmann, M.; Schulz, P. S.; Wasserscheid, P. Chitosan Containing Supported Ionic Liquid Phase Materials for CO2 Absorption. Ind. Eng. Chem. Res. 2016, 55, 7052–7059. [Google Scholar] [CrossRef]
- Jing Wen, Yuhong Li, Li Wang, Xiunan Chen, Qi Cao, Naipu He. Carbon Dioxide Smart Materials Based on Chitosan. Progr. in Chem., 2020, 32, 417–422. [Google Scholar] [CrossRef]
- Lopes, M.; Cecílio, A.; Zanatta, M.; Corvo, M. C. From Biopolymer Dissolution to CO2 Capture under Atmospheric Pressure - A Molecular View on biopolymer@Ionic Liquid Materials. J. Clean. Prod. 2022, 367, 132977. [Google Scholar] [CrossRef]
- Paiva, T.; Echeverria, C.; Godinho, M. H.; Almeida, P. L.; Corvo, M. C. On the Influence of Imidazolium Ionic Liquids on Cellulose Derived Polymers. Eur. Polym. J. 2019, 114, 353–360. [Google Scholar] [CrossRef]
- Trivedi, T. J.; Rao, K. S.; Kumar, A. Facile Preparation of Agarose–Chitosan Hybrid Materials and Nanocomposite Ionogels Using an Ionic Liquid via Dissolution, Regeneration and Sol–Gel Transition. Green Chem. 2014, 16, 320–330. [Google Scholar] [CrossRef]
- Yang, X.; Qiao, C.; Li, Y.; Li, T. Dissolution and Resourcfulization of Biopolymers in Ionic Liquids. React. Funct. Polym. 2016, 100, 181–190. [Google Scholar] [CrossRef]
- Mallakpour, S.; Dinari, M. Ionic Liquids as Green Solvents: Progress and Prospects. In Green Solvents II; Springer Netherlands: Dordrecht, 2012. [Google Scholar]
- Feng, J.; Zang, H.; Yan, Q.; Li, M.; Jiang, X.; Cheng, B. Dissolution and Utilization of Chitosan in a 1-carboxymethyl-3-methylimidazolium Hydrochloride Ionic Salt Aqueous Solution. J. Appl. Polym. Sci. 2015, 132. [Google Scholar] [CrossRef]
- Ferreira, I. C.; Araújo, D.; Voisin, P.; Alves, V. D.; Rosatella, A. A.; Afonso, C. A. M.; Freitas, F.; Neves, L. A. Chitin-Glucan Complex – Based Biopolymeric Structures Using Biocompatible Ionic Liquids. Carbohydr. Polym. 2020, 247, 116679. [Google Scholar] [CrossRef]
- Li, L.; Yuan, B.; Liu, S.-W.; Yu, S.-T.; Xie, C.-X.; Liu, F.-S.; Shan, L.-J. Clean Preparation Process of Chitosan Oligomers in Gly Series Ionic Liquids Homogeneous System. J Polym Environ 2012, 20, 388–394. [Google Scholar] [CrossRef]
- Liu, D.; Chen, Q.; Li, M.; Lou, B.; Yu, R.; Li, Z.; Zhang, Y. Influence of Carboxyl Anion on the Dissolution of Chitosan in Cholinium-Based Ionic Liquids. AIP Conf. Proc. 2018, 1971, 050015. [Google Scholar] [CrossRef]
- Shamshina, J. L. Chitin in Ionic Liquids: Historical Insights into the Polymer’s Dissolution and Isolation. A Review. Green Chem. 2019, 21, 3974–3993. [Google Scholar] [CrossRef]
- Eftaiha, A. F.; Alsoubani, F.; Assaf, K. I.; Troll, C.; Rieger, B.; Khaled, A. H.; Qaroush, A. K. An Investigation of Carbon Dioxide Capture by Chitin Acetate/DMSO Binary System. Carbohydr. Polym. 2016, 152, 163–169. [Google Scholar] [CrossRef] [PubMed]
- Osman, A. I.; Hefny, M.; Abdel Maksoud, M. I. A.; Elgarahy, A. M.; Rooney, D. W. Recent Advances in Carbon Capture Storage and Utilisation Technologies: A Review. Environ. Chem. Lett. 2021, 19, 797–849. [Google Scholar] [CrossRef]
- Elfving, J.; Kauppinen, J.; Jegoroff, M.; Ruuskanen, V.; Järvinen, L.; Sainio, T. Experimental Comparison of Regeneration Methods for CO2 Concentration from Air Using Amine-Based Adsorbent. Chem. Eng. J. 2021, 404, 126337. [Google Scholar] [CrossRef]
- Smit, B.; Reimer, J. A.; Oldenburg, C. M. Introduction to Carbon Capture and Sequestration; Imperial College Press: London, England, 2014. [Google Scholar]
- Volkis, V.; Kumar, R.; Isloor, A.; Jiru, F. Biocompatible Polymeric Blends for the Reversible Capturing of Carbon Dioxide. Polymer Preprints 2012. [Google Scholar]
- Suginta, W.; Khunkaewla, P.; Schulte, A. Electrochemical Biosensor Applications of Polysaccharides Chitin and Chitosan. Chem. Rev. 2013, 113, 5458–5479. [Google Scholar] [CrossRef]
- Jayakumar, R.; Menon, D.; Manzoor, K.; Nair, S. V.; Tamura, H. Biomedical Applications of Chitin and Chitosan Based Nanomaterials—A Short Review. Carbohydr. Polym. 2010, 82, 227–232. [Google Scholar] [CrossRef]
- Hammi, N.; Chen, S.; Dumeignil, F.; Royer, S.; El Kadib, A. Chitosan as a Sustainable Precursor for Nitrogen-Containing Carbon Nanomaterials: Synthesis and Uses. Materials Today Sustainability 2020, 10, 100053. [Google Scholar] [CrossRef]
- Dutta, K.; Dutta, J.; Tripathi, S. Chitin and chitosan: Chemistry, Properties and Applications. J. Sci. Ind. Res. 2004, 63, 20–31. [Google Scholar]
- Padaki, M.; Isloor, A. M.; Wanichapichart, P. Polysulfone/N-Phthaloylchitosan Novel Composite Membranes for Salt Rejection Application. Desalination 2011, 279, (1–3). [Google Scholar] [CrossRef]
- Bashir, S.; Teo, Y. Y.; Ramesh, S.; Ramesh, K.; Khan, A. A. N-Succinyl Chitosan Preparation, Characterization, Properties and Biomedical Applications: A State of the Art Review. Rev. Chem. Eng. 2015, 31. [Google Scholar] [CrossRef]
- Kumar, R.; Isloor, A. M.; Ismail, A. F.; Matsuura, T. Performance Improvement of Polysulfone Ultrafiltration Membrane Using N-Succinyl Chitosan as Additive. Desalination 2013, 318, 1–8. [Google Scholar] [CrossRef]
- Kumar, R.; Isloor, A. M.; Ismail, A. F.; Matsuura, T. Synthesis and Characterization of Novel Water Soluble Derivative of Chitosan as an Additive for Polysulfone Ultrafiltration Membrane. J. Memb. Sci. 2013, 440, 140–147. [Google Scholar] [CrossRef]
- Shiflett, M. B.; Corbin, D. R.; Yokozeki, A. Comparison of the Sorption of Trifluoromethane (R-23) on Zeolites and in an Ionic Liquid. Adsorp. Sci. Technol. 2013, 31, 59–83. [Google Scholar] [CrossRef]
- Fletcher, A. J.; Benham, M. J.; Thomas, K. M. Multicomponent Vapor Sorption on Active Carbon by Combined Microgravimetry and Dynamic Sampling Mass Spectrometry. J. Phys. Chem. B 2002, 106, 7474–7482. [Google Scholar] [CrossRef]
- Benham, M. J.; Ross, D. K. Experimental Determination of Absorption-Desorption Isotherms by Computer-Controlled Gravimetric Analysis. Z. Phys. Chem. (N F) 1989, 163, 25–32. [Google Scholar] [CrossRef]
- Rupley, J. A. The Hydrolysis of Chitin by Concentrated Hydrochloric Acid, and the Preparation of Low-Molecular-Weight Substrates for Lysozyme. Biochim. Biophys. Acta 1964, 83, 245–255. [Google Scholar] [CrossRef]
- Pradip Kumar Dutta. (2016). Chitin and Chitosan for Regenerative Medicine. New Delhi Springer India.
- Weiss, I. M.; Schönitzer, V. The Distribution of Chitin in Larval Shells of the Bivalve Mollusk Mytilus Galloprovincialis. J. Struct. Biol. 2006, 153, 264–277. [Google Scholar] [CrossRef]
- Roberts, G. A. F. Progress on Chemistry and Application of Chitin and Its Derivatives. Polish Chitin Soc 2008, 13, 7–15. [Google Scholar]
- Irani, M., Jacobson. Modified carbon nanotubes/tetraethylenepentamine for CO2 capture. Fuel 2017, 206, 10–18. [Google Scholar] [CrossRef]
- Park, H.; Jung, Y. M.; You, J. K.; Hong, W. H.; Kim, J.-N. Analysis of the CO2 and NH3 Reaction in an Aqueous Solution by 2D IR COS: Formation of Bicarbonate and Carbamate. J. Phys. Chem. A 2008, 112, 6558–6562. [Google Scholar] [CrossRef] [PubMed]
- Epling, W. S.; Peden, C.; Szanyi, J. Carbonate Formation and Stability on a Pt/BaO/γ-Al2O3 NOX Storage/Reduction Catalyst. The J. Phys. Chem. C 2008, 112, 10952–10959. [Google Scholar] [CrossRef]
Figure 1.
Scheme of IGA machine and the example of output.
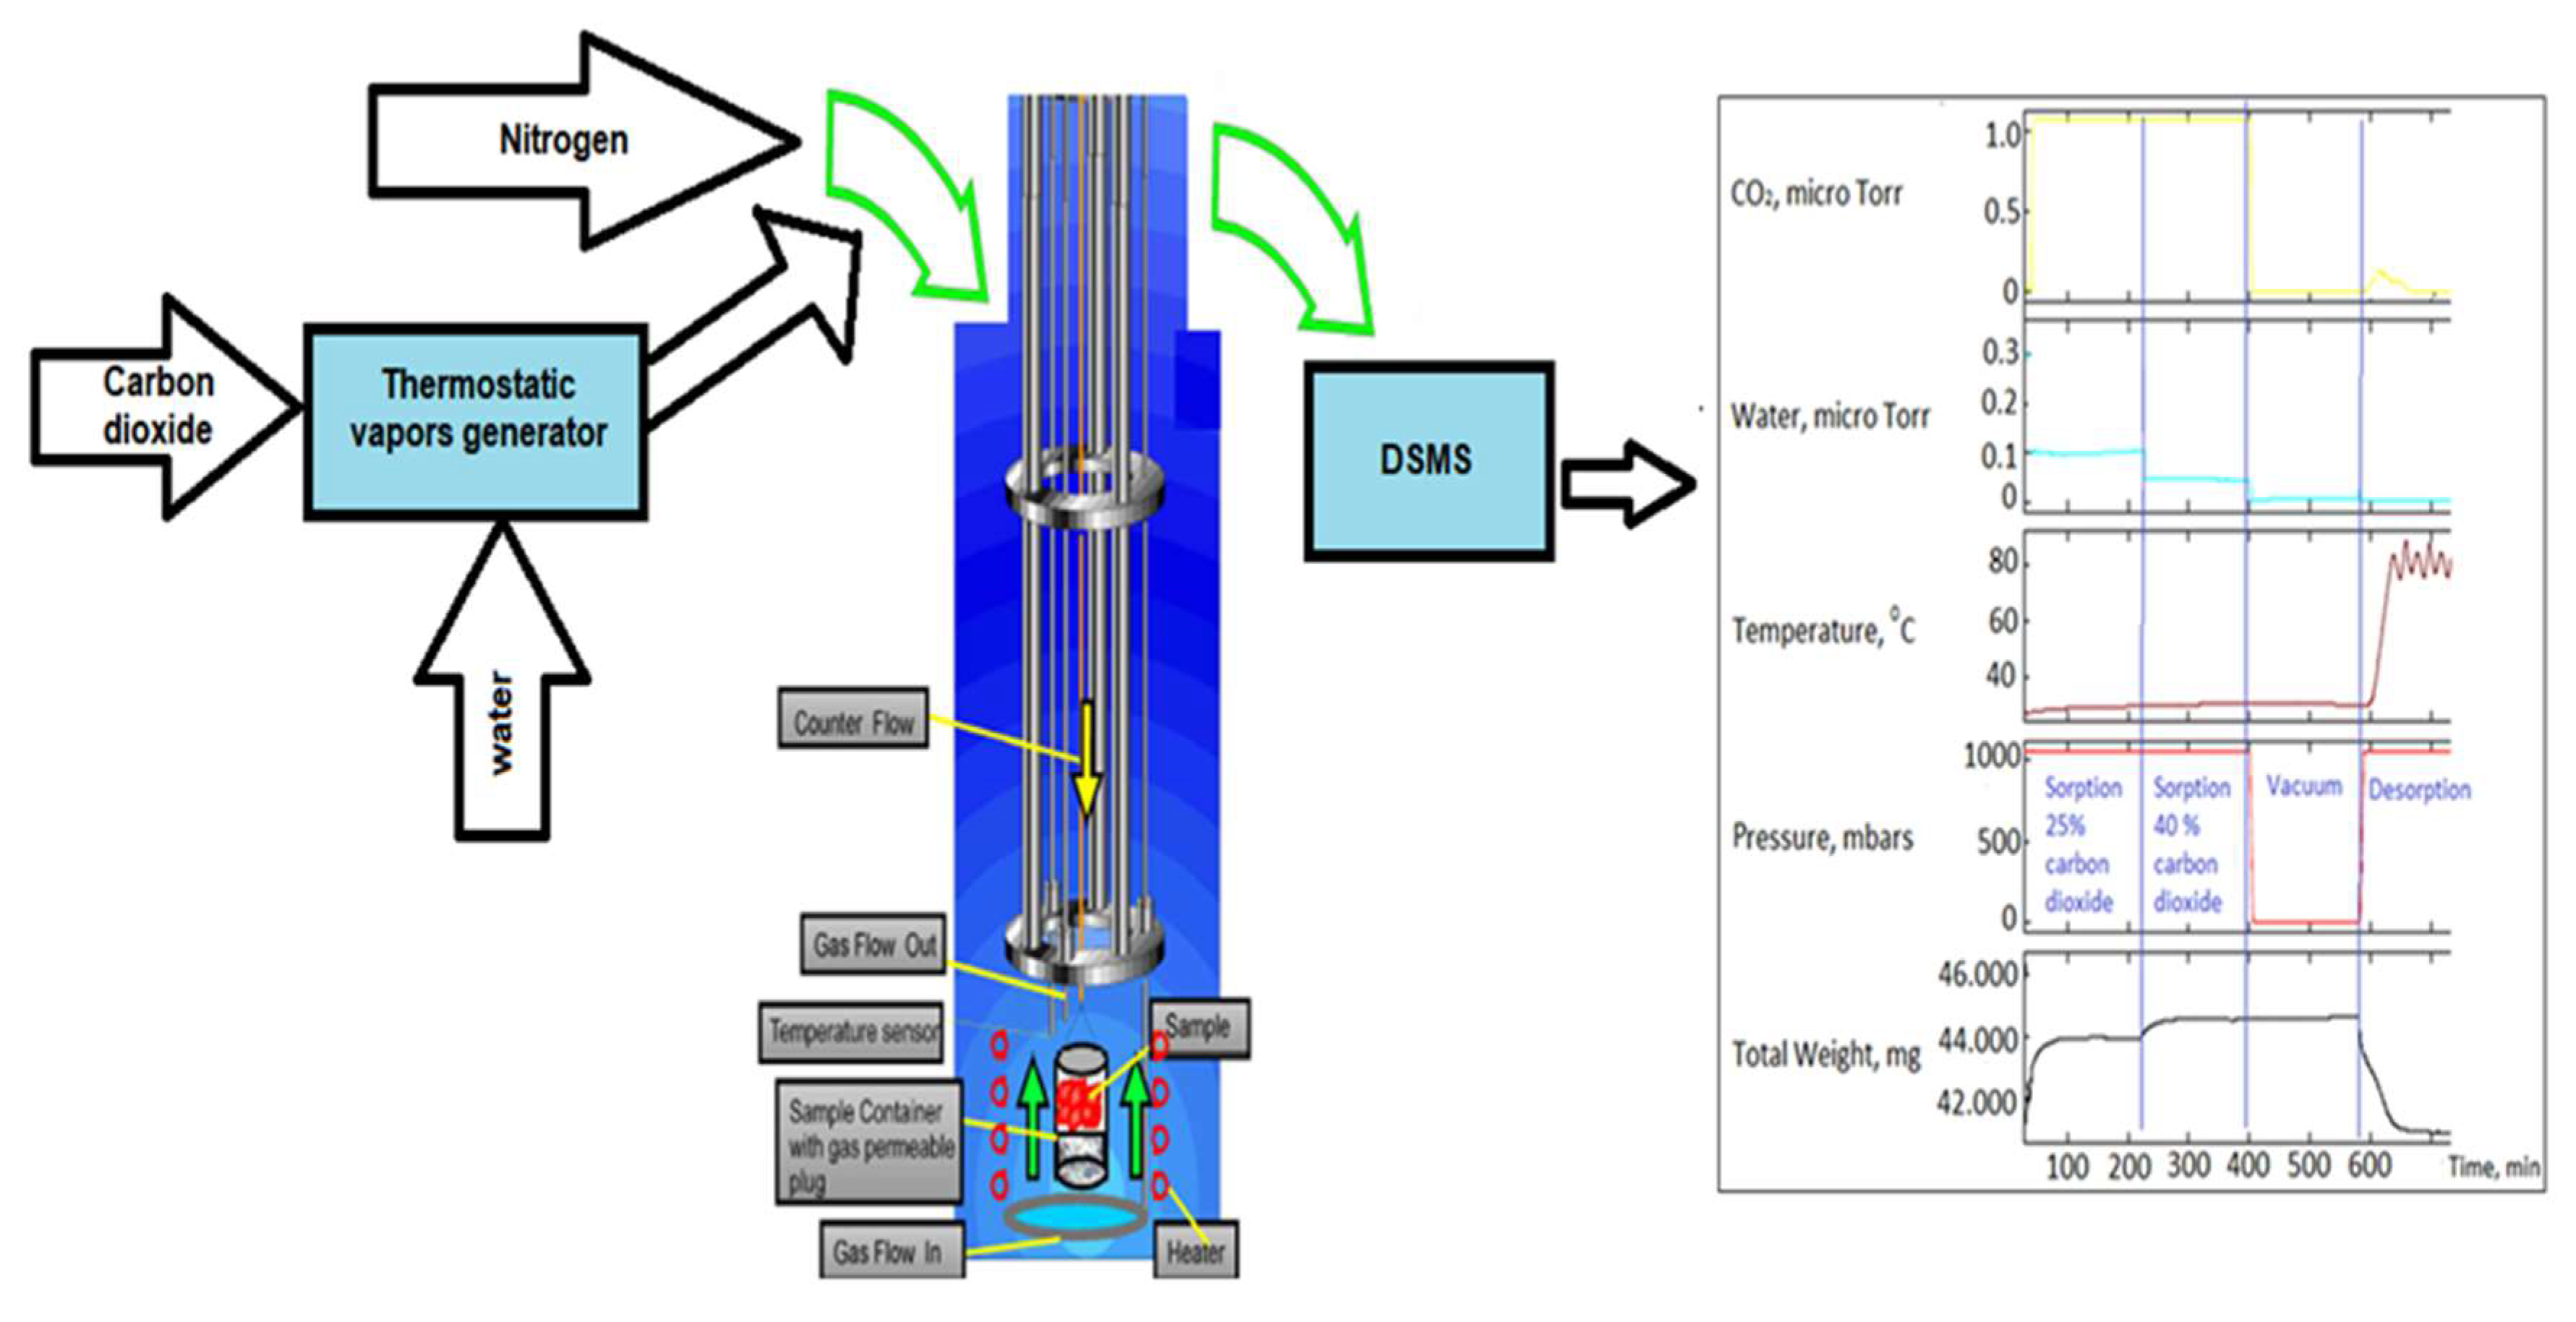
Figure 2.
Charcoal-Celite Column to separate hydrolysis products under pressure.
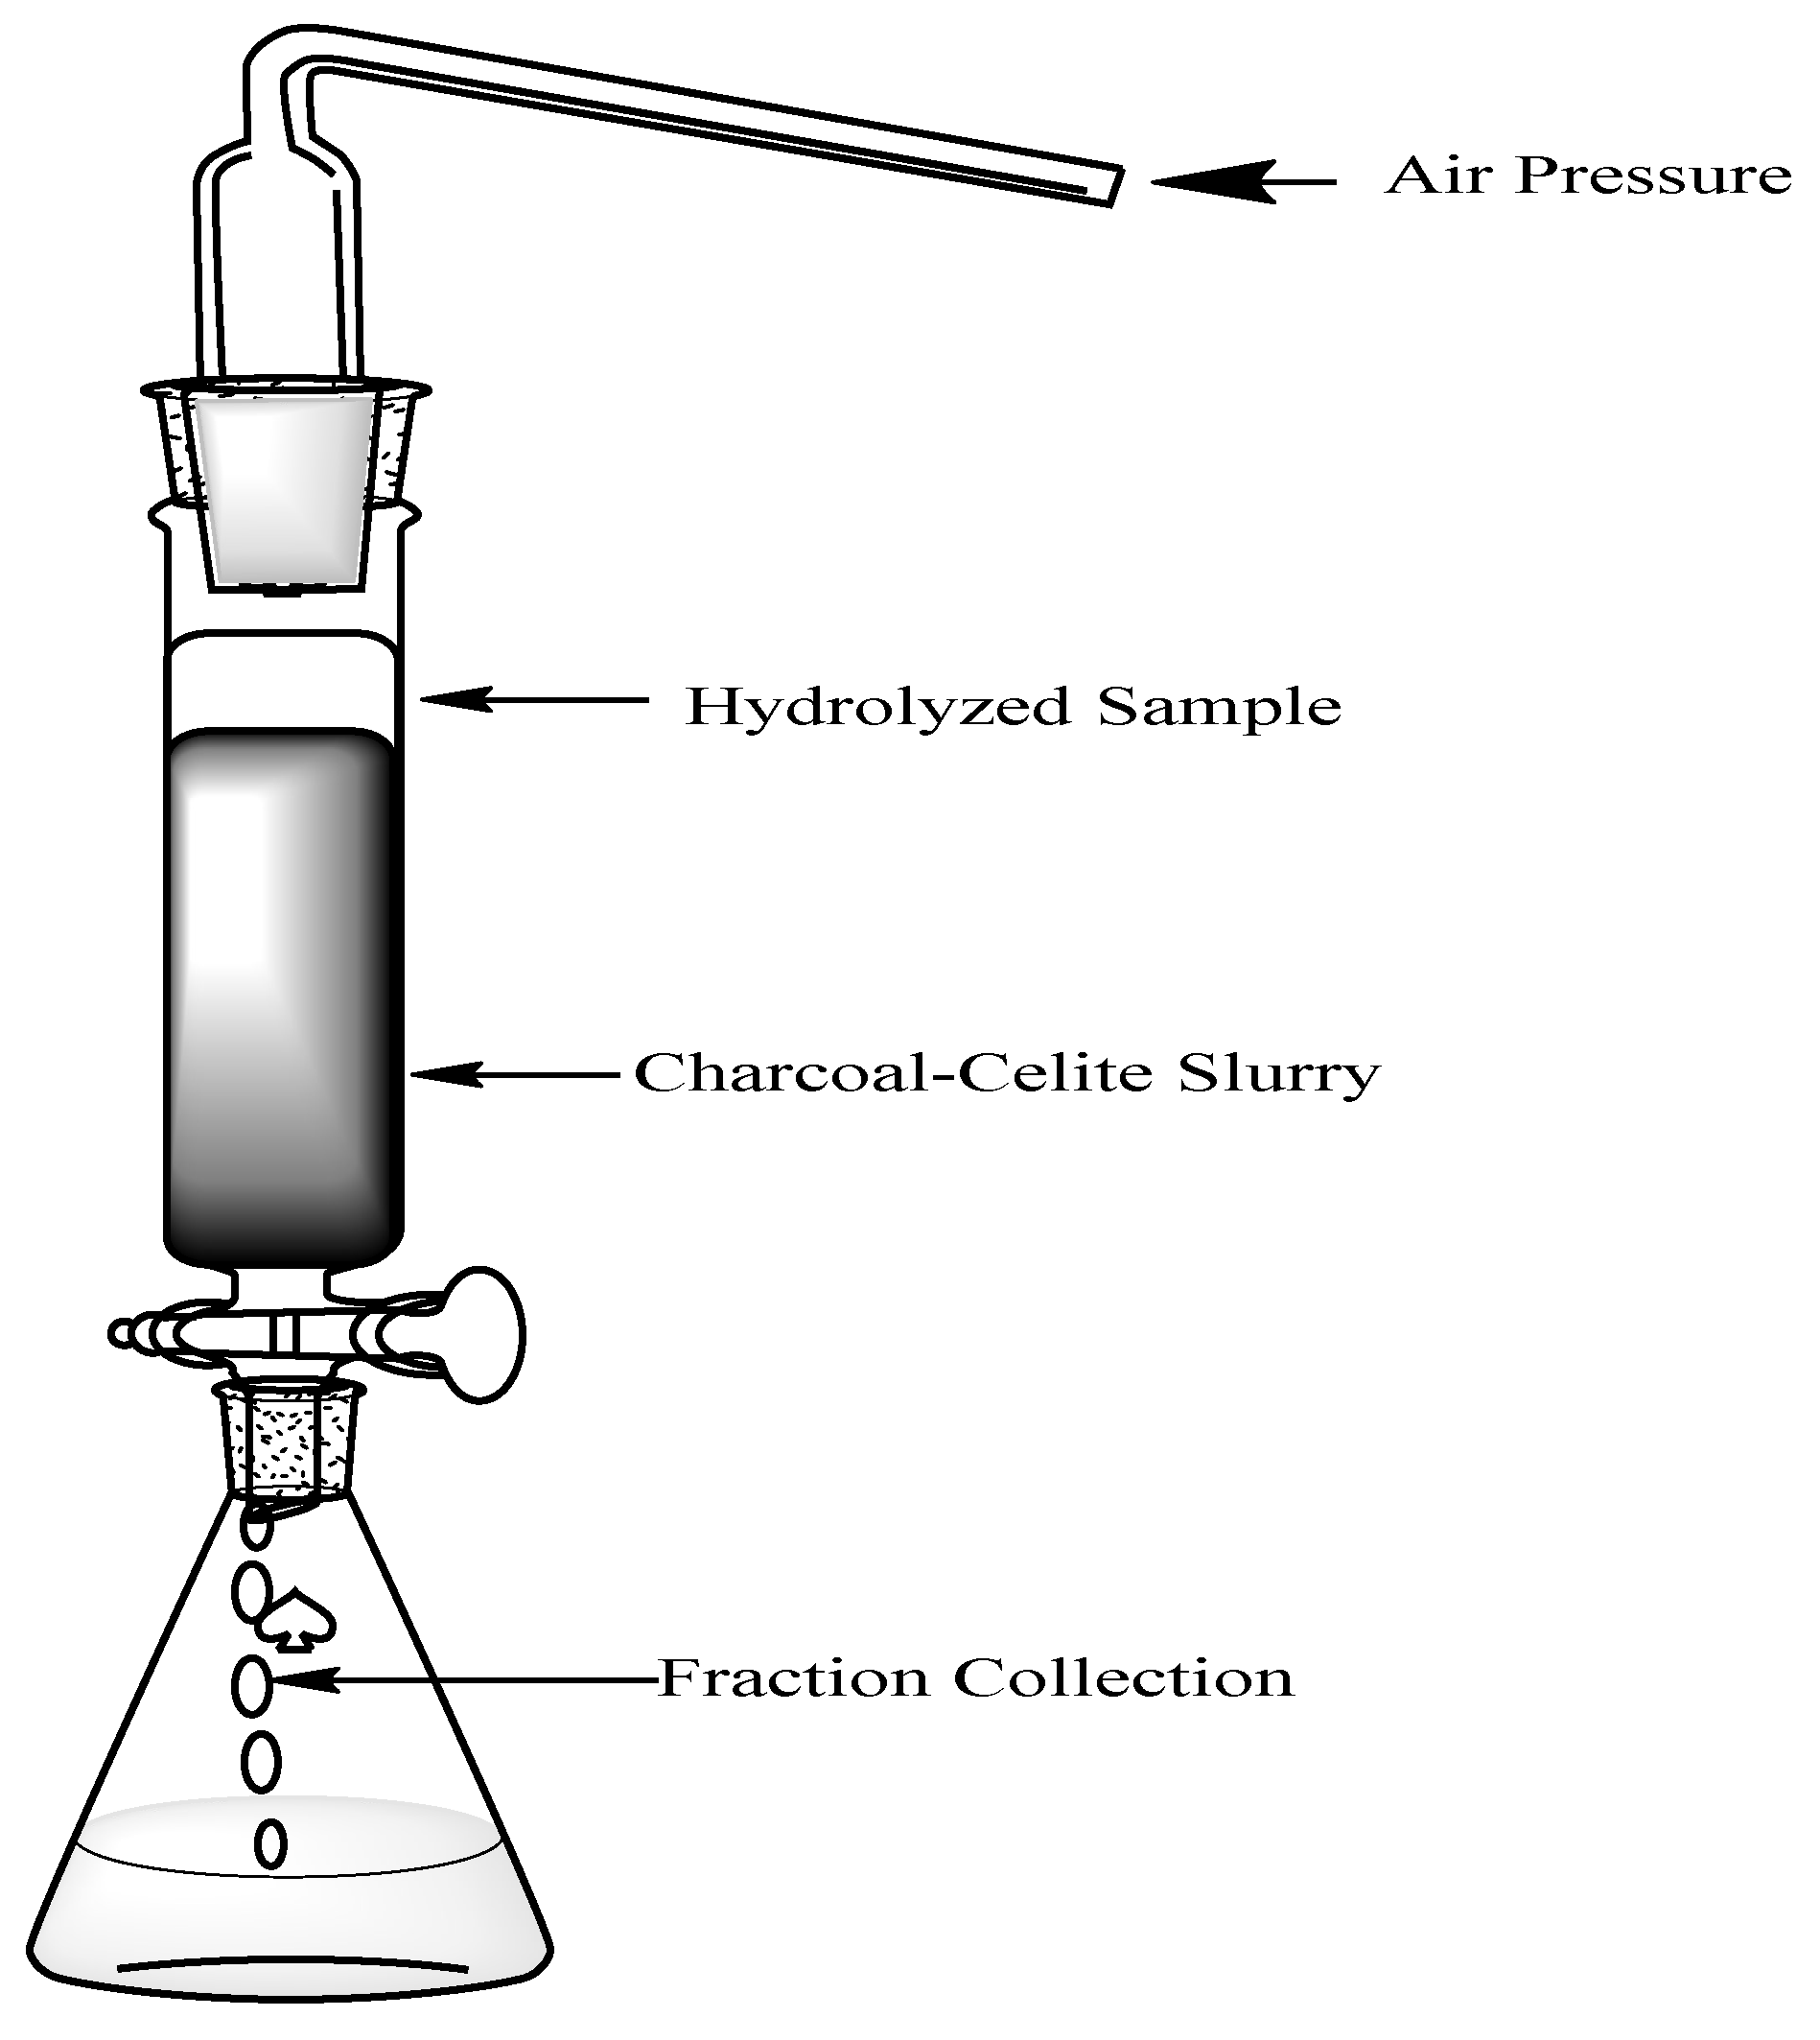
Figure 3.
Apparatus for CO2 sorption.
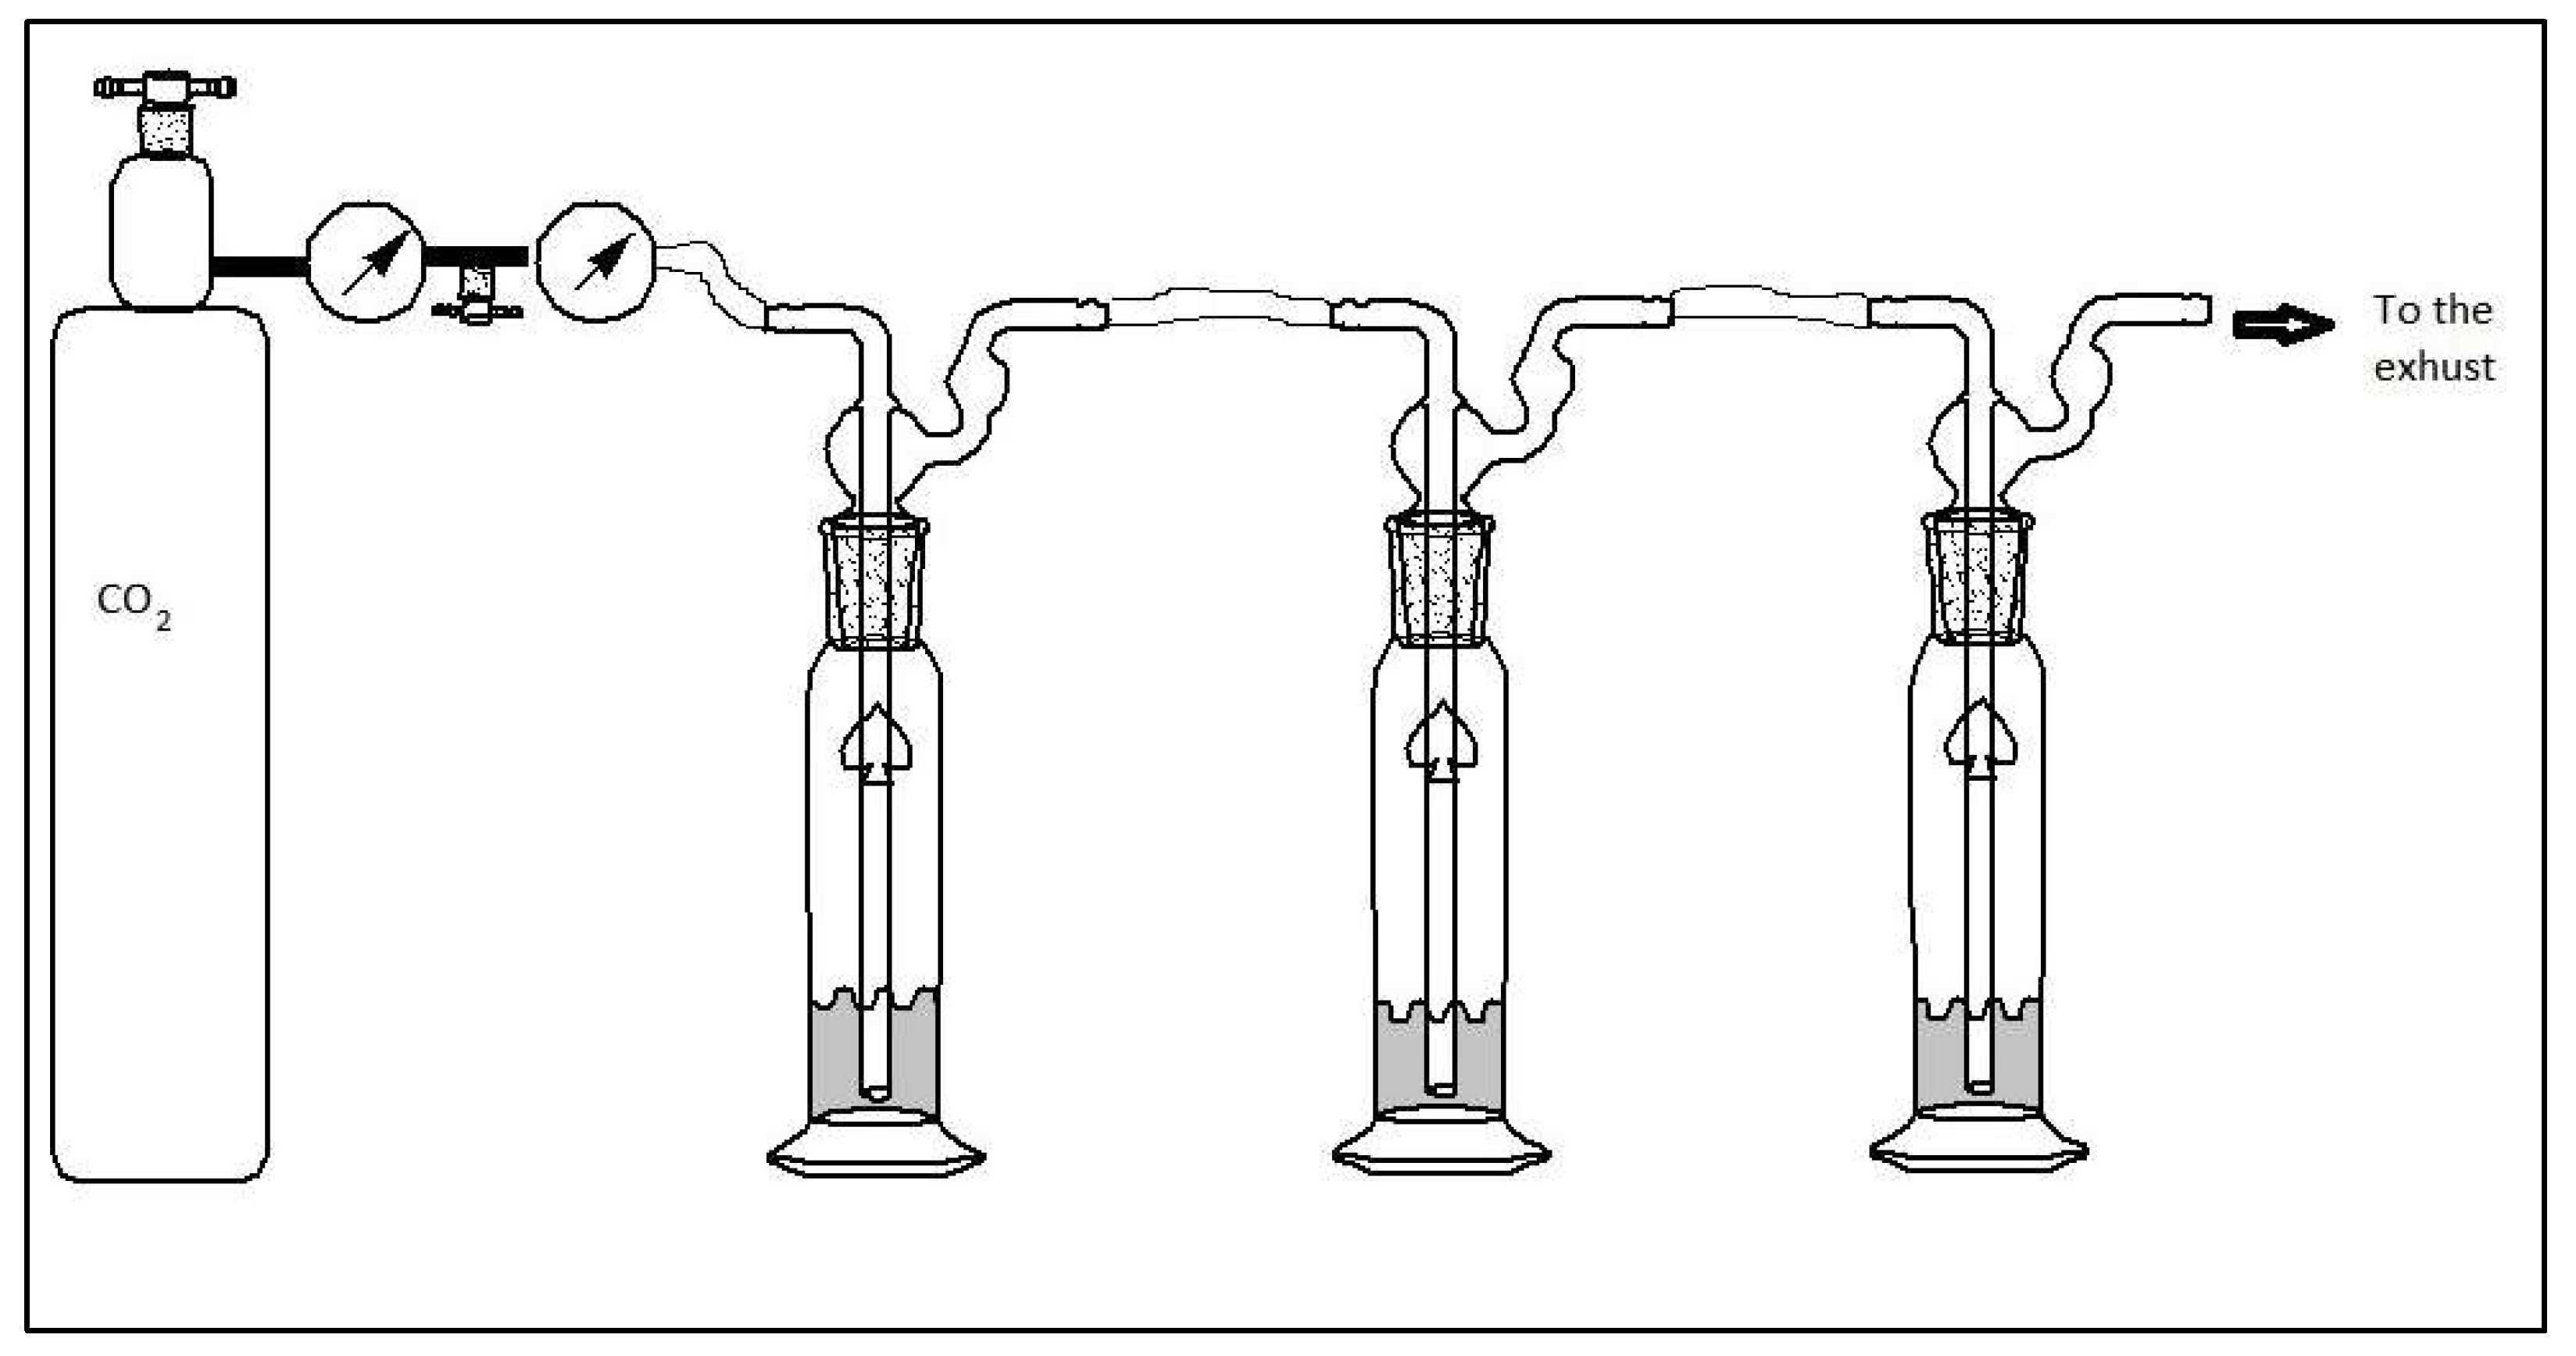
Figure 4.
Chemical modification of Chitosan [44, 46-47].
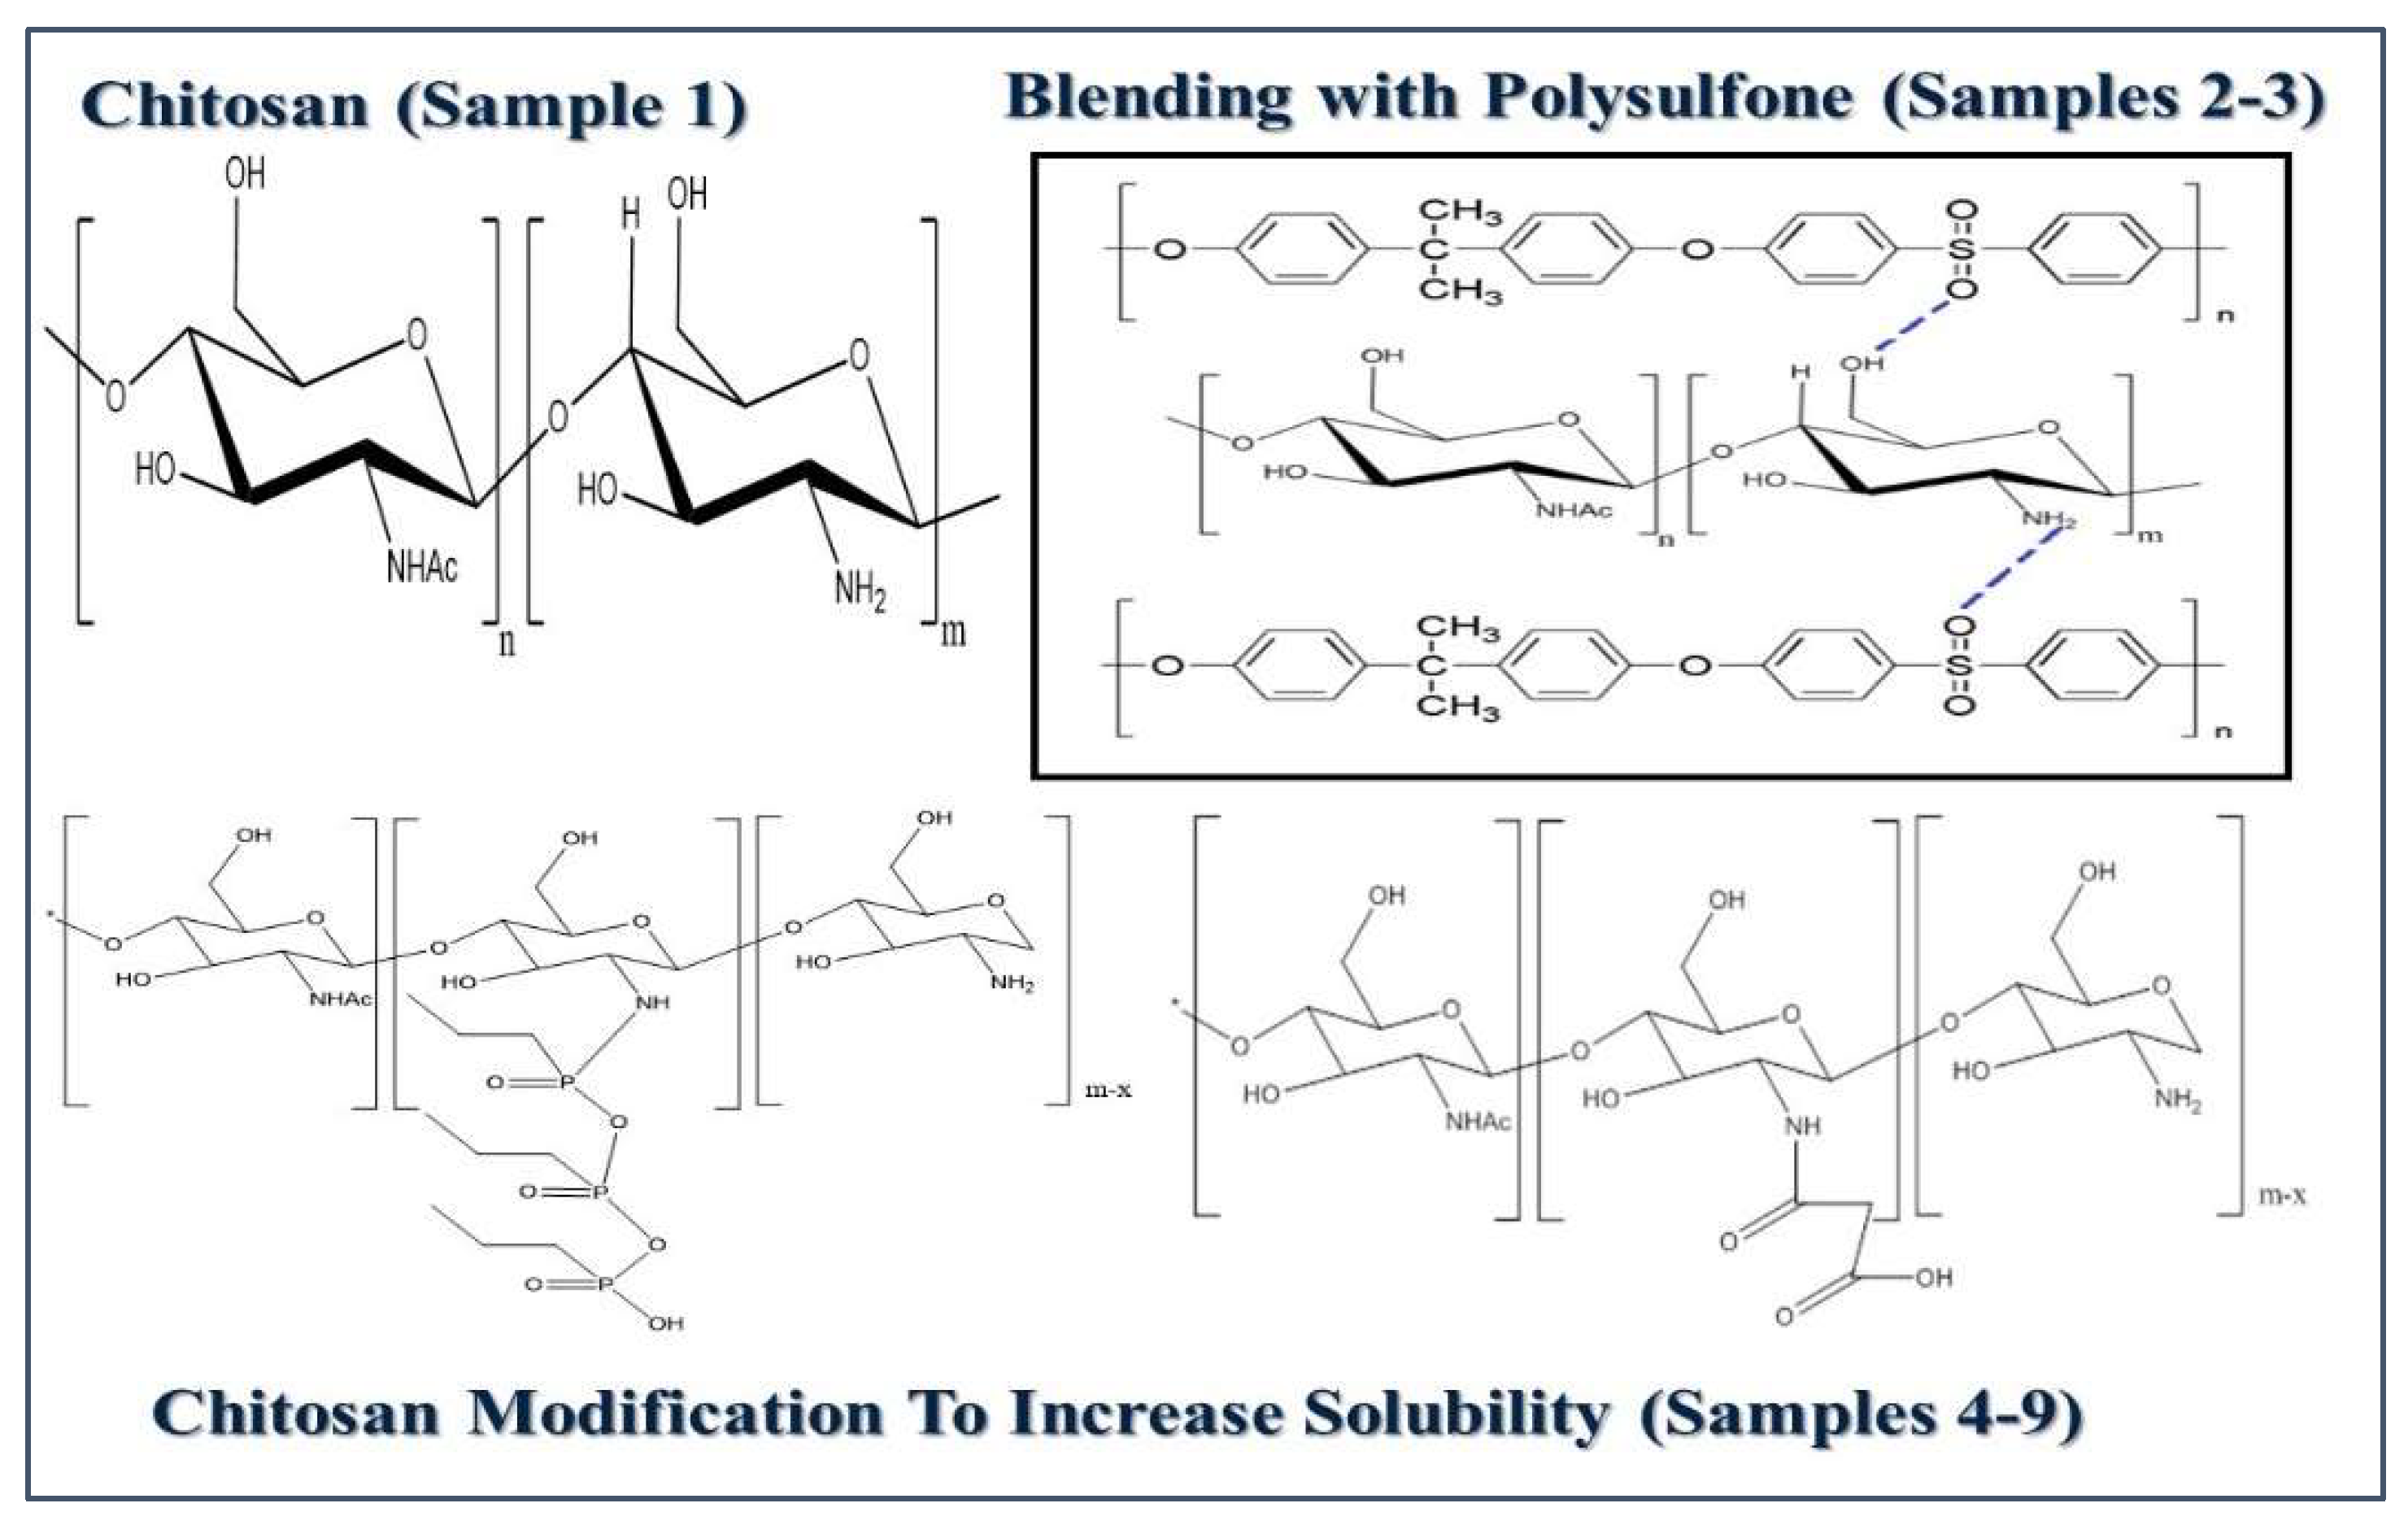
Figure 5.
FTIR of carbamate and bicarbonate products, as shown in literature [56].
Figure 5.
FTIR of carbamate and bicarbonate products, as shown in literature [56].
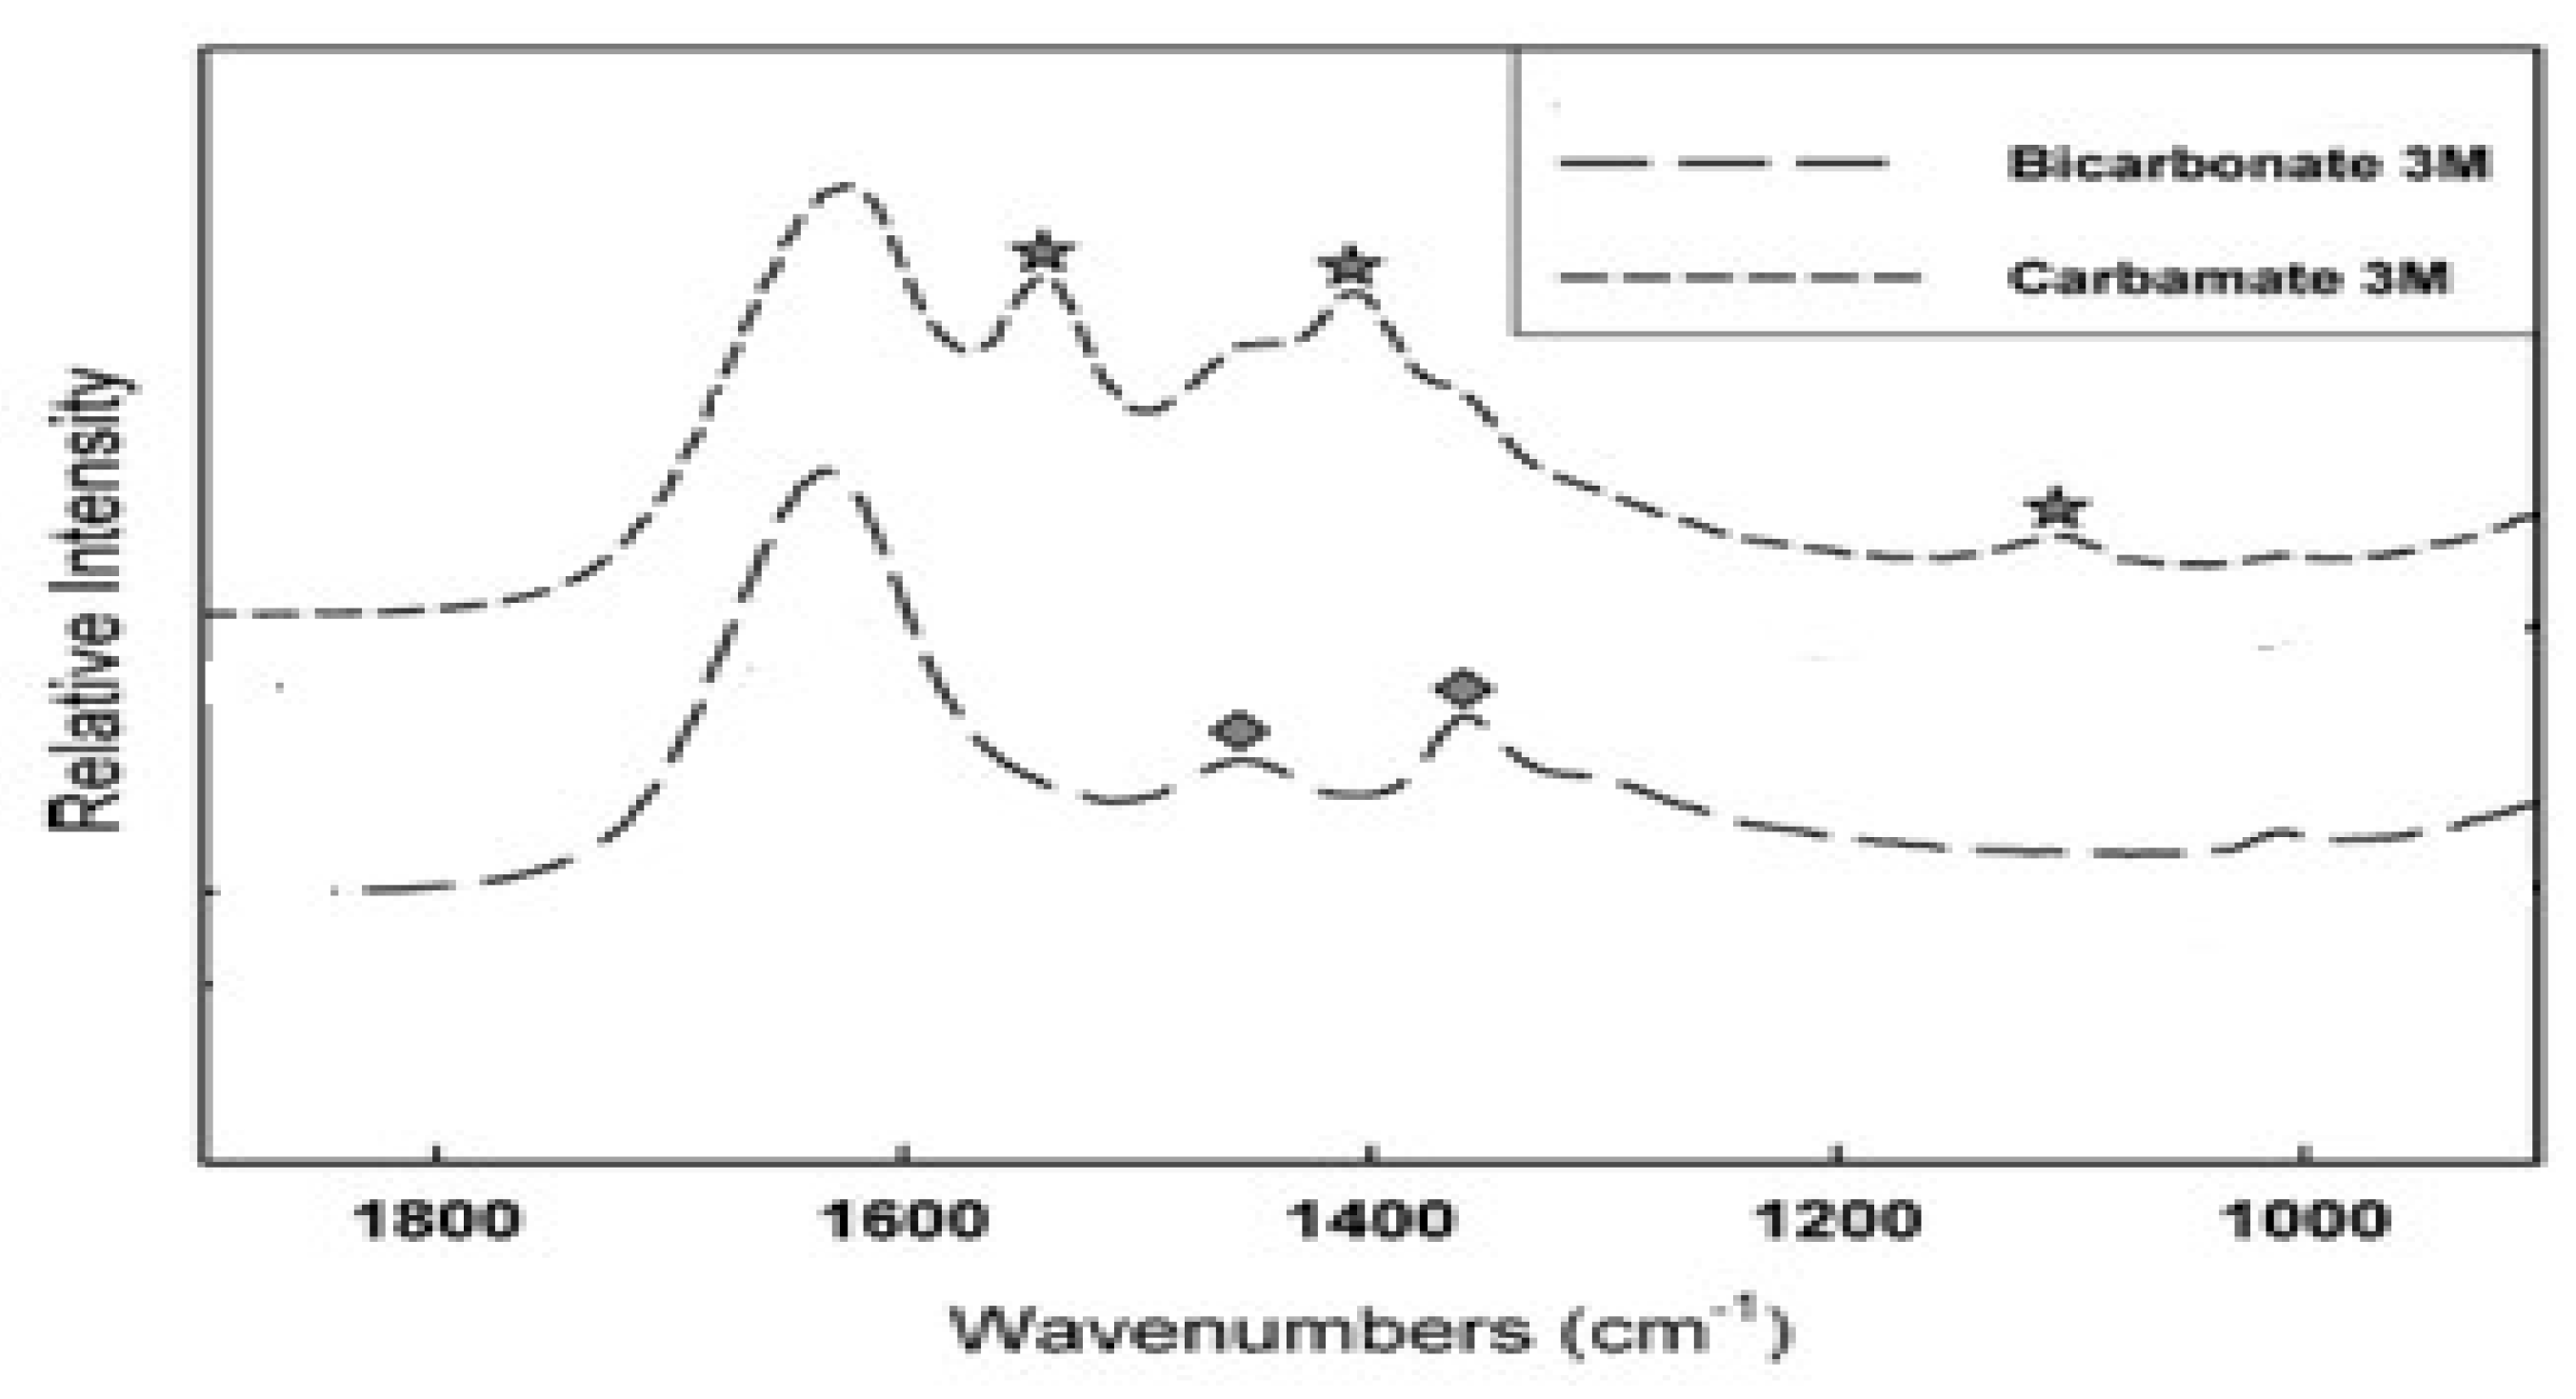
Figure 6.
FTIR of chitosan after CO2 absorption.
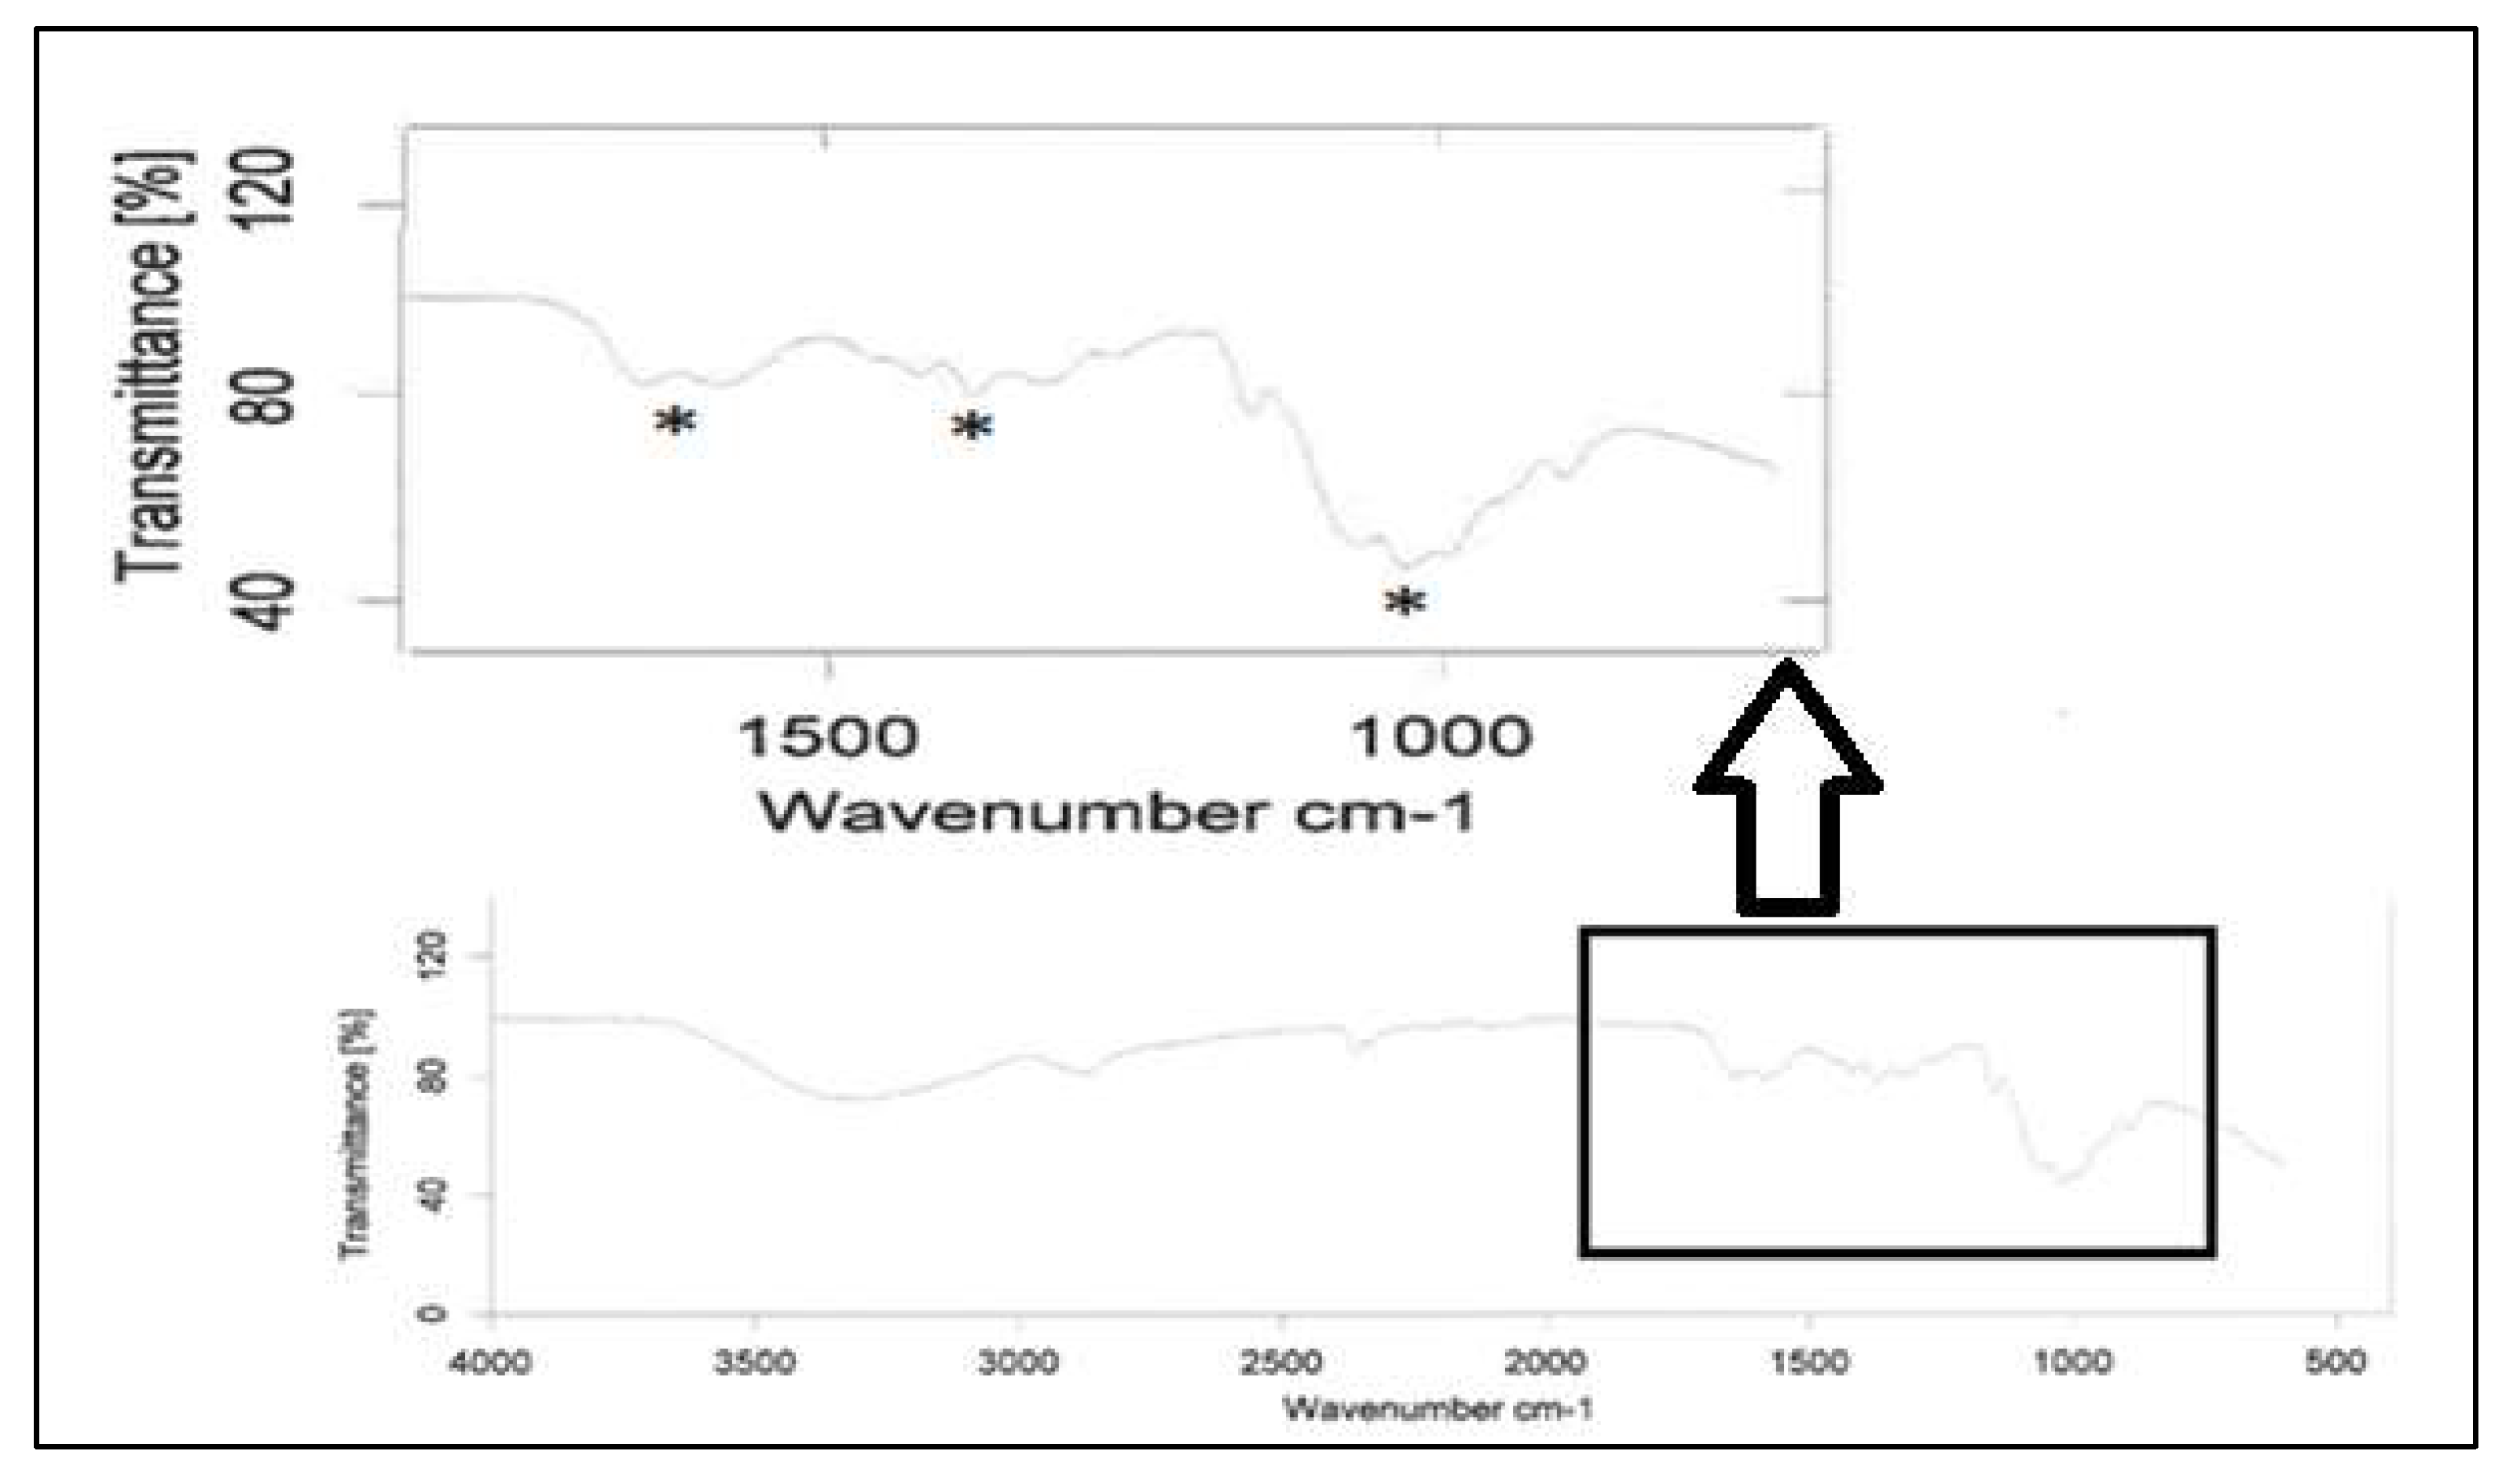
Figure 7.
Chitin exposure to CO2 for (clockwise from top left) 0, 24, 36, 48 and 72 hours.
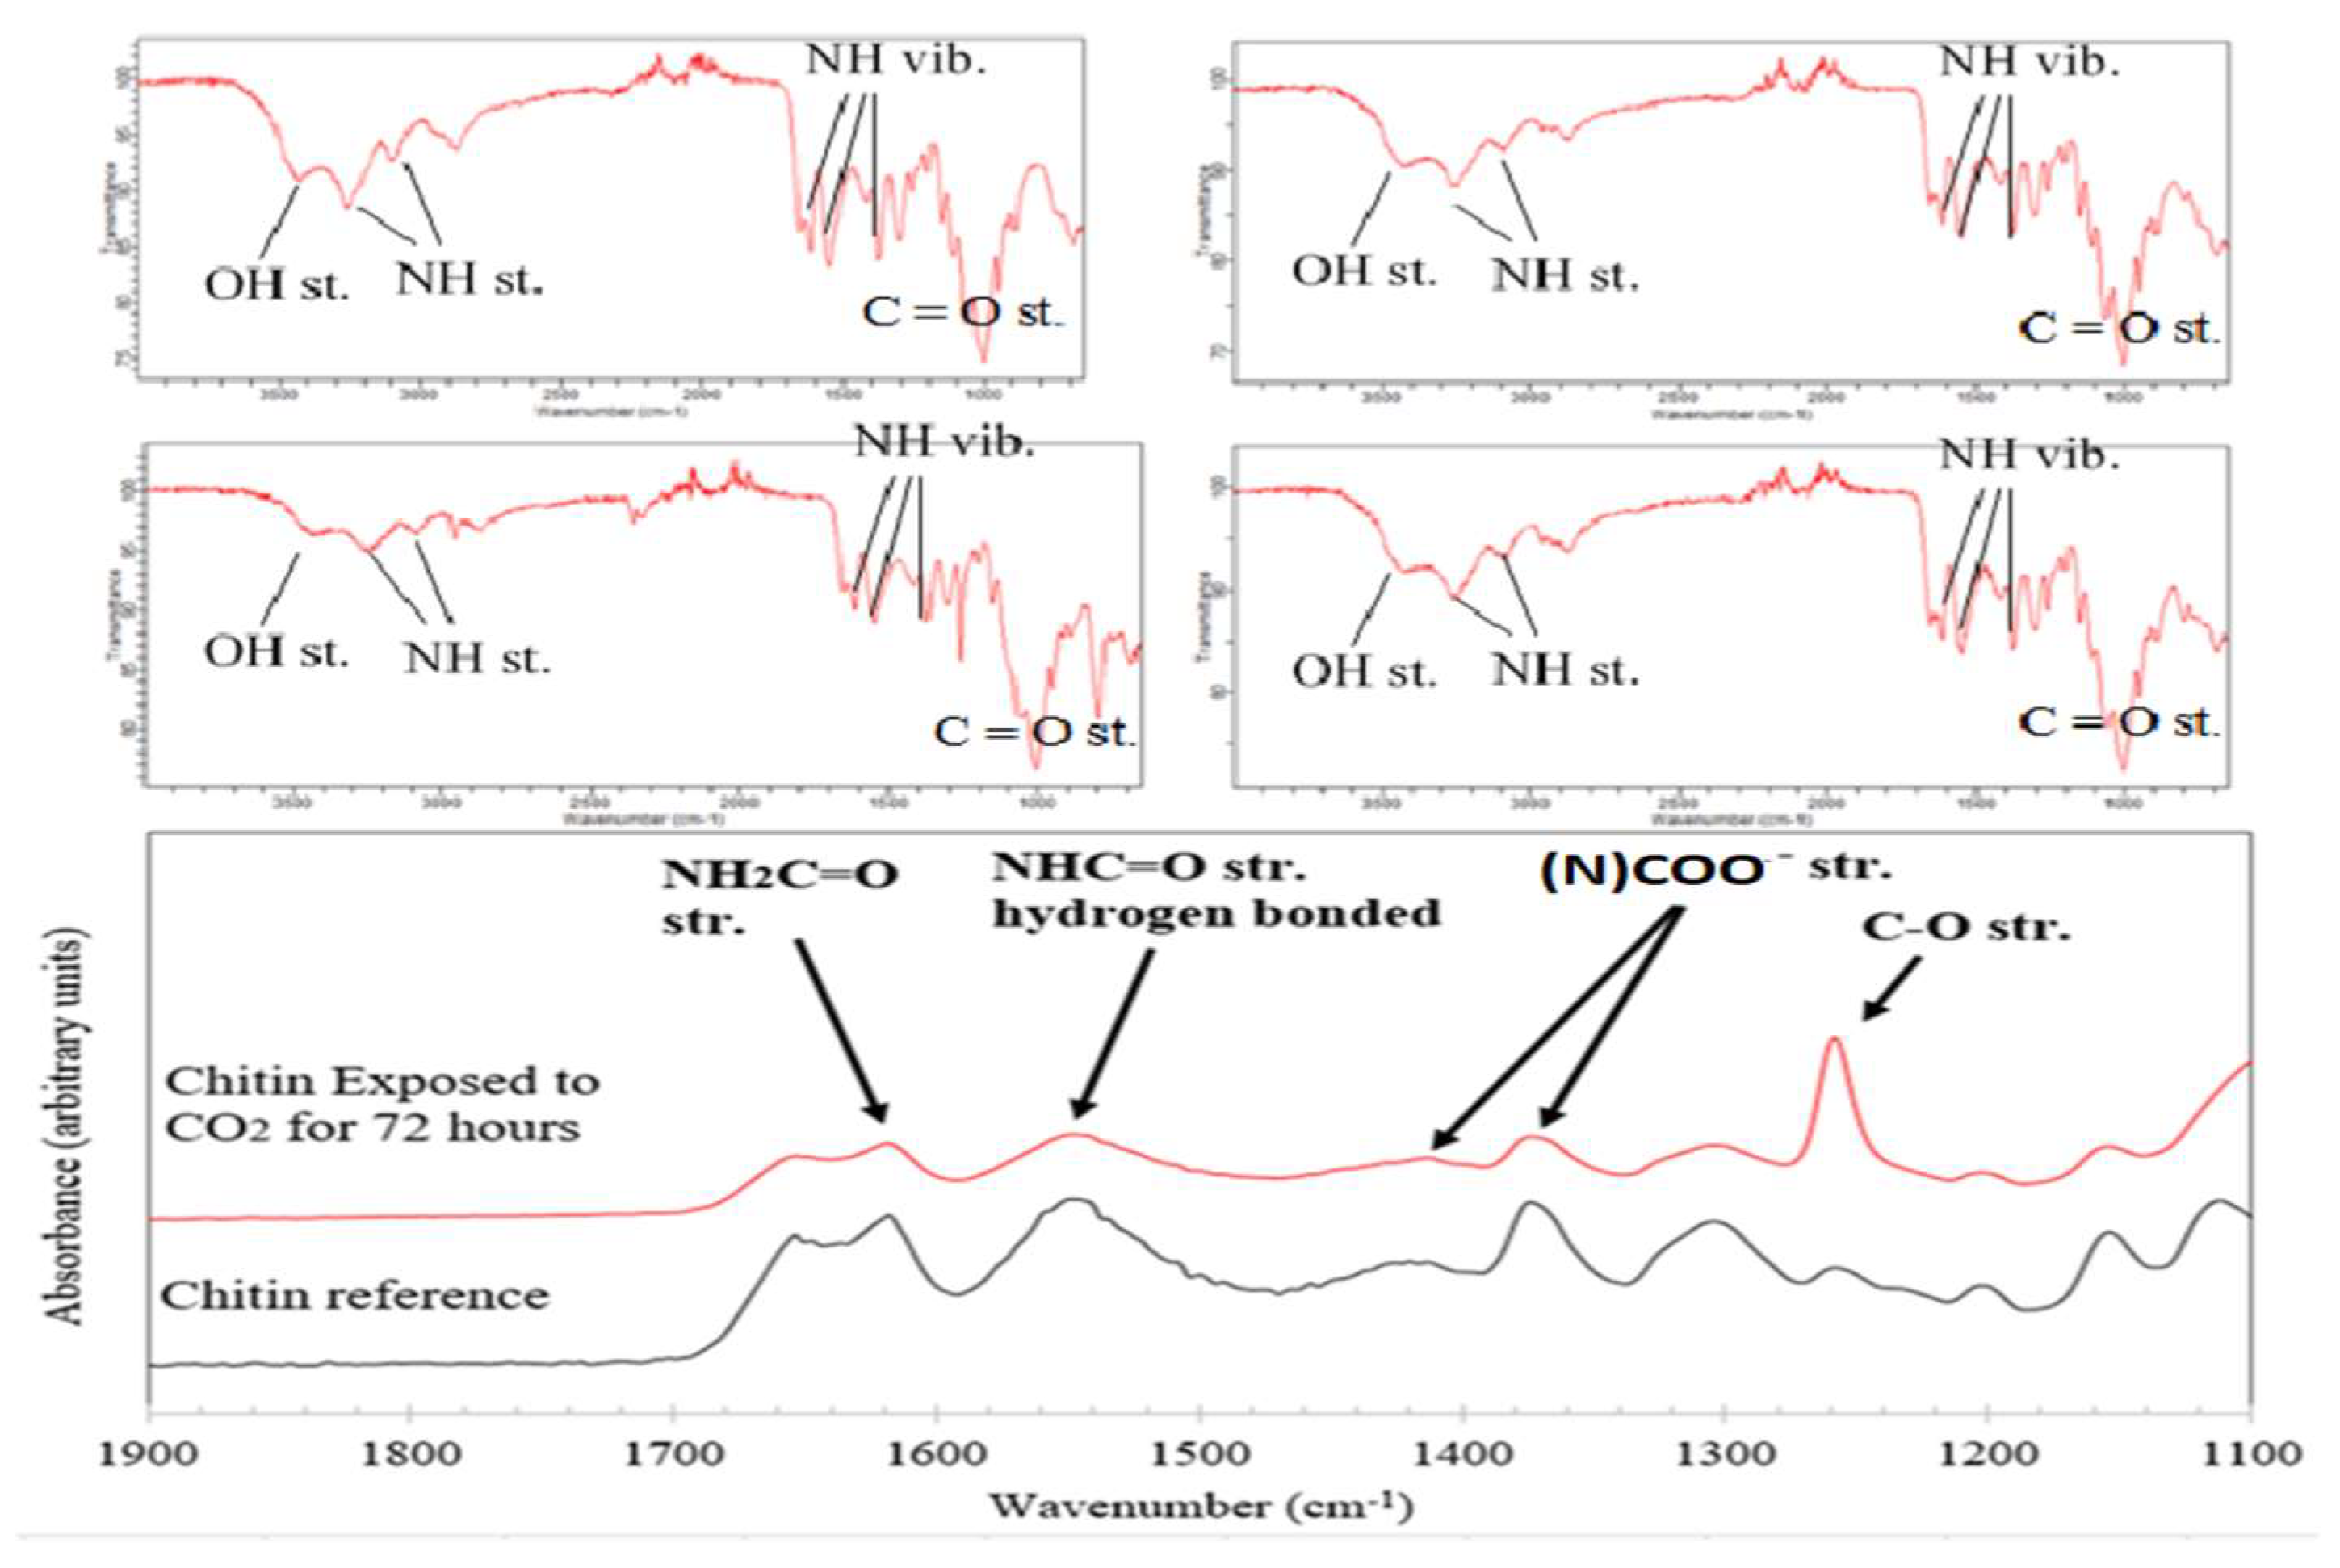
Figure 8.
MALDI Results for 30, 40, and 50 degree Celsius.
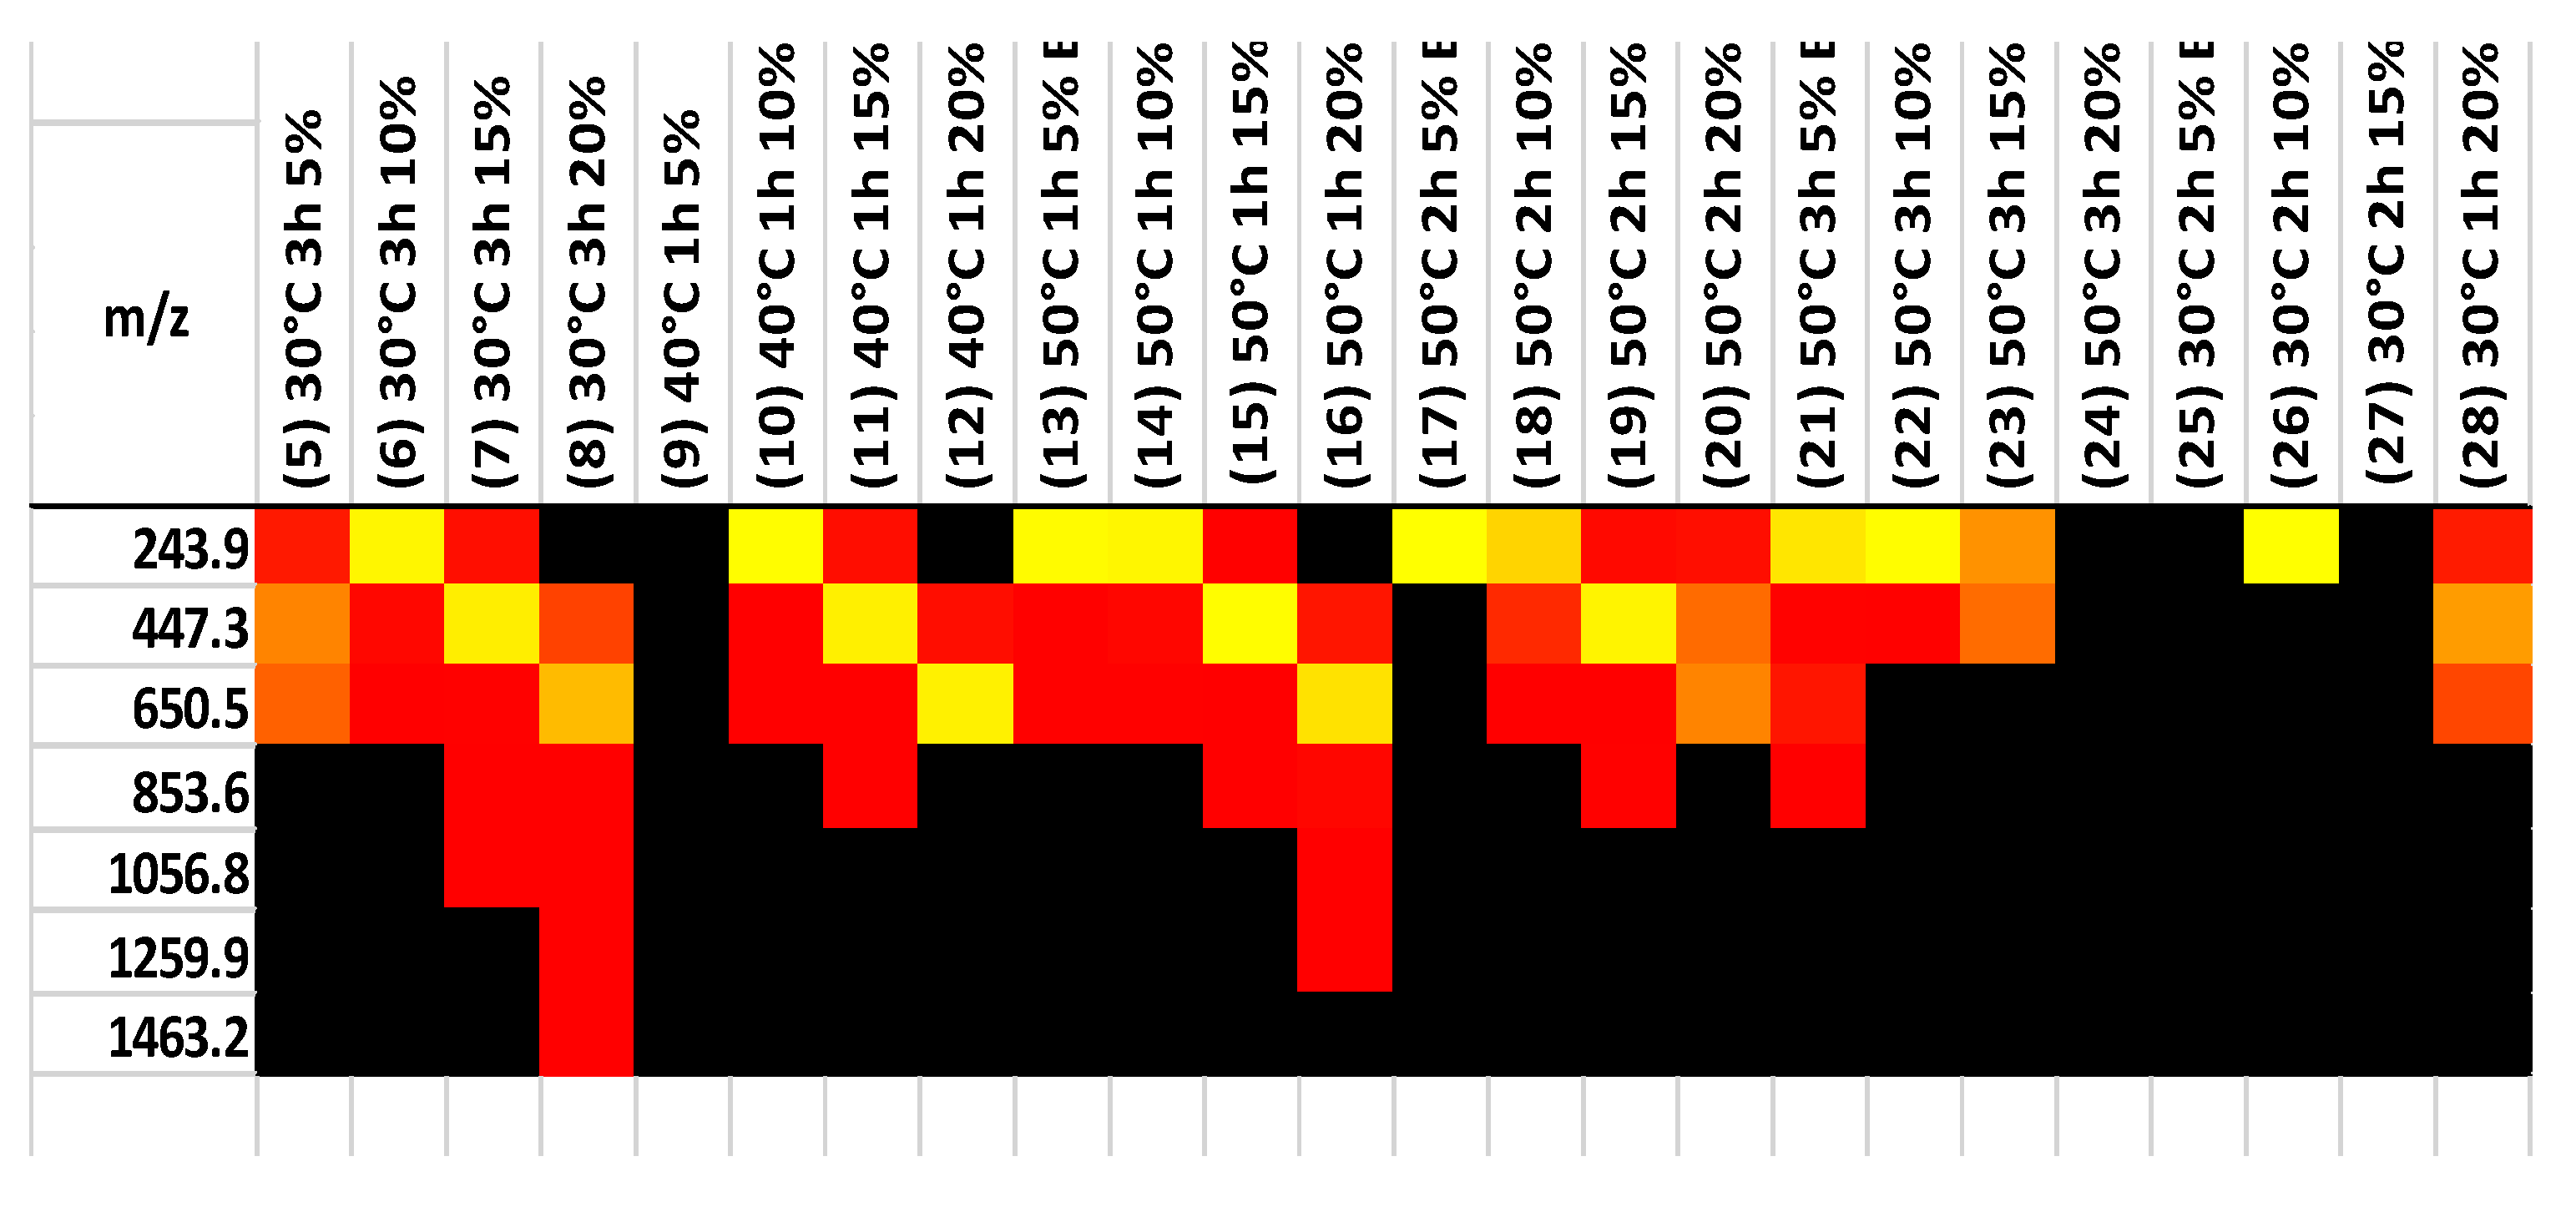
Figure 9.
FTIR spectra of pure chitin (before exposed to CO2) and 10% fraction after exposed to CO2.
Figure 9.
FTIR spectra of pure chitin (before exposed to CO2) and 10% fraction after exposed to CO2.
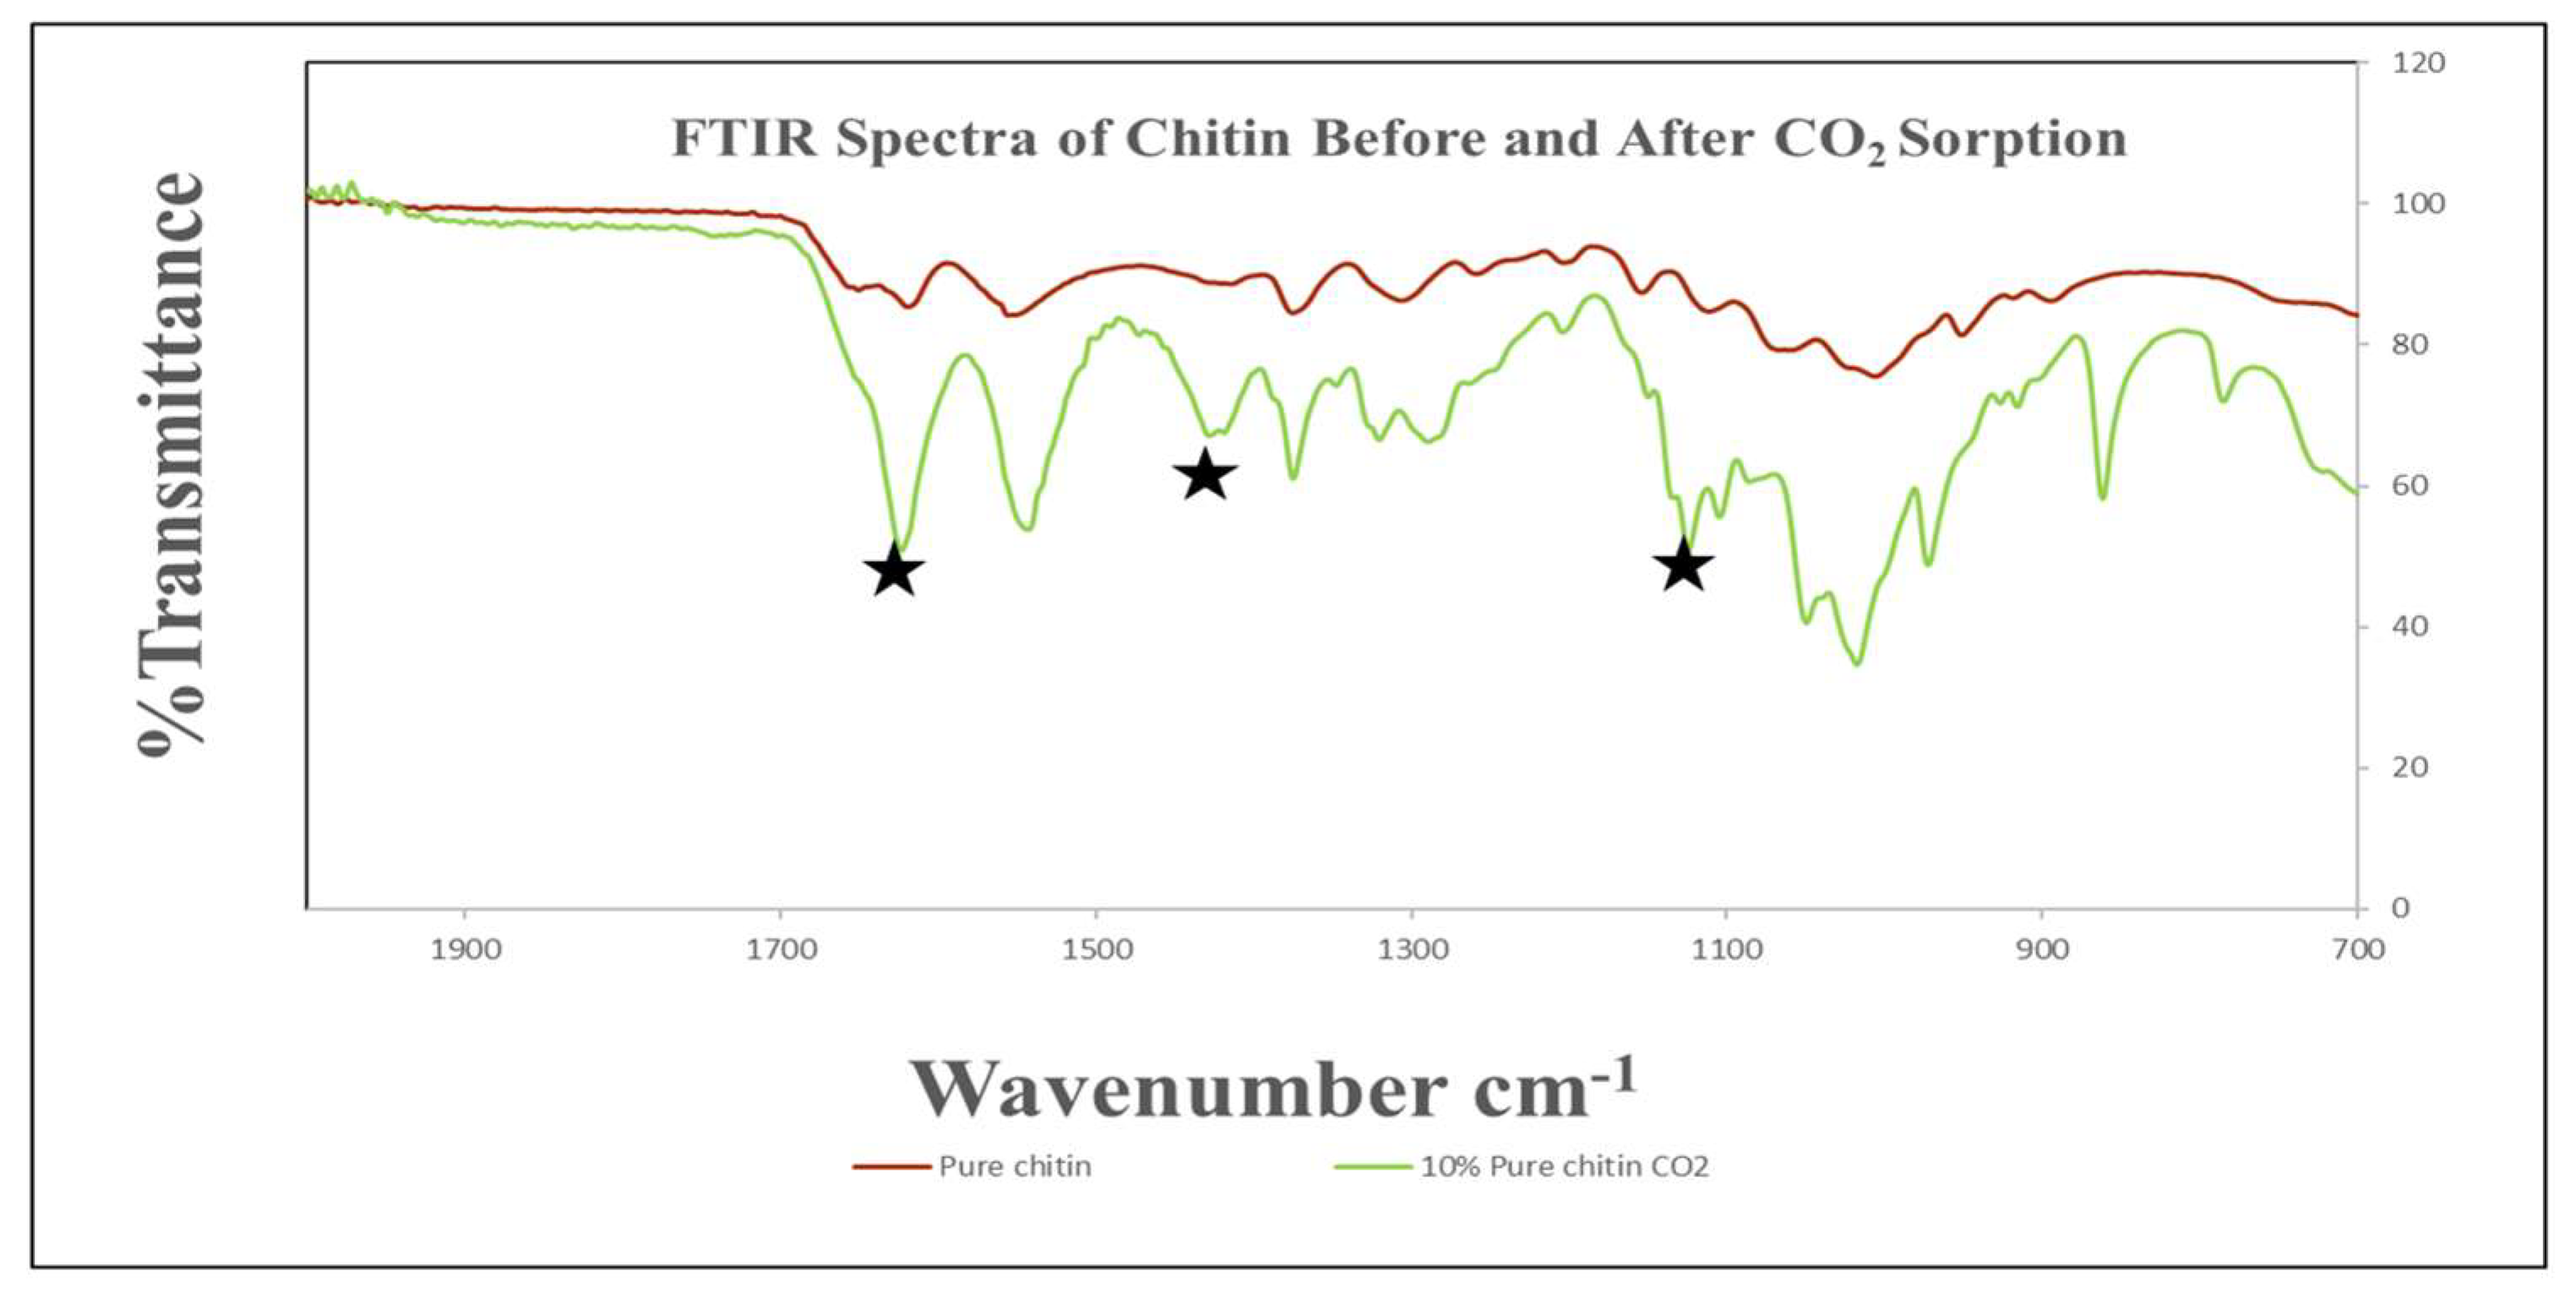
Figure 10.
FTIR spectra of hydrolyzed Chitin, exposed to CO2.
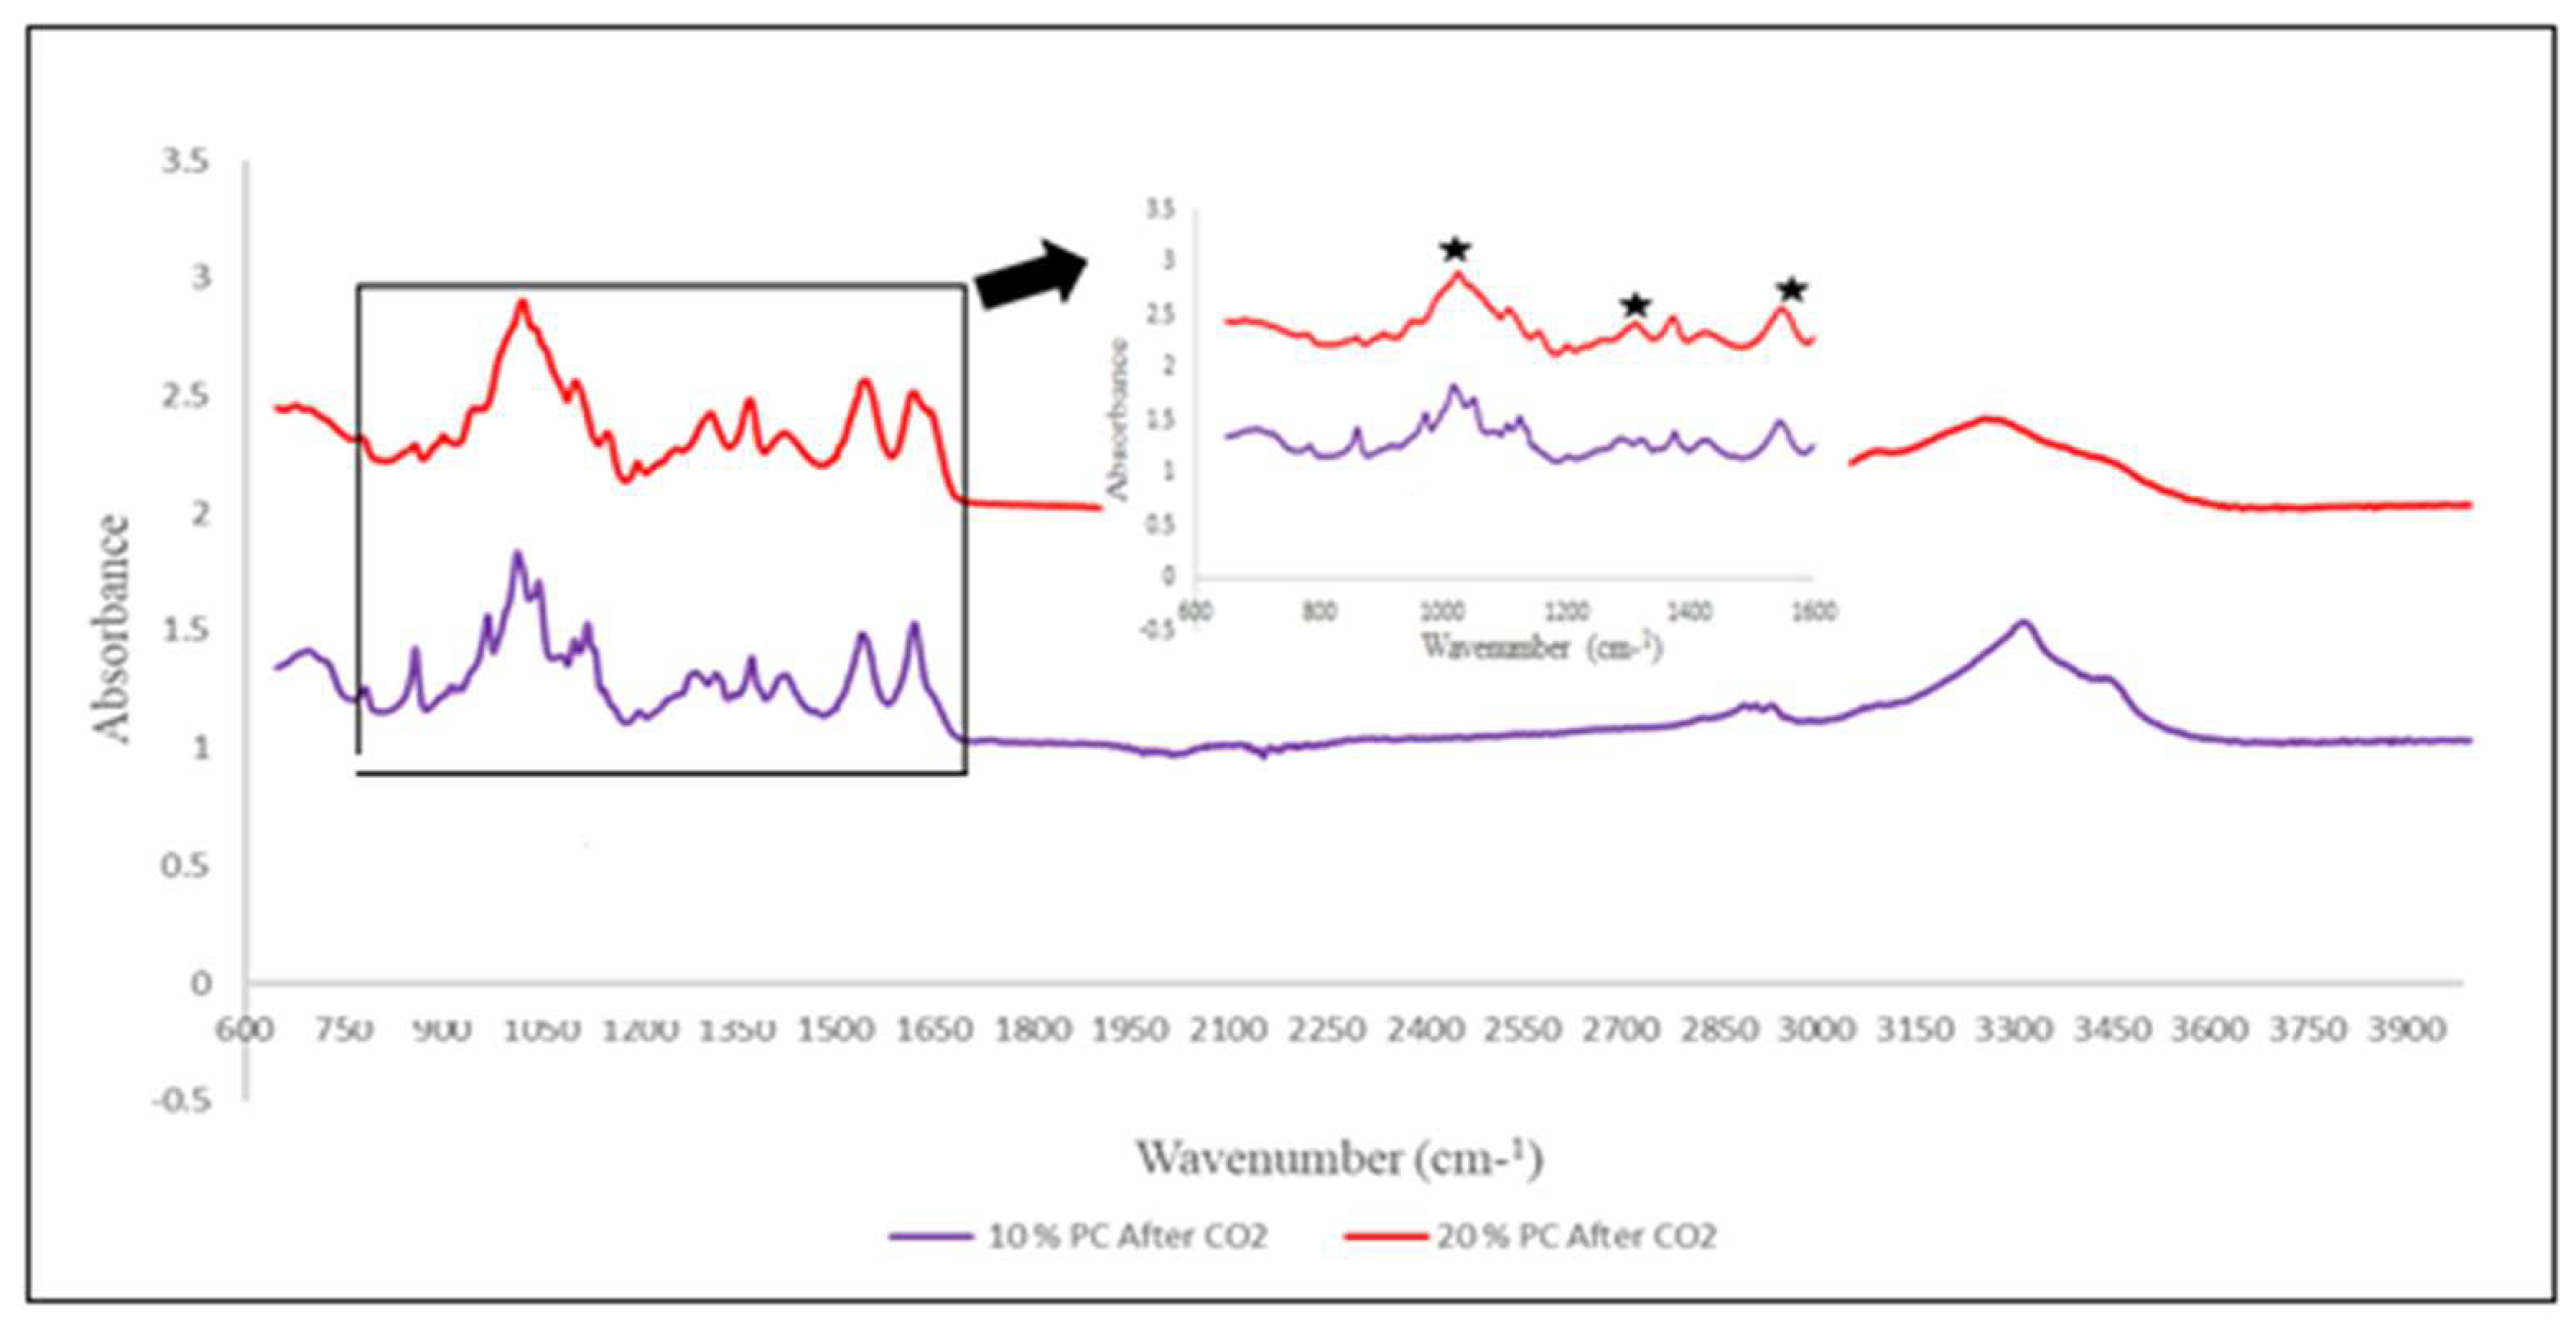
Figure 11.
Chitin content of each shell type. These values represent the mass remaining after demineralization and deproteinization treatments.
Figure 11.
Chitin content of each shell type. These values represent the mass remaining after demineralization and deproteinization treatments.
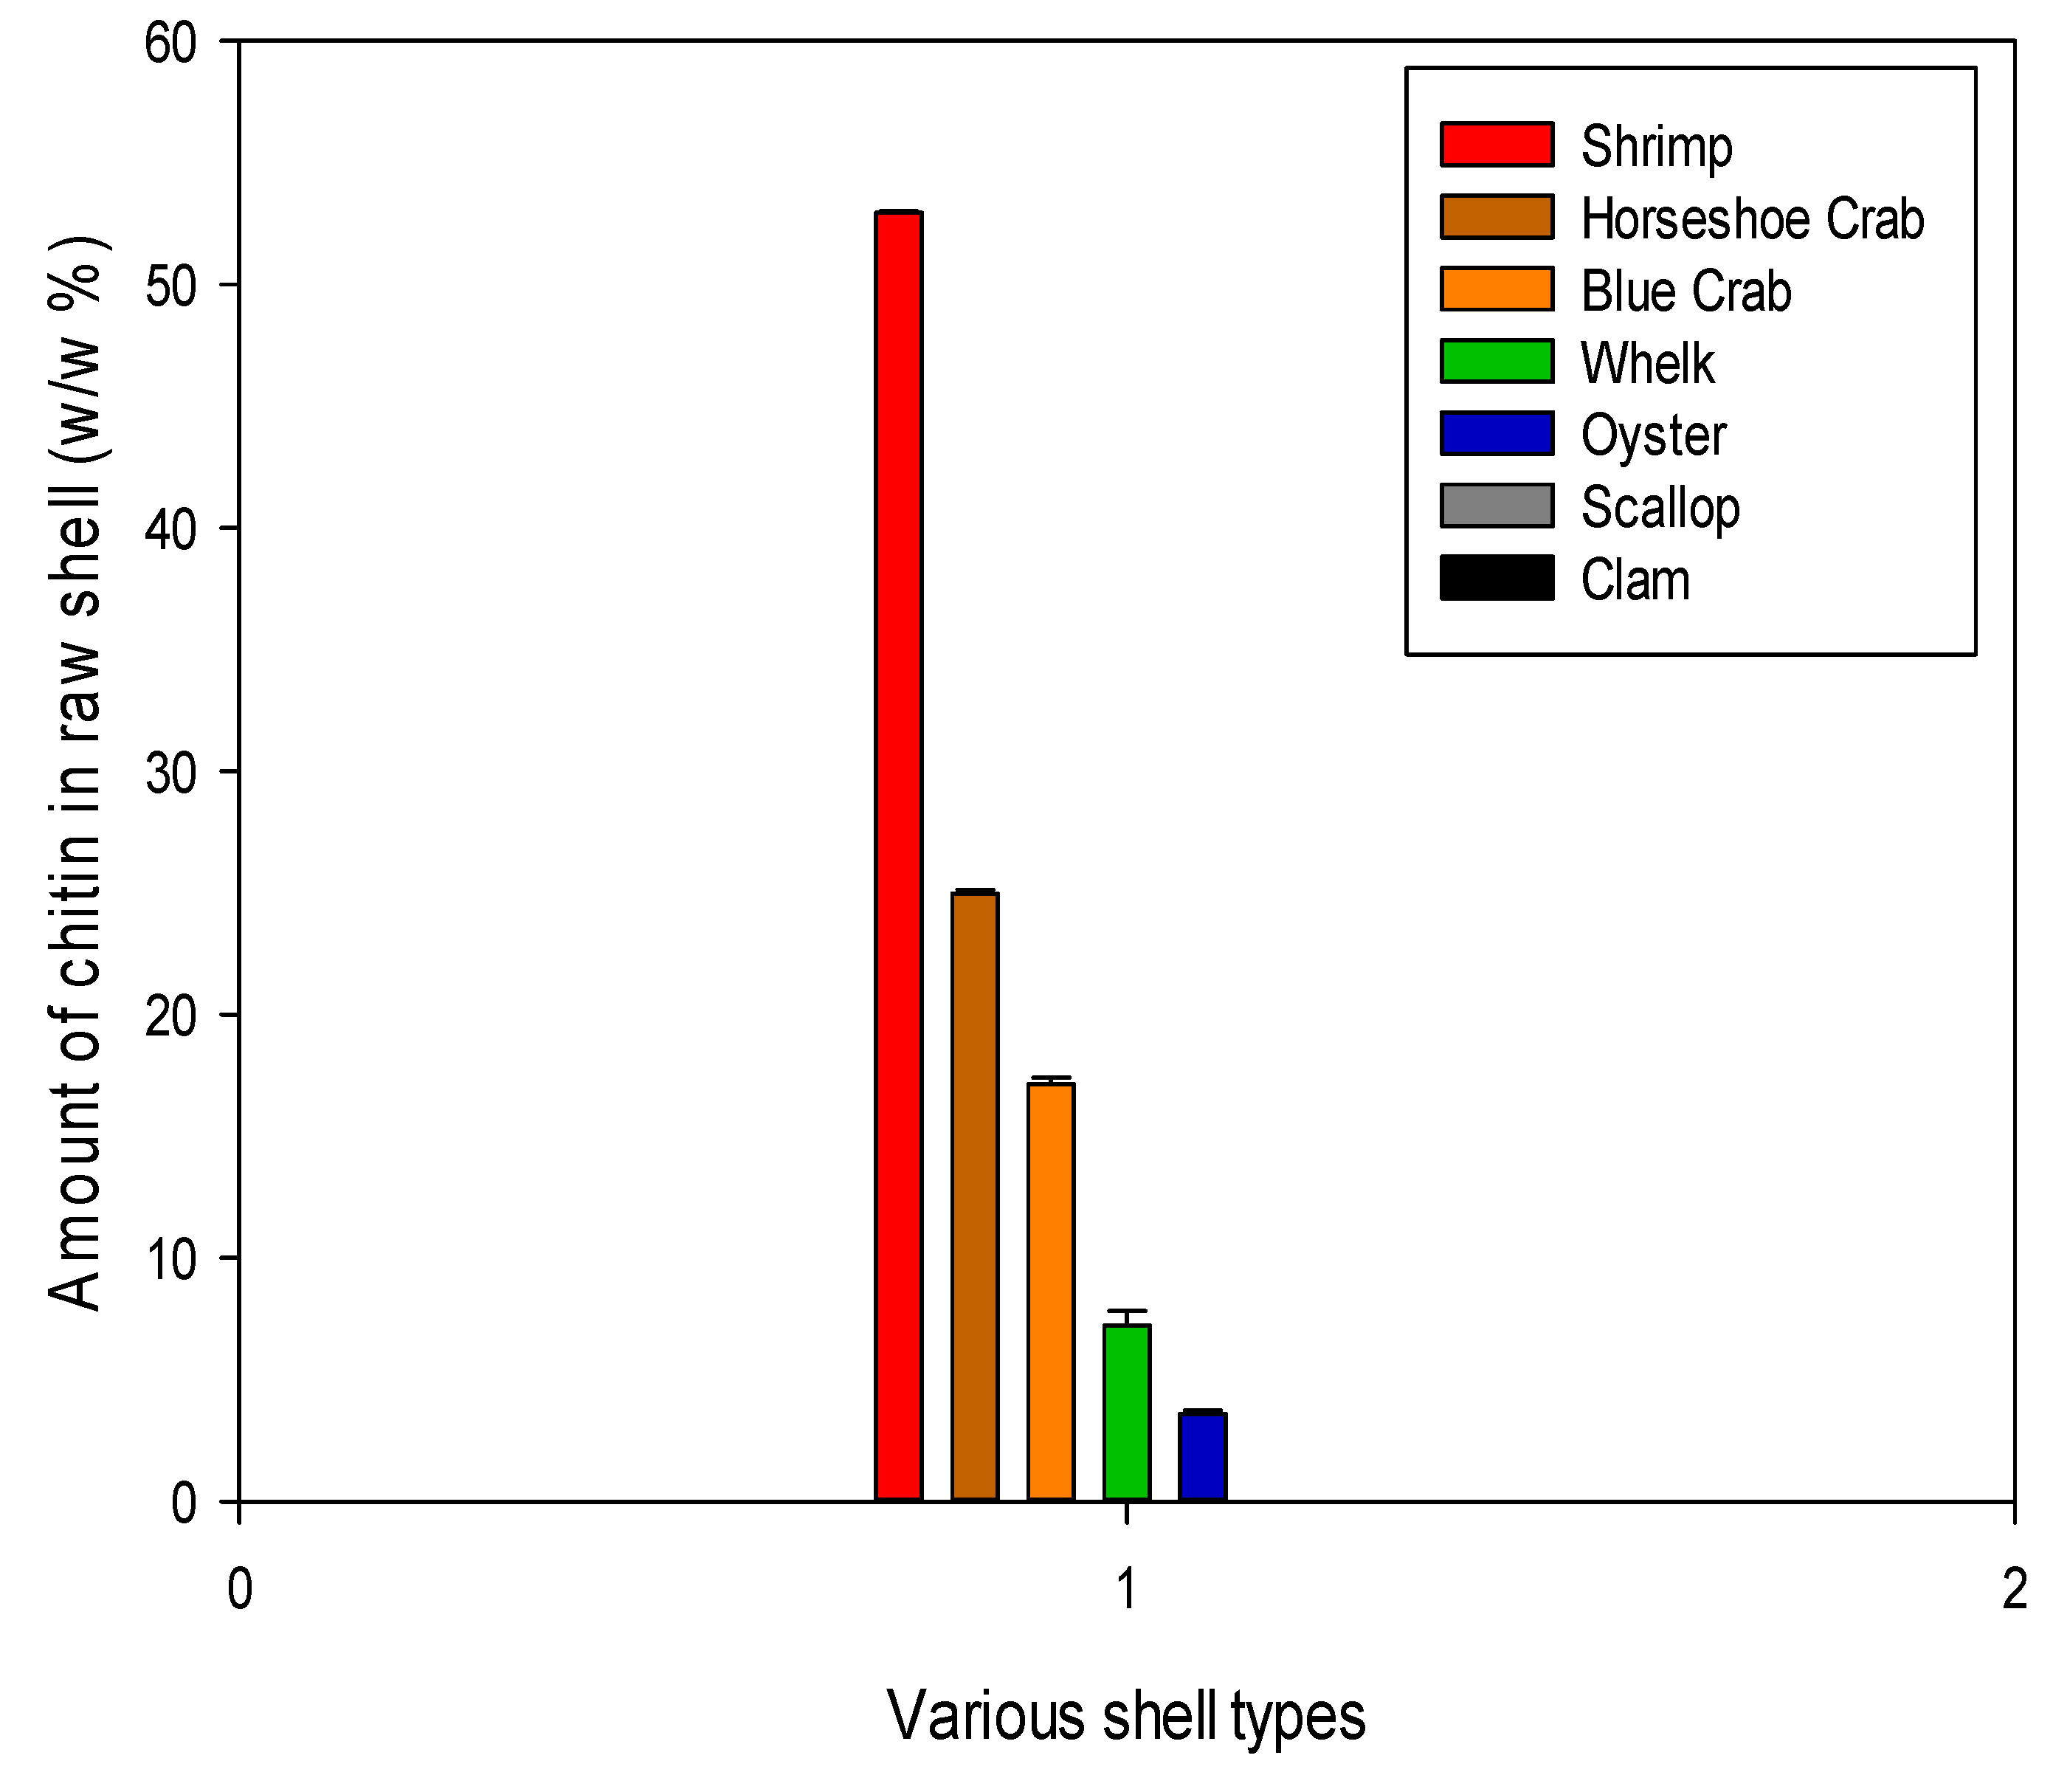

Table 1.
Carbon dioxide sorption-desorption data for pure chitosan, and its blends with polysulfone.
Table 1.
Carbon dioxide sorption-desorption data for pure chitosan, and its blends with polysulfone.
| Entry | Sample description | Sorption capacity with 25%of CO2, gCO2/g sample/hour |
Sorption capacity with 40% of CO2, gCO2/g sorbent/hour |
Temperature at which the desorption starts, °C | Temperature at which full release was recorded (sorbent comes to its original weight), °C |
|---|---|---|---|---|---|
| 1 | Pure chitosan 11,000 Daltons | 0.54 | 0.66 | 38 | 80 |
| 2 | Blend of 2.5 % (ww) of chitosan in polysulfone | 0.06 | 0.08 | 45 | 80 |
| 3 | Blend of 5 % (ww) of chitosan in polysulfone | 0.17 | 0.23 | 48 | 80 |
| 4 | NPPCS | 0.28 | 0.31 | 41 | 77 |
| 5 | NPPCS 10% in polysulfone | 0.12 | 0.16 | 44 | 80 |
| 6 | NPPCS 20% in polysulfone | 0.42 | 0.46 | 45 | 80 |
| 7 | NSCS | 0.36 | 0.41 | 44 | 75 |
| 8 | NSCS 10% in polysulfone | 0.20 | 0.29 | 48 | 80 |
| 9 | NSCS 20% in polysulfone | 0.48 | 0.53 | 50 | 80 |
Disclaimer/Publisher’s Note: The statements, opinions and data contained in all publications are solely those of the individual author(s) and contributor(s) and not of MDPI and/or the editor(s). MDPI and/or the editor(s) disclaim responsibility for any injury to people or property resulting from any ideas, methods, instructions or products referred to in the content. |
© 2025 by the authors. Licensee MDPI, Basel, Switzerland. This article is an open access article distributed under the terms and conditions of the Creative Commons Attribution (CC BY) license (http://creativecommons.org/licenses/by/4.0/).
Copyright: This open access article is published under a Creative Commons CC BY 4.0 license, which permit the free download, distribution, and reuse, provided that the author and preprint are cited in any reuse.


