
Submitted:
07 April 2025
Posted:
08 April 2025
You are already at the latest version
Abstract
Carbon Dioxide Equivalent (CO2e) avoided is increasingly communicated to individuals through digital media. Too Good To Go – a food waste app – presents users with a personalised CO2e avoided figure. Each time they collect food from a supermarket, café or restaurant their number increases. How do users experience CO2e avoided on the app? We explore this question through a longitudinal research project with 10 households in Oxfordshire, involving three interviews, five self-report surveys and a 28-day trial of the app. In general, participants did not see the figure as particularly valuable – best demonstrated in how little it influenced their usage of the app. This was largely due to issues of truthfulness. Each time a participant travelled and collected a bag, the CO2e avoided feedback would increase by a fixed amount. This was at odds with the considerable variation in user experiences. Instead of CO2e avoided, participants put forward alternative impact data that was less individualised and more relatable. We use the concept of data experiences, as developed by Hoeyer et al. (2024), to think through the findings. In doing so, we provide empirical support to the utility of the four-part concept and put forward an additional cross-cutting theme of intensity. The paper also highlights how organisations cannot assume that certain metrics will influence peoples’ opinions and behaviours. To have an impact, their audiences’ data experiences need to be properly understood.
Keywords:
Data
; Climate change
; technology
; experience
; behaviour change
Introduction
Carbon Dioxide Equivalent (CO2e) avoided is increasingly communicated to individuals. Organisations that facilitate green travel are adding CO2e avoided feedback to their service, for example: Trainline – a travel booking site with 30 million active users per month – presents the user with how much CO2e they would save on a specific journey by comparing the emissions of travelling by car and by train; Strava – a fitness app with 125 million registered users – allows people to see how much CO2e was avoided by cycling to work instead of driving; and Too Good To Go (TGTG) – an app that allows users to buy nearly-wasted food – provides users a running total of the CO2e they’ve avoided by collecting food that would have otherwise gone to waste.
These figures are often assumed to have some impact on users. It is imagined that individuals will better understand how their actions are limiting damage to the environment and encourage them to continue their climate-friendly behaviours. However, three decades of research on information provision, sustainability and behaviour change caution against such narratives. The information-deficit model, which argues that a lack of information underpins peoples’ unsustainable behaviours, has been widely dismissed as too simplistic (Middlemiss, 2018: 64; Shove, 2010: 1275). This is not to say that information plays no role in sustainable behaviour change – it is just more complex than exposing people to scientific knowledge (Carroll, Lyons & Denny, 2014; Valkengoes, Abrahamse & Steg, 2022).
For food behaviours to be changed, for example, peoples’ food practices need to be understood so they can engage with information before, during and after food shopping rather than just at the point of purchase (Ran et al., 2022). Much of this engagement with information is discursive – it is talked about among peers, allowing people to reflect on their own sustainability-related behaviours (Hobson, 2003; Simcock, 2014). And there are often unexpected outcomes of information provision. Smart metres bring down energy usage on the whole but have also been linked to the reinforcement of unsustainable practices and negative emotional responses (Hargreaves et al., 2010).
When thinking about CO2e avoided, therefore, we need to reject simplistic narratives around behaviour change and embrace the complexity and open-endedness of how people experience information. This is particularly important for CO2e avoided. People may be familiar with CO2 (Timmons and Lunn, 2022), but not CO2e. CO2e calculates the seven main greenhouse gasses’ global warming potential (GWP) and expresses this relative to the global warming potential of CO2, which is set at 1. This allows for gasses such as methane – important when understanding emissions from food production, for example – to be included in assessments of impact on the planet. The measure of CO2e thus allows for the commensuration of different activities but requires a high level of carbon literacy and specific technical understanding. Even when someone understands CO2e avoided, there are ethical arguments concerning the focus on personalised carbon data.
All good stories of personalised CO2e should recognise the role of British Petroleum (BP) in its creation. Building on the emerging concept of an individuals’ “carbon footprint”, the fossil fuel company released the first widely used personalised carbon footprint calculator in 2004 (Kaufman, 2024). The calculator allowed individuals to measure their impact on the planet – argued to be a part of a broader Public Relations campaign to divert responsibility away from fossil fuel companies and towards individuals’ actions. Since then, there has been a proliferation of carbon footprint calculators, from government-backed enterprises (e.g., Climate Neutral from the UN) to non-profit entities (e.g., WWF’s Footprint) (Mulrow et al., 2019). Two decades on from BP’s marketing campaign, it is now normalised for people to think of themselves as personally responsible for climate change, with this figure appearing to be rising (European Commission, 2019).
To understand how people experience CO2e avoided information, we focus on the CO2e avoided feedback on the TGTG app. TGTG more comprehensive and engaging than other services communicating CO2e avoided information: Trainline do present a CO2e avoided figure to each user, but they do not provide regular users with a running total of how much CO2e they have avoided through repeat purchases; whereas Strava’s personalised data is not for all journeys, it is only for specific users who select the “commute” option when cycling.
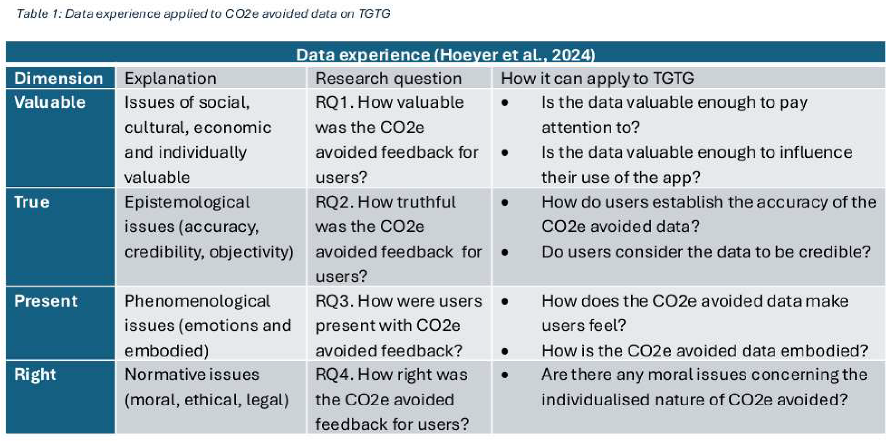
To think through how people experience CO2e avoided feedback on the app, we use Hoeyer and colleague’s (2024) concept of data experiences. How valuable was the CO2e avoided feedback for users? How truthful was the CO2e avoided feedback for users? How were users present with CO2e avoided feedback? How right – morally, ethically, legally - was the CO2e avoided feedback for users? These questions are explored through a multi-stage research project with 10 households (12 individuals) in Oxfordshire in the UK, involving three interviews, five self-report surveys and a 28-day trial of the TGTG app.
Our findings provide empirical data concerning the way people engage with quantitative information in the context of climate change. It helps us better understand why and how information does not always influence sustainability-related behaviours. At the same time, it attends to the vitally important – yet poorly understood – academic exercise of understanding peoples’ experiences of data.
Data Experiences
There are not many over-arching theoretical framework for understanding data experiences. Two stand out as helpful. Burgess and colleagues (2022) position data within cultural studies, arguing for an examination of datafication “at the ground level” in the “activities, thoughts and feelings of citizens, consumers and users of technologies”. Mapping out everyday data cultures they connect intimate individual data experiences with broader structural conversations concerning agency and publics. Their work is useful but lacks a clear analytical approach to individuals’ experiences.
This is provided by Hoeyer and colleagues (2024) through their concept of data spaces: “conditions of being that are enacted when people, computers, and organisations use data for manoeuvring hopes, opportunities, risks, and challenges—or think that others might be doing so.” They use policy reports and documents about the proposed European Health Data Space – a large-scale health data infrastructure – to map out the nature of data spaces. To analyse data spaces, they outline two dimensions: the formative that examines how data spaces come into being through the meeting of labour, users and promises; and the experiential, defined as the way data spaces are inhabited. Given the focus of our paper, we use the experiential theoretical framework to think through how people experience CO2e avoided feedback on the TGTG app.
Hoeyer and colleagues (2024) argue that much of the existing work either focuses on data as knowledge or data as political objects, but this misses direct experiences with data. In doing so, academic work can struggle to understand “how and why some people react to datafied phenomena” (Hoeyer, 2023). To unpick this, they define data experiences are comprised of four aspects: value – what people experience as valuable (economically, emotionally, and socially); truth – what people experience as true (epistemologically); presence – what people experience as present (sensing, seeing, feeling); right – what people experience as right (legal, moral, normative). They are keen to stress that peoples’ experiences are often combinations of these four aspects. For example, someone might consider CO2e avoided to be true but place very little value on the figure when engaging with the TGTG app because they don’t feel (when they are present) that its right to overly-individualise the fight against food waste. These combinations change as peoples’ experiences vary depending on specific individuals and circumstances
To give a sense of how people might experience CO2e avoided, we can turn to the small body of literature on how people engage and experience carbon footprint calculators – and the CO2/CO2e metrics used in these calculators. To map out this empirical work we use the four dimensions of data experience. In doing so, we further develop the different elements of Hoeyer and colleague’s framework.
Data Experiences of Carbon Footprint Calculators
Value can be approached by considering how much the data can influence changes in behaviours. Research is inconclusive as to the effects of carbon footprint calculators on behaviour change (Jack et al., 2024). Some studies have highlighted the effect of calculators on peoples’ behaviour, for example Kok and Barendregt (2021) found that participants made changes to different parts of their lifestyle after using the calculator, ranging from avoiding packaging to decreased meat and dairy consumption. But relying on personalised information from a calculator is considered insufficient to encourage more people to adopt pro-environmental behaviours (Büchs et al., 2018; Dreijerink and Paradies, 2020). Integrated interventions, on the other hand, seem to have more influence, suggesting that individuals may change their behaviour if they use a carbon footprint calculator and engage in group discussions (Gram-Hanssen and Christensen, 2012; Sutcliffe et al., 2008).
Beyond the impact of carbon footprint calculators on pro-environmental behaviours, we can consider the impact on individuals’ attitudes, social norms and intentions. Kok and Berendregt (2021) outlined how calculators can facilitate conversations with peers and be the catalyst for plans to change in the future – important effects in their own right and building blocks to direct behaviour change. Matching with the work from Luo an colleagues (2023) who show that personalised feedback on carbon emissions can lead to people intending to reduce their carbon-related activities. It does seem that footprint calculators can increase awareness (Büchs et al., 2018), but this is mitigated by calculators generally attracting people who already have a modest impact on the planet (relative to other citizens in their country) due to heightened concern about climate change.
The ability for individuals to contextualise data emerges from a meeting of value and truth. CO2 and CO2e are concepts that individuals can struggle to understand (Dósa and Russ, 2020). This makes it hard to determine the truthfulness of CO2 and CO2e information and makes it difficult to ascribe value to it. To address this, some calculators contextualise the data they present. For example, how many Earths would be needed if everyone had the same consumption pattern as the user (the “planet representation”). Participants in Kok and Berendregt’s (2021) study found this way of communicating CO2 more comprehendible – in the words of participant 1 “you can tell right away […] this isn’t good, because there is only one Earth.” A similar argument was made by other participants in the study when discussing the amount of land required for their lifestyle (sometimes used to represent carbon footprints): participants called for the hectares of land figure to be converted into square metres or football fields instead.
It seems that contextualisation can de-mystify issues of truth and, in turn, allow people to place more value on the data. Similarly, Lindrup and colleagues (2023) provided participants with different weight totes bags that represented countries’ per capita CO2e. It allowed participants to understand how countries compared to each other, allowing for people to better contextualise the data. But this contextualisation was only partial. They could not contextualise the impact on the planet of the CO2e being presented to them.
The issue of truth emerges more explicitly in how personal footprints are calculated. Users of carbon footprint calculators are critical of the level of detail in the survey questions, arguing that there was not enough nuance in how their carbon footprint was calculated (Jack et al., 2024). For example, a participant in Bjorn-Hansen and colleagues (2022) study expressed their discontent, explaining that he shared an electric car with his son, but this “spreading” of CO2e was not captured. Those who were more concerned about the environment, would generally be happy to answer more detailed questions concerning their carbon footprint for a more truthful account of their impact (Kok and Barendregt, 2021).
Stepping away from truth and value, we can consider how some users were present with calculators (Jack et al., 2024; Kok and Barendregt, 2021). Participants in Kok and Berendregt’s (2021) study felt they could never reduce the number of planets to one, and so felt hopeless in their ability to address climate change. Similarly, Jack and colleagues (2024) refers to the role of demotivation and resistance. They outline how one participant felt sad about their carbon footprint: in their view, they were doing a lot already to help the environment - but they were still above average on the calculator. For others, they continued to live high carbon lifestyles but had a “guilty conscience” in doing so. These negative feelings of hopelessness, sadness and guilt are important emotional reactions but are not the only ways that people are present with data. Data can be embodied when people sense the weight of something, as seen in Hedin and colleague’s (2024) tote bag study that physicalised emissions.
The least amount of empirical work centres on what is considered right. Some research does refer to issues of responsibility. Some people disagree with calculating an individuals’ carbon footprint because it detracts from structural issues driving climate change (Jack et al., 2024). One participant used this criticism to present an alternative framing of individuals’ relationship to climate change: a handprint, not a footprint, that places emphasis on how individuals can contribute to structural change through signing petitions, voting and joining citizens’ initiatives (Kok and Barendregt, 2021).
We use the empirical work on carbon footprint calculators – set within Hoeyer and colleagues’ data experiences framework – to underpin our examination of CO2e avoided feedback on the TGTG app (see Table 1). The four issues form our four research questions, each guided by a set of questions emerging from the literature:
RQ1. How valuable was the CO2e avoided feedback for users?
RQ2. How truthful was the CO2e avoided feedback for users?
RQ3. How were users present with CO2e avoided feedback?
RQ4. How right was the CO2e avoided feedback for users?
Given the similarities between our empirical focus and carbon footprint calculators, our operationalisation of true, present and right match with the literature outlined above. For valuable, however, we focus specifically on users’ attention to the data and usage of the app. TGTG does not use CO2e avoided feedback to engender broader changes in peoples’ lifestyles (like carbon footprint calculator do), its designed to maintain engagement with the app and encourage users to buy surprise bags.
Methods
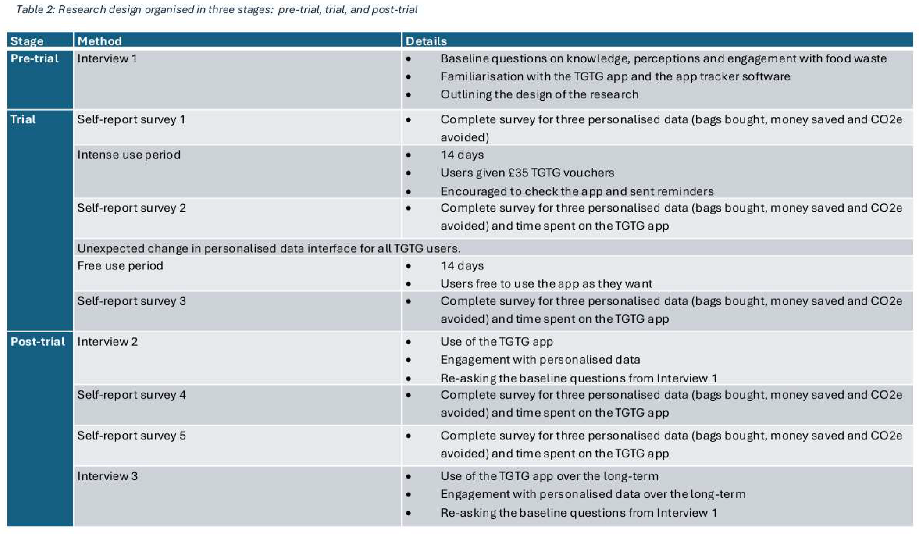
Research Design
To understand how participants experienced CO2e avoided feebdack on the TGTG app, we developed a multi-stage research design centred around a 28-day trial of the app. Our approach was specifically designed to expose 10 households (comprised of 12 participants) to the CO2e avoided feedback as they engaged with the TGTG app. The stages of the research are outlined in Table 2.
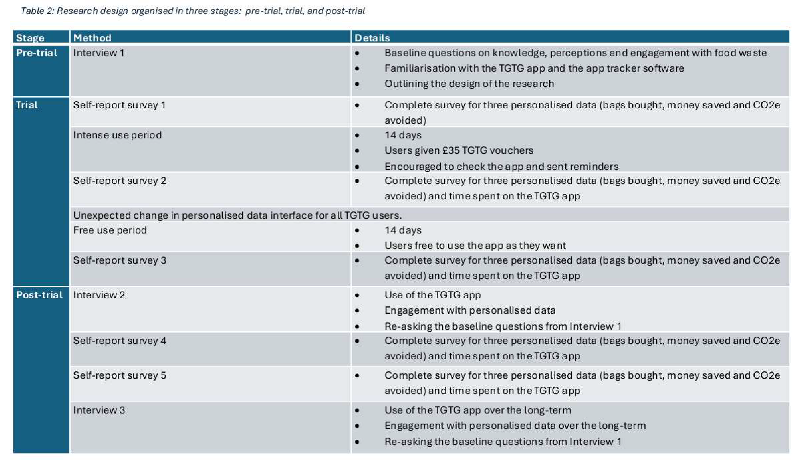
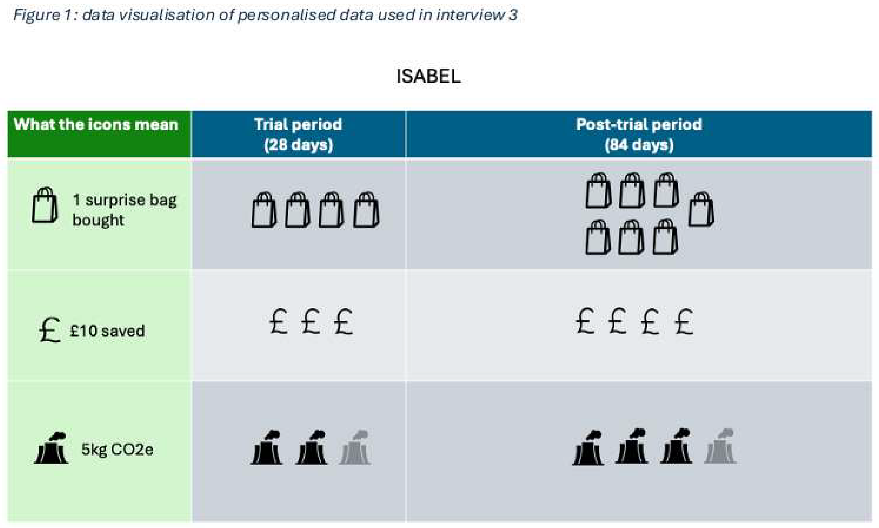
We conducted three interviews per household (with multi-participant households interviewed together) to understand how they perceived this data: one before the trial of the app, one immediately after the trial and one 12 weeks after the trial. The three interviews per household allowed us to contextualise participants data experiences within the broader experience of using the TGTG app and outlined how their experience of CO2e avoided feedback changed over time. To aid our discussions of the data, all participants from the 10 households completed self-report data surveys at specific times during the intervention. The surveys focused on four data points: time spent on app, bags bought, money saved, and CO2e saved. The data provided allowed for the researchers to understand participants’ usage and it was used in the second and third home interview as a prompt. Participants’ personal data was converted into a set of infographics that represented the three data points and changes over time (see Figure 1 for an example). The visualisation followed the guidance of Franconeri and colleagues (2021). It used icons to represent units, with 5kg of CO2e represented by one power station. When CO2e feedback was not a multiple of five, the icon was made more transparent (see Figure 1). During the household interviews, participants were encouraged to discuss the accuracy of the data, how the data connected to their personal experience and the influence of the data on their opinions and behaviours.
Participants
The research was part of a pre-existing living labs research conducted by XXX at XXX. All participants currently part of the living lab were emailed a screening survey. Of the 25 respondents, we selected 12 individuals from 10 households. The selection was based on four criteria: 18+ years of age; uses a smartphone; no or limited past use of TGTG; lives in or regularly visits Oxford.
Given that TGTG operates through an app and has a minimum age of 18, all participants needed to own a smartphone and be aged 18 years or older. We selected users who had either not used the app before or had purchased a surprise bag on TGTG more than one year ago. This ensured that all users were relatively fresh to the platform, rather than having considerably different current levels of engagement. Finally, we selected those who either lived within 3 miles of Oxford City Centre or travelled into Oxford at least once a week. Given that most food providers on the app were located in the centre of Oxford, this ensured that participants had opportunities to collect food that was on offer. We attempted to achieve a balance of household composition, age and use of a food bank1 in the last 12 months (see Table 3). All 12 individuals – from the 10 households - who started the project completed the final interview, submitting all five self-report surveys.
Data Analysis of CO2e Avoided
Our analysis focused on the CO2e avoided feedback. To analyse how this data was experienced, we analysed each participant’s three home interviews and the five self-report survey data. The predominant focus of our analysis was on the interview data. To do so, we considered three layers of the data:
- CO2e avoided data - specific discussions about CO2e avoided on the app and CO2e/CO2e avoided more broadly
- Personalised data - discussions about their personalised data, focusing on money saved and bags bought;
- Wider context - broader conversations about their experience of the app that helped contextualise specific conversations about CO2e.
The self-report data was used as a prompt during these discussions but was also analysed to understand participants’ usage of the app over time (particularly important for addressing RQ3 and RQ4).
The presentation of CO2e avoided on the app changed in two ways during the trial period. This was unplanned and not part of the research design. First, TGTG shifted from CO2e saved to CO2e avoided. Second, they changed how the data was presented – showing users the equivalent kilowatt hours (kWh) and how this equated to the number of full smartphone charges, cups of hot coffee and time taking a hot shower. Our analysis does account for users’ experience of this change.
All interviews were transcribed and uploaded to QSR NVivo. On this platform, Author 1 conducted the first round of coding (Coding v1). This involved coding the interviews for references to the three layers outlined above: CO2e, other personalised data and wider context. Within each of these layers, Author 1 developed a set of codes that linked directly to answering the research questions.
Qualitative coding of interviews can overly-compartmentalise different moments of discussions between participants and researchers. The resulting codes can make logic sense yet fail to connect different participants testimonies in a meaningful, joined up way. When multiple interviews are conducted with one participant over time, this problem is exacerbated. To address this, Author 1 worked with the extracts from the coding document to create the narrative document, which focused on constructing a narrative that formed links between the different testimonies and directly addressed the four research questions. This process involved using all three interviews per participant and accounting for how their experiences changed over time. The self-report survey data was used to contextualise individual participants’ usage of the app.
The number of participants’ testimonies within each code was not used to determine whether codes should be included or excluded from the narrative. Instead, the narrative clearly indicates a qualitative scale: a single conversation, some participants (less than 50% of the total sample), the majority or most participants (50% or over), and all participants.
Following this, Author 2 critically engaged with the relationship between the coding and narrative. They first evaluated the flow, structure and argumentation of the narrative. They then assessed the evidential basis for the narrative using the coding document. In doing so, they created the next version of the coding and narrative. Author 1 and Author 2 repeated this process three times to reach agreement. This process was emergent, interpretive and dialogical. For example, Author 1 and Author 2 would discuss via Teams the relevance of new codes that were previously uncaptured or converse via in-text comments about adding sections to the narrative to improve argumentation.
Findings
Our findings outline how CO2e avoided feedback was not considered particularly valuable to participants (RQ1), highlighted in how little it influenced their usage of the app and the lack of meaningful attention they gave the data. This is partly explained by participants’ low trust in the data – emerging from the interplay of what is considered true (RQ2) and how this feels (RQ3). From this distrust, participants outlined how impact data on TGTG could be more valuable (RQ1) and just (RQ4). They advocated for a shift away from individualised CO2e avoided feedback towards relatable impact data that set individuals within a larger community.
CO2e Avoided Did Not Influence App Usage
One way to understand the value placed on CO2e avoided feedback (RQ1) is to explore how much it influenced participants’ behaviour. None of the participants referred to the app changing their broader pro-environmental behaviours. But they did talk about how it influenced their use of the app. Only one of the participants referred to the CO2e avoided feedback motivating them to use the app.
I’m not so interested in the number of bags but, I think (…) I’m most interested, it would be the CO2e because that would be the reason for doing it. (Mills I2)
But within the same conversation, they also emphasised that these metrics weren’t’ their priority when using the app (Mills I2). Some participants expressed how knowing the CO2e of the bags, while not an influence on their decisions, was a nice to have as it served as a “pat on the back” (Raymond I2) and was a nod at “environmentally friendly” behaviour (Czarina I2).
For Czarina, the link between the data and their behaviour did change between interview 2 and 3. The CO2e avoided feedback was considered more meaningful after the interface change which translated the data into more tangible forms, such as number of full smartphone charges (I3). But for most participants, there was no change concerning the influence of the data on them using the app from interview 2 and interview 3. We can see an example below:
Raymond: I think that something like the CO2e, it wouldn’t drive me to pick something from a specific place if it was a higher saving. (I2)
Raymond: Yeah, I was going to say, seeing it is the CO2 emissions. I’ll speak for both of us, probably it’s not a driver. (I3)
CO2e avoided was not considered a reason to use the app for May either. When asked which of the three numbers (bags bought, money saved or CO2e avoided) would motivate them to use the app, she pointed to money saved as being most important
Um, oh, I, it, it [food waste] wasn’t important to me. It was more this, the benefit it would have for us financially as a family, if I’m honest, and the savings we would make on purchasing the food for the meals that we used it for. – May (I3)
May purchased the most surprise bags (n=17) out of all the participants in the trial, but CO2e avoided feedback was not a driver of this. Why does CO2e avoided feedback have such little impact on peoples’ behaviour? Some participants expressed not needing CO2e specific figure to know that they were doing something good for the planet by preventing food waste (Mills I2, Gauri & Chetan I2). But the explanation runs deeper than this. We can turn to another aspect of value (RQ1) by considering how CO2e avoided on the app was given such little meaningful attention.
CO2e Avoided Was Not Given Meaningful Attention
All participants were shown where their CO2e avoided feedback was in the app during the first interview. Participants were asked to select the “Me” section (later changed to “Profile”) of the app so they could see the location of the information they needed to self-submit. A typical interaction is outlined below:
I: This is the “Me” section, and when we send you through the self-report survey, it will basically say, “okay, can you go on the Too Good To Go app and click on “Me” and then report what it says on here.” (…)
Czarina: And here is the summary of how much I have, how much I spend, and the carbon footprint. (I1)
Therefore, it is not surprising that all participants stated they were aware of the personalised CO2e avoided feedback on the app. There is a difference, however, between knowing information is on the app and giving the data meaningful attention. Some participants did refer to checking their CO2e avoided when they used the app, but this centred on a casual interest in seeing the number change
I: And the CO2e saved – did you look at it at any other time than when I asked you to self-report the information?
Gauri: I think I looked at it again, just when I was using the app (…) but not because the number means anything to me. (…) I kind of was just interested in seeing it change. (I2)
For some participants, however, this data was not part of their experience of using the app at all. Returning to May, who amassed the most CO2e avoided (49kg) of all the participants
[In a two-person interview, asking the second person about their experience with the TGTG app]
I: How about you, May? [Did you look at the CO2e saved any other time?]
May: If I’m honest (laughs), I have no thoughts on it [CO2e avoided].
I: Well, it just wasn’t an important aspect of-?
May: No. (I2)
Given that the study design involved participants needing to check and report this data, we would expect our participants to give more attention to their personalised data than the average user of the TGTG app. The lack of attention indicated that it held very little meaning. This was reflective of a broader pattern. Participants generally ignored the “Me” section, where the personalised data was presented.
Only when I was probably first on the app to seeing what was there. Seeing where this information was, and then the next time when you asked me to report it (…) so it’s not something I would refer to a lot. (Mills I3)
The “Me” section is one of four tabs at the bottom of the app, alongside “Discover”, “Browse” and “Favourites”. The three latter tabs allow users to search for surprise bags. The “Me” section is siloed from the experience of searching and securing surprise bags on the app, as Isabel explains below
I never looked [at the “Me” Section] until like apart from the points where you asked me to, I didn’t look at the Profile bit because all I was interested in is it’s on a separate bit to the bit of like ‘What, what have you got going for me?’ (Isabel I2)
The design of the app meant people had less chance to engage with the personalised data. When participants did engage with the data due to the research design, they were sceptical of how it was calculated.
CO2e Avoided Was Confusing, Untrustworthy and Opaque
Despite low levels of attention to CO2e, participants did discuss the data during both interview 2 and 3. Their experience of CO2e avoided was confusing, untrustworthy and opaque – combining issues of truth (RQ2) and presence (RQ3). In part, this explains why the data was not considered particularly valuable (RQ1).
Confusion and Cynicism
Some participants outlined their confusion when it came to CO2e avoided. When Raymond (I3) referred to the CO2e figure, he referred to “CO2 emissions” rather than “CO2 equivalent.” Whereas Toby initially thought “that’s my CO2” (I1).
This can be linked to a lack of explanation on the TGTG app about how the figure was calculated.
You look at the number and go, well, really, can it be that? I’m not too sure. If there’s anything that at least allows me to sort of understand, okay, this is how we’ve estimated it and in the degree of confidence that there’s some rationality behind it, then maybe yeah but even then I’d find it a bit challenging because there’s so many variables involved, you can’t just easily put a number and go “I’ve picked this up.” – Chetan (I3)
During the same interview, Gauri explained that “every time I saw like how many carbon whatever I was saving, I was like, that’s bullshit (laughs). I just don’t believe the calculations for it” (I3). Participant’s cynicism and confusion was often rooted in disbelief of the veracity of the CO2e figures, based on the disconnect between their experience of picking up a TGTG bag and the CO2e avoided feedback.
Disconnect Between User Journey and Data
Some participants accepted that CO2e would be avoided by stopping food from going to landfill and producing methane (Isabel I2; Chetan I2 & I3). But most participants were keen to challenge the assumptions that were made to calculate the CO2e figure. TGTG failed to account for the variation in the contents of surprise bags (Mills I3). Even the same business would provide very different food. Below Verity outlines how this occurs at a bakery
The CO2 part I think is very ballpark to the point it’s not useful. Because they don’t know really what I’ve been given. You know, if I go to a bakery and they give me free items and one day, let’s say they’re three doughnuts, like just plain sugar glaze ring doughnuts and then the next time I go, there are three half baguettes that have got like seven types of meats and cheeses in them. One of them has a very different carbon footprint than the other. But do they [TGTG] know? (Verity I3)
This variation was linked to the practice of the particular food provider in selecting food for the surprise bag. Isabel describes:
Certainly, in Coop [a supermarket], they just go around, like, bunging things in a bag, so they’re clearly not logging it to say these are the things. And I don’t know enough about what happens when bread decomposes and how carbon intensive bread is, because there’s a lot of like bakery bread. (Isabel I3)
Isabel experienced seeing the TGTG bag being made. It did not match her expectations, hence creating distrust on how the CO2e avoided feedback was calculated. The TGTG model works on food providers having a large degree of flexibility when it comes to the content of the surprise bags. While such a process works well to monetise food that would go to waste, participants expected more monitoring of the bag contents to create accurate calculation of the CO2e avoided. As Gauri aptly puts it, “if it’s a surprise bag, how do they even know what I picked up?” (I2). It is not possible for the user to provide this information on the app, as Mills outlines:
I haven’t listed all the things that I’ve got from my surprise bag that time. It’s very much a finger in the air [i.e., guessing based on very limited information]. (Mills I3)
Hence there was a clear expectation that the CO2e avoided feedback would be linked to the specific contents of each surprise bag. When they perceived that there was no apparent link, they seemed to trust the data less.
The CO2e avoided figure also related to the actions of the person picking up the food. As Gauri emphasises, “you don’t actually know what happens once people pick it up” (I3). To collect a surprise bag, a user must travel to the food provider. As outlined by some participants, the app does not collect information about transport. Toby discussed in both the second and third interviews:
I did think a couple of times, when looking at the CO2. Yeah, but if, if I had driven to pick up this stuff, then your CO2 calculation ain’t the global picture, is it? ’Cause you’re saying I’ve saved CO2, I don’t know… I don’t know how they calculate it. But certainly if I’ve driven, I’ve burnt some CO2. (Toby, I2)
I can get the logic of it; I just don’t get that I have saved 19 kilos. Where? How? What? What were they assuming? that I drove there? I don’t know. I really don’t know how they get that. (Toby, I3)
The CO2e savings made by preventing food from going to landfill may be offset by driving to collect the bag itself. As Mills (I3) explained, “I’m in theory, I’m saving all this CO2 on the thing, but I’m just starting up my diesel car and driving to ALDI.”
- Filling in the Gaps of how CO2e avoided feedback is calculated
In the absence of information, participants developed their own understanding of the CO2e metric. One participant assumed the figure was based on miles travelled by the food (Raymond I2). Louise outlined their interpretation that the embedded CO2e in the food (from its production, transportation and storage) moves from the hospitality sector to the domestic setting in more detail
I think that’s more marketing, that data, what the icons mean, rather than they’ve made me go “oh, look, I’m saving CO2” because actually, that’s CO2 would have been…I know it’s saving stuff from landfill or from incineration or composting, but it’s moving CO2, it’s not getting rid of it. If you see what I mean? (Louise I2)
Louise’s interpretation reflects a high level of carbon literacy – tied to her professional background in “waste planning” (I1). But due to a lack of information within the app about CO2e saved, it is still an interpretation. We can observe a similar process for Chetan (I1), who discussed the CO2e avoided feedback with some confidence but – in lieu of the app providing it – were aware that they did not have access to enough information to make an informed interpretation. This highlights the need to communicate the method of calculating CO2e saved, otherwise users will use their varying levels of carbon literacy to make interpretations.
Contextualisation was key. Participants would place CO2e avoided within their existing experience of interacting with concepts of embedded carbon, CO2 and CO2e. Some participants talked about food in the first interviews: Isabel (I1) had visited a café where they “guesstimated the carbon footprint of the food”; Gauri (I1) discussed how they were signed up to Oddbox – a vegetable delivery service – partly due to “an analysis of the most carbon neutral” vegetable box.
But other contextualisation was not food related. Louise (I3) refers to the impact of investments within pension schemes on climate change – and how changing from one scheme to another can have a significant effect on an individuals’ carbon footprint. Referring to another context, Verity referred to comparing the CO2e figures on TGTG to a self-tracking app, Strava:
I use Strava for my cycling (…). If you log something as a commute rather than a like a workout, it gives you a CO2e figure as well. So, I know that like I think it’s 1.4, 1.5 kilos for each trip to work, and again for back from work. And this is just X to X basically when I cycle in, I think compared to a private vehicle sort of expected emissions. So, I know what my commute, it’s sort of there and back is like 3 kilos a day that I save by cycling rather than driving. So, I think that’s where my benchmark is on the figures. (Verity I2)
But other participants explained how they had not come across CO2e avoided in their day-to-day life (Toby, I2), which meant they struggled to contextualise the data they came across. As Mills (I3) outlined, “I don’t know what 5 kilogrammes of CO2e looks like, you know, what harm it would create or how many car journeys is it?”
By chance, the way the data was presented to the user was changed part way through the trial period. The original interface provided users with a single CO2e avoided figure in kilograms (kgs). The new interface presented the user with three types of data: CO2e avoided in kg, energy saved in kWh, and the equivalent actions that would use the energy saved (full smartphone charges, cups of hot coffee and time taking a hot shower). Participants outlined how they liked the new interface and how it did go some way to improving their understanding of CO2e, but the change had little impact on how much meaning or trust they gave the CO2e avoided feedback on the app. Both the extracts below are from interviews that occurred after the interface change.
“I guess it doesn’t mean very much. I know [that] with the update of the app, they’ve kind of changed it, so it’s now like… “it’s this many miles”” (Isabel I2)
“Well, under the CO2e one, it sort of rotates between giving [the data] in different ways to understand: ‘[oh yeah], that was interesting.’ I mean, I still don’t feel like I’m personally responsible for that [CO2e avoided], but that was interesting to see [the CO2e avoided feedback] in a format that was more relevant to me (…), in a more easy to understand way, really, for people like me (laughs).” (Tallulah I3)
The new interface allows users to convert the impact of collecting a surprise bag into everyday activities. But there are other ways that data can be contextualised, as discussed by Louise. She recognised that the app was trying to reinforce good behaviours, but criticised the lack of reference points for the user to comprehend the impact of activities.
The average family does however many tonnes of carbon a year and this food is only a small part of it. (Louise I3)
As she outlines above, a family’s activities will produce tonnes of carbon a year. When one surprise bag saves 2.7kg of CO2e, the scale is not properly contextualised alongside other activities.
Making Impact Data More Influential
From the analysis above, we can see that CO2e avoided in the TGTG app is not a success story. The metric is not considered valuable enough to influence usage of the app or be given meaningful attention and – given the perceived inaccuracies and lack of transparency – not particularly trustworthy as a piece of knowledge. Emerging from these discussions, however, were imagined alternatives to CO2e avoided. Through these testimonies, participants highlighted how impact data could be more valuable (RQ1) and just (RQ4) by shifting away from individualised CO2e avoided.
Is CO2e the Right Measure?
Some of the participants were keen to stress the intangibility of CO2e (Alchik, Czarina). During both the second and third interview, Alchik explained
To tell you the truth, it does not mean a lot. I know we’re talking about greenhouse gasses and things like that. But in terms of my personal experience, it means really nothing. It’s a theoretical concept, it’s not a living part of my experience. (Alchik I2) ***
I: What are your feelings when you see that number?
Alchik: It’s just a number, I’m afraid. Just a number. I don’t have feelings, so you know it’s a-, an abstract number. (…) you know, it’s not as if its making a tangible impact on my body or my health. (Alchik I3)
CO2e is a measure of global warming potential, relative to CO2. Whilst the impact of CO2e are tangible, namely in how people experience extreme weather conditions, the measure itself is not immediately relatable. Gauri and Chetan called for a change in how impact was presented to the user. They argued that size of food wasted items should be used, using “bins of food” as a measure (Gauri I3). Using this measure would allow individuals to conceptualise just how much food had been saved. The change in measure was combined with a re-thinking about how the individual fits within a broader set of users.
Disconnect Between the User and TGTG
For some participants, there was a recurrent tension between the impact of an individual user of the app and the impact that TGTG has in terms of food savings as a whole. Two participants felt that they were not really saving food from being wasted because of the high demand for TGTG bags – and therefore were not saving CO2e.
It feels like these are surprise bags that probably will be claimed by someone and therefore it doesn’t necessarily feel like, I, you know, I’ve actually really saved anything. (Isabel I2)
And also, had I not managed to get that surprise bag, someone else would have snapped it up, so I doubt that sushi would ever be wasted. It’s almost like you’re in luck, it’s your lucky day if you’ve managed to bag one, and that’s what they call it “You’ve bagged a surprise bag”, but yeah, you know, it almost doesn’t feel like that’s about food waste. That’s about getting a bargain. (Tallulah I2)
So, it’s either me or someone else, but it will be, it’s sort of, is good for the environment anyway. It just might be someone else doing it (…) maybe they’re telling you this information because some people will feel good that they’re responsible for that and not think any more about it. (Tallulah I3)
Due to the high competition users faced in securing bags, individuals could be fairly certain that someone else would buy a surprise bag if they did not. Therefore, users lacked agency in how they saved CO2e. This disconnect between an individuals’ experience and the work of TGTG as a whole was also outlined during a conversation between Gauri and Chetan about displacement of food
Chetan: And in the second scenario, they say, “enable surplice food to be safe for going to waste, thereby avoiding new food production.” Mhmm OK. Gauri: (Laughs)
Chetan: What is that? Avoiding new food production. That is a... It’s already been produced. It’s already being produced. What do you mean avoiding? (I2)
The CO2e numbers seemed so disconnected from the TGTG app users that Gauri (I2) discussed how the CO2e avoided feedback might not even be made for them, that the numbers seemed inflated to appeal to investors.
From Individual to Collective Action
Building on Gauri and Chetan’s conversation above, in theory, people using TGTG would reduce their demand from their regular food providers – having a knock-on effect for the production of food. For example, if 1000 users of TGTG bought three less items per week from the same supermarket, the supermarket would order less food and thereby reduce need for supply. But to the individual user, who is making a choice between purchasing a surprise bag or using something from their cupboard, a reduction in supply is not immediately apparent. Whether TGTG is reducing food production or not, the user does not experience food provision in this way.
To address this tension, Chetan and Gauri (I3) argued that the app should move away from being “hyper-individualised”, placing the individual within a community.
Gauri: So, like you might have taken one action but actually in total these number of actions have happened and so that figure of like how many bins of food collectively have been saved in your area, or in your postcode is, that would be because it feels like you’re like adding to additional efforts that other people have. That might motivate more of a kind of collective effort and I think might go beyond the slightly individualistic kind of reward that the app seems to add to it (…)
Chetan: Yeah, that’s a good idea actually. Yeah, if they can show that in terms of our postcode, for example (…) if it’s possible to have like an OX4 postcode level information on like how people are using the app, and how much food we’ve collectively saved, that would be quite powerful potentially, actually. I’d want to also tell people I know in the neighbourhood about the app, as well as a result saying “we’re doing this”, you know. (I3)
As Gauri outlines, this is being done elsewhere. She refers to Oatly, who consistently refer to the consumer as “one person who’s contributing to a larger set of people who are taking action” (I3). In doing so, TGTG can present the user with an intelligible measure of impact, a scale to the impact that feels substantial and positions the user as part of a collective action on food waste. Such a proposition chimes with the sentiment of participants who emphasised the need for structural change:
Because I think fundamentally the problem isn’t with the consumers. I think it’s with the whole food system. I’ve been pleased to see things initiatives like Wonky veg in the supermarkets. But a lot of these things require system change, not individual change. Yes, it’s good that consumers can see things and put pressure on because they understand a bit more, but I think we need system change. (Louise I3)
I mean, it’s difficult to enforce, but there should be no reason why any food that is edible should ever be thrown away. And if it’s not edible, you shouldn’t have ever let it get to the point it’s inedible, and whether that’s relationships with charities who can do a lot of the sort of grunt work on collecting and distribution and whatever. But yeah, it should be, whether it’s, I don’t know, penalties or higher taxes, I don’t know how you do it in terms of a mechanism or regulatory environment.” (Verity I1)
Moving away from individualised CO2e avoided feedback and towards more accessible impact data communicated at different levels from the individual to the collective may mean users personalised data is given more attention, understood better and more influential.
Conclusions
Overall, the point of CO2e avoided feedback on the TGTG app is unclear. Based on our participants’ experiences, the data is generally not meaningful, not trustworthy, not informative, and does not influence behaviour. We can unpack this experience by returning to Hoeyer and colleague’s (2024) framework and connecting the specific findings to the work on carbon footprint calculators. To do so, we have outlined the four aspects of data experience below, how they intersect and interact, and two potential cross-cutting themes.
Value. The data was not considered particularly valuable by participants, best highlighted in how little it influenced their usage of the TGTG app. The personalised CO2e avoided figure is designed to drive engagement with the app. For our participants, however, this was not achieved. In part, this was because participants could not contextualise the data within their existing activities. Research outlines that people generally struggle to rank the impact of different individual activities in terms of carbon emissions (Kretschmer, 2024), which means TGTG need to better contextualise the CO2e avoided figure. Their current approach of converting CO2e avoided into familiar daily activities is potentially misleading. Users are presented with a large number of cups of hot coffee or full smartphone charges, but this hides the relatively small impact of collecting a surprise bag on an individuals’ annual CO2e footprint.
It should be recognised here that our approach to value involved a narrower behavioural focus than existing research on carbon footprint calculators. The feedback on TGTG was designed to keep users on the app and purchase surprise bags. Carbon footprint calculators, on the other hand, present users with their CO2e and encourage broader pro-environmental behaviour changes.
Truth. The value given to the data was influenced by experiences of truth. A lack of transparency about how the CO2e avoided figure was calculated meant participants were often left confused and were thereby critical about the accuracy of the data – rejecting it as a valuable piece of knowledge. Confusion and criticism were articulated during the interviews as participants described gaps in understanding of the CO2e avoided figure in relation to their experience: participants would see their CO2e avoided figure increase by a fixed amount each time (2.7kg) but experienced high levels of variation in the contents of their surprise bag and factored in how they travelled to pick it up, which led them to deduce that the figure was inexact to an untrustworthy extent. An inability to account for such nuances has been documented in carbon footprint calculator research (Biørn-Hansen et al., 2022; Jack et al., 2024), with the work of Hedin and colleagues (2024) outlining how the public will focus on the type of food and its transportation when estimating the embedded CO2e.
Presence. Issues of presence were intertwined with questions of truth. In response to the certainty in which TGTG presented the CO2e avoided feedback, participants’ reactions ranged from frustration at the lack of transparency to a general disbelief in the claims being made. Whilst emotional reactions to CO2e have been documented in the literature, these accounts often centre on the hopelessness or guilt elicited by the results of carbon footprint calculators (Jack et al., 2024; Kok and Barendregt, 2021). The disconnect between what the data was attempting to describe and peoples’ embodied experiences led to an emotional reaction from participants. The way the data was used by TGTG struggled to connect with how participants sensed the world around them, remaining an abstracted, theoretical concept. Even the attempts to contextualise the figure often struggled to make CO2e avoided feedback relatable – chiming with previous research on carbon footprint calculators (Kok and Barendregt, 2021). Taken together, we can see how this interplay between truth and presence results in a distrust of CO2e avoided.
Trust is a potential cross-cutting theme identified by Hoeyer and colleagues (2024). Distrust of the CO2e avoided feedback cuts across issues of truth, presence and value in our study. Participants reacted with frustration and disbelief at the tension between the certainty of the personalised data presented to them and the variation in their experiences of actually collecting, consuming and wasting surprise bags. This sits in direct opposition to those arguing that numbers have a near magical hold over individuals (see Eriksson, 2023). Distrust underpinned a lack of value given to the data.
Right. A lack of trust in CO2e avoided underpinned the low value given to the data. But issues of value also stretch beyond trust. When we consider the ways that participants talked about making impact data more influential, we can see how value was also tied to what was considered right. Only presenting users with their individualised CO2e avoided was seen by participants as hiding the structural nature of climate change, chiming with previous work on carbon footprint calculators (Jack et al., 2024; Kok and Barendregt, 2021). In their opinion, understanding food waste through the lens of the individual consumer ignores the way individuals are set within the local, national and international structures – and how certain aspects of food waste, such as during production and distribution, are systematic issues.
Our findings go beyond affirming the value of Hoeyer and colleague’s theoretical framework, it actively develops the concept of data experiences in four ways. First, the site of quantification must be understood. There is a clear difference between health data experiences and climate change data experiences. Health has the potential to be known through personal (non-data-specific) experience and through data; health issues are deeply embodied but health risks can also be quantified. Climate change, on the other hand, cannot be known solely through personal (non-data-specific) experience. As Edwards (2013: 4) tells us “not even the most cosmopolitan traveller could perceive a global average temperature change of about +0.75c.” Yes, collecting, eating and wasting food is tangible but the CO2e avoided feedback linked to this process is only known through quantification. The way a topic is experienced – and the role of data in this – must be understood.
Second, we need to think about the intensity of the data experience. Hoeyer and colleague’s model focuses on a potential all-encompassing European health data system that allows individuals, researcher organisations, governments and medical professionals to access multi-national digital health data. Our focus is on specific feedback on a food waste app. The potency of our data experience is lower, which has knock on effects for the four issues. Let’s consider just one issue – presence. Yes, participants referred to disbelief and frustration when encountering the CO2e avoided feedback. But it is hard to imagine these emotions being more intense than those about the cross-national sharing of sensitive health about patients in Europe. Intensity is infused in all four issues of data experience.
Third, the medium and organisation of the data experience must be acknowledged. We focused on a profit-making entity communicating data via an app. Participants were generally aware that TGTG were motivated by profit – and would often have food on their app that could have gone to other existing organisations, such as food banks. Receiving CO2e avoided feedback in this way would be a different data experience than being presented the same information on a poster at a local, not-for-profit, community food pantry. How would does the motivation of an organisation at the heart of a data experience influence all four issues? How does the mode of accessing data, whether through an app or through a website, change the data experience? Scholars must pay attention to this.
Fourth, and finally, we can see how data experiences and information-related behaviour change research intersect. In our case, we interpreted value as tightly focused on the continued usage of the TGTG app. But for other data experiences, such as carbon footprint calculators, this would involve broader behaviours. Existing research points to the way information is emotive, discussed and set within practices (Middlemiss, 2018: 64; Shove, 2010: 1275; Hobson, 2003; Simcock, 2014; Hargreaves et al., 2010). But this work lacks an over-arching theoretical framework to bring these different elements together. Data experiences can be provide this – outlining how and why numerical information behaviour change interventions often fail.
Statements and Declarations
There are no conflicting interests to declare.
This work was supported by ERC Consolidator Grant #101003083 for the iDODDLE project (The Impacts of Digitalised Daily Life on Climate Change) and the Loughborough University School of Social Sciences internal funding scheme.
The Loughborough University Ethics Review Committee at Loughborough University approved our interviews (approval: 2023-16448-16399) on November 11, 2023. Respondents gave written consent for review and signature before starting interviews.
Consent to publish was obtained within the manuscript text. See Supplementary Information for document.
The data for this study can be made available upon reasonable request.
References
- Biørn-Hansen A, Katzeff C and Eriksson E (2022) Exploring the Use of a Carbon Footprint Calculator Challenging Everyday Habits. In: Nordic Human-Computer Interaction Conference, New York, NY, USA, 8 October 2022, pp. 1–10. ACM.
- Büchs M, Bahaj ABS, Blunden L, et al. (2018) Promoting low carbon behaviours through personalised information? Long-term evaluation of a carbon calculator interview. Energy Policy 120. Elsevier: 284–293.
- Burgess J, Albury K, McCosker A, et al. (2022) Everyday Data Cultures. Wiley.
- D’Ignazio (2020) Data Feminism. Cambridge, MA: MIT Press.
- Dósa K and Russ, RS. Making sense of carbon footprints: how carbon literacy and quantitative literacy affects information gathering and decision-making. Environmental Education Research 2020, 26, 421–453. [Google Scholar] [CrossRef]
- Dreijerink L and Paradies G (2020) How to reduce individual environmental impact? A literature review into the effects and behavioral change potential of carbon footprint calculators. Available at: www.tno.nl (accessed 31 October 2024).
- European Commission (2019) Special Eurobarometer 490. Report. Climate Change.
- Franconeri SL, Padilla LM, Shah P, et al. (2021) The Science of Visual Data Communication: What Works. Psychological Science in the Public Interest 22(3). SAGE Publications Inc.: 110–161.
- Gram-Hanssen K and Christensen, TH. Carbon calculators as a tool for a low-carbon everyday life? Sustainability: Science, Practice and Policy 2012, 8, 19–30. [Google Scholar] [CrossRef]
- Hedin B, Blomqvist AG and Menon AR (2024) Engaging Environmental Learning: A Tangible Approach for Conveying Environmental Data in Education Using Weight. In: Proceedings of the Eighteenth International Conference on Tangible, Embedded, and Embodied Interaction, New York, NY, USA, 11 February 2024, pp. 1–6. ACM.
- Hedin B, Pargman D, Blomqvist A, et al. (2024) Interacting with Environmental Data: Utilizing Weight as a Medium in Enhancing Carbon Literacy. In: IMX 2024 - Proceedings of the 2024 ACM International Conference on Interactive Media Experiences, 7 June 2024, pp. 429–431. Association for Computing Machinery, Inc. Available at: https://dl.acm.org/doi/10.1145/3639701.3661085 (accessed 12 November 2024).
- Hoeyer K, Green S, Martani A, et al. Health in data space: Formative and experiential dimensions of cross-border health data sharing. Big Data & Society 2024, 11.
- Jack T, Bååth J, Heinonen JT, et al. (2024) How individuals make sense of their climate impacts in the capitalocene: mixed methods insights from calculating carbon footprints. Sustainability Science 19(3). Springer: 777–791.
- Kaufman M (2024) The devious fossil fuel propaganda we all use | Mashable. Available at: https://mashable.com/feature/carbon-footprint-pr-campaign-sham (accessed 12 November 2024).
- Kennedy H and Hill, RL. The Feeling of Numbers: Emotions in Everyday Engagements with Data and Their Visualisation. Sociology 2018, 52, 830–848. [Google Scholar] [CrossRef]
- Knox H. Doing place through data: Proliferation, profiling and the perils of portrayal in local climate action. Big Data & Society 2024, 11.
- Koetsenruijter, W. Using Numbers in News Increases Story Credibility. Newspaper Research Journal 2011, 32, 74–82. [Google Scholar] [CrossRef]
- Kok AL and Barendregt W (2021) Understanding the adoption, use, and effects of ecological footprint calculators among Dutch citizens. Journal of Cleaner Production, 326. Elsevier: 129341.
- Kretschmer, S. Carbon literacy – Can simple interventions help? Effect of information provision on emissions knowledge of private households. Energy Policy 2024, 188, 114060. [Google Scholar] [CrossRef]
- Lawson BT and Lugo-Ocando, J. Political communication, press coverage and public interpretation of public health statistics during the coronavirus pandemic in the UK. European Journal of Communication 2022, 37, 646–662. [Google Scholar] [CrossRef] [PubMed]
- Lawson BT, Chadwick A, Hall N-A, et al. The trustworthiness of peers and public discourse: exploring how people navigate numerical dis/misinformation on personal messaging platforms. Information, Communication & Society 2024, 1–18.
- Lee B, Liu J, Choung H, et al. Framing Risk with Numbers: The Framing Effects of Risk Assertions and Number Formats on Emotions and Risk Perceptions. Mass Communication and Society 2019, 22, 344–364. [Google Scholar] [CrossRef]
- Lindrup MVA, Menon AR and Biørn-Hansen A (2023) Carbon Scales: Collective Sense-making of Carbon Emissions from Food Production through Physical Data Representation. In: 10 July 2023, pp. 1515–1530. Association for Computing Machinery (ACM). Available at: https://dl.acm.org/doi/10.1145/3563657.3596043 (accessed 12 November 2024).
- Luo Y, Hanson-Wright B, Dowlatabadi H, et al. (2023) How does personalized feedback on carbon emissions impact intended climate action? Environment, Development and Sustainability. Springer Science and Business Media B.V.: 1–15.
- Lupton D, Pink S, Labond CH, et al. Personal Data Contexts, Data Sense, and Self-Tracking Cycling. International Journal of Communication 2018, 18, 647–665. [Google Scholar]
- Mulrow J, Machaj K, Deanes J, et al. (2019) The state of carbon footprint calculators: An evaluation of calculator design and user interaction features. Sustainable Production and Consumption 18. Elsevier: 33–40.
- Muñoz-Leiva F, Climent-Climent S and Liébana-Cabanillas F (2017) Determinants of intention to use the mobile banking apps: An extension of the classic TAM model. Spanish Journal of Marketing - ESIC 21(1). No longer published by Elsevier: 25–38.
- Neff G and Nafus D (2016) Self-Tracking. Cambridge, MA: MIT Press.
- Nord I (2018) Reducing Greenhouse Gas Emissions Through the Use of Free Shops. Available at: https://www.diva-portal.org/smash/get/diva2:1223835/FULLTEXT01.pdf (accessed 12 November 2024).
- Peters E (2020) Innumeracy in the Wild: Misunderstanding and Misusing Numbers. Oxford: Oxford University Press.
- Stonell L (2024) Q&A: Sophie Trueman, Too Good To Go.
- Sutcliffe M, Hooper P and Howell R. Can eco-footprinting analysis be used successfully to encourage more sustainable behaviour at the household level? Sustainable Development 2008, 16, 1–16. [Google Scholar] [CrossRef]
- Timmons S and Lunn P (2022) Public understanding of climate change and support for mitigation.
| 1 | We used a broad definition of a food bank to include any place that stocks food provisions – often donated by organisations – that people can collect for free or a small fee. In Oxford, these were called food banks, food pantries and food larders. |
Disclaimer/Publisher’s Note: The statements, opinions and data contained in all publications are solely those of the individual author(s) and contributor(s) and not of MDPI and/or the editor(s). MDPI and/or the editor(s) disclaim responsibility for any injury to people or property resulting from any ideas, methods, instructions or products referred to in the content. |
© 2025 by the authors. Licensee MDPI, Basel, Switzerland. This article is an open access article distributed under the terms and conditions of the Creative Commons Attribution (CC BY) license (https://creativecommons.org/licenses/by/4.0/).
Copyright: This open access article is published under a Creative Commons CC BY 4.0 license, which permit the free download, distribution, and reuse, provided that the author and preprint are cited in any reuse.


