Submitted:
07 April 2025
Posted:
08 April 2025
You are already at the latest version
Abstract
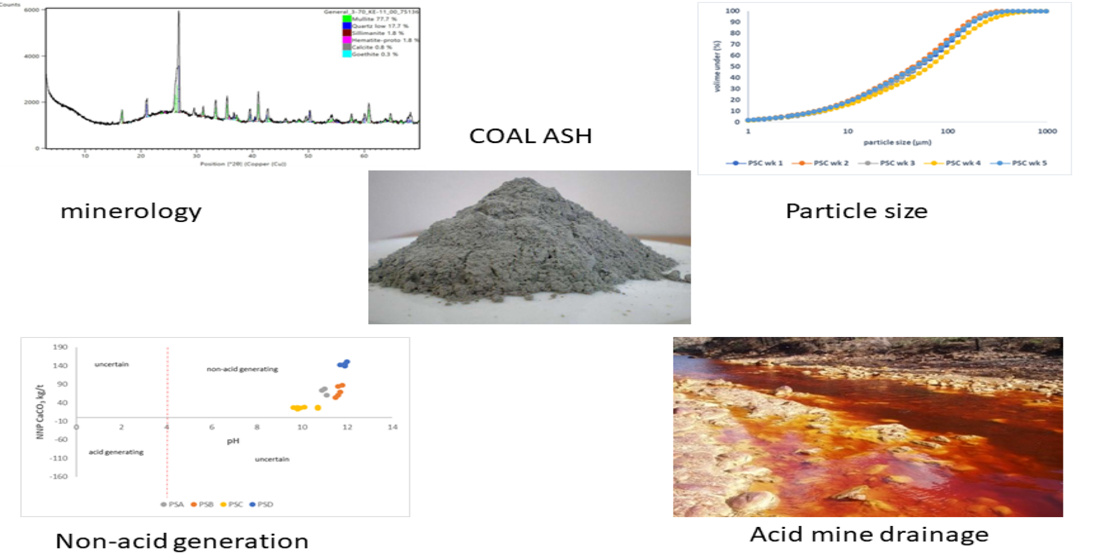
Coal incineration for power generation in South Africa generates an average of 25 Mt of coal ash annually, with only 7 % being utilised, hence there is growing advocacy for coal waste utilisation. A multi-technique approach was used to analyse the variability of coal fly ash and legacy coal ash, assessing its suitability for acid mine drainage remediation. Legacy coal ash samples were collected from 3 South African power stations and cola fly ash samples from the fourth power station. The variability studies were carried out in 3 phases, i.e. daily, weekly, and monthly to assess if there are any significant changes in the physical and chemical properties of the coal ash over time. All the samples were classified as Class F, having a SiO2, Al2O3, and Fe2O3 wt. % of > 70 %. The highest net neutralising potential (NNP) value of 151 CaCO3 kg/t was obtained over a coal fly ash sample, while 87.1, 77.9, and 30.3 CaCO3 kg/t were the highest obtained from each of the three respective power stations where legacy coal ash was sampled. The acid neutralising properties of legacy coal ash, coupled with its good civil engineering properties, make it a feasible option for use as a reactive barrier or mine backfilling material for acid mine drainage treatment.
Keywords:
coal fly ash
; variability
; legacy coal ash
; remediation
; reactive barrier
; acid mine drainage
; charaterisation
; net neutralizing potential
; XRD
; particle size distribution
1. Introduction
The economy of South Africa largely rests on the mining industry, which is energy-intensive. On the other hand, population growth results in increased domestic demand for electricity. At the present moment 77 % of the power produced by the country's power utility, Eskom, is generated from coal-powered stations. Globally the country is rated as the 7th electricity producer and ranked 5th as a coal-producing country. The power utility produces about 95 % of all the power used in the country and two-thirds of all the power produced in the whole continent of Africa [1]. Coal incineration for power generation results in the production of vast amounts of coal ash. The coal ash can be sub-divided into two categories, namely; coal bottom ash (CBA) and coal fly ash (CFA). The CFA is made up of non-combustible mineral matter found in coal and it is mostly composed of silica, alumina, and iron oxides [2]. It is composed of hollow, glassy particles enriched with Ca, K, Na, and several other trace elements such as As, B, Mo, Se, and Sr [3]. The particle size of the CFA is usually in the range of 10 – 100 microns. The ash that is gathered in the lower part of the furnace is composed of coarse particles and is referred to as coal bottom ash. The CBA is similar to CFA in chemical composition but it is heavier and contains unburnt coal, and hence contains higher levels of carbon content. Furthermore, CBA differs from CFA in particle size and mineralogy. Bottom ash particles are much coarser, with size ranching from fine sand to grave with a maximum order of 12 mm [4].
The CFA makes about 70 – 80 % of the total ash wastes, with the remaining 10 – 20 % being CBA [5]. Globally, only about 20 % of the coal ash is utilised while the remaining 80 % is disposed of in landfills [6]. The utilisation of both CBA and CFA can solve the storage constraints faced by power stations and consequently avert the environmental issues associated with coal ash. However, their usage is chiefly governed by their respective physical and chemical properties. Generally, CFA has been used in numerous applications including; soil amelioration, the construction industry, the ceramic industry, catalysis, environmental protection, zeolite synthesis, and valuable metal recovery. The suitability for use in these applications is based on the physico-chemical properties of CFA which include; cementitious or pozzolanic properties, low bulky density, small particle size, higher water holding capacity, alkalinity, high SiO2 and Al2O3 content, and availability of variable metal oxides [7]. On the other hand, CBA utilisation has been mostly restricted to the construction industry due to its good engineering properties in terms of free draining, granular, lightweight, high permeability, and interlocking nanostructures [6,8]. Based on these properties CBA has also been used in agriculture and manufactured soil products. There is also a huge potential for CBA for use in concrete products, aggregate replacement, embankment fill, road construction, zeolite synthesis, and reclamation work.
There have been considerable strides in the utilisation of CFA and its usage is expected to increase, on the other hand utilisation of CBA is still much restricted to the construction industry [7,9]. In South Africa many power stations are running out of coal storage space and it is imperative to develop new ways of coal ash utilisation. The coal ash which is disposed in ash dumps is usually a mixture of CFA and CBA and is referred to as legacy coal ash (LCA). It comprises of approximately 80 % CFA and 20 % CBA. One of the most interesting applications of LCA would be in the neutralisation of acid mine drainage, based on the high acid neutralising potential of CFA and excellent civil engineering properties of CBA. The CBA offers unique drainage, porosity, permeability and better civil engineering properties relative to CFA, it can be well suited for the construction of reactive barriers used in the treatment of acid mine drainage [9]. In addition, CBA has been used as an adsorbent due to its excellent efficacy in inorganic and organic pollutant removal. CBA has been successfully used in the removal of Fe(II), Mn(II), Cu(II), and Zn(II) via adsorption and metal hydroxide precipitation [10,11]. On the other hand, several studies reported the application of CFA in the neutralisation of acid mine drainage [12,13,14].
The current work aims to assess the variability of LCA over time as it is collected from the furnaces at 4 different power stations in South Africa. Knowledge of the LCA variability would therefore fast track the application process and provide options to increase its usage. This study is undertaken to provide a clear understanding of the LCA variability over time, i.e., hourly, weekly, and monthly variation in both physical and chemical properties. This will be essential in deciding the most appropriate LCA sample for any chosen application. Individually, CFA has been applied more relative to LCA, and a bibliometric and scientometric analysis on the utilisation of these ashes attests to that.
Bibliometric & Scientometric Analysis
A bibliometric and scientometric analysis was carried out to evaluate the publication output over the past 10 years based on the keywords; coal fly ash/legacy coal ash, utilisation, and variability. The scientometric analysis aimed at determining the frequency of co-occurrence of these keywords to have an idea of how much research outputs were generated over the last 10 years globally (2014 – present). The data search was accessed on the 28th of November 2024. Table 1, presents the bibliometric data generated from Scopus database based on three keywords: coal fly ash, utilisation & variability. Table 2, presents the data search results for the keywords; legacy coal ash, utilisation & variability. The data search included journal articles, chapters, conference papers, reviews, and conference review papers. The top 3 subject areas, the top 5 countries, and the article output from South Africa are also presented for both CFA and LCA. It however has to be noted that not all works based on LCA variability are indexed in the Scopus database, so those are not accounted for in this bibliometric analysis.
The data presented in Table 1, shows that there has been a significant output in terms of research articles based on CFA. The search based on the keyword coal fly ash yielded 9822 search results, and upon filtering the search results to limit search results to articles with keywords, coal fly ash, and utilisation, 5887 search results were generated. Only 184 search results were obtained on searching for articles based on the three keywords, coal fly ash, utilisation, and variability. China produced the majority of the articles totalling 3977 articles. South Africa recorded only 2 articles based on the three keywords. This attests to the fact that very little work was carried out on variability studies on coal fly ash. Comparatively, the studies on the utilisation and variability of CFA were much higher than that of LCA. The search results for the utilisation and variability of LCA are presented in Table 2.
The data presented in Table 2, shows that a total of 29 articles were obtained based on the keyword, legacy coal ash. Filtering the search results based on the keywords legacy coal ash and utilisation, 11 search results were obtained, and only 1 search result was generated upon filtering using all the 3 keywords (legacy coal ash, utilisation & variability). The United States produced the highest number of articles over the last 10 years. From the search results based on the three keywords, no articles were produced from South Africa despite the huge dependence on coal incineration for power generation. This is indicative of the fact that minimal research has been conducted on the utilisation and variability of South African LCA. More research on LCA variability may enhance its usage for various potential applications. Understanding the variability, and potential application of LCA is perceived as a strategic global plan for encouraging waste utilisation and reduction in the dependence on natural aggregates in the construction industry [15]. Furthermore, a scientometric analysis of the search data generated based on these three keywords was conducted and a keyword co-occurrence analysis was obtained. The data analysis was performed using a scientometric analysis software VOSviewer.
The keywords co-occurrence analysis reflects the research hotspots [16]. Figure 1 (a), presents a keyword co-occurrence cluster view based on the search results generated using the keywords; legacy coal ash and variability, while Figure 1(b) presents the cluster generated based on the keywords; legacy coal ash and variability. The first set (legacy coal ash + utilisation) generated a total of 254 keywords, and those with a minimum co-occurrence of 2 were selected leaving a set of 31 keywords which were then used to generate the cluster. It should be noted that the cluster was based on all keywords, which includes both the authors' keywords as well as the indexed keywords. In the second cluster (legacy coal ash + variability) a total of 28 keywords were obtained with a minimum occurrence of 1. In the clusters, the node area and font size correspond to the weight value of the keyword. The higher the frequency of occurrence of a keyword, the larger the node and font. The thickness of the line linking a set of keywords depicts how often the two keywords appear together in articles. It again can be deduced from the clusters (Figure 1(a) and (b) that there were no significant links between the keywords; legacy coal ash, utilisation, and variability. This further signifies the fact that there has been minimal work done with regard to the research area.
Figure 1(a).
VOSviewer keyword co-occurrence clustering view based on the keywords; legacy coal ash and
utilisation.
Figure 1(a).
VOSviewer keyword co-occurrence clustering view based on the keywords; legacy coal ash and
utilisation.
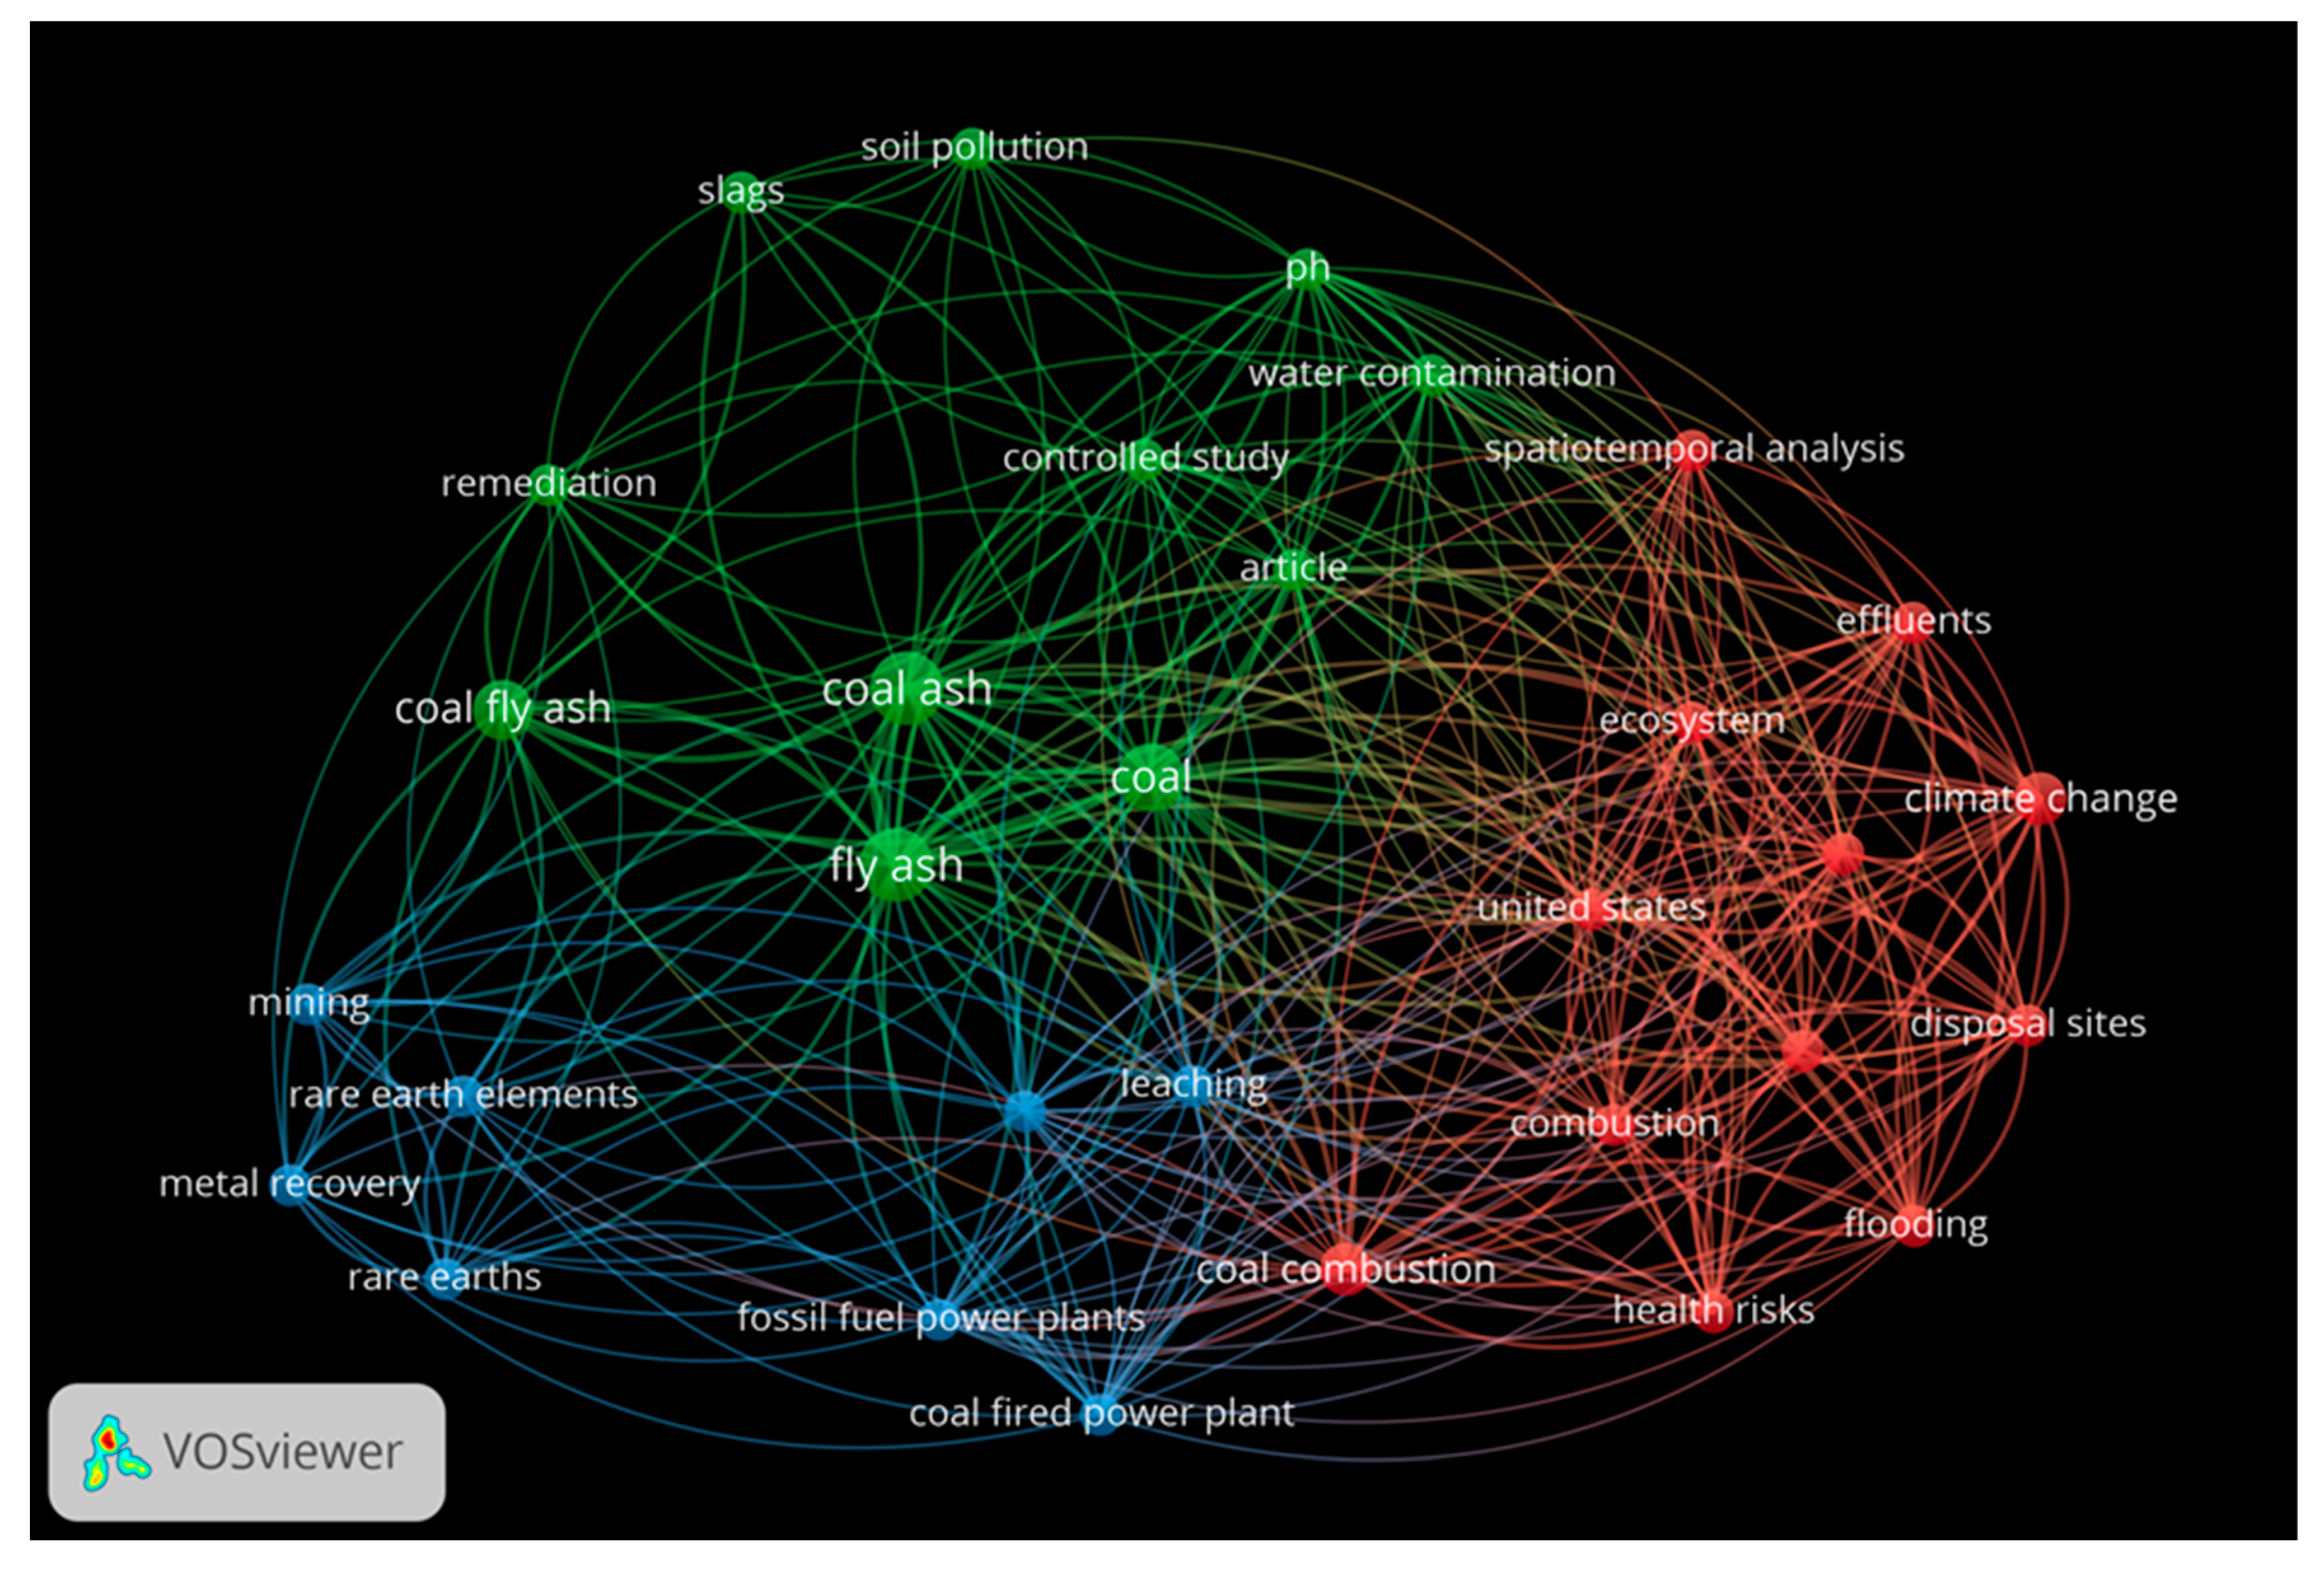
Figure 1(b).
VOSviewer keyword co-occurrence clustering view based on the keywords; legacy coal ash and variability
Figure 1(b).
VOSviewer keyword co-occurrence clustering view based on the keywords; legacy coal ash and variability
2. Materials and Methods
The sampling of LCA was commenced in December of 2021 at four (4) power stations in South Africa namely; power station A (PSA), power station B (PSB), power station C (PSC), and power station D (PSD). It should be noted that the samples collected from PSD were CFA and not LCA. These power stations have high priority regarding the utilisation of their ash to reduce the ash disposal footprints at the power stations. The samples were collected from the conveyor belt as run-of-station ash. The sampling was conducted on an hourly basis for one day and the samples collected were analysed for elemental, mineral composition, particle size distribution, and acid neutralisation analysis. The data was compared for all the four stations sampled.
Further variability studies were conducted over a longer period in 2022. The first set of these samples were collected from PSC and PSA power stations. The sampling was done every week for five (5) weeks in June and July of 2022. A second set of variability data was also collected from the two power stations for monthly variability studies. The samples were collected in the months of June, July, August, and September of 2022.
Characterisation
The elemental composition of the ash samples was analysed using XRF spectrometry (Thermo Scientific, ARL ADVANT'X), and the mineralogical composition was performed using XRD (PANalytical Empyrean diffractometer) equipped with X’Celerator detector and fixed slits with Cu-Kα radiation. The phases were identified by using X'Pert Highscore plus software. The particle size distribution was determined using a (Malvern Panalytical, Mastersizer 3000) laser diffraction particle size analyser.
Acid-Base Accounting: The Acid-Base Accounting (ABA) analysis was done via a static test which assesses the potential of a rock/solid material to produce or neutralise acid. The analysis was done based on the classical method of Sobek et al, with modification of Lawrence, as presented in Lawrence & Wang [17,18,19]. The method is based on the quantification of the following components:
- Acid Generating Potential (AGP) – (this test determines the amount of acid that could potentially be generated by the rock/solid material). The AGP was calculated using the formula:
AGP = 31,25 x %Ssulphide (kg CaCO3/tonne)
*With Sulphur content determined by gravimetric precipitation of BaSO4
- Acid Neutralisation Potential (ANP) – (this test determines the amount of acid that could potentially be consumed by the rock/solid material). The ANP determination was done based on the Fizz Test as described by [17]. A finely ground sample of the LCA, was acid digested using excess HCl under boiling conditions. Upon cooling the mixture, the acid remaining in the pulp was titrated using NaOH to a pH of 7, and the amount of acid consumed was determined. This quantity was then expressed in units of kg CaCO3 per tonne of LCA sample.
- Net Acid Generation (NAG) Potential – (this value is obtained by subtracting the ANP from the AGP). A positive value indicates potentially acid-forming rock whereas a negative value indicates potentially non-acid-forming rock. Vice versa this is the Net Neutralising Potential (NNP) of the rock.
*Rock material with an NNP of less than zero kg CaCO3 per ton will theoretically have a net potential to produce acidic leachate. Rock material with an NNP higher than zero kg CaCO3 per ton will theoretically have a net potential to neutralise acidic leachate.
3. Results and Discussion
3.1. Elemental Composition
The elemental composition of the ashes was analysed using X-Ray Fluorescence spectrometry (XRF). Samples of LCA collected from PSA and PSB were analysed alongside CFA samples collected from PSD power station. In all the analysed samples the major elements (as oxides in weight %) were SiO2 and Al2O3. The minor oxides detected in the samples (both LCA & CFA) in the order of their respective relative abundances were; CaO > Fe2O3 > TiO2 > P2O5 > K2O > Na2O. The typical elemental composition of the LCA samples collected from PSA power station is presented in Figure 2.
Overall, there was minimal variation in both the major and minor elements with time, and this observation was consistent in all the other tested samples. SiO2 and Al2O3 were the predominant elements, with a total percentage composition of > 70 % at any given time throughout the sampling.
There were slight variations in the elemental composition over the sampling period for both the PSD (CFA) samples and the other LCA samples. These outcomes were expected due to the low proportion of inorganic elements that volatilise during the combustion of South African feed coals [20]. Collins at al., reported on the elemental composition of a blend of South African coal ashes and the wt. % ranges were; CaO (1.5 – 13), Fe2O3 (2.0 – 5.7), TiO2 (1.3 – 1.8), P2O5 (0.1 -0.3), K2O (1.1 – 16.1) and Na2O (0 – 0.1) [21]. In other related studies on the elemental composition of South African coal ashes (Van Dyk et al., and Matjie et al, are consistent with the observations made in this study [22,23]. Averages of the elemental composition wt. % of the tested ashes are presented in Table 3.
Thus, according to the ASTM C618 specification, the LCA and the CFA are compliant with pozzolanic material class F, siliceous ash; (sum of SiO2, Al2O3, and Fe2O3 should be > 70 %). There are very slight variations in the composition of the LCA over time, for instance the sample collected from PSA power station; the average percentages were 87.59, 88.51, and 88.28 % for daily, weekly, and monthly variations respectively. These slight variations are attributed to the fact that coal is inherently heterogeneous and even though the coal might have been coming from the same mine variations would be expected. The exact composition of the LCA is influenced by several factors namely; raw coal source, particle size, type of coal burner, and the operating conditions of the burner, which differ with each power station, thus the differences in the elemental composition of ashes from different stations [24]. Rafieizonooz et al., reported on the composition of Malaysian CBA and CFA and the total wt. % of SiO2 + Al2O3 + Fe2O3 was 83.24 % and 78.82 % respectively [25]. Other previous studies on CFA and CBA elemental composition reported comparable outcomes for the CBA and CFA elemental composition [11,26,27]. In some of the studies, the CaO wt. % composition was lower than that of Fe2O3, contrary to the observation made in this study, for instance, Rafieizonooz et al., reported the CaO and Fe2O3 in Malaysian CBA to be 8.7 % and 19.84 % respectively, while Sanjith et al., reported the CaO and Fe2O3 in Indian CBA to be 7.44 % and 4.29 % respectively [25,29]. The ratio of CaO : Fe2O3 may also be influenced by the fact that some of the power stations especially in Europe, America, and Asia use washed coal for power generation. Coal washing reduces the amount of pyrite in the coal and hence the amount of Fe2O3 produced in the resultant ash. It should be noted that Eskom, the South African power utility uses feed coals that typically consist of a fraction of washed coal and a high-ash discard. In some instances, unwashed run-of-mine coal or de-stoned coal can be part of the mix [29]. Despite this, variations of LCA composition are to be expected since the composition is largely influenced by the source and nature of the incinerated coal.
3.2. Mineral Composition
Peaks due to mullite, quartz, sillimanite, and haematite were clearly visible in the XRD patterns obtained for both the CFA and LCA samples tested. These mineral phases are characteristic of class F material [30]. Both diffractograms presented in Figure 3(a) and (b) were characterised by a broad hump centred at 26.5° 2θ which attests to the presence of amorphous material in the tested samples [31]. In some samples, minor fractions of leucite, magnetite, dolomite, and limenite were detected. In the tested samples there was minimal variation in the mineral phases with time, in all the samples analysed. The silica and aluminosilicate, mineral phases formed are governed by 3 major factors, namely: (i) how reducing or oxidising is the environment in which they are formed, (ii) the presence of rare elements. In power stations and boilers where the atmosphere is reducing there is a tendency towards the formation of quartz, magnetite, and mullite. Furthermore, the distribution of these mineral phases ought to change with temperature changes [32,33].
Generally, the mineral matter that makes up coal consists of pyrite (cubic FeS2), kaolinite (Al2Si2O5(OH)4), and calcite (CaCO3). Other common minerals include marcasite (orthorhombic FeS2), chalcopyrite (CuFeS2), arsenopyrite (FeAsS), stibnite (Sb2S3), gypsum (CaSO4·2H2O), quartz (SiO2), dolomite (CaMg(CO3)2), apatite (Ca5(PO4)3F) and mica. Thus, the quartz in the diffractogram of both the CFA and the LCA is due to its natural occurrence in coal [34]. Pure quartz particles can enter the gasifiers and boilers and resist phase transformation even at temperatures of ± 1200 °C [35]. Phase transformation of kaolinite (naturally occurring in coal) at these temperatures is responsible for the formation of mullite. It is also possible for mullite to crystallise from molten solution due to the reactions of kaolinite with fluxing minerals (i.e. dolomite, calcite, and pyrite) [20]. Another mineral phase which was detected in both the tested CFA and LCA was sillimanite, which is one of the polymorphs of Al2SiO5. At temperatures above 1200 °C, sillimanite is transformed into mullite, with complete mullitisation occurring at the temperature range 1500 °C - 1600 °C [36,37]. The mullite formation occurs in accordance with the reaction: (3Al2O3 + 2SiO2 → 3Al2O3·2SiO2, ΔG = −24.06 kJ/mol, 1200 °C).
Some minor minerals were detected in the CFA sample such as lime, clinopyroxene, and magnesioferrite. The presence of lime is due to the high-temperature decomposition of calcite (and maybe gypsum) present in coal [34]. Magnesioferrite is produced when ankerite Ca(Fe2+,Mg)(CO3)2 (one of the dominant carbonate minerals in coal) is heated to temperatures of about 1000 °C. The breakdown of ankerite also results in the formation of periclase and calcite ([38,39]. Clinopyroxene is formed by the reactions between SiO2, Al2O3, Fe2O3, and CaO at temperatures below 1200 °C. The ratio of CaO : Fe2O3 may influence the formation of the mineral phase, and higher ratios favour the formation of clinopyroxene [40]. Typical plots for the variation of major mineral phases over a period of 24 hours are presented in Figure 4(a) PSB power station LCA samples (b) PSD power station CFA samples.
Throughout the 24-hour sampling period, the PSB (LCA) samples had mullite as the most abundant mineral phase. Hematite was relatively low in all the tested samples ranging from 1.7 to 5.7 wt. % over the sampling times. Sillimanite was generally low apart from the sample taken at 10:00 where there was 35.1 wt. % alongside a reduced amount of 45.9 wt. % of mullite. This may be attributed to the temperature swings that occur in some regions of the boiler. Temperatures below 1200 °C are associated with the presence of mullite and sillimanite will appear as the temperature goes above 1200 °C. Further evidence to indicate that the boiler temperature at the time of sampling was lower than 1200 °C, is the existence of aragonite which thermally decomposes at 1000 °C. The mineral composition of aragonite is not presented in Figure 4(a) but was detected in the tested sample. It also has to be noted that the presence of aragonite suppresses the formation of mullite by reducing the ash fusion temperature, thus the lower wt. % of mullite detected in the sample [41]. The same sample also had the highest wt. % of quartz, and this could be attributed to the decomposition of muscovite which occurs at temperatures around 850 °C (muscovite is formed from the initial kaolinite present in coal). Furthermore, the ashing temperature for coals is 815 °C and at this point, the ash composition is dominated by simple oxides and quartz levels are at their maximum [42].
The mineral composition analysis of PSD Power Station coal fly ash indicated that sillimanite, quartz, and hematite minerals were present in all sampled time intervals. Interestingly, mullite was present for most of the sampling intervals except for those in which sillimanite was > 50 % (i.e., time – 12:00 and 13:00). This again can be attributed to the temperature dependence of the sillimanite-mullite phased transformation. Low levels of hematite, lime, and magnesite were detected in the sample. Generally, the major mineral phases and their relative abundances in the tested samples were comparable and the variation of these mineral phases were largely due to the temperature variation of the boilers, in addition to the heterogeneity of the coal itself. The averages of the mineral composition of the ash samples collected from the four power stations are presented in Table 4.
A comprehensive analysis of the variability of the PSC and PSA power stations ash types was carried out over much longer periods; firstly, over 5 weeks taking samples every week, and secondly over a period of 4 months. The weekly samples were collected in June/July and the monthly samples were collected in June, July, August, and September of 2022. The mineral variations are presented in Figure 5 and Figure 6.
Generally, the order of mineral relative abundance followed the order mullite > quartz > sillimanite > hematite. In some samples, magnesite and lime were detected. The trends for both the weekly and monthly variations are also comparable. The temperature variation and coal inhomogeneity can be ascribed to be the chief governing factors in determining the variation of these major ash minerals. This is in addition to the fact that the chemistry and mineralogical composition of the incinerated coals at the different power stations would differ. A summary of the variations of these minerals in the tested samples is presented in Table 5.
The wt. % mean values for mineral phases for weekly and monthly data sets were comparable for each respective LCA sample. The highest standard deviation recorded was 5.19 for mullite in the PSA (LCA) samples with hematite having a low standard deviation of < 2 in all samples over the weekly and monthly variation analysis. In a study on the mineralogy of Brazilian coal ashes, Silva et al., analysed 7 samples of CFA and CBA and the mineral phase wt. % range in CFA was; quartz (17.02 – 44.55 %), and mullite (60 – 69.7 %) [43]. With the CBA samples, the ranges were; quartz (31.44 – 41.89 %), mullite (55.56 – 69.82 %), and hematite (0 – 0.3 %). Generally, the mineralogy of the tested samples is consistent with numerous other studies on CBA and CFA [44,45,46].
3.3. Particle Size Distribution
The particle size distribution of the coal ashes collected from four different power stations was analysed and Figure 8 shows the PSD (CFA) and PSB (LCA), Dv(10), Dv(50), and Dv(90) plotted against time for the samples collected over 24 hours. The PSD (CFA) had a consistent particle size distribution over the sampling period. The LCA sample showed some slight variation, and the same was observed with the other two LCA samples (PSA and PSC).
As expected, the CFA had a lower particle size distribution, in comparison to the LCA sample, the mean Dv(50) values were 24.15 µm and 30.62 µm for the CFA and LCA respectively while the mean specific area was 864.44 m²/kg and 532.04 m²/kg. Guan et al., reported on the particle size distribution of LCA samples collected from 4 power stations in China and the Dv(50) values ranged from 9.28 – 28.47 µm [47]. In the same report, a sample of CFA was also analysed and the Dv(50) value was 19.07 µm. These values are also consistent with those reported by Kim & Do, on the analysis of Korean CFA and CBA [48]. The variation of the particle size distribution of LCA over 5 weeks and over 4 months was done with the PSA and PSC samples and is presented in Figure 8. The particle size distribution curves show that all samples had good continuity and minimal variations over the respective sampling periods. There however was some noticeable variation in the weekly samples collected from PSA, but each of the samples exhibited good continuity. Rafieizonooz et al., reported the particle size distribution of Malaysian CFA and CBA, and the CFA particle size range was 0.5 µm – 250 µm, while the CBA range was 7.5 µm – 1320 µm [25]. The data obtained in this study is within the ranges reported. Similar profiles for CBA particle size distribution were obtained by [47,49,50].
The particle size analysis for both the CFA and LCA samples revealed that the grains are predominantly made up of clay, silt and sand sized particles. The average daily, weekly and monthly uniformity coefficient (Cu) and coefficient of curvature (Cc) for the coal ash samples are presented in Table 6. The (Cu) and (Cc) were computed using expression (i) and (ii) respectively.

The PSD coal fly ash, the PSC and PSA coal legacy ash samples fell within the sand-well graded class (Cu > 6 and 1 < Cc < 3), with only the PSB coal legacy ash samples falling in the gravel-well graded class (Cu > 4 and 1 < Cc < 3). The ash classes remained consistent over the sampling periods, daily, weekly and monthly despite the changes in burner temperatures and other combustion conditions. The Cu and Cc data for LCA obtained in this study is consistent with data reported in related studies on Malaysian CBA which was classified as sand-well graded [51,52]. In another related study by Asvesta et al, in which CBA samples from 4 different Greek powers stations were analysed, 3 of the samples had grain size classification consistent with that of the PSB samples [53].
3.4. Acid-Base Accounting
The acid-base accounting was done based on the static test results as presented by Sobek et al., Lawrence, R.W. & Wang, and Morin & Hutt, [17,19,54]. The classification is based on the net neutralising potential (NNP), and this classification, an NNP value of 0 with a paste pH of 4 is classified as acid generating. The x-y scatter plots of the NNP vs paste pH for daily, weekly, and monthly samples are presented in Figure 9. Sulphur quantification can also be regarded as a form of predicting acid-forming behaviour in solid particulate matter. In the tested samples the highest total sulphur wt. % recorded was 0.32 % for PSD (CFA) sample. The other three groups of LCA samples had a total sulphur concentration of < 0.2 %. The low total sulphur levels signify low acid-forming potential. It was also expected that the CFA would have a higher total sulphur content compared to the LCA samples, since CFA interacts with the produced SOx in the flu gas stream which does not occur with the CBA which makes part of the LCA. The SOx- sulphur can then adsorb to the fly ash particles and be retained on the surface while part of it may end up reacting with metal oxides to form various sulphite or sulphate end products [55]. The reasonable levels of aluminosilicates and carbonates against a low concentration of total sulphur in the ash samples guarantee an excellent potential for acid neutralisation [56]. It should also be noted that total sulphur analysis does not necessarily indicate the amount of reactive sulphur.
Based on the static test results Sobek et al., classification, all the samples tested for daily, weekly, and monthly analysis were in the non-acid generating class [17]. Figure 9(a) shows data collected from the 24-hour sampling, and it can be seen that the CFA sample from PSD showed the most non-acid-forming behaviour. From the elemental composition data presented in Table 2, it can be seen that the total wt. % composition of the PSD (CFA) in terms of SiO2, Al2O3, and Fe2O3 was the lowest, however the wt. % composition of the other metal oxides such as CaO, MgO, Na2O, and K2O were relatively high in the CFA samples. These metal oxides are responsible for the neutralising behaviour of coal ashes [34]. The higher concentration of these oxides was able to mask the acid-generating behaviour induced by the presence of sulphur compounds in the ash. Another contributing factor is that during the oxidation of reactive sulphur and carbonate dissolution, iron oxy-hydroxides may precipitate at the surface of these sulphides and carbonates rendering them captive [57]. On comparing the respective LCA samples, the same can be said about the neutralising behaviour of the PSA ash compared to that of the PSC ash. During the 3 sampling phases, the PSA ash exhibited better acid neutralising behaviour relative to the PSC ash. This again can be ascribed to the relatively higher wt. % of the oxides; CaO, MgO, Na2O and K2O.
Sample uniformity is also essential in minimising variations in chemical and physical behaviour. The elemental, mineral as well as particle size distribution of the CFA was mostly consistent in all the samples and the x-y scatter plot (NNP vs pH) in Figure 9 (a), shows a high degree of clustering with the PSD (CFA) sample. On the contrary, there was noticeable dispersion in the LCA samples and this can be ascribed to the respective variations in elemental, mineralogical, morphology, and particle size distribution, in combination with the coal inhomogeneity. A summary of the NNP and pH of the PSC and PSA (LCA) samples is presented in Table 7.
4. Conclusions
Over the 3 sampling phases; daily, weekly, and monthly sampling, the obtained data shows minimal variation with regard to elemental composition of the respective CFA and LCA samples. The observed minimal variations are largely ascribed to the inhomogeneous nature of the incinerated coal itself. In all the samples the elemental composition attested that both the CFA and LCA belong to class F, characterised by a total SiO2, Al2O3, and Fe2O3 wt. % composition of above 80 %. These oxides were higher in the LCA samples relative to the levels in the CFA samples. On the contrary, other metal oxides such as CaO, MgO, K2O and Na2O were much higher in the CFA samples and this resulted in their higher net acid neutralising potential. Of the tested parameters, the mineralogical phases tend to vary much over time. The basic minerals associated with coal ashes such as quartz, mullite, sillimanite, and hematite were detected in almost all samples but with varying wt. % levels. The CFA mineralogy varied from sample to sample and the outcomes can be attributed largely to the temperature variations within the boilers. Mineral transformation is largely controlled by temperature, and in the case of CFA the presence of CO2 in the flu gas may contribute to the formation of carbonate minerals such as dolomite.
The particle size distribution for the CFA samples showed greater continuity in comparison to LCA. There was also good continuity with the LCA samples with slight variations in particle sizes with the PSA weekly samples. Both the CFA and LCA samples exhibited good acid neutralising potential, with the highest NNP values obtained in the CFA. The higher the concentration of the oxides CaO, MgO, Na2O, and K2O, the higher the observed NNP values. From the scientometric analysis on the utilisation of CBA, it was found that there is minimal work completed so far, and most of the applications of CBA are in the construction industry, due to the good civil engineering properties of CBA. The quest for waste utilisation avails LCA as a potential candidate for the construction of reactive barriers for the remediation of acid mine drainage, based on the synergism of CFA and CBA properties that provides (i) good civil engineering properties (ii) good net acid neutralising potential (iii) good metal adsorption capacity. Furthermore, the particle size distribution studies showed that the LCA satisfies the gradation criteria for utilisation in geotechnical applications. The high SiO2 and Al2O3 levels also make LCA a suitable feed stock in zeolite and geopolymer synthesis.
Based on the outcomes of this study, it can be concluded that following the temperature profiles of the boilers during coal incineration may assist in predicting the mineral phases of the resultant coal ashes. Since CFA has better net neutralising potential than LCA but inferior civil engineering properties, it will be interesting to investigate the performance of reactive barriers for AMD remediation that are constructed using a mixture of LCA. Since the properties of the ash are determined by the nature of the incinerated coal, it would also be essential for power stations to develop a criterion of establishing whether a source of coal has become a new source based on changes in the composition especially the amount of CaO, available alkalies and the SiO2 to Al2O3 ratio.
Author Contributions
T. Hlatywayo, S. Clarke, and K. Reynolds-Clausen conceived and planned the experiments. K. Reynolds-Clausen carried out the material characterisation experiments. T. Hlatywayo and S. Clarke contributed to the interpretation of the results. T. Hlatywayo took the lead in writing the manuscript. All authors provided critical feedback and helped shape the research, analysis and manuscript.
Funding
We would like to acknowledge ESKOM for funding the research that enabled us to collect the data for this paper.
Data Availability Statement
The authors confirm that the data supporting the findings of this study are available within the article. Raw data that support the findings of this study are available from the corresponding author, upon reasonable request.
Conflicts of Interest
There are no conflicts to declare.
References
- Hlatywayo, T. Coal Fly Ash and Acid Mine Drainage Based, Heterogeneous Fe Catalysts for the Friedel-Crafts Alkylation Reaction. Ph.D. Thesis, Chemistry Department, University of the Western Cape, Cape Town, South Africa, 2020. Available online: https://hdl.handle.net/10566/14746. (accessed on 7 January 2025).
- Saer, L.K.A. Properties and Use of Coal Fly Ash; Thomas Telford Ltd, 2001. [CrossRef]
- Punshon, T.; Seaman, J. C.; Sajwan, K. S. The Production and Use of Coal Combustion Products. Chemistry of Trace Elements in Fly Ash 2003, 1–11. [CrossRef]
- Kumar, D.; Gupta, A.; Ram, S. Uses of Bottom Ash in the Replacement of Fine Aggregate for Making Concrete. International Journal of Current Engineering and Technology 2014, 4(6). http://inpressco.com/category/ijcet.International Journal of Current Engineering and Technology - Inpressco. http://inpressco.com/category/ijcet. (accessed 2023-03-16).
- Mohammed, S. A.; Koting, S.; Katman, H. Y. B.; Babalghaith, A. M.; Abdul Patah, M. F.; Ibrahim, M. R.; Karim, M. R. A Review of the Utilization of Coal Bottom Ash (CBA) in the Construction Industry. Sustainability 2021, 13 (14), 8031. [CrossRef]
- Ullah, A., Kassim, A., Abbil, A., Matusin, S., Rashid, A.S.A., Yunus, N.Z.M., &Abuelgasim, R. Evaluation of Coal Bottom Ash Properties and Its Applicability as Engineering Material. IOP Conf. Ser.: Earth and Environmental Science 2020, 498 012044. http://10.1088/1755-1315/498/1/012044.
- Yao, Z. T.; Ji, X. S.; Sarker, P. K.; Tang, J. H.; Ge, L. Q.; Xia, M. S.; Xi, Y. Q. A Comprehensive Review on the Applications of Coal Fly Ash. Earth-Science Reviews 2015, 141, 105–121. [CrossRef]
- Abdullah, M. H.; Rashid, A. S. A.; Anuar, U. H. M.; Marto, A.; Abuelgasim, R. Bottom Ash Utilization: A Review on Engineering Applications and Environmental Aspects. IOP Conference Series: Materials Science and Engineering 2019, 527 (1), 012006. [CrossRef]
- Labidi, A.; Ren, H.; Zhu, Q.; Liang, X.; Liang, J.; Wang, H.; Sial, A.; Mohsen Padervand; Lichtfouse, E.; Rady, A.; Allam, A. A.; Wang, C. Coal Fly Ash and Bottom Ash Low-Cost Feedstocks for CO2 Reduction Using the Adsorption and Catalysis Processes. Science of The Total Environment 2024, 912, 169179–169179. [CrossRef]
- Asokbunyarat, V.; van Hullebusch, E. D.; Lens, P. N. L.; Annachhatre, A. P. Coal Bottom Ash as Sorbing Material for Fe(II), Cu(II), Mn(II), and Zn(II) Removal from Aqueous Solutions. Water, Air, & Soil Pollution 2015, 226 (5). [CrossRef]
- Zhou, H.; Bhattarai, R.; Li, Y.; Si, B.; Dong, X.; Wang, T.; Yao, Z. Towards Sustainable Coal Industry: Turning Coal Bottom Ash into Wealth. Science of The Total Environment 2022, 804, 149985. [CrossRef]
- Gitari, W.M.; Petrik, L.F.; Etchebers, O.; Key, D.L.; Iwuoha, E.; Okujeni, C. Passive neutralisation of acid mine drainage by fly ash and its derivatives: A column leaching study. Fuel 2008, 87, (8–9), 1637-1650. [CrossRef]
- Weinberg, R.; Coyte, R.; Wang, Z.; Das, D.; Vengosh, A. Water Quality Implications of the Neutralization of Acid Mine Drainage with Coal Fly Ash from India and the United States. Fuel 2022, 330, 125675. [CrossRef]
- Raletsena, M. V.; Mongalo, N. I. The Possible Application of Fly Ash (FA) to Ameliorate Acid Mine Water (AMD) for Irrigation of Potato (Solanum Tuberosum L.). Heliyon 2024, 10 (11), e32079. [CrossRef]
- Muthusamy, K.; Mohamad Hafizuddin, R.; Mat Yahaya, F.; Sulaiman, M. A.; Syed Mohsin, S. M.; Tukimat, N. N.; Omar, R.; Chin, S. C. Compressive Strength Performance of OPS Lightweight Aggregate Concrete Containing Coal Bottom Ash as Partial Fine Aggregate Replacement. IOP Conference Series: Materials Science and Engineering 2018, 342, 012099. [CrossRef]
- Xiao, F.; Li, C.; Sun, J.; Zhang, L. Knowledge Domain and Emerging Trends in Organic Photovoltaic Technology: A Scientometric Review Based on CiteSpace Analysis. Frontiers in Chemistry 2017, 5. [CrossRef]
- Sobek, A.A.; Schuller, W.A.; Freeman, J.R.; Smith, R.M. Field and laboratory methods applicable to overburdens and mine soils. EPA-600/2-78-054, Environmental Protection Agency, Washington, DC 1978.
- Lawrence, R.W. Prediction of the behaviour of mining and processing wastes in the environment. In: Proceedings Western Regional Symposium on Mining and Mineral Processing Wastes. Ed Doyle, F., Berkeley, California, May 30 -June 1, 1990, 155 – 122.
- Lawrence, R.W. & Wang, Y. (1996) Determination of neutralization potential for acid rock drainage prediction. MEND/NEDEM report 1.16.3, Canadian Centre for Mineral and Energy Technology, Ottawa 1996.
- Rautenbach, R.; Matjie, R.; Strydom, C.; Bunt, J. Transformation of Inherent and Extraneous Minerals in Feed Coals of Commercial Power Stations and Their Density-Separated Fractions. Energy Geoscience 2021, 2 (2), 136–147. [CrossRef]
- Collins, A. C.; C.A Strydom; Dyk, J. C. van; Bunt, J. R. FACTSAGETM Thermo-Equilibrium Simulations of Mineral Transformations in Coal Combustion Ash. Journal of the Southern African Institute of Mining and Metallurgy 2018, 118 (10). [CrossRef]
- van Dyk, J. C.; Melzer, S.; Sobiecki, A. Mineral Matter Transformation during Sasol-Lurgi Fixed Bed Dry Bottom Gasification – Utilization of HT-XRD and FactSage Modelling. Minerals Engineering 2006, 19 (10), 1126–1135. [CrossRef]
- Matjie, R.; Ward, C.; Li, Z. Mineralogical Transformations in Coal Feedstocks during Carbon Conversion Based on Packed-Bed Combustor Tests: Part 1. Bulk Coal and Ash Studies. Coal Combustion and Gasification Products 2012, 4 (1), 45–54. [CrossRef]
- Jayaranjan, M. L. D.; van Hullebusch, E. D.; Annachhatre, A. P. Reuse Options for Coal Fired Power Plant Bottom Ash and Fly Ash. Reviews in Environmental Science and Bio/Technology 2014, 13 (4), 467–486. [CrossRef]
- Rafieizonooz, M.; Khankhaje, E.; Rezania, S. Assessment of Environmental and Chemical Properties of Coal Ashes Including Fly Ash and Bottom Ash, and Coal Ash Concrete. Journal of Building Engineering 2022, 49, 104040. [CrossRef]
- Lo, F.C.; Lee, M.G.; Lo S.L. Effect of Coal Ash and Rice Husk Ash Partial Replacement in Ordinary Portland Cement on Pervious Concrete. Construction and Building Materials 2021, 286, 122947. [CrossRef]
- Ankur, N.; Singh, N. Performance of Cement Mortars and Concretes Containing Coal Bottom Ash: A Comprehensive Review. Renewable and Sustainable Energy Reviews 2021, 149, 111361. [CrossRef]
- Sanjith, J.; Kiran, B.M.; Chethan, G.; Mohan K.K.N. A Study on Mechanical Properties of Latex Modified High Strength Concrete Using Bottom Ash as a Replacement for Fine Aggregate. International Journal of Emerging Engineering Research and Technology 2015, 3(6), 114-121.
- Kolker, A.; Senior, C.; Van Alphen, C.; Koenig, A.; Geboy, N. Mercury and trace element distribution in density separates of a South African Highveld (#4) coal: Implications for mercury reduction and preparation of export coal. International Journal of Coal Geology 2017, 170, 7-13. [CrossRef]
- Gomes, S.; François, M. Characterization of mullite in silicoaluminous fly ash by XRD, TEM, and 29Si MAS NMR. Cement and Concrete Research 2000, 30, 175-181. [CrossRef]
- Chancey, R. T.; Stutzman, P. E.; Maria C.G. Juenger; Fowler, D. Comprehensive Phase Characterization of Crystalline and Amorphous Phases of a Class F Fly Ash. Cement and Concrete Research 2010, 40 (1), 146–156. [CrossRef]
- Vassilev, S. Phase-Mineral and Chemical Composition of Coal Fly Ashes as a Basis for Their Multicomponent Utilization. 1. Characterization of Feed Coals and Fly Ashes⋆. Fuel 2003, 82 (14), 1793–1811. [CrossRef]
- Holm, J. L.; O.J Kleppa; Westrum, E. F. Thermodynamics of Polymorphic Transformations in Silica. Thermal Properties from 5 to 1070° K and Pressure-Temperature Stability Fields for Coesite and Stishovite. Geochimica et cosmochimica acta 1967, 31 (12), 2289–2307. [CrossRef]
- Catalfamo, P.; Di Pasquale, S.; Corigliano, F.; Mavilia, L. Influence of the Calcium Content on the Coal Fly Ash Features in Some Innovative Applications. Resources, Conservation and Recycling 1997, 20 (2), 119–125. [CrossRef]
- Creelman, R. A.; Ward, C. R.; Schumacher, G.; Juniper, L. Relation between Coal Mineral Matter and Deposit Mineralogy in Pulverized Fuel Furnaces. Energy & Fuels 2013, 27 (10), 5714–5724. [CrossRef]
- Tomba, A.; Camerucci, M. A.; Urretavizcaya, G.; Cavalieri, A. L.; Sainz, M. A.; Caballero, A. Elongated Mullite Crystals Obtained from High Temperature Transformation of Sillimanite. Ceramics International 1999, 25 (3), 245–252. [CrossRef]
- Igami, Y.; Ohi, S.; Miyake, A. Sillimanite-Mullite Transformation Observed in Synchrotron X-Ray Diffraction Experiments. Journal of the American Ceramic Society 2017, 100 (10), 4928–4937. [CrossRef]
- Rodriguez-Navarro, C.; Kudlacz, K.; Ruiz-Agudo, E. The Mechanism of Thermal Decomposition of Dolomite: New Insights from 2D-XRD and TEM Analyses. American Mineralogist 2012, 97 (1), 38–51. [CrossRef]
- Guo, W.; Li, J.; Wang, Z.; Zhang, K.; Gao, Z.; Ma, J.; Zhao, C. Mineralogical Characteristics of Early Permian Paragonite-Bearing Coal (No. 3) in the Jinyuan Mine, Tengxian Coalfield, Shandong Province, Eastern China. Minerals 2020, 10 (8), 714. [CrossRef]
- Shi, W.-J.; Kong, L.-X.; Bai, J.; Xu, J.; Li, W.-C.; Bai, Z.-Q.; Li, W. Effect of CaO/Fe2O3 on Fusion Behaviors of Coal Ash at High Temperatures. Fuel Processing Technology 2018, 181, 18–24. [CrossRef]
- Wang, H.; Cheng, L.; Pu, J.; Zhao, J. Melting Characteristics of Coal Ash and Properties of Fly Ash to Understand the Slag Formation in the Shell Gasifier. ACS Omega 2021, 6 (24), 16066–16075. [CrossRef]
- Reinmöller, M.; Kong, L.; Laabs, M.; Ge, Z.; Hommel, C.; Farid, M. M.; Shi, W.; Schreiner, M.; Cao, X.; Guhl, S.; Bai, J.; & Meyer, B. Methods for the determination of composition, mineral phases, and process-relevant behavior of ashes and its modeling: A case study for an alkali-rich ash. Journal of the Energy Institute 2022, 100, 137-147. [CrossRef]
- Silva, L.; Ward, C.; Hower, J.; Izquierdo, M.; Waanders, F.; Oliveira, M.; Li, Z.; Hatch, R.; Querol, X. Mineralogy and Leaching Characteristics of Coal Ash from a Major Brazilian Power Plant. Coal Combustion and Gasification Products 2010, 2 (1), 51–65. [CrossRef]
- Collins, A. C.; Strydom, C. A.; Matjie, R. H.; Bunt, J. R.; van Dyk, J. C. Production of Sodium-Based Zeolites and a Potassium-Containing Leach Liquor by Alkaline Leaching of South African Coal Fines Ash. Journal of the Southern African Institute of Mining and Metallurgy 2023, 123 (3), 145–155. [CrossRef]
- Moitsheki, L. J.; Matjie, R. H.; Baran, A.; Mooketsi, O. I.; Schobert, H. H. Chemical and Mineralogical Characterization of a South African Bituminous Coal and Its Ash, and Effect on PH of Ash Transport Water. Minerals Engineering 2010, 23 (3), 258–261. [CrossRef]
- Matjie, R.; Ginster, M.; Van Alphen, C.; Sobiecki, A. Detailed characterisation of Sasol ashes Proceedings Organised by World of Coal Ash (WOCA), April 11 - 15, Lexington, Kentucky, USA 2005.
- Guan, X.; Wang, L.; Mo, L. Effects of Ground Coal Bottom Ash on the Properties of Cement-Based Materials under Various Curing Temperatures. Journal of Building Engineering 2023, 69, 106196. [CrossRef]
- Kim, Y.-T.; Do, T.-H. Effect of Bottom Ash Particle Size on Strength Development in Composite Geomaterial. Engineering Geology 2012, 139-140, 85–91. [CrossRef]
- Cheng, B.; Liu, R.; Li, X.; Enrique; Chen, M.; Li, S. Effects of Fly and Coal Bottom Ash Ratio on Backfill Material Performance. Construction and Building Materials 2021, 319, 125831–125831. [CrossRef]
- Consoli, N.C.; Heineck, K.S.; Coop, M.R.; Da Fonseca, A.V.; Ferreira, C. Coal Bottom Ash as a Geomaterial: Influence of Particle Morphology on the Behavior of Granular Materials. Soils and Foundations 2007, 47 (2), 361–373. [CrossRef]
- Marto, A.; Kassim, K.; A. Muhardi; Mahir, A.; Lee, F.; Yap, S. L. Engineering characteristics of Tanjung Bin coal ash. The electronic journal of geotechnical engineering 2010, 15, 1117 – 1129. https://api.semanticscholar.org/CorpusID:137007211 (accessed 2025-02-24).
- Abdullah, M. H.; Abuelgasim, R.; Rashid, A. S. A.; Mohdyunus, N. Z. Engineering Properties of Tanjung Bin Bottom Ash. MATEC Web of Conferences 2018, 250, 01006. [CrossRef]
- Asvesta, A.; Kapageridis, I.; Vasileiadou, A.; Koios, K. & Kantiranis, N. Granulometric, Chemical, and Mineralogical Evaluation of Greek Lignite Bottom Ash for Potential Utilization in Concrete Manufacturing. 2023, 116, 50–50. [CrossRef]
- Morin, K. A.; Hutt, N. M. Observed preferential depletion of neutralization potential over sulfide minerals in kinetic tests—site specific criteria for safe NP/AP ratios. In: Proceedings of International Land Reclamation and Mine Drainage Conference on the Abatement of Acidic Drainage, US Bureau of Mines SP06A–94, April 24 – 29, Pittsburgh, PA, USA 2005, 148–156.
- Davis, W. T.; Fiedler, M. A. The Retention of Sulfur in Fly Ash from Coal-Fired Boilers. Journal of the Air Pollution Control Association 1982, 32 (4), 395–397. [CrossRef]
- Namaghi, H. H.; Li, S. Acid-Generating and Leaching Potential of Soils in a Coal Waste Rock Pile in Northeastern China. Soil and Sediment Contamination: An International Journal 2016, 25 (7), 776–791. [CrossRef]
- Elghali, A.; Benzaazoua, M.; Bussière, B.; Genty, T. Spatial Mapping of Acidity and Geochemical Properties of Oxidized Tailings within the Former Eagle/Telbel Mine Site. Minerals 2019, 9 (3), 180. [CrossRef]
Figure 2.
Elemental Composition of (a) SiO2 and Al2O3 (b) other trace oxides in PSA power station ash with time.
Figure 2.
Elemental Composition of (a) SiO2 and Al2O3 (b) other trace oxides in PSA power station ash with time.
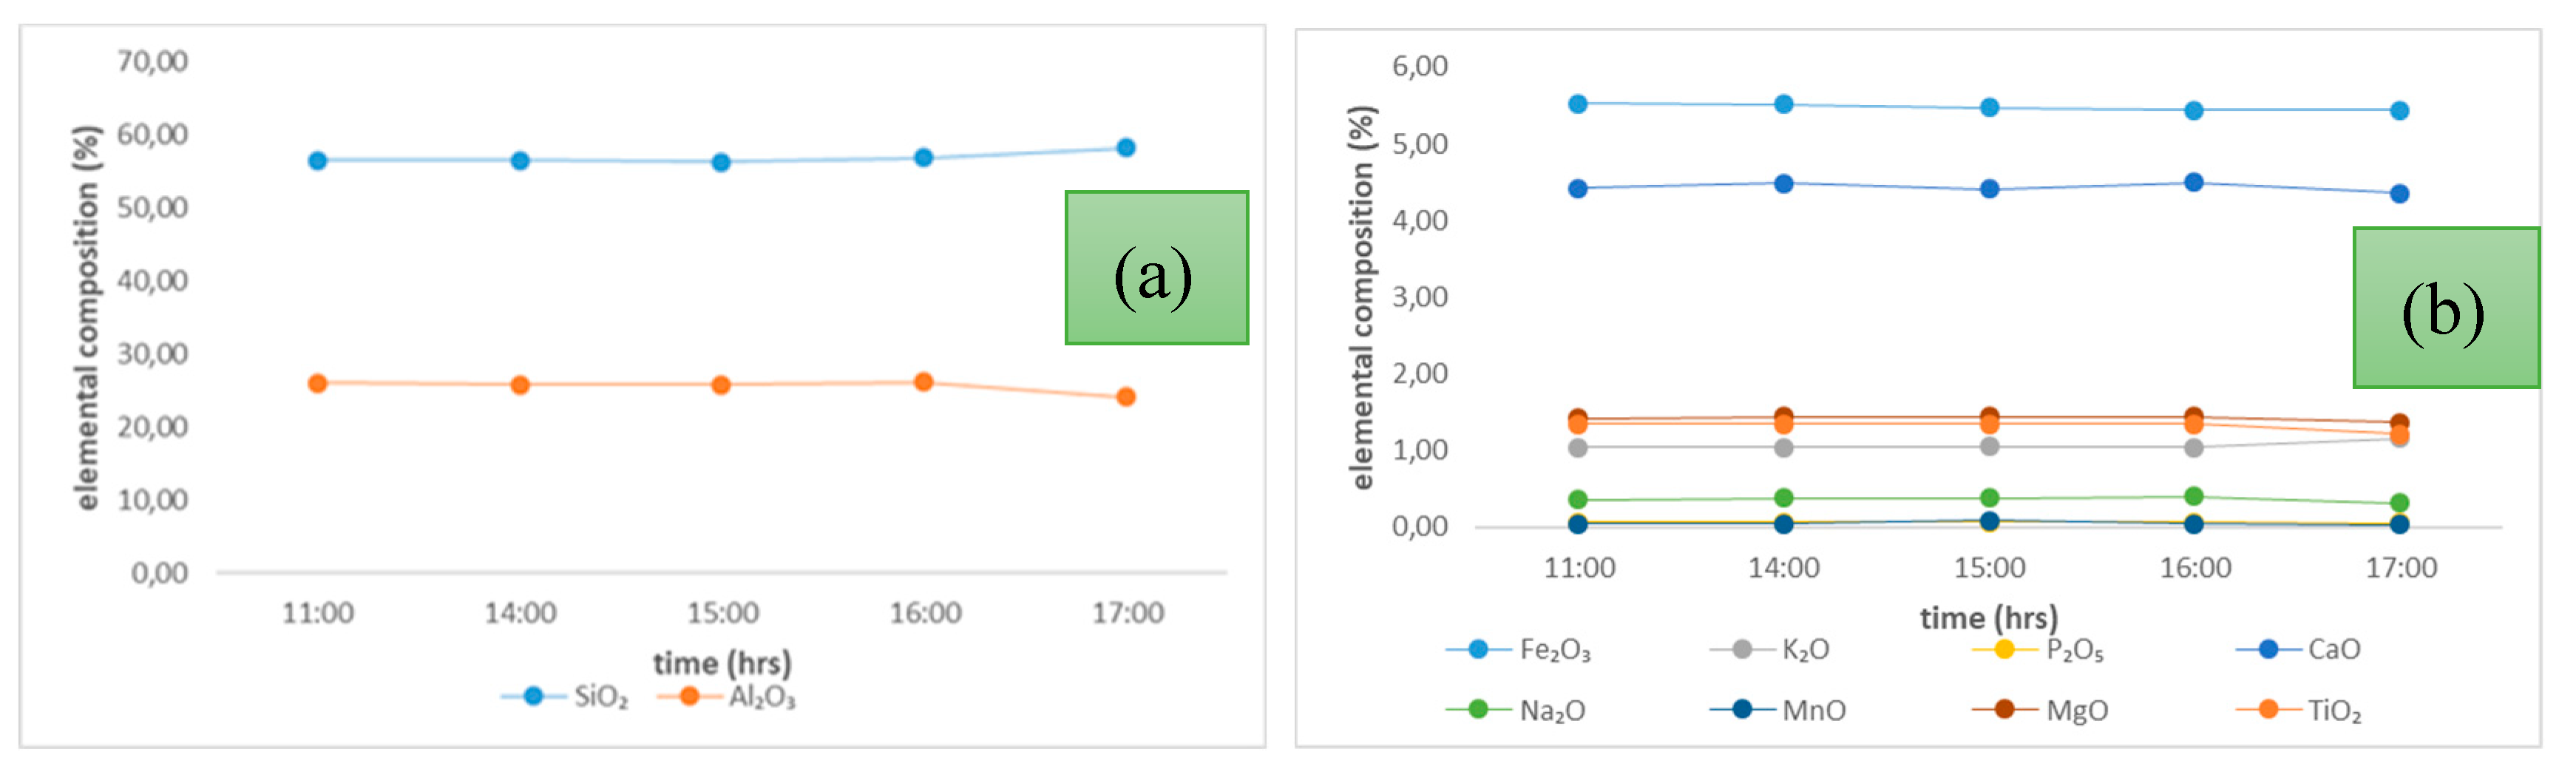
Figure 3.
Diffractogram of (a) LCA sample collected from PSB (b) CFA sample collected from PSD with representative peaks.
Figure 3.
Diffractogram of (a) LCA sample collected from PSB (b) CFA sample collected from PSD with representative peaks.
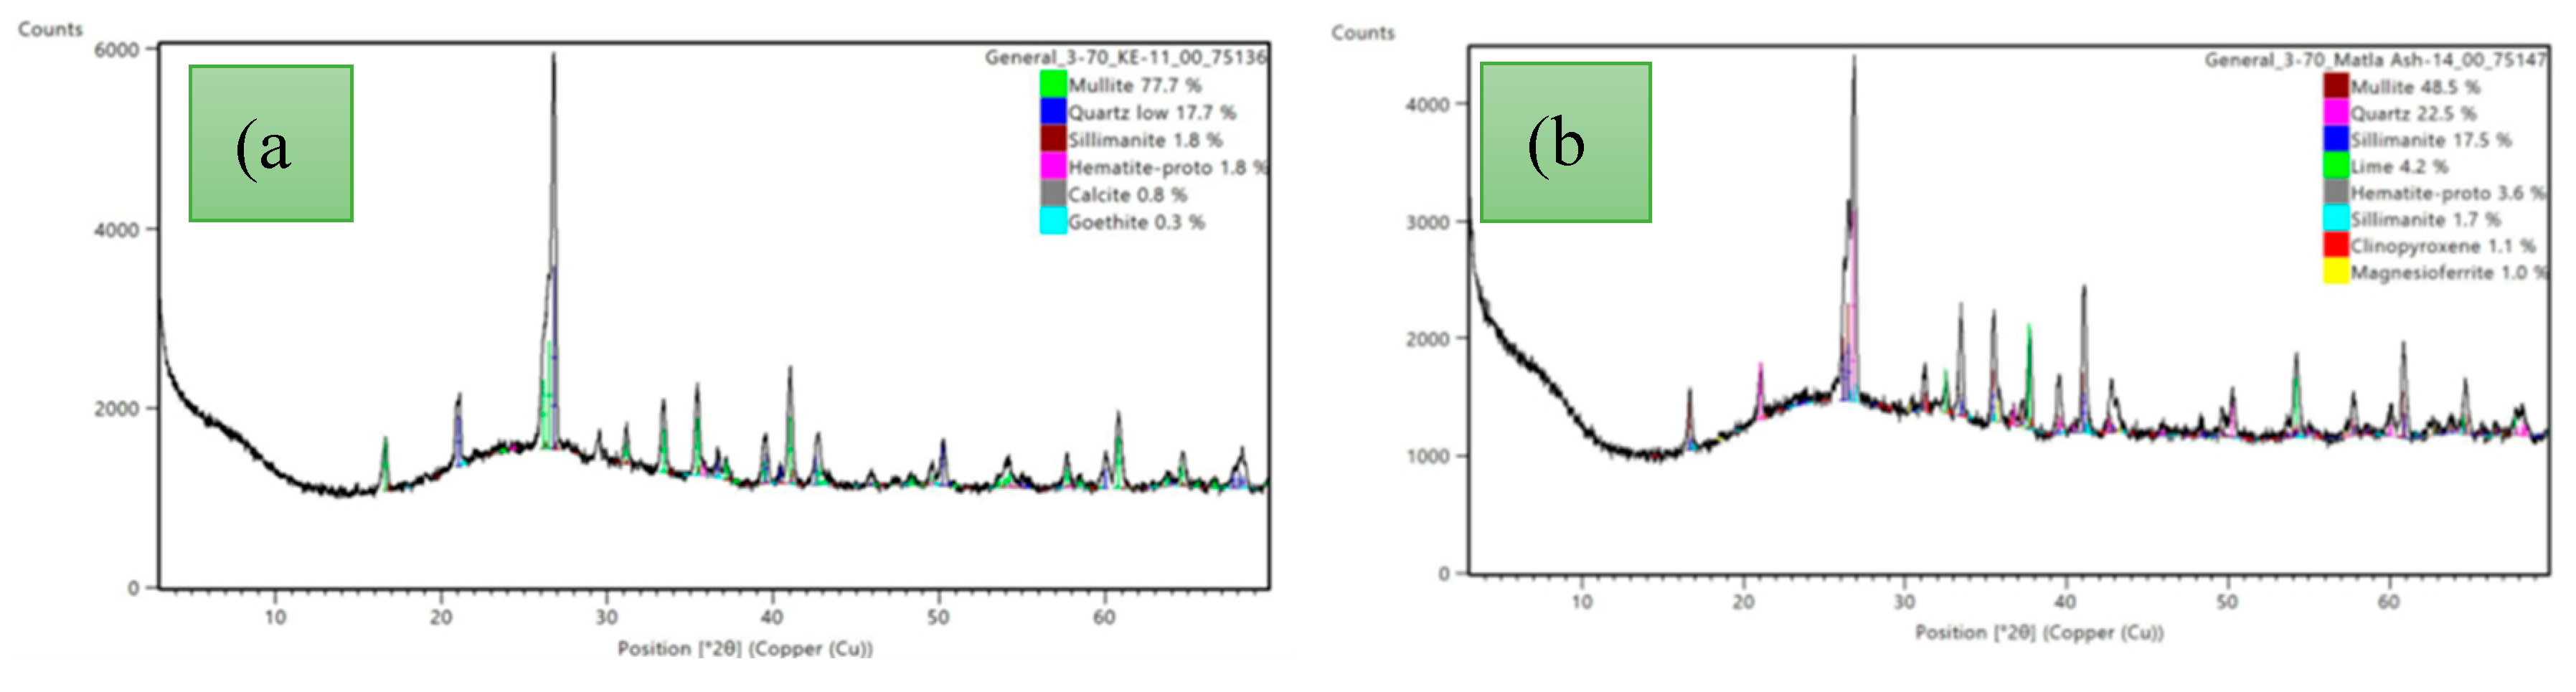
Figure 4.
Mineral Composition of (a) PSB power station LCA (b) PSD power station CFA with time over 24 hours.
Figure 4.
Mineral Composition of (a) PSB power station LCA (b) PSD power station CFA with time over 24 hours.
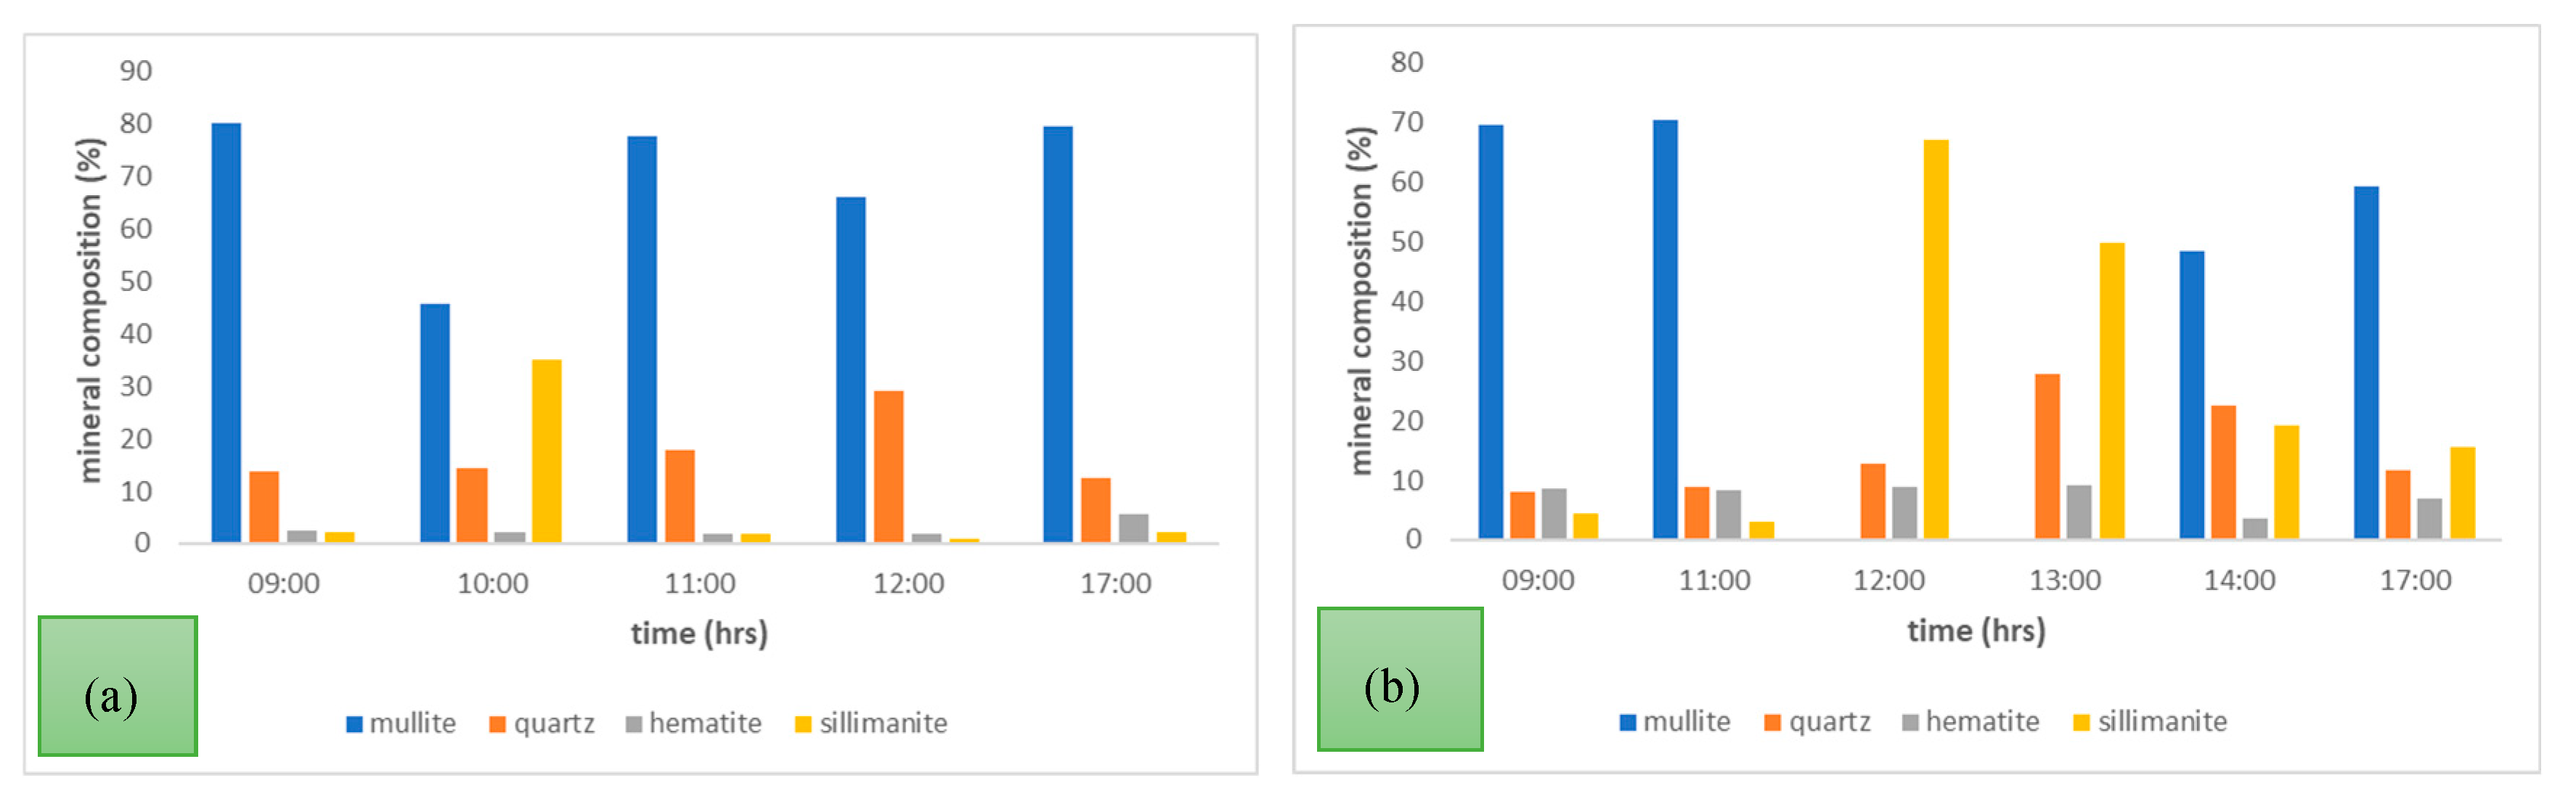
Figure 5.
Mineral Composition of PSC power station ash over (a) 5 weeks of June/July 2022; (b) 4 months June-September 2022.
Figure 5.
Mineral Composition of PSC power station ash over (a) 5 weeks of June/July 2022; (b) 4 months June-September 2022.
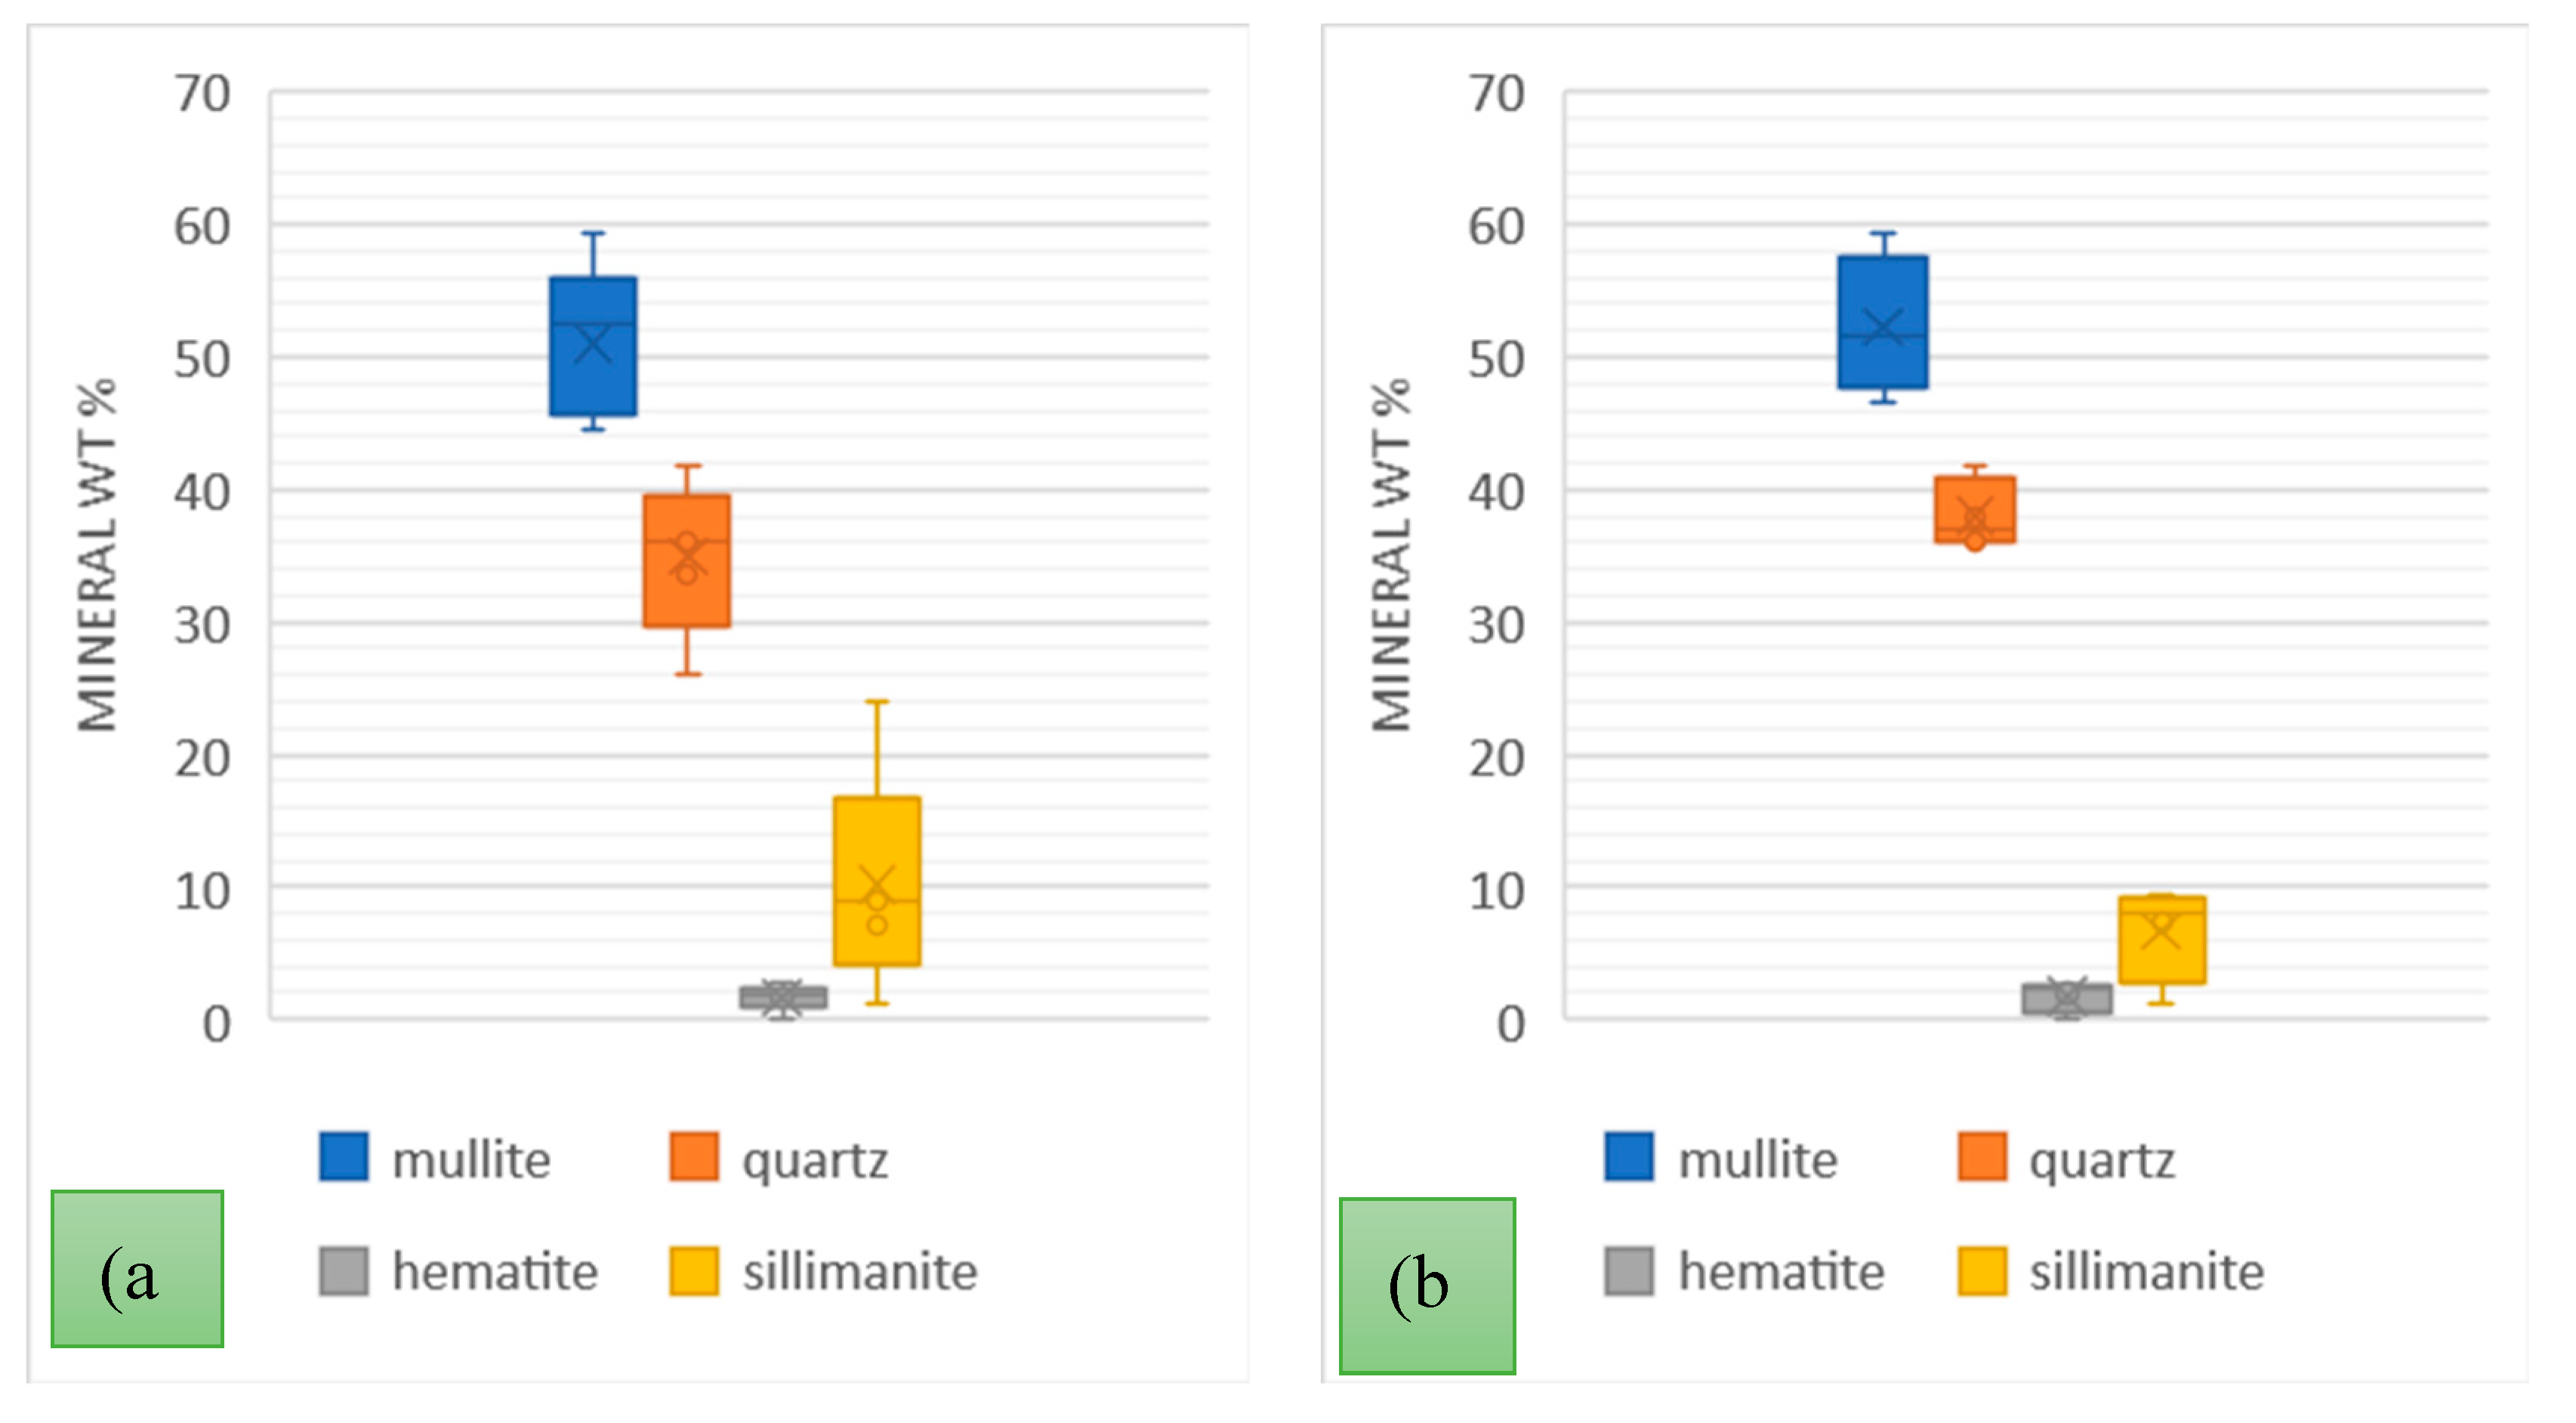
Figure 6.
Mineral Composition of PSA power station ash over (a) 5 weeks of June/July 2022; (b) 4 months June-September 2022.
Figure 6.
Mineral Composition of PSA power station ash over (a) 5 weeks of June/July 2022; (b) 4 months June-September 2022.
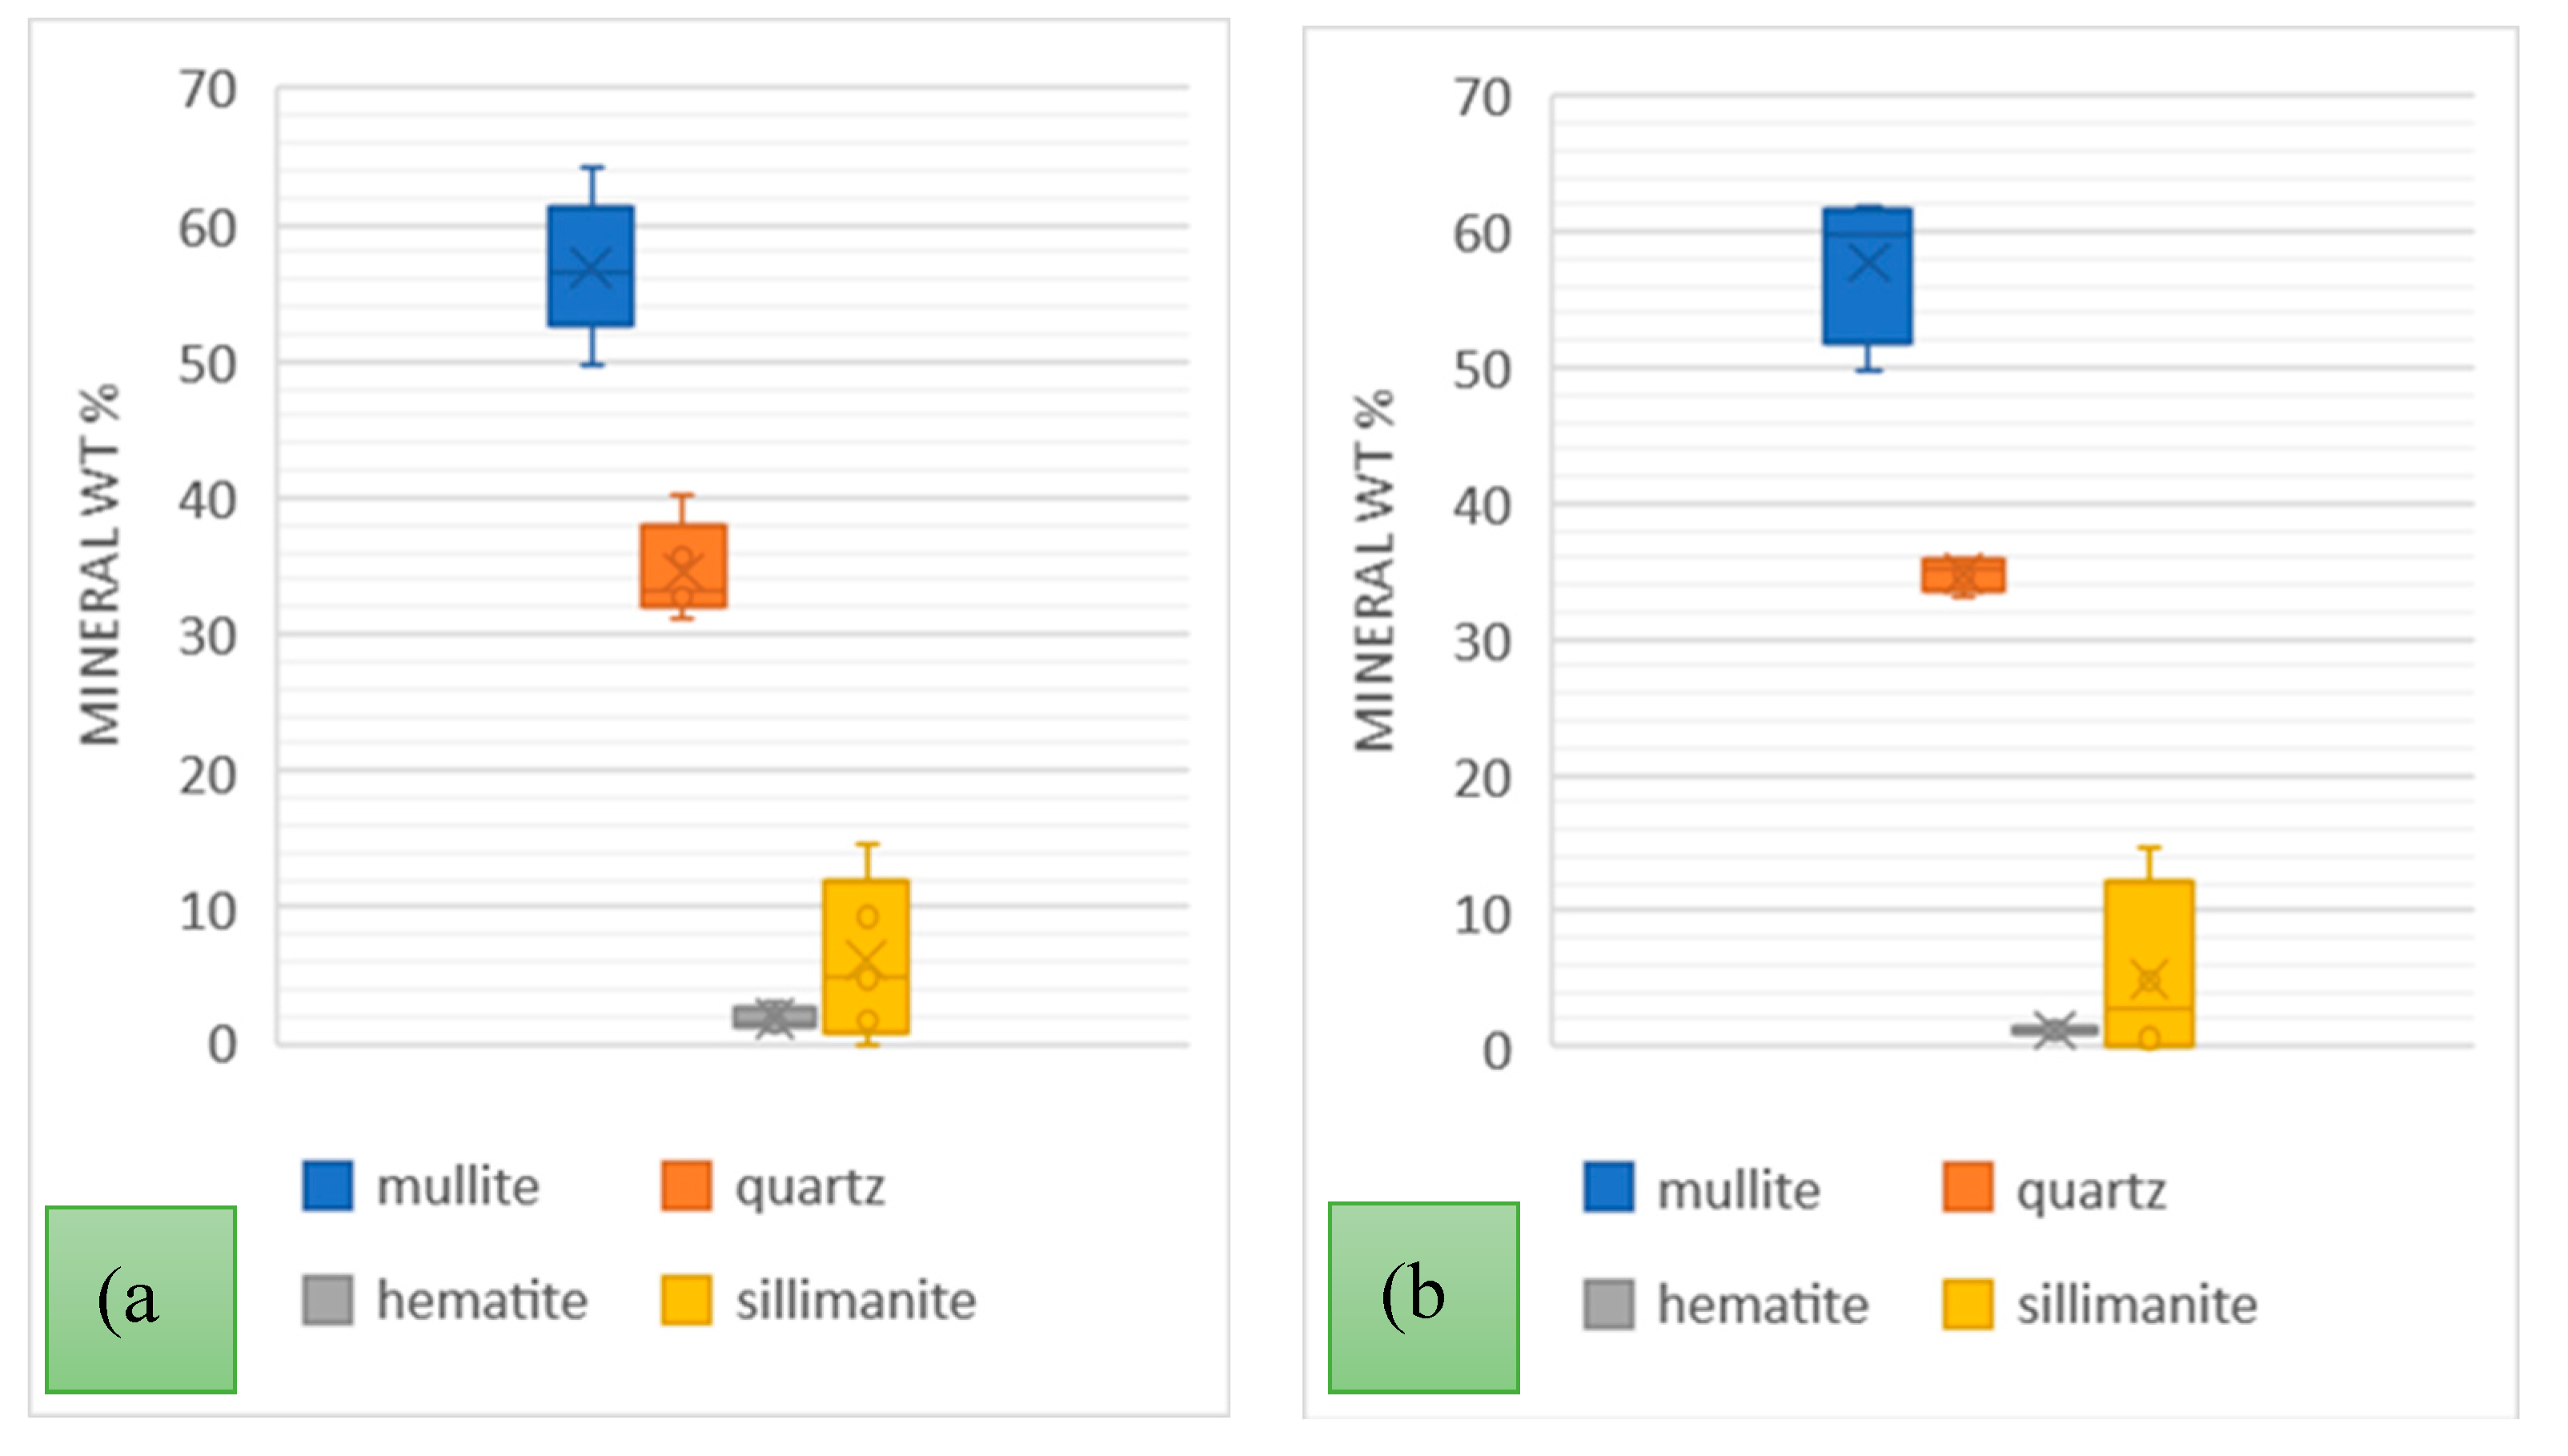
Figure 7.
Particle Size Distribution of (a) PSD and (b) PSB power station ash over 24 hours.

Figure 8.
Particle size distribution curves for (a) PSC weekly (b) PSA weekly (c) PSC monthly (d) PSA monthly.
Figure 8.
Particle size distribution curves for (a) PSC weekly (b) PSA weekly (c) PSC monthly (d) PSA monthly.
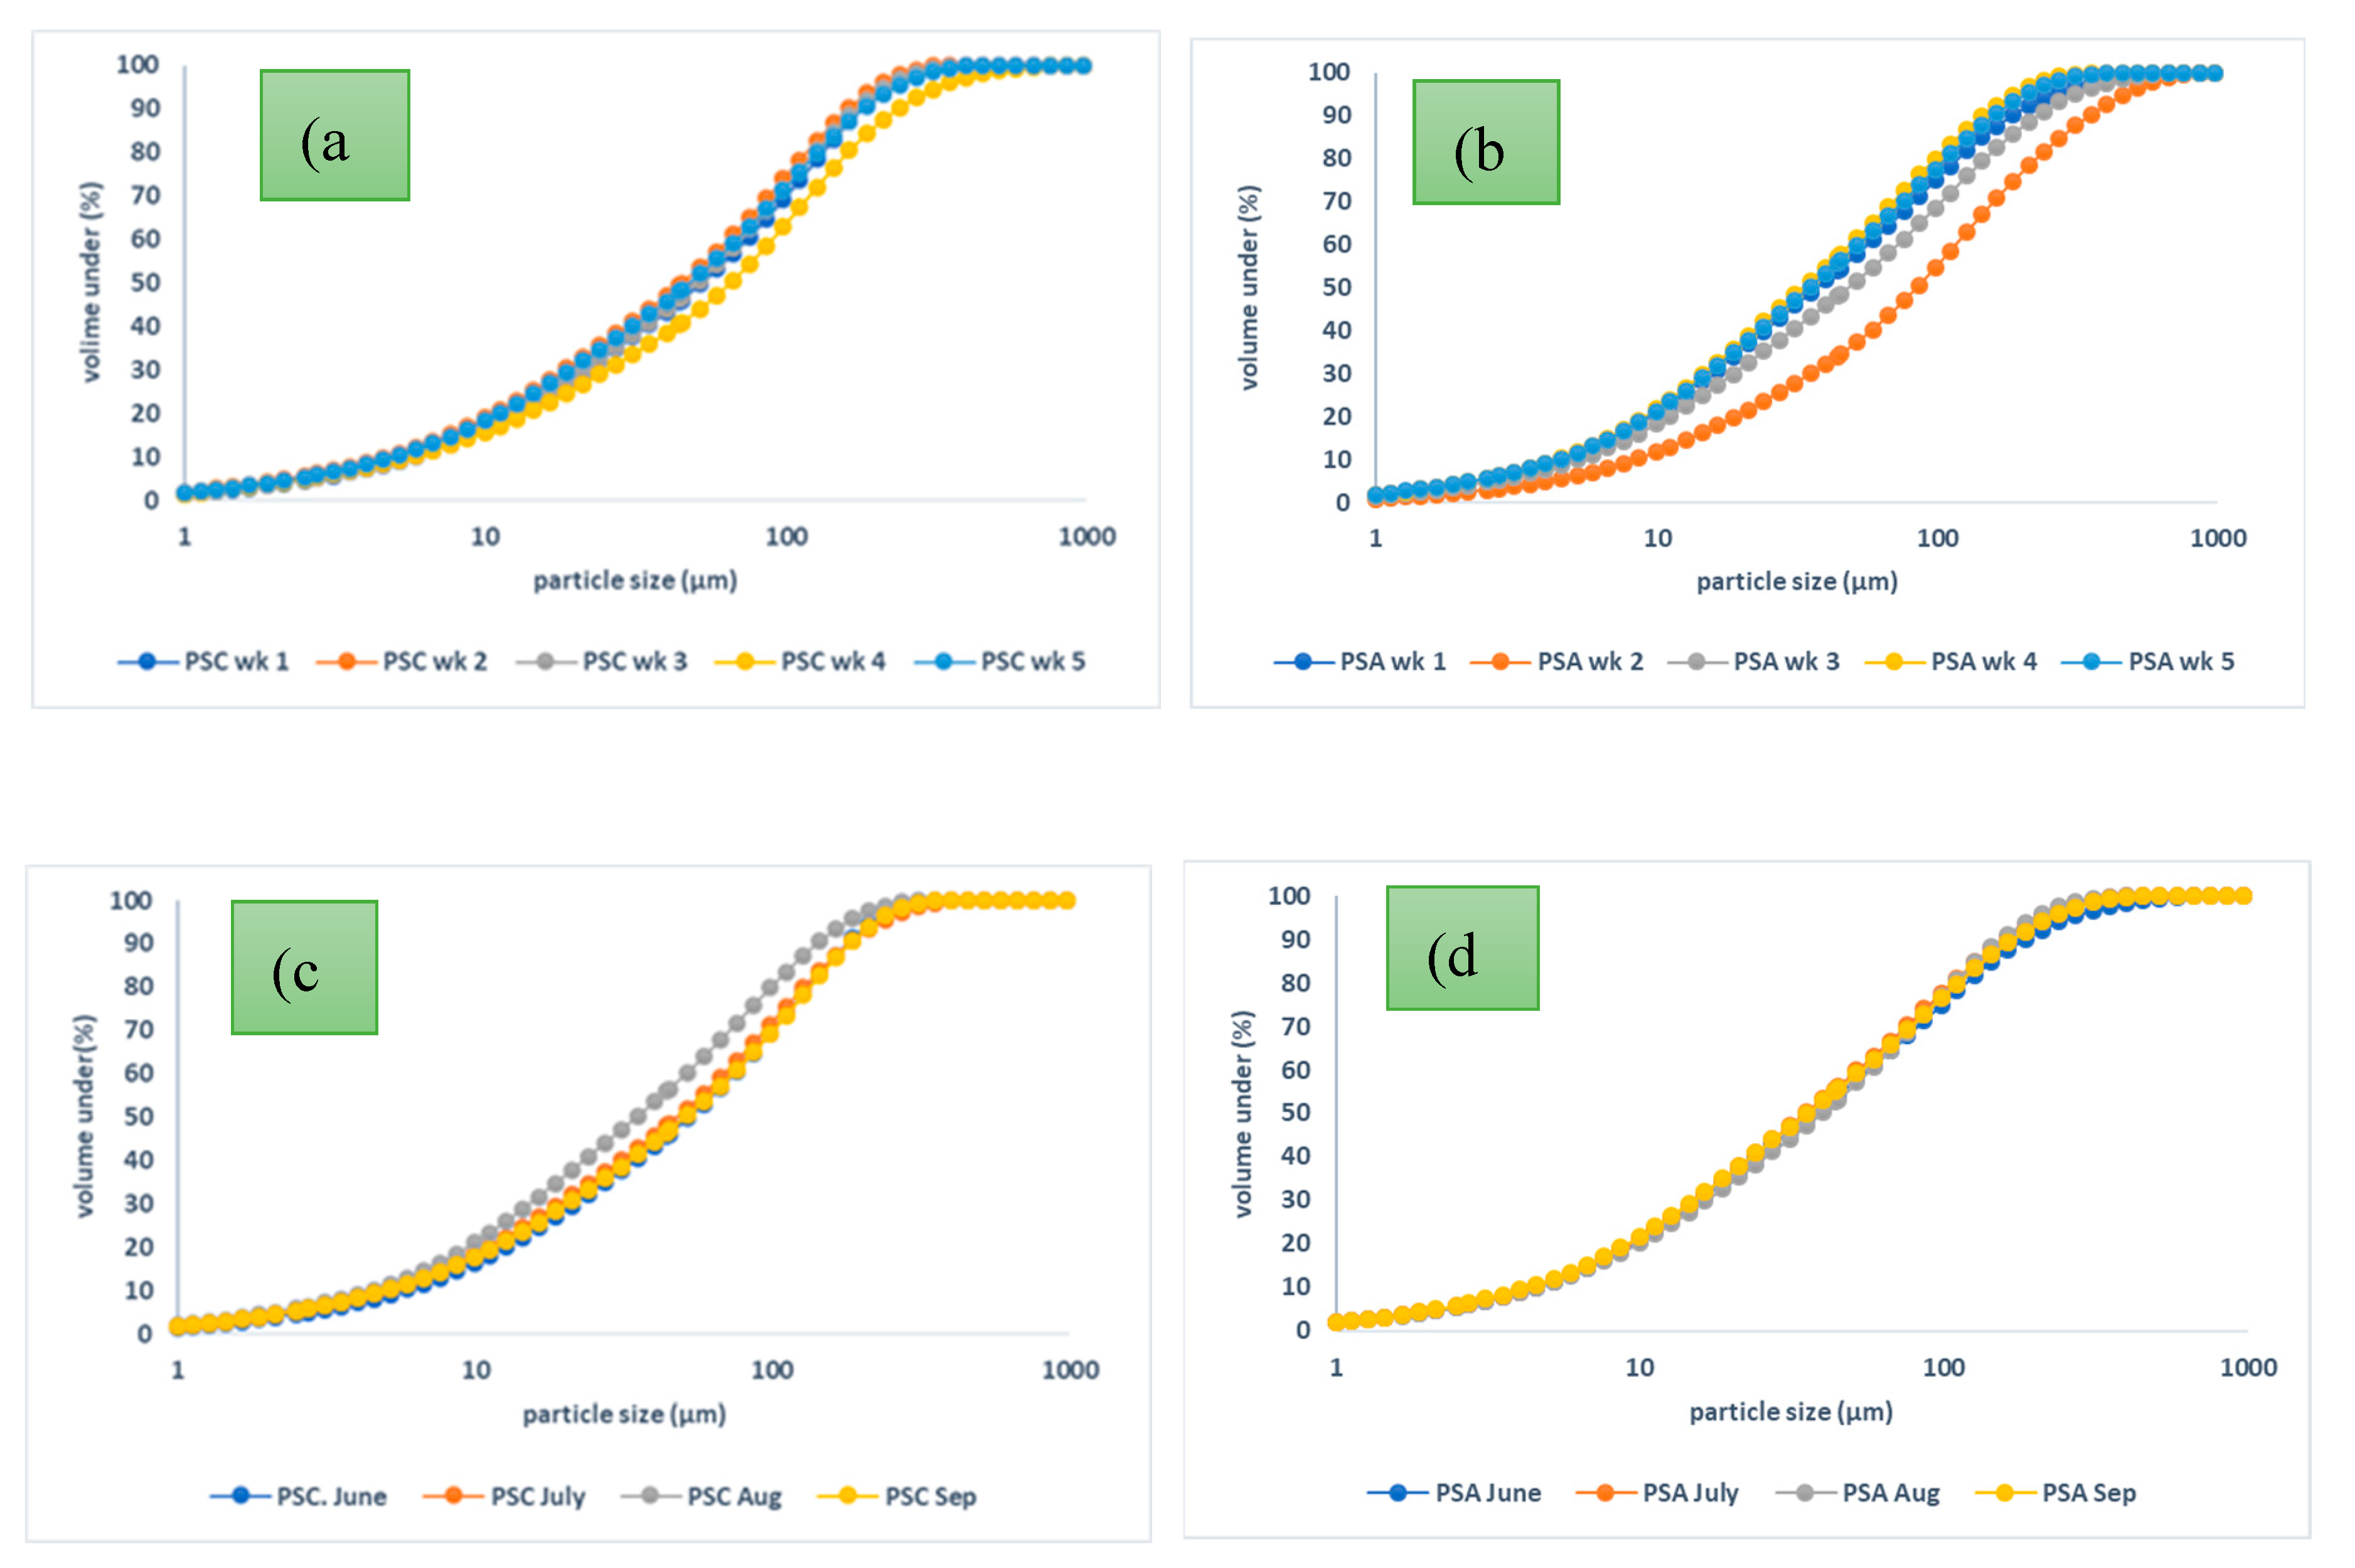
Figure 9.
Classification of CFA and LCA samples in terms of NNP and paste pH (a) 24-hour sampling (b) weekly and monthly sampling.
Figure 9.
Classification of CFA and LCA samples in terms of NNP and paste pH (a) 24-hour sampling (b) weekly and monthly sampling.
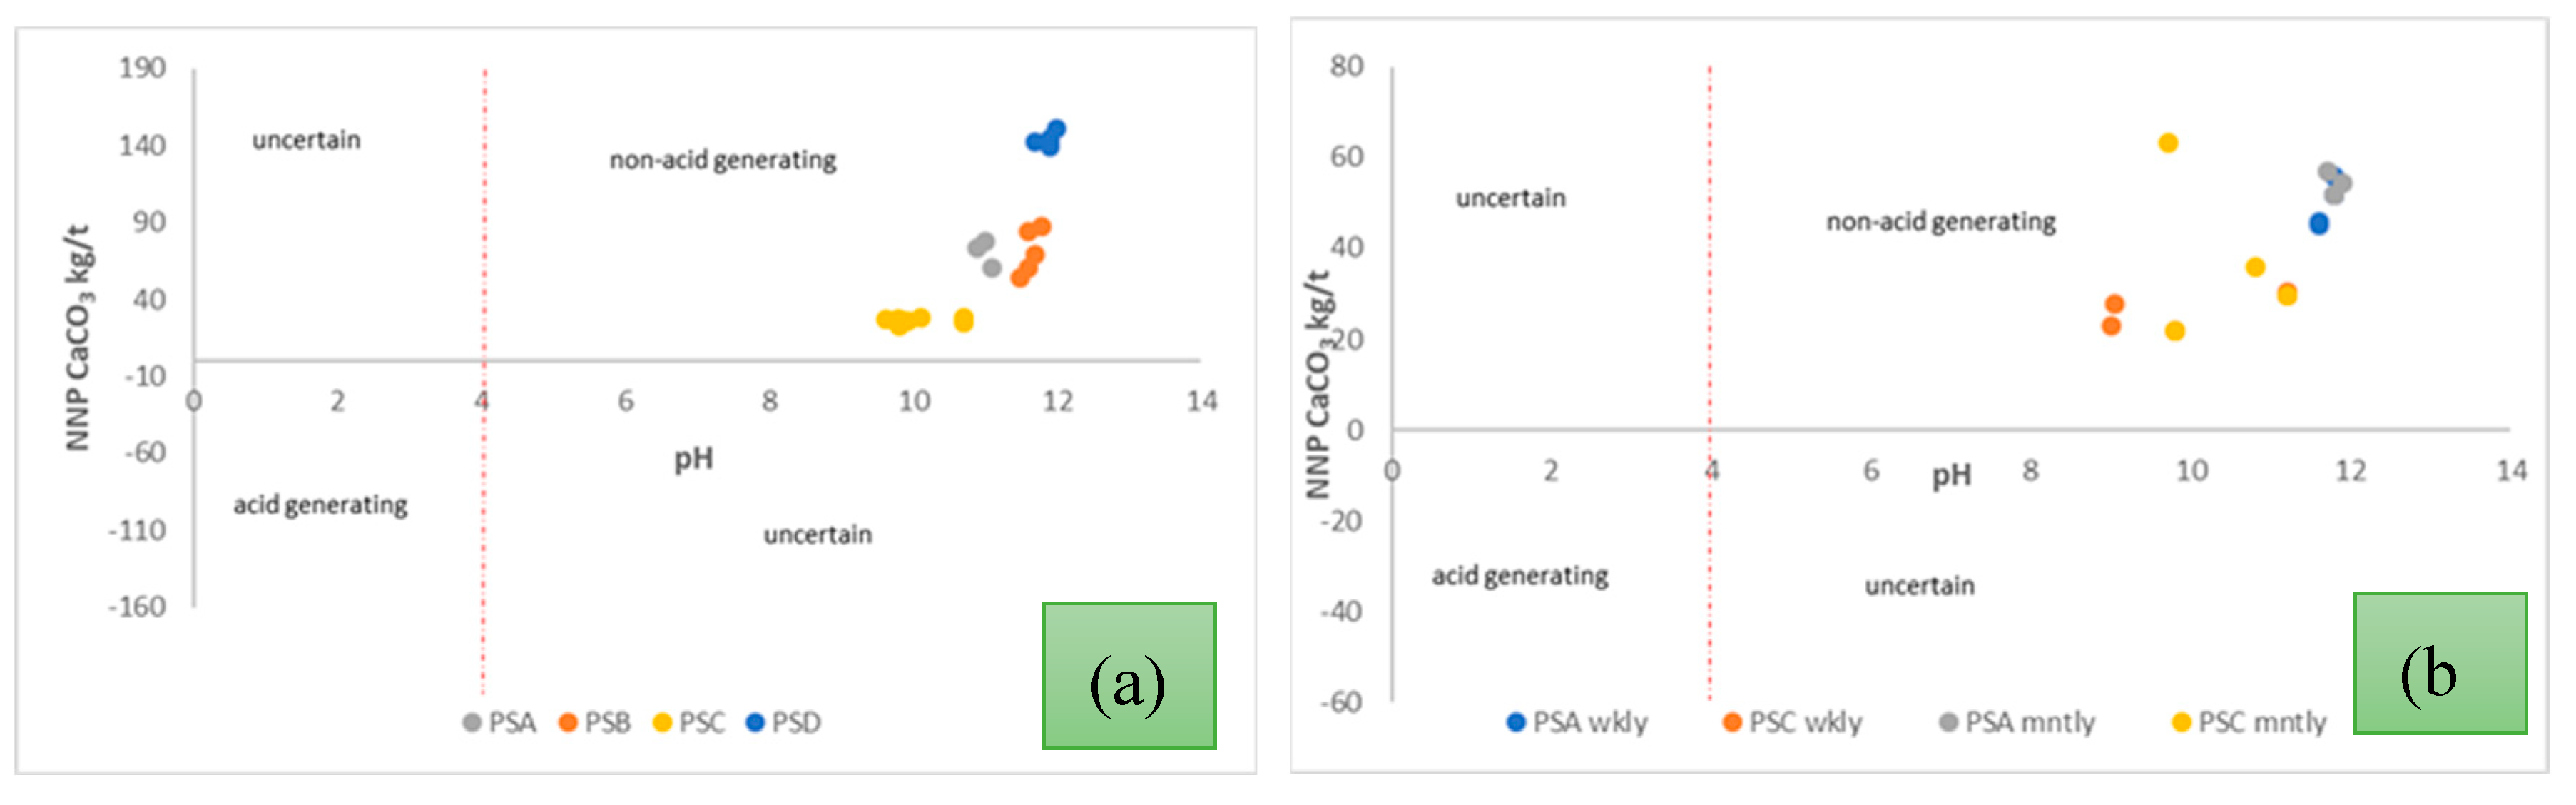

Table 1.
Document search results from Scopus database, based on the keywords; coal fly ash, utilisation, and variability. 1.
Table 1.
Document search results from Scopus database, based on the keywords; coal fly ash, utilisation, and variability. 1.
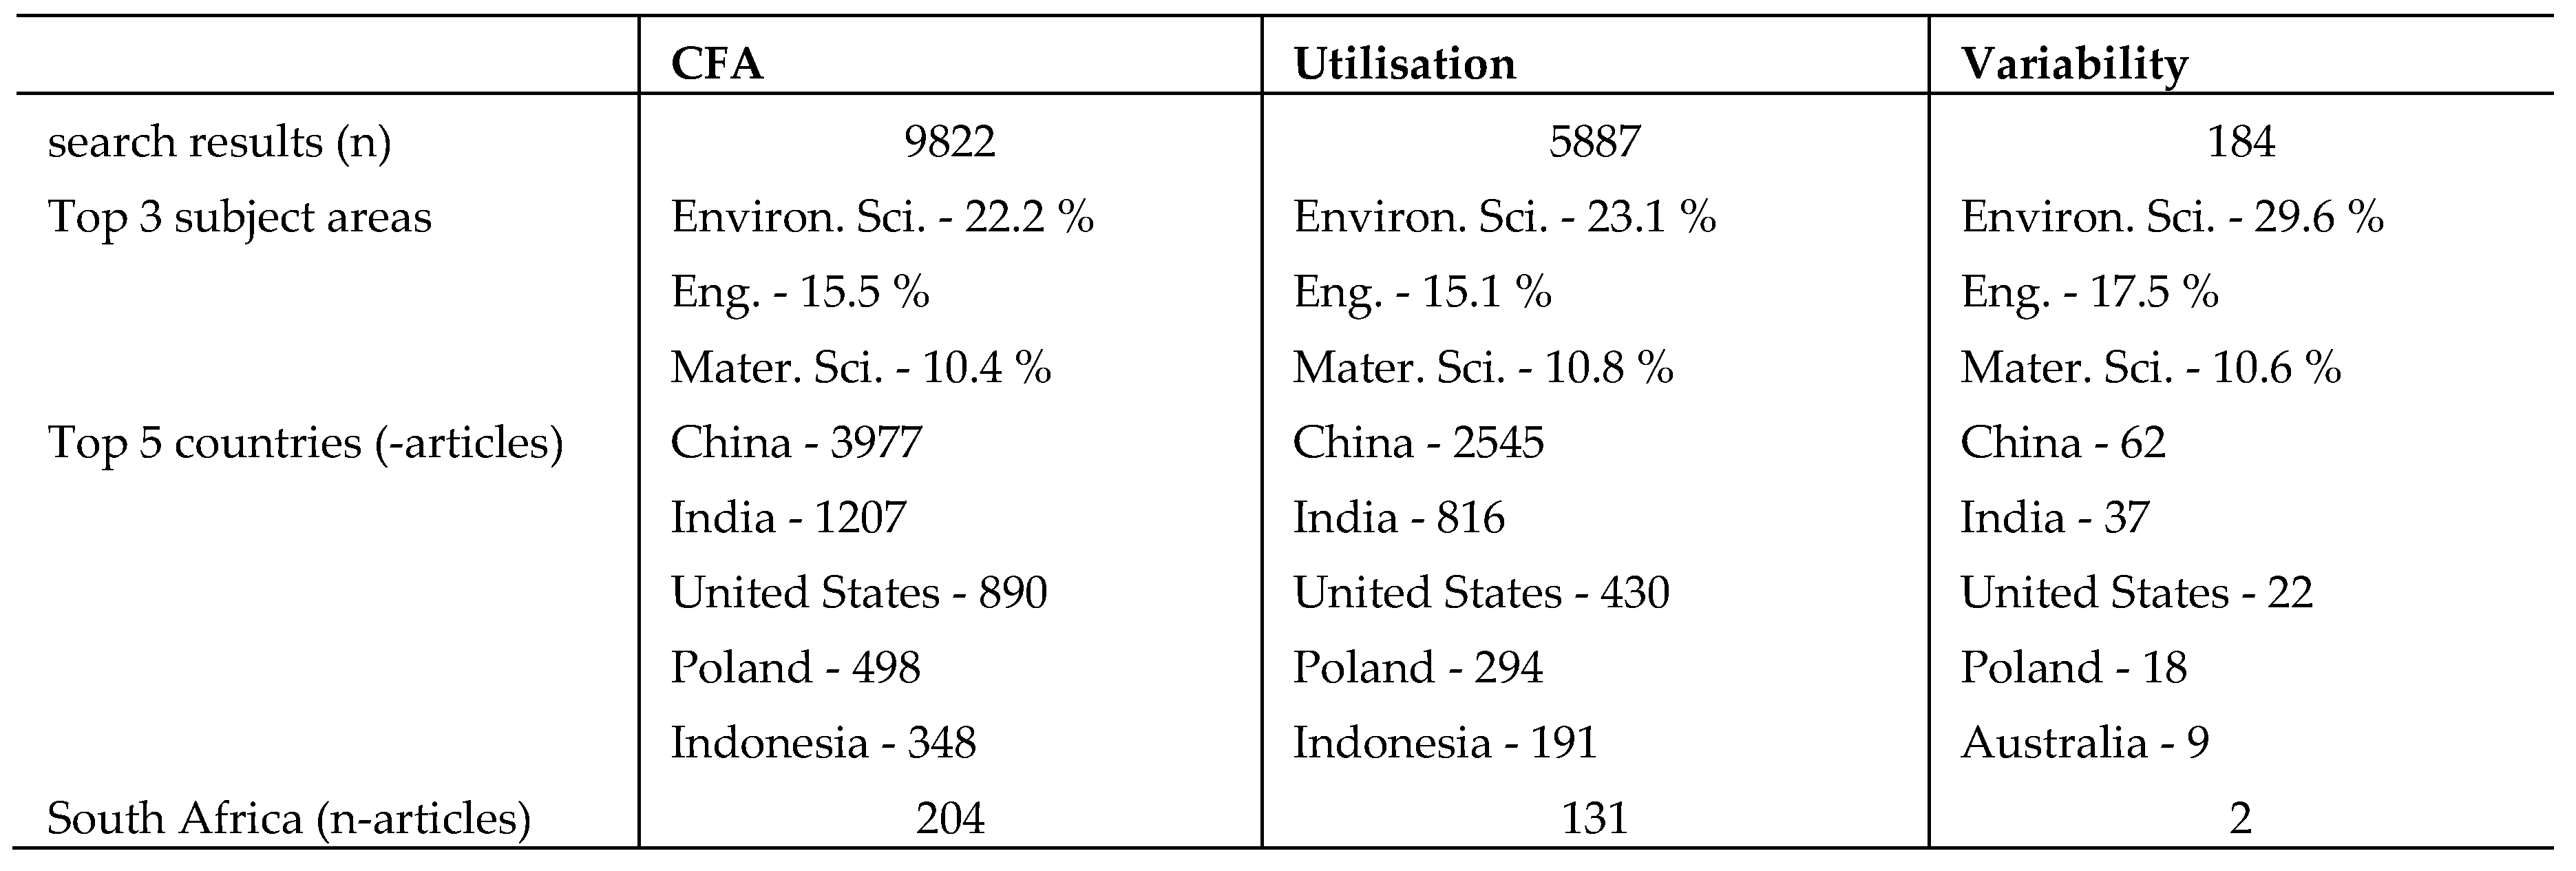 |
Table 2.
Document search results from Scopus database, based on the keywords; legacy coal ash, utilisation, and variability.
Table 2.
Document search results from Scopus database, based on the keywords; legacy coal ash, utilisation, and variability.
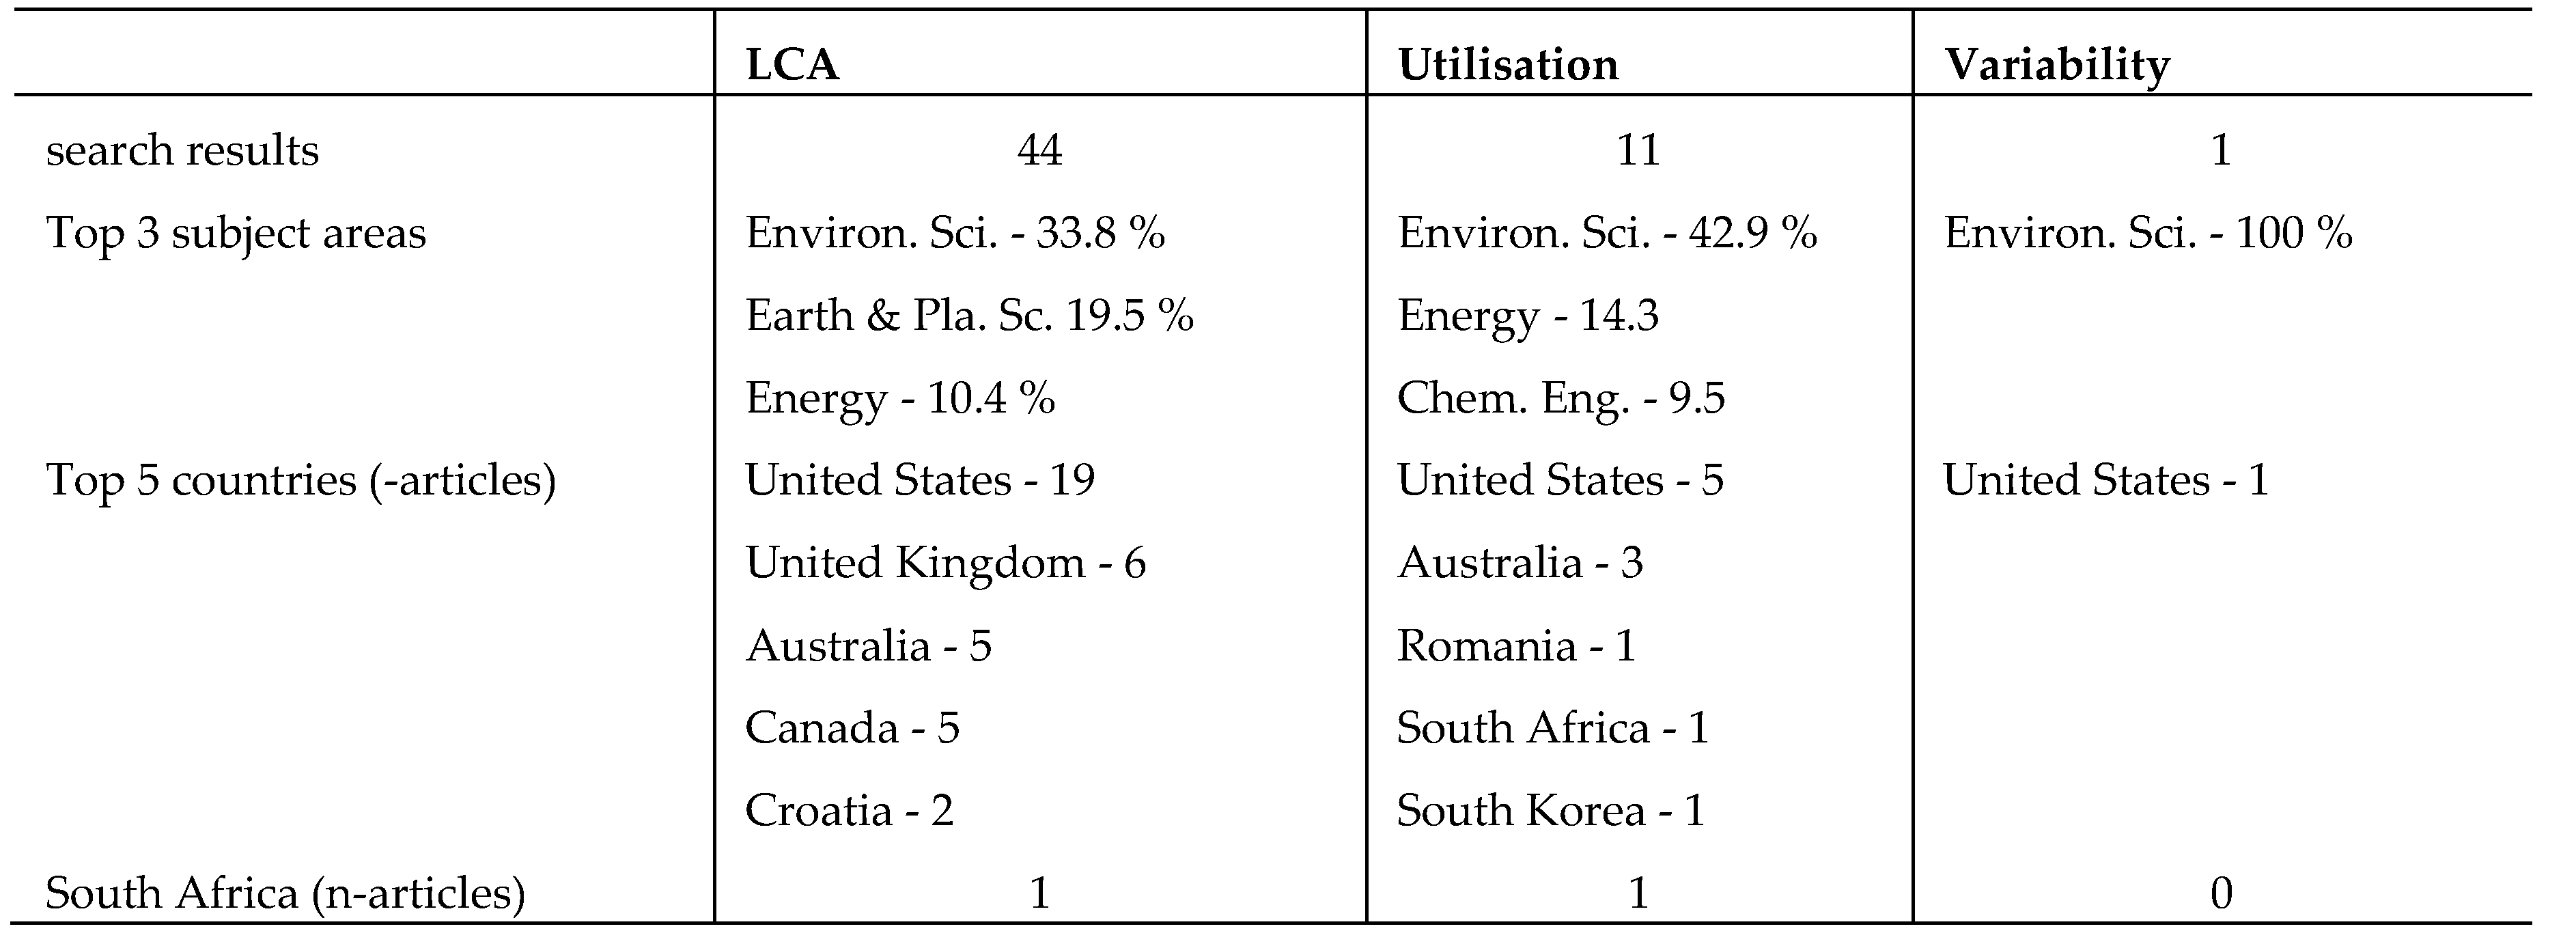 |
Table 3.
Average elemental composition variation of different coal ash types from different power stations. (*The subscript in red represents the sample population – n, also PSD sample was CFA and not LCA).
Table 3.
Average elemental composition variation of different coal ash types from different power stations. (*The subscript in red represents the sample population – n, also PSD sample was CFA and not LCA).
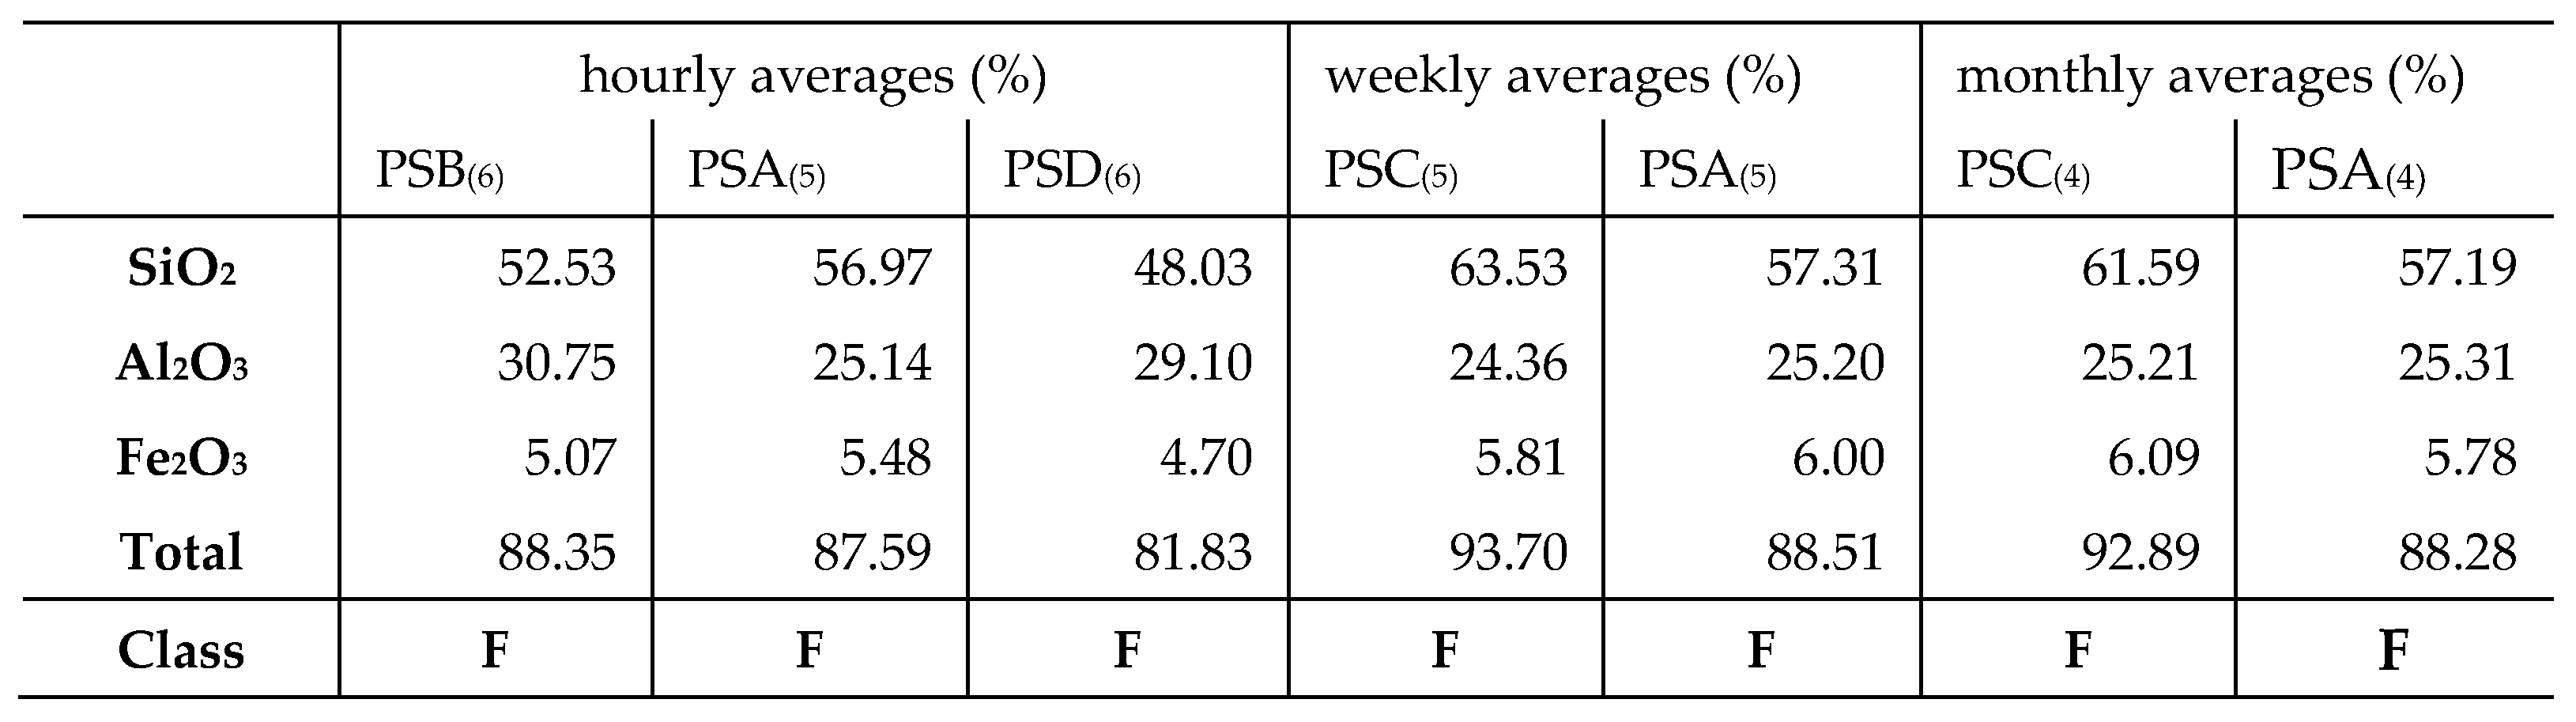 |
Table 4.
Average mineral composition of the coal ashes for samples collected over a 24-hour period. (*The subscript in red represents the sample population – n, also PSD sample was CFA and not LCA).
Table 4.
Average mineral composition of the coal ashes for samples collected over a 24-hour period. (*The subscript in red represents the sample population – n, also PSD sample was CFA and not LCA).
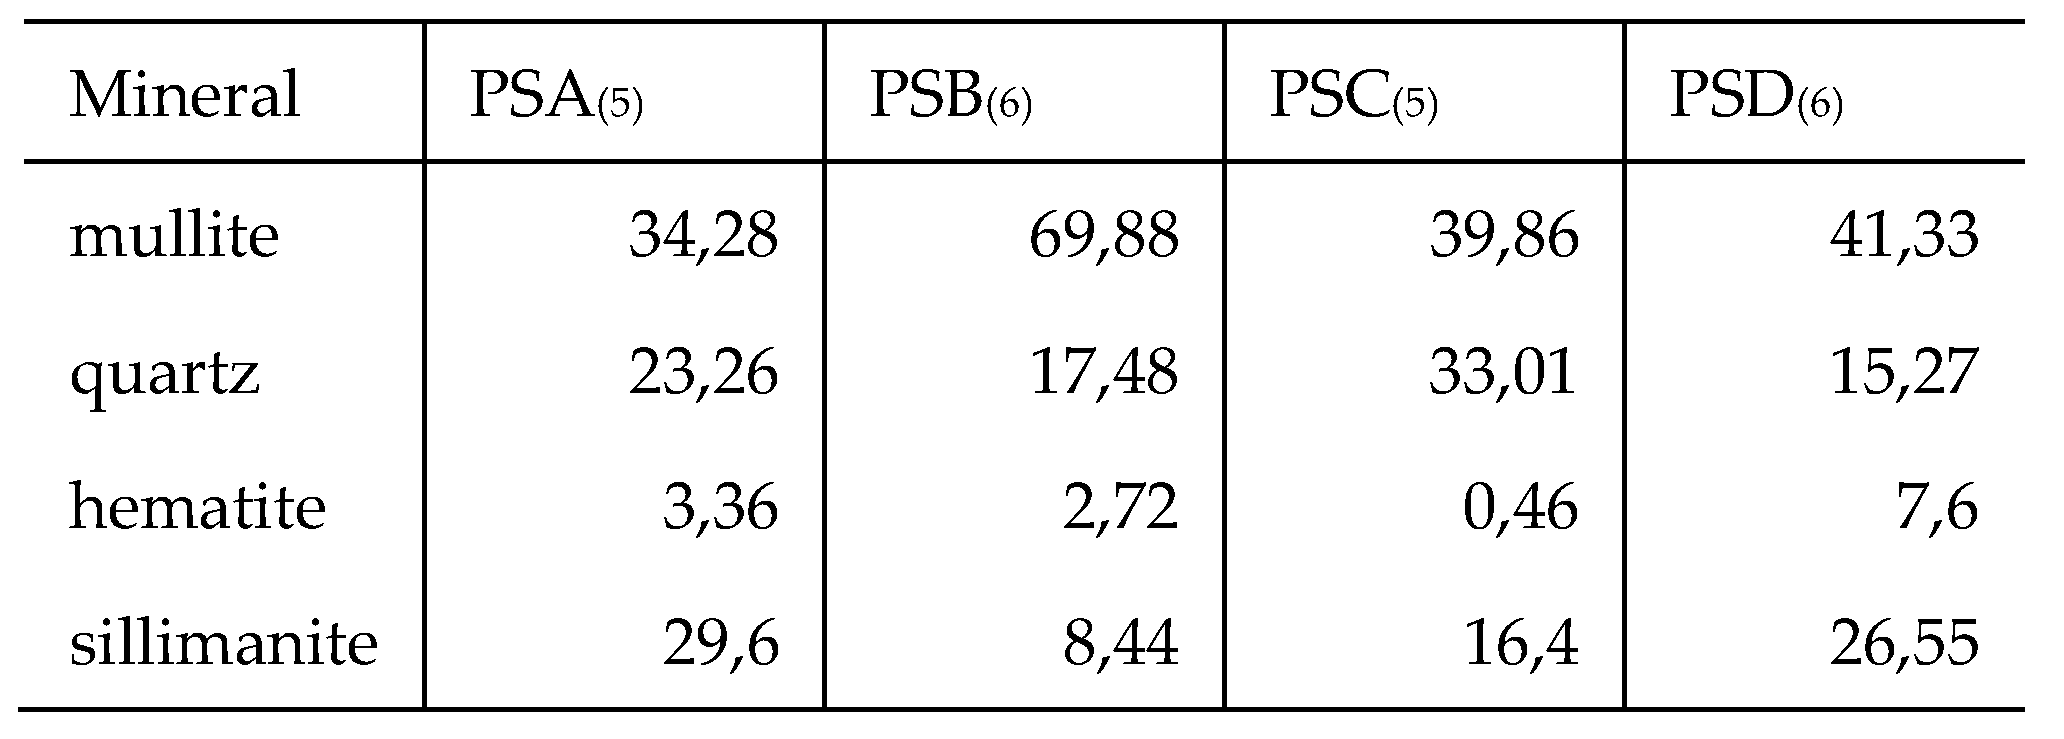 |
Table 5.
Average mineral composition of the coal ashes for samples collected over 5-week and 4-month periods at stations PSC and PSA. (*standard deviation - (sd); interquartile range - (IQR)).
Table 5.
Average mineral composition of the coal ashes for samples collected over 5-week and 4-month periods at stations PSC and PSA. (*standard deviation - (sd); interquartile range - (IQR)).
 |
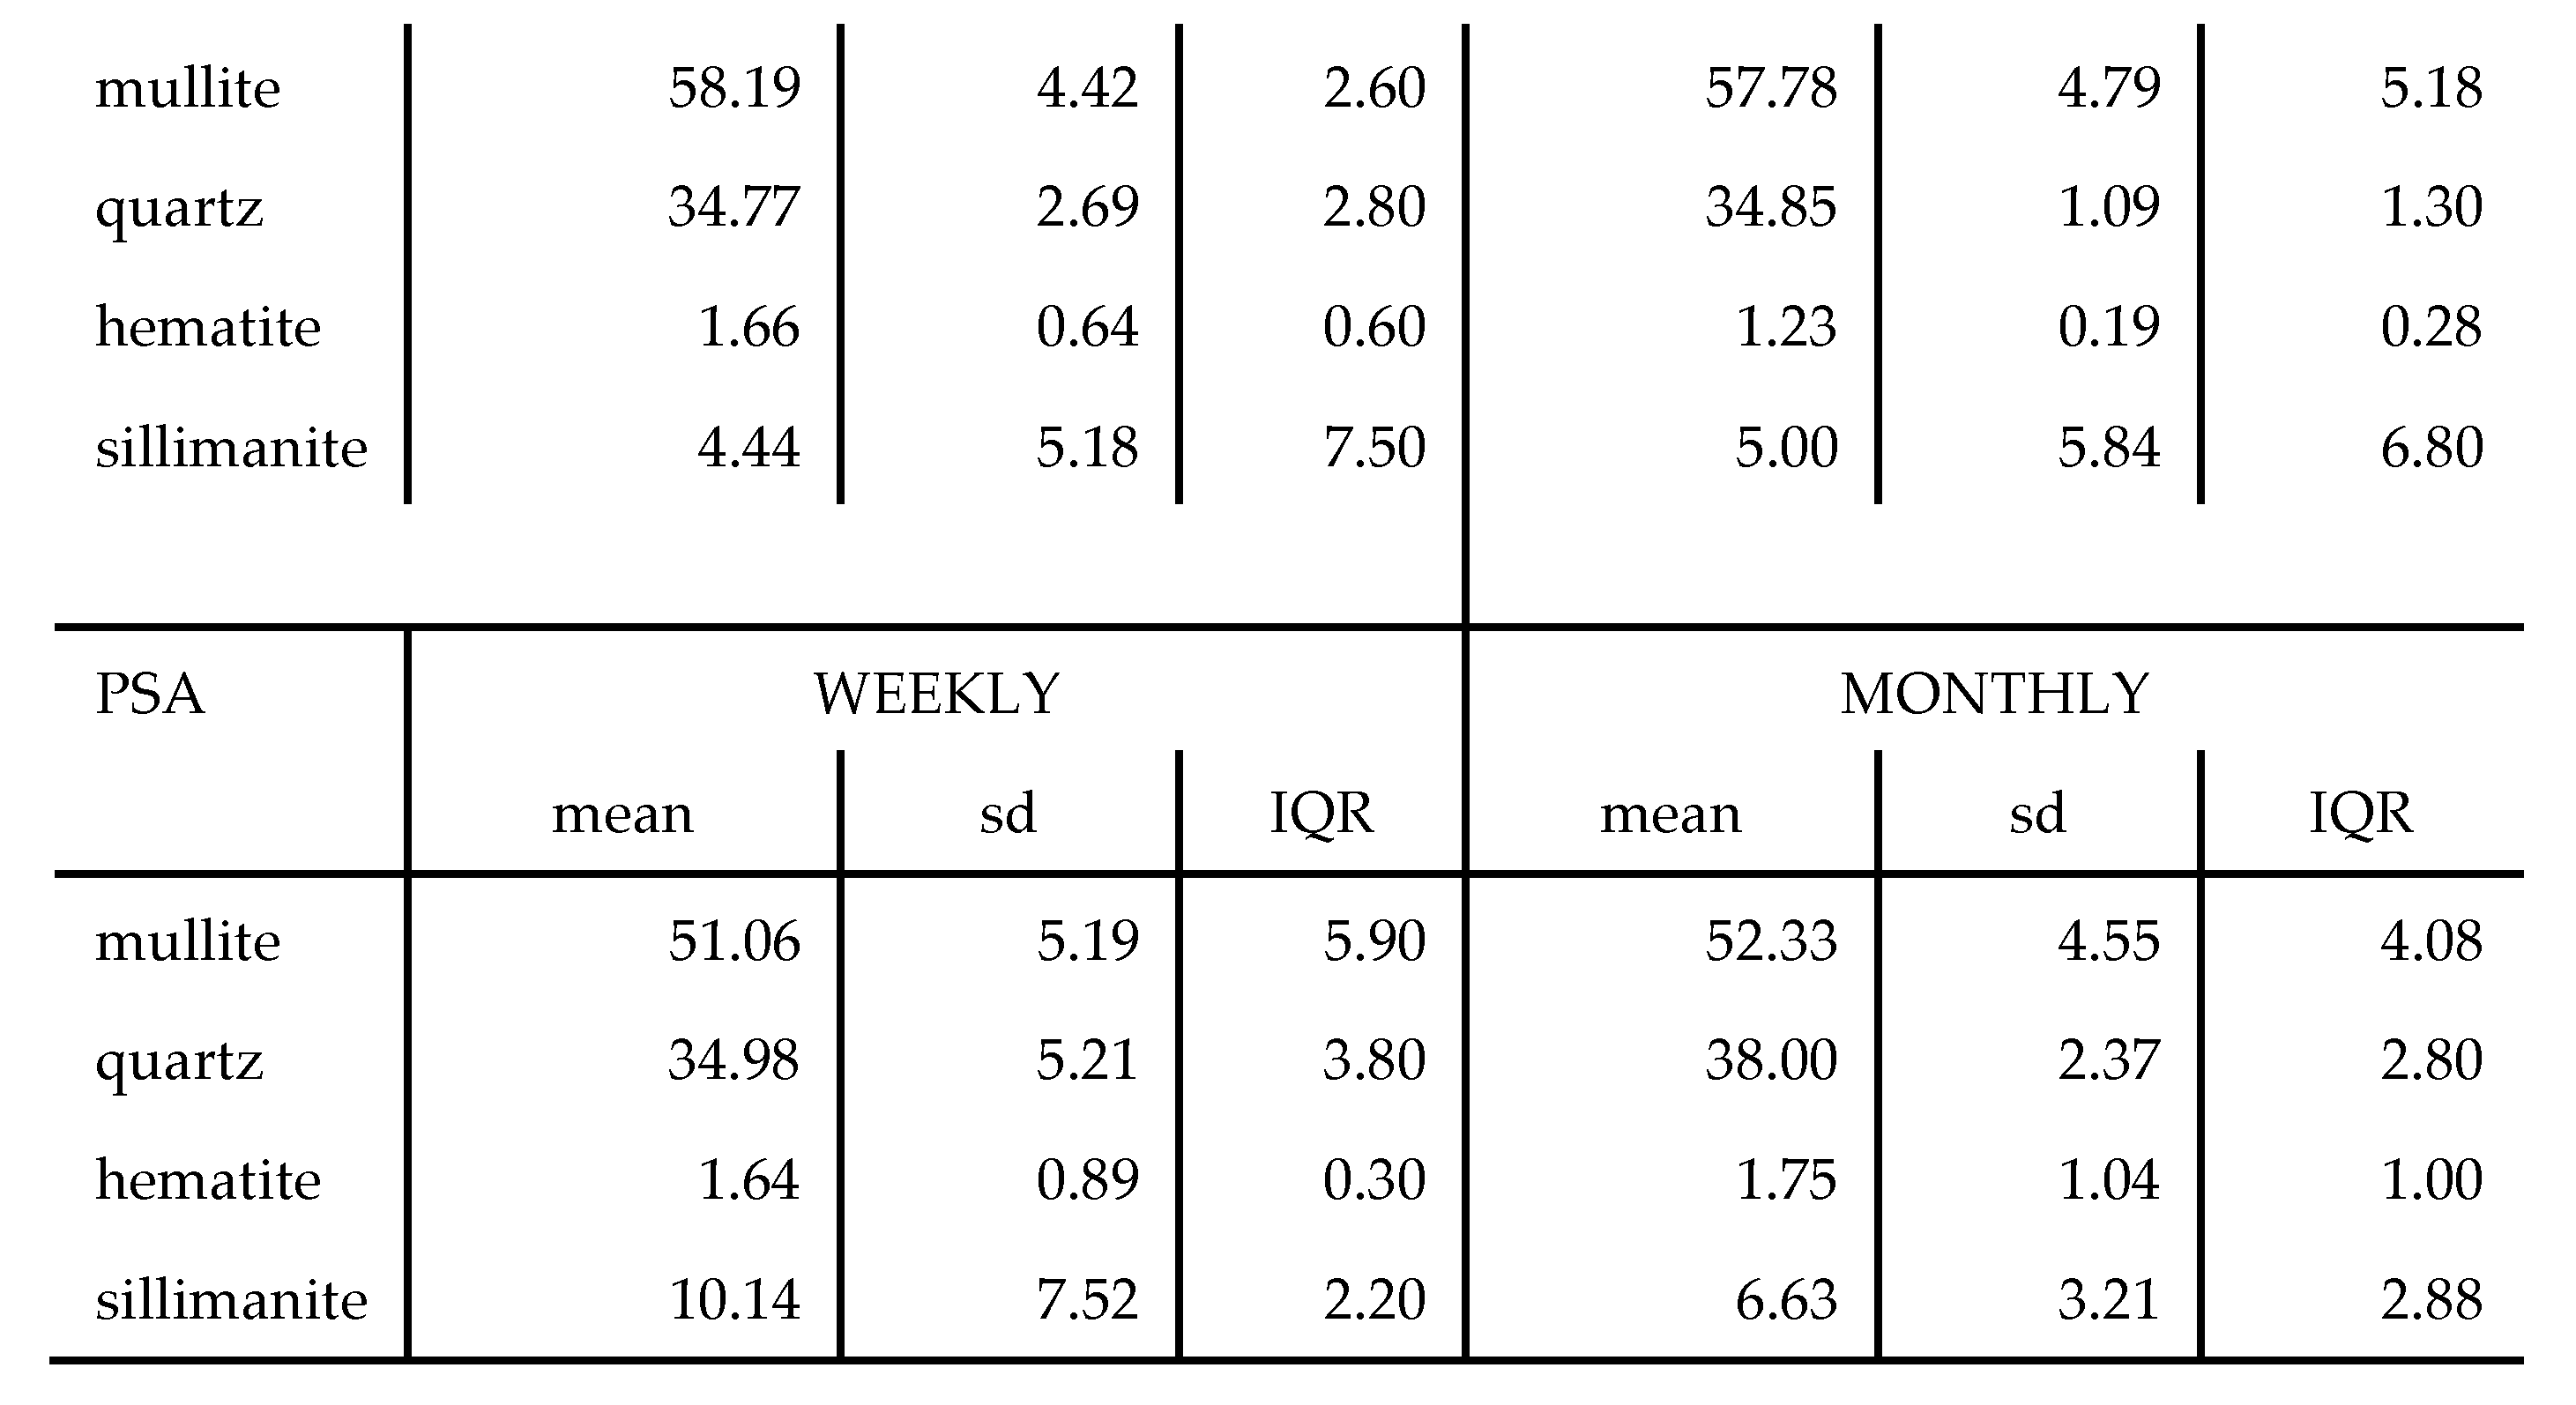 |
Table 6.
Average particle coefficient of uniformity and curvature of coal ash samples.
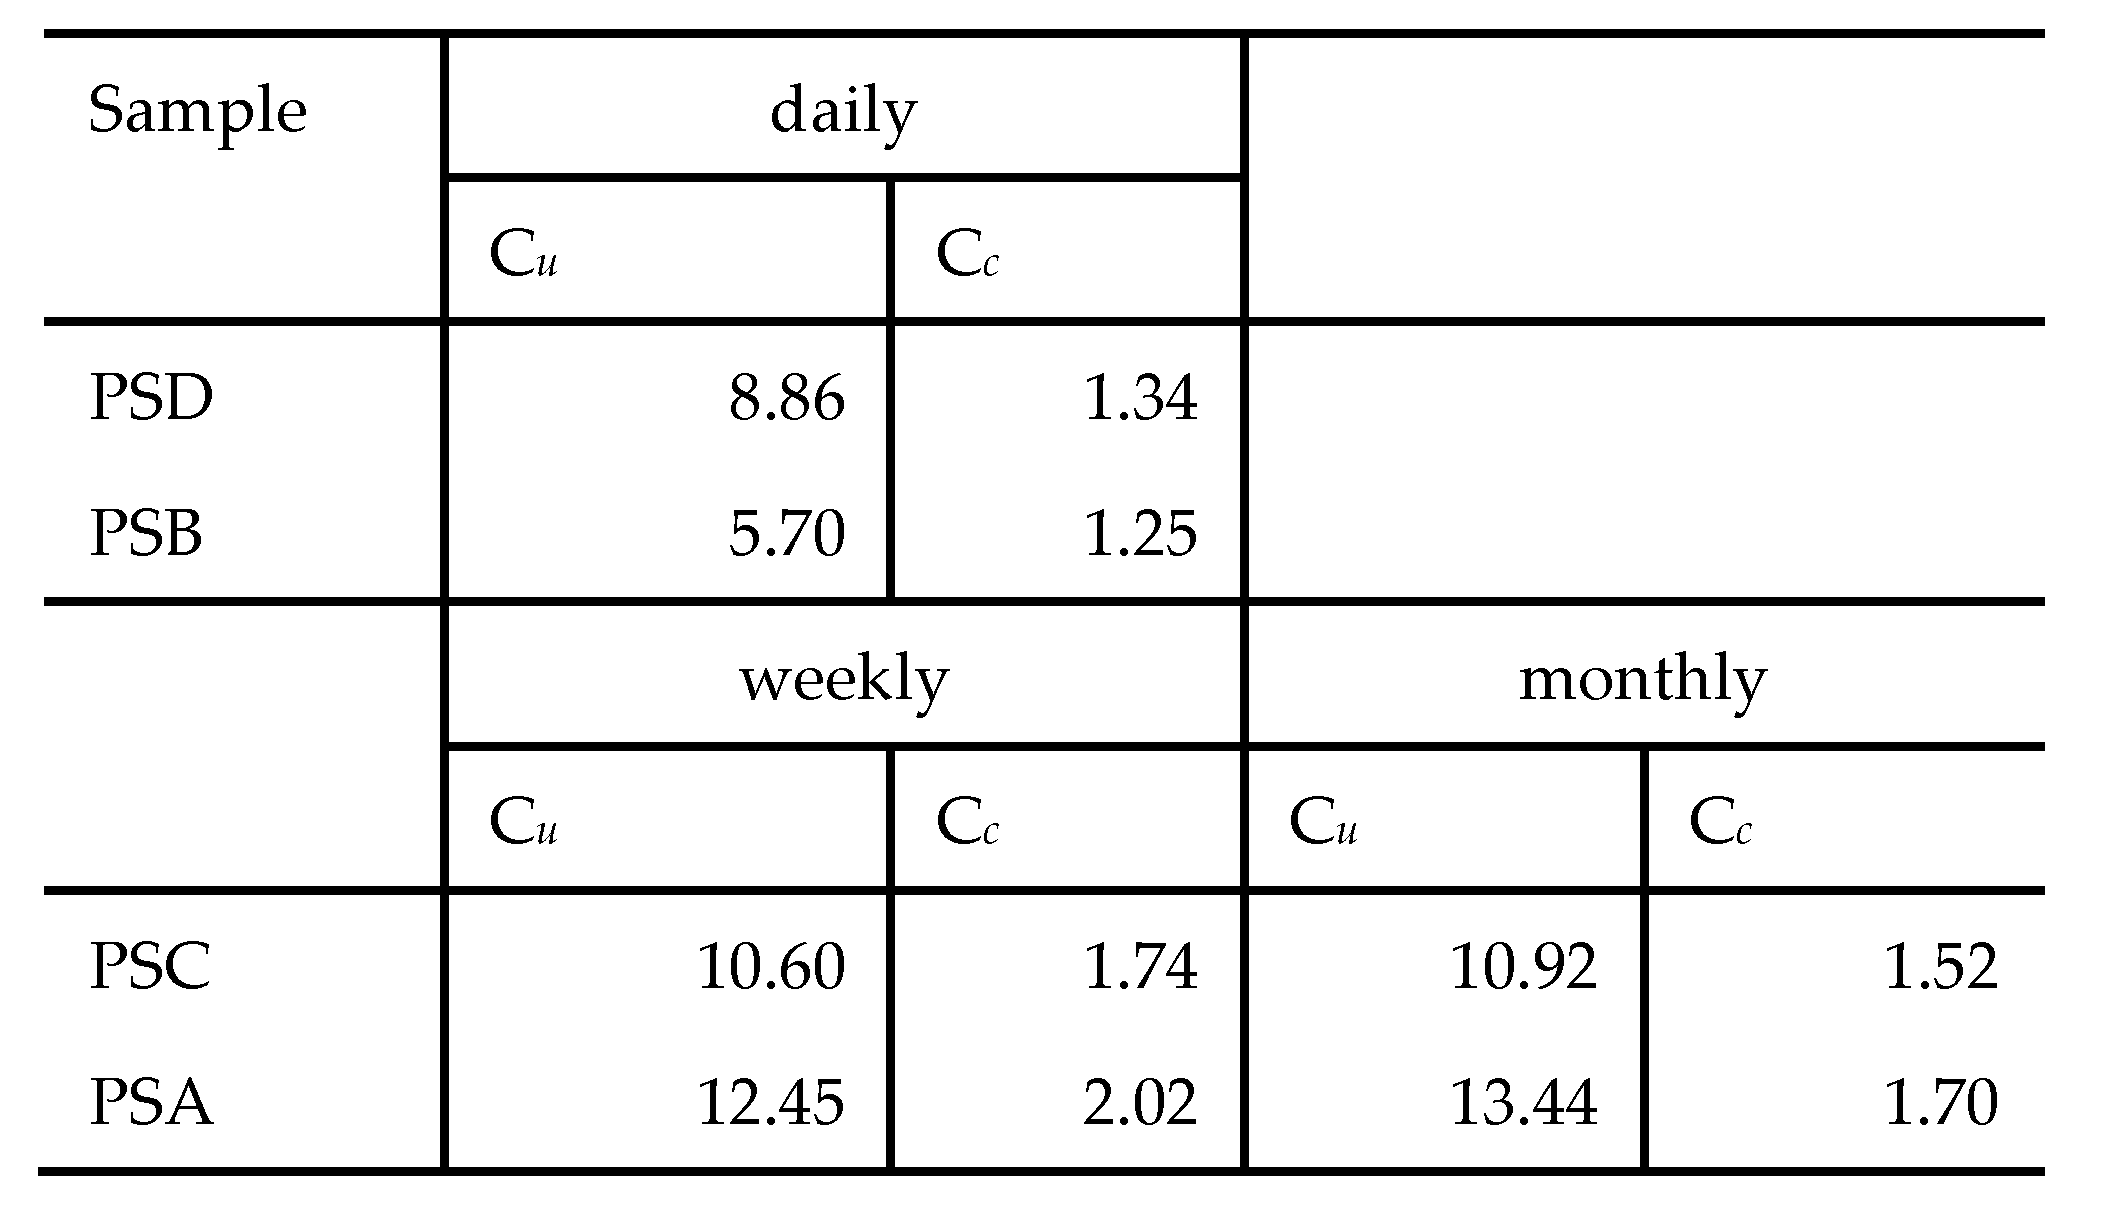 |
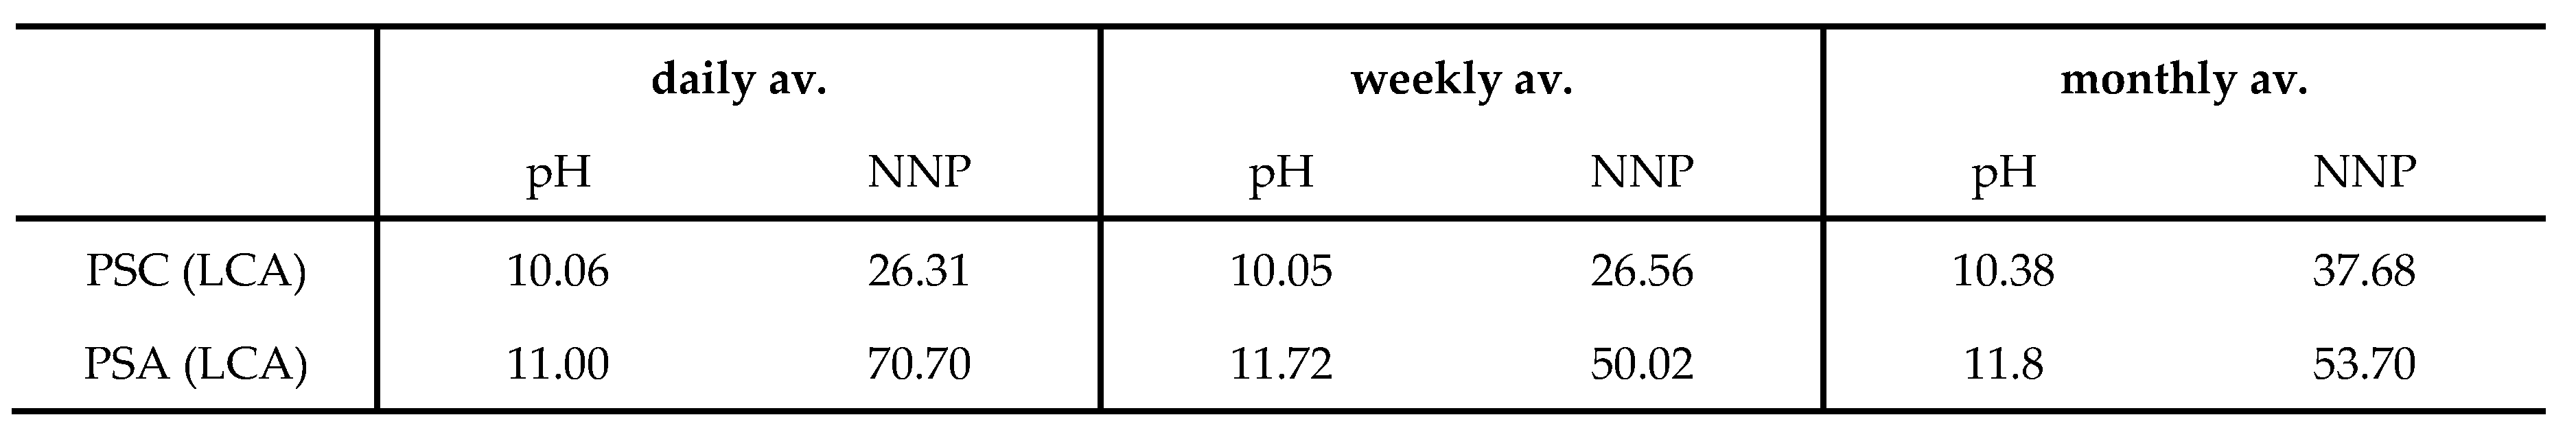
Table 7.
Summary of the pH and NNP averages for PSC and PSA (LCA) samples over 3 sampling phases.
 |
Disclaimer/Publisher’s Note: The statements, opinions and data contained in all publications are solely those of the individual author(s) and contributor(s) and not of MDPI and/or the editor(s). MDPI and/or the editor(s) disclaim responsibility for any injury to people or property resulting from any ideas, methods, instructions or products referred to in the content. |
© 2025 by the authors. Licensee MDPI, Basel, Switzerland. This article is an open access article distributed under the terms and conditions of the Creative Commons Attribution (CC BY) license (http://creativecommons.org/licenses/by/4.0/).
Copyright: This open access article is published under a Creative Commons CC BY 4.0 license, which permit the free download, distribution, and reuse, provided that the author and preprint are cited in any reuse.


