
Submitted:
07 April 2025
Posted:
08 April 2025
You are already at the latest version
Abstract
Aims: to measure whether subjects with high (HBAT) and low activation of brown adipose tissue (LBAT) showed acute differences in energy expenditure during and after 30-minutes of high intense interval training. Methods: Forty professional soccer athletes were invited to participate in the study, of which 37 started the protocol and 35 completed it. This was an acute, double-blind, case-control, quasi-experimental study design. Activation of BAT was estimated to be using infrared thermography. All participants were divided into four groups and compared by condition: (a) HBAT-CAF; (b) HBAT-PLA; (c) LBAT-CAF; and (d) LBAT-PLA. They performed 30 min of high-intensity interval training (HIIT) which included four sets of 4-minute of running in a speed corresponding at 90–95% of HRmax, each followed by a 3-minute active recovery interval at 60–70% of HRmax and 30 min of passive recovery. During exercise and recovery, breath-to-breath spirometry was performed and energy expenditure (EE), carbohydrates (g/day), fats (g/day) and proteins (g/day) were measured. Results: HBAT showed higher EE at all measurement times (p≤0.01) in the CAF condition and at all measurement times in the PLA condition (p≤0.001). For fat catabolism, the CAF condition showed a significant difference between conditions, with CAF showing higher catabolism at 60 min [36.5 g/day (0.8; 137.2); p=0.047] compared to PLA. For PTN catabolism, the HBAT-CAF condition, minutes 40, 50, and 60 showed a significant difference compared to the other measurement times (p≤0.023 for all comparisons). Conclusion: After high-intensity interval exercise with CAF supplementation, both HBAT and LBAT subjects experience a significant increase in EE during exercise and recovery compared to baseline. Basal BAT activity did not affect the rate of CHO and FAT oxidation, although a higher rate of PTN utilization was observed in the HBAT-CAF group.
Keywords:
Caffeine
; Brown adipose tissue
; Infrared thermography
; Aerobic exercise
; Metabolism
1. Introduction
Overweight and obesity are chronic conditions marked by inflammatory processes driven by excess adipose tissue accumulation relative to height, sex, and age [1]. Emerging research highlights brown adipose tissue (BAT) as a metabolically active organ with thermogenic and endocrine functions. BAT secretes signaling molecules termed "batokines," which modulate systemic metabolism by influencing skeletal muscle, liver, pancreatic, and neural activity [2,3]. These interactions enhance glucose and fatty acid uptake in muscle, suppress hepatic lipogenesis, improve beta-cell function, and mitigate cardiovascular strain, collectively promoting metabolic health and aiding in the management of obesity, dyslipidemia, and hypertension [3,4,5]. Despite advances in understanding obesity pathogenesis, gaps persist in translating BAT’s therapeutic potential. It has been probed that activating as little as 50g of BAT may elevate metabolic rate by up to 25%, offering a promising anti-obesity strategy [6].
Brown adipose tissue, once thought exclusive to infants, is now known to persist in adults, as demonstrated by 18F-fludeoxyglucose positron emission tomography (18F-FDG PET/CT) imaging [7]. While 18F-FDG PET/CT remains the gold standard for identifying metabolically active BAT through glucose analog uptake, its clinical utility is limited by radiation exposure and cost [8]. For the other side, Infrared thermography (IRT) presents a non-invasive, low-cost alternative by measuring skin temperature in BAT-rich regions, such as the supraclavicular area, where superficial deposits are abundant [9,10]. IRT quantifies heat emission (a proxy for BAT thermogenesis) before, during, or after cold or pharmacological stimulation, with validation against PET/CT confirming its reliability [11,12].
BAT thermogenesis is driven by mitochondrial uncoupling protein 1 (UCP-1), which dissipates energy as heat [13]. Ergogenic compounds like capsaicin analogs and capsinoids enhance UCP-1 activity, boosting energy expenditure [14,15]. Similarly, CAF (a widely consumed adenosine receptor antagonist) stimulates BAT via β-adrenergic pathways, upregulating UCP-1, PPARγ, and PGC-1α to promote mitochondrial biogenesis and thermogenesis [6,16]. These mechanisms align with caffeine’s observed effects on weight loss and metabolic rate increase [16].
Beside caffeine, exercise stimulate energy expenditure through sympathetic nervous system (SNS) activation, which enhances skeletal muscle metabolism and BAT thermogenesis [5,15]. SNS-mediated norepinephrine release binds β-adrenergic receptors, upregulating UCP-1 and PGC-1α via the p38MAPK pathway [17]. Exercise also elevates adipocyte triglyceride lipase and hormone-sensitive lipase activity, promoting lipid mobilization and white adipose tissue browning [18]. Concurrently, exercise-induced irisin secretion stimulates WAT thermogenesis through mammalian p38 mitogen-activated protein kinase signaling, further linking physical activity to metabolic health [17]. Despite growing interest in BAT activation strategies, limited research explores exercise’s acute effects on BAT-mediated energy expenditure, particularly in combination with ergogenic supplements. This study investigates whether individuals with high (HBAT) versus low BAT activity (LBAT) exhibit differential energy expenditure during and after 28 minutes of HIIT with or without CAF supplementation. We hypothesized that individuals HBAT-CAF would exhibit greater EE and fat catabolism compared to HBAT-PLA, LBAT-CAF and LBAT-PLA.
2. Materials and Methods
Experimental Approach
This study employed a quasi-experimental acute protocol. On the first day of data collection, participants were categorized into either the HBAT or LBAT group based on the thermographic protocol established by Nirengi, et al. [19]. On the next day, a researcher not involved in data collection randomly assigned participants to either the CAF or PLA conditions. Participants then underwent a HIIT protocol lasting 30 minutes, followed by 30 minutes of passive recovery. On the third day (seven days after the second session) the conditions were reversed (crossover design), ensuring that all participants experienced both CAF and PLA conditions. This approach ensured that the study was conducted in a double-blind manner, minimizing bias. Throughout both exercise and recovery periods, participants' physiological responses were monitored using a spirometry protocol to collect relevant data.
Participants
To achieve the objectives of the present study, the researchers established the following inclusion criteria: (a) male; (b) aged 18 years or older; (c) physically active, with a training frequency of at least four times per week; (d) free from any injuries that could impair test performance; and (e) not using stimulant or vasodilator medications. From the initial pool of participants, those who (a) did not complete all stages of the study for any reason, or (b) had errors during the collection or processing of spirometry data were excluded. Forty professional soccer players were invited to participate in the study, of whom 37 began the protocol and 35 completed it. The groups exhibited the following anthropometric characteristics: (a) HBAT: 26.5±4.3 years; 1.7±0.1 m; 77.4±7.2 kg; 25.5±1.8 kg/m²; 15.7±2.0% body fat; and (b) LBAT: 27.0±4.1 years; 1.7±0.1 m; 79.0±8.1 kg; 26.0±1.7 kg/m²; 15.9±4.5% body fat. No significant differences were observed between the two groups for these variables (p≥0.05).
BAT Protocol and Classification
The classification of participants regarding BAT activity was estimated using a thermographic protocol validated by positron emission tomography – PET-CT (gold-standard) [19]. In this protocol, participants (wearing only shorts) remained seated in a climate-controlled room at 19°C and 48% of humidity for 60 minutes. After this period, two thermal images of the upper trunk region were captured following the thermographic imaging protocol proposed by Moreira, et al. [20]. The highest-quality image was selected for analysis. BAT activity was calculated based on the temperature difference between the mean of the supraclavicular region and a reference external region (control). Participants with a temperature difference of ≥1.03°C were classified into the HBAT group. This cut-off demonstrated a specificity of 84.6%, sensitivity of 85.7%, and accuracy of 85.4% [19].
A thermal imaging camera (FLIR T335, FLIR Systems, Sweden) with a resolution of 320x240 pixels, a spectral range of 7.5 to 13.0 µm, an image frequency of 30 Hz, a thermal sensitivity of 50 mK at 30°C, and an accuracy of ±2% was used for registering the thermograms. The emissivity values were set at 0.98, corresponding to the emissivity of human skin. A thermographic image (thermogram) was captured, including the anterior cervical and supraclavicular regions, at 0, 10, 20, 30, 40, 50, and 60 minutes after starting the exercise protocol. Figure 1 illustrates an example of the regions of interest selected for the BAT activity estimation by infrared radiation.
To obtain Tsk data from the recorded thermograms, FLIR Tool+ analysis software (FLIR, Sweden) was used. With this software and following the procedure described by Yoneshiro, et al. [21], regions of interest (ROI) were delimited by selecting two 21 x 21 pixel circles, one above the left median clavicular region (1) and the other in the upper thorax (2). The ROIs were selected on the left side of the subject because previous studies indicate that the pulmonary vascular bundle influences the results on the right side of the subject.
Pre-Exercise Breakfast and Supplement
Data collection was conducted always in the early morning to minimize variability and control for potential circadian influences. Participants were instructed to arrive at the laboratory at 07:00 a.m., where they were provided with a standardized breakfast totaling approximately 320 kcal. The meal included a medium banana (≈90 kcal), two slices of whole-wheat bread (140 kcal) with peanut butter (≈90 kcal), and lemon-flavored water (0 kcal). Concurrently with breakfast, participants were administered a capsule containing either (a) CAF (375 mg, ≈4.8 mg/kg body mass) or (b) PLA (maltodextrin), depending on their assigned experimental condition. This protocol ensured that all participants began the study under consistent nutritional and physiological conditions.
High Intensity Interval Training, Recovery Protocol and Spirometric Measurements
One hour after consuming breakfast and the randomized capsule intake, participants performed a HIIT protocol adapted from Tjønna, et al. [22]. The protocol comprised four 4-minute sprints at 90–95% of maximum heart rate (HRmax), each followed by a 3-minute active recovery interval at 60–70% of HRmax. While the original protocol spanned 28 minutes, the final active recovery interval was extended by 2 minutes in this study to standardize the total measurement duration at 30 minutes. HRmax was estimated using the formula established by Roy and Mccrory [23]: [HRmax = 208 − (0.7 × age)].
Following the HIIT session, participants rested in a supine position for 30 minutes while recovery metabolism was assessed via indirect calorimetry. A portable breath-by-breath gas analyzer (Metalyzer 3BR3®, Cortex, Leipzig, Germany) was used to collect metabolic data at seven time points: 0, 10, 20, 30, 40, 50, and 60 minutes. Measurements from 0–30 minutes corresponded to the effort phase, while the subsequent 30 minutes represented the recovery phase. Prior to each session, the device was calibrated in accordance with the manufacturer’s specifications. Throughout the experiment, oxygen consumption and carbon dioxide production were continuously monitored to estimate total EE (kcal) and substrate utilization rates (g/day) for CHO, FAT and PTN. CHO and FAT oxidation rates were derived using Frayn’s stoichiometric equations Alcantara, et al. [24], whereas PTN catabolism was calculated via the analyzer’s proprietary software (Metasoft® Studio 5.5.1, Cortex, Leipzig, Germany).
Data Analysis
Data were initially organized and managed in spreadsheets using Microsoft Excel 2024 (Microsoft Corporation, Redmond, WA, USA). Statistical analyses were conducted via generalized estimating equations, a method suited for clustered data, as outlined by Ballinger [25]. When significant main or interaction effects were identified in the models, pairwise comparisons were adjusted for multiple testing using the Bonferroni post-hoc procedure. All analyses were performed in IBM SPSS Statistics (Version 25.0, IBM Corporation, Armonk, NY, USA), with statistical significance defined a priori as p ≤ 0.05.
3. Results
For EE we observed an interactive effect between Group X Supplement X Moment of measurement (W = 12.745; GL = 6; p = 0.047). For moment of measurement comparison HBAT-CAF group showed differences at 0 min vs. 40 min [1,018.3 kcal (632.0; 1,404.6); p≤0.001], 50 min [2,276.0 kcal (1,997.9; 2,554.1); p≤0.001] and 60 min [2,411.5 kcal (2,107.0; 2,715.9); p≤0.001], at 10 min vs. 40 min [1,010.6 kcal (691.2; 1,330.0); p≤0.001], 50 min [2,268.3 kcal (2,039.2; 2,497.3); p≤0.001] and 60 min [2,403.7 kcal (2,171.0; 2,636.4); p≤0.001], at 20 min vs. 30 min [-295.5 kcal (-521.7; -68.7); p=0.011], 40 min [900.2 kcal (549.4; 1,251.0); p≤0.001], 50 min [2,157.9 kcal (1,892.6; 2,423.1); p≤0.001] and 60 min [2,293.4 kcal (2,001.5; 2,585.2); p≤0.001], at 30 min vs. 40 min [1195.4 kcal (857.3; 1,533.5); p≤0.001], 50 min [2,453.1 kcal (2212.1; 2,694.1); p≤0.001] and 60 min [2,588.6 kcal (2,322.6; 2,854.5); p≤0.001], and at 50min vs. 60 min [135.5 kcal (41.7; 229.2); p=0.05].
Comparations of the HBAT-PLA group results by moment showed differences at 0 min vs. 30 min [-433.9 kcal (-810.3; -57.5); p=0.024], 40 min [707.2 kcal (286.0; 1,128.3); p=0.001], 50 min [1,167.1 kcal (1378.1; 1,976.1); p≤0.001] and 60 min [1613.7 kcal (1297.2; 1930.3); p≤0.001], at 10 min vs. 20 min [-359.5 kcal (-642.9; -76.2); p=0.013], 30 min [-584.7 kcal (-920.7; -248.7); p=0.001], 40 min [556.4 kcal (239.5; 873.3); p=0.001], 50 min [1,526.3 kcal (1246.4; 1,806.3); p≤0.001] and 60 min [1463.0 kcal (1206.0; 1720.0); p≤0.001], at 20 min vs. 30 min [-225.1 kcal (-425.5; -24.8); p=0.028], 40 min [915.9 kcal (631.5; 1,200.4); p≤0.001], 50 min [1,885.9 kcal (1,668.7; 2,103.1); p≤0.001] and 60 min [1,822.5 kcal (1,571.7; 2,073.3); p≤0.001], at 30 min vs. 40 min [1141.1 kcal (790.9; 1,491.2); p≤0.001], 50 min [2,111.0 kcal (1,823.2; 2,398.9); p≤0.001] and 60 min [2,047.6 kcal (1782.2; 2,313.1); p≤0.001], and at 40 min vs. 50 min [970.0 kcal (746.8; 1,193.1); p≤0.001] and 60 min [906.6 kcal (624.3; 1,188.9); p≤0.001].
LBAT-CAF group showed differences by moment at 0 min and other moments of measurement (p≤0.043) except 10 min [-200.2 kcal (-567.5; 167.1); p=0.285], at 10 min showed differences vs. the other moments of measurement (p≤0.01) except 30 min [-274.4 kcal (-563.5; 14.7); p=0.063], at 20 min showed difference vs. the other moments of measurement (p≤0.01) except 30 min [62.7 kcal (-201.2; 327.0); p=0.641], at 30 min showed significative differences vs. 40 min [1057.7 kcal (552.1; 1,563.4); p≤0.001], 50 min [2107.1 kcal (1724.0; 2,490.2); p≤0.001] and 60 min [2,150.1 kcal (1,754.8; 2,545.3); p≤0.001], and at 40 min showed significative differences vs. 50 min [1049.3 kcal (798.0; 1,300.7); p≤0.001] and 60 min [1,092.3 kcal (880.9; 1,303.7); p≤0.001].
Finally, the LBAT-PLA group showed a significative differences at 0 min vs. all moments of measurement (p≤0.023) except 10 min [69.8 kcal (-272.6; 412.2); p=0.69] and 40 min [266.5 kcal (-123.5; 656.6); p=0.18], at 10 min vs. all moments of measurement except 40 min [196.8 kcal (-378.7; 772.2); p=0.503], at 20 min vs. all moments of measurement except 30 min [52.0 kcal (-326.5; 430.5); p=0.788], at 30 min vs. 40 min [719.2 kcal (74.8; 1,363.6); p=0.029], 50 min [1833.9 kcal (1382.9; 2,285.0); p≤0.001] and 60 min [1977.1 kcal (1,569.3; 2,384.9); p≤0.001], at 40 min showed significative differences vs. 50 min [1114.7 kcal (824.9; 1,404.6); p≤0.001] and 60 min [1,257.9 kcal (843.6; 1,672.1); p≤0.001].
In CAF condition HBAT group showed a significative high EE vs. LBAT group in all moments of measurement except 20 min [273.0 kcal (-86.6; 632.7); p=0.137], 50 min [284.9 kcal (-8.8; 578.6); p=0.057] and 60 min [192.5 kcal (-104.8; 489.7); p=0.204]. In PLA condition HBAT showed a higher EE vs. LBAT at 0 min [466.4 kcal (66.7; 866.1); p=0.022] and 60 min [377.1 kcal (162.6; 591.6); p=0.001]. Finally, regardless of group, CAF showed a higher EE in all moments of measurement (p≤0.014). Figure 2 shows the EE for all groups and conditions.
For CHO catabolism, there were significative interaction between Condition X moments of measurement (W = 15,574; GL = 6; p = 0.016). CAF showed significative differences between 50 min vs all moments of measurement except 60 min [46.3 g/day (-3.8; 96.5); p=0.105]. Similarly for PLA we observed significative differences between 50 min vs all moments of measurement except 60 min [-6.0 g/day (-60.0; 48.1); p=1.0]. When compared to PLA, CAF presents a higher catabolism at 0 min [207.3 g/day (86.8; 327.7); p=0.001], 10 min [172.2 g/day (47.5; 296.9); p=0.007], 40 min [136.8 g/day (56.6; 217.0); p=0.001] and 50 min [69.0 g/day (0.8; 137.2); p=0.047].
To FAT catabolism we observed an interaction effect between Condition X moments of measurement (W = 19,403; GL = 6; p = 0.004). For moments of measurement CAF showed a significative difference between 60 min vs. 0 min [63.1 g/day (8.5; 117.7); p=0.009], 10 min [66.8 g/day (12.3; 121.3); p=0.004] and 40 min [104.2 g/day (71.6; 136.7); p≤0.001]. For significative differences between Conditions, CAF showed a higher catabolism at 60 min [36.5 g/day (0.8; 137.2); p=0.047] when compared to PLA.
About PTN catabolism, we find an interactive effect between Group X Supplement X Moment of measurement (W = 14.783; GL = 6; p = 0.022). For HBAT-CAF 40, 50 and 60 min showed a significative difference for the other moments of measurement (p≤0.023 for all comparisons). HBAT-PLA present difference 0 min vs other moments of measurement (p≤0.01) except 10 (p=0.111) and 20 min (p=0.144). 10 min showed difference vs. other moments (p≤0.002) except 40 min (p=0.082). 50 and 60 min showed difference vs. others (p≤0.001). For LBAT-CAF we observed differences between 40 min and other moments of measurement (p≤0.015). 50 and 60 min showed difference vs. others (p≤0.001). 20 min showed difference vs. 0 [6.9 g/day (2.3; 11.5); p=0.003] and 10 min [4.7 g/day (1.5; 8.0); p=0.004]. For LBAT-PLA 50 and 60 min showed difference vs. others (p≤0.001). 40 min showed difference vs others (p≤0.042) except 10 min (p=0.139). 0 min present difference vs. 20 [-9.3 g/day (-14.3; -4.3); p≤0.001] and 30 min [-17.1 g/day (-32.3; -2.0); p=0.027]. 10 present difference vs. 20 min [-9.0 g/day (-14.4; -3.6); p=0.001]. For Group and Condition comparison, HBAT-CAF showed a significative difference vs HBAT-PLA at all moments of measurement (p≤0.01), except 20 min (p=0.57). LBAT-CAF presents a significant difference in all moments of measurement (p≤0.002) vs. LBAT-PLA, except 20 (p=0.122) and 30 min (p=0.367).
4. Discussion
While BAT is a key regulator of energy homeostasis, the combined effects of thermogenic compounds and exercise on BAT activity remain underexplored in humans [26]. This study is the first to investigate the acute interaction between HIIT and CAF intake in individuals stratified by BAT activity. While our hypothesis was partially supported, because participants in the HBAT-CAF exhibited significantly higher EE during and post-exercise compared to other groups (HBAT-PLA, LBAT-CAF, LBAT-PLA). However, no significant differences in CHO or fat oxidation rates were observed across BAT activation states. Intriguingly, HBAT-CAF was linked to higher PTN catabolism at all measurement time points except 20 minutes, suggesting a transient metabolic shift. These findings underscore the potential of combining HIIT and CAF to amplify energy expenditure, a critical factor in weight management [27]. Prior studies confirm CAF’s capacity to stimulate BAT thermogenesis [6,12], yet the interplay between exercise and thermogenic supplements in modulating BAT activity remains poorly characterized, highlighting the novelty of this work [26].
Our results bridges this gap, revealing that a CAF supplementation (4.8 mg/kg) amplified EE across all groups, irrespective of BAT activation status, consistent with previous studies of Pérez, Soto, Barroso, Dos Santos, Queiroz, Miarka, Brito and Quintana [12]. CAF likely potentiates HIIT-induced sympathetic nervous system (SNS) activation, as it stimulates β-adrenergic receptors to enhance metabolic and cardiovascular activity [6]. This synergy may explain the pronounced EE in HBAT-CAF, where elevated norepinephrine (NE) levels during HIIT [28] and post-exercise cortisol release [29] likely amplified thermogenesis. Notably, peak EE occurred between 10–30 minutes of HIIT, aligning with studies linking exercise intensity to catecholamine surges [29,30]. While HIIT predominantly relies on anaerobic glycolysis, aerobic pathways (potentiated by SNS activation) contribute to sustained lipolysis and EE [31,32]. Despite these effects, BAT activation did not modulate substrate oxidation, contrasting with Mekonen, et al. [33], who identified exercise-induced proteolysis as a minor but measurable energy source.
Differently, we observed PTN catabolism in HBAT-CAF may reflect transient metabolic demands, though protein supplementation strategies could mitigate nitrogen imbalance without compromising performance [34]. These results position HIIT combined with caffeine as a viable strategy to combat obesity through elevated EE, consistent with D'Amuri, Sanz, Capatti, Di Vece, Vaccari, Lazzer, Zuliani, Dalla Nora and Passaro [30], who reported HIIT’s efficacy in weight loss and cardiovascular improvement. Despite the innovative results, our protocol presents limitations, which include the indirect assessment of supraclavicular BAT via thermography, which may underestimate heat emission in individuals with low BAT volume [19]. Additionally, the 85% accuracy in BAT classification raises potential misgrouping risks. Future studies should explore interactions between moderate-intensity exercise, caffeine, and BAT activity in diverse populations, including females and sedentary individuals, to improve translational applications.
5. Conclusions
Based on our aims, methodology, findings, and limitations, we conclude that CAF supplementation increases EE in both HBAT and LBAT groups during and after a HIIT session. While basal BAT activity did not influence CHO or fat oxidation rates. Furthermore, the HBAT-CAF demonstrated a marked increase in PTN catabolism. These results suggest that combining acute exercise with caffeine may enhance EE, offering a potential strategy to address energy imbalance in overweight and obesity management. Further research is warranted to explore long-term metabolic adaptations and the mechanistic role of BAT in substrate utilization.
Author Contributions
CJB, DASS, ACCQ and DIVP contributed to the study conception and design. Material preparation, data collection and analysis were performed by DASS, MRS, MLGR and AIAO. The first draft of the manuscript was written by CJB, DIVP, MSQ, EAM, BM and DASS and all authors commented on previous versions of the manuscript. All authors read and approved the final manuscript.
Funding
This research was funded by “Fundação de Amparo à Pesquisa do Estado de Minas Gerais- FAPEMIG”. Project: “Efeito da interação entre a suplementação de cafeína e o exercício físico na ativação do tecido adiposo marrom” (Grant: 2070.01.0004535/2021-70).
Institutional Review Board Statement
This study was conducted in accordance with the Declaration of Helsinki and approved by the Institutional Review Board (or Ethics Committee) of Santo Tomás University (82.17).
Informed Consent Statement
Informed consent was obtained from all subjects involved in the study.
Data Availability Statement
The database for this study will be made available on demand, just send an email to ciro.brito@ufjf.br.
Acknowledgments
We thank the Club de Deportes Puerto Montt for supporting this study.
Conflicts of Interest
The authors declare no conflicts of interest.
Abbreviations
The following abbreviations are used in this manuscript:
| BAT | Brown adipose tissue |
| HBAT | High brown adipose tissue |
| LBAT | Low brown adipose tissue |
| CAF | Caffeine |
| PLA | Placebo |
| EE | Energy expenditure |
| CHO | Carbohydrate |
| FAT | Lipids |
| PTN | Protein |
| HIIT | High intensity interval training |
| HRmax | Maximum heartrate |
| 18F-FDG PET/CT | 18F-fludeoxyglucose positron emission tomography |
| IRT | Infrared thermography |
| UCP-1 | Uncoupling protein 1 |
| PGC-1α | peroxisome proliferator-activated receptor-gamma coactivator |
| SNS | sympathetic nervous system |
References
- Fortunato, I.M.; Pereira, Q.C.; Oliveira, F.d.S.; Alvarez, M.C.; Santos, T.W.d.; Ribeiro, M.L. Metabolic Insights into caffeine’s anti-adipogenic effects: An exploration through intestinal microbiota modulation in obesity. International Journal of Molecular Sciences 2024, 25, 1803. [Google Scholar] [CrossRef] [PubMed]
- Scheele, C.; Wolfrum, C. Brown adipose crosstalk in tissue plasticity and human metabolism. Endocrine reviews 2020, 41, 53–65. [Google Scholar] [CrossRef]
- Yang, F.T.; Stanford, K.I. Batokines: mediators of inter-tissue communication (a mini-review). Current obesity reports 2022, 11, 1–9. [Google Scholar] [CrossRef] [PubMed]
- Raiko, J.; Orava, J.; Savisto, N.; Virtanen, K.A. High brown fat activity correlates with cardiovascular risk factor levels cross-sectionally and subclinical atherosclerosis at 5-year follow-up. Arterioscler Thromb Vasc Biol 2020, 40, 1289–1295. [Google Scholar] [CrossRef]
- Singh, R.; Barrios, A.; Dirakvand, G.; Pervin, S. Human brown adipose tissue and metabolic health: potential for therapeutic avenues. Cells 2021, 10, 3030. [Google Scholar] [CrossRef]
- Van Schaik, L.; Kettle, C.; Green, R.; Irving, H.R.; Rathner, J.A. Effects of caffeine on brown adipose tissue thermogenesis and metabolic homeostasis: a review. Front Neurosci 2021, 15, 621356. [Google Scholar] [CrossRef]
- Gatidis, S.; Schmidt, H.; Pfannenberg, C.A.; Nikolaou, K.; Schick, F.; Schwenzer, N.F. Is it possible to detect activated brown adipose tissue in humans using single-time-point infrared thermography under thermoneutral conditions? Impact of BMI and subcutaneous adipose tissue thickness. PLoS One 2016, 11, e0151152. [Google Scholar] [CrossRef]
- Mostafa, N.M.; Mohamadien, N.R.; Sayed, M.H. Brown adipose tissue (BAT) activation at 18 F-FDG PET/CT: correlation with clinicopathological characteristics in breast cancer. Egyptian Journal of Radiology and Nuclear Medicine 2021, 52, 1–9. [Google Scholar] [CrossRef]
- Law, J.M.; Morris, D.E.; Robinson, L.J.; Symonds, M.E.; Budge, H. Semi-automated analysis of supraclavicular thermal images increases speed of brown adipose tissue analysis without increasing variation in results. Current Research in Physiology 2021, 4, 177–182. [Google Scholar] [CrossRef]
- Leitner, B.P.; Huang, S.; Brychta, R.J.; Duckworth, C.J.; Baskin, A.S.; McGehee, S.; Tal, I.; Dieckmann, W.; Gupta, G.; Kolodny, G.M. Mapping of human brown adipose tissue in lean and obese young men. Proceedings of the national academy of sciences 2017, 114, 8649–8654. [Google Scholar] [CrossRef]
- Jang, C.; Jalapu, S.; Thuzar, M.; Law, P.W.; Jeavons, S.; Barclay, J.L.; Ho, K.K. Infrared thermography in the detection of brown adipose tissue in humans. Physiological reports 2014, 2, e12167. [Google Scholar] [CrossRef] [PubMed]
- Pérez, D.I.V.; Soto, D.A.S.; Barroso, J.M.; Dos Santos, D.A.; Queiroz, A.C.C.; Miarka, B.; Brito, C.J.; Quintana, M.S. Physically active men with high brown adipose tissue activity showed increased energy expenditure after caffeine supplementation. J Therm Biol 2021, 99, 103000. [Google Scholar] [CrossRef] [PubMed]
- Velickovic, K.; Wayne, D.; Leija, H.A.L.; Bloor, I.; Morris, D.E.; Law, J.; Budge, H.; Sacks, H.; Symonds, M.E.; Sottile, V. Caffeine exposure induces browning features in adipose tissue in vitro and in vivo. Sci Rep 2019, 9, 1–11. [Google Scholar] [CrossRef] [PubMed]
- Sun, L.; Camps, S.G.; Goh, H.J.; Govindharajulu, P.; Schaefferkoetter, J.D.; Townsend, D.W.; Verma, S.K.; Velan, S.S.; Sun, L.; Sze, S.K. Capsinoids activate brown adipose tissue (BAT) with increased energy expenditure associated with subthreshold 18-fluorine fluorodeoxyglucose uptake in BAT-positive humans confirmed by positron emission tomography scan. The American journal of clinical nutrition 2018, 107, 62–70. [Google Scholar] [CrossRef]
- Symonds, M.E.; Aldiss, P.; Pope, M.; Budge, H. Recent advances in our understanding of brown and beige adipose tissue: the good fat that keeps you healthy. F1000Research 2018, 7, F1000 Faculty Rev-1129. [Google Scholar] [CrossRef]
- Yamada, A.K.; Pimentel, G.D.; Pickering, C.; Cordeiro, A.V.; Silva, V.R. Effect of caffeine on mitochondrial biogenesis in the skeletal muscle–A narrative review. Clinical nutrition ESPEN 2022, 51, 1–6. [Google Scholar] [CrossRef]
- Zhu, Y.; Qi, Z.; Ding, S. Exercise-Induced adipose tissue thermogenesis and Browning: how to explain the conflicting findings? International Journal of Molecular Sciences 2022, 23, 13142. [Google Scholar] [CrossRef]
- Bartness, T.J.; Liu, Y.; Shrestha, Y.B.; Ryu, V. Neural innervation of white adipose tissue and the control of lipolysis. Frontiers in neuroendocrinology 2014, 35, 473–493. [Google Scholar] [CrossRef]
- Nirengi, S.; Wakabayashi, H.; Matsushita, M.; Domichi, M.; Suzuki, S.; Sukino, S.; Suganuma, A.; Kawaguchi, Y.; Hashimoto, T.; Saito, M. An optimal condition for the evaluation of human brown adipose tissue by infrared thermography. PLoS One 2019, 14, e0220574. [Google Scholar] [CrossRef]
- Moreira, D.G.; Costello, J.T.; Brito, C.J.; Adamczyk, J.G.; Ammer, K.; Bach, A.J.; Costa, C.M.; Eglin, C.; Fernandes, A.A.; Fernández-Cuevas, I. Thermographic imaging in sports and exercise medicine: A Delphi study and consensus statement on the measurement of human skin temperature. J Therm Biol 2017, 69, 155–162. [Google Scholar] [CrossRef]
- Yoneshiro, T.; Matsushita, M.; Hibi, M.; Tone, H.; Takeshita, M.; Yasunaga, K.; Katsuragi, Y.; Kameya, T.; Sugie, H.; Saito, M. Tea catechin and caffeine activate brown adipose tissue and increase cold-induced thermogenic capacity in humans. The American journal of clinical nutrition 2017, 105, 873–881. [Google Scholar] [CrossRef] [PubMed]
- Tjønna, A.E.; Lee, S.J.; Rognmo, Ø.; Stølen, T.O.; Bye, A.; Haram, P.M.; Loennechen, J.P.l.; Al-Share, Q.Y.; Skogvoll, E.; Slørdahl, S.A. Aerobic interval training versus continuous moderate exercise as a treatment for the metabolic syndrome: a pilot study. Circulation 2008, 118, 346–354. [Google Scholar] [CrossRef]
- Roy, S.; Mccrory, J. Validation of maximal heart rate prediction equations based on sex and physical activity status. International journal of exercise science 2015, 8, 318. [Google Scholar] [CrossRef]
- Alcantara, J.M.; Sanchez-Delgado, G.; Amaro-Gahete, F.J.; Galgani, J.E.; Ruiz, J.R. Impact of the method used to select gas exchange data for estimating the resting metabolic rate, as supplied by breath-by-breath metabolic carts. Nutrients 2020, 12, 487. [Google Scholar] [CrossRef]
- Ballinger, G.A. Using generalized estimating equations for longitudinal data analysis. Organizational research methods 2004, 7, 127–150. [Google Scholar] [CrossRef]
- Chen, K.Y.; Brychta, R.J.; Sater, Z.A.; Cassimatis, T.M.; Cero, C.; Fletcher, L.A.; Israni, N.S.; Johnson, J.W.; Lea, H.J.; Linderman, J.D. Opportunities and challenges in the therapeutic activation of human energy expenditure and thermogenesis to manage obesity. Journal of biological chemistry 2020, 295, 1926–1942. [Google Scholar] [CrossRef]
- Soegaard, C.; Riis, S.; Mortensen, J.F.; Hansen, M. Carbohydrate Restriction During Recovery from High-Intensity–Interval Training Enhances Fat Oxidation During Subsequent Exercise and Does Not Compromise Performance When Combined With Caffeine. Current Developments in Nutrition 2025, 9, 104520. [Google Scholar] [CrossRef]
- Zouhal, H.; Jacob, C.; Delamarche, P.; Gratas-Delamarche, A. Catecholamines and the effects of exercise, training and gender. Sports Medicine 2008, 38, 401–423. [Google Scholar] [CrossRef] [PubMed]
- Athanasiou, N.; Bogdanis, G.C.; Mastorakos, G. Endocrine responses of the stress system to different types of exercise. Reviews in Endocrine and Metabolic Disorders 2023, 24, 251–266. [Google Scholar] [CrossRef]
- D'Amuri, A.; Sanz, J.M.; Capatti, E.; Di Vece, F.; Vaccari, F.; Lazzer, S.; Zuliani, G.; Dalla Nora, E.; Passaro, A. Effectiveness of high-intensity interval training for weight loss in adults with obesity: A randomised controlled non-inferiority trial. BMJ Open Sport & Exercise Medicine 2021, 7. [Google Scholar]
- Lu, Y.; Baker, J.S.; Ying, S.; Lu, Y. Effects of practical models of low-volume high-intensity interval training on glycemic control and insulin resistance in adults: a systematic review and meta-analysis of randomized controlled studies. Frontiers in Endocrinology 2025, 16, 1481200. [Google Scholar] [CrossRef] [PubMed]
- Jagsz, S.; Sikora, M. The Effectiveness of High-Intensity Interval Training vs. Cardio Training for Weight Loss in Patients with Obesity: A Systematic Review. Journal of Clinical Medicine 2025, 14, 1282. [Google Scholar] [CrossRef] [PubMed]
- Mekonen, W.; Schwaberger, G.; Lamprecht, M.; Hofmann, P. Whole Body Substrate Metabolism during Different Exercise Intensities with Special Emphasis on Blood Protein Changes in Trained Subjects—A Pilot Study. Journal of functional morphology and kinesiology 2023, 8, 102. [Google Scholar] [CrossRef] [PubMed]
- Liang, Y.; Chen, Y.; Yang, F.; Jensen, J.; Gao, R.; Yi, L.; Qiu, J. Effects of carbohydrate and protein supplement strategies on endurance capacity and muscle damage of endurance runners: A double blind, controlled crossover trial. Journal of the International Society of Sports Nutrition 2022, 19, 623–637. [Google Scholar] [CrossRef]
Figure 1.
Example of BAT activity estimation. 1: supraclavicular region of interest and 2: external region of interest.
Figure 1.
Example of BAT activity estimation. 1: supraclavicular region of interest and 2: external region of interest.
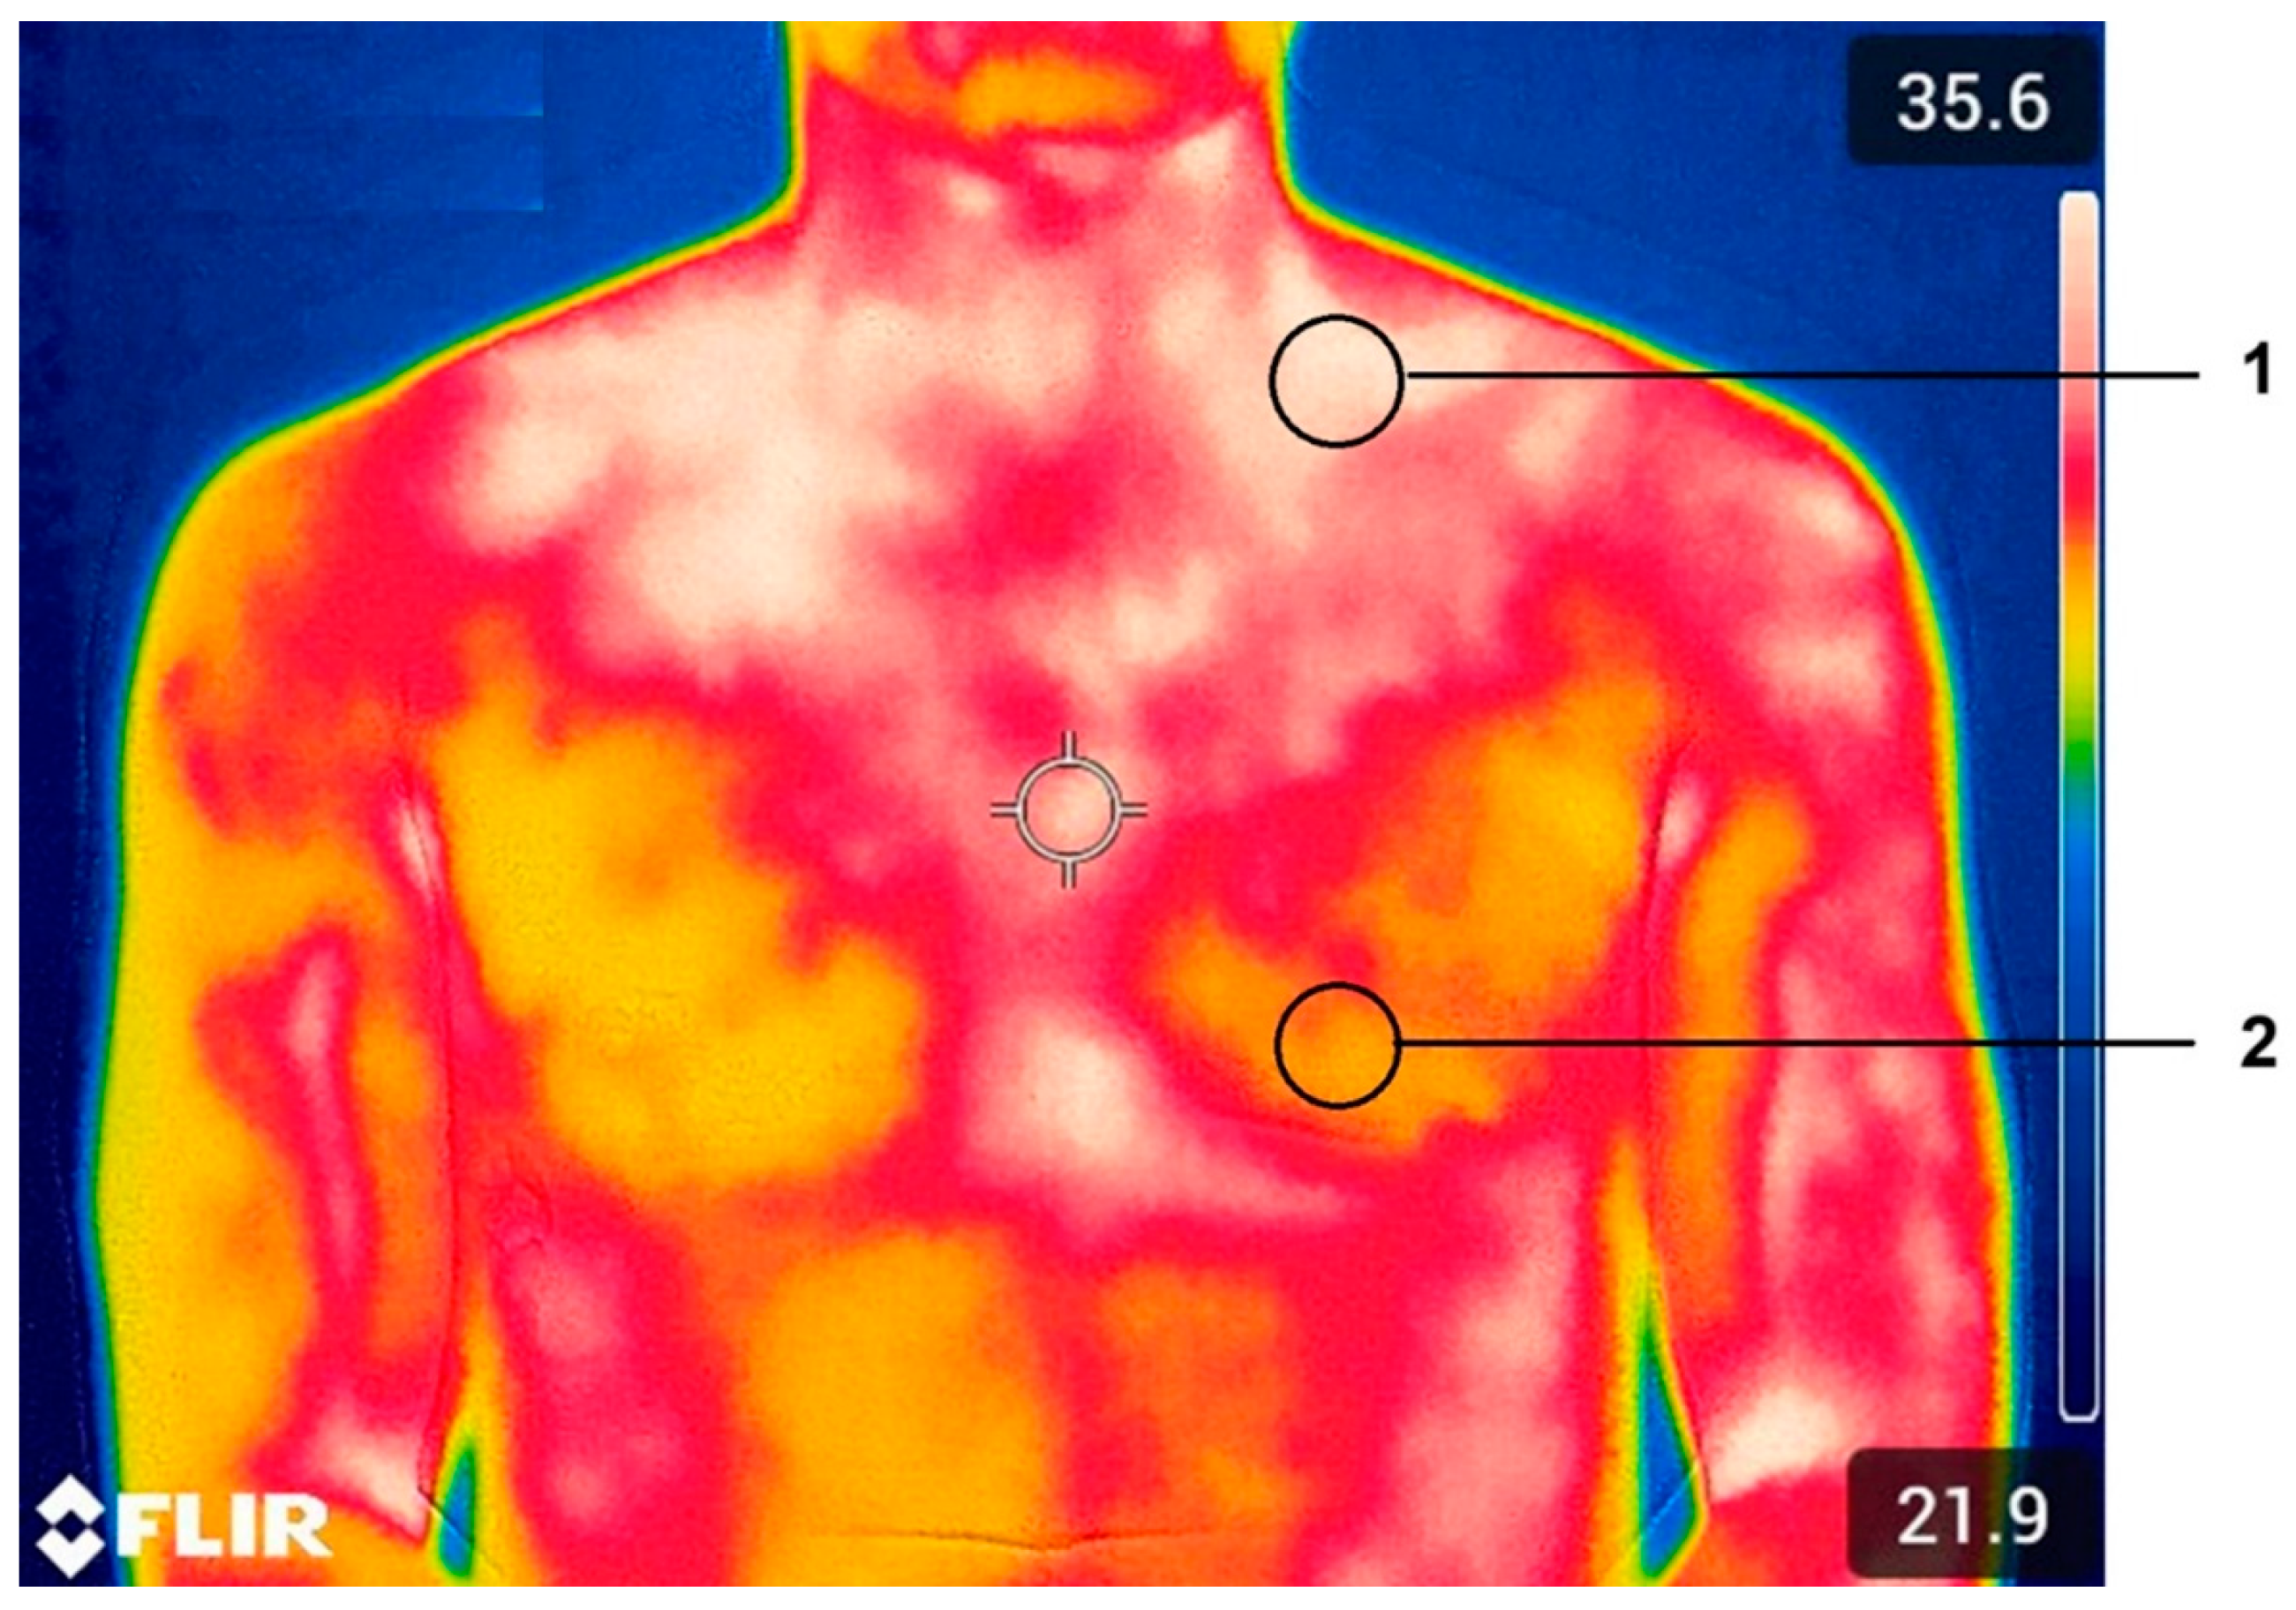
Figure 2.
EE along the experimental time. Red zone – sprint (90-95% of maximum heart rate); green zone – active interval (60-70% of maximum heart rate); blue zone – recovery. HBAT-CAF = a p≤0.001 this moment of measurement vs. the others; b p≤0.05 this moment of measurement vs. the others; c p≤0.05 this moment of measurement vs. the others; d p=0.011 this moment of measurement vs. 30 min. HBAT-PLA = e p≤0.001 this moment of measurement vs. the others. f p≤0.001 this moment of measurement vs. the others. g p≤0.028 this moment of measurement vs. the others; h p=0.013 this moment of measurement vs. 10 min. LBAT-CAF = i p≤0.001 this moment of measurement vs. the others; j p≤0.003 this moment of measurement vs. the others; k p=0.043 this moment of measurement vs. 10 min; l p≤0.01 this moment of measurement vs. 10 min and 0 min. LBAT-PLA = m p≤0.001 this moment of measurement vs. the others; n p≤0.029 this moment of measurement vs. the others except 10 min; o p≤0.007 this moment of measurement vs. the others except 20 min; p p≤0.05 this moment of measurement vs. 10 min and 0 min. # p≤0.026 HBAT-CAF vs LBAT-CAF. $ p≤0.022 HBAT-PLA vs LBAT-PLA. * p≤0.001 HBAT-CAF vs HBAT-PLA. & p≤0.014 LBAT-CAF vs LBAT-PLA.
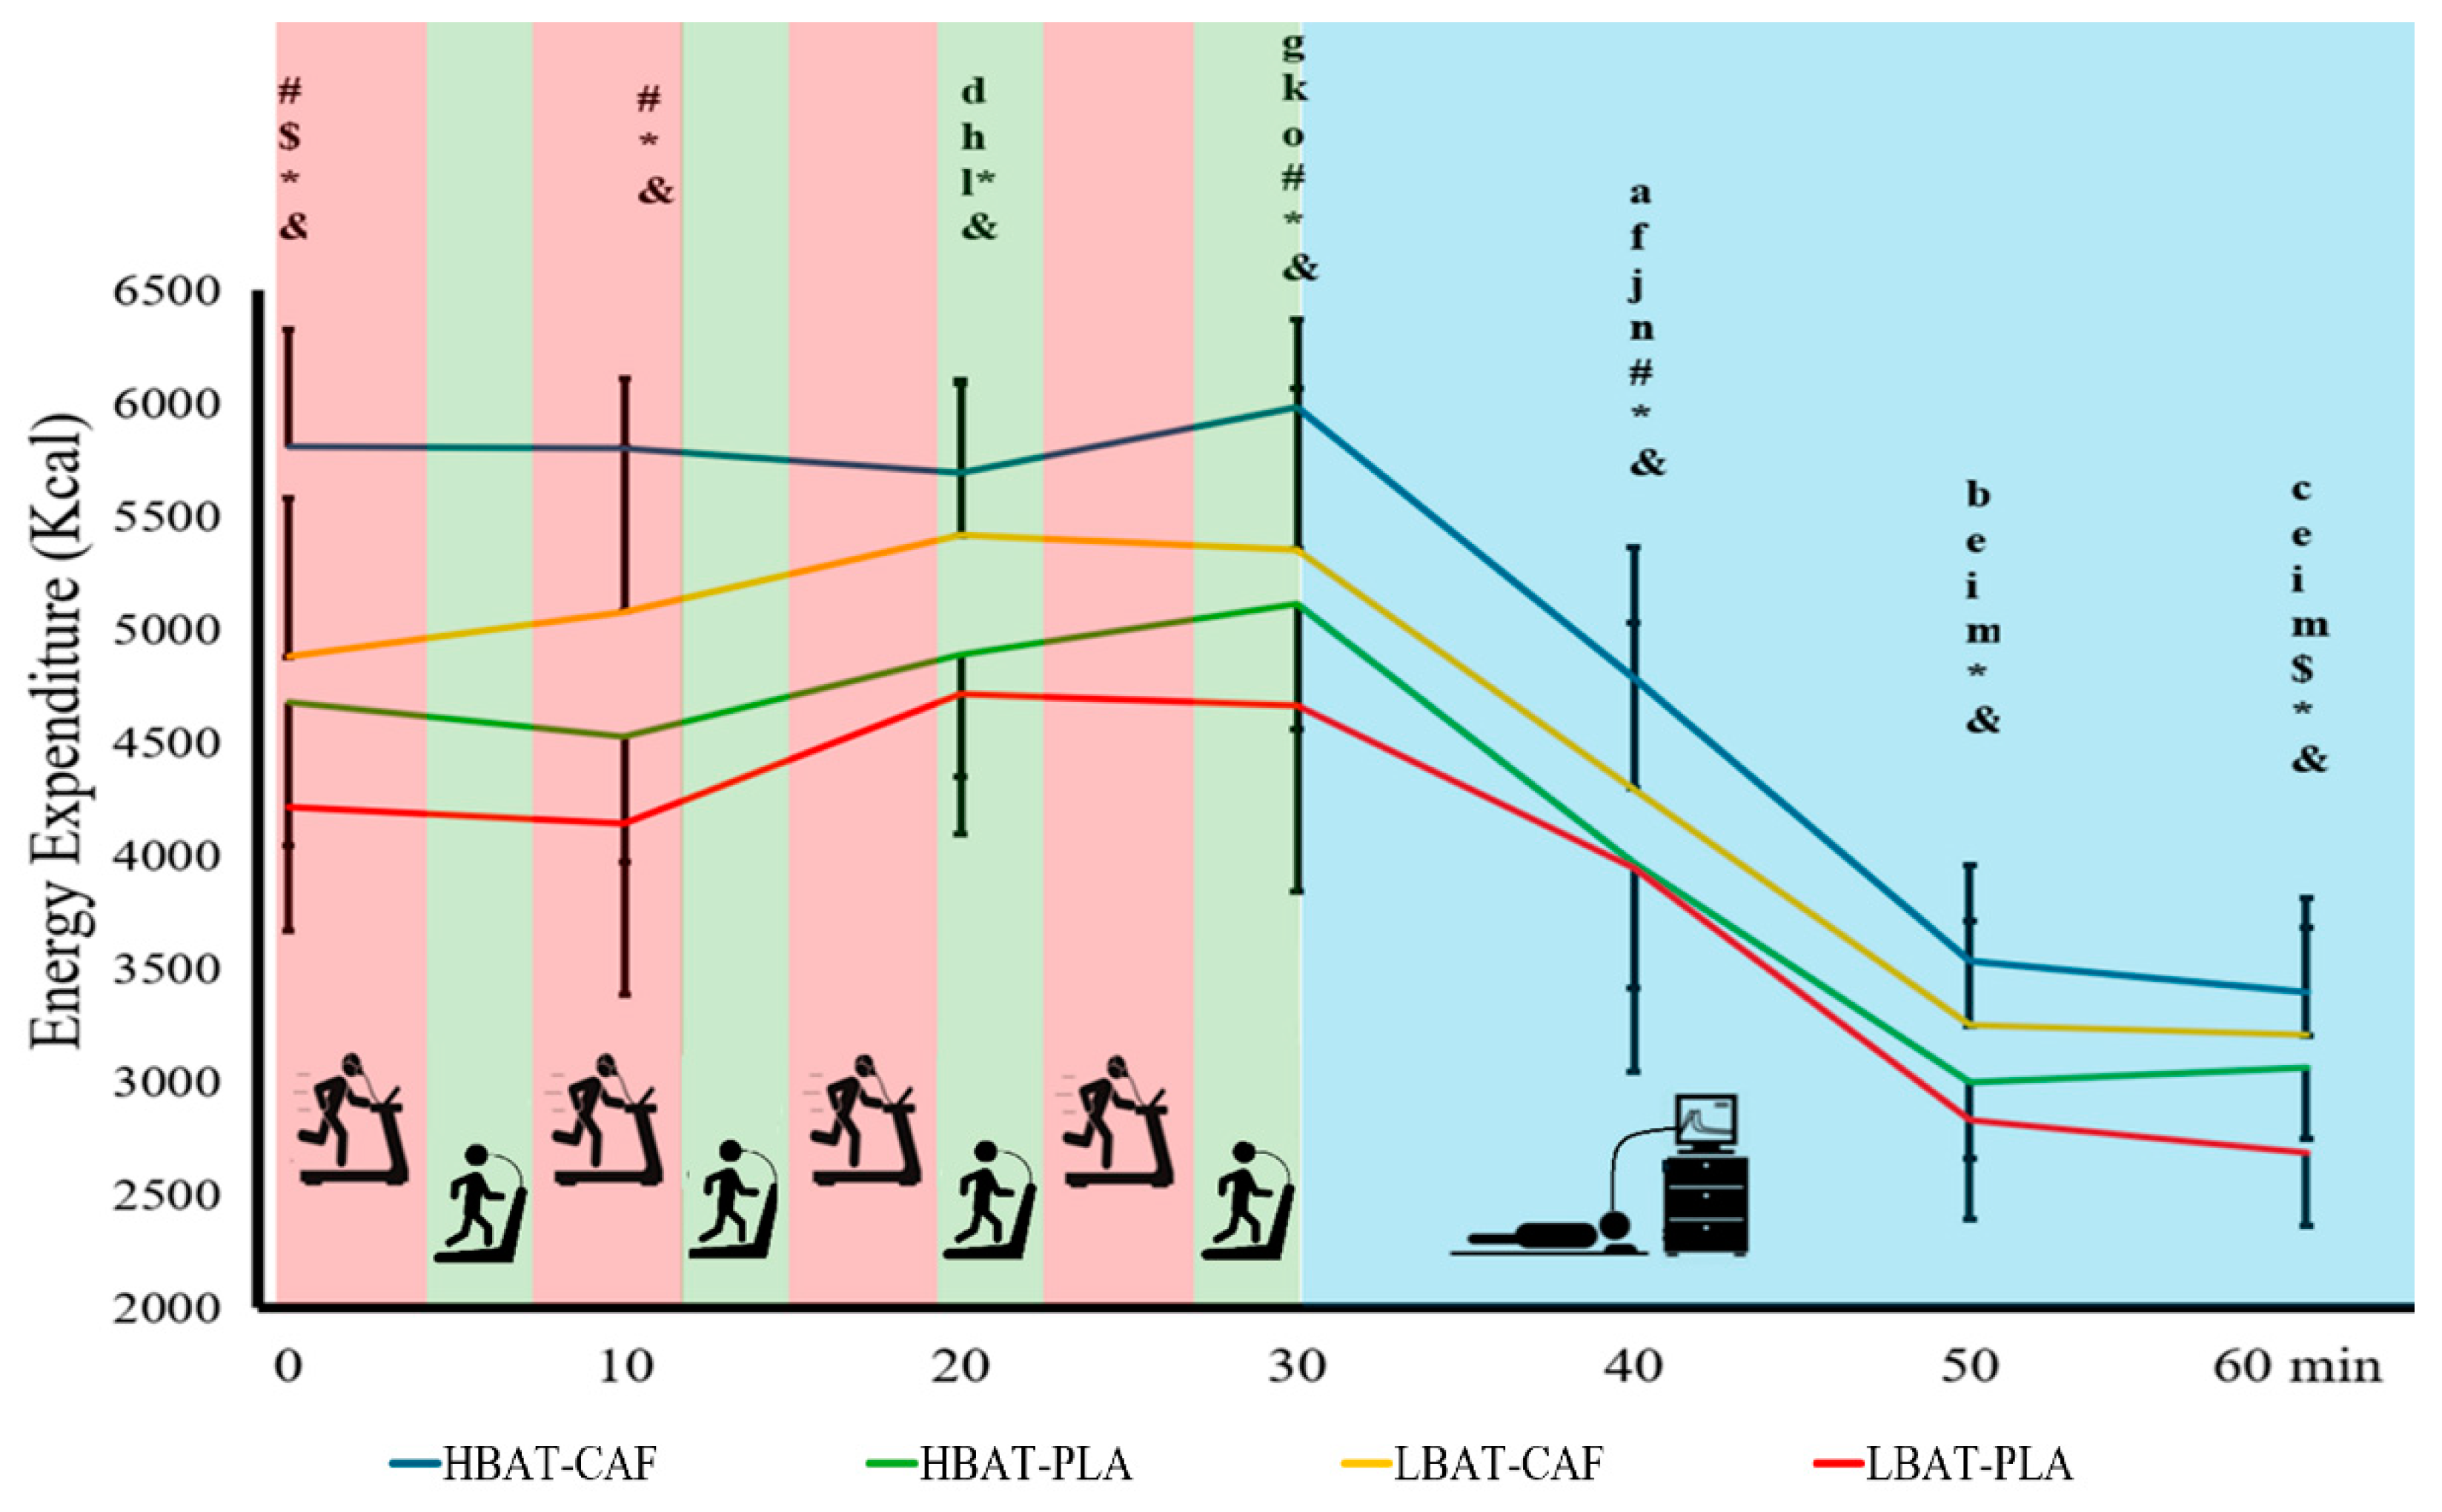

Table 2.
Carbohydrates, lipids and protein catabolism along the experiment. Data presented by means ± standard deviation and 95% CI.
Table 2.
Carbohydrates, lipids and protein catabolism along the experiment. Data presented by means ± standard deviation and 95% CI.
| Moments of measurement | |||||||
|---|---|---|---|---|---|---|---|
| Group-Condition | 0 min | 10 min | 20 min | 30 min | 40 min | 50 min | 60 min |
| CHO (g/day) | |||||||
| HBAT-CAF | 1,021.6±205.5* (917.6; 1,125.6) | 1,119.0±123.2* (1,056.6; 1,181.4) | 1,052.0±223.9 (938.6; 1,165.3) | 1,066.8±190.8 (970.2; 1,163.3) | 950.2±233.9* (831.8; 1,068.6) | 527.8±184.5a* (434.4; 621.1) |
457.1±123.6a (394.5; 519.7) |
| LBAT-CAF | 894.5±217.1* (784.6; 1,004.4) |
900.3±250.7* (773.4; 1,027.1) |
1,065.1±522.2 (800.8; 1,329.4) |
962.8±231.8 (845.5; 1,080.1) |
797.9±138.4* (727.9; 867.9) |
457.1±165.8a* (373.2; 541.0) |
415.4±165.6a (331.6; 499.3) |
| HBAT-PLA | 1,018.1±268.8 (900.3; 1,135.9) |
966.5±350.3 (813.0; 1,120.0) |
1,019.2±356.5 (863.0; 1,175.4) |
1,117.9±722.4 (861.3; 1,494.5) |
891.3±222.2 (794.0; 988.7) |
402.3±167.2a (329.0; 475.6) |
380.3±160.1a (310.1; 450.4) |
| LBAT-PLA | 730.7±368.9 (569.0; 892.3) |
840.8±226.3 (741.7; 940.0) |
821.3±307.6 (686.6; 956.1) |
1,119.5±797.9 (769.8; 1,469.2) |
770.1±196.3 (684.1; 856.1) |
335.0±170.6a (260.2; 409.7) |
364.7±169.2a (290.5; 438.8) |
| FAT(g/day) | |||||||
| HBAT-CAF | 133.4±93.6 (86.0; 180.7) |
94.3±62.1 (62.8; 125.7) |
116.6±85.8 (73.2; 160.0) |
139.9±65.1 (107.0; 172.8) |
45.3±46.7 (21.7; 68.9) |
129.3±67.1 (95.3; 163.2) |
146.9±56.3b* (118.4; 175.4) |
| LBAT-CAF | 84.8±92.9 (37.8; 131.8) |
62.8±77.6 (23.5; 102.1) |
83.6±90.6 (37.8; 129.5) |
94.0±81.2 (52.9; 135.1) |
64.9±48.8 (40.3; 89.6) |
107.4±72.7 (70.6; 144.2) |
129.5±71.4b* (93.4; 165.6) |
| HBAT-PLA | 48.4±104.8 (2.5; 94.3) |
80.1±105.3 (33.9; 126.2) |
101.9±128.8 (45.5; 158.4) |
97.4±107.3 (50.4; 144.4) |
54.3±51.9 (31.5; 77.0) |
155.5±71.4 (124.2; 186.7) |
161.1±64.2 (132.9; 189.2) |
| 189.2 | 72.3±115.1 (21.9; 122.8) |
62.9±101.3 (18.5; 107.3) |
84.1±102.0 (39.3; 128.8) |
85.2±114.4 (35.1; 135.3) |
76.2±90.5 (36.5; 115.8) |
127.4±92.8 (86.8; 168.1) |
105.5±80.9 (70.1; 141.0) |
| PTN(g/day) | |||||||
| HBAT-CAF | 64.1±5.4# (61.3; 66.9) |
64.4±3.3# (62.7; 66.1) |
63.7±4.0 (61.6; 65.7) |
64.4±9.4# (59.6; 69.1) |
52.1±6.2a# (48.9; 55.2) |
39.6±4.7a# (37.2; 42.0) |
38.4±4.8a# (36.0; 40.8) |
| LBAT-CAF | 51.8±7.4 (48.1; 55.5)$ |
48.3±6.1 (45.3; 51.4)$ |
60.2±21.0 (49.5; 70.8)e |
57.6±5.6 (54.7; 60.4) |
44.6±6.3a$ (41.4; 47.8) |
33.6±3.8a$ (31.7; 35.5) |
34.4±3.7a$ (32.5; 36.2) |
| HBAT-PLA | 53.1±8.0c (49.6; 56.6) |
55.3±8.9d (51.4; 59.2) |
60.0±7.3 (56.8; 63.2) |
76.6±50.8 (54.3; 98.9) |
48.1±7.8 (44.7; 51.5) |
36.7±5.3a (34.4; 39.0) |
36.3±5.4a (33.9; 38.6) |
| LBAT-PLA | 46.5±5.8g (44.0; 49.1) |
46.8±9.1h (42.8; 50.8) |
55.8±9.7 (51.6; 60.1) |
63.7±36.0 (47.9; 79.4) |
41.4±11.0f (36.6; 46.3) |
31.5±5.5a (29.1; 33.9) |
29.6±4.1a (27.8; 31.4) |
Note. a p≤0.023 for this moment of measurement vs. the others. b p≤0.009 for this moment of measurement vs. 0, 10 and 40 min. c p≤0.01 for this moment of measurement vs. the others, except 10- and 20-min. d p≤0.002 for this moment of measurement vs. the others, except 40 min. e p≤0.004 for this moment of measurement vs. 0- and 10-min. f p≤0.042 for this moment of measurement vs the others, except 10 min. g p≤0.027 for this moment of measurement vs. 20- and 30-min. h p=0.001 for this moment of measurement vs. 20 min. * p≤0.047 vs. PLA. # p≤0.01 vs. HBAT-PLA. $ p≤0.002 vs. LBAT-PLA.
Disclaimer/Publisher’s Note: The statements, opinions and data contained in all publications are solely those of the individual author(s) and contributor(s) and not of MDPI and/or the editor(s). MDPI and/or the editor(s) disclaim responsibility for any injury to people or property resulting from any ideas, methods, instructions or products referred to in the content. |
© 2025 by the authors. Licensee MDPI, Basel, Switzerland. This article is an open access article distributed under the terms and conditions of the Creative Commons Attribution (CC BY) license (http://creativecommons.org/licenses/by/4.0/).
Copyright: This open access article is published under a Creative Commons CC BY 4.0 license, which permit the free download, distribution, and reuse, provided that the author and preprint are cited in any reuse.


