
Submitted:
04 April 2025
Posted:
08 April 2025
You are already at the latest version
Abstract
MAI Motion is a motion capture system designed to assess lower-limb biomechanics during functional movements like the sit-to-stand (STS) test. Determining how many repetitions are needed to obtain reliable measurements is critical for balancing data quality and participant burden. This study evaluates whether three repetitions (3x) of STS provide sufficiently reliable data compared to five repetitions (5x). 3D videos of participants (n=10) performing 5x STS movements were captured using MAI Motion. Primary measurements were the mean values of each joint angle and the coefficient of variation (CV). Statistical comparisons (paired t-tests or non-parametric equivalents) determined differences in mean values or CV existed between 3x and 5x. Analysis revealed minimal differences in mean angles between 3x and 5x. Variability, assessed via CV, showed no clinically meaningful differences. Although ankle angle, knee and hip abduction had higher CV values than other metrics, 3x and 5x performed similarly. Participants reported that 3x required less effort than 5x, implying practical advantage for clinical or research settings. These findings validate that a 3x STS captures biomechanical data comparable to a 5x protocol using the MAI Motion system. Reducing repetitions can lessen participant fatigue while preserving measurement reliability, making 3x a pragmatic standard for most populations.
Keywords:
digital motion capture
; biomechanics
; kinematics
; movement
Introduction
The integration of artificial intelligence (AI) in motion capture has gained significant attention across multiple fields, especially in healthcare and rehabilitation. However, the advancement of AI-based motion tracking systems employing markerless technology, are emerging as viable alternatives to traditional methods that rely on physical markers and controlled laboratory environments. These advancements are particularly relevant in clinical settings where the use of markers may be impractical or invasive.
These AI-based investigative tools facilitate motion capture in diverse clinical domains, including orthopaedic clinics, physiotherapy and rehabilitation, without the need for extensive physical setups [1]. The shift towards markerless motion capture is further supported by the lower cost, greater accessibility and ability to perform whole-body kinematics tracking [2].
MAI Motion, is a markerless digital platform that allows the analysis of everyday movements including the transition from a seated to standing position, known as the sit-to-stand (STS) test [3,4]. Moving from a seated to standing position involves a multifaceted process that requires a complex interplay of kinematic phases and biomechanical adjustments across four distinct phases: flexion momentum, momentum transfer, extension, and stabilization [5,6] also known as the pelvic tilt, trunk extension, hip flexion, and knee extension. Each phase is characterized by specific kinematic actions that facilitate the successful transfer of the center of mass (COM) from a stable base of support (the seat) to a less stable position (the feet) [7]. The STS test is primarily conducted for its’ ability to effectively indicate lower limb strength, functional capacity, and risk of falls, which are critical for maintaining independence in daily activities.[7]
The STS test is a widely utilised and validated tool in clinical and research settings for assessing lower limb function, balance, and physical performance, particularly among older adults and individuals with musculoskeletal (MSK) impairments [8,9]. While various STS protocols exist, the five-repetition format (5x STS) is commonly adopted due to its balance between practicality and sensitivity in detecting functional deficits [10,11].
However, in clinical practice, a significant proportion of individuals with chronic MSK conditions are unable to complete five full repetitions due to pain, fatigue, or movement limitations. This constraint presents a potential barrier to inclusive assessment and data acquirement, particularly when advanced kinematic analysis tools such as MAI Motion are employed.
To address this challenge, we hypothesised that three repetitions (3x) of the STS test may yield data of comparable reliability to the conventional five-repetition protocol. The aim of this study, therefore, was to systematically evaluate whether kinematic parameters captured via 3D MAI Motion during 3x STS trials could reliably replicate those obtained from 5x trials. By directly comparing both protocols across a range of key biomechanical metrics, we sought to establish whether the shorter protocol offers a valid alternative, thereby enhancing accessibility without compromising the integrity of the diagnostic assessment.
Materials and Methods
- Ethical approval
The study was carried out following Good Clinical Practice (as outlined by NIHR) and guidance set forth by the General Medical Council (GMC). Each participant provided informed consent for their involvement in the study and for the prospective dissemination of its outcomes. Prior ethics clearance was obtained from the MSK Doctors Medical Advisory Committee Ethics Board 2021_7084.
- Subjects
10 subjects (7 male and 3 female, age = 60±10.5 mean±SD; min 42/max 73 years). The participants were selected according to the following inclusion criteria: Ability to perform the STS test 5x; exclusion criteria: Not being able to complete 5 repetitions.
- Experiment and task
A standard RGB camera (resolution 1920 x 1080, frame rate 30 fps), capable of processing motion tracking and depth sensing, was used to capture movement. The video recorded was uploaded on the MAI Motion platform to be analysed.
All subjects sat on a chair with seat height adjusted to keep the hip and knee joints as close to 90° as possible. Both feet were placed level to the ground at neutral position and shoulder width apart. For a complete movement cycle, the subject was asked to stand up and then sit down. This was repeated for 5 cycles.
Through the MAI Motion platform, angles of the knee, hip & ankle, abduction of the knee and hip, and L/R and core movement were determined for participants (n=10) who repeated the STS test 5x. Measurements were determined for all 5x repeats or the first 3x repeats.
Definition of kinematic measurements, termed parameters, reported throughout the manuscript are: For angle and abduction measures (knee, hip and ankle); Impulse (+ve and -ve) represents the speed of change in degrees per second (os); Impulse ratio is defined as the +ve impulse / -ve impulse (no units). Range is the range of motion in degrees (o). For measures of L/R movement and core movement: Impulse (+ve and -ve) represent the speed of change in metres per second (m/s). Impulse ratio is defined as the +ve impulse / -ve impulse (no units). Range is the range of motion in metres (m).
Coefficient of Variation (CV): (Standard Deviation / Mean) × 100 was reported as percent (%) and used to measure variability across repeats. CV thresholds commonly define <10% as “ideal” and 10–20% as “acceptable.”
Difference in mean (DiM): (5x – 3x) / 5x × 100 was reported as percent (%) and used to compare differences across the measurements.
- Statistical Analysis
Statistical analysis was performed using Excel and GraphPad Prism (version 10.4.1). Statistical tests included ordinary one-way ANOVA followed by Šídák's multiple comparisons tests or paired t-tests. A p-value of <0.05 was considered significant (see Figure legends for details).
Results
This study employed 3D MAI Motion capture technology to analyse key kinematic parameters, including positive and negative impulse, impulse ratio, and range of motion across critical joint movements, or categories, such as knee angle, knee abduction, hip angle, hip abduction, ankle angle, as well as left/right and core movement. These parameters were assessed during a repeated sit-to-stand test performed five times (5x) by 10 participants, providing a comprehensive evaluation of dynamic joint and body motion under varying biomechanical loads. The purpose of this evaluation was to determine whether 5x repeats are necessary or 3x repeats provide equivalent data and results.
Figure 1 shows an overview of representative data from one participant. Whilst there is considerable variation across the parameter scores within categories (for example when comparing left and right positive and negative impulse scores for knee angle - Figure 1A) and across categories (compare the same parameters for knee, hip and ankle angle – Figure 1A, B and C), there is relatively limited variation between scores derived from 5x vs 3x for the same parameter, with means and standard deviations comparable. Consistent with this, there were no significant differences between the means for scores derived from 5x or 3x for the same parameter. Furthermore, analysis of the coefficient of variation (CV) across the scores (Figure 1A-G, see insets) showed comparable CVs for 5x and 3x that were statistically indistinguishable and typically in the range of 10 to 20%, values considered ideal to acceptable in this context.
Next, we went on to analyse the difference in means (DiMs) to establish whether there were any significant differences between the results generated from analysis of 5x or 3x repeats from all 10 participants (Figure 2). There were no significant differences between 5x or 3x, with DiMs for most parameters typically ranging between 0 and 10%, indicating good consistency between 5x and 3x repeats (as illustrated by all the mean DiMs being less than 10%). Higher values, upto 30%, were seen for some individual DiMs (which represent the DiM for that parameter, for one participant), most notably impulse ratio in knee angle, ankle angle and hip abduction (Figure 2). Similar results were seen when data was grouped by participant (Supplementary Figure 1). Collectively, the absence of any statistically significant differences between the DiMs for 5x and 3x and the consistency between measures suggests that analysis of data from 3x repeats generates results comparable to those from 5x repeats.
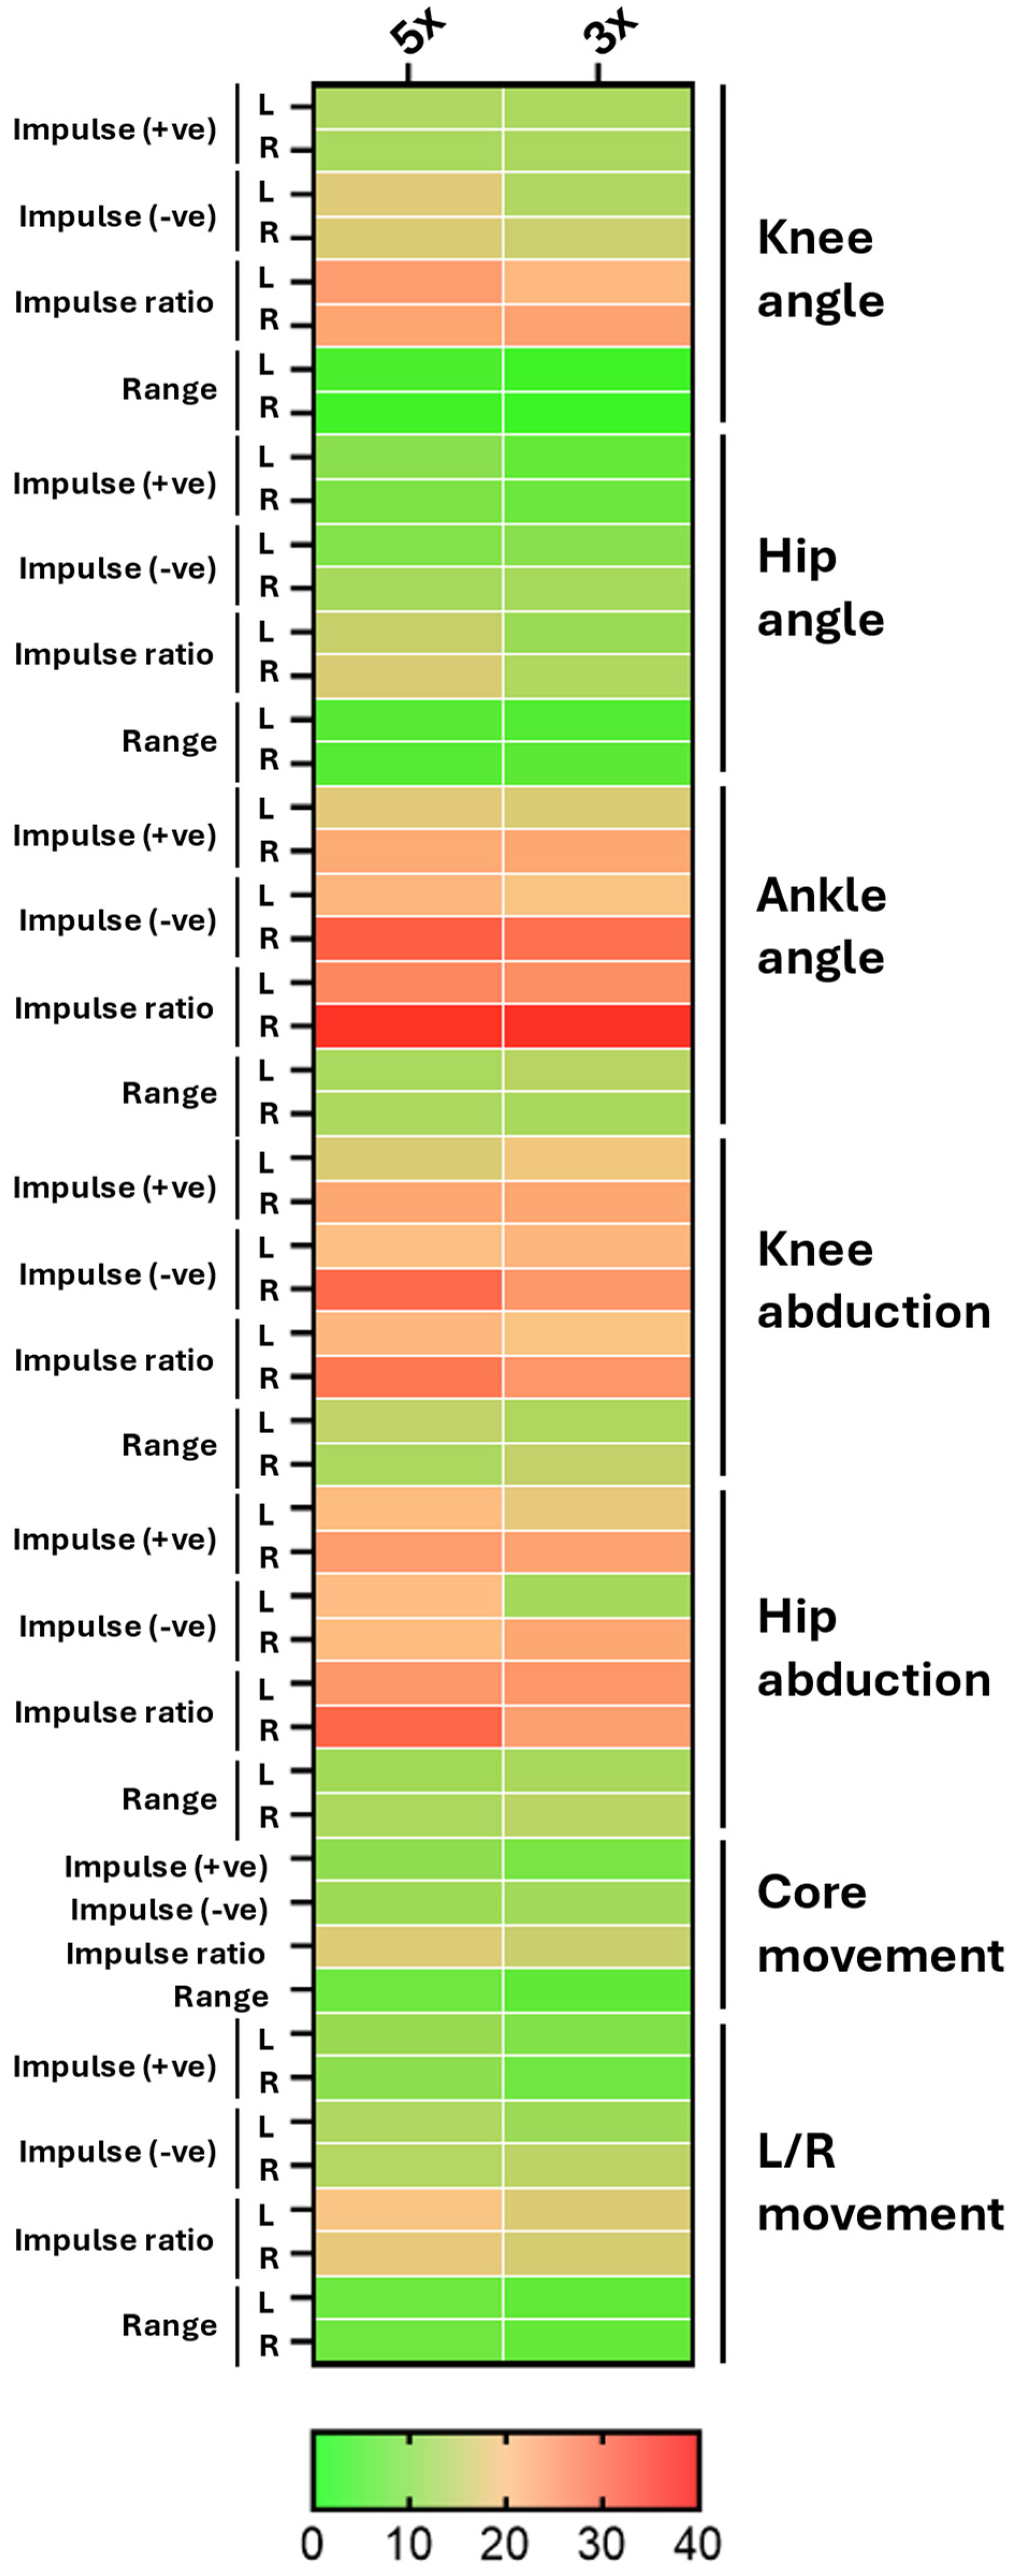
To investigate this further we analysed the CVs generated from the 5x or 3x repeats from all participants (Figure 3). Whilst most CV values were below 20%, in some instances higher values around 60 to 70% were evident (for example, participants 2 and 7, knee angle (red) and hip abduction (orange), Figure 3A). Importantly, where such high values were found, they were present in both the 5x and 3x repeats. Statistically significant differences were revealed when comparing the CVs between 5x vs 3x for participants 2, 6 & 7. For participants 2 & 7 the CVs were significantly lower in the 3x compared to 5x (14.9±10.7 vs 18.7±12.7 & 17.1±14.5 vs 20.1±13.5, mean±SD, *p<0.025) whereas this difference was reversed for participant 6 (18.0±12.9 vs 15.4±11.3, mean±SD, **p<0.002, Figure 3A). Further statistical analysis of the mean CVs for each parameter (generated by calculating the mean CV for each parameter, itself derived by combining the mean CV for that parameter per participant) also showed a modest, but significantly lower mean CV for 3x vs 5x (15.6±7.0 vs 16.73±7.3, mean±SD, ***p<0.0001, Figure 3B). This is presented more qualitatively in Figure 4, which shows a comparison of the mean CV derived from 5x or 3x repeats for every parameter allowing visual identification of variation between parameters and across categories as exemplified by differences in parameters across ankle angle, and knee and hip abduction (Figure 4).
Overall, these quantitative and qualitative comparisons indicate that results generated from 3x are equivalent to, or even superior to, results from 5x.
Discussion
This study aimed to evaluate whether the kinematic data generated by the MAI Motion system from participants performing the STS test over 3 repetitions was equivalent to the data obtained from 5 repetitions. The results indicate a high degree of consistency between results generated by analysis of 3x or 5x repeats across multiple parameters, including positive and negative impulse, impulse ratio and range of motion evaluated across key joint categories. Statistical and qualitative analysis demonstrated that results from 3x were comparable to, or even outperformed, those from 5x. This supports the use of a shorter 3x protocol without compromising the reliability or diagnostic benefit of the data.
Statistical analysis of results generated by investigation of data from 5x or 3x repeats, including comparison of DiMs and CVs, showed a lack of significant differences between mean values or the levels of variability of all parameters when considered individually. Significant differences in variability were only observed when comparing grouped data, namely the mean variation across CVs for all 52 parameters in three out of 10 participants (2, 6 and 7) and the ‘meta-mean’ of the CVs for each parameter, with analysis of 3x repeats generating significantly less variability than that of 5x.
These findings are consistent with prior research in functional testing, indicating that beyond a modest number of repetitions, additional cycles yield diminishing returns on measurement precision. This likely reflects the effects of participant fatigue due to the increased number of repetitions, potentially resulting in greater variability in neuromuscular control, posture and/or movement specifically across the 4th and 5th repeats. Whilst further analysis would be required to address this more formally previous studies have reported that increased fatigue can lead to adaptations in movement [12] giving rise to changes in biomechanical parameters [13]. Based on these observations, and the results presented here, it seems reasonable to propose that 3x repeats should be recommended to reduce fatigue-related variability while maintaining measurement accuracy.
From a diagnostic perspective, the opportunity to effectively capture movement dynamics using digital platforms such as MAI Motion has real-world applicability in musculoskeletal healthcare. For example, for individuals who are frail or exhibit considerable mobility impairments or chronic musculoskeletal conditions the increased accessibility afforded through remote evaluation, combined with the adoption of a shorter protocol, will make assessments less demanding and more inclusive. Furthermore, many individuals undergoing rehabilitation find it challenging to complete five repetitions in a single session [14], making the 3x test a more realistic and inclusive option.
Limitations of this study are the relatively small number of participants and the inclusion of analysis of only one functional task. Increasing the number of participants and inclusion of other functional tasks (e.g., squats, single-leg stance) in future studies would address these limitations.
Conclusion
In conclusion, this study provides evidence supporting the use of a three-repetition protocol for STS movement as analysed by the 3D MAI Motion markerless motion capture platform. From a practical perspective, reducing repetition from five to three can improve time-efficiency, reduce participant burden, and enhance protocol adherence. This is particularly essential in clinical populations of elderly or frail cohorts where fatigue, discomfort, or compliance may limit viability. Hence, the 3x protocol can be confidently adopted for routine testing.
Supplementary Materials
The following supporting information can be downloaded at the website of this paper posted on Preprints.org. Supplementary Figure S1 – Difference in means (DiMs) derived from analysis of 5x or 3x repeats of the STS test grouped by participant. (A) Shows means for each parameter (describing Knee Angle (red), Knee Abduction (purple), Hip Angle (blue), Hip Abduction (orange), Ankle Angle (green), L/R movement (grey) and Core movement (tan)) calculated from 5x or 3x repeats for each participant. (B) As in A following calculation of the meta-means (derived by calculating the mean of the means for each participant for each parameter). (C) Shows the DiMs between 5x and 3x for each parameter (presented as % of 5x mean plotted grouped by participant (1-10). Mean±SD (black lines). No significant differences were observed between the means of any parameter comparing 5x vs 3x (using ordinary one way ANOVA followed by multiple comparisons or paired t-tests).
Author Contributions
Conceptualization, methodology and supervision, Paul Lee; software and data curation Yan Wen; validation, Yan Wen, Tanvi Verma, and Jonathan Whitehead; formal analysis, Jonathan Whitehead; Writing, review and editing, Tanvi Verma and Jonathan Whitehead; All authors have read and agreed to the published version of the manuscript.
Funding
This research received no external funding
Acknowledgments
The authors would like to thank the participants who contributed to this study.
Conflicts of Interest
Yan Wen and Tanvi Verma were compensated by MSK Doctors for their contributions to this work. Jonathan P. Whitehead received consultancy fees from MSK Doctors for their role in the study. Paul YF Lee serves as the CEO and founder of MSK Doctors and is credited as the inventor of MAI Motion as part of the Innovate UK Knowledge Transfer Partnership funds from The UK government.
References
- Wagh V, Scott MW, Kraeutner SN. Quantifying Similarities Between MediaPipe and a Known Standard to Address Issues in Tracking 2D Upper Limb Trajectories: Proof of Concept Study. JMIR Form Res. 2024 Dec 17;8:e56682. [CrossRef]
- Lorenz EA, Su X, Skjæret-Maroni N. A review of combined functional neuroimaging and motion capture for motor rehabilitation. J NeuroEngineering Rehabil. 2024 Jan 3;21(1):3. [CrossRef]
- Armstrong K, Wen Y, Zhang L, Ye X, Lee P. Novel clinical applications of marker-less motion capture as a low-cost human motion analysis method in the detection and treatment of knee osteoarthritis. J Arthritis. 2022;11(1):001–00.
- Armstrong K, Zhang L, Wen Y, Willmott AP, Lee P, Ye X. A marker-less human motion analysis system for motion-based biomarker identification and quantification in knee disorders. Front Digit Health [Internet]. 2024 Jan 23 [cited 2025 Apr 2];6. Available from: https://www.frontiersin.org/journals/digital-health/articles/10.3389/fdgth.2024.1324511/full.
- Li J, Xue Q, Yang S, Han X, Zhang S, Li M, et al. Kinematic analysis of the human body during sit-to-stand in healthy young adults. Medicine (Baltimore). 2021 Jun 4;100(22):e26208. [CrossRef]
- Schenkman M, Berger RA, Riley PO, Mann RW, Hodge WA. Whole-body movements during rising to standing from sitting. Phys Ther. 1990 Oct;70(10):638–48; discussion 648-651. [CrossRef]
- Janssen WG, Bussmann HB, Stam HJ. Determinants of the Sit-to-Stand Movement: A Review. Phys Ther. 2002 Sep 1;82(9):866–79. [CrossRef]
- Alcazar J, Losa-Reyna J, Rodriguez-Lopez C, Alfaro-Acha A, Rodriguez-Mañas L, Ara I, et al. The sit-to-stand muscle power test: An easy, inexpensive and portable procedure to assess muscle power in older people. Exp Gerontol. 2018 Oct 2;112:38–43. [CrossRef]
- Park TS, Shin MJ. Comprehensive Assessment of Lower Limb Function and Muscle Strength in Sarcopenia: Insights from the Sit-to-Stand Test. Ann Geriatr Med Res. 2024 Feb 8;28(1):1–8. [CrossRef]
- Jones SE, Kon SSC, Canavan JL, Patel MS, Clark AL, Nolan CM, et al. The five-repetition sit-to-stand test as a functional outcome measure in COPD. Thorax. 2013 Nov 1;68(11):1015–20. [CrossRef]
- Zhang Q, Li YX, Li XL, Yin Y, Li RL, Qiao X, et al. A comparative study of the five-repetition sit-to-stand test and the 30-second sit-to-stand test to assess exercise tolerance in COPD patients. Int J Chron Obstruct Pulmon Dis. 2018;13:2833–9.
- Burdack J, Horst F, Aragonés D, Eekhoff A, Schöllhorn WI. Fatigue-Related and Timescale-Dependent Changes in Individual Movement Patterns Identified Using Support Vector Machine. Front Psychol [Internet]. 2020 Sep 30 [cited 2025 Mar 21];11. Available from: https://www.frontiersin.org/journals/psychology/articles/10.3389/fpsyg.2020.551548/full.
- Aquino M, Petrizzo J, Otto RM, Wygand J. The Impact of Fatigue on Performance and Biomechanical Variables—A Narrative Review with Prospective Methodology. Biomechanics. 2022 Dec;2(4):513–24. [CrossRef]
- Yee XS, Ng YS, Allen JC, Latib A, Tay EL, Abu Bakar HM, et al. Performance on sit-to-stand tests in relation to measures of functional fitness and sarcopenia diagnosis in community-dwelling older adults. Eur Rev Aging Phys Act. 2021 Jan 8;18(1):1. [CrossRef]
Figure 1.
– Overview of kinematic measurements from a participant performing a repeated sit-to-stand (STS) test following analysis of 5 or 3 repeats. Measures for each parameter (Impulse +ve, Impulse -ve, Impulse ratio and Range of motion (Range)) within each of the categories, (A) Knee Angle, (B) Knee Abduction, (C) Hip Angle, (D) Hip Abduction, (E) Ankle Angle, (F) L/R movement and (G) Core movement, were extracted from video of a participant performing the STS test 5 times captured using MAI Motion. Each panel depicts parameters measured across all 5 repeats (5x – green) or the first 3 repeats (3x – red), the mean±SD (black lines) and, in the insets, the Coefficients of Variance (CV (%)) for each parameter derived from 5x or 3x repeats. Left (L) and Right (R) are shown for all measures except core. For panels A-E, units are; Impulse +ve and Impulse -ve (o/s); Range (o). For panels F-G, units are; Impulse +ve and Impulse -ve (m/s); Range (m). No significant differences were observed between the means (using ordinary one way ANOVA followed by multiple comparisons) or CVs (using paired t-tests) of any parameter comparing 5x vs 3x.
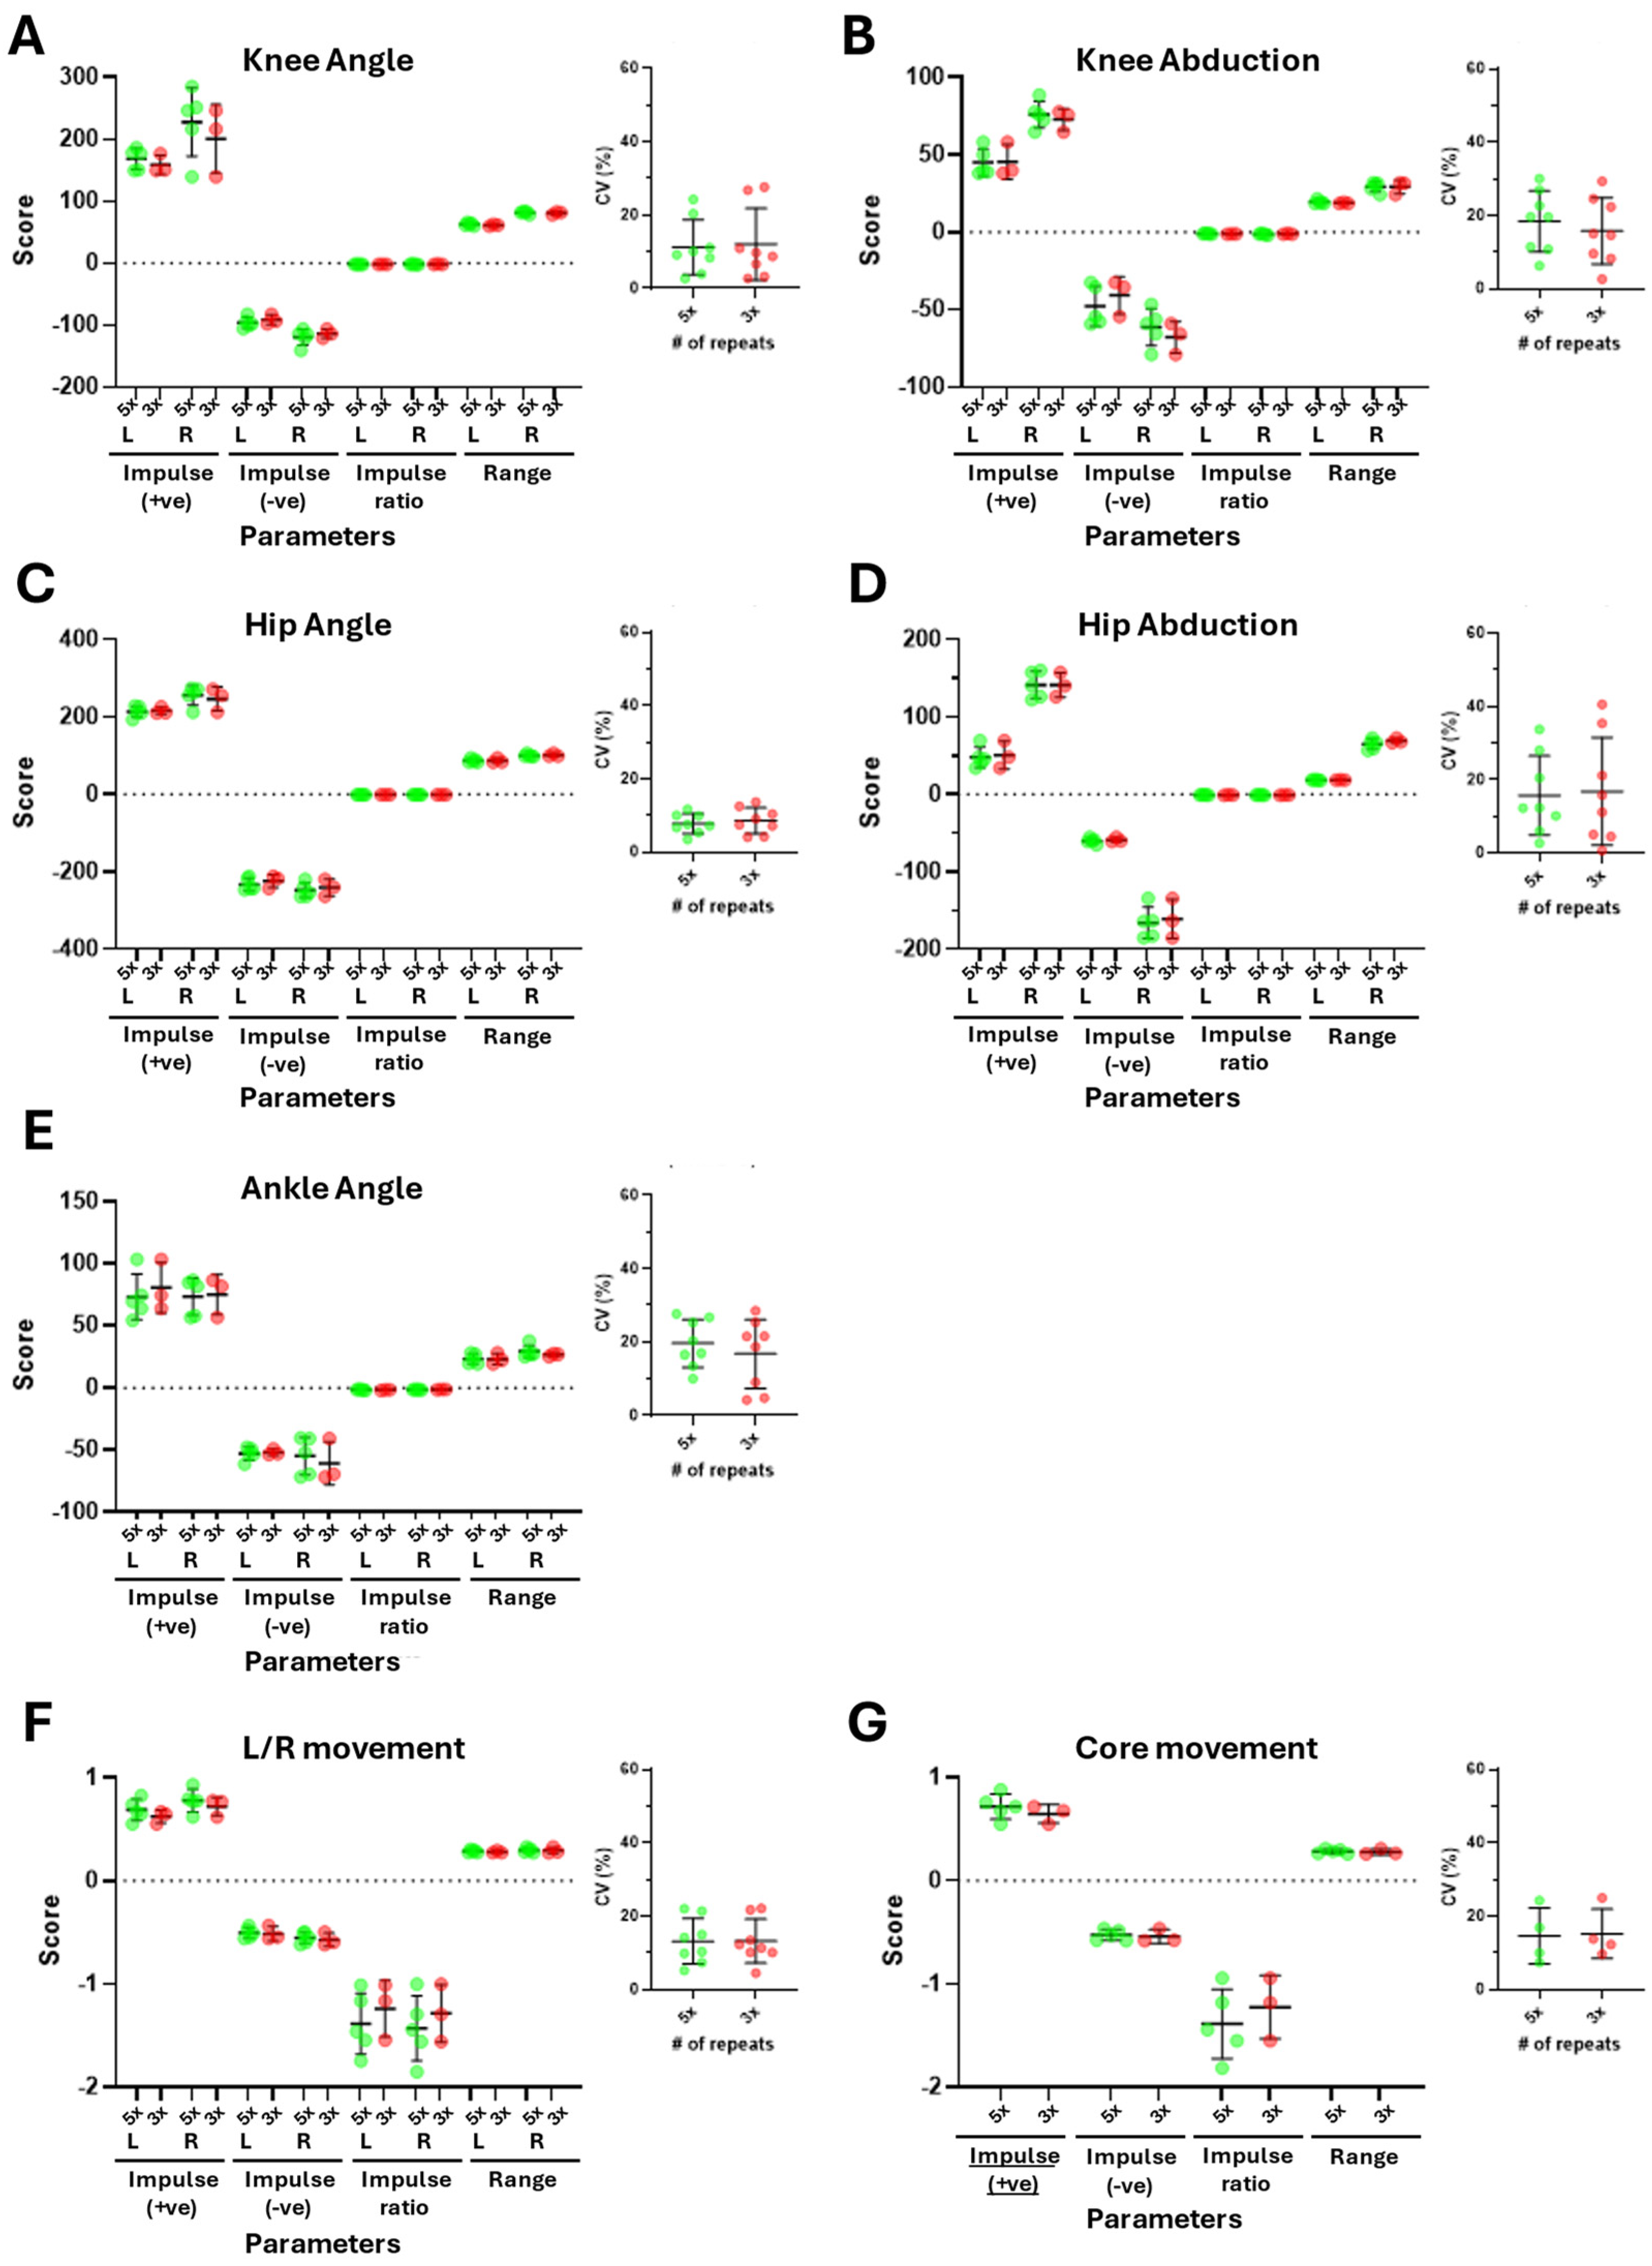
Figure 2.
– Difference in means (DiMs) derived from analysis of 5x or 3x repeats of the STS test grouped by parameter. DiMs for each parameter were derived by establishing the difference between means calculated from 5x or 3x repeats for each participant (n=10) and are presented as % of 5x mean. Mean±SD (black lines) of the DiM for each parameter are shown.
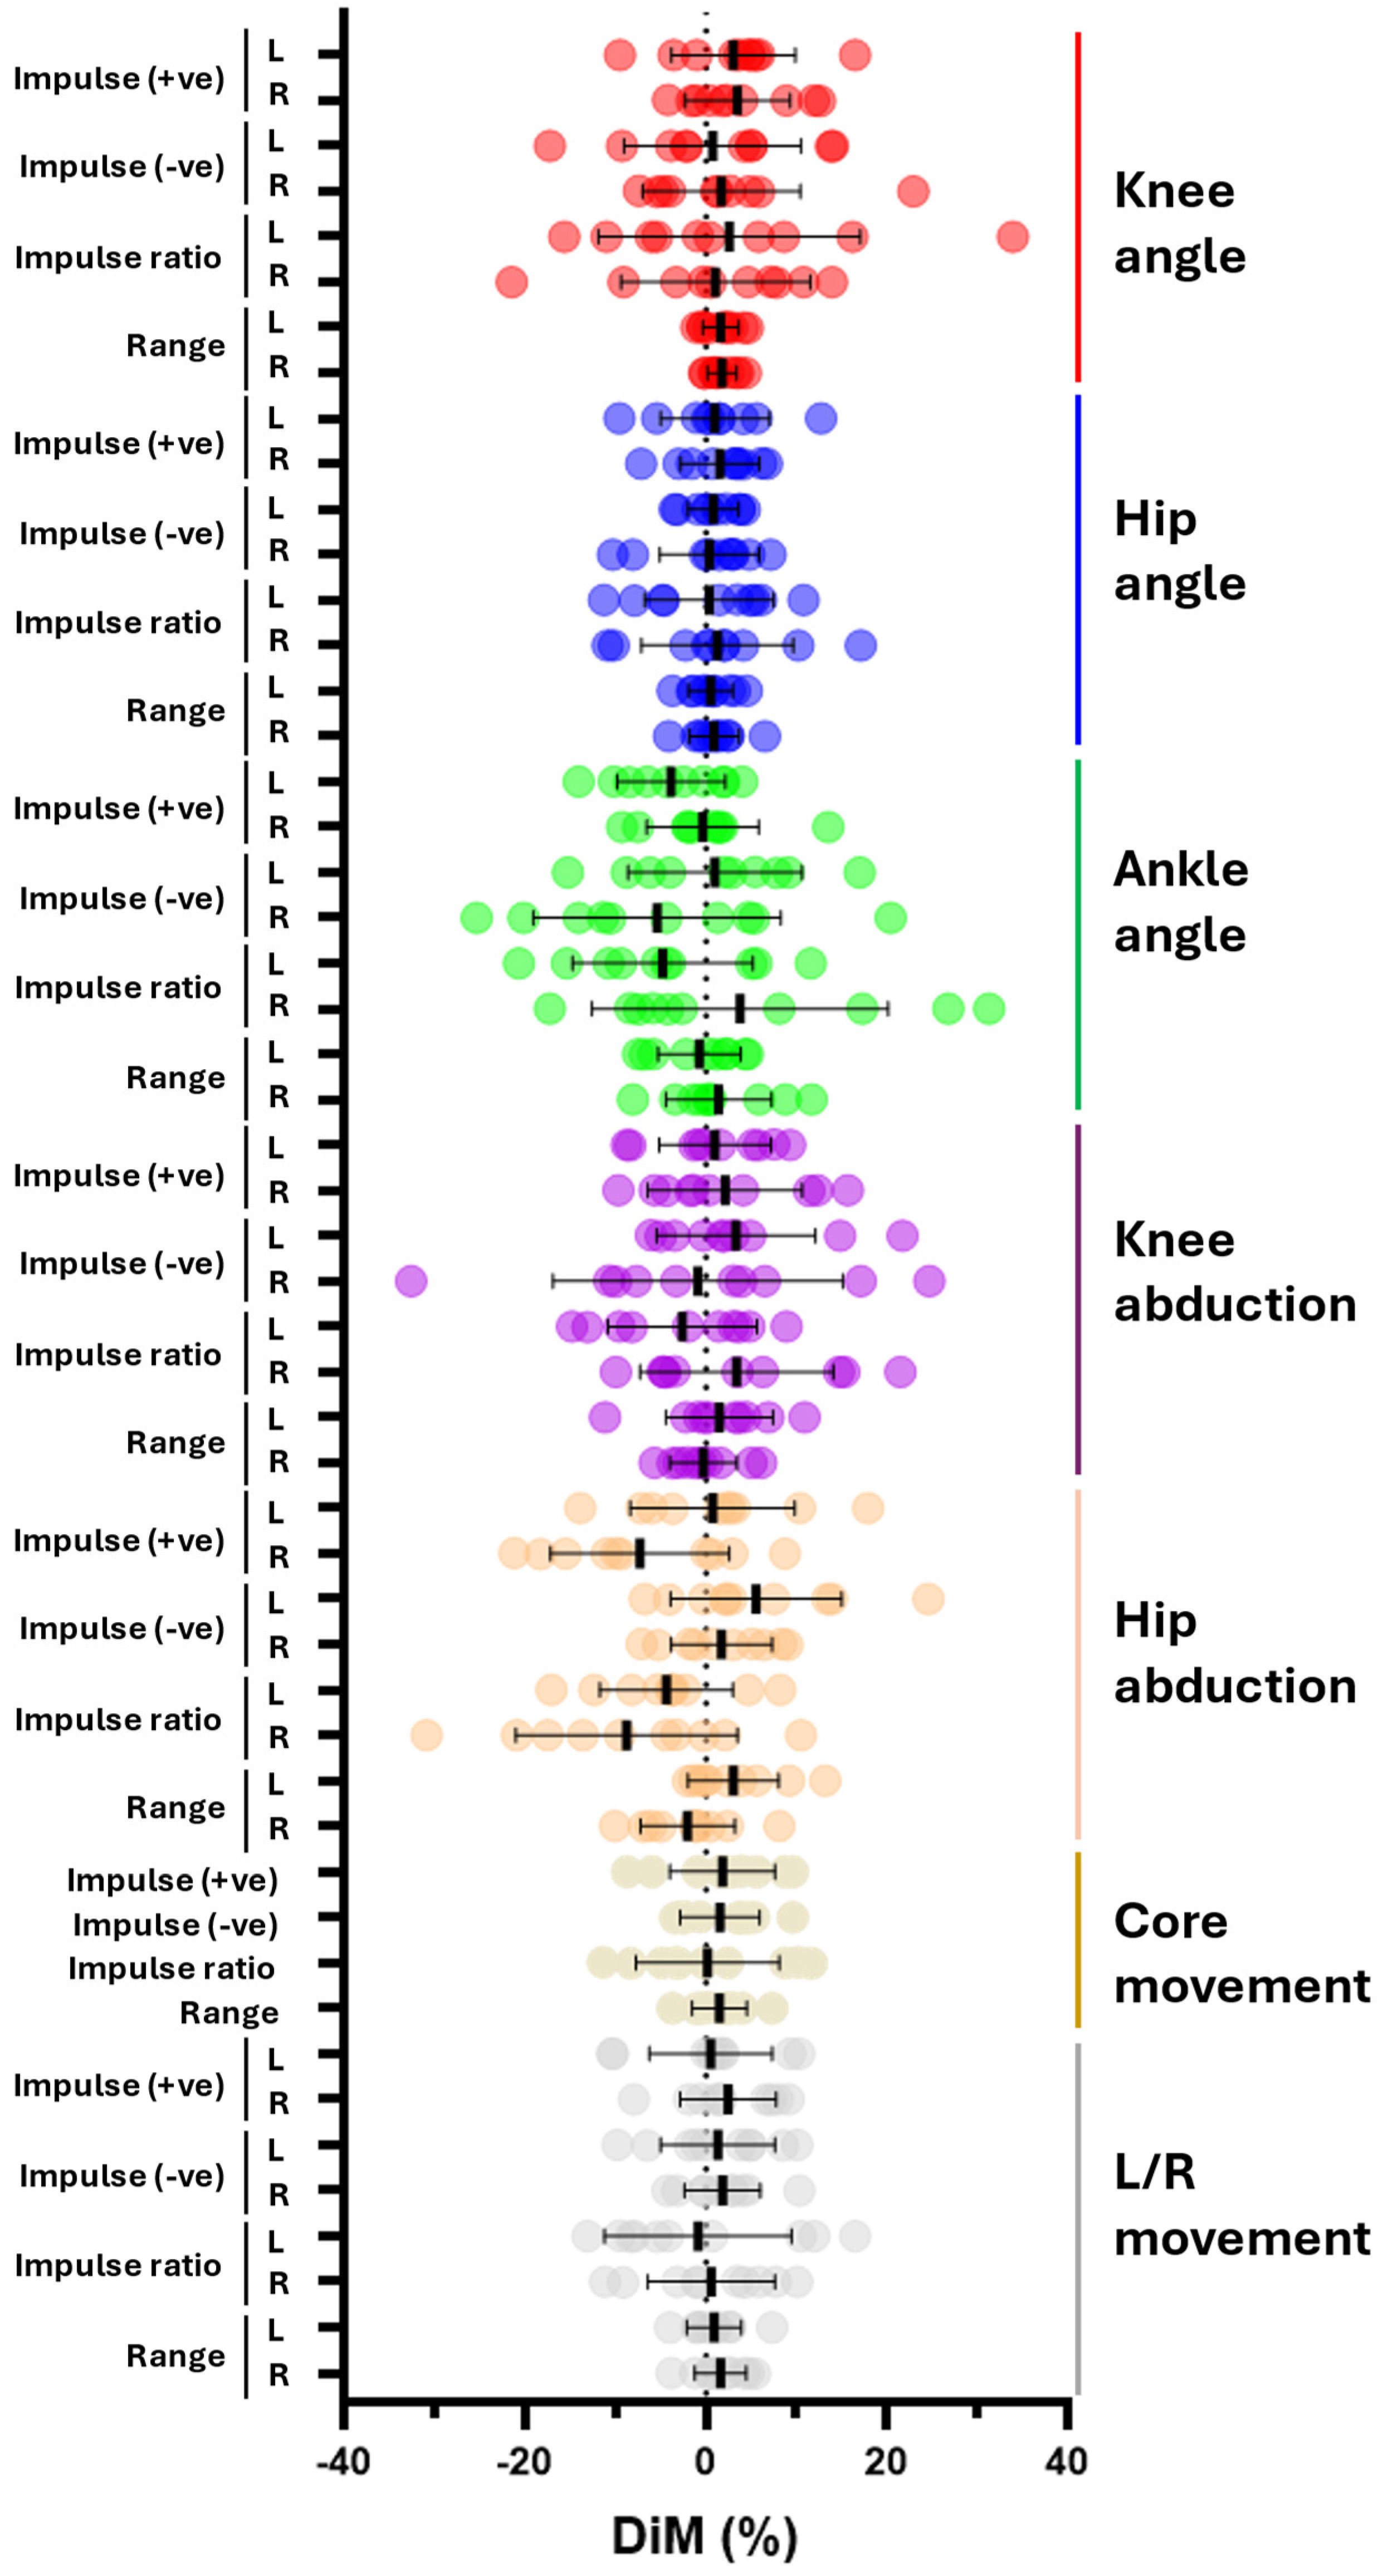
Figure 3.
– Coefficient of variance (CV) derived from analysis of 5x or 3x repeats of the STS test grouped by participant. (A) CVs for each parameter (describing Knee Angle (red), Knee Abduction (purple), Hip Angle (blue), Hip Abduction (orange), Ankle Angle (green), L/R movement (grey) and Core movement (tan)) were derived by comparing the CVs from 5x vs 3x repeats for each participant (1-10). Mean±SD (black lines) are shown. Statistical significance between 5x vs 3x for each participant was determined using repeated measures one way ANOVA followed byŠídák's multiple comparisons tests (*p<0.025; **p<0.002). (B) Mean CVs for each parameter across all 10 participants were calculated using data from 5x or 3x repeats. Mean±SD (black lines) are shown. Statistical significance between 5x vs 3x was determined using a paired t-test (***p=0.0001).
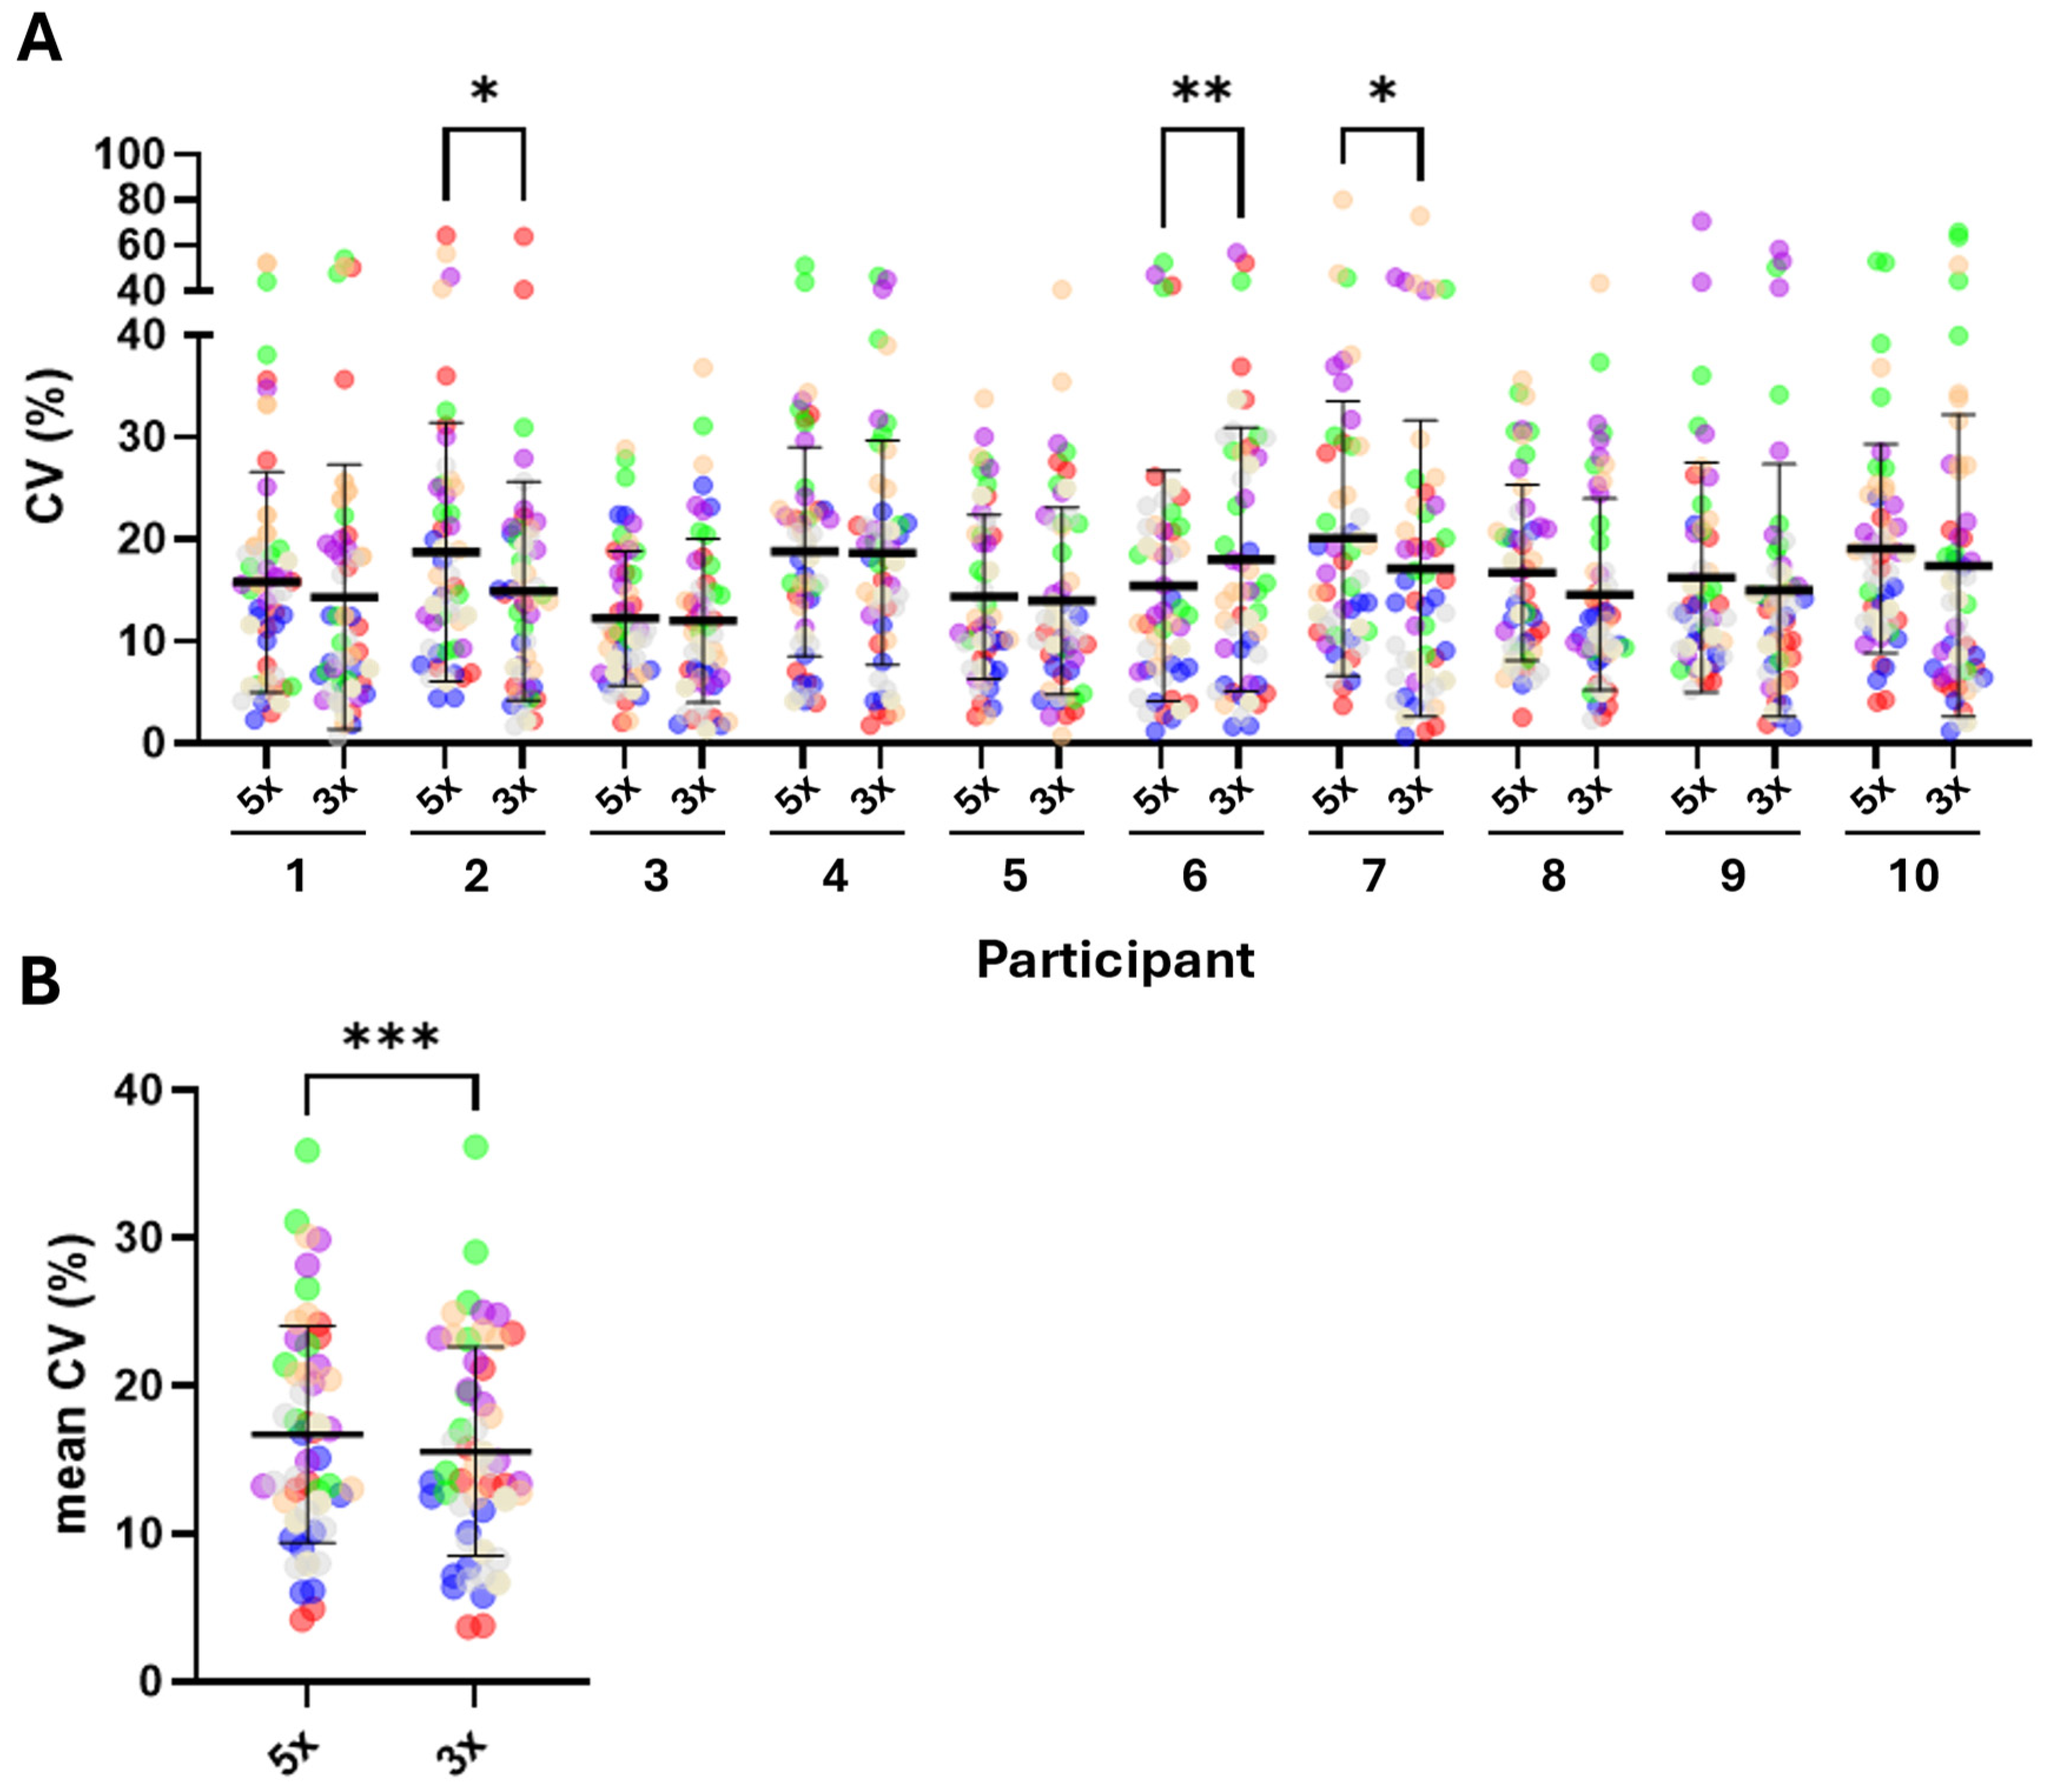
Figure 4.
– Summary of CVs derived from analysis of 5x or 3x repeats of the STS test grouped by parameter. Mean CVs for each parameter from all 10 participants are represented using a colour scale ranging from green (ideal / low CV), to amber (acceptable / intermediate CV), to red (poor / high CV). Difference in colour for a parameter between 5x vs 3x denotes differences between means of CVs for that parameter (eg 5x cf 3x for Impulse -ve, L & R, Knee angle). Similarly, where colours differ between the same parameter across different categories denotes differences between means of CVs for that parameter (eg Impulse +ve and Impulse -ve for Knee angle cf Ankle angle).
Disclaimer/Publisher’s Note: The statements, opinions and data contained in all publications are solely those of the individual author(s) and contributor(s) and not of MDPI and/or the editor(s). MDPI and/or the editor(s) disclaim responsibility for any injury to people or property resulting from any ideas, methods, instructions or products referred to in the content. |
© 2025 by the authors. Licensee MDPI, Basel, Switzerland. This article is an open access article distributed under the terms and conditions of the Creative Commons Attribution (CC BY) license (http://creativecommons.org/licenses/by/4.0/).
Copyright: This open access article is published under a Creative Commons CC BY 4.0 license, which permit the free download, distribution, and reuse, provided that the author and preprint are cited in any reuse.


