
Submitted:
02 April 2025
Posted:
07 April 2025
You are already at the latest version
Abstract
In the context of growing globalization and escalating market competition, tea enterprises in Sichuan, China, encounter challenges in maintaining and enhancing their competitiveness. This study investigates the interplay between dynamic capabilities, business model innovation (BMI), and the competitiveness of Sichuan tea enterprises. Using a Structural Equation Model (SEM), the research examines 10 representative tea enterprises in Sichuan. The findings reveal that dynamic capabilities significantly influence these enterprises' competitiveness and BMI. Specifically, the ability to perceive environmental changes enables rapid market responses, learning capabilities facilitate the adoption of new knowledge and technologies, and resource integration optimizes resource allocation. Furthermore, BMI serves as a partial mediator in this relationship, reinforcing competitive advantage through improvements in value proposition, value creation, and value capture. These findings contribute to theory and practice by offering strategic insights into how Sichuan tea enterprises can leverage dynamic capabilities and BMI to strengthen their market position.
Keywords:
Sichuan Tea Enterprises
; Dynamic capability
; Business Model Innovation
; competitiveness
; Structural Equation Model (SEM)
1. Introduction
With increasing globalization and the growing complexity of economic integration, enterprises worldwide face an increasingly dynamic and competitive market environment[1]. Traditional business models, often rigid and linear, struggle to keep pace with rapid economic, technological, and environmental shifts [2]. As a result, firms must develop strategies that enhance adaptability, resilience, and long-term sustainability. In this context, dynamic capabilities-the ability to sense, seize, and reconfigure resources-have emerged as a vital mechanism for fostering business model innovation (BMI) and ensuring enterprise sustainability[2,3].
The rapid advancement of digital technologies and shifting consumer preferences toward sustainability have created challenges and opportunities for businesses[4]. Consumers increasingly prioritize eco-friendly products, ethical supply chains, and transparent business operations, compelling enterprises to rethink their business models[5]. Technological, managerial, or business model-driven innovation has become the cornerstone of sustainable enterprise development[6]. While business model innovation (BMI) has been widely studied in high-tech and service industries, its application in traditional sectors, such as agriculture and tea production, remains underexplored[7].
The tea industry in Sichuan, China, provides a compelling case for understanding how firms in traditional agricultural sectors can integrate sustainability-driven innovation. Sichuan is one of China's most prominent tea-producing regions, renowned for its rich culture and high-quality products. In 2022, the province's tea industry achieved an output value exceeding 108 billion yuan, underscoring its economic significance 1. However, despite this financial success, Sichuan's tea enterprises face mounting challenges, including climate change, evolving consumer preferences, and intensified global competition.
Sustainability has become a critical competitive factor in the global tea market. Consumers are increasingly drawn to organic, fair-trade, and environmentally friendly tea products, pushing enterprises to adopt green innovations and integrate sustainable practices into their business models. To remain competitive, Sichuan's tea enterprises must transition from traditional production-focused strategies to more adaptive and sustainable business models that align with global sustainability trends.
Prior research indicates that dynamic capabilities, such as market sensing, learning, and resource integration, enable firms to adapt to these changing conditions and develop sustainable business models that foster long-term growth[8]. Nevertheless, the mediating role of business model innovation in this relationship remains largely unexplored, especially in traditional industries like the tea sector [9].
This study contributes to understanding how small and medium-sized enterprises (SMEs) in traditional industries can prosper in the global economy. It explores the role of dynamic capabilities in driving business model innovation. Theoretically, this research expands our understanding of how dynamic capabilities influence the competitiveness of traditional local agricultural enterprises. These enterprises have long relied on conventional production and sales models, and there has been limited research on their competitiveness[10]. This study uses empirical data to examine the relationships among dynamic capabilities, business model innovation, and competitiveness in Sichuan's tea enterprises. It provides a new theoretical perspective for understanding the mechanisms that enhance the competitiveness of Sichuan's tea enterprises. At the same time, the study broadens our understanding of dynamic capabilities in the context of international business, highlights the mediating role of business model innovation in the relationship between dynamic capabilities and firm competitiveness, lays the foundation for future research, and offers practical recommendations for entrepreneurs and managers to navigate the complexities of today's global market ever-changing examines the role of dynamic capabilities in driving business model innovation.
The rest of this article is structured as follows. The next section presents a theoretical analysis and hypothesis. The third part explains the data source and empirical model of the study. The fourth part introduces this study's empirical results and analysis, including the direct and intermediate effects tests using the structural equation model. Finally, the fifth part summarizes the thesis and discusses its significance.
2. Literature Review and Research Hypothesis
2.1. Literature Review
2.1.1. Dynamic Capability
Dynamic capabilities emerged in the 1990s as a response to the growing uncertainty in the business environment. The early perspective was that firms must develop integrated capabilities rooted in technical knowledge and resources to link changes in production and implementation [11]. The formal concept of dynamic capabilities emphasizes the need for enterprises to constantly adapt, integrate, and reconfigure internal and external resources in response to market changes. Over time, research has expanded this theory to include new perspectives[12]. The introduction of the concept of "global dynamic capability" emphasizes the importance of creating a proprietary resource portfolio in the global market[13] and the role of resource reallocation in forming competitiveness and meeting customer needs[14].
Recent studies have expanded dynamic capabilities to include a cognitive dimension, with scholars emphasizing the crucial role of managerial awareness and decision-making[15,16]. Dynamic capabilities help companies identify opportunities, respond quickly to threats, and implement strategic decisions [17], but also integrate innovation, environmental scanning and awareness, and ecosystem coordination [18]. Therefore, enterprises must develop integration capabilities based on technical expertise and resource coordination to align production and implementation with market changes[19]. The formalization of dynamic capabilities theory emphasized the importance of continuous adaptation, resource integration, and restructuring to respond effectively to shifts in the market[20]. Over time, scholars expanded this perspective, adding insights into how organizations build competitive advantage by reallocating resources and adjusting to customer needs.
2.1.2. Business Model Innovation
Initially, business models focused on market supply and demand, emphasizing product production and sales. However, as market competition intensified and the economic environment evolved, companies recognized that sustaining a competitive advantage required more than just product differentiation. Instead, businesses needed to rethink their operational strategies and value-creation mechanisms at a broader strategic level [21]. From the late 20th century to the early 21st century, scholars and business practitioners began deconstructing business models into key components, refining their operating mechanisms, and establishing systematic theoretical frameworks[22]. A significant milestone was the business model canvas proposed by Osterwalder and Pigneur [23]. This framework breaks down business models into nine core elements: customer segmentation, value proposition, channels, customer relationships, revenue sources, key resources, key activities, strategic partnerships, and cost structure[24].
Meanwhile, scholars have examined business model innovation from various perspectives. Some researchers argue that business model innovation involves reallocating organizational resources and capabilities to generate and capture new value[25]. Others emphasize that rethinking value creation and delivery mechanisms is fundamental to business model transformation[26]. Recent studies highlight that business model innovation is about creating new revenue streams and restructuring an enterprise's logic and framework to better adapt to changing customer needs and market dynamics[25]. This growing body of theoretical research has solidified business model innovation as a distinct and critical field in business strategy.
Based on the above research, this study concerning the views of[27] defines business model innovation in tea enterprises as the strategic reform of their business and profit models. This innovation aims to help tea enterprises navigate market competition and enhance their competitiveness.
2.1.3. Sustainable Competitiveness
Sustainable competitiveness refers to a firm's ability to achieve long-term economic success while maintaining environmental and social sustainability 2. Business model innovation (BMI) is crucial in rethinking value creation, delivery, and capture mechanisms to align with sustainability challenges and evolving market demands[28].
2.2. Research Hypothesis
2.2.1. The Impact of Dynamic Capability on Business Model Innovation
Dynamic capabilities enable firms to integrate, build, and reconfigure their internal and external resources to adapt to evolving market conditions. This adaptability fosters innovation and helps organizations maintain a competitive edge. Firms with intense learning, adaptability, and resource reconfiguration capabilities are better positioned to transform their business models in response to sustainability challenges[2].
In recent years, a growing body of research has confirmed this finding. Some scholars emphasize the role of perception and capture capabilities (components of dynamic capabilities) in enhancing the value proposition and value creation novelty of business model innovation[29]. In the context of digital transformation, scholars have studied the phenomenon of business model creation (BMI) empowered by digital technologies in response to the COVID-19 crisis [30]. Through the analysis of the digital actions of large food retailers like Walmart and Carrefour, they showed that the dynamic capability of retailers can be explained by the innovation of value creation and capture mechanisms, which are key elements of business model innovation.
Building on the preceding analysis, this study proposes the following hypothesis:
H1: Dynamic capabilities have a positive impact on business model innovation.
2.2.2. Business Model Innovation and Sustainable Competitiveness
Innovation is an essential pillar of competitiveness[31]. Business model innovation (BMI) involves rethinking value creation, delivery, and capture mechanisms to adapt to changing market demands and sustainability challenges [32]. Business Model Innovation (BMI) enables organizations to derive value from their innovation endeavors[33] and is recognized as a source of competitive advantage[34,35,36].
In the era of economic globalization, enterprises are confronted with a more intricate market environment. To maintain their competitive edge and enhance business performance, they must continuously adapt to changes and innovate their business models[37]. In recent years, more and more research has concluded that business model innovation is essential for enterprises to remain competitive in an unpredictable environment, enabling enterprises to adapt to a rapidly changing business environment and stay competitive. Innovation plays a crucial role in a company's competitiveness, and adopting policies that integrate innovation into business models can build lean, efficient, and competitive companies[38]. Business model innovation in the digital economy can drive competitive advantage by creating and capturing value through customer-centric value propositions, digital capabilities, and an agile organizational culture[39].
Recent studies suggest that firms that innovate their business models toward circular economy practices and eco-friendly production are more likely to enhance their sustainable competitiveness[40]. For instance, Sichuan's tea enterprises are increasingly adopting digital transformation, eco-packaging, and sustainable sourcing to gain a competitive advantage in global markets[41].
Based on the above analysis, the following hypothesis can be formulated:
H2: Business model innovation positively affects the sustainable competitiveness of Sichuan's tea enterprises.
2.2.3. Dynamic Capabilities and Sustainable Competitiveness
Dynamic capabilities (DC) refer to a firm's ability to integrate, build, and reconfigure internal and external resources to adapt to changing environments[12]. Dynamic capability is regarded as the source of competitive advantage [42]. They can integrate and reconfigure internal and external organizational resources to adapt to dynamic and complex environmental changes [43] and create corporate value amidst a turbulent and intricate market landscape. Dynamic capabilities can optimize and reposition internal and external resources to adapt to environmental shifts, facilitating the creation and maintenance of competitive advantages[12]. They enable enterprises to respond to environmental changes[44] efficiently, transform the current strategic resource base, and form a new routine process, thus enhancing enterprise efficiency[45]. Dynamic capabilities contribute to enterprises' sustainable survival and development by perceiving changes, exploring new market opportunities, reconstructing internal and external organizational resources, and providing new strategic options[46].
Dynamic capability is a key competitive advantage for businesses constantly evolving and gaining popularity in research, with an increasing number of publications on the subject. Some studies have explored the interactive relationship between dynamic capability and competitive advantage of electronic manufacturing enterprises, and the results show that dynamic capability positively affects competitive advantage[47]. Dynamic capability can help enterprises constantly adjust internal resources and capabilities to adapt to the pressure of the economic, social, and ecological environment and enhance the long-term competitiveness of enterprises on the road to sustainable development through the sustainable practice of the organization[48]. The dynamic capabilities framework suggests that firms that can effectively sense opportunities, seize resources, and transform their operations are more likely to achieve sustainable competitive advantage[49].
Building on the preceding analysis, this study proposes the following hypothesis:
H3: Dynamic capabilities directly improve the competitiveness of tea enterprises in Sichuan, China.
2.2.4. Business Model Innovation as a Mediator
Dynamic capability allows enterprises to integrate, build, and reconfigure internal and external capabilities to adapt to rapid environmental changes[12]. It empowers companies to innovate and maintain a competitive edge. While dynamic capabilities enhance competitiveness, the mechanisms by which this occurs remain underexplored.
Recent studies suggest that business model innovation (BMI) is a crucial mediator in this relationship, facilitating organizational agility and sustainability practices[50]. Scholars differentiate between micro-foundational and higher-order capabilities: the former involves restructuring core competencies, while the latter allows management to sense opportunities, redesign business models, and reallocate resources effectively [51].
Research in the context of small and medium-sized enterprises (SMEs) in China has shown that dynamic capabilities positively influence business model innovation, enhancing firm performance. This finding is particularly relevant for businesses affected by external shocks such as the COVID-19 pandemic, where BMI partially mediates the relationship between dynamic capabilities and enterprise success[52].
In summary, BMI acts as a bridge between dynamic capabilities and competitive market positioning. Firms with well-developed dynamic capabilities are likelier to engage in business model innovation, allowing them to identify emerging trends, address customer needs, and transform their operational strategies. By leveraging innovation and adaptability, businesses can secure a sustainable competitive advantage in increasingly dynamic markets[53].
Based on the preceding analysis, this study proposes the following hypothesis:
H4: Business model innovation mediates the relationship between dynamic capabilities and competitiveness in Sichuan, China.
Based on dynamic capability, this study establishes a relationship model between dynamic capability, business model innovation, and the tea enterprise competitiveness of Sichuan China. According to these hypotheses, we show an analytical model in Figure 1.
3. Research Methodology
3.1. Sample Selection
In this study, the Delphi method selected ten representative tea companies in Sichuan as samples. Firstly, more than 50 potential enterprises were collected from the database of the Sichuan Tea Industry Association, industry reports, and an online business directory to form an initial database, and a 15-member expert team including agricultural economics and business management professors, well-known tea company executives, and industry analysts was formed. The first round of experts evaluated enterprises according to market share, business model, innovation ability, and market influence, counted the frequency of recommendations, and selected the top ones to enter the second round. In the second round, experts refer to the selected enterprises' innovation practices, new product releases, and marketing strategies and rank them comprehensively. The final 10 enterprises cover large enterprises with significant market share and expansive networks, as well as small and medium-sized enterprises with unique product positioning and novel marketing, effectively reflecting the diversity of Sichuan tea enterprises. It lays a foundation for studying the relationship between dynamic capability, business model innovation, and competitiveness.
3.2. Research Instrument
Statistical Package for the Social Sciences (SPSS) and Amos software were used for data analysis. Descriptive statistics were first performed to understand the essential characteristics of the sample. Then, correlation analysis was carried out to explore the relationships between dynamic capabilities, business model innovation, and competitiveness. Finally, the hypotheses are tested using structural equation models (SEM) and the path coefficients between dynamic capabilities, business model innovation, and sustainable competitiveness.
Notably, the potential variables examined in this study—dynamic capability, business model innovation, and firm competitiveness—are abstract and complex to measure directly. However, the structural equation model (SEM) offers a significant advantage by enabling the construction of both measurement and structural models. This approach allows for a comprehensive analysis of the complex interrelationships among these variables, providing a robust analytical framework to explore the factors influencing the competitiveness of tea enterprises in Sichuan, China.
3.3. Variable Measurement
A structured questionnaire was carefully designed to ensure the precise collection of research data, with each item assessed using a five-point Likert scale. This study incorporates three latent and nine observed variables, totaling 40 items. The dimension framework was developed to align closely with the core research objectives.
3.3.1. Dynamic Capability (DC)
Dynamic capability is the independent variable of this study. Scholars have analyzed dynamic capabilities from different dimensions to further explain and understand enterprises' dynamic capabilities. In most cases, scholars deconstruct dynamic capabilities from the perspective of the process [54], dividing them into perception, learning, and reconstruction ability[55]. After continuous exploration, scholars divide dynamic ability into perception and integration ability of learning ability[56,57]. Sichuan is rich in tea resources. However, the tea market is highly competitive, and consumer demand constantly changes. Tea enterprises must have a keen insight into market trends, integrate various resources, and improve tea planting and production technology. Therefore, we divided dynamic capability into three dimensions: sensing, learning, and integration capability.
The constructs in this study are measured using validated scales derived from previous research. Sensing capability (SC) is assessed based on the framework proposed by[55] and the validated scale developed by[58], which evaluates an organization's ability to detect market opportunities and respond to environmental changes. Learning capability (LC), a critical component of dynamic capabilities, is measured using the validated scale from[59], capturing an organization's capacity to absorb, interpret, and integrate new knowledge to enhance competitiveness. Integration capability (IC) is assessed using the validated scale from[60], which examines an organization's effectiveness in coordinating internal processes, adapting strategies, and efficiently integrating and reallocating resources in response to environmental shifts, thereby strengthening competitive advantage. The measurement items for Sensing capabilities, learning ability, and integration ability are detailed in Table 1.
3.3.2. Business Model Innovation (BMI)
Business model innovation (BMI) is the mediating variable. Scholars believe that the measurement dimensions of business model innovation generally range from 4 to 8[61]. The latest scale construction of business model innovation tends to select fewer dimensions, usually between 3 and 5[62]. Most scholars divide the business model innovation architecture into value proposition innovation, value creation innovation, and value capture innovation in recent years[63,64,65,66,67]. Considering Sichuan tea's unique natural resources, its origin advantages, and rich cultural heritage, consumers can be offered distinctive products that deliver exceptional value. Simultaneously, value recovery can be achieved through strategic pricing and diversified sales channels, ensuring sustainable market positioning and competitive advantage. Therefore, this study divides the business model innovation of Sichuan tea enterprises into value creation, value proposition, and value capture. These dimensions provide insights into how enterprises define the value they offer to customers, convert created value into financial benefits, and develop a systematic approach to value creation.
Value Proposition (VP), a fundamental component of business model innovation, is assessed using a validated scale[68,69,70]. The measurement items examine an organization's capacity to deliver high-quality products, enhance service flexibility, evaluate customer perceptions, and facilitate customer value creation, thereby strengthening market competitiveness. Similarly, Value Creation (VC), a critical determinant of business sustainability, is evaluated using a validated scale[68,69,71,72]. This dimension captures an organization's ability to streamline transactions, enhance customer familiarity with operational processes, provide efficient offerings, allocate valuable resources effectively, and ensure customer satisfaction, all contributing to a sustained competitive advantage. Furthermore, Value Capture (VCA), a fundamental aspect of business performance, is measured through a validated scale[68,69,71]. The items assess an organization's effectiveness in capturing value through superior product quality, market expansion, and innovative strategies for revenue generation or cost reduction. A detailed presentation of the measurement items is provided in Table 2.
3.3.3. Market Competitiveness (MC)
Enterprise competitiveness is the dependent variable of this study. The study examines market competitiveness, profit capabilities, and growth capacity [73,74], assessing an enterprise's market position, revenue generation capability, and future development prospects.
Enterprise Competitiveness (EC) is a multidimensional construct that encompasses market competitiveness, profit capabilities, and growth capacity, essential for sustaining a firm's competitive advantage. Market Competitiveness (MC), measured using a validated scale[75,76,77], assesses an enterprise's ability to expand its market share, maintain high customer satisfaction and loyalty levels, establish a strong presence in target markets, and respond flexibly to dynamic market conditions. Profit Capabilities (PR), based on established measures[78,79,80], evaluate an organization's efficiency in production, return on investment, cost competitiveness, and revenue growth. Growth Capacity (GC), an essential dimension of long-term sustainability, is measured using a validated scale[81,82,83] and examines an organization's ability to enhance customer satisfaction, attract new customers, implement employee-driven innovations, achieve managerial satisfaction with performance, and maintain higher productivity than competitors. These dimensions collectively provide a comprehensive framework for assessing enterprise competitiveness and strategic positioning in dynamic business environments.

Table 3.
Market Competitiveness measurement scale.
| Dimensions | Code | Item |
|---|---|---|
| Market Competitiveness |
MC1 | Firms' market share is growing faster. |
| MC2 | The company's customer satisfaction and loyalty are very high. | |
| MC3 | The company's products have a high market share in the target market. | |
| MC4 | Companies have the flexibility to adapt to rapidly changing markets and respond more quickly. | |
| Profit Capabilities |
PR1 | The production efficiency of the company is very high. |
| PR2 | The company has a high return on investment. | |
| PR3 | Enterprises can compare and Provide products or services to customers cheaply. | |
| PR4 | The company's sales are growing fast. | |
| Growth Capacity |
GC1 | Enterprises are better able to improve customer satisfaction |
| GC2 | Businesses are better able to attract new customers. | |
| GC3 | Companies were able to implement more employee suggestions than last year. | |
| GC4 | The top management team of the enterprise is relatively satisfied with the performance. | |
| GC5 | The average productivity of employees is higher than that of competitors. |
The five-point Likert scale was employed, where one represents "strongly disagree," 2 represents "disagree," 3 represents "neutral," 4 represents "agree," and 5 represents "strongly agree."
3.4. Data Collection
Before the large-scale distribution of questionnaires, a pre-survey was conducted to refine and optimize the questionnaire content. Subsequently, researchers contacted ten representative tea enterprises via email, telephone, and other communication channels to explain the study's purpose and significance, securing their support and cooperation. Five hundred questionnaires were distributed through an online survey platform to these enterprises in Sichuan Province, resulting in 470 responses. After data screening, 451 valid responses were obtained, yielding an effective response rate of 90.2%. To enhance the quality and recovery rate of the questionnaires, researchers monitored the distribution process in real-time and conducted follow-ups to ensure data collection proceeded as planned.
4. Research Results
4.1. Descriptive Statistical Analysis
In this study, we utilized SPSS 27.0 software to process the data from the sample questionnaire. The test results are presented in Appendix A1. Kline proposed that the sample follows a normal distribution when the absolute value of skewness is less than 3, and the absolute value of kurtosis is less than 10[84]. The statistical results show that the absolute values of skewness and kurtosis of measurement items in the questionnaire are all less than 1, and the absolute values of kurtosis are all less than 2, indicating that the values of each measurement item follow a normal distribution and can be used for confirmatory factor analysis.
4.2. Reliability Analysis
Table 4.
Results of the reliability analysis of the sample population.
| Latent | Observed Variable | Items | Corrected Item-Total Correlation | Cronbach's Alpha if Item Deleted | Cronbach's alpha | Cronbach's Alpha (n=451) |
|---|---|---|---|---|---|---|
| DC | SC | SC1 | 0.719 | 0.859 | 0.884 | 0.945 |
| SC2 | 0.717 | 0.859 | ||||
| SC3 | 0.724 | 0.857 | ||||
| SC4 | 0.719 | 0.859 | ||||
| SC5 | 0.717 | 0.859 | ||||
| LC | LC1 | 0.722 | 0.861 | 0.886 | ||
| LC2 | 0.697 | 0.867 | ||||
| LC3 | 0.742 | 0.857 | ||||
| LC4 | 0.715 | 0.863 | ||||
| LC5 | 0.739 | 0.857 | ||||
| IC | IC1 | 0.678 | 0.865 | 0.881 | ||
| IC2 | 0.712 | 0.857 | ||||
| IC3 | 0.754 | 0.847 | ||||
| IC4 | 0.709 | 0.858 | ||||
| IC5 | 0.726 | 0.854 | ||||
| BMI | VPR | VPR1 | 0.698 | 0.698 | 0.859 | |
| VPR2 | 0.714 | 0.714 | ||||
| VPR3 | 0.731 | 0.731 | ||||
| VPR4 | 0.674 | 0.674 | ||||
| VCR | VCR1 | 0.768 | 0.768 | 0.893 | ||
| VCR2 | 0.722 | 0.722 | ||||
| VCR3 | 0.725 | 0.725 | ||||
| VCR4 | 0.724 | 0.724 | ||||
| VCR5 | 0.747 | 0.747 | ||||
| VCA | VCA1 | 0.702 | 0.76 | 0.833 | ||
| VCA2 | 0.687 | 0.774 | ||||
| VCA3 | 0.689 | 0.772 | ||||
| EC | MC | MC1 | 0.732 | 0.831 | 0.870 | |
| MC2 | 0.715 | 0.838 | ||||
| MC3 | 0.727 | 0.833 | ||||
| MC4 | 0.72 | 0.836 | ||||
| PC | PC1 | 0.709 | 0.796 | 0.848 | ||
| PC2 | 0.681 | 0.809 | ||||
| PC3 | 0.674 | 0.812 | ||||
| PC4 | 0.678 | 0.81 | ||||
| GC | GC1 | 0.704 | 0.842 | 0.871 | ||
| GC2 | 0.688 | 0.846 | ||||
| GC3 | 0.701 | 0.842 | ||||
| GC4 | 0.694 | 0.844 | ||||
| GC5 | 0.693 | 0.845 |
Before the validity analysis, we first conducted the overall reliability analysis of the sample, scored the reliability of each potential variable and observed variable, and observed its reliability coefficient according to the measurement results. If the reliability coefficient is more significant than 0.7 and the combined reliability is greater than 0.6, it indicates that the scale has good reliability. According to the measurement results in Table 5, the overall Cronbach's Alpha of the scale was 0.945. The highest Cronbach's Alpha value of each latent variable was 0.920, and the lowest combined reliability of the observed variable was 0.833, which met the requirements of a reliability coefficient greater than 0.7 and combined reliability greater than 0.6, indicating that the scale had good reliability.
4.3. Convergence Factor Analysis (CFA)
Confirmatory Factor Analysis (CFA) tests the degree of fit between the investigator's preset factor structure and the actual observed data to help the researcher determine whether the observed variable effectively reflects the underlying construct or factor. First, the researchers examined each latent variable. We measure the internal consistency of an indicator by Composite Reliability, which is the degree to which a set of measurement indicators agree on the underlying variability. In general, if C.R.>0.7, the measurement is considered highly reliable[85]. AVE (Average Variance Extracted) is used to assess the convergence validity of latent variables, the extent to which a measure can explain the variance of the latent variables. Generally, if the AVE value is more significant than 0.5, the underlying variable has good convergence validity[86].
Amos 27.0, a Structural Equation Model software, was used to conduct first-order and second-order calculations for each dimension of dynamic capability, business model innovation, and competitiveness of tea enterprises, and the corresponding parameter estimation and fitting indicators were obtained, as shown in Table 5, Table 6 and Table 7.
As shown in Table 5, in the confirmatory factor analysis of dynamic capability, the path coefficients of the three dimensions of dynamic capability are estimated to be between 0.731 and 0.821. It suggests a significant and relatively strong direct relationship between the three dimensions and dynamic capability. Changes or improvements in each dimension will considerably impact the enterprise's dynamic capabilities. Cronbach's sensing, learning, and integration capability values were 0.884, 0.886, and 0.881, respectively, all higher than the minimum requirement of 0.7. Through the calculations, we came up with The Composite Reliability of Sensing Capability, Learning Capability, and Integration Capability were 0.883, 0.886, and 0.882, which were greater than 0.7. The AVE values are 0.603, 0.608, and 0.599, respectively, more significant than 0.5. The results show that the dynamic capability scale has good reliability and convergence.
From the fitting results of the Dynamic Capability scale model (shown in Table 6), the x2/df value is less than 2. The GFI value is more than 0.9, the NFI value, CFI value, RFI value, IFI value, TLI value, and CFI value are all greater than 0.9, and the RMSEA value is less than 0.05, which means the overall model fits the scale well, Researchers can consider the scale to have good construction validity.
The results show that the correlation coefficients among the three dimensions of dynamic capabilities reach a significant level. Learning capability had the highest factor loading at 0.802, followed by integration capability at 0.771 and sensing capability at 0.766, with all factors loading greater than 0.7, indicating a substantial degree of aggregation among the dimensions when measuring the construct of dynamic capability.
As presented in Table 8, in the confirmatory factor analysis of business model innovation, the path coefficients of the three dimensions of business model innovation are estimated to range from 0.748 to 0.808. It suggests that these three dimensions have a relatively strong direct influence on business model innovation. The Cronbach's α values of value proposition, value creation, and value capture were 0.859, 0.893, and 0.833, respectively, all surpassing the minimum requirement of 0.7. The calculations found that the Composite Reliability of value proposition, value creation, and value capture were 0.860, 0.893, and 0.833, respectively, all greater than 0.7. The AVE values are 0.605, 0.625, and 0.624, respectively, exceeding 0.5. The results demonstrate the business model innovation scale's reliability and convergence.
According to the model fitting (Table 9), the x2/df value is 1.692, less than 2, the GFI value is more significant than 0.9, the NFI value, CFI value, RFI value, IFI value, TLI value, and CFI value are all above 0.9, and the RMSEA value is 0.039, less than 0.05. The overall model fits the scale well. Based on the above comprehensive analyses, we can conclude that the scale has relatively good construct validity. Therefore, the model conforms to the standard of the Structural Equation Model.
The results show that the correlation coefficients among the three dimensions of business model innovation reach a significant level. Value creation had the highest factor loading at 0.821, followed by value proposition at a loading of 0.782 and value capture at a factor loading of 0.746. All factors loading is more significant than 0.7, indicating substantial aggregation among the dimensions when measuring the business model innovation construct.
It can be learned from Table 11 that in the confirmatory factor analysis for enterprise competitiveness, the estimated values of the path coefficients of the three dimensions of enterprise competitiveness range from 0.744 to 0.816, which indicates a robust direct correlation between these three dimensions and enterprise competitiveness. The Cronbach's α values of marketing competitiveness, profit capability, and growth capacity are 0.870, 0.848, and 0.871, respectively, all exceeding the minimum requirement of 0.7. Through calculation, it is found that the composite reliabilities of marketing competitiveness, profit capability, and growth capacity are 0.870, 0.848, and 0.871, respectively, all greater than 0.7. The AVE are 0.627, 0.582, and 0.574, respectively, exceeding 0.5. The results indicate that the measurement scale of enterprise competitiveness has good reliability and convergence.
According to the fitting of the enterprise competitiveness model (Table 12), x2/df value is 1.782, less than 2, GFI value is 0.961, more significant than 0.9, NFI value, CFI value, RFI value, IFI value, TLI value, and CFI value are respectively: 0.961, 0.963, 0.954, 0.984, 0.979, 0.984. The values are all greater than 0.9, and the RMSEA value is 0.042, less than 0.05. The overall model and scale fit well. Based on the above analysis, this scale has good construct validity.
The results show that the correlation coefficients among the three dimensions of enterprise competitiveness reach a significant level. Marketing competitiveness had the highest factor loading at 0.788, followed by profit capability at 0.765 and growth capacity at 0.760, all factors loading greater than 0.7, indicating a substantial degree of aggregation among the dimensions when measuring the construct of EC.
4.4. Pearson's Correlation Analysis
Pearson's correlation analysis in Table 14 reveals significant relationships between dynamic capabilities (SC, LC, IC), business model innovation (VPR, VCR, VCA), and enterprise competitiveness (MC, PC, GC) among Sichuan tea enterprises. The results show that dynamic capabilities are positively correlated with business model innovation, with learning capabilities and integrating capabilities (IC) exhibiting the strongest associations with value proposition (VPR) and value creation (VCR) (r = 0.343–0.398, p < 0.01). Additionally, business model innovation dimensions significantly correlate with enterprise competitiveness, particularly value creation (VCR) and market competitiveness (MC) (r = 0.364, p < 0.01), indicating that effective business model transformation enhances competitive advantage. Furthermore, enterprise competitiveness indicators (MC, PC, GC) show strong interrelations, reinforcing that market competitiveness can sustain growth. These findings align with dynamic capability theory, highlighting that enhancing sensing, learning, and integrating capabilities fosters business model innovation, strengthening enterprise competitiveness.
4.5. Direct Effect Test
Based on the above analysis, the mediating effect of business model innovation on the relationship between dynamic capabilities and the competitiveness of Sichuan tea enterprises aligns with the requirements of the Structural Equation Model (SEM). Following the analytical framework for tea enterprise competitiveness in Sichuan, a structural equation model was developed and subjected to an initial fitting test using AMOS 27.0. The corresponding fitting parameters are presented in Table 15.
As shown in Table 15, the absolute fit index confirms the model's adequacy. The chi-square to degrees of freedom ratio (x2/df) is 1.257, which falls within the acceptable range of 1 to 3, indicating a relatively satisfactory model fit. Additionally, the root mean square error of approximation (RMSEA) is 0.024, below the standard threshold of 0.05. This low value of the RMSEA suggests the model has minimal approximation error and demonstrates a strong overall fit. The normed fit index is 0.915, higher than 0.9, indicating the model has a favorable fit. The relative fit index (RFI) is 0.909, more significant than 0.9, further supporting the model's fit effect. The incremental fit index is 0.981, above 0.9, signifying a high level of model fit. The Tucker-Lewis index (TLI) is 0.980, more than 0.9, reflecting that the model fits well. The comparative fit index (CFI) is 0.981, surpassing 0.9, indicating an excellent model fit. The structural equation of the impact of enterprise dynamic capabilities on the competitiveness of Sichuan tea enterprises, with business model innovation as the mediating variable, is depicted in Figure 2.
Figure 2 visualizes the relationships among the key variables in the study. Rectangles represent observed variables, which include specific measurement items for sensing capability (SC), learning capability (LC), integration capability (IC), value proposition (VPR), value creation (VCR), value capture (VCA), market competitiveness (MC), profitability (PC), and growth capability (GC). These observed variables provide the empirical basis for the study. Ellipses represent latent variables, namely dynamic capabilities (DC), business model innovation (BMI), and enterprise competitiveness (EC). These core abstract concepts are inferred indirectly through observed variables, as they cannot be measured directly. The arrows in the figure indicate the paths of influence among variables, reflecting important theoretical hypotheses and empirical findings. For example, the arrow from dynamic capabilities (DC) to business model innovation (BMI) indicates that dynamic capabilities (DC) changes may trigger corresponding business model innovation BMI changes. The path coefficient quantifies this relationship, meaning that a 1-unit increase in DC is associated with a 0.135-unit rise in BMI. Similarly, the coefficient of 0.436 on the path from BMI to EC indicates that a 1-unit increase in business model innovation (BMI) is associated with a 0.436-unit increase in EC. The coefficient of 0.088 on the path from dynamic capabilities (DC) to EC means that a 1-unit increase in dynamic capabilities (DC) is associated with a 0.088-unit increase in enterprise competitiveness (EC). These coefficients reveal both the direction and intensity of the relationships among variables, providing a basis for analyzing the complex interactions between dynamic capabilities, business model innovation, and enterprise competitiveness.
Based on the structural equation model results, the path relationships among the three core variables (DC, BMI, EC) are summarized in Table 16, including path coefficients, standard errors (S.E.), critical ratios (C.R.), probabilities (P), and standardized regression weights.
The estimated path coefficient from dynamic capability (DC) to business model innovation (BMI) is 0.135, which indicates that DC has a positive effect on Business Model Innovation (BMI). The right of return estimate's standard error (S.E.) is 0.014. When the significance level P < 0.001, the critical ratio reaches 9.322, and its absolute value exceeds the necessary threshold of 3.29. When the significance level is 0.001, researchers can estimate that the parameter is significantly non-zero, indicating a statistically significant relationship between dynamic capability (DC) and business model innovation (BMI). For every 1 unit increase in DC, Business Model Innovation (BMI) increased by an average of 0.135 units. The estimated value of standardized regression weight is 0.642, indicating that dynamic capability (DC) can explain business model innovation (BMI). In conclusion, dynamic capability (DC) significantly positively affects business model innovation (BMI). The study verifies the positive relationship between dynamic capabilities and business model innovation, confirming hypothesis 1.
The estimated path coefficient from business model innovation (BMI) to enterprise competitiveness (EC) is 0.436, which shows that business model innovation has a positive role in promoting the competitiveness of enterprises. With the innovation of business models, the competitiveness of enterprises has a trend of improvement. The right of return estimate's standard error (S.E.) is 0.086. When the significance level P < 0.001, the critical ratio reaches 5.073, and its absolute value exceeds the necessary threshold of 3.29. When the significance level is 0.001, researchers can estimate that the parameter is significantly non-zero, indicating a statistically significant relationship between business model innovation (BMI) and enterprise competitiveness (EC). For every 1 unit increase in business model innovation (BMI), enterprise competitiveness (EC) increased by an average of 0.436 units. The estimated value of standardized regression weight is 0.406, indicating that business model innovation (BMI) can explain enterprise competitiveness (EC). In conclusion, business model innovation (BMI) significantly positively affects enterprise competitiveness (EC). The study verifies the positive relationship between business model innovation (BMI) and enterprise competitiveness (EC), confirming hypothesis 2.
The estimated path coefficient from dynamic capability (DC) to enterprise competitiveness (EC) is 0.088, which indicates that dynamic capability (DC) plays a positive role in promoting enterprise competitiveness (EC). However, compared with the path coefficient of dynamic capability on business model innovation mentioned above (0.135) and the path coefficient of business model innovation (BMI) on enterprise competitiveness (0.436), this coefficient value is small, indicating that dynamic capability has a relatively weak role in improving enterprise competitiveness. The right of return estimate's standard error (S.E.) is 0.018. When the significance level P < 0.001, the critical ratio reaches 4.883, and its absolute value exceeds the necessary threshold of 3.29. When the significance level is 0.001, the estimation shows that the parameter is significantly non-zero, indicating a statistically significant relationship between dynamic capability (DC) and enterprise competitiveness (EC). For every 1-unit increase in DC, enterprise competitiveness (EC) increases by an average of 0.088 units. The estimated value of standardized regression weight is 0.390, indicating that dynamic capability (DC) can explain enterprise competitiveness (EC). To sum up, dynamic capability has a positive impact on enterprise competitiveness. The hypothesis of a positive correlation between dynamic capability and enterprise competitiveness is verified, and hypothesis 3 is accepted.
4.6. Mediating Effect Testing
As can be seen from Table 17, the mediating effect of dynamic capability (DC) on enterprise competitiveness (EC) through business model innovation is 0.158, the total effect value of dynamic capability (DC) on enterprise competitiveness (EC) is 0.464, and the effect value is within 95% confidence interval, excluding 0. The mediating effect accounts for 34% of the total effect. Therefore, business model innovation (BMI) has a significant partial mediating effect on the impact of dynamic capability (DC) on firm competitiveness (EC), and hypothesis 4 is accepted.
5. Conclusions and Recommendations
5.1. Conclusions
This study employed a Structural Equation Model (SEM) to examine the relationships among Dynamic Capabilities (DC), Business Model Innovation (BMI), and Enterprise Competitiveness (EC). The findings revealed significant impacts among these variables.
The results reveal that Dynamic Capabilities (DC) significantly influence Business Model Innovation (BMI) (β = 0.642, p < 0.001), highlighting the necessity for organizations to enhance their ability to sense, learn, and integrate knowledge effectively. To strengthen dynamic capabilities, firms should engage in continuous market analysis to refine their sensing capabilities, promote knowledge-sharing initiatives to improve learning capabilities, and foster cross-functional collaboration to enhance integration capabilities. These measures will enable businesses to develop adaptive business models that respond effectively to changing market dynamics. Furthermore, Business Model Innovation (BMI) exerts a strong positive impact on Enterprise Competitiveness (EC) (β = 0.406, p < 0.001). This suggests that organizations can enhance their competitive edge by focusing on sustainable and innovative business models. Companies should develop unique value propositions through product differentiation and digital transformation, optimize value creation by leveraging advanced technologies and strategic partnerships, and enhance value capture mechanisms through data-driven pricing and revenue models.
Additionally, the study indicates that Dynamic Capabilities (DC) have a direct and positive effect on Enterprise Competitiveness (EC) (β = 0.390, p < 0.001), implying that organizations can improve their market positioning, growth capacity, and profitability without solely relying on business model innovation. To achieve this, businesses should adopt agile decision-making frameworks to enhance market responsiveness, invest in digital tools such as AI-driven analytics to improve operational efficiency and implement sustainable business strategies that align with long-term financial and environmental goals. In conclusion, these findings offer strategic insights for firms aiming to sustain innovation and competitiveness. Organizations can effectively navigate an evolving business landscape and achieve sustainable long-term success by strengthening dynamic capabilities, driving business model innovation, and leveraging enterprise competitiveness strategies.
The findings of this study align with and extend prior research on dynamic capabilities, business model innovation, and firm competitiveness. The positive relationship between dynamic capabilities and competitiveness supports the theoretical framework proposed by Teece, who argues that firms with strong dynamic capabilities can sense, seize, and transform opportunities more effectively, leading to sustainable competitive advantage[2]. Similarly, our results are consistent with[38] that enterprises with greater adaptability and market responsiveness are better positioned to innovate and refine their business models. Moreover, our study confirms the mediating role of business model innovation, which resonates with previous research suggesting that innovation in business models is a key mechanism through which firms leverage their dynamic capabilities to achieve superior performance[50].
This study provides empirical evidence that dynamic capabilities are crucial drivers of business model innovation and sustainable competitiveness in Sichuan's tea industry. By emphasizing the role of knowledge integration and strategic flexibility, the findings offer actionable insights for businesses seeking to maintain a competitive edge in evolving markets.
5.2. Recommendations
5.2.1. Focus on Strengthening Dynamic Capabilities
Enterprises should increase investment to cultivate employees' learning ability and adaptability. Regularly organize training courses on market trend analysis and emerging - technology applications to enhance employees' acumen in perceiving market opportunities. Establish cross-departmental project teams, encouraging members to practice resource allocation in diverse business scenarios, strengthening their ability to seize opportunities and translate them into business growth. Through regular reviews of organizational structures and business processes, flexibly adjust the allocation of internal and external resources to improve organizational agility. Conduct training on strategic resource management, teaching enterprises to identify, cultivate, and utilize core strategic resources. Accelerate digital transformation by introducing enterprise resource planning (ERP) systems, customer relationship management (CRM) systems, etc., to build a more resilient enterprise structure.
5.2.2. Promote Business Model Innovation
Enterprises should comprehensively renovate value creation, delivery, and capture mechanisms. Leverage big data to analyze consumer demands and develop personalized tea products. Optimize the logistics and distribution system to ensure the fresh and prompt delivery of products. Explore diversified profit - making models, such as launching tea - themed tourism and tea - culture experience courses. Accelerate the process of digital transformation by building an entirely - functional e-commerce platform to expand sales channels. Create an intelligent supply chain to achieve real - time monitoring and precise allocation of information throughout the entire process, from tea planting, picking, and processing to sales. Employ digital marketing strategies such as social media and search engine marketing to enhance brand awareness and influence. Actively implement sustainable business models by using degradable environmentally - friendly packaging materials, establishing organic tea procurement standards and traceability systems, and carrying out circular - economy practices such as reusing tea waste, thus meeting consumers' demands for sustainable development.
5.2.3. Foster an Innovation - Driven Culture and Deepen Cooperation
Create a culture that encourages innovation within enterprises. Set up an innovation incentive fund to reward teams or individuals whose innovative ideas are successfully implemented. Regularly hold creative sharing sessions and brainstorming activities to stimulate employees' innovative thinking. The government should introduce tax incentives and financial subsidies to encourage enterprises to innovate business models and transform sustainability. Industry associations should build communication platforms and organize seminars, experience - sharing meetings, and other activities. Strengthen industry-university-research cooperation. Jointly build tea - research laboratories to conduct projects such as new variety cultivation and deep - processing technology research of tea. Establish a joint talent - cultivation mechanism to supply compound - talent who not only understand tea - specific knowledge but also possess innovative capabilities, thus promoting knowledge exchange and research and development innovation.
5.3. Further Study
Because tea enterprises are easily affected by environmental and policy factors, future studies may take market and policy factors as moderating variables to deeply explore the mechanism of dynamic capability and business model innovation on the competitiveness of enterprises, such as studying the difference in the impact of business model innovation on the competitiveness of Sichuan tea enterprises under different policy environments.
Author Contributions
Conceptualization, K.J. and C.W.; methodology, K.J., C.W., B.S.; software, K.J.; validation, C.W., B.S., and K.L.; formal analysis, C.W., B.S.; investigation, Z.L.; resources, K.J., Z.L.; data curation, K.J.; writing—original draft preparation, K.J.; writing—review and editing, C.W., B.S., and K.L.; supervision, K.J.; project administration, C.W., B.S., and K.L.; funding acquisition, Z.L. All authors have read and agreed to the published version of the manuscript.
Funding
This research received no external funding.
Institutional Review Board Statement
Ethical review and approval were waived for this study since it did not involve human biological experiments or patient data.
Informed Consent Statement
Informed consent was obtained from all subjects involved in the study.
Data Availability Statement
Data will be made available upon request.
Conflicts of Interest
The authors declare no conflicts of interest.
Appendix A
Appendix A.1
Table A1.
Distribution test results of extensive sample data.
| N | Minimum | Maximum | Mean | Std. Deviation | Skewness | Kurtosis | |||
|---|---|---|---|---|---|---|---|---|---|
| Statistic | Statistic | Statistic | Statistic | Statistic | Statistic | Std. Error | Statistic | Std. Error | |
| SC1 | 451 | 1 | 5 | 3.4 | 1.145 | -0.214 | 0.115 | -0.902 | 0.229 |
| SC2 | 451 | 1 | 5 | 3.41 | 1.155 | -0.177 | 0.115 | -1.013 | 0.229 |
| SC3 | 451 | 1 | 5 | 3.43 | 1.19 | -0.246 | 0.115 | -1.07 | 0.229 |
| SC4 | 451 | 1 | 5 | 3.48 | 1.172 | -0.188 | 0.115 | -1.234 | 0.229 |
| SC5 | 451 | 1 | 5 | 3.44 | 1.188 | -0.248 | 0.115 | -1.054 | 0.229 |
| LC1 | 451 | 1 | 5 | 3.43 | 1.17 | -0.15 | 0.115 | -1.098 | 0.229 |
| LC2 | 451 | 1 | 5 | 3.38 | 1.169 | -0.179 | 0.115 | -1.006 | 0.229 |
| LC3 | 451 | 1 | 5 | 3.44 | 1.198 | -0.252 | 0.115 | -1.037 | 0.229 |
| LC4 | 451 | 1 | 5 | 3.4 | 1.176 | -0.241 | 0.115 | -1.031 | 0.229 |
| LC5 | 451 | 1 | 5 | 3.41 | 1.212 | -0.193 | 0.115 | -1.12 | 0.229 |
| IC1 | 451 | 1 | 5 | 3.41 | 1.165 | -0.195 | 0.115 | -0.995 | 0.229 |
| IC2 | 451 | 1 | 5 | 3.49 | 1.122 | -0.277 | 0.115 | -0.904 | 0.229 |
| IC3 | 451 | 1 | 5 | 3.43 | 1.199 | -0.244 | 0.115 | -1.053 | 0.229 |
| IC4 | 451 | 1 | 5 | 3.51 | 1.159 | -0.328 | 0.115 | -0.934 | 0.229 |
| IC5 | 451 | 1 | 5 | 3.47 | 1.167 | -0.248 | 0.115 | -1.028 | 0.229 |
| VPR1 | 451 | 1 | 5 | 3.42 | 1.158 | -0.186 | 0.115 | -1.042 | 0.229 |
| VPR2 | 451 | 1 | 5 | 3.44 | 1.15 | -0.185 | 0.115 | -1.111 | 0.229 |
| VPR3 | 451 | 1 | 5 | 3.4 | 1.181 | -0.237 | 0.115 | -1.028 | 0.229 |
| VPR4 | 451 | 1 | 5 | 3.49 | 1.18 | -0.282 | 0.115 | -1.06 | 0.229 |
| VCR1 | 451 | 1 | 5 | 3.43 | 1.241 | -0.227 | 0.115 | -1.177 | 0.229 |
| VCR2 | 451 | 1 | 5 | 3.45 | 1.185 | -0.203 | 0.115 | -1.081 | 0.229 |
| VCR3 | 451 | 1 | 5 | 3.47 | 1.208 | -0.257 | 0.115 | -1.046 | 0.229 |
| VCR4 | 451 | 1 | 5 | 3.47 | 1.18 | -0.19 | 0.115 | -1.097 | 0.229 |
| VCR5 | 451 | 1 | 5 | 3.41 | 1.216 | -0.205 | 0.115 | -1.155 | 0.229 |
| VCA1 | 451 | 1 | 5 | 3.51 | 1.204 | -0.358 | 0.115 | -0.999 | 0.229 |
| VCA2 | 451 | 1 | 5 | 3.46 | 1.178 | -0.246 | 0.115 | -1.052 | 0.229 |
| VCA3 | 451 | 1 | 5 | 3.48 | 1.193 | -0.255 | 0.115 | -1.086 | 0.229 |
| MC1 | 451 | 1 | 5 | 3.29 | 1.264 | -0.076 | 0.115 | -1.198 | 0.229 |
| MC2 | 451 | 1 | 5 | 3.42 | 1.217 | -0.225 | 0.115 | -1.078 | 0.229 |
| MC3 | 451 | 1 | 5 | 3.37 | 1.239 | -0.178 | 0.115 | -1.12 | 0.229 |
| MC4 | 451 | 1 | 5 | 3.34 | 1.191 | -0.097 | 0.115 | -1.089 | 0.229 |
| PC1 | 451 | 1 | 5 | 3.32 | 1.178 | -0.134 | 0.115 | -1.079 | 0.229 |
| PC2 | 451 | 1 | 5 | 3.42 | 1.153 | -0.232 | 0.115 | -0.936 | 0.229 |
| PC3 | 451 | 1 | 5 | 3.36 | 1.167 | -0.098 | 0.115 | -1.075 | 0.229 |
| PC4 | 451 | 1 | 5 | 3.44 | 1.146 | -0.238 | 0.115 | -0.982 | 0.229 |
| PC1 | 451 | 1 | 5 | 3.46 | 1.159 | -0.267 | 0.115 | -0.981 | 0.229 |
| GC2 | 451 | 1 | 5 | 3.49 | 1.167 | -0.332 | 0.115 | -0.949 | 0.229 |
| GC3 | 451 | 1 | 5 | 3.48 | 1.165 | -0.301 | 0.115 | -1.046 | 0.229 |
| GC4 | 451 | 1 | 5 | 3.48 | 1.144 | -0.261 | 0.115 | -0.964 | 0.229 |
| GC5 | 451 | 1 | 5 | 3.43 | 1.122 | -0.272 | 0.115 | -0.901 | 0.229 |
| Valid N (listwise) | 451 | ||||||||
References
- Porter, M.E.; Kramer, M.R. In THE BIG IDEA Creating Shared Value How to reinvent capitalism — and unleash a wave of innovation and growth, 2010; 2010.
- Teece, D.J. , Business models and dynamic capabilities. Long range planning 2018, 51, 40–49. [Google Scholar] [CrossRef]
- Helfat, C.E.; Peteraf, M.A. , Understanding dynamic capabilities: progress along a developmental path. Strategic Organization 2009, 7, 102–91. [Google Scholar] [CrossRef]
- Bocken, N.M.P.; Short, S.W.; Rana, P.; Evans, S. , A literature and practice review to develop sustainable business model archetypes. Journal of Cleaner Production 2014, 65, 42–56. [Google Scholar] [CrossRef]
- Lüdeke-Freund, F.; Carroux, S.; Joyce, A.; Massa, L.; Breuer, H. , The sustainable business model pattern taxonomy—45 patterns to support sustainability-oriented business model innovation. Sustainable Production and Consumption 2018. [Google Scholar] [CrossRef]
- Chesbrough, H.W. , Business Model Innovation: Opportunities and Barriers. Long Range Planning 2010, 43, 354–363. [Google Scholar] [CrossRef]
- Evans, S.; Vladimirova, D.; Holgado, M.; Fossen, K. v.; Yang, M.; Silva, E.A.; Barlow, C.Y. , Business Model Innovation for Sustainability: Towards a Unified Perspective for Creation of Sustainable Business Models. Business Strategy and The Environment 2017, 26, 597–608. [Google Scholar] [CrossRef]
- Nayal, K.; Raut, R.D.; Queiroz, M.M. d.; Priyadarshinee, P. , Digital Supply Chain Capabilities: Mitigating Disruptions and Leveraging Competitive Advantage Under COVID-19. IEEE Transactions on Engineering Management 2024, 71, 10441–10454. [Google Scholar] [CrossRef]
- Rahman, M.S.; Hossain, M.A.; Chowdhury, A.H.; Hoque, M.T. , Role of enterprise information system management in enhancing firms competitive performance towards achieving SDGs during and after COVID-19 pandemic. J. Enterp. Inf. Manag. 2021, 35, 214–236. [Google Scholar] [CrossRef]
- Pablos, P.O. d. , Transnational Corporations and Strategic Challenges: An Analysis of Knowledge Flows and Competitive Advantage. The Learning Organization 2006, 13, 544–559. [Google Scholar] [CrossRef]
- Iansiti, M.; Clark, K.B. , Integration and Dynamic Capability: Evidence from Product Development in Automobiles and Mainframe Computers. Industrial and Corporate Change 1994, 3, 557–605. [Google Scholar] [CrossRef]
- Teece, D.J.; Pisano, G.P.; Shuen, A. , DYNAMIC CAPABILITIES AND STRATEGIC MANAGEMENT. Strategic Management Journal 1997, 18, 509–533. [Google Scholar] [CrossRef]
- Griffith, D.A.; Harvey, M.G. , A Resource Perspective of Global Dynamic Capabilities. Journal of International Business Studies 2001, 32, 597–606. [Google Scholar] [CrossRef]
- Galvin, P.; Rice, J.P.; Liao, T.-S. , Applying a Darwinian model to the dynamic capabilities view: Insights and issues1. Journal of Management & Organization 2014, 20, 250–263. [Google Scholar]
- Ambrosini, V.; Bowman, C. , What are Dynamic Capabilities and are They a Useful Construct in Strategic Management? Wiley-Blackwell: International Journal of Management Reviews 2009. [Google Scholar] [CrossRef]
- Helfat, C.E.; Peteraf, M.A. , The dynamic resource-based view: capability lifecycles. Strategic Management Journal 2003, 24, 997–1010. [Google Scholar] [CrossRef]
- Li, D.; Liu, J. , Dynamic capabilities, environmental dynamism, and competitive advantage: Evidence from China. Journal of Business Research 2014, 67, 2793–2799. [Google Scholar] [CrossRef]
- Helfat, C.E.; Raubitschek, R.S. , Dynamic and integrative capabilities for profiting from innovation in digital platform-based ecosystems. Research Policy 2018. [Google Scholar] [CrossRef]
- Bitencourt, C.; Müller Neto, H.F.; Zanandrea, G. , A (RE)VIEW OF DYNAMIC CAPABILITIES: ORIGINS AND FUTURE DEVELOPMENTS. Revista de Administração de Empresas 2024. [Google Scholar] [CrossRef]
- González-Samaniego, A. ; A. Valenzo-Jimenez, M.; Apolinar Martinez-Arroyo, J.; Antelmo Casanova Valencia, S., Assessing the degree of development of dynamic capabilities theory: A systematic literature review. Problems and Perspectives in Management 2023. [Google Scholar] [CrossRef]
- Hoffmann, S. In Business model transformation influenced by Germany's Energiewende : a comparative case study analysis of business model innovation in start-up and incumbent firms, 2016; 2016.
- Salum, F.; Coleta, K.G.; Rodrigues, D.P.; Lopes, H.E.G. , The Business Models' Value Dimensions: An Analytical Tool. Revista Ibero-Americana de Estratégia 2019. [Google Scholar] [CrossRef]
- Osterwalder, A.; Pigneur, Y. , Business Model Generation: A handbook for visionaries, game changers and challengers. African Journal of Business Management 2010, 5, 1–5. [Google Scholar]
- Nielsen, C.; Osterwalder, A.; Pigneur, Y. , How do you enable business model innovation to thrive in your organisation? Journal of Business Models 2024. [Google Scholar] [CrossRef]
- Iheanachor, N.; David-West, Y.; Umukoro, I.O. , Business model innovation at the bottom of the pyramid – A case of mobile money agents. Journal of Business Research 2021, 127, 96–107. [Google Scholar] [CrossRef] [PubMed]
- York, J.M. In The Role of the Business Model and Business Model Innovation as Essential Components to Commercialization, Entrepreneurship, and Strategic Renewal, 2020; 2020.
- Teece, D.J. , Business Models and Dynamic Capabilities. SSRN Electronic Journal 2017. [Google Scholar]
- Zott, C.; Amit, R. , Business Model Design: An Activity System Perspective. Long Range Planning 2010, 43, 216–226. [Google Scholar] [CrossRef]
- Heider, A.L.; Gerken, M.; Dinther, N. v.; Hülsbeck, M. , Business model innovation through dynamic capabilities in small and medium enterprises – Evidence from the German Mittelstand. Journal of Business Research 2020. [Google Scholar] [CrossRef]
- Mancuso, I.; Messeni Petruzzelli, A.; Panniello, U. , Innovating agri-food business models after the Covid-19 pandemic: The impact of digital technologies on the value creation and value capture mechanisms. Technological Forecasting and Social Change 2023, 190, 122404–122404. [Google Scholar] [CrossRef]
- Varga, J. , Exploring the Link between Competitiveness and Innovation. 2023 IEEE 21st Jubilee International Symposium on Intelligent Systems and Informatics (SISY) 2023, 000229–000234. [Google Scholar]
- Oliveira-Dias, D.; Kneipp, J.M.; Bichueti, R.S.; Gomes, C.M. , Fostering business model innovation for sustainability: a dynamic capabilities perspective. Management Decision 2022. [Google Scholar] [CrossRef]
- Euchner, J.; Ganguly, A. , Business Model Innovation in Practice. Research-Technology Management 2014, 57, 33–39. [Google Scholar]
- Casadesus-Masanell, R.; Zhu, F. , Business Model Innovation and Competitive Imitation: The Case of Sponsor-Based Business Models. Southern Medical Journal 2013, 34, 464–482. [Google Scholar] [CrossRef]
- Demil, B.; Lecocq, X. , Business Model Evolution: In Search of Dynamic Consistency. Long Range Planning 2010, 43, 227–246. [Google Scholar] [CrossRef]
- Teece, D.J. , Business Models, Business Strategy and Innovation. SSRN Electronic Journal 2010. [Google Scholar]
- Hamel, G. , The Challenge Today: Changing the Rules of the Game. Business Strategy Review 1998, 9, 19–26. [Google Scholar] [CrossRef]
- Brito, A.E.P.; Zapata, M.I.B. , Innovation and its Importance for Competitiveness in Mexico. Business, Management and Economics Research 2020. [Google Scholar]
- Wang, Y. , Business Model Innovation and Corporate Competitive Advantages in the Digital Economy Era. Modern Economics & Management Forum 2024. [Google Scholar]
- Bocken, N.M.P.; Geradts, T. , Barriers and drivers to sustainable business model innovation: Organization design and dynamic capabilities. Long Range Planning 2020, 53, 101950. [Google Scholar] [CrossRef]
- Schiavon, P.; Mendonça, T.B.B. d. In Dynamic capabilities and business model innovation in sustainable family farming, 2022; 2022.
- Beske, P.; Land, A.; Seuring, S. , Sustainable supply chain management practices and dynamic capabilities in the food industry: A critical analysis of the literature. International Journal of Production Economics 2014, 152, 131–143. [Google Scholar] [CrossRef]
- Zahra, S.A.; Sapienza, H.J.; Davidsson, P. , Entrepreneurship and Dynamic Capabilities: A Review, Model and Research Agenda. Wiley-Blackwell: Journal of Management Studies 2006. [Google Scholar] [CrossRef]
- Drnevich, P.L.; Kriauciunas, A. , Clarifying the conditions and limits of the contributions of ordinary and dynamic capabilities to relative firm performance. Southern Medical Journal 2011, 32, 254–279. [Google Scholar] [CrossRef]
- Hartnett, J.L.; Schechter, S.H.; Kropp, D.H. In Managing Quality: The Strategic and Competitive Edge, 1988; 1988.
- Eisenhardt, K.M.; Martin, J.A. , DYNAMIC CAPABILITIES, WHAT ARE THEY? Strategic Management Journal 2000, 21, 1105–1121. [Google Scholar] [CrossRef]
- Zhang, W. , Driving Competitive Advantage: A Study of Dynamic Capability and Digital Maturity in the Electronic Manufacturing Industry. International Journal of Science and Business 2024. [Google Scholar] [CrossRef]
- Karman, A.; Savanevičienė, A. , Enhancing dynamic capabilities to improve sustainable competitiveness: insights from research on organisations of the Baltic region. Baltic Journal of Management 2020, 16, 318–341. [Google Scholar] [CrossRef]
- Mariam, S.; Khawaja, K.F.; Khan, H.G.A. , Dynamic Capabilities, Innovation, and Sustainable Competitive Advantage under Environmental Uncertainty in Textile Industry. NUML International Journal of Business & Management 2023. [Google Scholar]
- Salgado, L.A.R.; Londoño, A.A.O. , The Impact of Business Model on Dynamic Capabilities. Revista de Economía del Caribe 2020. [Google Scholar] [CrossRef]
- Riswanto, A. , Competitive Intensity, Innovation Capability and Dynamic Marketing Capabilities. Research Horizon 2021. [Google Scholar] [CrossRef]
- Kareem, M.A.; Kummitha, H.R.; Kolloju, N. , The Mediating Role of Innovation Capabilities on the Relationship between Dynamic Capabilities and Firm Competitive Performance. Organizacija 2024, 57, 56–71. [Google Scholar] [CrossRef]
- Burcharth, A. , The role of dynamic capabilities for business model innovation in organizations from relatively stable markets. BASE - Revista de Administração e Contabilidade da Unisinos 2024. [Google Scholar] [CrossRef]
- Narayanan, V.; Colwell, K.; Douglas, F.L. , Building Organizational and Scientific Platforms in the Pharmaceutical Industry: A Process Perspective on the Development of Dynamic Capabilities. ERN: Other Organizations & Markets: Structures & Processes in Organizations (Topic) 2009. [Google Scholar]
- Teece, D.J. , Explicating Dynamic Capabilities: The Nature and Microfoundations of (Sustainable) Enterprise Performance. SSRN Electronic Journal 2007. [Google Scholar]
- Garrrido, I.; Kretschmer, C.; Vasconcellos, S.L. d.; Gonçalo, C.R. , Dynamic Capabilities: A Measurement Proposal and its Relationship with Performance. Brazilian Business Review 2020. [Google Scholar] [CrossRef]
- Kareem, M.A.; Alameer, A.A.A. , The Impact of Dynamic Capabilities on Organizational Effectiveness. Management & Marketing. Challenges for the Knowledge Society 2019, 14, 402–418. [Google Scholar]
- Kump, B.; Engelmann, A.; Kessler, A.; Schweiger, C. , Toward a dynamic capabilities scale: measuring organizational sensing, seizing, and transforming capacities. Industrial and Corporate Change 2018. [Google Scholar] [CrossRef]
- Gronum, S.; Steen, J.; Verreynne, M.L. , Business model design and innovation: Unlocking the performance benefits of innovation. Australian Journal of Management 2016, 41, 585–605. [Google Scholar] [CrossRef]
- Saukko, L.; Aaltonen, K.; Haapasalo, H. , Defining integration capability dimensions and creating a corresponding self-assessment model for inter-organizational projects. International Journal of Managing Projects in Business 2022. [Google Scholar] [CrossRef]
- Morris, M.H.; Schindehutte, M.; Allen, J. , The entrepreneur's business model: toward a unified perspective. Journal of Business Research 2005, 58, 726–735. [Google Scholar] [CrossRef]
- Johnson, M.W.; Christensen, C.M.; Kagermann, H. , Reinventing Your Business Model. Harvard Business Review 2008, 86. [Google Scholar]
- Chen, J.; Liu, L.; Wang, Y. , Business model innovation and growth of manufacturing SMEs: a social exchange perspective. Journal of Manufacturing Technology Management 2020. [Google Scholar] [CrossRef]
- Guo, H.; Guo, A.; Ma, H. , Inside the black box: How business model innovation contributes to digital start-up performance. Journal of Innovation & Knowledge 2022. [Google Scholar]
- Khaddam, A.A.; Irtaimeh, H.J.; Al-Batayneh, A.R.; Al-Batayneh, S.R. , The effect of business model innovation on organization performance. Management Science Letters 2021. [Google Scholar] [CrossRef]
- Latifi, M.; Nikou, S.; Bouwman, H. , Business model innovation and firm performance: Exploring causal mechanisms in SMEs. Technovation 2021, 107, 102274. [Google Scholar] [CrossRef]
- Nosratabadi, S.; Mosavi, A.; Lakner, Z. , Food Supply Chain and Business Model Innovation. Foods 2020, 9. [Google Scholar] [CrossRef] [PubMed]
- Bashir, M.; Alfalih, A.A.; Pradhan, S. , Sustainable business model innovation: Scale development, validation and proof of performance. Journal of Innovation & Knowledge 2022. [Google Scholar]
- Clauss, T. , Measuring Business Model Innovation: Conceptualization, Scale Development, and Proof of Performance. Organizations & Markets: Policies & Processes eJournal 2017. [Google Scholar]
- Teng, D.-n.; Lu, P.-y. , Value proposition discovery in big data enabled business model innovation. 2016 International Conference on Management Science and Engineering (ICMSE) 2016, 1754–1759. [Google Scholar]
- Nunes, M.P.; Pereira, R.D.V. , BUSINESS MODEL INNOVATION AND BUSINESS PERFORMANCE IN AN INNOVATIVE ENVIRONMENT. International Journal of Innovation Management 2020, 2150036. [Google Scholar] [CrossRef]
- Rudny, W. , BUSINESS MODEL INNOVATION AND VALUE CREATION. sj-economics scientific journal 2016. [Google Scholar] [CrossRef]
- Csapi, V.; Balogh, V.A. , A financial performance-based assessment of SMEs' competitiveness – an analysis of Hungarian and US small businesses. Problems and Perspectives in Management 2020. [Google Scholar] [CrossRef]
- Zhang, W.; Li, S.; Li, Z.; Feng, H. , Assessing the competitiveness of listed Chinese high-growth companies in the STAR market. Heliyon 2023, 9. [Google Scholar] [CrossRef]
- Kambhampati, U.S. , Industry competitiveness: leadership identity and market shares. Applied Economics Letters 2000, 7, 569–573. [Google Scholar] [CrossRef]
- Nekmahmud, M.; Rahman, S. In Measuring the Competitiveness Factors in Telecommunication Markets, 2018; 2018.
- Swink, M.; Narasimhan, R.; Wang, C. , Managing beyond the factory walls: Effects of four types of strategic integration on manufacturing plant performance. Journal of Operations Management 2007, 25, 148–164. [Google Scholar] [CrossRef]
- Guenzi, P.; Troilo, G. , The joint contribution of marketing and sales to the creation of superior customer value. Journal of Business Research 2007, 60, 98–107. [Google Scholar] [CrossRef]
- Neill, S.; McKee, D.O.; Rose, G.M. , Developing the organization's sensemaking capability: Precursor to an adaptive strategic marketing response. Industrial Marketing Management 2007, 36, 731–744. [Google Scholar] [CrossRef]
- Seggie, S.H.; Cavusgil, E.; Phelan, S.E. , Measurement of return on marketing investment: A conceptual framework and the future of marketing metrics. Industrial Marketing Management 2007, 36, 834–841. [Google Scholar] [CrossRef]
- Lunnan, R.; Haugland, S.A. , Predicting and measuring alliance performance: a multidimensional analysis. Southern Medical Journal 2008, 29, 545–556. [Google Scholar] [CrossRef]
- Newbert, S.L. , Value, rareness, competitive advantage, and performance: a conceptual-level empirical investigation of the resource-based view of the firm. Southern Medical Journal 2008, 29, 745–768. [Google Scholar] [CrossRef]
- Richard, O.C.; Murthi, B.P.S.; Ismail, K.M. , The impact of racial diversity on intermediate and long-term performance: The moderating role of environmental context. Southern Medical Journal 2007, 28, 1213–1233. [Google Scholar] [CrossRef]
- Kline, R.B. , Software Review: Software Programs for Structural Equation Modeling: Amos, EQS, and LISREL. Journal of Psychoeducational Assessment 1998, 16, 343–364. [Google Scholar] [CrossRef]
- Hair, J.F. In Multivariate data analysis : a global perspective, 2010; 2010.
- Fornell, C.; Larcker, D.F. , Evaluating structural equation models with unobservable variables and measurement error. Journal of Marketing Research 1981, 18, 39–50. [Google Scholar] [CrossRef]
| 1 | |
| 2 |
Figure 1.
A hypothetical model of the relationship between dynamic capability, business model innovation, and competitiveness of the tea enterprises in Sichuan, China.
Figure 1.
A hypothetical model of the relationship between dynamic capability, business model innovation, and competitiveness of the tea enterprises in Sichuan, China.
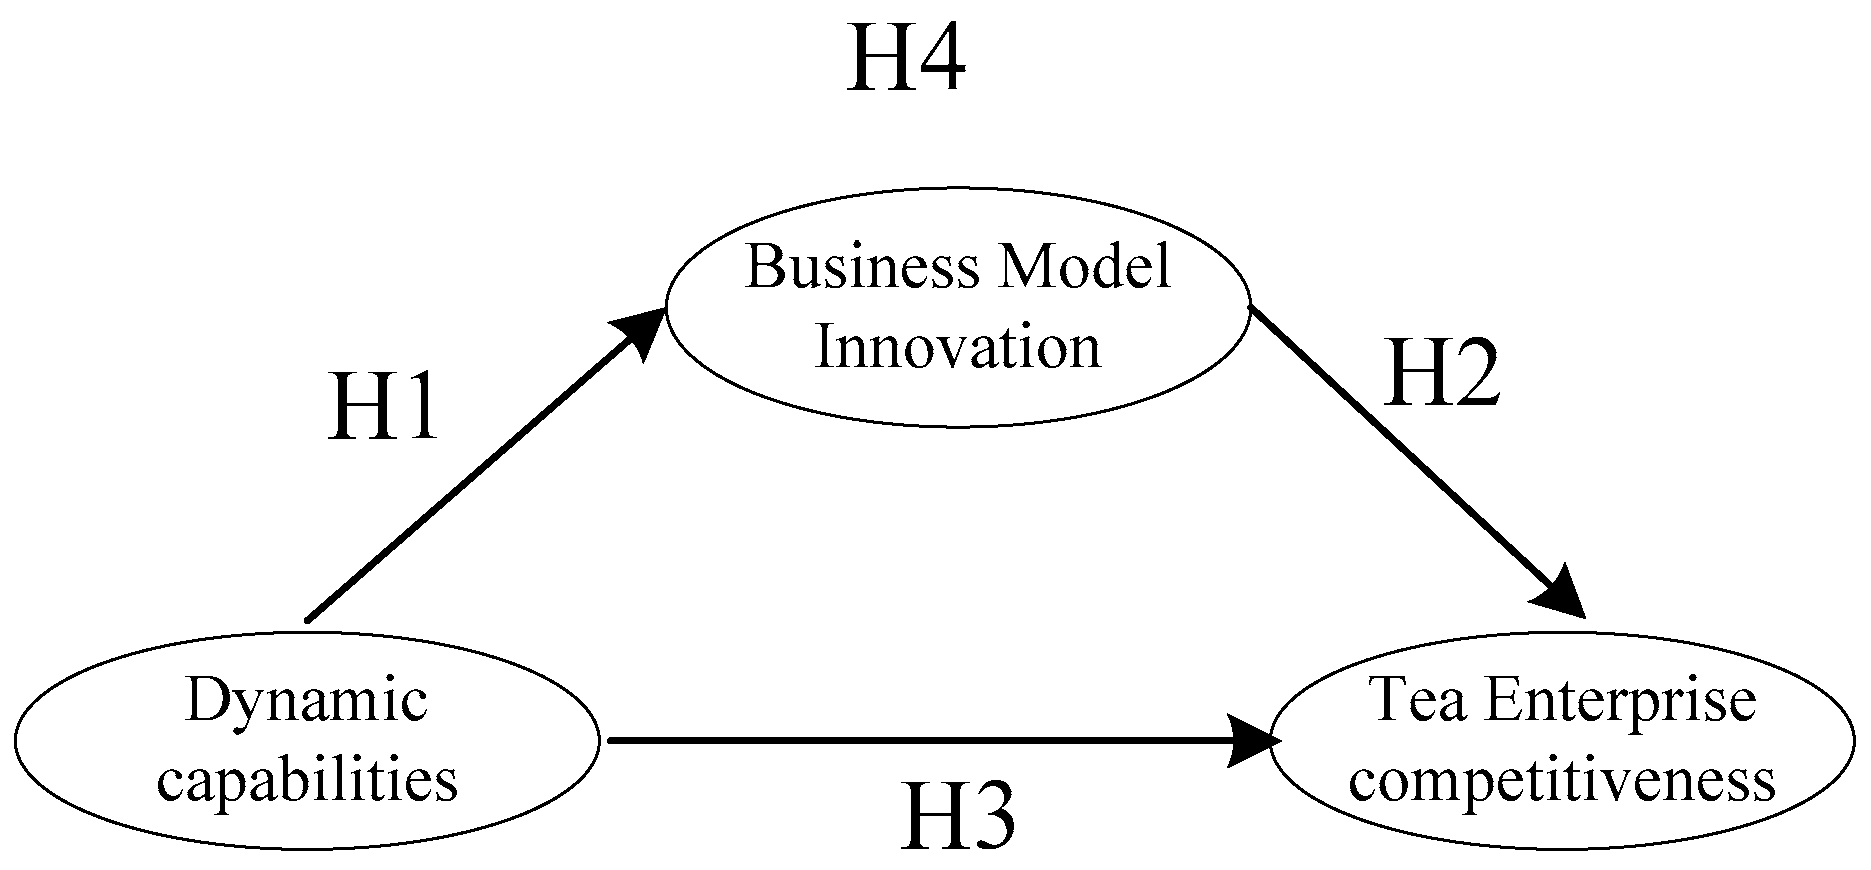
Figure 2.
Structural equation model fitting diagram of the influence of dynamic capability on the competitiveness of Sichuan tea enterprises.
Figure 2.
Structural equation model fitting diagram of the influence of dynamic capability on the competitiveness of Sichuan tea enterprises.
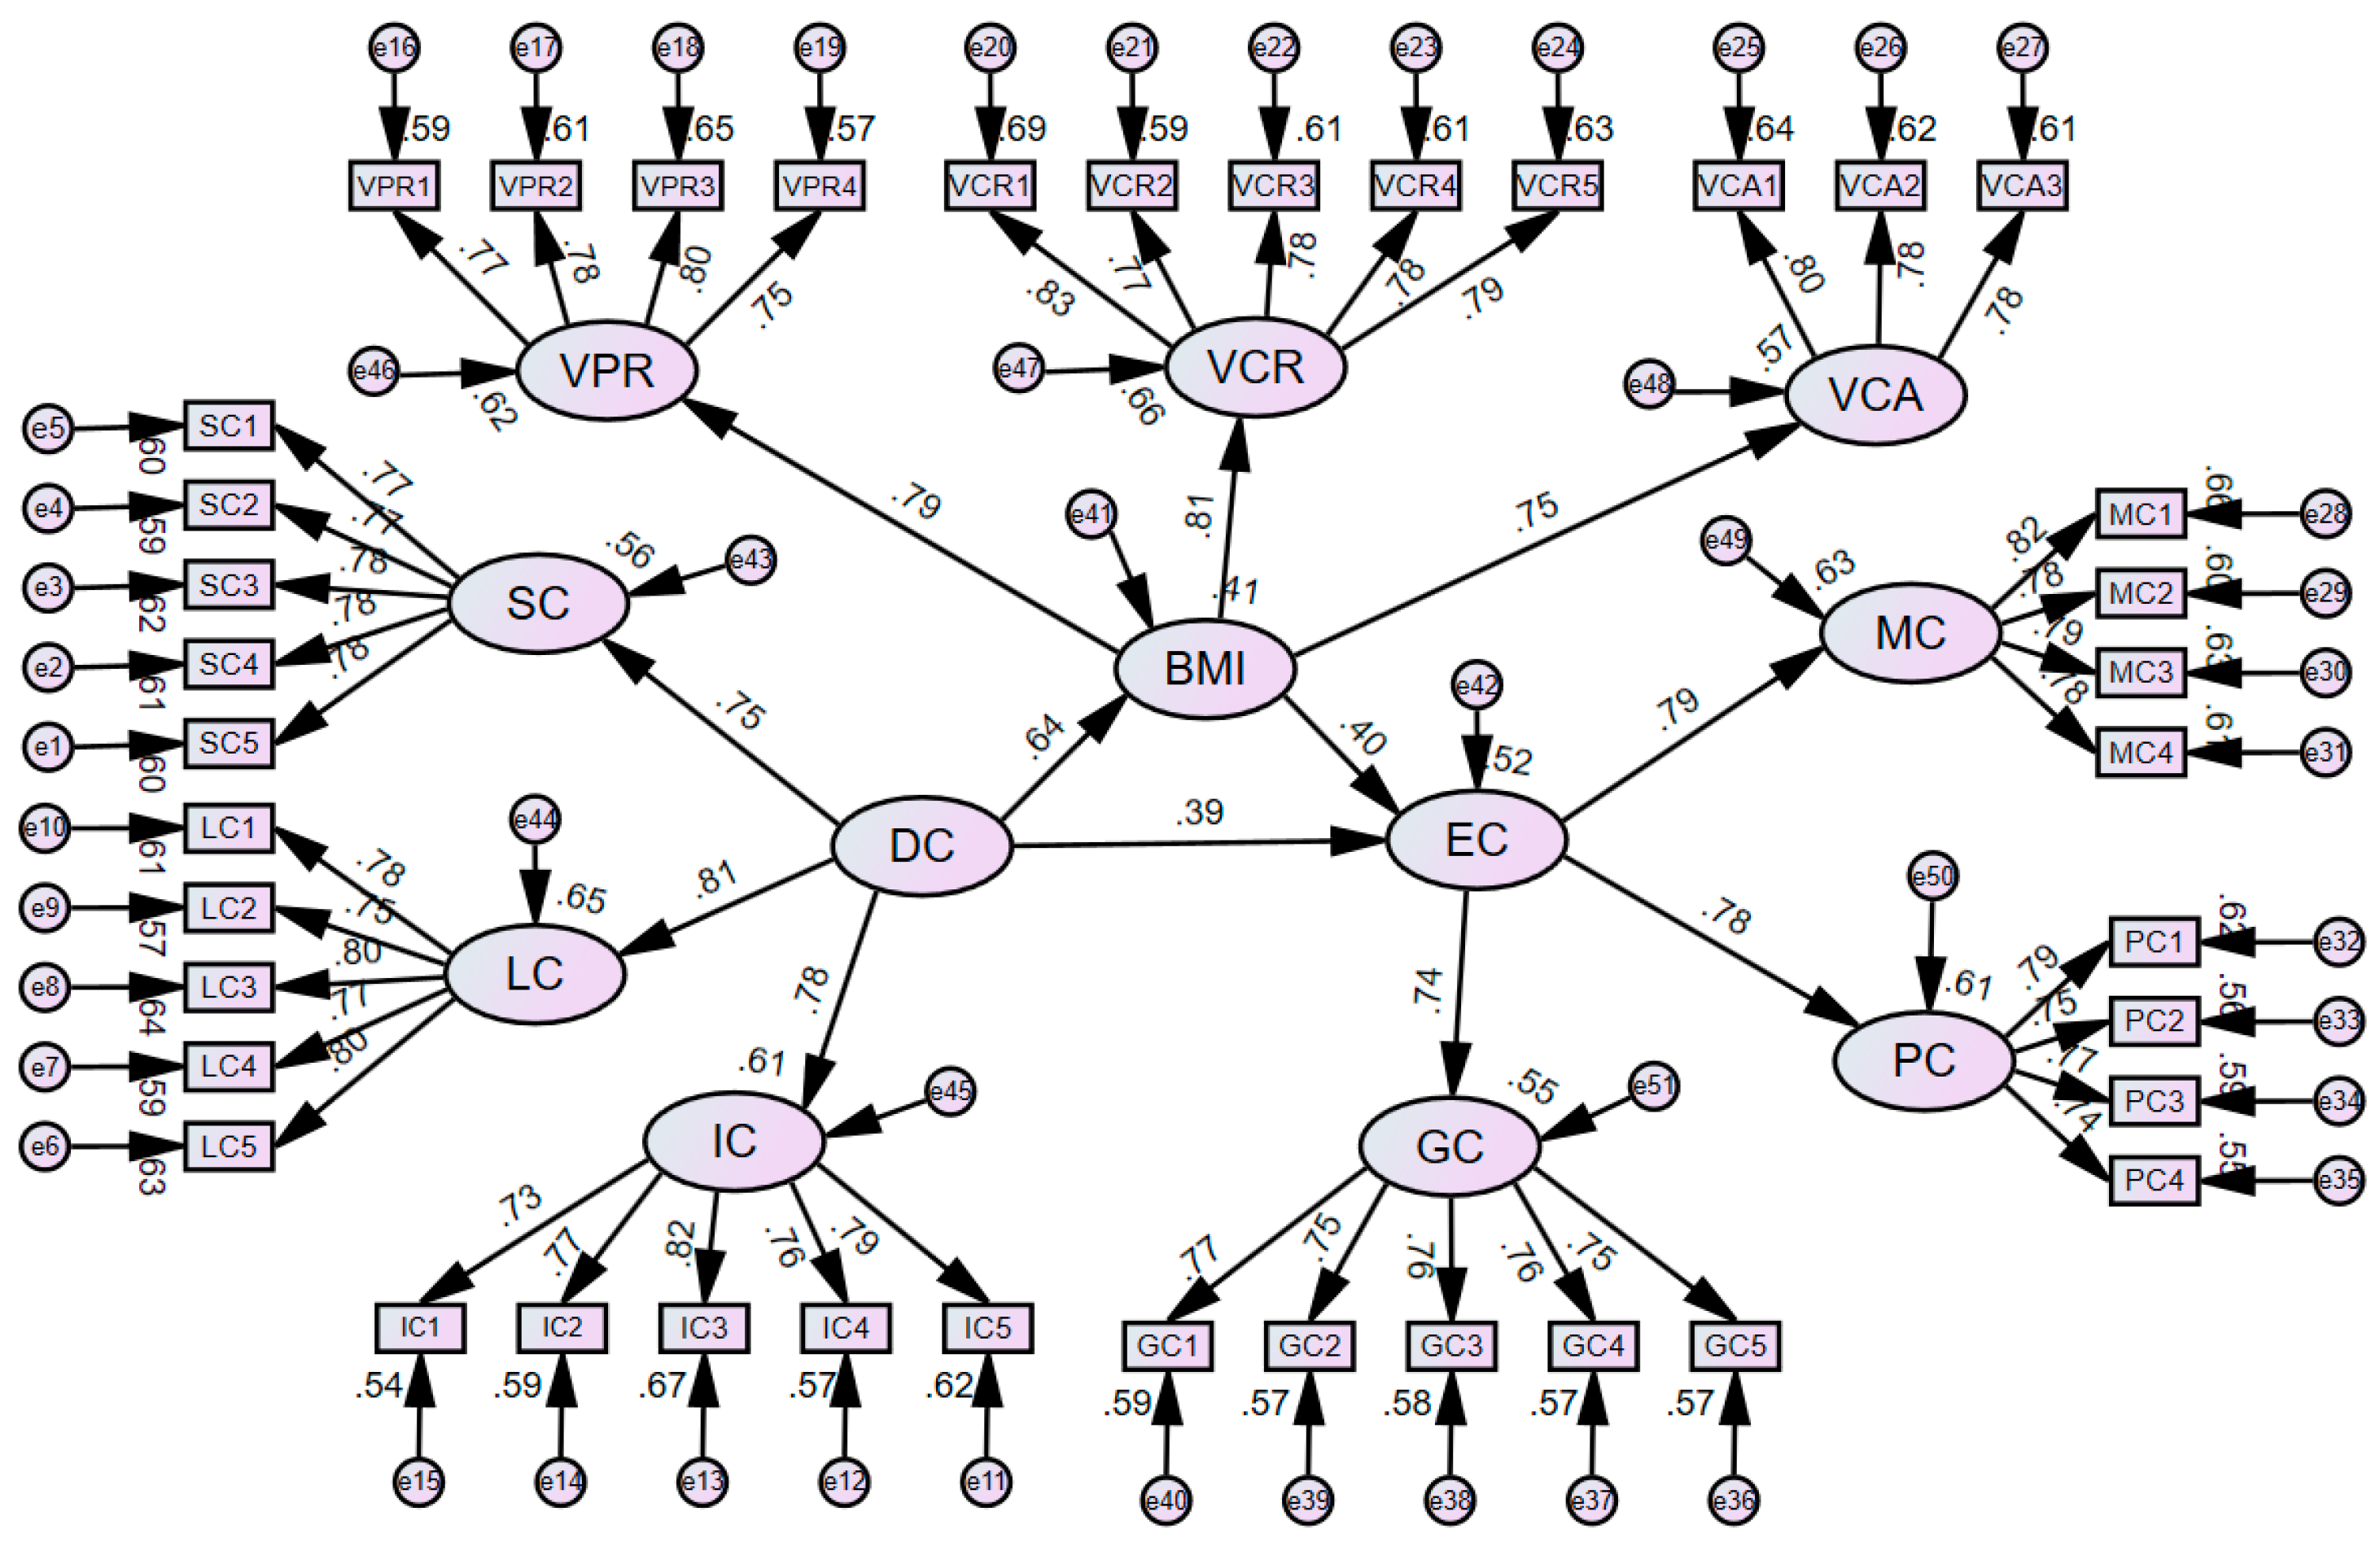
Table 1.
Dynamic Capability measurement scales.
| Dimensions | Code | Item |
|---|---|---|
| Sensing Capability (SC) |
SC1 | Our company can quickly scan the environment for new opportunities. |
| SC2 | Our company can quickly detect changes in customer preferences and needs. | |
| SC3 | Our company is quick to react to competitors' moves. | |
| SC4 | Our company has a more accurate understanding of the industry's current situation and development trends. | |
| SC5 | Our management often discusses and communicates changes in the external environment of the enterprise. | |
| Learning Capability (DC) |
LC1 | Our company can understand and master all kinds of information on time. |
| LC2 | Our company can timely identify the changes caused by new information and knowledge. | |
| LC3 | Our company can integrate new technologies we already know with other technologies. | |
| LC4 | Our management requires periodical cross-departmental meetings to discuss new developments, problems, and achievements. | |
| LC5 | Our management emphasizes cross-departmental support to solve problems. | |
| Integration Capability (IC) |
IC1 | Our company has a high degree of coordination between different departments and teams in the enterprise. |
| IC2 | Our company can adjust its strategies according to environmental changes. | |
| IC3 | Our company can constantly adjust resource allocation according to environmental changes. | |
| IC4 | Our company can quickly integrate and share new information and knowledge within the enterprise. | |
| IC5 | Our company constantly optimizes core resources to highlight competitive advantages. |
Table 2.
Scales for measuring business model innovation.
| Dimensions | Code | Item |
| Value Proposition |
VPR1 | Our company provides customers with high-quality products. |
| VPR2 | Flexibility in providing our service is a key priority. | |
| VPR3 | We assess our customer's perceived value periodically. | |
| VPR4 | A significant part of our value proposition is to support customer value creation. | |
| Value Creation |
VCR1 | The company emphasizes transaction simplicity to reduce mistakes. |
| VCR2 | Our customers are familiar with our transactions. | |
| VCR3 | The company delivers effective and efficient offers. | |
| VCR4 | We possess valuable resources that meet customer needs at reasonable costs. | |
| VCR5 | Our customers are satisfied with the value we provide. | |
| Value Capture |
VCA1 | Product quality is a critical factor in our production process to capture value. |
| VCA2 | Our expanding market share increases our value capture. | |
| VCA3 | The companies can increase their revenue or reduce business costs in new ways. |
Table 5.
Results of parameter estimation for the dynamic capability scale.
| Path Relationship | Estimate | Cronbach's alpha | C.R. | AVE | ||
|---|---|---|---|---|---|---|
| SC1 | <--- | Sensing Capability | 0.774 | 0.884 | 0.883 | 0.603 |
| SC2 | <--- | Sensing Capability | 0.767 | |||
| SC3 | <--- | Sensing Capability | 0.786 | |||
| SC4 | <--- | Sensing Capability | 0.779 | |||
| SC5 | <--- | Sensing Capability | 0.775 | |||
| LC1 | <--- | Learning Capability | 0.782 | 0.886 | 0.886 | 0.608 |
| LC2 | <--- | Learning Capability | 0.756 | |||
| LC3 | <--- | Learning Capability | 0.797 | |||
| LC4 | <--- | Learning Capability | 0.770 | |||
| LC5 | <--- | Learning Capability | 0.793 | |||
| IC1 | <--- | Integration Capability | 0.731 | 0.881 | 0.882 | 0.599 |
| IC2 | <--- | Integration Capability | 0.767 | |||
| IC3 | <--- | Integration Capability | 0.821 | |||
| IC4 | <--- | Integration Capability | 0.756 | |||
| IC5 | <--- | Integration Capability | 0.792 | |||
Table 6.
Results of the DC scale model fitting.
| x2/df | RMSEA | GFI | NFI | RFI | IFI | TLI | CFI | |
|---|---|---|---|---|---|---|---|---|
| 1.879 | 0.044 | 0.948 | 0.958 | 0.949 | 0.980 | 0.975 | 0.980 | |
| Acceptable fit | <8 | <.05 | >.90 | >.90 | >.90 | >.90 | >.90 | >.90 |
Table 7.
Results of second-order parameters of DC scale estimation value.
| Path Relationship | Estimate | ||
|---|---|---|---|
| Sensing Capability | <--- | Dynamic Capability | 0.766 |
| Learning Capability | <--- | Dynamic Capability | 0.802 |
| Integration Capability | <--- | Dynamic Capability | 0.771 |
Table 8.
Results of parameter estimation for the BMI scale.
| Path Relationship | Estimate | Cronbach's alpha | C.R. | AVE | ||
|---|---|---|---|---|---|---|
| VPR1 | <--- | Value Proposition | 0.771 | 0.859 | 0.860 | 0.605 |
| VPR2 | <--- | Value Proposition | 0.783 | |||
| VPR3 | <--- | Value Proposition | 0.808 | |||
| VPR4 | <--- | Value Proposition | 0.748 | |||
| VCR1 | <--- | Value Creation | 0.830 | 0.893 | 0.893 | 0.625 |
| VCR2 | <--- | Value Creation | 0.768 | |||
| VCR3 | <--- | Value Creation | 0.779 | |||
| VCR4 | <--- | Value Creation | 0.782 | |||
| VCR5 | <--- | Value Creation | 0.793 | |||
| VCA1 | <--- | Value Capture | 0.801 | 0.833 | 0.833 | 0.624 |
| VCA2 | <--- | Value Capture | 0.783 | |||
| VCA3 | <--- | Value Capture | 0.786 | |||
Table 9.
The BMI scale model fitting result.
| x2/df | RMSEA | GFI | NFI | RFI | IFI | TLI | CFI | |
|---|---|---|---|---|---|---|---|---|
| 1.692 | 0.039 | 0.967 | 0.971 | 0.962 | 0.988 | 0.984 | 0.988 | |
| Acceptable fit | <8 | <.05 | >.90 | >.90 | >.90 | >.90 | >.90 | >.90 |
Table 10.
Results of second-order parameters of BMI scale estimation value.
| Path Relationship | Estimate | ||
|---|---|---|---|
| Value Proposition | <--- | Business Model Innovation | 0.782 |
| Value Creation | <--- | Business Model Innovation | 0.821 |
| Value Capture | <--- | Business Model Innovation | 0.746 |
Table 11.
Results of parameter estimation for the EC scale.
| Path Relationship | Estimate | Cronbach's alpha | C.R. | AVE | ||
|---|---|---|---|---|---|---|
| MC1 | <--- | Marketing Competitiveness | 0.816 | 0.870 | 0.870 | 0.627 |
| MC2 | <--- | Marketing Competitiveness | 0.776 | |||
| MC3 | <--- | Marketing Competitiveness | 0.793 | |||
| MC4 | <--- | Marketing Competitiveness | 0.781 | |||
| PC1 | <--- | Profit Capability | 0.796 | 0.848 | 0.848 | 0.582 |
| PC2 | <--- | Profit Capability | 0.749 | |||
| PC3 | <--- | Profit Capability | 0.762 | |||
| PC4 | <--- | Profit Capability | 0.744 | |||
| GC1 | <--- | Growth Capacity | 0.767 | 0.871 | 0.871 | 0.574 |
| GC2 | <--- | Growth Capacity | 0.754 | |||
| GC3 | <--- | Growth Capacity | 0.760 | |||
| GC4 | <--- | Growth Capacity | 0.755 | |||
| GC5 | <--- | Growth Capacity | 0.753 | |||
Table 12.
Results of the EC scale model fitting result.
| x2/df | RMSEA | GFI | NFI | RFI | IFI | TLI | CFI | |
|---|---|---|---|---|---|---|---|---|
| 1.782 | 0.042 | 0.961 | 0.963 | 0.954 | 0.984 | 0.979 | 0.984 | |
| Acceptable fit | <8 | <.05 | >.90 | >.90 | >.90 | >.90 | >.90 | >.90 |
Table 13.
Results of second-order parameters of EC scale estimation value.
| Path Relationship | Estimate | ||
|---|---|---|---|
| Marketing Competitiveness | <--- | Enterprise Competitiveness | 0.788 |
| Profit Capability | <--- | Enterprise Competitiveness | 0.765 |
| Growth Capacity | <--- | Enterprise Competitiveness | 0.760 |
Table 14.
Results of Pearson's correlation analysis for each dimension.
| AVE | SC | LC | IC | VPR | VCR | VCA | MC | PC | GC | |
|---|---|---|---|---|---|---|---|---|---|---|
| SC | 0.603 | 0.777 | ||||||||
| LC | 0.608 | .545** | 0.780 | |||||||
| IC | 0.599 | .521** | .549** | 0.774 | ||||||
| VPR | 0.605 | .320** | .343** | .398** | 0.778 | |||||
| VCR | 0.625 | .346** | .318** | .393** | .564** | 0.790 | ||||
| VCA | 0.624 | .278** | .372** | .321** | .495** | .528** | 0.790 | |||
| MC | 0.627 | .322** | .376** | .330** | .372** | .364** | .365** | 0.792 | ||
| PC | 0.582 | .331** | .393** | .348** | .329** | .392** | .314** | .516** | 0.763 | |
| GC | 0.574 | .303** | .344** | .314** | .306** | .322** | .308** | .521** | .498** | 0.758 |
Note: * p<0.05 ** p<0.01 *** p<0.001.
Table 15.
Results of the SEM model fitting (n=451).
| fit index | The standard or critical value | Observed value |
| Absolute fit index | ||
| x2/df (Chi-square) | Between 1 to 3 | 1.257 |
| RMSEA | <0.5 | 0.024 |
| Relative fit index | ||
| GFI (Goodness-of-Fit Index) | >0.9 | 0.907 |
| NFI (Normed Fit Index) | >0.9 | 0.915 |
| RFI (Relative Fit Index) | >0.9 | 0.909 |
| IFI (Incremental Fit Index) | >0.9 | 0.981 |
| TLI (Tucker-Lewis Index) | >0.9 | 0.980 |
| CFI (Comparative Fit Index) | >0.9 | 0.981 |
Table 16.
Structural equation model path results (n=451).
| Path Relationship | Estimate | S.E. | C.R. | P | Standardized Regression Weights | ||
|---|---|---|---|---|---|---|---|
| BMI | <--- | DC | 0.135 | 0.014 | 9.322 | *** | 0.642 |
| EC | <--- | BMI | 0.436 | 0.086 | 5.073 | *** | 0.406 |
| EC | <--- | DC | 0.088 | 0.018 | 4.883 | *** | 0.390 |
Note: * p<0.05 ** p<0.01 *** p<0.001.
Table 17.
Results of the mediating effect on business model innovation.
| Path | Estimate | Lower | Upper | P |
|---|---|---|---|---|
| DC-BMI-EC Mediating effect | 0.158 | 0.114 | 0.209 | 0.00 |
| DC-EC Total Effect | 0.464 | 0.391 | 0.531 | 0.00 |
| Ratio | 0.34 | 0.24 | 0.465 | 0.00 |
Disclaimer/Publisher’s Note: The statements, opinions and data contained in all publications are solely those of the individual author(s) and contributor(s) and not of MDPI and/or the editor(s). MDPI and/or the editor(s) disclaim responsibility for any injury to people or property resulting from any ideas, methods, instructions or products referred to in the content. |
© 2025 by the authors. Licensee MDPI, Basel, Switzerland. This article is an open access article distributed under the terms and conditions of the Creative Commons Attribution (CC BY) license (http://creativecommons.org/licenses/by/4.0/).
Copyright: This open access article is published under a Creative Commons CC BY 4.0 license, which permit the free download, distribution, and reuse, provided that the author and preprint are cited in any reuse.


