
Submitted:
03 April 2025
Posted:
04 April 2025
You are already at the latest version
Abstract
To reduce pollutants generated by automotive painting processes and improve coating efficiency, this study proposes a clean production method for automotive body painting based on an improved whale optimization algorithm from the perspective of "low-carbon consumption and emission-reduced production." A multi-level, multi-objective decision-making model is developed by integrating three dimensions of clean production: material flow (optimizing material costs), energy flow (minimizing painting energy consumption), and environmental emission flow (reducing carbon emissions and processing time). The whale optimization algorithm is enhanced through three key modifications: the incorporation of nonlinear convergence factors, elite opposition-based learning, and dynamic parameter self-adaptation, which are then applied to optimize the automotive painting model. Experimental validation using the painting processes of TJ Corporation's New Energy Vehicles (NEVs) demonstrates the superiority of the proposed algorithm over MHWOA, WOA-RBF, and WOA-VMD. Results show that the method achieves a 42.1% increase in coating production efficiency, over 98% exhaust gas purification rate, 18.2% average energy-saving improvement, and 17.9% reduction in manufacturing costs. This green transformation of low-carbon emission-reduction infrastructure in painting processes delivers significant economic and social benefits, positioning it as a sustainable solution for the automotive industry.
Keywords:
automobile spraying
; cleaner production
; Whale Optimization Algorithm
; multi-objective optimization
1. Introduction
The environmental problem is becoming more and more serious and has become a global problem with the rapid development of the global economy. Cleaner production can improve the efficiency of resource utilization, reduce and avoid the generation of pollutants, protect and improve the environment, protect human health, and promote sustainable economic and social development [1]. The United Nations Environment Programme (UNEP) defines ‘cleaner production’ as the continuous application of integrated preventive environmental strategies to production processes and products in order to reduce risks to humans and the environment [2]. Therefore, the essence of cleaner production is to emphasize three aspects: clean energy, clean production process and clean products, and to realize the 'greening' of the whole process of production and the whole process of product life cycle. It is a new type of pollution prevention and control strategy proposed by the international community after summarizing the experience and lessons of industrial pollution control. It is of great significance to prevent and control environmental pollution, reduce the burden of end treatment, improve the market competitiveness of enterprises, cope with the new situation of international trade and implement the strategy of sustainable development [3].
It is necessary to integrate the concept of cleaner production CP into the production of enterprises for realizing the sustainable development of CP and better adapt to the changing environment of social economy.
Yu et al. [4] integrated the concept of CP into all aspects of the enterprise, including raw materials, waste, process control, process flow, product quality, staff quality, administrative management, etc., and established a cleaner production management model. Lv Lishu et al. [5] proposed a multi-level and multi-objective optimization model of grinding process scheme for cleaner production for energy saving and emission reduction of grinding process. The experiment confirmed the effectiveness and put forward the corresponding energy saving and emission reduction strategy. Ma et al. [6] proposed a data-driven cleaner production strategy for energy-intensive manufacturing based on product life cycle management, and explained it through the life cycle of cleaner production data. Wang et al. [7] revealed the characteristics of changes in consumption structure forced by the transfer of low-carbon costs in enterprises, embedded the concept of low-carbon consumption in the utility function of consumers, established a production decision-making model of enterprises, and discussed the mechanism of the impact of the transfer of emission reduction costs on consumer demand changes. Sharma [8] studied the use of the best and worst method (BWM), Grey Decision Making Trial and Evaluation Laboratory(Grey DEMATEL)and grid framework to explore the transformation strategy and sub-strategy of the integration of cleaner production and environment, focusing on green, flexible and inclusive development. The results show that strategies such as ' using artificial intelligence and the Internet of Things for optimization (STG B)' and ' combining block chain technology (STG D)(Incorporating Block chain technology)' are crucial. The study also classifies these strategies and their sub-strategies into causal groups, of which ' using artificial intelligence and the Internet of Things for optimization (STG B)(Leveraging AI & IoT for optimization)' has the greatest impact. The adoption of advanced digital twins technology (STG C)(employing advanced digital twins technology)has the least impact. However, the implementation of cleaner production still faces many obstacles. Although the relevant policies of cleaner production have played a guiding and constraining role, they can help enterprises to achieve comprehensive utilization of resources and reduce pollutant emissions to a certain extent. However, cleaner production activities are a dynamic process. Technology is constantly improving. The latest market demand and resource management require enterprises to continuously improve their own management models. The existing industrial enterprise management system still rarely considers the sustainability of cleaner production and the lack of comprehensive consideration of resources, energy, economy and environment [9].
With the increasingly serious energy and environmental problems, China has put forward the development concept of " innovation, coordination, green, open and sharing. " New energy vehicles and intelligent manufacturing in emerging industries have become the key strategies [10]. With the rapid development of the global automobile industry, the energy consumption, material consumption and pollutant production of the whole automobile industry chain are also increasing sharply, especially in the coating process [11]. The coating production line is the production line with the largest investment and the highest process requirements in automobile production. It is also the process production line with the highest energy consumption and three waste emissions. Hydropower consumption accounts for more than 60 % [12] of the entire automobile production, and the impact of a large number of pollutants on the environment is also increasingly serious. The wastewater discharged from the production process of coating pretreatment only contains a large amount of pollutants such as acid, alkali, oil, heavy metals, nitrates and phosphates. A large amount of electrophoresis wastewater from the electrophoresis primer process, due to its poor biodegradability, is currently widely used. The chemical coagulation treatment method is difficult to meet the relevant pollutant discharge standards, and it will inevitably have serious adverse effects on the surrounding environment [13]. In the process of coating transportation, modulation and coating, these organic solvents escape into the air and then produce a large amount of volatile organic compounds (VOCs), which not only pollutes the atmospheric environment, but also directly causes great harm to human health [14]. Restricted by today's environmental protection requirements, automobile coating production-related enterprises may be in trouble due to environmental pollution problems caused by the coating production process, which in turn limits the development of enterprises. In order to adapt to the development of the times, enterprises have carried out a lot of research on cleaner production to improve efficiency and enterprise management level [15]. At present, there are different requirements for cleaner production audit of automobile spraying production in different regions, and there are no uniform standards and requirements. The pass rate of cleaner production audit is less than 40 % [12]. Changing the concept, changing the traditional way of thinking, implementing cleaner production, accelerating technological innovation, reducing energy consumption, material consumption and pollutants from the source, strengthening the control of the whole process of product production and the whole life cycle, and coordinating the development of economy and environment are the needs of sustainable development of enterprises. It is also the embodiment of corporate social responsibility and the inevitable trend of developing low-carbon economy.
Based on this, the team studied the clean production management of automobile body spraying. On the basis of the combination of the value flow chart analysis technology of lean production theory and the ECRS optimization principle of process reengineering, the artificial intelligence algorithm is further integrated to optimize the spraying process. The main innovations are as follows:
(1) An improved Whale Optimization Algorithm (NEDWOA) is proposed, incorporating a nonlinear convergence factor, elite opposition-based learning, and adaptive dynamic parameters. The NEDWOA demonstrates significant improvements in global search capability, convergence speed, and robustness.
(2) The clean production problem in automotive body painting is defined as a multi-objective optimization issue involving material flow, energy flow, and environmental emissions in the painting process. From the perspective of "low-carbon consumption + emission-reducing production," a multi-level, multi-objective decision-making model for automotive painting is established, considering both process and operational layers, with objectives including material cost, painting energy consumption, carbon emissions, and painting time.
(3) The NEDWOA is applied to optimize the automotive painting model, proposing a production method for automotive body painting based on the NEDWOA. Taking the new energy vehicles of TJ Automotive Manufacturing Plant in China as an example, compared to other algorithms, the proposed algorithm achieves superior optimization results, improving painting production efficiency by 42.1%, achieving a waste gas purification rate of over 98%, enhancing average energy-saving effects by more than 18.2%, and reducing manufacturing costs by 17.9%.
The structure of this paper is as follows. The first section is the introduction, outlining the research background, current status, and significance of clean production, and emphasizing the urgency of clean production management in the automotive painting industry. The second section presents the improved Whale Optimization Algorithm (NEDWOA). The third section details the multi-level, multi-objective optimization method for the painting process based on the NEDWOA. The fourth section conducts experimental validation before and after optimization, followed by result analysis. The fifth section summarizes the research conducted in this paper.
2. Improved Whale Optimization Algorithm
The Whale Optimization Algorithm (WOA) is a swarm intelligence optimization method inspired by the bubble-net hunting behavior of humpback whales, first proposed by Mirjalili and Lewis [16]. This algorithm mimics the "spiral bubble-net feeding strategy" of whales, characterized by structural simplicity, minimal parameter requirements, and ease of implementation. It has been widely applied to function optimization, engineering design, and machine learning. Recent research on WOA has focused on three areas: algorithmic enhancements, multi-objective optimization, and practical industrial applications. To address WOA’s issues of easily falling into local optima and slow convergence speed, researchers have proposed various improvement strategies, such as introducing nonlinear convergence factors [17], adaptive weights [18], and chaotic mapping. Hybrid approaches combining WOA with other optimization algorithms (e.g., Particle Swarm Optimization [PSO], Genetic Algorithm [GA]) have also been developed to enhance global search capability and robustness. For multi-objective optimization, extensions like Pareto front-based Multi-Objective WOA (MOWOA) have been explored.
To further improve WOA’s convergence and robustness, this study introduces three enhancement strategies:
(1) Nonlinear Convergence Factor: Replaces the linear-decreasing convergence factor with a nonlinear version to flexibly balance exploration and exploitation.
(2) Elite Opposition-Based Learning: Generates reverse solutions from high-quality elite individuals to increase population diversity.
(3) Dynamic Parameter Self-Adaptation: Adjusts parameters in real time based on search states to enhance adaptability.
The improved algorithm, named NEDWOA (Nonlinear convergence factor + Elite opposition-based learning + Dynamic parameter adaptation), implements these strategies as follows.
2.1. Nonlinear Convergence Factor
In the original WOA, the convergence factor a decreases linearly, resulting in rigid search step size adjustments that cannot adapt to complex optimization processes. The proposed exponential nonlinear convergence factor is defined as,
where hyperparameter controlling the decay rate γ>1 (typically γ=2). Initial convergence factor αinit is 2.
In the early phase (t<<Tmax), rapid decay of α enables larger step sizes which can accelerate global exploration. In the late phase (t→Tmax), gradual decay of α refines local exploitation, stabilizing convergence toward the optimal solution.
This exponential formulation allows dynamic adaptation to problem complexity and scale, significantly enhancing the algorithm’s flexibility compared to the linear counterpart.
2.2. Elite Opposition-Based Learning
To address the premature convergence caused by decaying population diversity, this study employs elite opposition-based learning to expand search space coverage. For each generation, the top k fitness-ranked elite individuals are selected, and their opposition solutions are generated and selectively retained.
For an elite individual Xelite, its opposition solution is computed as,
where UB and LB represent the variable’s upper and lower bounds, respectively. The superior solutions between Xelite and Xoppo are retained.The opposition solutions are integrated into the population while maintaining a constant total population size by removing the worst-performing individuals. This strategy effectively mitigates local optima stagnation and demonstrates enhanced performance in multimodal optimization problems due to its systematic exploration-exploitation balance.
Xoppo=UB+LB−Xelite
2.3. Dynamic Parameter Self-Adaptation
To resolve the limitations of fixed parameters in the original algorithm, which struggle to adapt to distinct optimization phases, this study introduces a fitness variance-driven dynamic parameter adjustment mechanism. Fitness variance calculation is written as,
where is average fitness of the current population, N is population size.
Dynamic adjustment rules are as follows. When σ2(t) is small, low fitness variance indicates population convergence. Increasing the spiral coefficient b intensifies local exploitation.
When σ2(t) is large, high fitness variance indicates population diversity. Increasing the random search probability p strengthens global exploration.
This strategy enables parameters to self-adapt based on population states, balances exploration and exploitation, and enhances the algorithm’s adaptability to complex optimization problems.
2.4. Implementation Workflow of the NEDWOA
The workflow of the NEDWOA is as shown in the Figure 1.
Specific steps are as follows.
Step 1: Initialize
Generate initial population {Xi} (which can be combined with chaotic mapping to enhance diversity);
Set parameters: αinit=2,γ=2, k=0.1N, bmin=1,bmax=3.
Step 2: Iterative optimization
For each generation t=1 to Tmax,
(1) Calculate the convergence factor: update a(t) according to the nonlinear formula.
(2) Update parameters, adjust b(t) and p(t) based on 2(t).
(3) Surround prey with spiral updates.
If p<0.5:
if ∣A <1: Surround the prey (towards the current optimal individual);
if ∣A ≥1: random search;
If p≥0.5: spiral update position;
(4) Elite reverse learning: Generate the reverse solution of the first k elite individuals to update the population;
(5) Fitness evaluation: Calculate the fitness of the new population and update the global optimal solution X*.
Step 3: Terminate and output
After the termination condition is satisfied, the global optimal solution X* is output.
3. Analysis of ‘Low Carbon Consumption + Emission Reduction Production’ Spraying Model
3.1. Analysis of Automobile Spraying Process Problems
The team conducted a survey of a number of automobile companies. By studying the causal relationship between the body painting production process problems, the specific reasons were analyzed using the fishbone diagram method as shown in Figure 2. By using the fishbone diagram to analyze the existing problems of low coating efficiency, high production cost, substandard environmental protection and inadequate on-site management, the causes of the problems are found: low sense of responsibility and many temporary workers from the personnel aspect; from the aspect of machine, there are some problems such as unreasonable layout of production line, obsolete equipment and low degree of automation. From the aspect of materials, there are many problems in the quality of accessories and poor quality of the body; there are some problems in the method, such as non-standard operation, unbalanced process time, chaotic production site and backward management means. From the environmental aspects, there are problems such as large paint pollution, substandard exhaust gas emissions and substandard wastewater emissions; there are some problems in measurement, such as poor sampling representativeness and large manual measurement error.
Cleaner production is a management means to prevent the whole production process of products. The input of the whole spraying process includes raw materials, auxiliary materials and energy sources such as electricity, natural gas and coal. The output includes energy sources such as electric energy and heat energy, and emissions such as gas, waste and waste liquid. Therefore, the spraying model can be established from three perspectives: material flow consumption M, energy flow consumption E, and environmental emission flow consumption T. Material flow consumption includes the consumption of various materials m in the spraying process, such as water sandpaper, primer, topcoat, putty, oil ash, etc. Energy flow consumption E includes the consumption of all kinds of energy e, and environmental emission flow includes the emission of various pollutants t such as paint sludge, waste gas and waste liquid. The input and output analysis of the spraying process is shown in Figure 3.
3.2. Energy Consumption Model
In the perspective of spraying state and energy flow, the energy consumption of spraying process can be decomposed into two modules, including energy consumption Espray and other energy consumption Eothers (energy consumption Estart in start-up stage, energy consumption Eawait in standby stage, energy consumption Eclose in shutdown stage), as shown in Figure 3.
The energy consumption in the shutdown stage is an instantaneous mutation of energy, which is generally not considered. The total energy consumption of the spraying process can be expressed as:
where Pspray, Pstart and Pawait are the power of painting stage, start-up stage and standby stage, respectively. tspray, tstart and tawait are the time of the painting stage, start-up stage and standby stage, respectively.
3.2.1. Energy Consumption in the Painting Stage
The energy consumption generated in the painting stage is the most important energy consumption in the spraying process. It mainly refers to the energy consumed by the painting equipment to spray the paint onto the car body under a certain air pressure. The energy consumption in the spray painting stage mainly includes the energy consumption generated by the collision power Pe between the paint droplets, the additional load loss power Ploss, and the energy consumption W generated by the collision between the paint and the car body, which can be expressed as:
The power generated by the paint spray is related to the force generated, including the normal force and tangential force generated when the paint is in contact with the body. The paint fluid is considered as an aggregate of a large number of paint droplets. The paint droplets are regarded as discrete elements. Assuming that they maintain a spherical structure when colliding with the body, the flow of the paint droplets can be described based on Newton 's second law [19]:
where, mi represents the mass of paint droplet i; vi and ωi are the linear velocity and angular velocity of paint droplet i, respectively; Fij represents the contact force of paint droplet i from discrete paint droplet j; Ii is the moment of inertia of paint droplet i, and Tij is the torque generated by the tangential component of the contact force between paint droplets.
Considering the adhesion of the contact surface between the paint droplets, this paper uses the JKR contact theory [20,21] to calculate the normal contact force between the paint droplets. Using the energy representation method, the contact surface energy Δ formed by the unit contact area of the two spherical particles is used to simulate the adhesion of two droplet particles with a contact radius of r. Then the collision normal force Fn between the two droplets can be expressed as:
The collision normal force Ft between two droplets can be expressed as:
where , , is the equivalent elastic modulus of droplets as a function of Young's modulus E and Poisson ratio v, ; is the equivalent droplet radius based on the droplet radius R, ; is equivalent mass, ; e is the restitution coefficient of droplet collision, and is the static friction coefficient between droplets. and are the normal relative velocity and tangential relative velocity between two droplets, respectively.
The loss power Pe of paint droplet collision is:
where v is the linear velocity of the paint, and N is the total number of paint particles in the spray arc zone.
The energy consumption of paint droplets impacting on automobile body is related to the density of working fluid, the velocity v0 of droplets impacting on solid surface, the initial diameter D0 of droplets, the surface tension coefficient σ of droplets and the dynamic viscosity μ of droplets. The initial kinetic energy before impact [22] is:
Surface energy before impact can be written as:
After the impact, the droplet reaches the maximum spreading, and the instantaneous kinetic energy KEa = 0. Surface energy after impact is:
where θA is the advancing contact angle.
According to the law of conservation of energy, KEb + SEb = KEa + Sea + W, the work W to overcome the viscous force is:
It is generally believed that the additional load loss power is (0. 1 ~ 0. 2) times that of the normal work loss power. Therefore, the energy consumption generated by the additional load is set as .
3.2.2. Other Energy Consumption
Other energy consumption includes start-up phase and standby phase energy consumption. Energy consumption in the start-up phase Estart is the energy needed to maintain the stable operation of the spraying robot after opening, which is related to the basic start-up power and start-up time of the robot. The basic start-up power is composed of the control system power Pc and the pneumatic system power Pp, and the start-up time is determined by the robot's own characteristics and procedures. The standby phase refers to the energy consumed by all other auxiliary systems after the spraying robot is turned on, including the energy consumption of the cooling device system Ecool, the energy consumption of the air drying device system Edry, the lighting device system Elight, and the temperature control system energy consumption Etem. Other energy consumption based on this spraying process can be summarized as:
where v(k) is the working state of an auxiliary system, and v(k)= 0 or 1 represents the stop and run state respectively. Pk is the stable operation power of an auxiliary system.
3.3. Carbon Emissions Model
The total carbon emission of the spraying process can be expressed as:
where Cm, Ce and Ct are carbon emissions from material flow, energy flow and environmental emission flow, respectively, and fm, fe and ft are carbon emission factors from material flow, energy flow and environmental emission flow, respectively [23].
The carbon emission of the material flow mainly refers to the carbon emission of the material consumed during the operation of the spraying system during its preparation process. Solvents used in paint and coating formulations are the main source of carbon emissions. Carbon emissions can be calculated using the following equation:
where is the mass of paint or coating and is the carbon emission factor of the material.
A large amount of electric energy will be consumed in the process of automobile body spraying. The use of electric energy itself does not produce carbon emissions. Here, the carbon emissions generated during the use of electric energy are calculated, that is:
The emissions that cause environmental impacts during the coating process include emissions to air, water (excessive paint spraying), and soil (paint sludge) [24]. Therefore, the carbon emissions generated by the environmental emission flow include carbon emissions from waste treatment such as paint sludge, carbon emissions from waste liquid treatment, and carbon emissions from waste gas. The calculation formula is as follows:
where mws is the mass of solid waste, ρwl is the density of waste liquid, Vvl is the discharge volume of waste liquid, Mg is the molar mass of waste gas, Vm is the molar volume of waste gas, Vwg is the volume of waste gas, , and are the carbon emission factors of waste, waste liquid and waste gas treatment, respectively.
4. Multi-Layer and Multi-Objective Optimization Model and Method for Spraying Process
4.1. Objective Function
The core of clean production management of automobile body spraying process is to reduce energy consumption and green environmental protection, but also to reduce costs and improve efficiency as much as possible. In view of the problems existing in automobile spraying, the spraying process flow is optimized and the real-time process reengineering is carried out. Therefore, the optimization process of automobile body spraying process scheme is a multi-objective optimization problem.
In this paper, spraying energy consumption, spraying carbon emission and spraying efficiency are taken as optimization objective functions, and the combinatorial optimization problem of reasonable selection of process layer ( spraying method, spraying gun, body and other spraying elements ) and process layer ( spraying process parameters ) is studied. That is, the simultaneous optimization method of energy consumption, carbon emission and spraying time under the generalized general mathematical model. The optimization objective function for low energy consumption, low carbon and high efficiency manufacturing can be expressed as,
The energy consumption of the entire spraying process route should take into account the energy consumption generated by each spraying process i (i = 1, 2, . . ., i0), which can be expressed as,
The carbon emissions generated by the entire spraying process are similar to energy consumption and can be expressed as,
The high efficiency of the spraying process route is reflected in the shortest time of the spraying process. The total spraying time TT includes the body spraying time, the paint adjustment time, the paint replacement time, and the paint replacement time.
The body spraying time tp is determined by the spraying path length L and the robot spraying feed speed vp, which can be written as,
In the painting process, if the two adjacent processes use different paint liquid, the paint liquid needs to be replaced. The paint liquid replacement time tpc in the painting process route can be obtained by the sum of the paint liquid replacement time of each process.
where topc is the single paint replacement time; is the paint number used in the i-th spraying process. If one paint is sprayed in two adjacent processes, = 0, otherwise = 1.
4.2. Constraint Condition
The constraints of the process layer and the process layer are discussed respectively in this part. The spraying process of automobile body can be divided into rationality constraint and optimal constraint according to its mandatory difference at the process layer. The optimal solution of the process route optimization must meet the rationality constraints and the optimal constraints as far as possible.
The reasonable constraints include: ①The normal process flow is unchanged. Firstly, the pretreatment is carried out, and then the spray painting is carried out after electrophoresis drying, gel injection and electrophoresis grinding; ②First, give priority to ensure the quality of work in the main process, first coarse and then fine, advanced coarse sealing glue injection repair glue and then fine sealing glue injection repair glue, grinding also abide by the principle of first coarse and then fine; ③It is ensured that the follow-up process does not destroy the characteristics of the previous process; ④The general constraints should also meet the principle of non-destructive constraints. Optimal constraints usually consider the constraints generated for the optimization objectives, including high efficiency, low cost, high precision, etc., and the principles of improving the processing efficiency and economy of replacing machines, tools and equipment.
The mathematical model of the constraint process is as follows:
where and are the rationality constraint and the optimization constraint respectively, is all the solutions in the spraying element, and there is i0! Due to the existence of constraints, the actual feasible spraying process route is less than i0!.
It is necessary to detect the spraying path of the spraying robot when the spraying robot operates according to the planned spraying path to prevent the collision between the body and the spray gun at the process layer, that is, any point p( xp, yp, zp ) on the spraying path of the robot meets the following conditions:
where xpc, ypc and zpc represent the three-dimensional coordinates of the point cloud contour data set respectively, Dmin is the shortest distance between p and the data set, and Dsafe is the safe distance without collision.
During the spraying process, the air flow rate changes too much, which may cause the air control unit (ACU) to fail to respond, and the film thickness is randomly thicker. Spraying parameters, such as air flow, coating flow, voltage, should avoid significant changes. Constraints are added to the kinematics and dynamics of each joint of the spraying robot manipulator. The kinematic constraints are written as follows,
where 、 、 are the maximum velocity, maximum acceleration and maximum pulse of the sth joint of the manipulator, respectively. 、 、 are the actual velocity, acceleration and pulse at time t of the sth joint of the manipulator, respectively.
In addition, during the spraying process of the robot, excessive torque input will cause the end of the manipulator to shake, resulting in low painting quality and easy damage to the body structure. Therefore, the dynamic constraints of each joint are limited as follows,
where is the torque of the sth joint of the manipulator at time t; is the maximum torque of the joint.
4.3. Optimization Method Based on the NEDWOA
Analytic Hierarchy Process (AHP) and Criteria Importance Though Intercrieria Correlation (CRITIC) are combined to weight, and the weight of fitness function is redistributed. The process transformation process based on the NEDWOA is shown in Figure 4.
4.3.1. Determination of Fitness Function
The paper uses the AHP method to construct the decision matrix for consistency test and determine the subjective weight ωs to ensure the rationality of the optimization goal. The original experimental data were standardized and the CRITIC method was used to determine the objective weight ωo:
where sj is the contrast strength, cj is conflict, m is the number of experimental groups, rij is the correlation coefficient between indicators.
The coefficient of variation ζ is used to calculate the subjective and objective combination weights:
where GAHP is the weight coefficient of each index based on AHP.
The multi-objective optimization problem is transformed into a single-objective optimization problem by using the weight coefficient transformation method, and then the linear weighting calculation is carried out. For the objective function of the high-efficiency and low-consumption low-carbon model, the weights are determined according to the importance of the corresponding sub-objectives, and the fitness functions of the three sub-objective functions are expressed as:
5. Case Study
In order to verify the effectiveness of the clean production of spraying process based on the NEDWOA, this paper takes TJ Company's new energy vehicle body painting production system as an example to study. The painting workshop is responsible for the painting tasks of body, frame, cargo box and plastic parts. The painting process is divided into two parts: the surface treatment technology of metal before painting and the construction technology of painting. The process flow diagram is shown in Figure 5. The main processes include pretreatment, electrophoresis drying, sealing glue injection, glue drying, electrophoresis grinding, spray painting, paint drying and finishing.
5.1. Spraying Process Parameter Setting and Calculation
Among the spraying process parameters, the main parameters of rotary high-voltage electrostatic spraying as an example are spraying distance, spray cup speed, spraying flow, forming air, high-voltage electrostatic, rotary cup profiling speed, etc. The best spraying distance is set to 250 mm. The working speed of the rotating cup is 30000r/min during spraying, and the maximum no-load speed is 60000r/min. The working speed of the rotating cup varies according to the composition of the paint liquid. The rotation speed of the paint and the background paint in the solvent-based paint spraying is 30000r/min to 35000r/min, 32000r/min is selected here, and 35000r/min to 45000r/min can be selected when spraying varnish, 40000r/min is selected here. The thickness of the varnish coating film is 35 to 50 m, the thickness of the middle coating film is 30 to 45 m, and the thickness of the metal paint is 12 to 18 m [25]. The flash drying time of the coating film was controlled at about 5 min. The wind speed of the circulating air filtration system that maintains the cleanliness of the spray room is generally controlled at 0.2 ~ 0.5m/s. The number of coating overlaps was selected 3 times.
Assuming that the total amount of paint is not lost during the spraying process, and all of it is attached to the vehicle body, the spraying flow Q of each spin cup of the spraying robot is,
where Q is the spraying flow rate (ml/min), Sp is the area needed to be sprayed (m2), δ is the dry film thickness (μm), TE is the coating efficiency of the coating, NV is the mass fraction (%) of paint solid under construction viscosity; N is the number of robots in the station ( the number of rotating cups ).
The formed air is ejected from the annular gap at the rear side of the rotary cup to adjust the amplitude of the paint mist. The setting of forming air parameters is proportional to the paint flow rate and the rotating speed of the rotating cup. Generally, the parameter value of forming air is 100-350NL / min.
The strength of the electrostatic field directly affects the electrostatic coating effect, such as coating efficiency, electrostatic effect, and uniformity of the paint film. The suitable range of the average electric field intensity required for electrostatic coating is 3900-4000 V/cm. Electrostatic spraying stipulates that the safe distance between the electrode and the coated object is 250-300 mm. Different voltage settings should be adopted according to the different types of coatings sprayed. Intermediate coating is generally set as 65-75kV. Varnish is set as 65-80 kV. Metallic paint is set as 50-65 kV. Due to the protruding corner of the body, it is easy to form the corner effect of electrostatic concentration. It is usually necessary to reduce the voltage setting, which can be controlled at 45kV-55kV.
The spraying moving speed of the sprayer is related to the factors such as the spraying area completed on this station, the number of overlapping times during spraying, the production beat, the characteristics of the sprayer, and the use efficiency of the robot. The TCP speed v of the spraying robot can be calculated by the following Equation (35).
where Sp is the spraying area of the automobile body (m2), Of is the overlapping coefficient of spraying. When overlapping area is 50 %, Of = 2. When overlapping area is 66%, Of = 3; When overlapping area is 50 %, Of = 4. W is the spray width, t is the spraying time, η is the use efficiency of the spraying robot, generally 90% -95%, K is the correction coefficient, generally 0. 6 - 0. 9.
According to the experimental conditions and the commonly recommended values of each factor, the values of each parameter are set in the experiment as shown in Table 1.
5.2. Spraying Optimization Based on EDOWOA
Based on the AHP method, the subjective weight is determined and the judgment matrix is constructed. In this optimization process, considering the importance of the three (energy consumption, carbon emissions, grinding time), the subjective weight value is (0. 3333, 0. 3333, 0. 3333). The process, robot feed speed, rotary cup speed, paint flow and other parameters were changed to construct the data set. The original data was constructed and normalized, and the objective weight value was calculated by CRITIC method. Among them, the calculated contrast strength was (0. 1306, 0. 0537, 0. 1124), the conflict was (0. 0463, 0. 0621, 0. 0856), so the comprehensive objective weight was (0. 3183, 0. 1752, 0. 5064); therefore, the weight of each optimization objective of the whole spraying is (0. 3258, 0. 2543, 0. 4199).
The software platform used in this experiment is MATLAB R2021a, and the computer processor is Intel (R) Xeon (R) W-2255. The algorithm program is written by software to randomly generate the population. The initial population size is 500, the genetic algebra is 250, the crossover probability is 0.9, and the mutation probability is 0.1. After setting the parameters of NED-WOA, the fitness function is defined according to the objective function. Then new individuals are generated by genetic operators. The optimization results that meet the requirements are output after crossover, selection and mutation. The algorithm convergence diagram of the spraying optimization process route is shown in Figure 6.
A comparative analysis was conducted between the proposed NEDWOA algorithm and existing methods (MHWOA [26], WOA-RBF [27], WOA-VMD [28]) under 250 iterations, with statistical evaluation of energy consumption, carbon emissions, and processing time per painted vehicle body as shown in Table 2. The NEDWOA-optimized clean production framework demonstrated superior performance. This empirical validation confirms NEDWOA's enhanced capability in balancing ecological and operational objectives, establishing it as a state-of-the-art solution for sustainable automotive painting systems.
The body painting workshop of TJ Automobile Manufacturing Co., Ltd. has a working time of six days/week. According to the order process and the basic data of body painting production control, the value flow of the body painting process before and after optimization is shown in Figure 7. It can be seen that good improvement results have been achieved.
According to the value stream map analysis, the value-added ratio before optimization and the value-added ratio after optimization are:
where PT is the value-added operation time of the body painting production process,PT=, is the ith value-added operation time; NPT is the non-value-added operation time of the body painting production process,NPT=, is the i th non-value-added operating time.
In addition, the optimized spraying clean production route has greatly improved the company's production efficiency and product quality, as shown in Table 3.
6. Conclusions
This study establishes a clean production process model for automotive body painting from three perspectives: material flow, energy flow, and environmental emission flow. A multi-level, multi-objective optimization model is developed at both the process and operation layers, targeting painting energy consumption, painting carbon emissions, and painting time. An improved whale optimization algorithm (NEDWOA) based on AHP-CRITIC combined weighting is proposed to solve the optimization problem. Taking the body coating process of TJ company as an example, the experimental results show that the production efficiency of the optimized process route is increased by 42.1%, the exhaust gas purification rate is 98 %, the manufacturing cost is reduced by 17.9 %, and energy consumption is reduced by 18.2 %. These results significantly enhance production profitability and quality, providing management and practical experience for domestic automotive manufacturers in clean production implementation. Additionally, the methodology offers strategic insights for advancing sustainable practices in other industries.
Author Contributions
Conceptualization, Q.Y. and T.Y.; methodology, Q.Y. and H.W.; software, X.L.; validation, Q.Y. and H.W.; formal analysis, X.L.; investigation, L.Z.; resources, Q.Y.; data curation, T.Y.; writing—original draft preparation, Q.Y.; writing—review and editing, X.L.; visualization, L.Z.; supervision, H.W.; project administration, H.W.; funding acquisition, H.W. All authors have read and agreed to the published version of the manuscript.
Funding
This research was funded by the National Natural Science Foundation of China, grant number 52075306.
Institutional Review Board Statement
Not applicable.
Informed Consent Statement
Not applicable.
Data Availability Statement
The data that support the findings of this study are available within the paper.
Conflicts of Interest
The authors declare no conflicts of interest.
References
- Xu, Y.; Peng, J.; Tian, J.; Fu, S.; Hu, C.; Fu, S.; Feng, Y. The impact and mechanism analysis of Clean Development Mechanism on the synergistic effects of pollution mitigation and carbon reduction. Environmental Research 2024, 260, 119659. [Google Scholar] [CrossRef] [PubMed]
- Giannetti, B.F.; Agostinho, F.; Cabello Eras, J.J. Cleaner production for achieving the sustainable development goals. Journal of Cleaner Production 2020, 271, 209–315. [Google Scholar] [CrossRef]
- Ma, S.; Ding, W.; Liu, Y.; Zhang, Y.; Ren, S.; Kong, X.; Leng, J. Industry 4. 0 and cleaner production: A comprehensive review of sustainable and intelligent manufacturing for energy-intensive manufacturing industries. Journal of Cleaner Production 2024, 467, 142879. [Google Scholar] [CrossRef]
- Yu, H.; Zhao, Y.; Yang, N.; Pan, Z.; Yu, H. Construction of cleaner production management system in China: mode innovation of cleaner production. Environ. Sci. Pollut. Res. Int. 2022, 29, 17626–17644. [Google Scholar] [CrossRef] [PubMed]
- Lv, L.; Deng, Z.; Liu, T.; Wan, L. Multrlayer and Multi-objective Optimization Model and Applications of Grinding Process Plan for Cleaner Production. China Mechanical Engineering 2022, 33, 589–599. [Google Scholar] [CrossRef]
- Ma, S.; Zhang, Y.; Lv, J.; Ren, S.; Yang, H.; Chao, W. Data-driven cleaner production strategy for energy-intensive manufacturing industries: Case studies from Southern and Northern China. Advanced Engineering Informatics 2022, 53, 101684. [Google Scholar] [CrossRef]
- Wang, M.; Hu, Y.; Wang, S. The complementary model of green consumption and low-carbon production under the dual-carbon goal. Systems Engineering-Theory & Practice 2024, 5, 1–26. [Google Scholar]
- Sharma, R.; Gupta, H. Harmonizing sustainability in industry 5.0 era: Transformative strategies for cleaner production and sustainable competitive advantage. Journal of Cleaner Production 2024, 445, 141118 https://doi org/10 1016/j jclepro 2024 141118. [Google Scholar] [CrossRef]
- Zhang, Y.; Zhang, F.; Yu, H.; Yang, N.; Zhao, Y.; Yang, J.; Yu, H. Performance evaluation of the practical application of cleaner production management system: A case study of steel enterprise. Journal of Cleaner Production 2022, 379, 134468 https://doi org/10 1016/j jclepro 2022 134468. [Google Scholar] [CrossRef]
- Gary, J.; Zhao, P.; Bao, Z. Dual-Credit Policy of New Energy Automobiles in China: Corporate Innovation Capability. Sustainability 2024, 16, 7504. [Google Scholar] [CrossRef]
- Qin, S.; Xiong, Y. Innovation strategies of Chinese new energy vehicle enterprises under the influence of non-financial policies: Effects, mechanisms and implications. Energy Policy 2022, 164, 112946. [Google Scholar] [CrossRef]
- Julio, L.R.; Tatiana, R.C. A framework for environmental and energy analysis of the automobile painting process. Procedia CIRP. 2014, 15, 171–175. [Google Scholar] [CrossRef]
- Jia, L. VOCs Pollution Status and Emission Reduction Countermeasures Automobile Painting Industry As an Example. Leather Manufacture and Environmental Technology 2023, 4, 112–113, 123. [Google Scholar] [CrossRef]
- Yadav, A.; Sachdeva, A.; Garg, R.K.; Qureshi, K.M.; Mewada, B.G.; Qureshi, M.R.N.M.; Mansour, M. Achieving Net-Zero in the Manufacturing Supply Chain through Carbon Capture and LCA: A Comprehensive Framework with BWM-Fuzzy DEMATEL. Sustainability 2024, 16, 6972. [Google Scholar] [CrossRef]
- Tang, Y.; Wang, R.; Zhan, L.; Xu, Z. Research on pollution characteristics of volatile organic compounds based on the remanufacturing process of automobile gearbox. Journal of Cleaner Production. 2022, 384, 135548 https://doi org/10 1016/j jclepro 2022 135548. [Google Scholar] [CrossRef]
- Mirjalili, S.; Lewis, A. The Whale Optimization Algorithm. Advances in Engineering Software 2016, 95, 51–67. [Google Scholar] [CrossRef]
- Wang, H.; Wu, F.; Zhang, L. Application of variational mode decomposition optimized with improved whale optimization algorithm in bearing failure diagnosis. Alexandria Engineering Journal 2021, 60, 4689–4699. [Google Scholar] [CrossRef]
- Trivedi, L.N.; Pradeep, J.; Narottam, J.; Arvind, K.; Dilip, L. Novel adaptive whale optimization algorithm for global optimization. Indian J. Sci. Technol. 2016, 9, 1–6. [Google Scholar] [CrossRef]
- Lin, B.; Teng, Y. Synergistic disparities of pollution reduction and carbon mitigation in the industrial chain: Evidence from China's industrial sector. Environmental Research 2024, 248, 118226. [Google Scholar] [CrossRef]
- Li, X.; Xu, Z.; Jiang, X.; Wang, T.; Li, Q.; Li, J.; Xia, X.; Chen, X. Numerical Simulations of Paint Droplet Hydrodynamics and Distributions in an Airless Spray Coating Process. SURFACF TECHNOLOGY 2024, 53, 158–166. [Google Scholar] [CrossRef]
- Ciauarellal, M. An Approximate JKR Solution for a General Contact, Including Rough Contacts. Journal of the Mechanics and Physics of Solids 2018, 114, 209–218. [Google Scholar]
- Hervig, J.; KLEINHANS, U.; WIELAND, C.; et al. On the Adhesive JKR Contact and Rolling Models for Reduced Particle Stiffness Discrete Element Simulations. Powder Technology 2017, 319, 472–482. [Google Scholar] [CrossRef]
- Zhong, Y.; Du, H.; Zhang, Y.; Peng, H. Thermocapillary migration of heterogeneous droplets with unidirectional temperature gradient. The Chinese Journal of Process Engineering 2018, 18(4), 697–703. [Google Scholar]
- Narita, H.; Kawamura, H.; Chen, L.Y.; et al. Development of Prediction System of Environmental Burden for Machine Tool Operation (2nd Report,Proposal of Evaluation indicator for EcoEfficiency). Optics Letters 2006, 71(704), 1392–1399. [Google Scholar]
- Han, H.; Hang, D.; Peng, L.; Zhu, W. Spraying trajectory planning and structure design of full profiling automatie electrostatie painting machine. JOURNAL OF MACHINE DESIGN 2014, 31(7), 75–80. [Google Scholar] [CrossRef]
- Li, X.; Wu, H.; Yang, Q.; et al. A multistrategy hybrid adaptive whale optimization algorithm. Journal of Computational Design and Engineering 2022, 9, 1952–1973. [Google Scholar] [CrossRef]
- Wang, Q.; Gu, Y.; Zhu, T.; et al. SOH Estimation of Lithium Batteries Based on ICA and WOA-RBF Algorithm. Energy Engineering 2024, 121(11), 3221–3239. [Google Scholar] [CrossRef]
- Lu, Y.; Yang, G.; Li, X.; et al. Dynamic power allocation for the new energy hybrid hydrogen production system based on WOA-VMD: Improving fluctuation balance and optimizing control strategy. International Journal of Hydrogen Energy 2024, 94, 580–599. [Google Scholar] [CrossRef]
Figure 1.
Workflow of the NEDWOA.
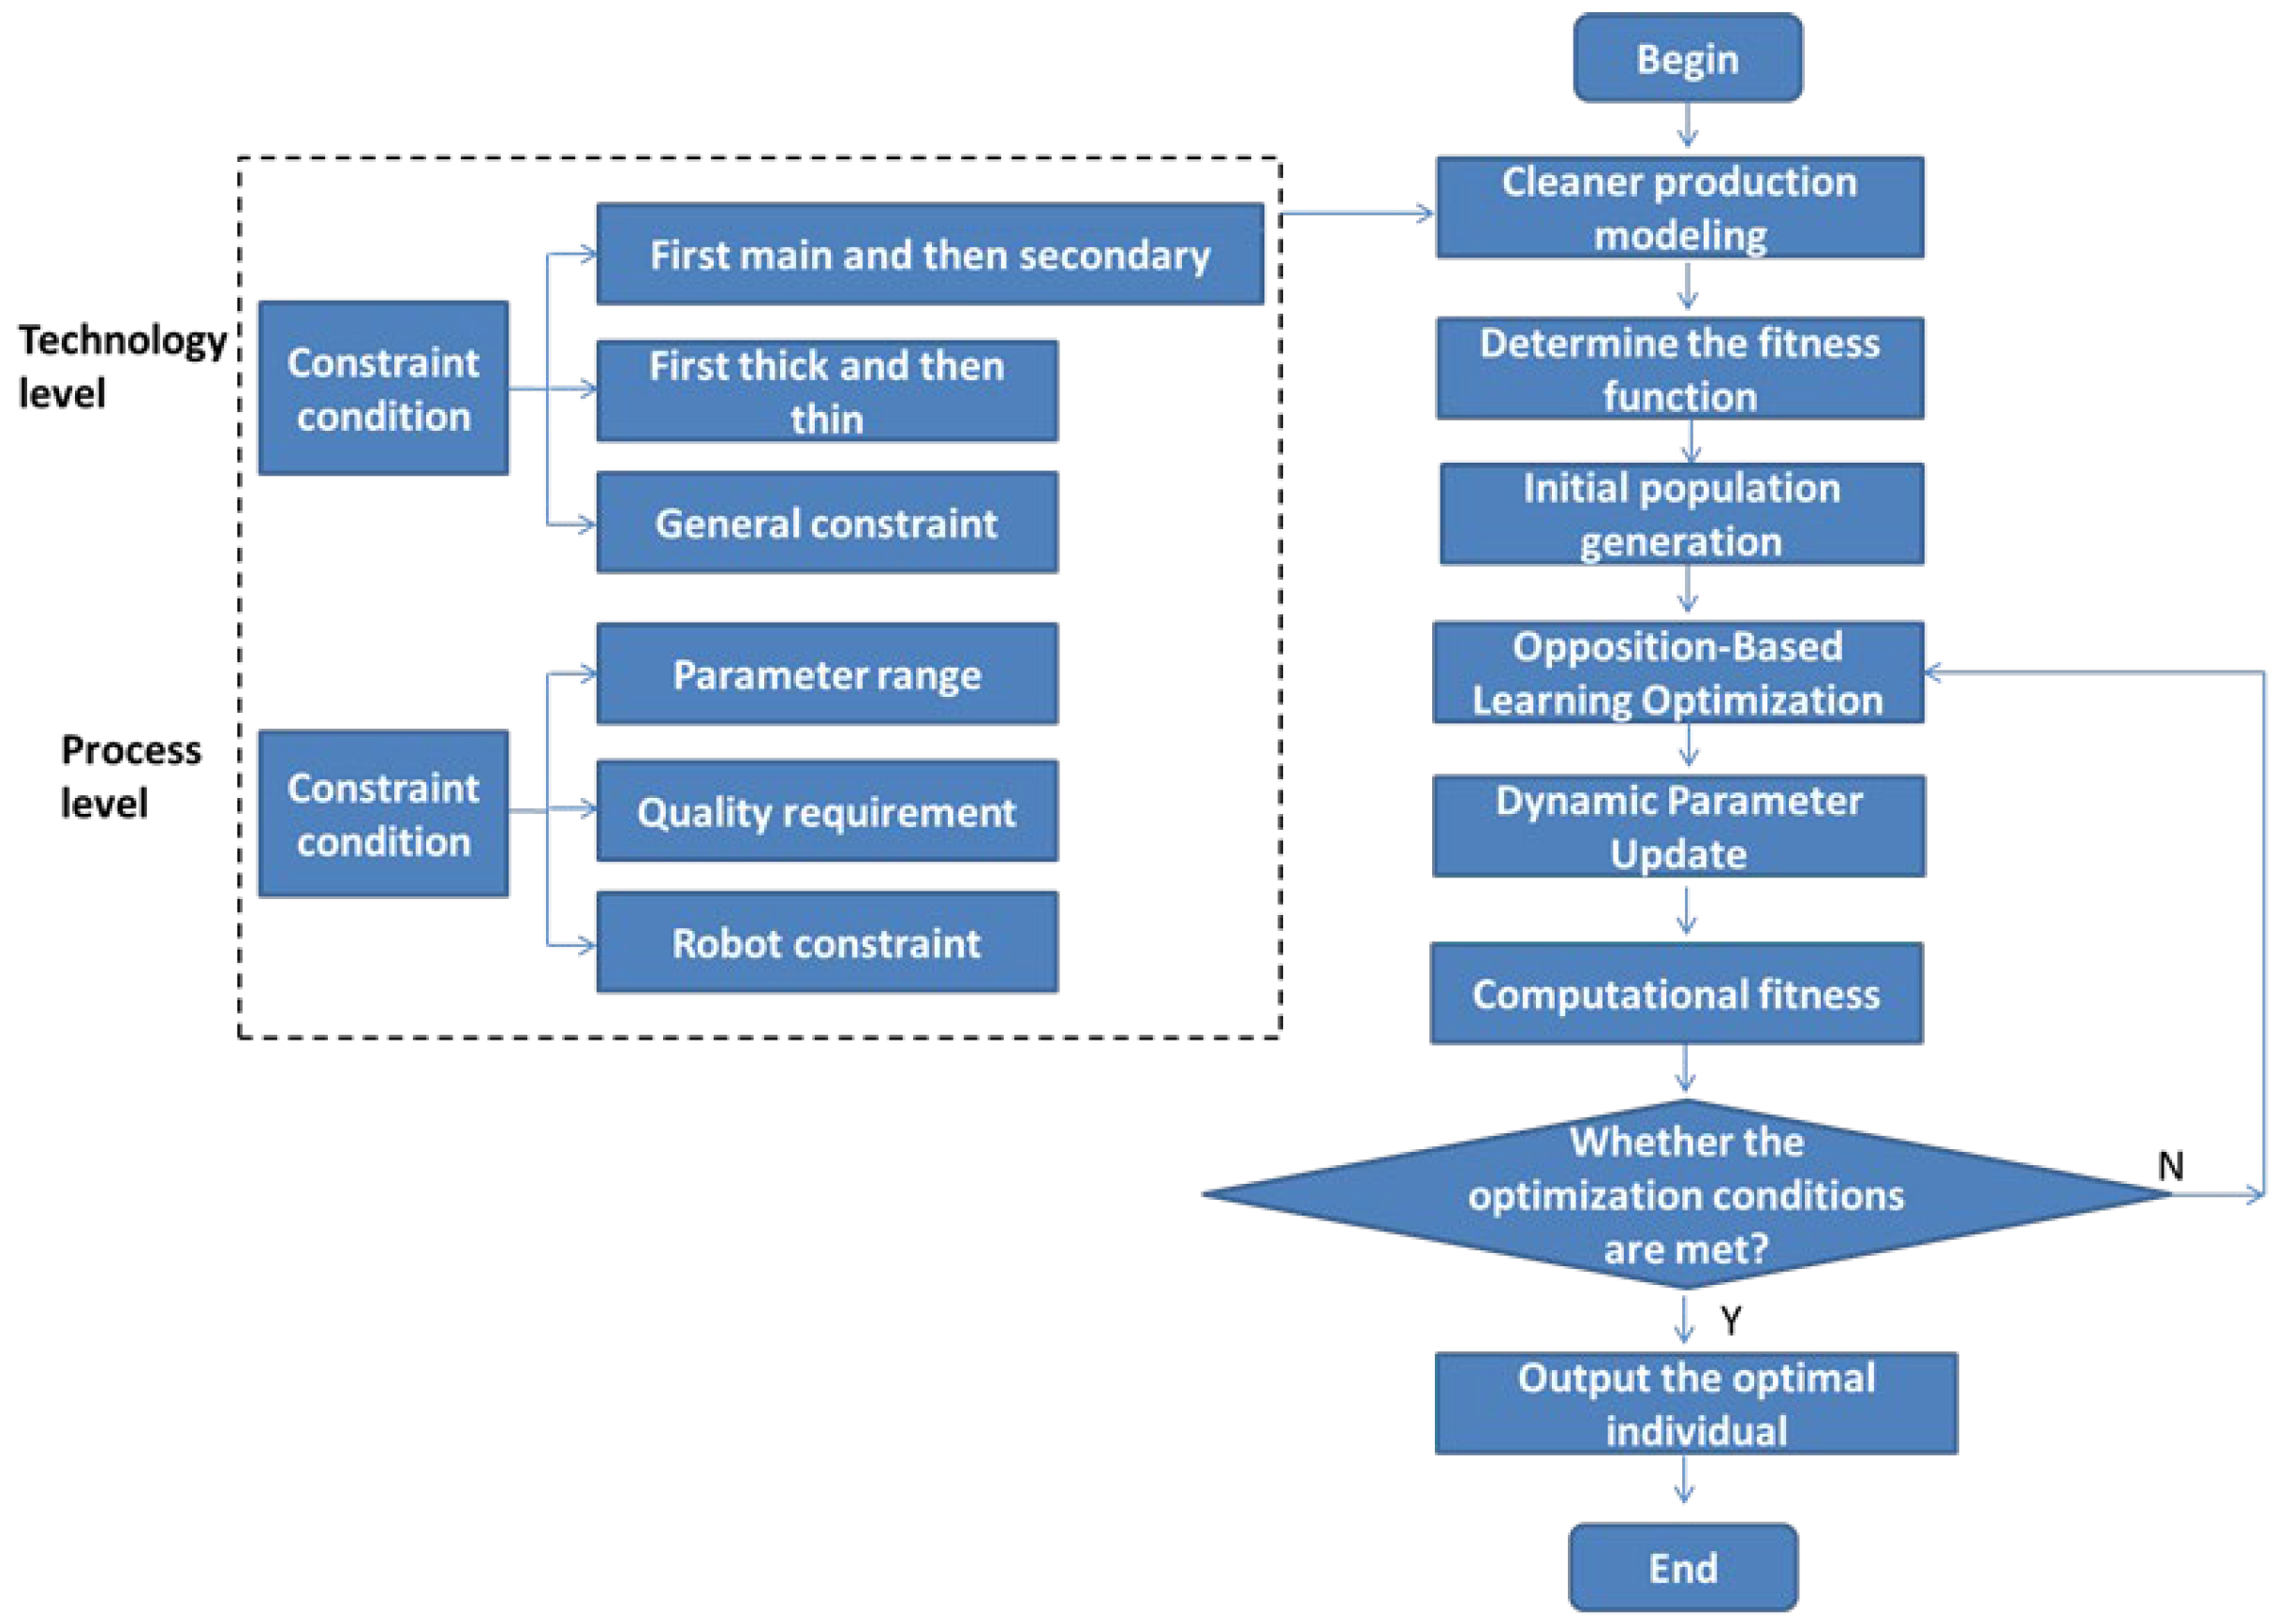
Figure 2.
Cause analysis of body painting production process fishbone diagram.
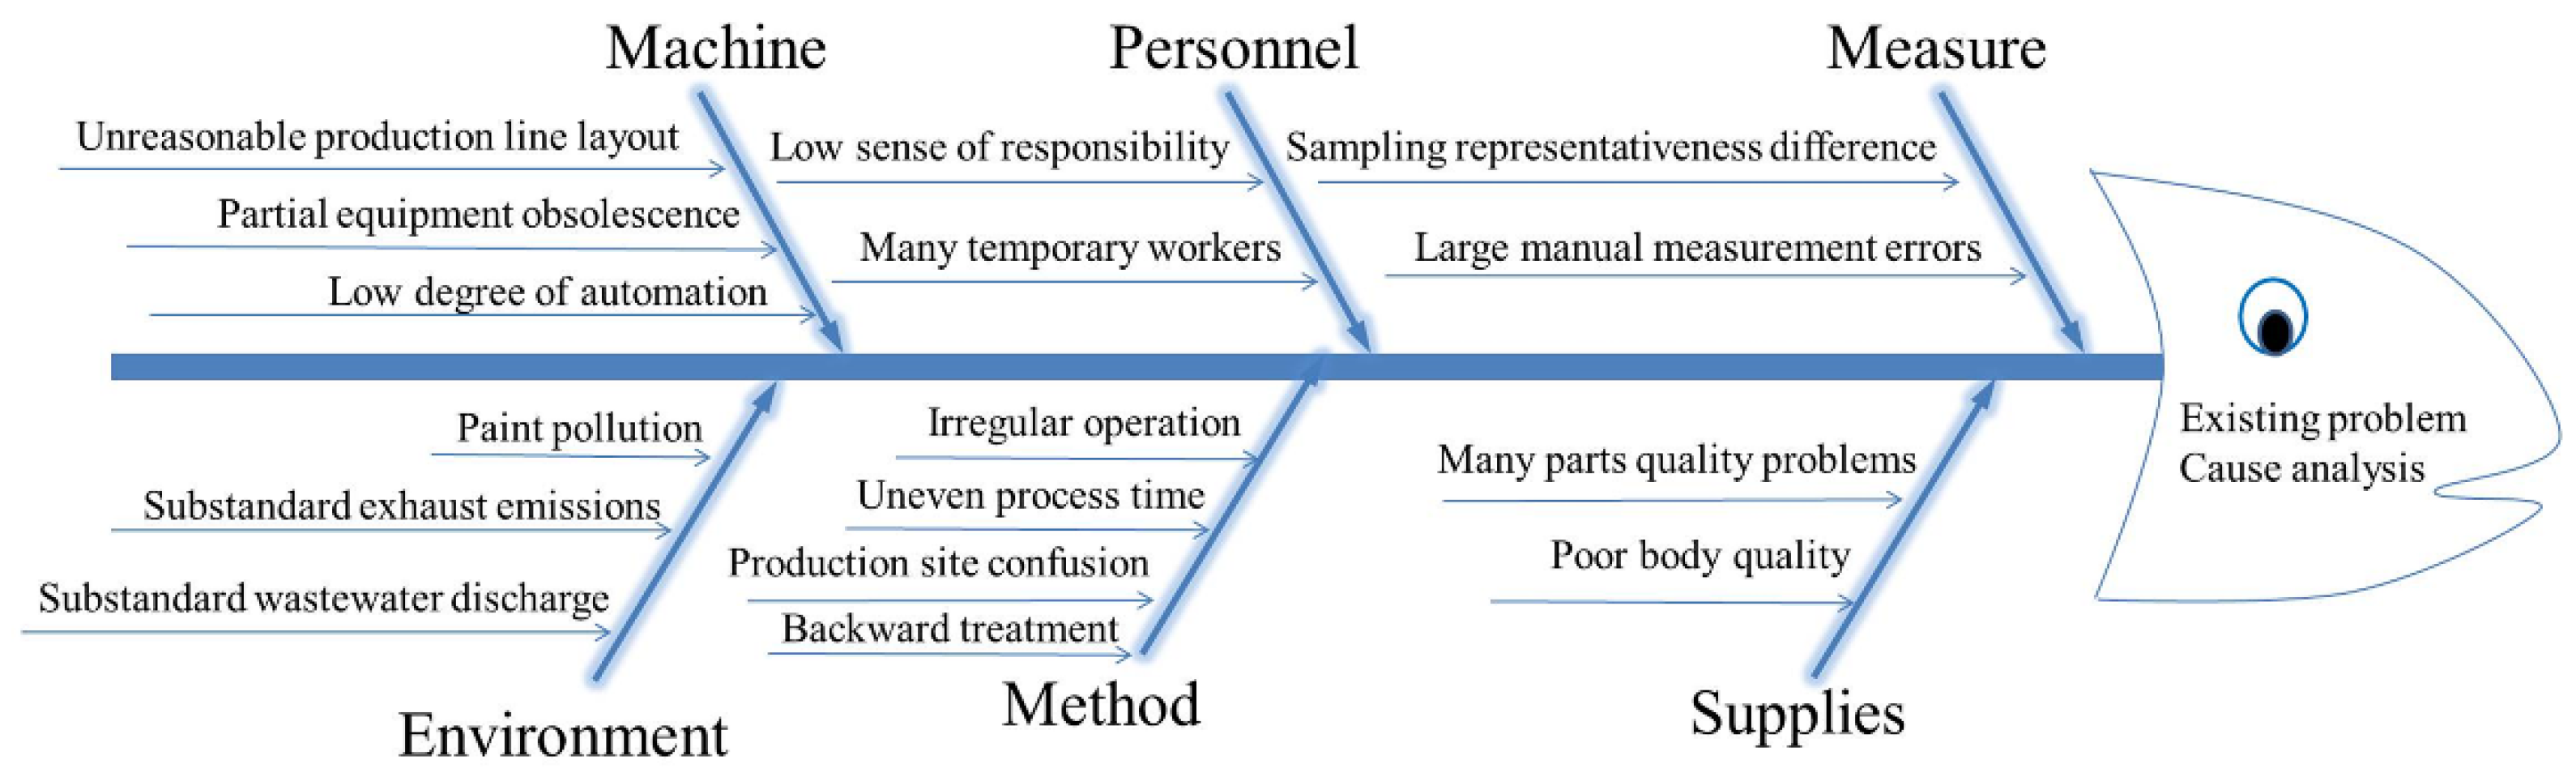
Figure 3.
‘Three-stream’ analysis of spray painting process.
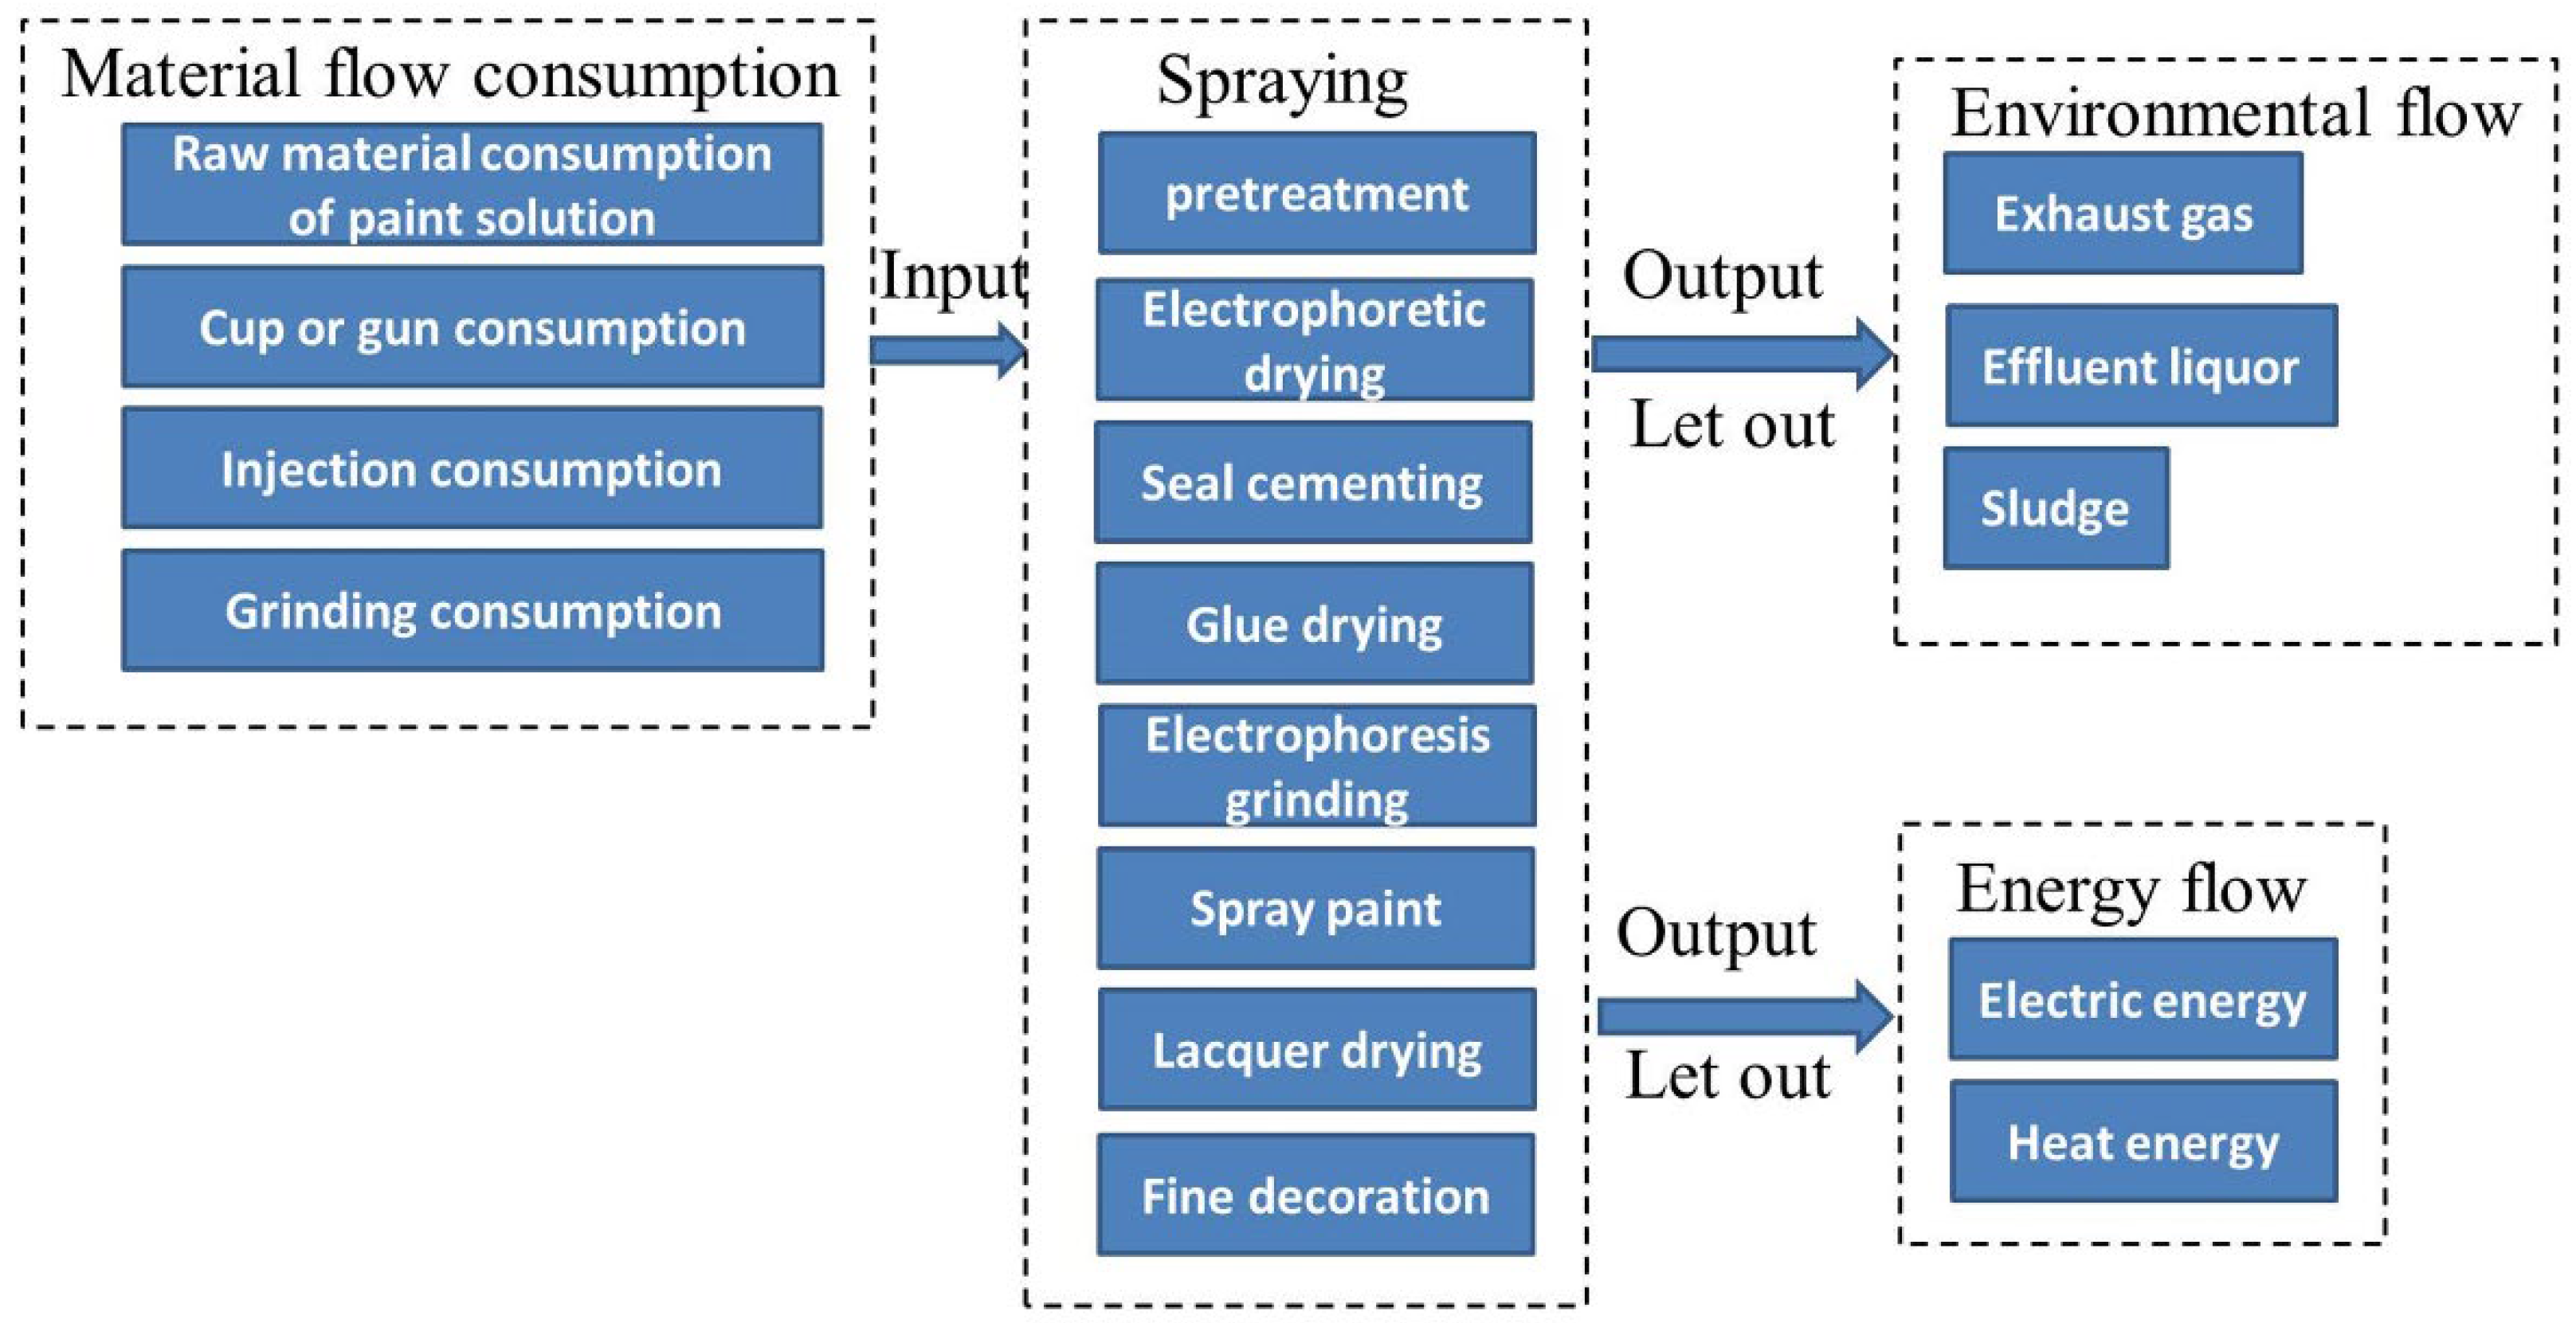
Figure 4.
Process transformation flow chart based on NEDWOA.

Figure 5.
Process flow chart of body painting.
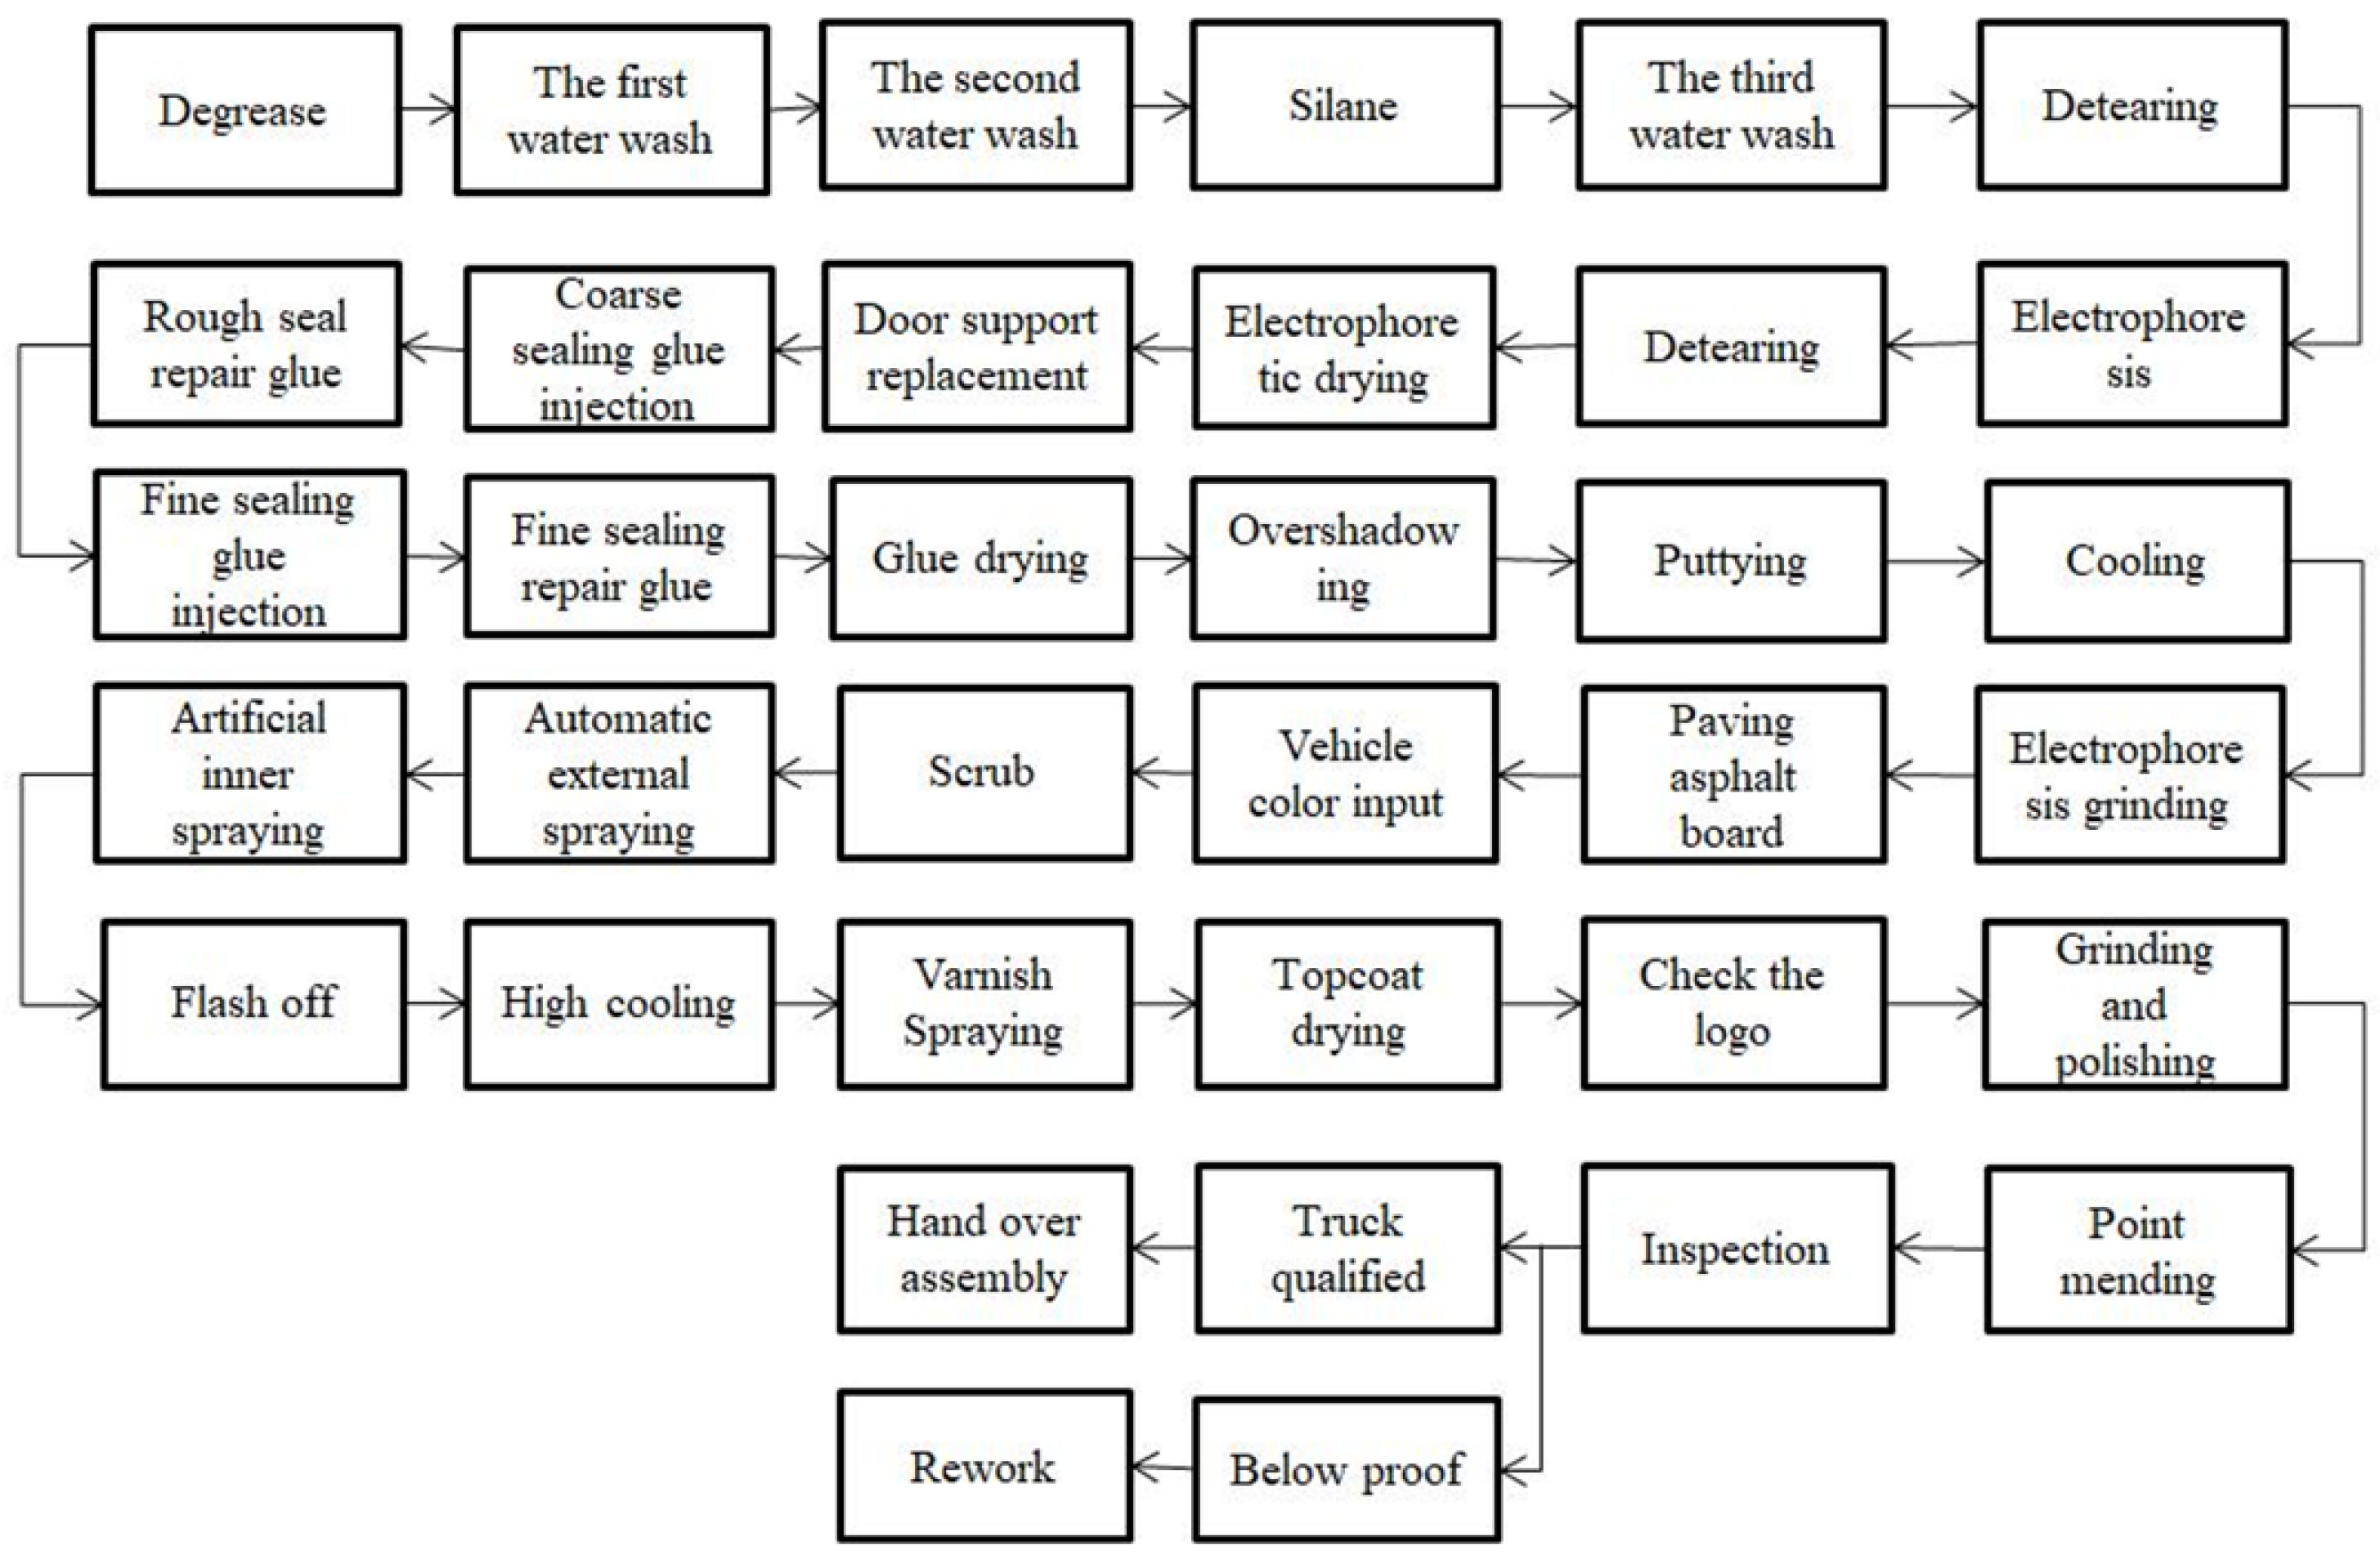
Figure 6.
Multi-objective convergence diagram.
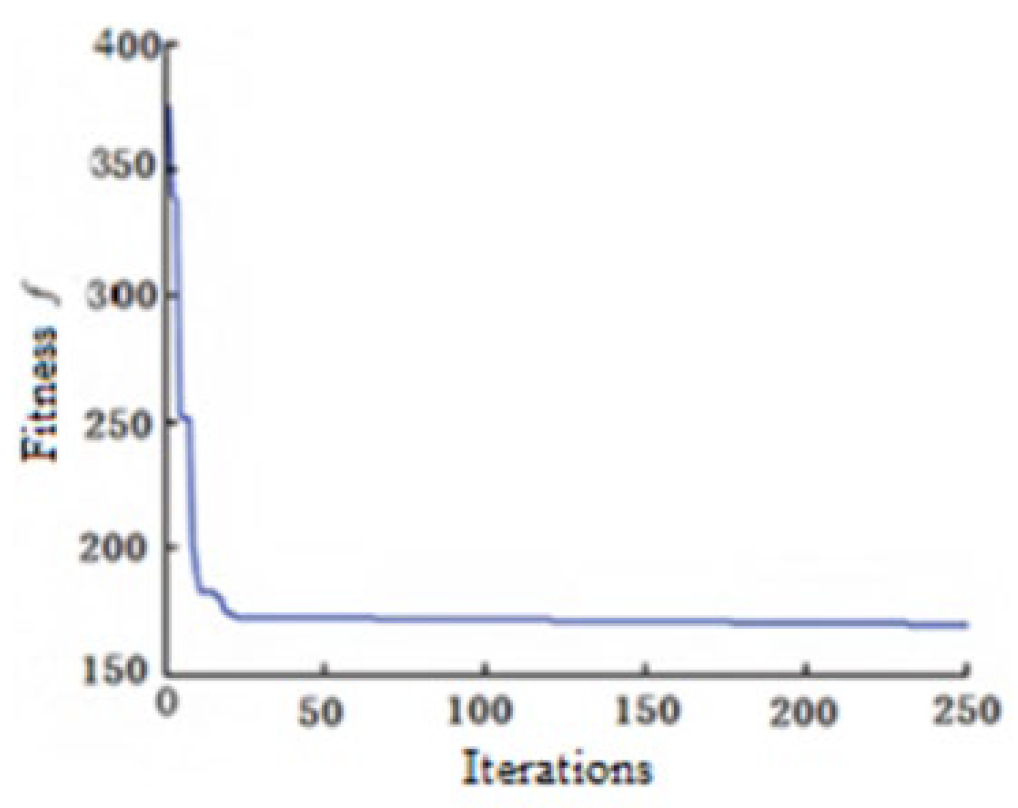
Figure 7.
Comparison of value flow before and after body painting optimization.
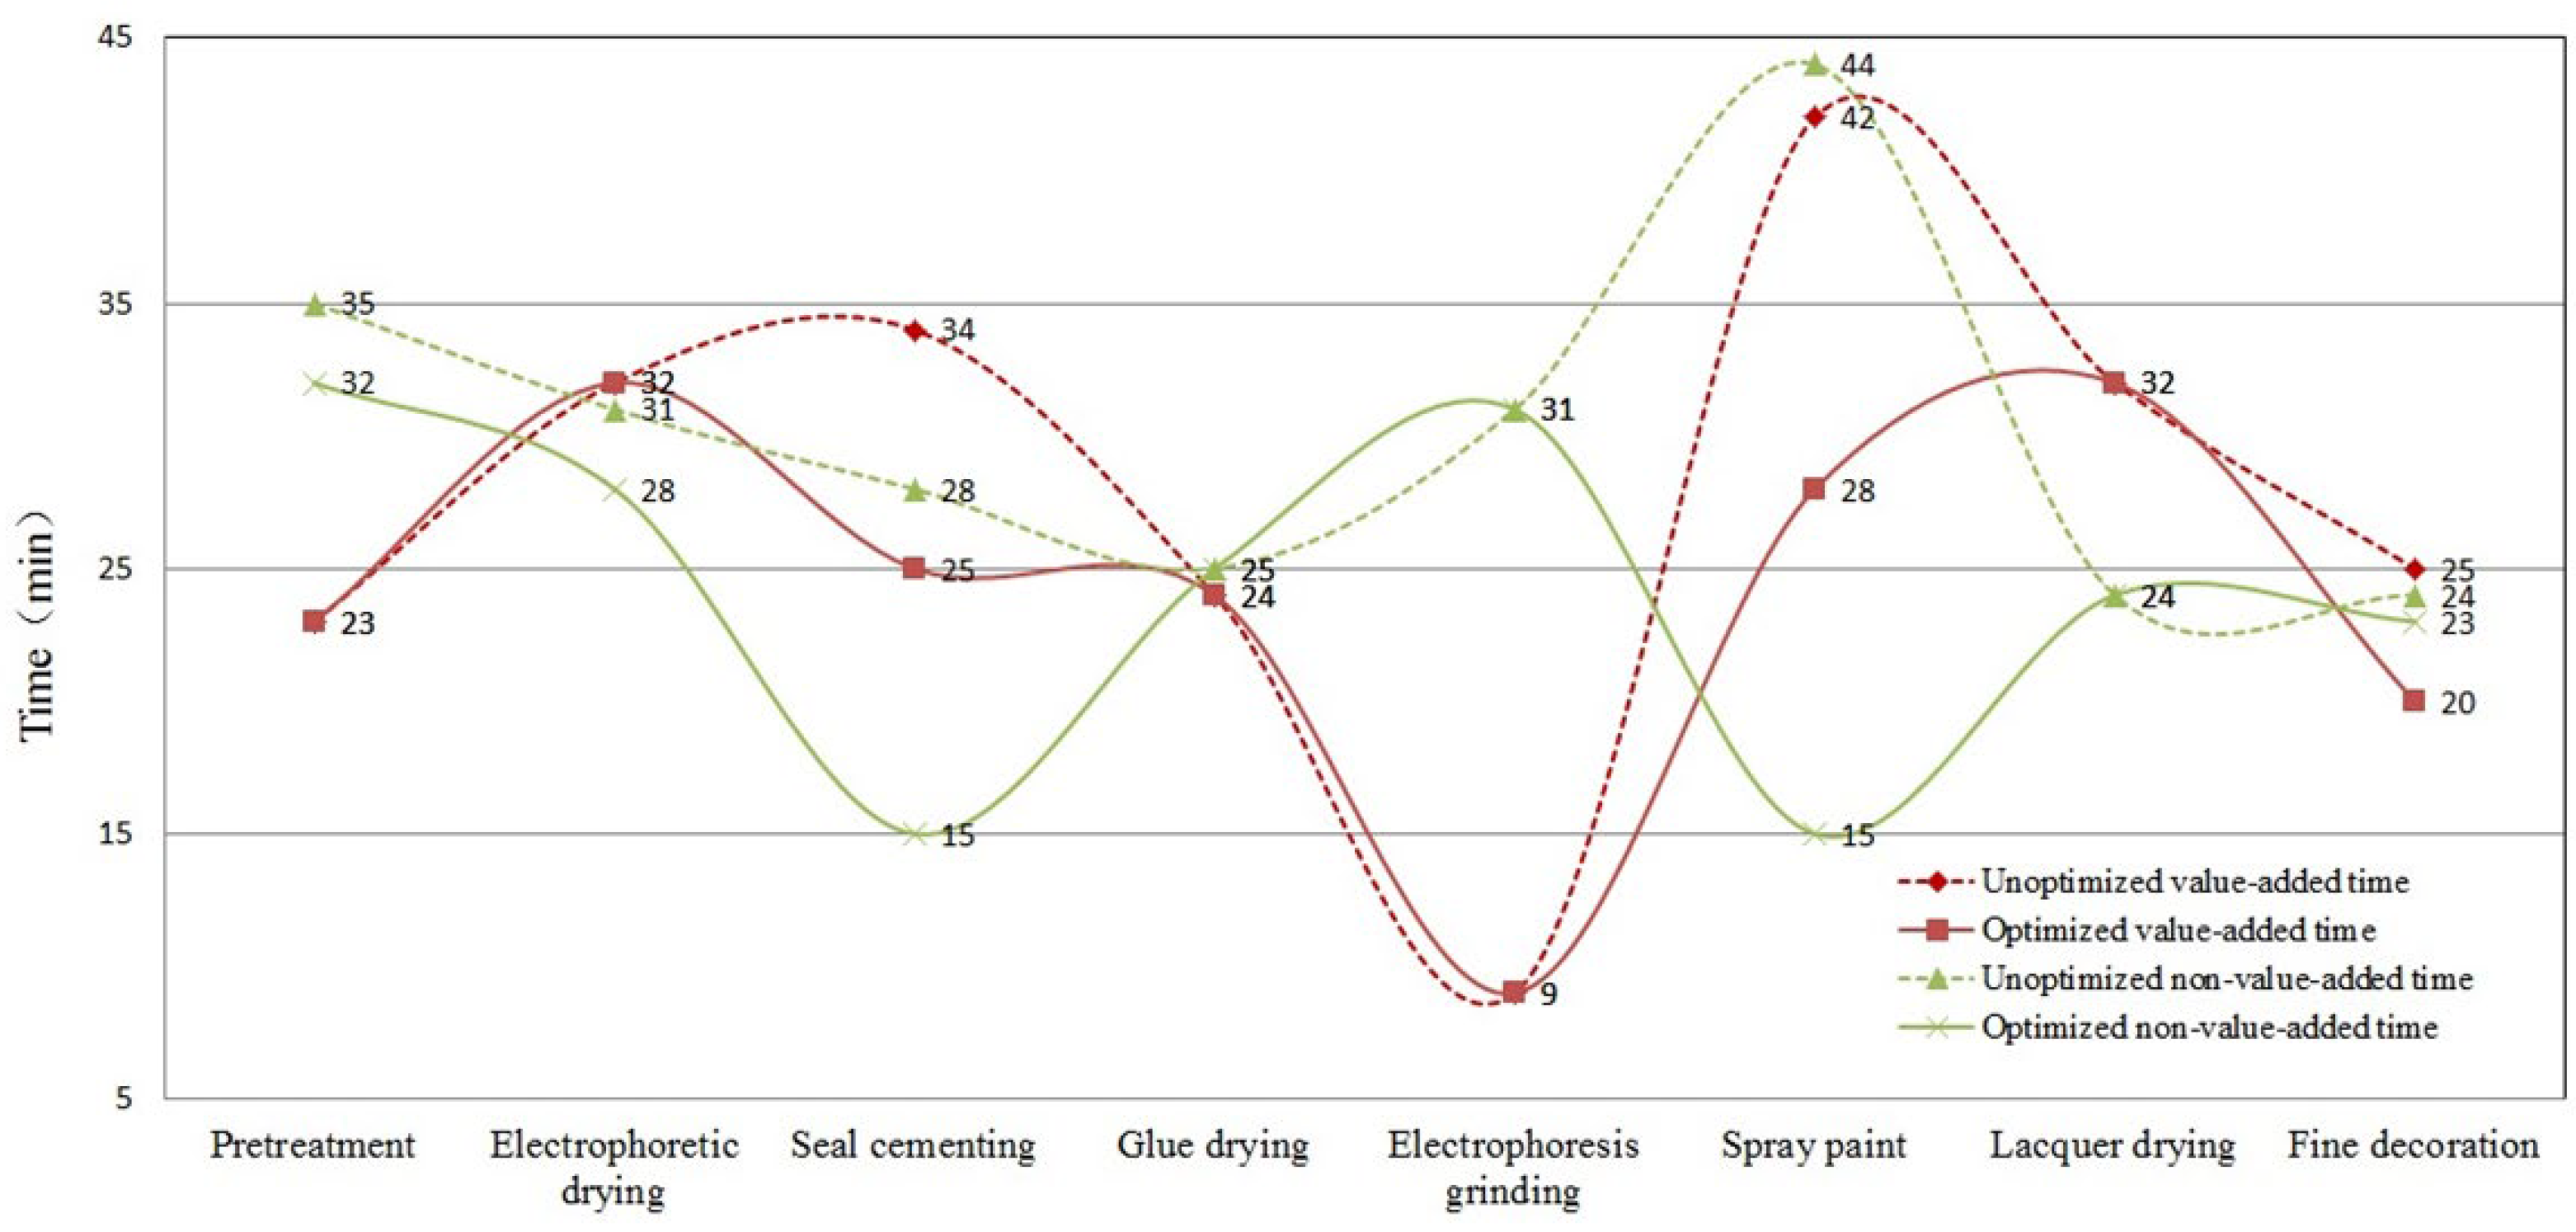

Table 1.
Experimental parameter settings.
| Parameter | Taking values | Parameter | Taking values |
|---|---|---|---|
| spraying distance | 250mm | static voltage U | 60kV |
| cup speed n | priming paint (32kr/min) | average film thickness δ | priming paint (20μm) |
| inter coatings (32kr/min) | inter coatings (40μm) | ||
| final coating (40kr/min) | varnish (40μm) | ||
| metallic paint (16μm) | |||
| paint flux Q | 300cc/min | forming air flow rate | 300NL/min |
| travel speed v | 400mm/s | plane tilt angle α | 0° |
Table 2.
Performance comparison between different algorithms.
| Metric | MHWOA | WOA-RBF | WOA-VMD | NEDWOA |
| Energy Consumption (kWh) | 352 | 367 | 358 | 346 |
| Carbon Emissions (kg CO₂) | 251 | 263 | 259 | 245 |
| Processing Time (h) | 4.9 | 5.8 | 6.1 | 4.2 |
| Total consumption | 180.57 | 188.88 | 185.06 | 176.79 |
Table 3.
TJ company body painting production process transformation effect.
| Serial number | Improvement goals | Original production data | Current production data | Analysis results |
|---|---|---|---|---|
| 1 | Production efficiency improvement | 675 / month | 959 / month | 42.1% |
| 2 | Increased value-added ratio of production | 44. 6% | 46. 2% | 1. 6% |
| 3 | Production personnel reduction rate | 16 patients | 12 patients | 25% |
| 4 | Production cost reduction | 719 yuan / piece | 590 yuan / piece | 17.9% |
| 5 | Improvement of production quality | defective index 15% | defective index 7% | 8% |
| 6 | Exhaust gas purification rate | 32% | 98% | 66% |
| 7 | Energy consumption | 423 kwh | 346kwh | 18.2% |
Disclaimer/Publisher’s Note: The statements, opinions and data contained in all publications are solely those of the individual author(s) and contributor(s) and not of MDPI and/or the editor(s). MDPI and/or the editor(s) disclaim responsibility for any injury to people or property resulting from any ideas, methods, instructions or products referred to in the content. |
© 2025 by the authors. Licensee MDPI, Basel, Switzerland. This article is an open access article distributed under the terms and conditions of the Creative Commons Attribution (CC BY) license (http://creativecommons.org/licenses/by/4.0/).
Copyright: This open access article is published under a Creative Commons CC BY 4.0 license, which permit the free download, distribution, and reuse, provided that the author and preprint are cited in any reuse.


