Submitted:
03 April 2025
Posted:
04 April 2025
Read the latest preprint version here
Abstract
Background/Objectives: Ferroptosis, an iron-dependent form of cell death, shows promise as a target for therapy-resistant cancers that exhibit increased iron metabolism. Ferroptosis is primarily characterised by lipid peroxidation within cell membranes. However, many cancers evade ferroptosis by upregulation of specialised ferroptosis defence mechanisms. This study investigates ferroptosis susceptibility in Tuberous Sclerosis Complex (TSC) model, ovarian and breast cancer cell lines to identify ferroptosis resistance mechanisms and therapeutic targets. Methods: We assessed ferroptosis susceptibility using the ferroptosis inducers, RSL3 and erastin. We explored ferroptosis resistance genes using inhibitors of NRF2 (ML385) and FSP1 (iFSP1). RNA-sequencing was conducted to identify dysregulated ferroptosis resistance genes and to better characterise NRF2 target genes. Results: TSC2-deficient cells exhibited resistance to RSL3 and erastin-induced ferroptosis, which correlated with increased ferroptosis defence gene expression, including NRF2 and downstream targets. NRF2 inhibition re-sensitised TSC2-deficient cells to ferroptosis, confirming its protective role. However, FSP1 inhibition did not re-sensitise TSC2-deficient angiomyolipoma kidney tumor cells to RSL3. In contrast, FSP1 knockdown significantly enhanced ferroptosis sensitivity in ovarian (PEO1, PEO4, OVCAR3) and breast (MDA-MB-436) cancer cell lines. Notably, in MDA-MB-436 cells, FSP1 knockdown was more effective than NRF2 inhibition in reversing ferroptosis resistance. Conclusions: Our findings highlight NRF2 and FSP1 as key regulators of ferroptosis resistance in TSC2-deficient and cancer cells. However, the differential efficacy of targeting these pathways suggests that patient stratification may be necessary for optimal therapeutic strategies. Targeting NRF2 and FSP1 could enhance ferroptosis susceptibility, offering a potential therapeutic approach for ferroptosis resistance cancers.
Keywords:
Ferroptosis
; Tuberous Sclerosis Complex
; mTOR
; cancer resistance
; NRF2
; FSP1
; RSL3
1. Introduction
Most cancer treatments aim to trigger cell-death by either disrupting cell survival and growth pathways, or by enhancing immune system recognition of tumors. Typically, conventional therapies result in apoptosis; a controlled and highly regulated form of cell death characterised by cell shrinkage, membrane budding, and phagocytosis by surrounding cells (see review [1]). However, many cancers develop resistance to therapies by disabling apoptotic pathways, necessitating alternative cytotoxic strategies. Given the limitations of apoptosis-inducing therapies, ferroptosis represents a promising alternative for targeting therapy-resistant tumors.
Ferroptosis is an iron-dependent form of regulated cell death that is driven by lipid peroxidation (LPO) and oxidative damage to cell membranes [2]. Unlike apoptosis, which relies on caspase activation, ferroptosis is primarily regulated by metabolic and oxidative stress pathways, with glutathione peroxidase 4 (GPX4) playing a central role in preventing LPO. While phospholipid peroxides appear to be the driving force behind ferroptosis, the process by which this occurs is poorly understood. Morphologically, ferroptosis is distinct from apoptosis and necrosis. Cells undergoing ferroptosis exhibit shrinking mitochondria, disrupted mitochondrial cristae and increased membrane density [2].
Iron metabolism plays a crucial role in rapidly proliferating cells, supporting processes such as DNA/RNA synthesis, redox homeostasis, and ATP production. However, dysregulation of iron homeostasis can promote oxidative stress and sensitize cells to ferroptosis [2]. To maintain homeostasis and to prevent ferroptosis, cells must carefully regulate intracellular iron levels by modulating iron import, export, and storage in iron-sulphur clusters and ferritin. Additionally, redox defence mechanisms exist to combat ferroptosis. Perturbations in amino acid availability, particularly cysteine, plays an important role due to its significance in the synthesis of glutathione (GSH), the most abundant intracellular antioxidant. GSH serves as a reducing agent to GPX4, a selenium-dependent enzyme, to detoxify lipid peroxides and prevent the accumulation of LPO in cell membranes [3]. Consequently, ferroptosis can be triggered by inhibiting the regeneration of the cellular antioxidant GSH via blockade of the cysteine-glutamate transporter Xc(–) system. Both inhibition of cysteine amino acid uptake and GPX4 are known to exacerbate LPO [4].
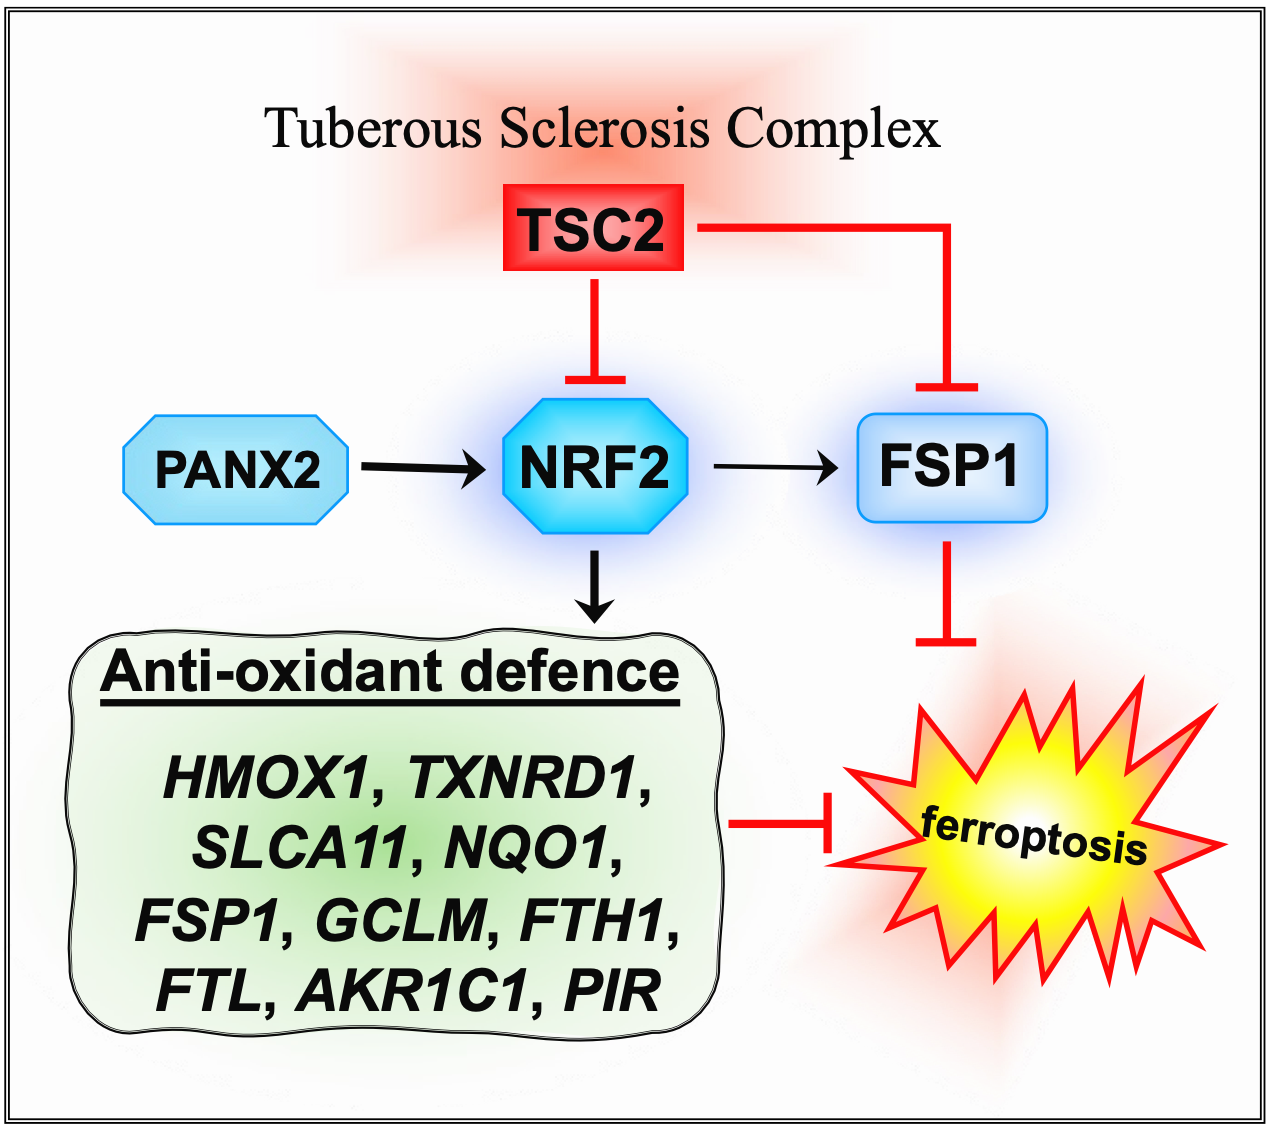
The transcription factor, nuclear factor E2 related factor 2 (NRF2/NFE2L2) defends against ferroptosis by upregulating the expression of antioxidant and cytoprotective genes that counteracts the accumulation of toxic reactive peroxides [5]. Key downstream gene targets of NRF2 involved in ferroptosis are GPX4, SLC7A11 (solute carrier family 7 member 11, a cysteine-glutamate antiporter), HMOX1 (heme oxygenase 1) and AIFM2 (AIF family member 2 (also known as ferroptosis suppressor protein 1 (FSP1)). HMOX1 is involved in heme catabolism and is a pro-ferroptosis enzyme [6]. Increased iron levels in the cell, by autophagic degradation of the iron storage protein ferritin and the upregulation of HMOX1 further contributes to reactive oxygen species (ROS) production and ferroptosis induction. AIFM2 functions as a NAD(P)H-dependent oxidoreductase that regenerates ubiquinol, thus preventing lipid oxidative damage and ferroptosis (reviewed in [7]).
To support their own growth, cancers often upregulate iron-linked metabolic pathways, increase iron uptake and can often develop a dependence on iron to become “iron addicted” (reviewed in [8]). Simultaneously, cancers often upregulate redox defence mechanisms that counteract against ferroptosis. This results in a range of tolerance to counter ferroptosis among different cancer types, with some forms of cancer being highly susceptible to ferroptosis, while others appear highly resistant [9]. Increased dependency on iron presents an enticing methodology of targeting previously drug-resistance cancers. For example, tumour dependency on iron may be exploited by resensitizing cancer cells to their naturally high intracellular iron levels.
To better understand mechanisms linked to ferroptosis sensitivity we utilized TSC cell line models. TSC is a rare genetic disorder caused by loss of function of either TSC1 or TSC2. TSC patients are predisposed to kidney, skin, and brain tumors (see reviews [11,12]). A central feature of TSC and their associated cell line models is that mechanistic target of rapamycin (mTOR) signaling is hyperactive [13,14]. Recent findings underscore the mTOR pathway as a pivotal but context-dependent regulator of ferroptosis. In some settings, oncogenic mTOR activity inhibits ferroptosis by promoting GPX4 translation and SREBP-mediated lipogenesis, thereby bolstering lipid membrane stability [14,15,16]. Conversely, under certain conditions, mTOR can facilitate ferroptosis via autophagic and lysosomal mechanisms that elevate intracellular iron or potentiate lipid peroxidation [17]. These contrasting outcomes reflect the complexity of mTOR-driven metabolic and redox pathways, suggesting that the net effect of mTOR activation on ferroptosis susceptibility is dictated by cell type, oncogenic drivers, and the broader metabolic environment. In this study, we explored ferroptosis survival mechanisms in both TSC and cancer cell lines to better understand potential vulnerabilities that could be therapeutically targeted.
2. Materials and Methods
2.1. Cell Culture, Drugs and Reagents
TSC cell lines used in this study include Tsc2+/+ p53−/− and Tsc2−/− p53−/− MEFs (now referred to as Tsc2+/+ and Tsc2−/−, respectively) were kindly provided by D. Kwiatkowski in 2004 (Harvard University, Boston, USA) [18]. Eker rat leiomyoma-derived cells lacking functional Tsc2 (ELT3-V3) and matched controls that re-express Tsc2 (ELT3-T3) were generated by Astrinidis et al. [19]; gifted in 2006 by C. Walker (M.D. Anderson Cancer Center, Houston, USA). Human TSC2-deficient angiomyolipoma (AML) 621-101 cells (TSC2(−) AML) and these cells restored with TSC2 re-expression (621-103 TSC2(+) AML was a gift from E. Henske in 2006 (Harvard University, Boston, USA) [20]. OVCAR3, PEO1, and PEO4 cells were a kind gift from Dr. James Cronin (Swansea University, UK). MDA-MB-436 cells were purchased from ATCC.
Cells were grown in humidified incubators at 37 °C, 5% (v/v) CO2. Maintenance and treatments were carried out with 10% (v/v) fetal bovine serum (FBS bought from Sigma-Aldrich, Dorset, UK) in Dulbecco’s modified Eagle’s medium (DMEM). Maintenance of TSC2(−) and TSC2(+) AML cells was done with 15% (v/v) FBS. OVCAR3 cells were cultured in RPMI 1640 medium supplemented with 20% (v/v) FBS, 2 mM L-Glutamine, 0.01 mg/mL insulin (Lonza, BE02-033E). PEO1 and PEO4 cells were cultured in RPMI 1640 medium supplemented with 15% FBS and 2 mM L-Glutamine. MDA-MB-436 cells were cultured in DMEM supplemented with 15% (v/v) FBS, 0.01 mg/mL insulin, and 2 mM L-Glutamine. All culture medium was supplemented with 100 U/mL penicillin and 100 µg/mL streptomycin (P4333, Sigma-Aldrich). Drugs to activate ferroptosis and inhibitors used in this study were bought from Selleck Biotechnology Ltd. (Waltham Abbey, UK). If not mentioned, all other lab chemicals were purchased from Merck Life Science UK Limited (Watford, UK). Cells were routinely checked and were found to be mycoplasma negative with Venor™ GeM Advance Mycoplasma Detection Kits (Minerva Biolabs, Berlin, Germany).
2.2. Flow Cytometry
To quantify cell death by flow cytometry, cells cultured on plastic tissue plates were washed with phosphate buffered saline (PBS) and then trypsinised to dissociate cells. Cells were collected and centrifuged at 2000 rpm (400 g) for 5 min. Cell pellets were then incubated with 3 μM DRAQ7 for 10 min at 37 °C then run on the flow-cytometer using 633 nm excitation and detection of fluorescence > 695 nm (far red). DRAQ7 was sourced from Biostatus (Shepshed, UK). LPO was assessed with the lipid peroxide-sensitive dye, Liperfluo (Dojindo). After drug treatment, cells were trypsinised, collected, and pelleted. Cell pellets were then resuspended in culture medium containing 5 µM liperfluo. Resuspended cells were then incubated for 30 min at 37 °C, 5% (v/v) CO2, before being stored on ice and assayed soon after. Flow cytometry was performed using a FACSCaliburTM Flow Cytometer (BD, Cowley, UK). Excitation was performed with 488 nm, and excitation was recorded with the FL1 (530/30 nm) detector. Readings were performed on a linear scale, and 15,000 gated events were recorded per sample. Gating was performed to exclude cellular debris and dead cells. Median fluorescent intensities were recorded. Data was processed using floreada (https://floreada.io/).
2.3. Cell Viability Assays Using Crystal Violet
To assess cell viability by relative cell quantity determination, cells were grown in clear bottom 96-well plates. 4 technical repeats were used per condition, per biological repeat. After treatment, wells were washed once with 1X PBS. Next, wells were stained with crystal violet solution (0.5% (w/v) crystal violet, 20% (v/v) methanol, ddH2O) and incubated for 10 mins on an orbital shaker. Wells were then washed 3 times with 1X PBS, prior to resuspension in 1% SDS solution. Plates were then incubated for 2 h on an orbital shaker before absorbance was measured at 570 nm on a PHERAstar® FS plate reader. Data was expressed relative to untreated DMSO control cells that were assigned a value of 100%.
2.4. RNA Sequencing and Analysis
Samples were collected in RNAprotect reagent (Qiagen, West Sussex, UK) prior to total RNA extraction with an RNEasy kit (Qiagen). Total RNA was quantified using a QubitTM RNA HS Assay. RNA samples for MDA-MB-436 cells were shipped to Novogene for RNA-sequencing and bioinformatic processing. Samples were first checked for quality control. mRNA was then purified from total RNA using poly-T oligo-attached magnetic beads. Libraries were then constructed and checked with QubitTM and RT-PCR for quantification. Libraries were then sequenced on the Illumina platform and reads were processed into clean data. HISAT2 (2.2.1) was used to build the index of the refence genome. FeatureCounts (2.0.6) was used to count the read numbers mapped to each gene and FPKM was calculated, and DESeq2 (1.42.0) was used to perform differential expression analysis. P-values were adjusted using the Benjamini and Hochberg’s methods to control error discovery rate. Gene Ontology analysis was performed in-house using GeneAnalytics (https://geneanalytics.genecards.org/). Gene ontology (GO) for ferroptosis gene sets was collated from literature searches. The NRF2-target gene (sourced from [21]) and was supplemented with additional targets based on literature searches. RNA sequencing data used for volcano plots comparing 621-101 TSC2(−) AML versus TSC2 re-expressed 621-103 TSC2(+) AML cells and the ferroptosis and NRF2-target genes sets are provided in Supplementary Table S1. RNA samples preparation and RNA sequencing for TSC-model cell lines (supported through Wales Gene Park (Cardiff University)) is described in [22]. We reanalysed RNA sequencing data for ferroptosis and NRF2-target genes comparing Tsc2−/− and Tsc2+/+ MEFs (found in Supplementary Table 2 of previously published manuscript [22]).
Raw RNA sequencing data comparing MDA-MB-436 with NRF2 knockdown versus MDA-MB-436 cells treated with non-targeting siRNA is provided in Supplementary Table S2. Supplementary Table S3 shows raw RNA sequencing data comparing MDA-MB-436 with FSP1 knockdown versus MDA-MB-436 cells treated with non-targeting siRNA.
2.5. Western Blotting
Cell lysates were prepared by direct cell lysis cells using x1 sample buffer (62.5 mM Tris–HCl (pH 7.6), 50 mM dithiothreitol, 2% (w/v) sodium dodecyl sulfate, 10% (w/v) glycerol, and 0.1% (w/v) bromophenol blue), sonicated for cycles of 3 x 30 s at full power (30 sonication amplitude microns (µm)), heated for 10 min at 95 °C and centrifuged for 8 min at 13,000 rpm (16,000 g). To quantify protein, Pierce 660 nm protein reagent (supplemented with ionic detergent compatibility reagent) was used as directed by the manufacturer (Thermo Fisher Scientific, Newport, UK). Equal protein amount was loaded on NuPage precast gels (Thermo Fisher Scientific, Newport, UK). Western blotting was performed as previously described [23]. Blot images was processed on ImageJ (v.50) with minimal alterations to contrast and brightness levels only. Uncropped blots are provided in supplementary data. Antibodies were purchased from Cell Signaling Technology (Danvers, MA, USA), including antibodies towards TSC2 (#4308), TFR (#55487), GPX4 (#52455) and β-actin (#4967). Antibodies for HMOX1 was from Abcam Limited, Cambridge, UK (#ab68477) and for FSP1 was from Proteintech Europe, Manchester, UK (#20886-1-AP).
2.6. Immunofluorescence
Cells were grown on glass coverslips. After treatment, cells were washed in 1X PBS for 5 min and were then fixed with 4% (v/v) paraformaldehyde in 1X PBS for 15 min (all wash/incubation steps were at room temperature, unless stated otherwise). Cells were washed 3 times with 1X PBS (5 min incubations) before being quenched with 0.1 M glycine in PBS for 15 min. After quenching, cells were washed in 1X PBS and then permeabilized with 0.2% (v/v) Triton X–100 in 1X PBS) for 20 min. Following permeabilization, buffer was removed, and cells were blocked with 2% (w/v) bovine serum albumin in 1X PBS for 20 min. Primary NRF2 antibody (#PA5-27882 (Thermo Fisher Scientific)), diluted 1:500 in blocking buffer, was then added to the cells and incubated for overnight at 4oC. Following three 5 min washes in 1X PBS, the secondary antibody (polyclonal donkey anti-rabbit Alexa Fluor 647, #A-31573 (Thermo Fisher Scientific)) was diluted 1:1000 in blocking buffer, and was applied to the cells for 30 min. Cells were then washed 3 times in 1X PBS for 5 min before incubating with DAPI (1 ug/mL in PBS) for 15 min. Cells were washed twice for 5 min with 1X PBS. Coverslips were mounted with 5 μL Fluoromount G and mountant. Cells were examined on a Leica DMI6000B microscope (Leica Biosystems, Wetzlar, Germany; DAPI λex 340-380nm λem 450-490nm; Far Red λex 590-650nm and λem 662-738nm) with fixed exposure time for comparative fluorescence intensity.
2.7. Statistical Analysis
GraphPad Prism 9 was used for statistical analysis. If data had normal (Gaussian) distribution, one-way ANOVA with Tukey’s post hoc test was used. If examining the effects of two independent variables, two-way ANOVA with Šídák's multiple comparisons test was used. p-values are represented as either * p<0.05, ** p<0.01, *** p<0.001, **** p<0.0001 or as not being significant ‘NS’. Data are presented as the mean ± SEM.
3. Results
3.1. TSC2-Deficiency Protects Cells from Ferroptosis Inducers
We examined the effects of ferroptosis inducers on two cell line models of TSC. Ferroptosis inducers, RSL3 (RAS-selective lethal 3) and erastin, were used in 24 h treatments with Tsc2(−/−) and Tsc2(+/+) mouse embryonic fibroblasts (MEF) cells (Figure 1a) and Tsc2-null ELT3-V3 and TSC2 re-expressed ELT3-T3 cells (Figure 1b). Cell viability was assessed by flow cytotometry using DRAQ7 labelling that measures cell death via increased membrane permeability. RSL3 primarily induces ferroptosis through direct inhibition of GPX4 without GSH depletion and more recently has been shown to inhibit the catalytic activity of thioredoxin reductase 1 that further contributes to lipid peroxidation and ferroptosis [25]. Erastin induces ferroptosis via a different mechanism, via inhibition of the cysteine-glutamate transporter Xc(–) system that prevents cysteine import for GSH regeneration, which then reduces the cell’s capacity to reduce lipid peroxides [25]. When compared to their wild-type controls, Tsc2-deficient cells were less sensitive to cell death when treated with either of the ferroptosis inducers, RSL3 or erastin (Figure 1a and 1b). 0.3 μM RSL3 and 1.2 μM erastin killed the Tsc2(−/−) MEF cells by ~50%, while showing ~75% loss of cell viability in the Tsc2(+/+) MEF cells. Similarly, higher concentrations of ferroptosis inducers were required to kill the TSC2-deficient ELT3-V3 cells.
To confirm that RSL3 treatment was inducing ferroptosis in an iron-dependent way, a panel of inhibitors were used in combination with RSL3 in the Tsc2(+/+) MEF, where we counted viable cell lines using crystal violet stain (Figure 1c). To explore another TSC model wild-type cell line, TCS2(+) AML cells were also examined using crystal violet viability assays (Figure 1d). Inhibitors used, included the use of: (i) the iron chelator, deferiprone, (ii) ferrostatin-1, to inhibit ferroptosis, (iii) pan-caspase inhibitor, Z-VAD-FMK, to inhibit ‘classic’ apoptosis, and (iv) necrostatin-1, to inhibit necroptosis. Deferiprone, ferrostatin-1 and necrostatin-1 ablated RSL3-induced cell death, while Z-VAD-FMK was unable to rescue RSL3 induced cell death. Phase contrast images of the TSC2(+) AML cells seeded at low cell density were taken to illustrate that RSL3 treatment caused the cells to round up (Figure 1e), which was prevented with either deferiprone, ferrostatin-1 or necrostatin-1. Collectively, these experiments indicate that loss of viability by RSL3 is iron dependent, indicating that cell death caused by RSL3 is ferroptosis. It is known that necrostatin-1 can block ferroptosis in cells [26].
To further explore ferroptosis, we carried out differentially expressed gene (DEG) analyses of ferroptosis linked genes from transcriptomic data. We compared differences of expression of ferroptosis genes between Tsc2(−/−) and Tsc2(+/+) MEFs (Figure 2a) and TSC2-deficient and TSC2-restored AML cells (Figure 2b). In cells lacking TSC2, we observed an upregulation of ferroptosis gene expression. Of note, HMOX1 expression was upregulated in the absence of TSC2. We also observed upregulation of the Xc(–) system cystine/glutamate transporter, SLC7A11, which is directly linked to ferroptosis resistance and a drug target of erastin to block SLC7A11-mediated cystine import [27]. We next examined the relative protein expression of targets linked to ferroptosis in these 2 TSC cell models: Tsc2(+/+) and Tsc2(−/−) MEFs (Figure 2c) and the TSC2(+) and TSC2(−) AML cells (Figure 2d). Ferroptosis related proteins examined were HMOX1, GPX4, GPX8, transferrin receptor (TFR, gene referred to as TFRC) and FSP1, while control blots included TSC2 and β-actin. While expression of ferroptosis related proteins was not altered with RSL3 treatment, expression of these ferroptosis linked proteins were generally upregulated upon TSC2-deficiency. Protein expression of HMOX1 and FSP1 was enhanced upon loss of TSC2 in both cells.
3.2. NRF2 Protects TSC2-Deficient Cells from Ferroptosis
Previous studies have suggested that loss of TSC2 elevates oxidative stress [28,29]. As homeostatic balance of oxidative stress is possibly modulated by the transcription factor NRF2 during induction of ferroptosis, we carried out DEG analyses of NRF2 target genes from Tsc2(−/−) compared to Tsc2(+/+) MEFs (Figure 3a) and TSC2-deficient and TSC2-restored AML cells (Figure 3b).
In both TSC cell line models, we observed an upregulation in the expression of NRF2 target genes upon TSC2 loss, highlighting that NRF2 is likely activated in these cells. In both cells, NRF2-target genes HMOX1, SLC7A11, SLC40A1, AIFM2, FTH1, FTL and SQSTM1 were upregulated. To examine NRF2 in the ELT3 cell line model of TSC, we examined NRF2 localisation in cells by confocal microscopy (Figure 3c). DAPI was employed as the nuclear counterstain. Secondary antibody control images, showing no background non-specific staining is shown in Supplementary Figure S1. NRF2 was predominately localised to the cytoplasm in untreated conditions, while RSL3 treatment resulted in the nuclear translocation of NRF2. Nuclear translocation of NRF2 was much more pronounced in Tsc2-deficient ELT3 cells (ELT3-V3), when compared to the wild-type Tsc2(+) controls (ELT3-T3). This higher level of nuclear staining of NRF2 upon RSL3 treatment in Tsc2-deficient ELT3 cells (ELT3-V3) is indicative of NRF2 activation.
In these TSC2-deficient cells, NRF2 could play a role in their resistance to ferroptosis. To explore this possibility, we used a drug inhibitor of NRF2, ML385. Treatment of ML385 was compared in Tsc2(−/−) MEFs (Figure 3d) and TSC2(−) AML cells (Figure 3e) that were treated with RSL3 to induce ferroptosis. Cell viability assays were carried out using crystal violet. NRF2 inhibition was found to re-sensitised both TSC2-deficient cell lines to RSL3-induced cell death, where we found cell death at lower doses of RSL3 when combined with ML385. This data shows that NRF2 is involved in ferroptosis resistant in TSC2-deficient cells.
We next considered whether a transcriptional gene target of NRF2, AIFM2 was involved. AIFM2 encodes FSP1, a key anti-ferroptotic enzyme that functions independently of GPX4 to prevent lipid peroxidation. FSP1 localizes to the plasma membrane, where it reduces ubiquinone (CoQ10) to its antioxidant form, ubiquinol, thereby neutralizing LPOs and protecting cells from ferroptosis [30]. Previous studies have suggested that NRF2 activation upregulates FSP1 expression as part of its antioxidant response program [31]. Given our findings that NRF2 is activated in TSC2-deficient cells, we next explored whether FSP1 contributes to ferroptosis resistance. We utilised a FSP1 inhibitor (iFSP1), where we observed that iFSP1 treatment resensitised Tsc2(−/−) MEFs to RSL3 induced cell death in viability assays with crystal violet (Supplementary Figure S2). However, iFSP1 did not resensitise TSC2(−) AML cells to RSL3-induced cell death (supplementary Figure 2b), highlighting a difference in dependency of ferroptosis survival genes between cell line models. This data also indicates a role for NRF2 in promoting ferroptosis resistance also involves mechanisms that are not downstream of FSP1.
3.3. NRF2 Protects TSC2-Deficient Cells from Ferroptosis
We Our findings indicate that NRF2 and FSP1 can both contribute to ferroptosis resistance in TSC2-deficient cell line models. However, it remains unclear whether these targets linked to ferroptosis resistance are unique to TSC or whether this also extends to cancer. Many cancer types exhibit high levels of NRF2 expression or activity linked to redox homeostasis, is pro-tumorigenic and is linked to resistance [32,33]. Similarly, FSP1 functions as a major ferroptosis suppressor in cancer [34]. Ferroptosis was recently suggested as a potential therapeutic target in both ovarian [35] and breast cancers [36]. Therefore, we wanted to examine the dependency of FSP1 and NRF2 to resist ferroptosis in both ovarian and breast cancer cell lines.
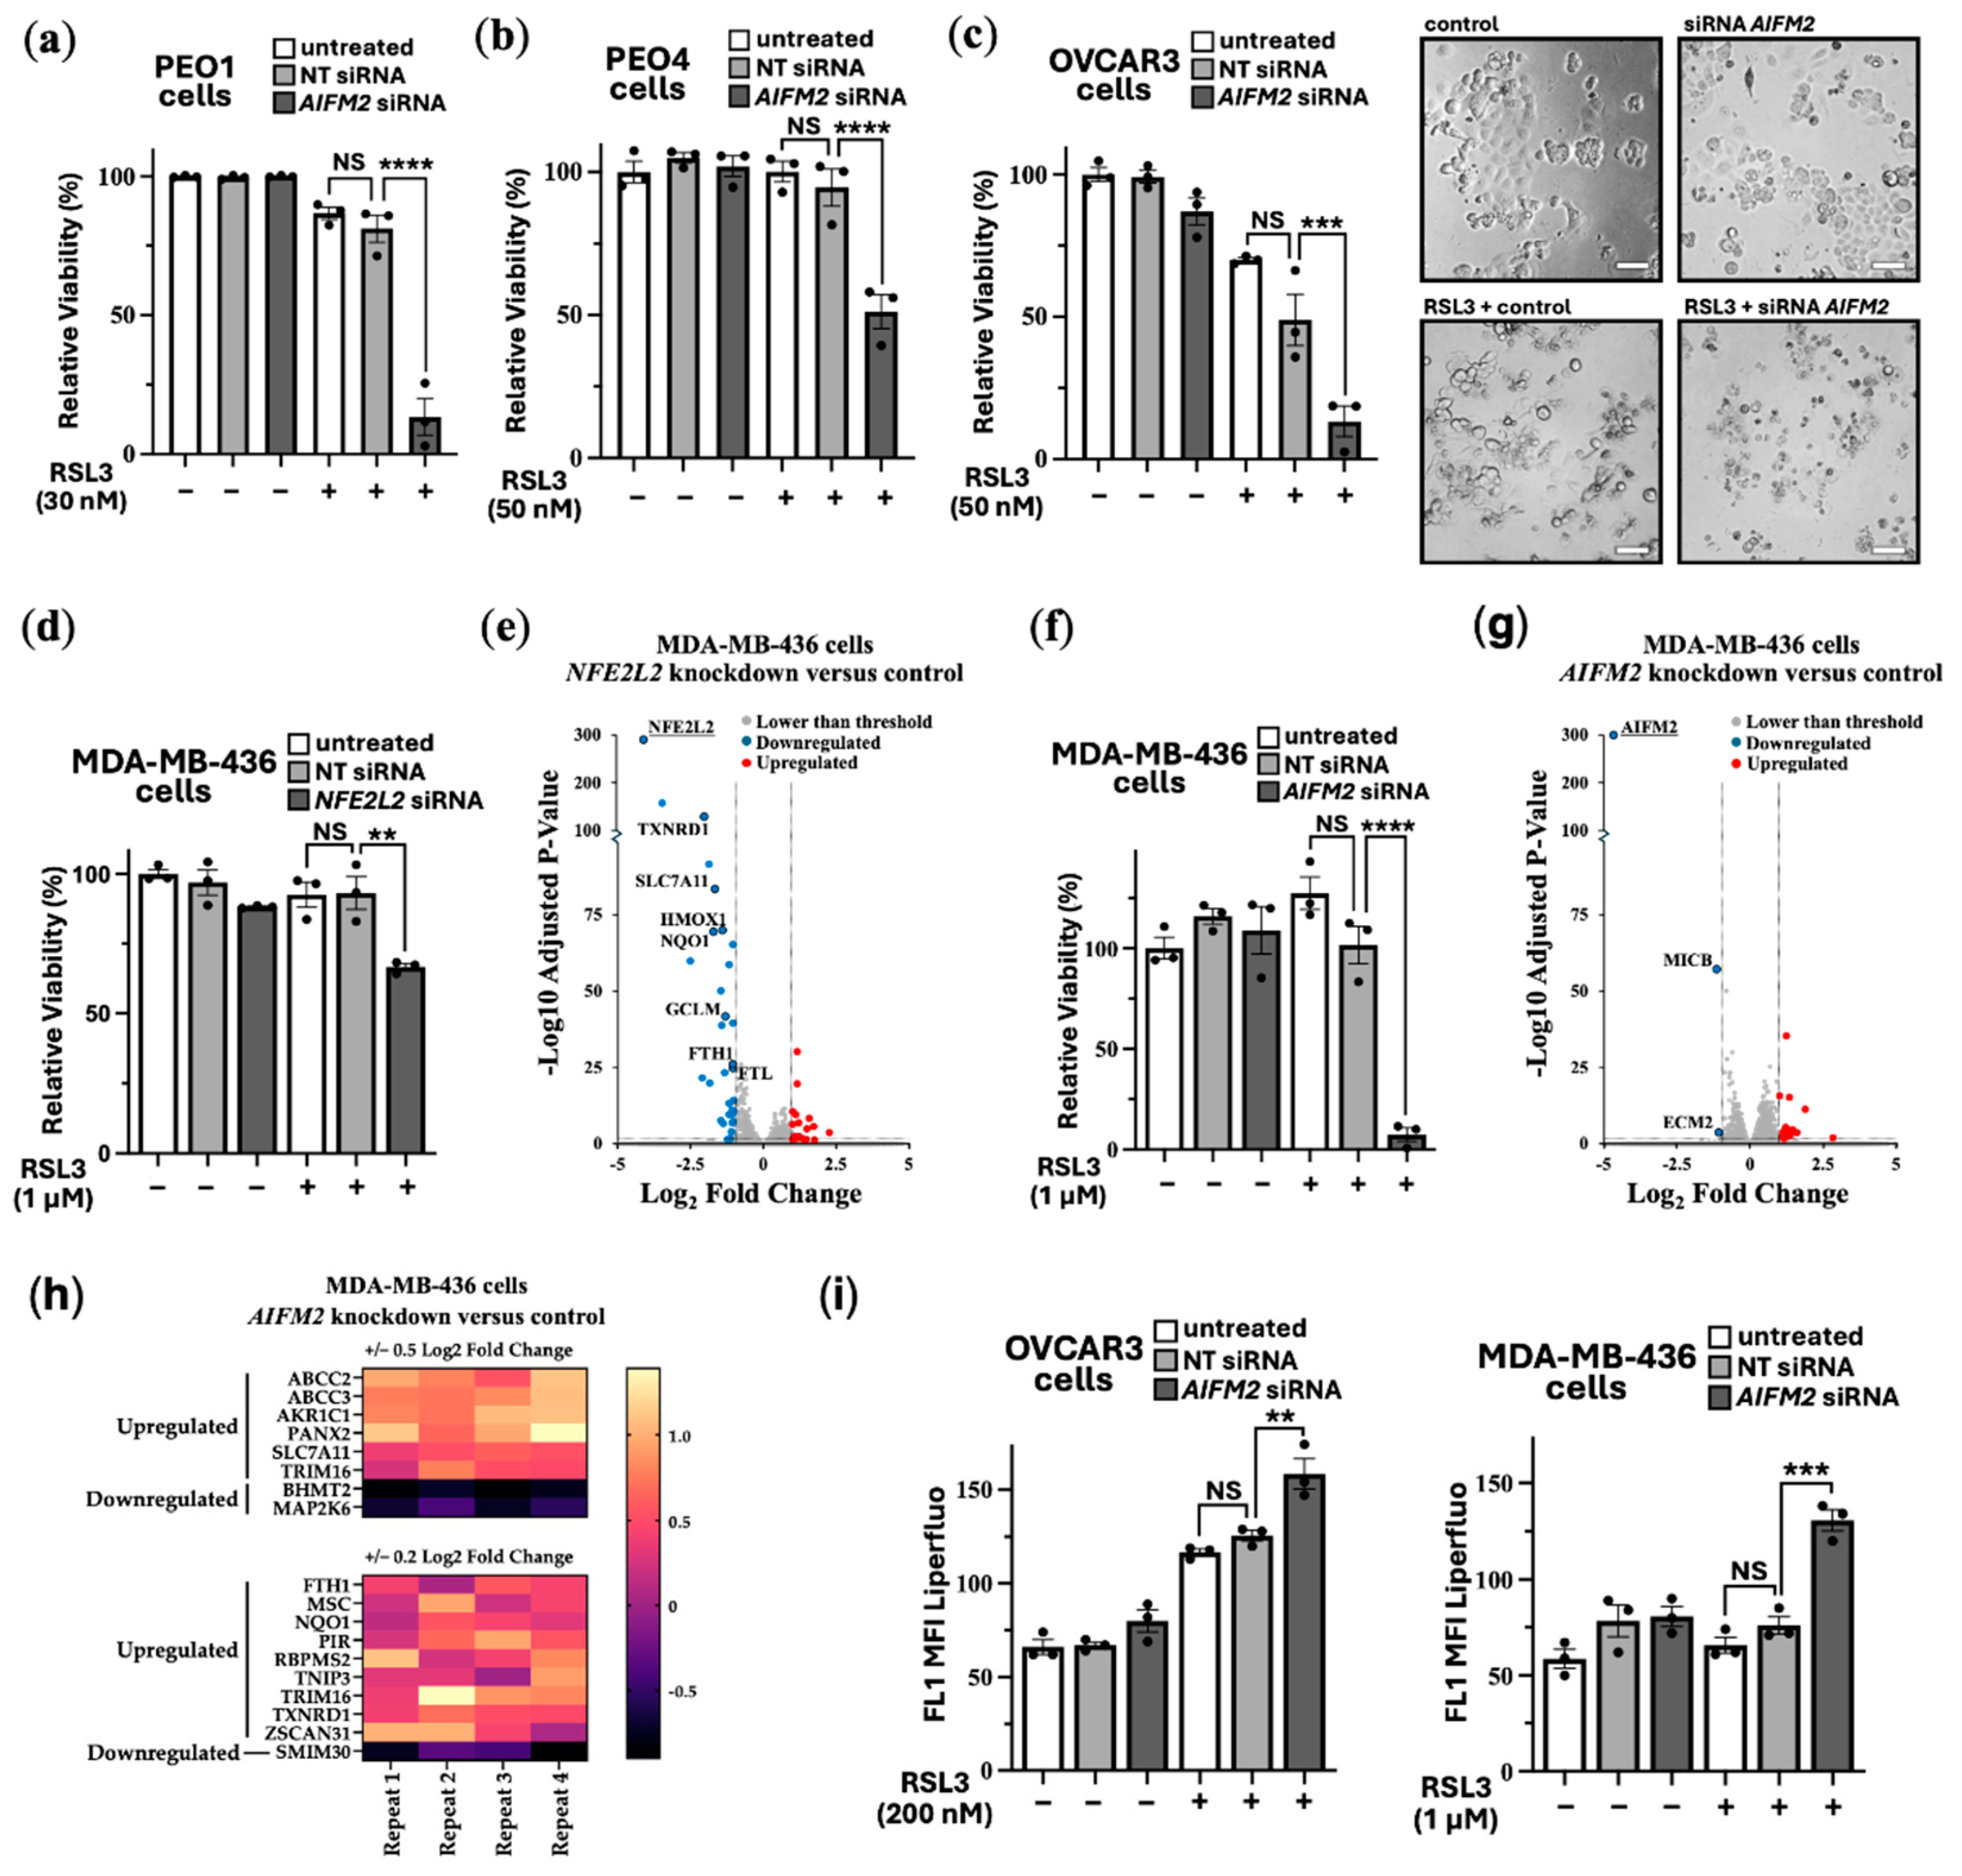
Instead of using iFSP1, we carried out siRNA knockdown of FSP1. Validation of effective FSP1 siRNA knockdown when compared to non-target siRNA control was determined by quantitative real-time PCR (RT-PCR). Supplementary Figure S3a and S3b show that FSP1 siRNA was effective to knockdown FSP1 expression in HEK293 and a panel of ovarian cancer cells (PEO1, PEO4 and OVCAR3). In PEO1, PEO4 and OVCAR3 cells a tolerable dose of RSL3 (30-50 nM) was used for each cell line. Cell viability assays were carried out to compare cells with and without FSP1 knockdown. FSP1 knockdown markedly sensitised these ovarian cell lines to RSL3-induced cell death (Figure 4a-c). Showing enhanced sensitivity, phase contrast images show that the OVCAR3 cells round up and shrink with FSP1 knockdown and RSL3 treatment. organization. environment. environment.
As a highly resistant cancer cell line to RSL3-induced ferroptosis, we examined MDA-MB-436 cells. These breast cancer cells were able to tolerate a high 1 μM dose of RSL3, showing no loss of cell viability (Figure 4d). We observed that targeting NRF2 for knockdown increased the level of RSL3 sensitivity in MDA-MB-436 cells by a moderate degree (where we observe a loss of ~30% cell viability). To examine how NRF2 might protect these cells against ferroptosis in more detail, we compared RNA sequencing data from NFE2L2 siRNA versus non-target siRNA. NRF2 knockdown caused 24 upregulated genes and 34 downregulated genes that were > and < than 2-fold (Figure 4e). DEG analysis indicated several key genes that are linked to ferroptosis survival. This included SLC7A11, the cysteine-glutamate antiporter, which would diminish the reduced form of glutathione, GSH, and would likely enhance sensitivity to ferroptosis. Other key targets that were downregulated upon NFR2 knockdown are annotated in the volcano plot and included TXNRD1, PIR, HMOX1, FTH1 and FTL. As expected NFE2L2 was markedly reduced in its expression, showing that NRF2 was effectively knocked down in this experiment. GO terms that correlated to these downregulated genes corresponded most strongly to “Negative Regulation of Ferroptosis”, and these specifically included NQO1, SLC7A11, HMOX1, and FTH1. Also included were “Response to Oxidative Stress”, “Intracellular Sequestering of Iron Ion”, and “Leukotriene Transport”, the latter of which relates to metabolism of polyunsaturated fatty acids (PUFAs), which are an essential initiating component of ferroptosis. The most strongly correlated GO pathway was “Ferroptosis”, which included the above-mentioned genes as well as AKR1C1 and GCLM. Within the upregulated genes after NRF2 knockdown there were no high match GO terms. There were three high match upregulated pathways which were focused around extracellular matrix organization.
Given that NRF2 knockdown only partially sensitised MDA-MB-436 to RSL3, we wanted to assess whether FSP1 knockdown might be more effective. Indeed, FSP1 knockdown caused loss of cell viability by >95% when also treated with RSL3 (Figure 4f).
To visualize the differences of ferroptosis induction, we carried out time-lapse videos of the MDA-MB-436 cells that were treated with RSL3 over a 18 h period (Video S1) and with RSL3 treatment after FSP1 knockdown (Video S2). This data indicates that FSP1 is critically involved in protecting these cells from ferroptosis, making it a promising therapeutic target for ferroptosis resistant cancer cells. We compared RNA sequencing data from AIFM2 versus non-target siRNA. AIFM2 expression was markedly reduced, showing that the AIFM2 siRNA was effective. FSP1 knockdown only resulted in a moderate change to their gene expression profile, causing a small number of genes to be changed in expression, i.e., 15 upregulated genes and 3 downregulated genes that had changed by −/+ 2-fold (Figure 4g). At reduced stringency with lower fold change, by cross-comparing NRF2-target genes that were downregulated after NRF2 knockdown and genes that were upregulated after FSP1 knockdown, it appears that FSP1 knockdown moderately enhanced NRF2-target gene expression (Figure 4h). This is likely a compensatory mechanism. 6 NRF2-target genes were identified using 0.5 Log2 Fold change analysis and 15 with lower stringency of 0.2 log2 fold change. Notably among them are the following NRF2-target genes: NQO1, FTH1, TXNRD1, SLC7A11, ABCC2 and ABCC3, indicating that loss of FSP1 causes an increase in NRF2 transcriptional products. Within that set NQO1, TXNRD1 and SLC7A11 are directly related to antioxidant response elements suggesting FSP1 loss is compensated by upregulating other antioxidant systems. Links to increased iron sequestration can be made through FTH1 suggesting that cells are reducing sources of oxidative stress. ABCC2 and ABCC3 can be linked to leukotriene transport meaning potential redistribution of PUFAs in the form of arachidonic acid. Possibly the higher increase in NRF2 transcriptional products could be through the upregulation of PANX2 (Pannexin 2) that occurs after FSP1 knockdown. PANX2 has been linked to upregulation of NRF2 by an undetermined mechanism in prostate cancer [37].
To confirm that loss of cell viability was through enhanced lipid peroxidation, we carried out LPO assays in both the OVCAR3 and MDA-MB-436 cell lines. These cell lines were examined as they show high sensitivity to RSL3 when combined with FSP1 knockdown. As expected, we observed a higher degree of lipid peroxidation upon FSP1 knockdown with RSL3 treatment (Figure 4i and overlay graphs are provided in Figure S3), highlighting the critical protective role that FSP1 plays to prevent the LPO buildup.
4. Discussion
Ferroptosis offers a potential alternative therapy that could be used independently or in combination with current treatments. It is an emerging iron-dependent form of cell death intrinsically linked to cancer metabolism and tumorigenesis. Iron-dependent metabolism provides cancer cells with a proliferative and survival advantage within the tumor microenvironment. Cancer cells often become hard-wired into non-aerobic glycolysis, utilizing ferroptosis pathways that generate higher levels of oxidative stress. This metabolic shift increases cancer dependency on specific ferroptosis survival pathways, enabling them to thrive in a metabolically challenging environment.
Elevated iron metabolism, along with increased oxidative stress could be a contributing factor to TSC pathology. The mTORC1 pathway stimulates lipid synthesis and incorporates PUFAs into cellular membranes [16], which serve as substrates for lipid peroxidation. This should make TSC2-deficient cells more susceptible to the accumulation of lipid peroxides and ferroptotic cell death. However, these cells appear to have adapted to higher levels of oxidative stress through elevated NRF2-mediated gene expression. mTORC1 is known to regulate the antioxidant defence system, which is crucial for counteracting oxidative stress-induced LPO. For example, mTORC1 promotes the release of NRF2 from its inhibitor KEAP1 (Kelch-like ECH-associated protein 1) by phosphorylating p62 (also known as sequestosome 1). This phosphorylation increases the affinity of p62 for KEAP1, leading to KEAP1 sequestration and subsequent NRF2 translocation into the nucleus [38]. NRF2 activation plays a crucial role in enhancing cellular resilience against oxidative damage and ferroptotic cell death [39]. p62 and NRF2 have previously been implicated in TSC model systems. Immunohistochemical analysis of SEGA tissue by Malik et al. [40] found increased expression of NRF2 target genes, GCLC, GCLM and HMOX1. Additionally, mTORC1 has been reported to regulate iron metabolism by modulating the expression of iron transport proteins, TFR and ferroportin, further increasing intracellular iron levels [41].
In addition to the clear links between mTORC1 hyperactivation and ferroptosis [14,15,16], iron metabolism and ferroptosis might be also connected to other pathological features of TSC, including signal transducer and activator of transcription 3 (STAT3) and hypoxia-inducible factor 1α (HIF-1α). We recently revealed that both redox-sensitive transcription factors, STAT3 and HIF-1α, were dependent on redox factor-1 (REF-1, also known as APEX1) [42]. We showed that REF-1 inhibition was sufficient to block the pathologically high levels of STAT3 and HIF-1α transcription in TSC model cell lines. During oxidative stress, REF-1 is activated and binds to STAT3 and HIF-1α and subsequently reduces cysteine residues in the transcriptional activation domain to further promote their DNA binding and activity (reviewed in [43]). Of note, REF-1 is also an upstream activator of NRF2 via the same antioxidant signaling mechanism. This may explain why the activity of NRF2 within TSC2-deficient cell lines was found to be higher. The regulation of iron metabolism is complex with multiple mechanisms and involves not just NRF2, but also STAT3 and HIF-1α. For instance, in colon and lung cancer cell lines, STAT3 was found to be upregulated by iron-dependent activation of cyclin-dependent kinase 1 [44,45]. Furthermore, STAT3 promotes the gene expression of GPX4, a key factor in ferroptosis resistance [46]. HIF-1α is also a central player in the regulation of iron uptake and metabolism (reviewed in [47]). Consequently, the increased ferroptosis resistance and elevated iron metabolism observed in TSC2-deficient cells is likely linked to aberrant activity of NRF2, STAT3 and HIF-1α that work together when oxidative stress is elevated to cause TSC pathology [42].
Our research has demonstrated that TSC2-deficient cells and various cancer cells exhibit variability in their ferroptosis resistance mechanisms. Cancer cells exploit the advantages of iron-dependent metabolism to support their survival. Ferroptosis resistance appears to be primarily driven by three main mechanisms: NRF2, FSP1 and the GPX4/glutathione system (reviewed in [4]). FSP1 plays a principal role to reverse LPO within plasma membranes. The primary function of FSP1 is to reduce CoQ10 to ubiquinol (CoQ10H2). Ubiquinol then scavenges phospholipid peroxyl radicals, suppressing the propagation of phospholipid peroxidation and ferroptosis [30]. We observed that knockdown of FSP1 changed the transcriptome profile of MDA-MB-436 cells by a moderate degree, implying that drug therapies to inhibit FSP1 might not dramatically alter gene expression. Minimal global transcriptional effect after FSP1 inhibition might be beneficial in treatment, i.e., is an indicator that side effects and toxicity to non-cancerous cells might only be minimal. However, we did see a modest increase in the expression of several NRF2-target genes upon FSP1 knockdown, which is presumably a compensatory survival mechanism to protect these cells from rising levels of LPO.
As expected, NRF2 knockdown had a greater effect on MDA-MB-436 cells to alter gene expression. A reduction of multiple anti-ferroptosis genes were observed. Perhaps among the most relevant of these were SLC7A11, NQO1, TXNRD1, GCLM, and AKR1C1. SLC7A11 is responsible for importing cystine which is an essential precursor for glutathione, which in turn is used by GPX4 to reduce harmful ferroptosis-inducing lipid peroxide species. The protein of TXNRD1 has also recently been identified as an off-target effect of RSL3. Taken together, this would suggest that NFE2L2 knockdown may have a similar effect to drug inhibition with RSL3. Furthermore, FTH1 downregulation may result in higher pools of intracellular labile iron, thus promoting ferroptosis. By targeting NRF2, tumors may be sensitized to chemotherapeutics [48]. GCLM is involved in glutathione synthesis and is therefore essential for proper GPX4 function and likely plays a role in cisplatin resistance in lung cancers [49]. NQO1 functions to regenerate antioxidants like vitamin E and ubiquinone in a similar manner to FSP1. As NQO1 and FSP1 are both involved in the regeneration of ubiquinone, which in turn is used to remove lipid peroxyl radicals from the ferroptosis propagation reaction, this may suggest variable dependency on these two enzymes (as well as other quinone-regenerating antioxidant enzymes). Different tumor types may rely primarily on NQO1 or FSP1, conferring enhanced targeting efficacies of NRF2 or FSP1, respectively. This may relate to the observed differential dependencies on either NRF2 or FSP1 for ferroptosis resistance within our TSC and cancer cell models. NQO1 may therefore be a potential target for promoting ferroptosis in tumors, and like FSP1, may have a lower global transcriptional effect than the targeting of NRF2.
While FSP1 is considered to be downstream of NRF2. However, we observed that NRF2 knockdown only marginally reduced AIFM2 expression, which was a similar finding to a related study [50]. This indicates that dysregulated FSP1 expression in TSC tumours is driven by NRF2-independent mechanisms. This finding indicates that targeted therapies aimed at overcoming ferroptosis resistance might benefit from stratification according to cancer type and expression of key pro- and anti-ferroptosis genes. This is an important point to consider when designing an effective therapeutic strategy to promote ferroptosis in cancer.
5. Conclusions
Our work reveals that NRF2 and FSP1 are involved in ferroptosis resistance in TSC2-deficient and ovarian and breast cancer cells. We show differential efficacy when blocking these pathways to enhance sensitivity to ferroptosis. This highlights that patient stratification may be necessary for optimal therapeutic strategies when targeting either NRF2 or FSP1. Future work on ferroptosis resistance mechanisms will be required to advance new therapeutic strategies for hard-to-treat cancers that show resistance to traditionally used anti-cancer drugs.
Supplementary Materials
The following supporting information can be downloaded at: Preprints.org, Figure S1: Immunofluorescence of ELT3 cells with 2o antibody & DAPI only; Figure S2: Cell viability assays with crystal violet of TSC model cell lines after iFSP1 and RSL3 treatment; Figure S3: Overlay graph of fluorescently labelled marker of lipid peroxidation in cancer cell lines after AIFM2 siRNA knockdown and RSL3 treatment; Supplementary uncropped blots: Figure 2C and 2D; Table S1: RNAseq ferroptosis & NRF2 genes TSC2(−) vs TSC2(+) AML cells; Table S2: RNAseq MDA-MB-436 cells with NRF2 knockdown; Table S3: MDA-MB-436 cells with FSP1 knockdown; Video S1: 24 h timelapse, RSL3 treated MDA-MB-436 cells; Video S2: 24 h timelapse, RSL3 treated MDA-MB-436 cells after FSP1 knockdown.
Author Contributions
Conceptualization, T.T., D.K.M., D.M.D. and A.R.T.; methodology, T.T., D.K.M, J.D.C., B.L.C, D.W.S. and A.R.T.; validation, D.K.M. and A.R.T.; formal analysis, T.T., D.K.M., M.A.M.A., M.H., A.F. and A.R.T.; investigation, T.T., D.K.M, M.A.M.A, M.H., A.F., B.L.C. and A.R.T.; resources, D.W.S., J.G.C., J.C.M, D.W.S., S.F.H, R.S.C. and A.R.T.; data curation, T.T., D.K.M., J.D.C., M.A.M.A., M.H., A.F. and A.R.T.; writing—original draft preparation, T.T., D.K.M, J.D.C. and A.R.T.; writing—review and editing, T.T., D.K.M., A.F., D.W.S., S.F.H., R.S.C., D.M.D. and A.R.T.; supervision, D.K.M., J.D.C., B.L.C., D.W.S., S.F.H., R.S.C., D.M.D. and A.R.T.; project administration, S.F.H., R.S.C., D.M.D. and A.R.T.; funding acquisition, J.G.C., J.C.M., S.F.H., R.S.C., D.M.D. and A.R.T. All authors have read and agreed to the published version of the manuscript.
Funding
This research was funded by Welsh Government’s European Social Fund (ESF) convergence programme for West Wales and the Valleys KESS II and BCUHB to T.T., S.F.H., R.S.C., D.M.D., and A.R.T.; Cancer Research Wales PhD studentship, grant number 2504 to D.K.M., D.M.D. and A.R.T.; Cancer Research Wales Fellowship, grant number 2527 to D.K.M., J.G.C., J.C.M., D.M.D. and A.R.T.; Tuberous Sclerosis Association, grant number 2018-S04 to J.D.C., D.M.D., and A.R.T.; King Fahd Security College/Ministry of Interior/Saudi Arabia, grant number 1050795978 to M.A.M.A. and A.R.T.; and Health and Care Research Wales (Wales Gene Park), grant number R21CA263133 to A.R.T.
Institutional Review Board Statement
Not applicable.
Data Availability Statement
All datasets generated or analyzed during this study are either included in this article or supplementary files. The data analyzed during the current study are available from the corresponding author upon reasonable request.
Acknowledgments
We acknowledge our colleagues at Wales Gene Park for their expertise and bioinformatic support. Wales Gene Park is an infrastructure support group funded by Welsh Government by Health and Care Research Wales.
Conflicts of Interest
The authors declare no conflicts of interest. The funders had no role in the design of the study; in the collection, analyses, or interpretation of data; in the writing of the manuscript; or in the decision to publish the results.
Abbreviations
The following abbreviations are used in this manuscript:
| AIFM2 | AIF family member 2 |
| AML | Angiomyolipoma |
| BCUHB | Betsi Cadwaladr University Health Board |
| CoQ10 | Ubiquinone |
| CoQ10H2 | Ubiquinol |
| DEG | Differential expressed gene |
| DMEM | Dulbecco’s modified Eagle’s medium |
| FBS | Fetal bovine serum |
| FSP1 | Ferroptosis suppressor protein 1 |
| GO | Gene Ontology |
| GPX4 | Glutathione peroxidase 4 |
| GSH | Glutathione |
| HMOX1 | Heme oxygenase 1 |
| HIF-1α | Hypoxia-inducible factor 1α |
| KEAP1 | Kelch-like ECH-associated protein 1 |
| LPO | Lipid peroxidation |
| MEF | Mouse embryonic fibroblasts |
| NFE2L2 | Nuclear factor E2 related factor 2 |
| PBS | Phosphate buffered saline |
| PUFAs | Polyunsaturated fatty acids |
| REF-1 | Redox factor-1 |
| RSL3 | RAS-selective lethal |
| RT-PCR | Real-time PCR |
| SLC7A11 | SLC7A11 Solute carrier family 7 member 11 |
| STAT3 | Signal transducer and activator of transcription 3 |
| TFR | Transferrin receptor |
| TSC2 | Tuberous Sclerosis Complex |
References
- Lee, E.; Song, C.H.; Bae, S.J.; Ha, K.T.; Karki, R. Regulated cell death pathways and their roles in homeostasis, infection, inflammation, and tumorigenesis. Exp Mol Med. 2023, 55, 1632–1643. [Google Scholar] [CrossRef]
- Dixon, S.J.; Lemberg, K.M.; Lamprecht, M.R.; Skouta, R.; Zaitsev, E.M.; Gleason, C.E.; Patel, D.N.; Bauer, A.J.; Cantley, A.M.; Yang, W.S.; et al. Stockwell BR. Ferroptosis: an iron-dependent form of nonapoptotic cell death. Cell 2012, 149, 1060–1072. [Google Scholar] [CrossRef] [PubMed]
- Averill-Bates, D.A. The antioxidant glutathione. Vitam Horm. 2023, 121, 109–141. [Google Scholar] [CrossRef]
- Kuang, F.; Liu, J.; Tang, D.; Kang, R. Oxidative Damage and Antioxidant Defense in Ferroptosis. Front Cell Dev Biol. 2020, 8, 586578. [Google Scholar] [CrossRef] [PubMed]
- Shakya, A.; McKee, N.W.; Dodson, M.; Chapman, E.; Zhang, D.D. Anti-Ferroptotic Effects of Nrf2: Beyond the Antioxidant Response. Mol Cells. 2023, 46, 165–175. [Google Scholar] [CrossRef] [PubMed]
- Chiang, S.K.; Chen, S.E.; Chang, L.C. A Dual Role of Heme Oxygenase-1 in Cancer Cells. Int J Mol Sci. 2018, 20, 39. [Google Scholar] [CrossRef]
- Li, J.; Cao, F.; Yin, H.L.; Huang, Z.J.; Lin, Z.T.; Mao, N.; Sun, B.; Wang, G. Ferroptosis: past, present and future. Cell Death Dis. 2020, 11, 88. [Google Scholar] [CrossRef]
- Torti, S.V.; Torti, F.M. Iron and Cancer: 2020 Vision. Cancer Res. 2020, 80, 5435–5448. [Google Scholar] [CrossRef]
- Zhang, X.; Li, X.; Xia, R.; Zhang, H.S. Ferroptosis resistance in cancer: recent advances and future perspectives. Biochem Pharmacol. 2024, 219, 115933. [Google Scholar] [CrossRef]
- McEneaney, L.J.; Tee, A.R. Finding a cure for tuberous sclerosis complex: From genetics through to targeted drug therapies. In Advances in Genetics; Kumar, D., Ed.; Elsevier: New York, NY, USA, 2019; Volume 103, pp. 91–118. [Google Scholar] [CrossRef]
- Henske, E.P.; Jóźwiak, S.; Kingswood, J.C.; Sampson, J.R.; Thiele, E.A. Tuberous sclerosis complex. Nat Rev Dis Primers 2016, 2, 16035. [Google Scholar] [CrossRef]
- Tee, A.R.; Fingar, D.C.; Manning, B.D.; Kwiatkowski, D.J.; Cantley, L.C.; Blenis, J. Tuberous sclerosis complex-1 and -2 gene products function together to inhibit mammalian target of rapamycin (mTOR)-mediated downstream signaling. Proc Natl Acad Sci USA. 2002, 99, 13571–13576. [Google Scholar] [CrossRef] [PubMed]
- Tee, A.R.; Manning, B.D.; Roux, P.P.; Cantley, L.C.; Blenis, J. Tuberous Sclerosis Complex Gene Products, Tuberin and Hamartin, Control mTOR Signaling by Acting as a GTPase-Activating Protein Complex toward Rheb. Curr Biol. 2022, 32, 733–734. [Google Scholar] [CrossRef] [PubMed]
- Liu, Y.; Wang, Y.; Liu, J.; Kang, R.; Tang, D. Interplay between MTOR and GPX4 signaling modulates autophagy-dependent ferroptotic cancer cell death. Cancer Gene Ther. 2021, 28, 55–63. [Google Scholar] [CrossRef] [PubMed]
- Zhang, Y.; Swanda, R.V.; Nie, L.; Liu, X.; Wang, C.; Lee, H.; Lei, G.; Mao, C.; Koppula, P.; Cheng, W.; et al. mTORC1 couples cyst(e)ine availability with GPX4 protein synthesis and ferroptosis regulation. Nat Commun. 2021, 12, 1589. [Google Scholar] [CrossRef]
- Yi, J.; Zhu, J.; Wu, J.; Thompson, C.B.; Jiang, X. Oncogenic activation of PI3K-AKT-mTOR signaling suppresses ferroptosis via SREBP-mediated lipogenesis. Proc Natl Acad Sci USA. 2020, 117, 31189–31197. [Google Scholar] [CrossRef]
- Armenta, D.A.; Laqtom, N.N.; Alchemy, G.; Dong, W.; Morrow, D.; Poltorack, C.D.; Nathanson, D.A.; Abu-Remalieh, M.; Dixon, S.J. Ferroptosis inhibition by lysosome-dependent catabolism of extracellular protein. Cell Chem Biol. 2022, 29, 1588–1600.e7. [Google Scholar] [CrossRef]
- Zhang, H.; Cicchetti, G.; Onda, H.; Koon, H.B.; Asrican, K.; Bajraszewski, N.; Vazquez, F.; Carpenter, C.L.; Kwiatkowski, D.J. Loss of Tsc1/Tsc2 activates mTOR and disrupts PI3K-Akt signaling through downregulation of PDGFR. J Clin Invest. 2003, 112, 1223–1233. [Google Scholar] [CrossRef]
- Astrinidis, A.; Cash, T.P.; Hunter, D.S.; Walker, C.L.; Chernoff, J.; Henske, E.P. Tuberin, the tuberous sclerosis complex 2 tumor suppressor gene product, regulates Rho activation, cell adhesion and migration. Oncogene. 2002, 21, 8470–8476. [Google Scholar] [CrossRef]
- Yu, J.; Astrinidis, A.; Howard, S.; Henske, E.P. Estradiol and tamoxifen stimulate LAM-associated angiomyolipoma cell growth and activate both genomic and nongenomic signaling pathways. Am. J. Physiol. Lung Cell Mol. Physiol. 2004, 286, L694–L700. [Google Scholar] [CrossRef]
- Ma, Q. Role of nrf2 in oxidative stress and toxicity. Annu Rev Pharmacol Toxicol. 2013, 53, 401–426. [Google Scholar] [CrossRef]
- Johnson, C.E.; Dunlop, E.A.; Seifan, S.; McCann, H.D.; Hay, T.; Parfitt, G.J.; Jones, A.T.; Giles, P.J.; Shen, M.H.; Sampson, J.R.; et al. Loss of tuberous sclerosis complex 2 sensitizes tumors to nelfinavir-bortezomib therapy to intensify endoplasmic reticulum stress-induced cell death. Oncogene 2018, 37, 5913–5925. [Google Scholar] [CrossRef] [PubMed]
- Dunlop, E.A.; Hunt, D.; Acosta-Jaquez, H.A.; Fingar, D.C.; Tee, A.R. ULK1 inhibits mTORC1 signaling, promotes multisite Raptor phosphorylation and hinders substrate binding. Autophagy. 2011, 7, 737–747. [Google Scholar] [CrossRef]
- Hou, M.J.; Huang, X.; Zhu, B.T. Mechanism of RSL3-induced ferroptotic cell death in HT22 cells: crucial role of protein disulfide isomerase. Acta Bioch Bioph Sin 2024, 15. [Google Scholar] [CrossRef] [PubMed]
- Sun, S.; Shen, J.; Jiang, J.; Wang, F.; Min, J. Targeting ferroptosis opens new avenues for the development of novel therapeutics. Signal Transduct Target Ther. 2023, 8, 372. [Google Scholar] [CrossRef] [PubMed]
- Yuk, H.; Abdullah, M.; Kim, D. H.; Lee, H.; and Lee, S. J. Necrostatin-1 prevents Ferroptosis in a Ripk1- and Ido-independent manner in hepatocellular carcinoma. Antioxidants 2021, 10, 1374. [Google Scholar] [CrossRef]
- Stockwell, B.R.; Friedmann Angeli, J.P.; Bayir, H.; Bush, A.I.; Conrad, M.; Dixon, S.J.; Fulda, S.; Gascón, S.; Hatzios, S.K.; Kagan, V.E.; et al. Ferroptosis: A regulated cell death nexus linking metabolism, redox biology, and disease. Cell 2017, 171, 273–285. [Google Scholar] [CrossRef]
- Chen, C.; Liu, Y.; Liu, R.; Ikenoue, T.; Guan, K.L.; Liu, Y.; Zheng, P. TSC-mTOR maintains quiescence and function of hematopoietic stem cells by repressing mitochondrial biogenesis and reactive oxygen species. J Exp Med. 2008, 205, 2397–2408. [Google Scholar] [CrossRef]
- Di Nardo, A.; Kramvis, I.; Cho, N.; Sadowski, A.; Meikle, L.; Kwiatkowski, D.J.; Sahin, M. Tuberous sclerosis complex activity is required to control neuronal stress responses in an mTOR-dependent manner. J Neurosci. 2009, 29, 5926–5937. [Google Scholar] [CrossRef]
- Bersuker, K.; Hendricks, J.M.; Li, Z.; Magtanong, L.; Ford, B.; Tang, P.H.; Roberts, M.A.; Tong, B.; Maimone, T.J.; Zoncu, R.; et al. The CoQ oxidoreductase FSP1 acts parallel to GPX4 to inhibit ferroptosis. Nature 2019, 575, 688–692. [Google Scholar] [CrossRef]
- Emmanuel, N.; Li, H.; Chen, J.; Zhang, Y. FSP1, a novel KEAP1/NRF2 target gene regulating ferroptosis and radioresistance in lung cancers. Oncotarget 2022, 13, 1136–1139. [Google Scholar] [CrossRef]
- DeNicola, G.M.; Karreth, F.A.; Humpton, T.J.; Gopinathan, A.; Wei, C.; Frese, K.; Mangal, D.; Yu, K.H.; Yeo, C.J.; Calhoun, E.S.; et al. Oncogene-induced Nrf2 transcription promotes ROS detoxification and tumorigenesis. Nature 2011, 475, 106–109. [Google Scholar] [CrossRef] [PubMed]
- Hayes, J.D.; McMahon, M. NRF2 and KEAP1 mutations: permanent activation of an adaptive response in cancer. Trends Biochem Sci. 2009, 34, 176–188. [Google Scholar] [CrossRef] [PubMed]
- Li, W.; Liang, L.; Liu, S.; Yi, H.; Zhou, Y. FSP1: a key regulator of ferroptosis. Trends Mol Med. 2023, 29, 753–764. [Google Scholar] [CrossRef] [PubMed]
- Li, L.; Qiu, C.; Hou, M.; Wang, X.; Huang, C.; Zou, J.; Liu, T.; Qu, J. Ferroptosis in Ovarian Cancer: A Novel Therapeutic Strategy. Front Oncol. 2021, 11, 665945. [Google Scholar] [CrossRef]
- Liu, Y.; Hu, Y.; Jiang, Y.; Bu, J.; Gu, X. Targeting ferroptosis, the achilles' heel of breast cancer: A review. Front Pharmacol. 2022, 13, 1036140. [Google Scholar] [CrossRef]
- Liao, D.; Yang, G.; Yang, Y.; Tang, X.; Huang, H.; Shao, J.; Pan, Q. Identification of Pannexin 2 as a Novel Marker Correlating with Ferroptosis and Malignant Phenotypes of Prostate Cancer Cells. Onco Targets Ther. 2020, 13, 4411–4421. [Google Scholar] [CrossRef]
- Ichimura, Y.; Waguri, S.; Sou, Y.S.; Kageyama, S.; Hasegawa, J.; Ishimura, R.; Saito, T.; Yang, Y.; Kouno, T.; Fukutomi, T.; et al. Phosphorylation of p62 activates the Keap1-Nrf2 pathway during selective autophagy. Mol Cell 2013, 51, 618–631. [Google Scholar] [CrossRef]
- Anandhan, A.; Dodson, M.; Shakya, A.; Chen, J.; Liu, P.; Wei, Y.; Tan, H.; Wang, Q.; Jiang, Z.; Yang, K.; et al. NRF2 controls iron homeostasis and ferroptosis through HERC2 and VAMP8. Sci Adv. 2023, 9, eade9585. [Google Scholar] [CrossRef]
- Malik, A.R.; Liszewska, E.; Skalecka, A.; Urbanska, M.; Iyer, A.M.; Swiech, L.J.; Perycz, M.; Parobczak, K.; Pietruszka, P.; Zarebska, M.M.; et al. Tuberous sclerosis complex neuropathology requires glutamate-cysteine ligase. Acta Neuropathol Commun. 2015, 3, 48. [Google Scholar] [CrossRef]
- Bayeva, M.; Khechaduri, A.; Puig, S.; Chang, H.C.; Patial, S.; Blackshear, P.J.; Ardehali, H. mTOR regulates cellular iron homeostasis through tristetraprolin. Cell Metab. 2012, 16, 645–657. [Google Scholar] [CrossRef]
- Champion, J.D.; Dodd, K.M.; Lam, H.C.; Alzahrani, M.A.M.; Seifan, S.; Rad, E.; Scourfield, D.O.; Fishel, M.L.; Calver, B.L.; Ager, A.; et al. Drug Inhibition of Redox Factor-1 Restores Hypoxia-Driven Changes in Tuberous Sclerosis Complex 2 Deficient Cells. Cancers 2022, 14, 6195. [Google Scholar] [CrossRef]
- Kelley, M.R.; Georgiadis, M.M.; Fishel, M.L. APE1/Ref-1 role in redox signaling: translational applications of targeting the redox function of the DNA repair/redox protein APE1/Ref-1. Curr Mol Pharmacol. 2012, 5, 36–53. [Google Scholar] [CrossRef]
- Xue, X.; Ramakrishnan, S.K.; Weisz, K.; Triner, D.; Xie, L.; Attili, D.; Pant, A.; Győrffy, B.; Zhan, M.; Carter-Su, C.; et al. Iron Uptake via DMT1 Integrates Cell Cycle with JAK-STAT3 Signaling to Promote Colorectal Tumorigenesis. Cell Metab. 2016, 24, 447–461. [Google Scholar] [CrossRef] [PubMed]
- Kuang, Y.; Guo, W.; Ling, J.; Xu, D.; Liao, Y.; Zhao, H.; Du, X.; Wang, H.; Xu, M.; Song, H.; et al. Iron-dependent CDK1 activity promotes lung carcinogenesis via activation of the GP130/STAT3 signaling pathway. Cell Death Dis. 2019, 10, 297. [Google Scholar] [CrossRef] [PubMed]
- Zhang, W.; Gong, M.; Zhang, W.; Mo, J.; Zhang, S.; Zhu, Z.; Wang, X.; Zhang, B.; Qian, W.; Wu, Z.; et al. Thiostrepton induces ferroptosis in pancreatic cancer cells through STAT3/GPX4 signalling. Cell Death Dis. 2022, 13, 630. [Google Scholar] [CrossRef]
- Peyssonnaux, C.; Nizet, V.; Johnson, R.S. Role of the hypoxia inducible factors HIF in iron metabolism. Cell Cycle 2008, 7, 28–32. [Google Scholar] [CrossRef] [PubMed]
- Xue, D.; Zhou, X.; Qiu, J. Emerging role of NRF2 in ROS-mediated tumor chemoresistance. Biomed Pharmacother. 2020, 131, 110676. [Google Scholar] [CrossRef] [PubMed]
- Fujimori, S.; Abe, Y.; Nishi, M.; Hamamoto, A.; Inoue, Y.; Ohnishi, Y.; Nishime, C.; Matsumoto, H.; Yamazaki, H.; et al. The subunits of glutamate cysteine ligase enhance cisplatin resistance in human non-small cell lung cancer xenografts in vivo. Int J Oncol. 2004, 25, 413–418. [Google Scholar] [CrossRef]
- Kim, J.W.; Kim, M.J.; Han, T.H.; Lee, J.Y.; Kim, S.; Kim, H.; Oh, K.J.; Kim, W.K.; Han, B.S.; Bae, K.H.; et al. FSP1 confers ferroptosis resistance in KEAP1 mutant non-small cell lung carcinoma in NRF2-dependent and -independent manner. Cell Death Dis. 2023, 14, 567. [Google Scholar] [CrossRef]
Figure 1.
TSC2-deficient cells are resistant to ferroptosis induction. TSC2-deficient cell line models: (a) Tsc2+/+ versus Tsc2–/– MEF and (b) ELT3-T3 (Tsc2+) versus ELT3-V3 (Tsc2–), were subjected to flow cytometry following DRAQ7 staining after being treated to either DMSO vehicle, RSL3 or erastin at the concentrations indicated for 24 h. DRAQ7 exclusion (gated region) represents the viable cell population, while positive DRAQ7 staining (outside gated region) indicates cell death (representative flow images are shown). Cell viability (%) is graphed (n=3). Relative viability (%) of (c) Tsc2+/+ MEFs and (d) TSC2(+) AML cells was determined by cell counting with crystal violet stain, where the cells were treated with either DMSO or RSL3 (100 or 200 nM, respectively) in the presence of either deferiprone (100 μM), ferrostatin-1 (10 μM), Z-VAD-FMK (10 μM) or necrostatin-1 (10 μM), as indicated, for 24 h (n=3). Phase contrast images of TSC2(+) AML cells at lower cell density were treated as above in panel D, to show morphological changes. Scale bar is 100 μm.
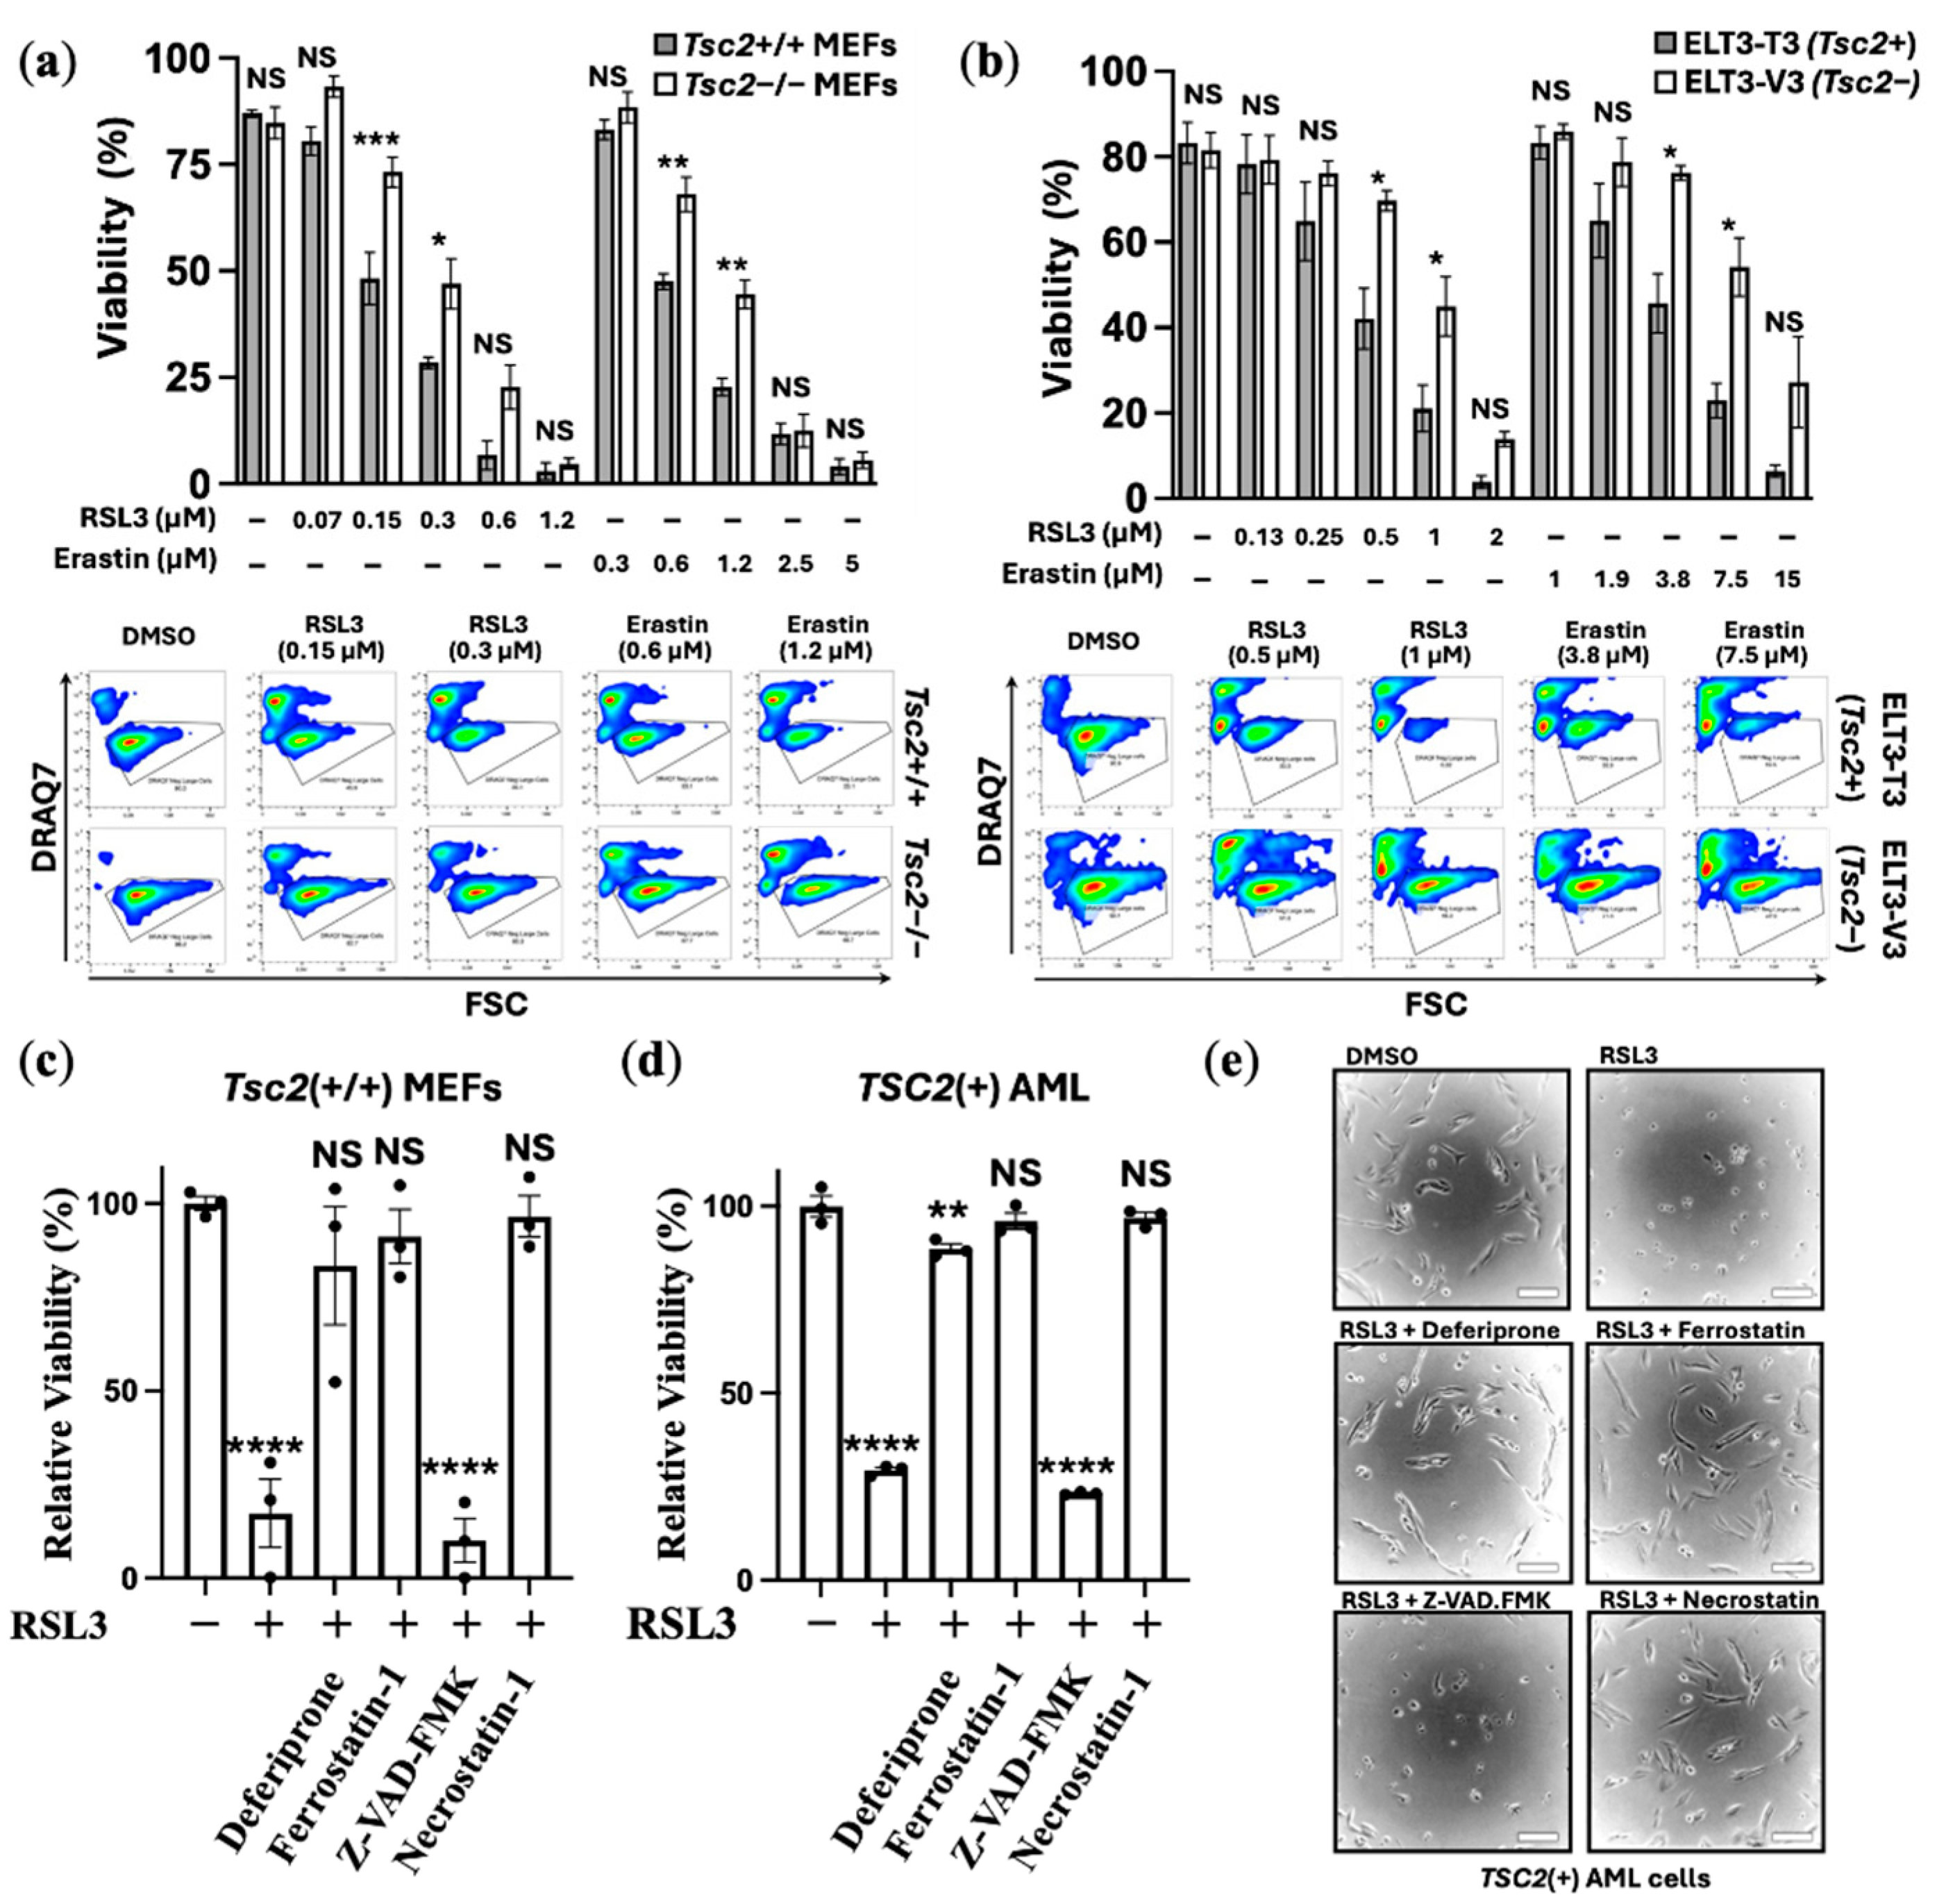
Figure 2.
TSC2-deficient cells show enhanced expression of genes linked to ferroptosis. Transcriptomic data comparing (a) Tsc2–/– versus Tsc2+/+ MEFs (n=3) and (b) TSC2(–) versus TSC2(+) (n=6), where ferroptosis-linked genes are shown in volcano plots. Thresholds were set at < and > 2-fold changes (for down- and up-regulated genes, respectively) with an adjusted p-value < 0.05. (c-d) Western blot analysis of ferroptosis associated proteins were also carried out on TFR, GPX4, HMOX1 and FSP1 in both TSC cell line models treated with either DMSO or 200 nM RSL3 for 4 h, as indicated (3 biological repeats of each shown). TSC2 and β-actin were analysed as controls.
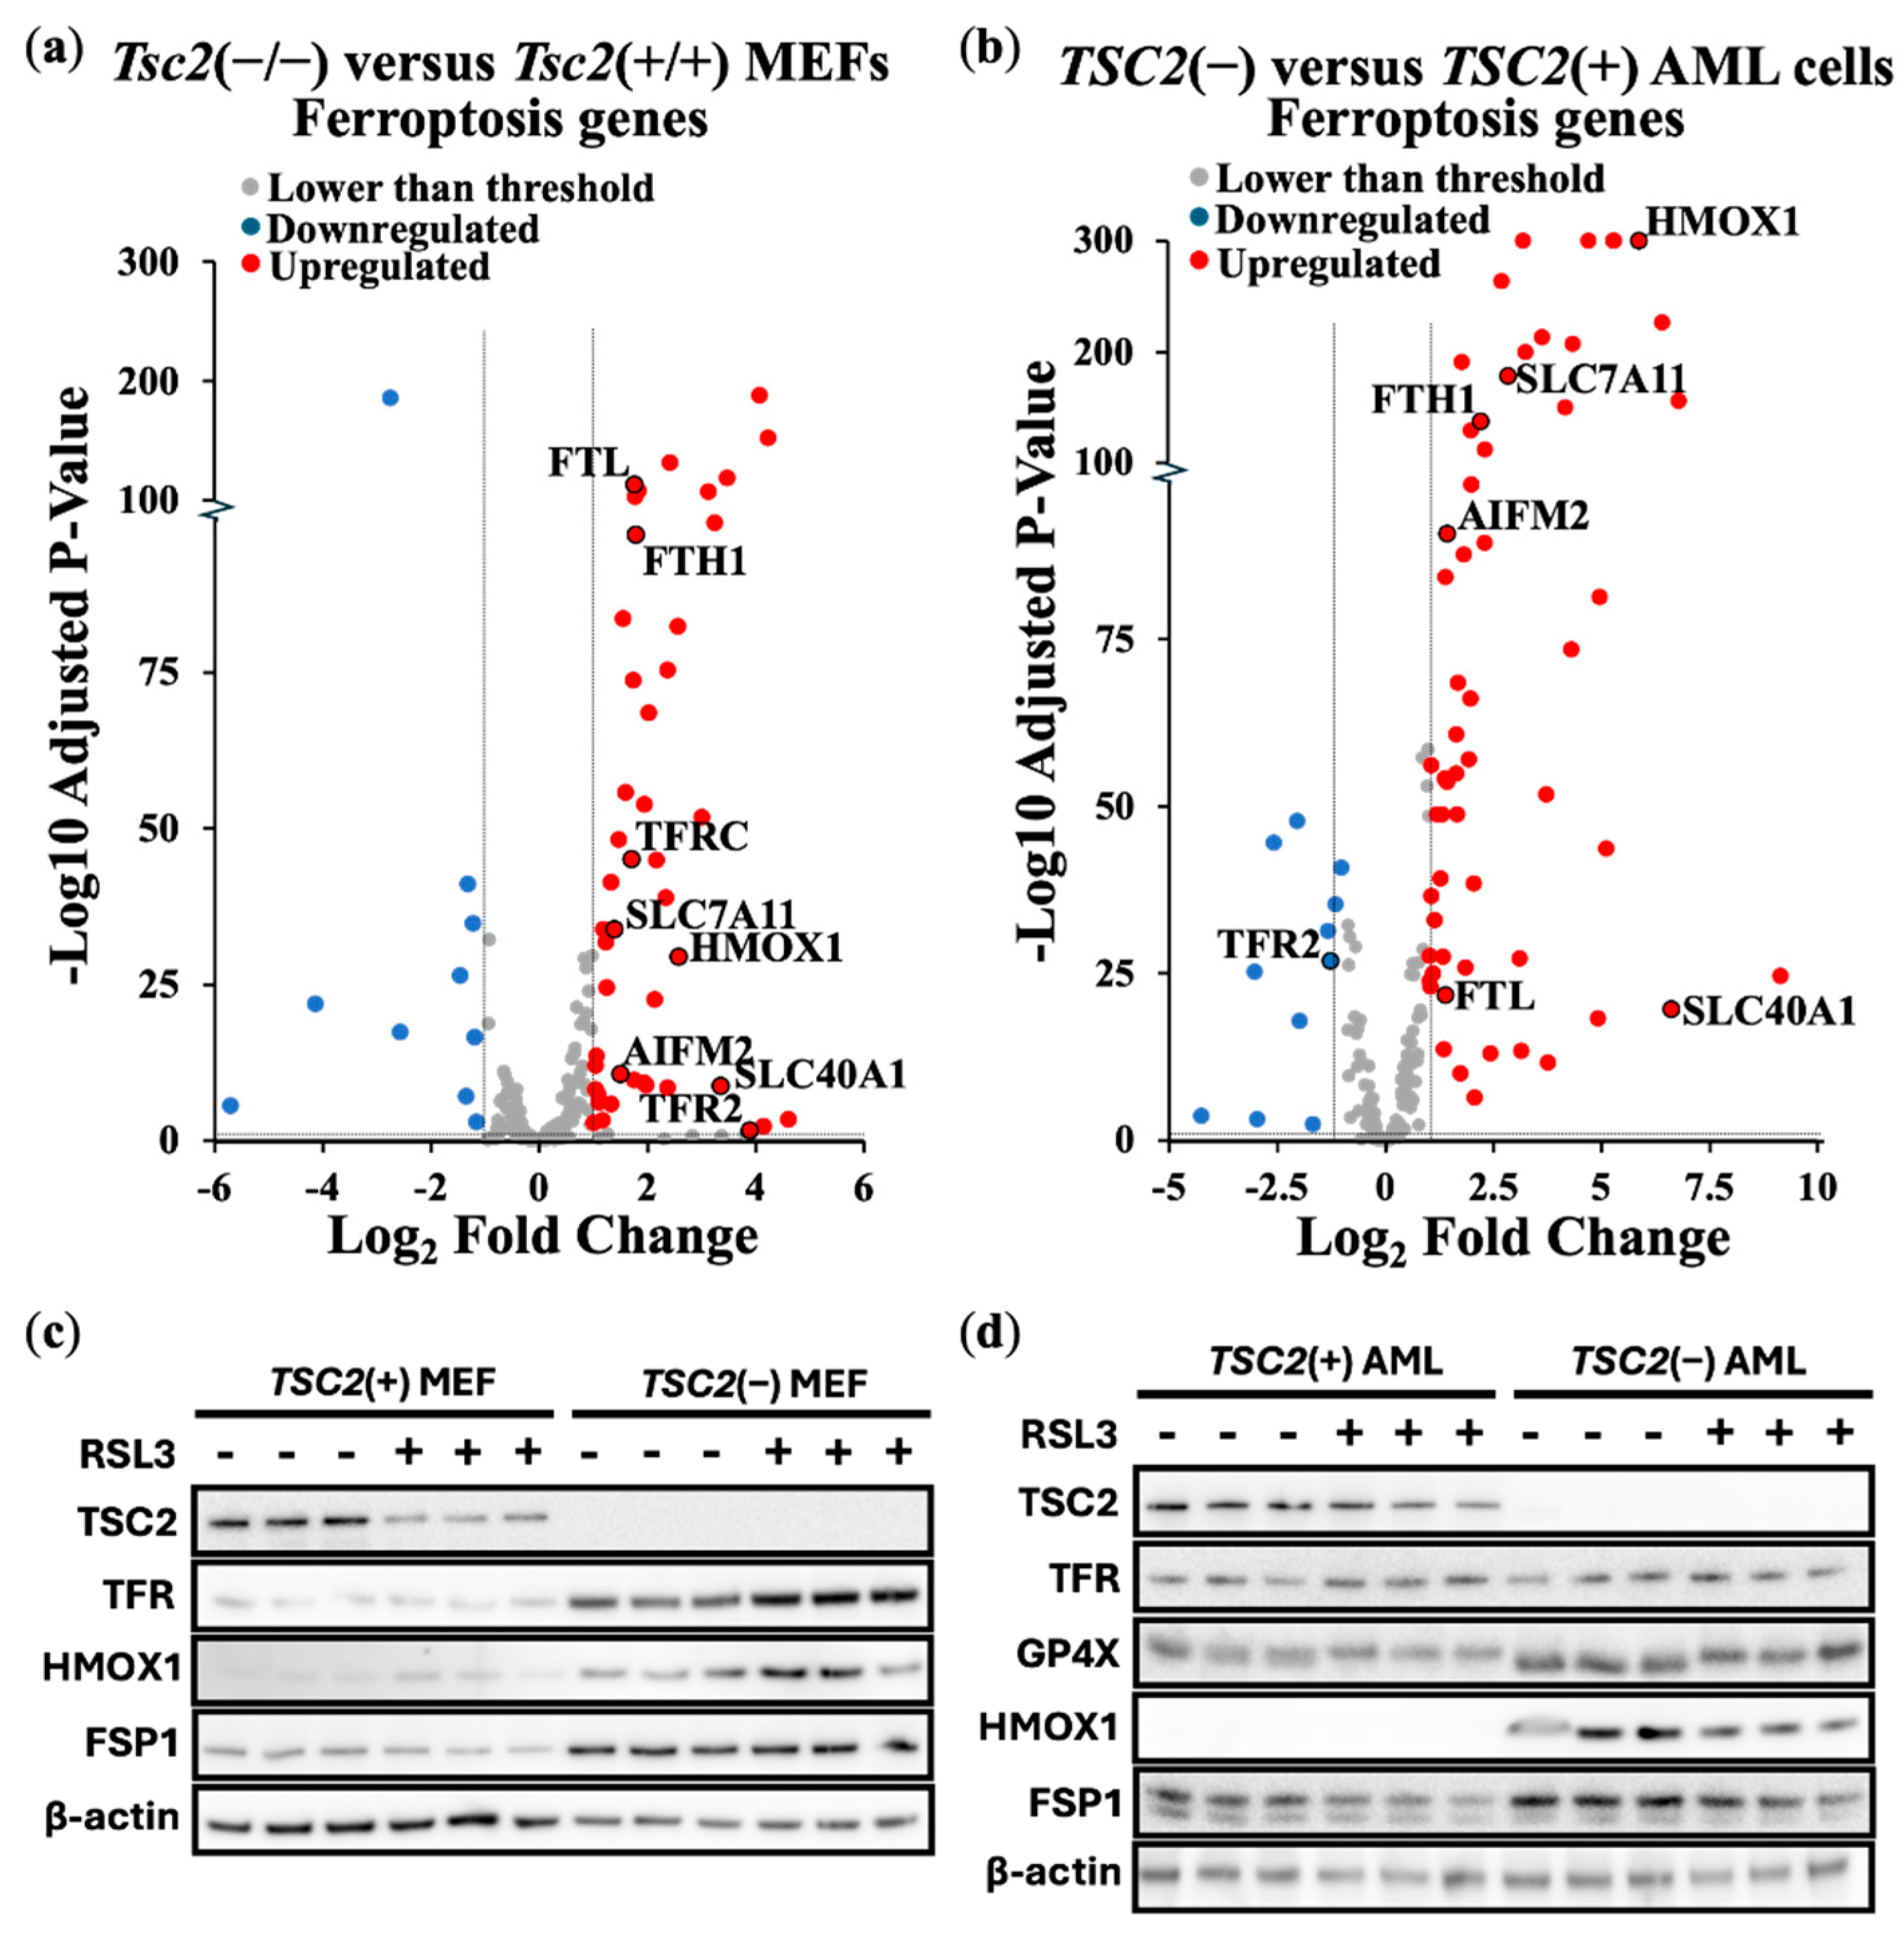
Figure 3.
NRF2 is upregulated and protects TSC2-deficient cells to ferroptosis. Transcriptomic data comparing (a) Tsc2–/– versus Tsc2+/+ MEFs (n=3) and (b) TSC2(–) versus TSC2(+) (n=6), where NRF2-linked genes are shown in volcano plots. Thresholds of < and > 2-fold changes and an adjusted p-value < 0.05 were set. (c) Confocal microscopy of ELT3-T3 (Tsc2+) and ELT3-V3 (Tsc2–) treated with either DMSO or RSL3 (6 h) was carried out using NRF2 antibodies (red) with nuclear counter stained with DAPI (blue). Both shown as ‘merge’, scale bar is 10 μm (n=3). Relative viability (%) of (d) Tsc2–/– MEFs and (e) TSC2(–) AML cells were assessed by cell counting in crystal violet assays. Cells were treated with either DMSO or RSL3 (25-400 nM) in the presence or absence of ML385 (5 μM), as indicated, for 24 h (n=3).
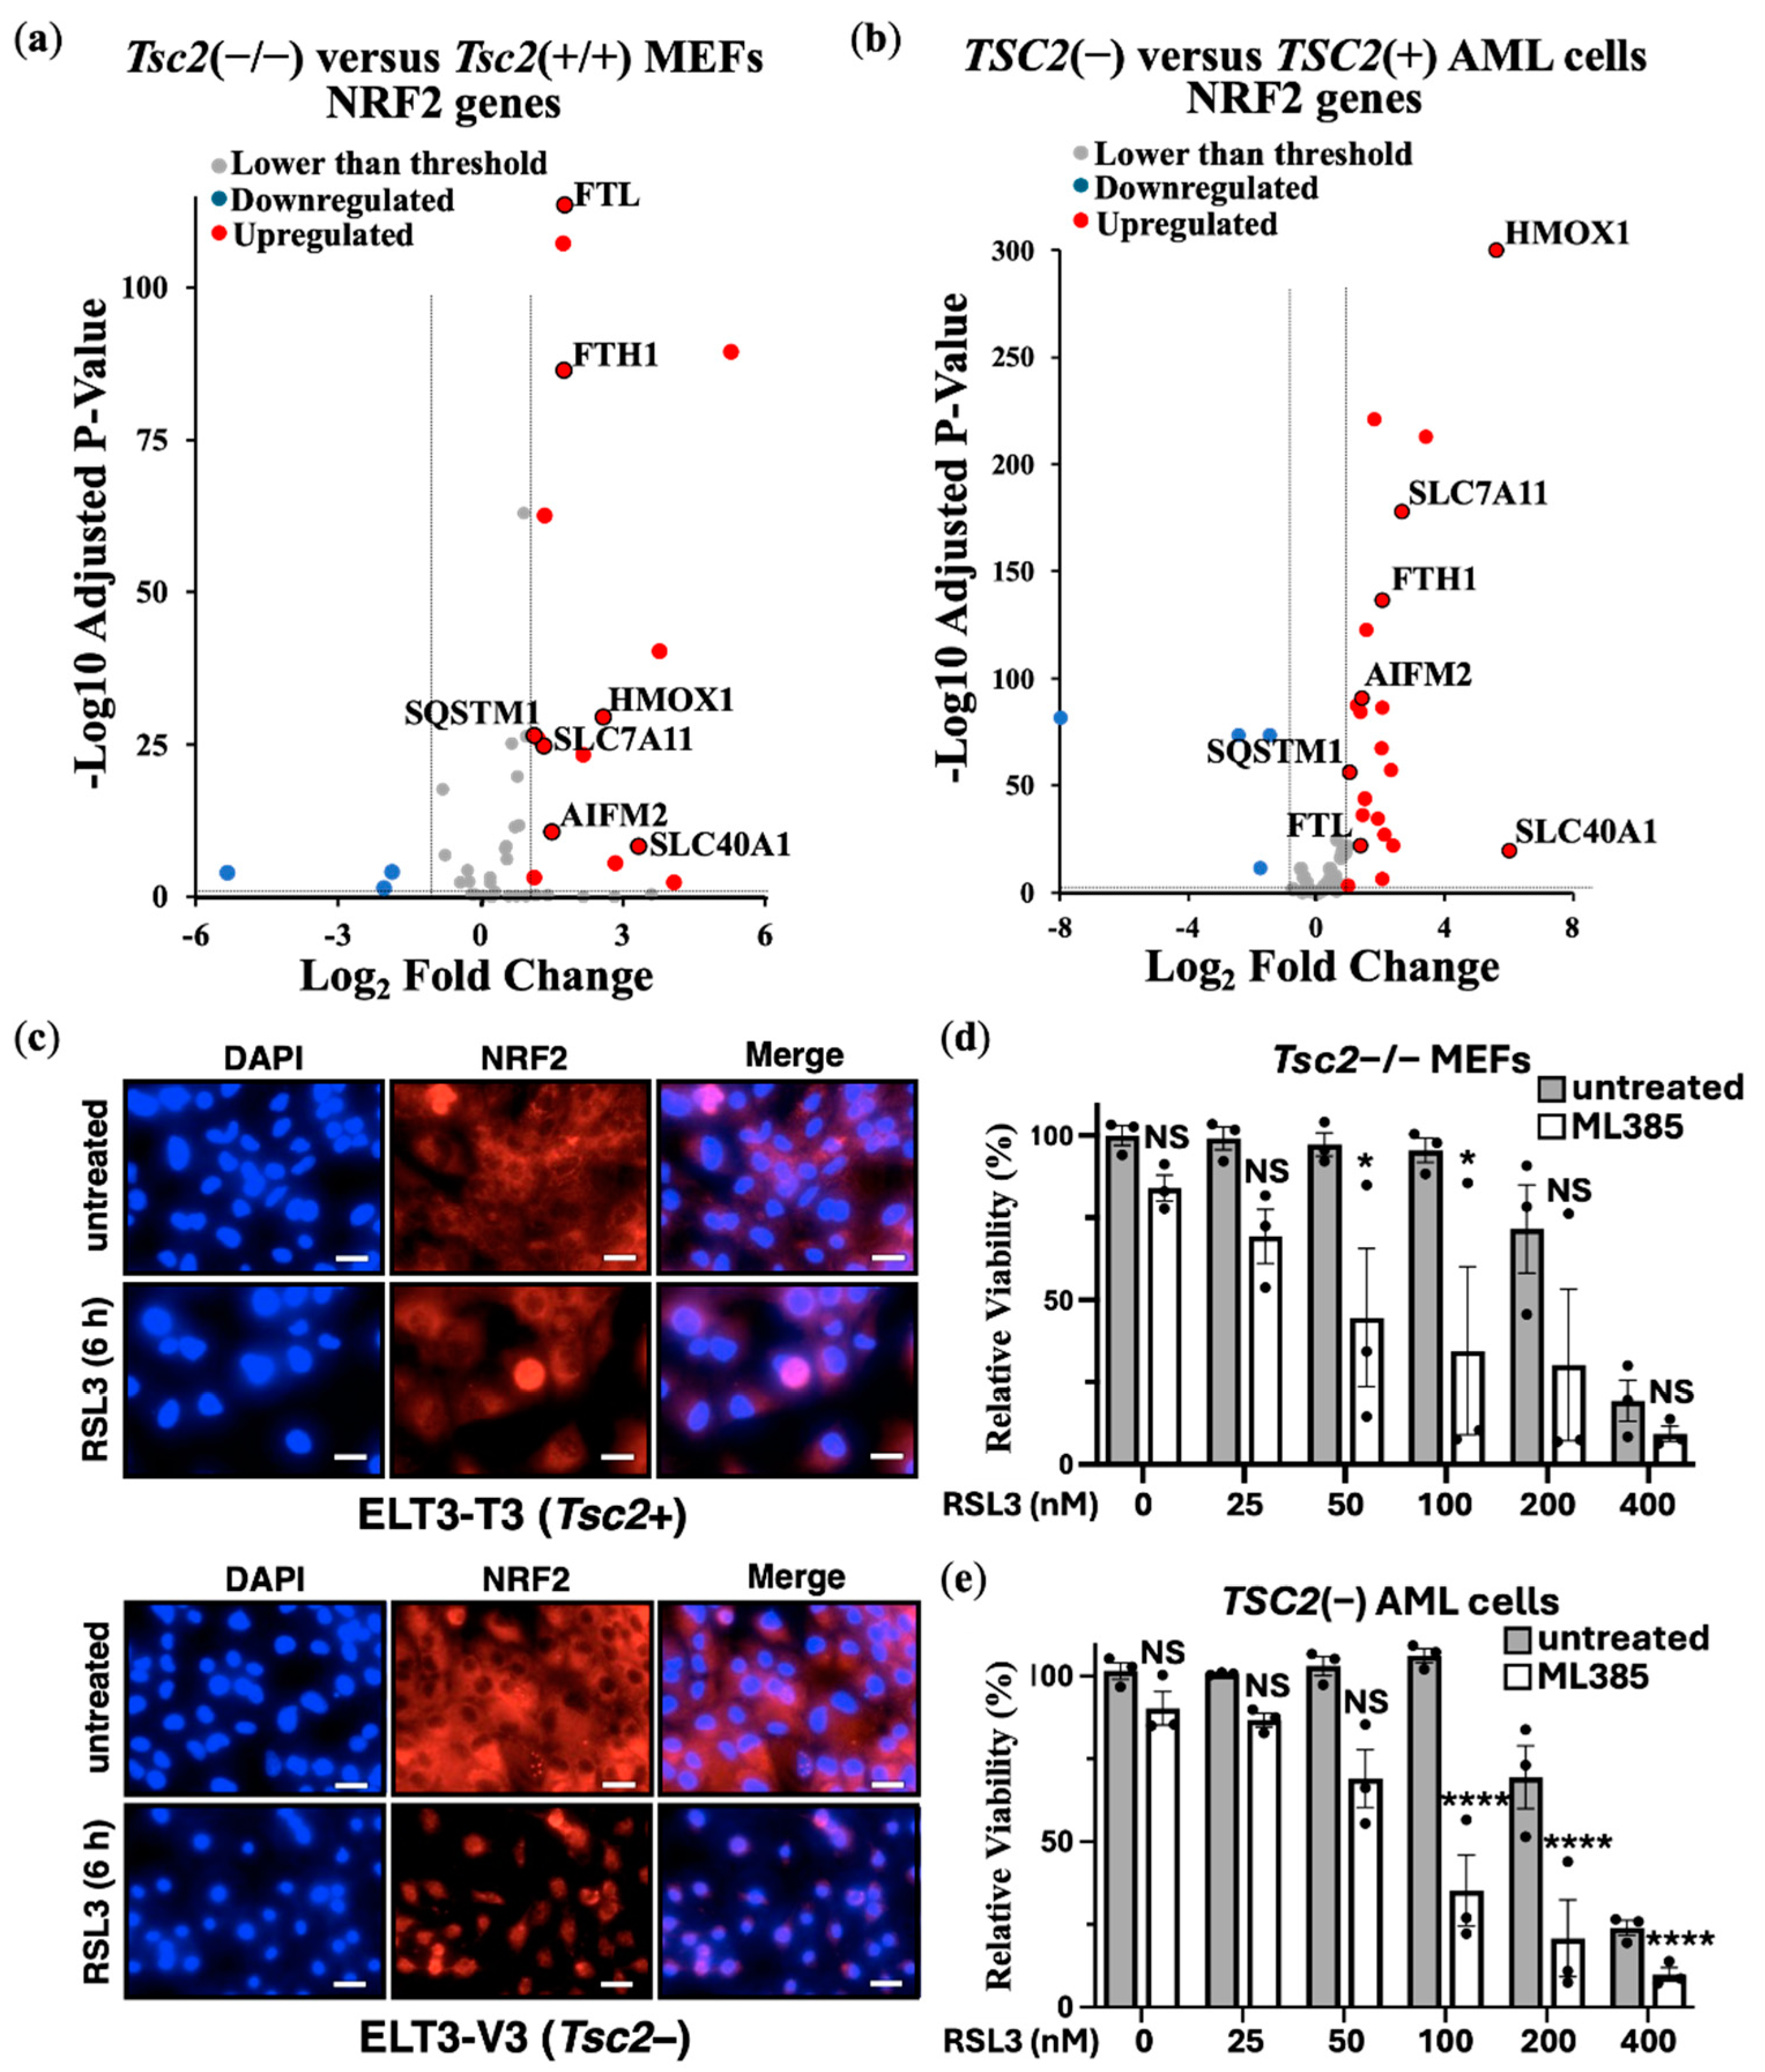
Figure 4.
Ferroptosis resistance mechanisms in cancer cells involving NRF2 and FSP1. Relative viability (%) was determined by crystal violet assays in (a) PEO1, (b) PEO4 and (c) OVCAR3 cells with either non-target (NT) or AIFM2 siRNA knockdown treated with either DMSO (control) or RSL3 at the indicated concentrations (n=3). For OVCAR3 cells, phase contrast images at lower cell density are shown to depict morphological changes. Scale bar is 100 μm. (d) MDA-MB-436 cells were subjected to crystal violet assays to measure relative viability (%) after non-target (NT) or NFE2L2 siRNA knockdown with or without RSL3 (1 μM) for 24 h (n=3). (e) RNA sequencing data comparing MDA-MB-436 cells with NFE2L2 siRNA knockdown versus non-target (n=4) was carried out after 72 h. Thresholds were set (< and > 2-fold changes and an adjusted p-value < 0.05). Respectively, (f) and (g) are identical to panels ‘d’ and ‘e’, apart from AIFM2 siRNA knockdown rather than targeting NFE2L2. Heatmap comparing AIFM2 versus non-target siRNA knockdown on NRF2-linked genes in MDA-MB-436 cells is shown in (h). (i) LPO was assessed in OVCAR3 and MDA-MB-436 cells that were treated with either non-target (NT) or AIFM2 siRNA knockdown with or without RSL3 (at either 200 nM or 1 μM) for 24 h (n=3).
Disclaimer/Publisher’s Note: The statements, opinions and data contained in all publications are solely those of the individual author(s) and contributor(s) and not of MDPI and/or the editor(s). MDPI and/or the editor(s) disclaim responsibility for any injury to people or property resulting from any ideas, methods, instructions or products referred to in the content. |
© 2025 by the authors. Licensee MDPI, Basel, Switzerland. This article is an open access article distributed under the terms and conditions of the Creative Commons Attribution (CC BY) license (http://creativecommons.org/licenses/by/4.0/).
Copyright: This open access article is published under a Creative Commons CC BY 4.0 license, which permit the free download, distribution, and reuse, provided that the author and preprint are cited in any reuse.


