
Submitted:
02 April 2025
Posted:
03 April 2025
You are already at the latest version
Abstract
Leather biodegradation is a microbially driven process of increasing interest for the development of sustainable waste management strategies. In this study, bacterial communities involved in the biodegradation of leather tanned with different agents (chrome, zeolite, Biole®) were characterised using high-throughput sequencing. Taxonomic profiling based on 16S rRNA gene amplification revealed that Proteobacteria, Bacteroidetes, and Patescibacteria were the dominant phyla across samples. Functional analysis, carried out through metatranscriptomic sequencing of RNA molecules, identified a total of 1,302 expressed enzymes, of which 46 were classified as proteases. The most abundant proteases included Endopeptidase La, Endopeptidase Clp, and Methionyl aminopeptidase. Although collagen samples exhibited the lowest bacterial diversity, they showed the highest total enzyme expression, whereas chrome-treated samples displayed increased protease activity, indicating selective pressure associated with heavy metal content. Additionally, distinct functional enzyme sets were found to be either shared among or exclusive to specific tanning treatments. Genera such as Acinetobacter, Pseudomonas, and Sphingopyxis were identified as key contributors to enzymatic activity and potential metal resistance. These results provide new insights into how tanning agents shape microbial communities and their enzymatic functions, highlighting specific taxa and enzymes with potential applications in the bioremediation of leather waste and environmentally friendly processing technologies.
Keywords:
leather biodegradation
; bacterial communities
; proteolytic enzymes
; metatranscriptomics
; 16S rRNA gene sequencing
; tanning agents
1. Introduction
Leather is a durable and flexible material derived from animal hides or skins. It primarily consists of collagen fibres, which comprise approximately 90% of the protein content[1]. The remaining components include elastin, keratin, various lipids, minerals, and water. The unique three-dimensional structure of interwoven collagen fibres gives leather its strength, flexibility, and ability to resist tearing[2]. Tanning chemically modifies the collagen structure to improve stability and impart desired properties [3]. Various tanning agents are employed to stabilise and preserve leather through distinct chemical mechanisms [4]. Among these, chromium salts are the most widely used mineral tanning agents. These form cross-links between collagen fibres by coordinating with carboxyl groups, resulting in highly stable and heat-resistant leather [5]. Synthetic tanning agents such as syntans can mimic vegetable tannins or offer specific properties by forming ionic and covalent bonds with the collagen matrix [6]. Other mineral-based tanning systems, such as zeolite-aluminosilicate-based reagents, have also been explored for their ability to stabilise collagen [7]. Although tanning significantly enhances the durability and longevity of leather products, it also affects their biodegradability and environmental impact [8]. The breakdown of leather is a complex biological process influenced by various microbial groups, with bacteria playing a crucial role[9]. These microorganisms produce specialised enzymes, such as proteases and lipases, that enable the degradation of proteins, lipids, and tanning agents present in leather [10]. Bacteria initiate a cascade of biochemical reactions through these enzymatic activities that gradually decompose the leather structure and alter its physical properties [11]. Tanning agents, especially those containing heavy metals such as chromium and aluminium, considerably influence microbial activity during biodegradation[12]. Chromium, typically present as hexavalent chromium [Cr(VI)], can be toxic to many bacteria, inhibiting growth and reducing enzymatic functionality [13,14]. Similarly, aluminium-based tanning agents, known for their astringent properties, further limit microbial degradation by reducing the accessibility of proteases to the leather matrix and altering its structural integrity [15,16]. These metals may interfere with microbial metabolic pathways by binding to essential biomolecules or inducing oxidative stress [17,18]. Consequently, microbial diversity and enzymatic activity are generally lower in chrome- and aluminium-tanned leathers, favouring the survival of metal-tolerant or resistant strains [19,20]. Microorganisms have evolved diverse mechanisms to cope with heavy metal stress [21]. These include complexation with proteins, active efflux through membrane transporters in prokaryotes, and compartmentalisation of organelles such as vacuoles in eukaryotes [22]. Additional resistance strategies involve biosorption, bioleaching, biomineralisation, biotransformation, and intracellular accumulation of heavy metals [23,24]. Understanding the intricate interactions between microbial communities and leather substrates is essential for developing strategies that enhance or mitigate biodegradation, depending on the application and environmental context [25,26]. Moreover, this knowledge is critical for advancing sustainable waste management practices in the leather industry [27]. Typically, the tanning process uses basic chromium sulphate, of which only 60–70% is absorbed by leather. The remaining portion is discharged as effluent [28,29], resulting in high levels of Cr in wastewater, ranging from 2.6 to 5.2 g/L after wet-blue production [20]. While Cr(III) is generally less toxic, Cr(VI) poses severe environmental and health risks because of its high solubility and membrane permeability [30]. The sludge or “chrome cake” generated during wastewater treatment contains 17–20% total chromium, with approximately 0.04% present as Cr(VI) [31]. Biodegradation using microorganisms has emerged as a cost-effective and eco-friendly approach for managing waste materials, including plastics and leather [32]. Several sustainable strategies have been developed to recycle solid tannery waste (STW), including the production of biogas, biohydrogen, biofuels, fertilisers, construction materials, and other commercial products such as adsorbents, animal feeds, proteins, fats, and enzymes [33]. Previous studies have explored the compostability and biodegradability of finished leathers [34] and identified bacterial genera, such as Acinetobacter, Brevundimonas, and Mycolicibacterium, in soil and aquatic environments[35,36,37,38]. These bacteria are associated with enzymatic processes relevant to protein degradation. However, most investigations have been limited to taxonomic assessments, and there is still a lack of comprehensive functional profiling of these microbial communities. Specifically, the detailed metabolic pathways and enzymatic functions responsible for leather degradation remain unclear. Various approaches have been proposed to address these challenges, including biosorption technologies [12], alternative tanning agents [39], and life cycle assessments to improve the sustainability of tanning processes [40]. In recent years, the industry has shown a growing interest in environmentally conscious practices and innovative waste management techniques to reduce Cr contamination and its environmental footprint[41,42]. Detailed taxonomic and functional profiling of microbial communities can provide valuable insights into the biological mechanisms underlying leather degradation and identify new targets for biotechnological applications. Understanding the metabolic pathways and microbial interactions involved in collagen and leather component breakdown can contribute to developing innovative bio-based waste management solutions. This study aimed to characterise the bacterial communities involved in leather biodegradation by examining their taxonomic composition and functional potential. This study uses high-throughput sequencing techniques to identify variations in microbial populations and metabolic pathways under different leather treatment conditions. By combining 16S rRNA gene sequencing for taxonomic profiling and metatranscriptomic analysis for functional profiling, this study provides an integrated view of microbial dynamics associated with the biodegradation of leather-based materials.
2. Materials and Methods
2.1. Determination of Leather Degradability by Microorganisms’ Assay (ISO:20136:2020)
A leather biodegradation test (Method B) was performed following the ISO 20136:2020 guidelines [43]. The inoculum consisted of a 50:50 mixture of tannery and municipal sewage wastewater, with one modification: 600 ml of inoculum was used instead of the standard 150 ml. For research purposes, this adjustment was made to increase the microbial concentration in the assay. Municipal wastewater was sourced from a local treatment facility (Elda, Spain), whereas tannery wastewater was obtained from Curtidos Segorbe S.L. (Segorbe, Spain)[44]. For each sample, 0.18–0.19 g/L of leather was added to individual Erlenmeyer flasks containing minimal salts and the inoculum. For positive control, pure collagen derived from bovine Achilles tendon (Sigma-Aldrich®, St. Louis, Missouri, USA) was utilised [45]. The assay was performed for 336 h (14 days) instead of 28 days since the aim was to study microbial and enzymatic shifts in the exponential phase of the assay. This study analysed three leather samples processed using different tanning methods. Each sample's total organic carbon content was determined through elemental analysis, as presented in Table 1, allowing the calculation of the theoretical maximum carbon dioxide evolution as an indicator of biodegradation.
2.2. Sample Collection and Preparation
Samples were drawn at different stages of an ongoing leather biodegradation assay (ISO 20136 assay) [45]. Table 2 shows the samples collected from each Erlenmeyer flask, and the time at which they were withdrawn after the start of the assay. Taxonomic profiling through 16S rRNA gene sequencing was performed without replicates and corresponded to the first five samples listed in Table 2. For functional profiling, triplicate samples were prepared for each sample to accurately estimate variations across different media. These values correspond to the remaining samples in the table.
Each time, 50 mL of the sample was extracted and mixed with 100 mL of RNAprotect®, followed by centrifugation at 4,500 rpm for 10 min. The supernatant was discarded, and the samples were stored at 4°C until all extractions were completed. The samples were then resuspended in appropriate volumes of RNAprotect® [46], centrifuged at 13,000 rpm for 1 min, and the supernatant was discarded before further processing.
2.3. RNA Extraction and Quality Control
RNA isolation was performed according to the protocol provided in the QIAGEN® 'RNA QIAsymphony' kit [47]. This procedure included mechanical cell lysis and enzymatic treatment. The quality and concentration of extracted RNA were assessed using a NanoDrop spectrophotometer. Samples designated for transcriptomic analysis were extracted in triplicate, and the QIAGEN® 'RNAse MinElute' kit [48] was used to clean and concentrate RNA from low-volume samples. A subsequent NanoDrop analysis was performed to measure RNA concentration and quality.
2.4. 16S and Transcriptomic Libraries Preparation
Amplicon libraries specific to bacterial DNA were prepared to capture taxonomic profiles of the samples. DNA (50 ng) was extracted and amplified using Illumina's 16S Metagenomic Sequencing Library Preparation protocol (Illumina 15044223 Rev. B). Amplification was performed using a two-step PCR protocol targeting the hypervariable V3–V4 region of the 16S rRNA gene, enabling precise differentiation between the bacterial taxa [49]. In the first amplification step, primers were designed with a dual structure: (1) a universal linker sequence to facilitate the incorporation of indices and sequencing primers, using the Nextera XT Index kit (Illumina, Inc. San Diego, California, USA) [50], and (2) universal primers targeting the V3–V4 region of the 16S rRNA gene[49]. The second amplification step incorporated the index sequences necessary for library preparation. The resulting 16S libraries were quantified using fluorometry with the Quant-iT™ PicoGreen™ dsDNA Assay (Thermo Fisher Scientific)[51] to ensure adequate quality and quantity for downstream applications. Quality control of the libraries was further verified using automated electrophoresis on the Agilent TapeStation system (Agilent Technologies, Santa Clara, California, USA), ensuring that the libraries met the required standards for high-quality sequencing. RNA depletion was performed using RiboZero-Plus (Illumina, Inc. San Diego, California, USA)[52] and a custom probe for metatranscriptomic libraries. This step effectively removes the majority of ribosomal RNA molecules, enriching the samples for mRNA to enhance sequencing efficiency and functional analysis [52].
2.5. 16S and Transcriptomic Libraries Sequencing
Once sequencing libraries for the 16S products were prepared, they were loaded onto the MiSeq platform (Illumina, Inc. San Diego, California, USA), using a 300 bp × 2 paired-end design. Transcriptomic libraries were sequenced using the NovaSeq 6000 platform (Illumina Inc. San Diego, California, USA), using a 150 bp × 2 paired-end design. This setup provided a significantly higher number of reads of improved quality. Sequencing was completed within approximately 56 hours. Image analysis, base calling, and data quality control were performed on the MiSeq platform using the MiSeq Control Software (MCS v3.1).
2.6. 16S Analysis
Amplicon Sequence Variants (ASVs) were filtered to exclude those with fewer than ten sequences per sample. Rarefaction curves were generated to evaluate the relationship between the sequencing depth and the number of taxa detected at various taxonomic levels. Taxonomic assignments were performed using a hybrid approach, starting with BLASTN [53]against the NCBI 16S ribosomal RNA database and refining assignments with the NBAYES classifier [54]and SILVA v.138 database [55] for sequences with less than 97% identity. The bioinformatic analysis involved quality filtering, ASV generation, and taxonomic classification. Paired-end reads were merged using the PEAR program [56], and sequencing adapters were removed using Cutadapt v3.4 [57]. Quality filtering was performed with Reformat, removing reads shorter than 200 nucleotides or with a quality score below 20. DADA2 [58] generated ASVs by modelling sequencing errors and eliminating chimeric sequences. Taxonomic classification of ASVs was conducted using BLASTN [59] with additional assignments from the SILVA database for cases requiring further refinement. The genus-level classification was provided as the standard, whereas species-level annotations were included when identity percentages were sufficiently high, ensuring a robust taxonomic framework for downstream analysis.
2.7. Metatranscriptomic Analysis
Metatranscriptomic samples were subjected to a quality filtering process, in which sequences shorter than 50 nucleotides and those with a quality score below 20 were removed. Functional annotation of the metatranscriptomic data was performed using HUMAnN3[60], which utilises the UniRef protein database[61]. This database includes various functional protein domains, enabling the identification of known proteins and predicting functions in organisms not explicitly represented in the database. Specific functional annotations were obtained following annotation with UniRef to provide a comprehensive view of the functional state of each sample. These included Gene Ontology (GO) terms[62], Kyoto Encyclopedia of Genes and Genomes (KEGG) pathways[63], enzyme commission (EC) codes, metabolic pathways, RXN codes for metabolic reactions[64], and CAZy codes related to carbohydrate metabolism[65]. This multilayered annotation approach allowed for a more detailed characterisation of the functional potential of the samples.
3. Results
3.1. Determination of Leather Degradability by Microorganisms’ Assay (ISO:20136:2020)
Biodegradation results for the leather samples described in Section 2.1 are shown in Figure 1, which shows the biodegradation assay. These biodegradation curves show the percentage of leather biodegradation throughout the assay (14 days); the times shown in Table 3 (Section 2.2) correspond to the time (h) in this graph. There was an initial (65h), exponential (113h), and final (240h) phase of leather biodegradation for all the samples at different biodegradation percentages. Collagen was used as a positive control because it was fully degraded in approximately 30 days. At the final stage of the assay, 336 h after the start of the assay, the biodegradation percentages for collagen, chrome, zeolite, and Biole were 55.68 %, 1.72%, 40.52%, and 14.52 %, respectively. It is important to note that the assay was conducted over 14 days, which is half the typical duration (28 days) for standard biodegradation tests. Therefore, the measured biodegradation values likely underestimate the full biodegradation potential of the samples.
3.2. 16S and Transcriptomic Libraries Sequencing
The resulting RNA concentration and quality, assessed using Nanodrop, are presented in Table S1 in the supplementary materials section. RNA concentration was found to be optimal for all amplicon and transcriptomic samples. The RNA concentration, measured with PicoGreen for the constructed libraries, was optimal for all amplicons and transcriptomic samples, allowing for library sequencing. The sequencing results are shown in Table 4.
In all analysed transcriptomic samples, the number of reads exceeded 20,000,000, with an average of 45 million reads per sample.
3.3. Bacterial Communities 16S Analysis
The taxonomic assignment of the representative sequences (ASVs) followed a mixed strategy to ensure a broader and more precise classification, as described in Section 2.7. This hybrid approach successfully assigned taxonomy at the family level for 89.5% of ASVs, and at the genus level for 77.8% of ASVs. Figure 2 and Figure 3 present the bacterial profiles of the analysed samples at the phylum and family levels, respectively, along with the beta diversity index (local contribution to beta diversity, LCBD). The LCBD index identifies diversity patterns among samples, with higher values indicating markedly distinct bacterial compositions [66]. Among the nine phyla with a relative abundance greater than 1%, the most prevalent were Proteobacteria (44 ± 8%), Bacteroidetes (17± 5%), and Patescibacteria (15 ± 5 %). Notably, the “Inoculum” sample represents the initial microbial community introduced in all experimental conditions, serving as a baseline reference. As the biodegradation assay progressed, the microbial communities in each leather sample (collagen, chrome, zeolite, and Biole) diverged from this initial inoculum, reflecting microbial selection and adaptation driven by the different chemical properties of the leather samples and tanning agents. This microbial shift highlights the influence of substrate composition on shaping the structure and diversity of bacterial communities during the biodegradation process.
Alphaproteobacteria and Gammaproteobacteria were generally present in similar proportions, except in the inoculum, where Alphaproteobacteria were predominant. Notable taxa included Lysobacter brunescens in the zeolite and Biole samples, Pararheinheimera in collagen, and Acinetobacter in nearly all samples and of interest for its protease activity relevant to leather tanning. Additionally, Pseudomonas, known for its protein-degrading potential, accounts for 2% of the collagen sample [67]. Patescibacteria, a phylum of small-sized bacteria with reduced genomes[68], accounted for 10–20% of all samples. These bacteria, often called nanobacteria or Candidate Phyla Radiation (CPR) groups, exhibit unique metabolic capabilities and act as symbionts within microbial communities[68]. Key taxa included Candidatus Campbellbacteria, Saccharimonadales, and Candidatus Pacebacteria, although taxonomic precision remains limited because of the phylum's underrepresentation in databases. Bacteroidetes, another dominant phylum, includes the family Flavobacteriaceae, which is known for carbohydrate metabolism and habitat diversity in marine, soil, and freshwater environments [69]. Despite their prominence, only a few genera, such as Mariniflexile sp. and marine NS9 groups, were consistently identified across samples. Given the low representation of bacteria isolated from aquatic and terrestrial environments in existing databases, achieving precise taxonomic assignment at the genus level remains challenging. Despite this limitation, a genus-level profile was successfully obtained for the analysed bacterial communities, as shown in Figure 3. The bar plots illustrate the relative abundance of bacterial genera across different sample groups, highlighting the taxonomic composition within each condition.
3.4. Alpha Diversity
Alpha diversity was assessed using Shannon and Simpson indices and species richness to evaluate the microbial diversity within each sample (Figure 4). These metrics were computed using the vegan package in R [71], which enables organism-abundance relationship analysis. The Shannon index quantifies species biodiversity, ranging from 0 (indicating a single species) to higher values as diversity increases [72]. The Simpson index (λ) measures the probability that two randomly selected individuals belong to the same species, with lower values indicating species dominance and higher values reflecting a more evenly distributed community [73]. Additionally, species richness estimates the total number of species within a sample, increasing proportionally with sample size[71]. All samples were normalised to 107,703 reads using rarefaction implemented using the Phyloseq package in R [74]to ensure comparability. The results showed that the inoculum and chrome samples exhibited higher alpha diversity, whereas collagen and Biole had lower diversity levels. Simpson index supported these findings, reinforcing the dominance of specific taxa in samples with lower diversity. However, due to the lack of sample replicates, statistical comparisons between groups could not be performed, and alpha diversity values should be interpreted as descriptive rather than indicative of significant differences [75,76].
3.5. Metatranscriptomic Analysis
A total of 1,302 enzymes were detected across all samples, with the most abundant being EC 2.7.7.6: DNA-directed RNA polymerase, an enzyme that catalyses the synthesis of RNA using a DNA template [77], EC 5.2.1.8: peptidylprolyl isomerase, an enzyme that catalyses the cis-trans isomerisation of prolyl peptide bonds[78], EC 3.4.21.53: Endopeptidase La, an ATP-dependent serine proteinase, EC 3.4.21.92: an endopeptidase Clp which hydrolyse proteins to small peptides, and EC 1.16.3.1: Ferroxidase a multicopper oxidase, which plays a crucial role in iron homeostasis by catalysing the oxidation of Fe(II) to Fe(III) [79] (Figure 5).
Among these, 446 enzymes were shared across all samples, whereas 32 enzymes were present exclusively in Biole, Zeolite, and Collagen, meaning they were absent in the chromium-treated samples (Figure 6). Additionally, a group of 15 enzymes was found to be common to all samples except Chrome and Biole, suggesting that these enzymes may be associated with microbial activity specific to certain tanning conditions and could be inhibited by the presence of heavy metals such as chromium. Moreover, 53 enzymes were unique to Collagen, and 10 were exclusive to Zeolite, highlighting distinct functional profiles files in these environments.
Given that tanned leather is primarily composed of proteins (~50%), along with water (~10%), dichloromethane-soluble material (~11%), water-washable material (~3%), and non-water-washable tanning agents (~24%)[34,80], further analysis was conducted to identify and classify proteases in the metatranscriptomic dataset. The protein composition of tanned leather includes approximately 89.8% collagen, 6.2% keratin, 3.1% albumin, and 0.9% elastin [81], making proteases particularly relevant. Of the detected enzymes, 46 were classified as proteases (EC 3.4.–), as shown in Figure 7. The most abundant proteases included EC 3.4.21.53: Endopeptidase La (37 ± 6%), which hydrolyses proteins in the presence of ATP; EC 3.4.21.92: Endopeptidase Clp, which hydrolyses proteins and small peptides in the presence of ATP and Mg²⁺ (16.5 ± 1.3%); and EC 3.4.11.18: Methionyl aminopeptidase, responsible for the cleavage of N-terminal methionine residues (10.9 ± 1.7%) [82].
3.5.1. Alpha Diversity
To assess functional diversity, Shannon and Simpson indices were calculated for the different sample groups shown in Figure 8). The collagen samples, followed by zeolite and Biole, exhibited the highest functional diversity indices, which contrasts with the taxonomic analysis where collagen showed the lowest bacterial diversity (Figure 4). Although with lower values, a similar pattern was observed when analysing alpha diversity considering only proteases shown in Figure 9.
3.5.2. Beta Diversity
Beta diversity provides insights into the functional differences between microbial communities. To assess it, a dissimilarity matrix was calculated based on Bray-Curtis distances and visualized using Principal Coordinates Analysis (PCoA) (Figure 10). The X-axis (PC1) accounted for 71.37% of the variability among the samples, while the Y-axis (PC2) explained 15.82%. In this analysis, clear groupings were observed among samples belonging to the same experimental group, indicating distinct functional profiles across conditions.
Taxonomic analysis of protease-associated enzymes revealed that the genera Aminobacter, Sphingopyxis, Pseudomonas, and Mesorhizobium contributed most significantly to the enzymatic profile. Proteases from Sphingopyxis were consistently found across all sample groups, whereas those from Aminobacter were absent from the chrome sample. The DESeq2 program was used to identify 242 significantly differentially expressed enzymes (functional markers) across sample groups. A subset of these enzymes, specifically those related to protein degradation, was selected to examine the potential contributors to leather degradation, as illustrated in Figure 8 The DESeq2 results indicated that most peptidases were predominantly expressed in chrome, zeolite, and Biole samples, in contrast to collagen, which exhibited lower expression levels. The only enzyme with higher expression in the collagen sample was EC 3.4.16.4, a carboxypeptidase that removes D-alanine residues from bacterial cell wall precursor proteins [83]. This enzyme is primarily expressed in Pseudomonas sp. TC11[84]. The most pronounced differences in differential expression were observed between the collagen and other sample groups. The only peptidase found to be underexpressed in the chrome sample compared to all other groups, except in the collagen sample, which exhibited even lower expression levels, was the HslU-HslV peptidase. This enzyme functions as a proteolytic complex responsible for degrading damaged cytoplasmic proteins [85], and is mainly expressed by Aminobacter aminovorans[86].
4. Discussion
The results of this study provide comprehensive taxonomic and functional characterization of the bacterial communities involved in leather biodegradation. The quality and purity of the extracted DNA was optimal across all samples, ensuring reliable sequencing data. Sequencing results revealed a high number of reads, with amplicon libraries exceeding 100,000 reads and transcriptomic libraries surpassing 20 million reads after quality filtering. This sequencing depth allowed for a robust assessment of microbial diversity and functional potential. Taxonomic profiling of the 16S rRNA sequences revealed that Proteobacteria, Bacteroidetes, and Patescibacteria were the dominant phyla across all samples. These phyla are commonly found in wastewater and aquatic environments and have been associated with xenobiotic degradation and metal tolerance[87]. In wastewater treatment plants, Proteobacteria have been reported to be the dominant bacterial communities. A metagenomic study of a wastewater treatment plant in South Korea found that the phylum Proteobacteria, especially potentially pathogenic species belonging to the genus Acinetobacter, dominated wastewater treatment plants [88]. Similarly, in the heavy metal-contaminated agricultural soils of West Bengal, India, γ-Proteobacteria were found to be the most abundant bacterial community, followed by other bacterial phyla [89]. Proteobacteria have also been observed to play a significant role in phytoremediation processes. They have been reported to be the primary colonisers of the rhizosphere and root endosphere of Typha species growing in both contaminated and non-contaminated environments [90]. This adaptability is attributed to their ability to use various carbon sources and to exert biochemical activities that contribute to plant growth and tolerance to heavy metals. Moreover, Alphaproteobacteria and Gammaproteobacteria have been identified as active degraders of organic pollutants such as toluene in clean and heavy metal-polluted soils [91]. The initial bacterial inoculum, which was a mixture of tannery and municipal wastewater, served as the baseline microbial community. Notably, shifts in bacterial composition were observed across all treatment groups, suggesting that exposure to different tanning agents, such as chrome, zeolite, and synthetic (Biole), influences microbial community dynamics and selection. The genera Acinetobacter and Pseudomonas appeared consistently across multiple samples, suggesting their potential relevance to leather degradation processes, primarily because of their well-documented enzymatic capabilities[86]. Acinetobacter is particularly noteworthy for its dual role in collagen degradation and Cr reduction. It has been isolated from tannery effluents and shown to effectively remediate 8–16 mg/L of Cr(VI) across a broad temperature range (25–37°C), particularly at pH 7 within 63.3 hours[92]. Additional studies have identified Acinetobacter strains, such as MKPF7, capable of optimally reducing Cr(VI) at 40°C and pH 7.0[93]. Pseudomonas, a genus frequently associated with proteolytic activity, was especially abundant in collagen-treated samples, where enzymatic breakdown was likely the most active. Several Pseudomonas strains such as Pseudomonas sp. Cr13 exhibits high tolerance to Cr(VI) (up to 250 mg/L) and Cd(II) (50 mg/L), achieving Cr(VI) removal rates of up to 94% in contaminated soils [94]. Other species like P. aeruginosa san ai, demonstrate resistance to cadmium concentrations up to 7.2 mM and exhibit considerable biosorption potential[95]. Moreover, P. aeruginosa KUJM, isolated from a sewage treatment plant, showed simultaneous resistance to multiple heavy metals, including As(III), As(V), Cd, Co, Cu, Cr, Ni, and Zn [96]. Certain Pseudomonas species, such as P. putida and P. aeruginosa, also produce metallothioneins and metal-binding proteins, with potential applications in the bioremediation of Pb and Cd contamination[97,98]. Metallothioneins are cysteine-rich, low-molecular-weight proteins found in various taxonomic groups, including microorganisms [99]. These proteins exhibit a high affinity for heavy metals, enabling microbial cells to bind, detoxify, and store toxic ions such as cadmium, zinc, and copper. For example, in yeast, MTs such as CUP1 and Crs5 primarily bind copper but also chelate zinc and cadmium ions, whereas in cyanobacteria, the SmtA protein plays a key role in maintaining intracellular metal homeostasis through its strong affinity for zinc and cadmium [100]. Recent studies have also demonstrated the potential of cell surface engineering to enhance microbial metal-binding capacity. By fusing metal-responsive peptides with outer membrane anchoring proteins (OMPs), certain microorganisms can be tailored to adsorb and dissociate specific metals directly at the cell surface[101], offering promising strategies for the removal of heavy metals from contaminated environments. Interestingly, although the collagen samples displayed the lowest bacterial diversity at the taxonomic level, they exhibited the highest overall enzyme expression, highlighting that functional capacity does not necessarily correlate with taxonomic richness. This underscores the importance of integrating both taxonomic and functional analyses when evaluating the roles of microbes in complex biodegradation environments. A total of 1,302 enzymes were detected in the metatranscriptomic data, 46 of which were classified as proteases (EC 3.4.-). The most abundant were EC 3.4.21.53 (Endopeptidase La), EC 3.4.21.92 (Endopeptidase Clp), and EC 3.4.11.18 (Methionyl aminopeptidase), all of which play a role in protein hydrolysis. These enzymes are likely to be key actors in the degradation of leather proteins, such as collagen and keratin. Notably, chrome-treated samples exhibited the highest expression of proteases, suggesting that the chromium tanning process selects microbial taxa with specialized enzymatic pathways to overcome the inhibitory effects of heavy metals. Interestingly, the HslU-HslV proteolytic complex, essential for degrading damaged cytoplasmic proteins [102], was underexpressed in chrome-treated samples, implying that chromium may directly suppress certain enzymatic functions. The absence of Aminobacter-associated proteases in these samples further supports the hypothesis that Cr exerts selective pressure on the microbial community, limiting the abundance and expression of sensitive genera. In contrast, collagen samples exhibited the most extensive enzymatic diversity but lower protease-specific activity, indicating that while metabolic activity is high, it may not be solely directed towards protein degradation. This is further supported by the alpha diversity metrics: collagen samples showed higher functional diversity (Shannon and Simpson indices), whereas taxonomic diversity was lower. Such discrepancies between taxonomic and functional diversity underscore the importance of integrating metatranscriptomic data into microbial ecology studies. The presence of 446 enzymes shared across all samples indicates a conserved core microbiome function, while the detection of enzymes exclusive to specific tanning conditions (e.g., 53 unique to collagen and 10 to zeolite) suggests functional adaptations driven by the chemical properties of the substrates. In particular, 32 enzymes were shared only among collagen, zeolite, and Biole samples, absent in chrome-treated samples, highlighting the potential inhibitory effect of chromium. Additionally, a subset of 15 enzymes was found in all samples except chrome and Biole, possibly reflecting selective pressures induced by synthetic or heavy-metal-based tanning agents. Beta diversity analysis further demonstrated distinct functional clustering of samples based on tanning treatment, with clear separation observed via PCoA. These findings reinforce the role of the tanning process in shaping both taxonomic and functional microbial profiles. Altogether, these results support the hypothesis that specific bacterial taxa possess unique enzymatic capabilities that are influenced by leather composition and tanning agents. Future studies should incorporate enzyme activity assays to validate the expression data, and metaproteomic analyses to confirm protein-level functionality. The role of bacterial consortia and synergistic enzymatic actions also warrants further investigation, particularly under long-term biodegradation conditions.
5. Conclusions
This study offers valuable insights into the taxonomic and functional diversity of bacterial communities involved in leather biodegradation. High-throughput sequencing enabled the identification of dominant phyla such as Proteobacteria, Bacteroidetes, and Patescibacteria, with genera like Acinetobacter and Pseudomonas potentially contributing to degradation processes. Among the 1,302 detected enzymes, 46 proteases were identified, underscoring the relevance of microbial enzymatic activity. Notably, collagen samples showed the highest overall enzyme expression, while chrome-treated samples exhibited increased protease activity, suggesting that tanning agents may influence enzymatic dynamics. These findings advance our understanding of microbial roles in leather degradation and point to potential enzymatic targets for future biotechnological applications in sustainable leather processing.
Supplementary Materials
The following supporting information can be downloaded at the website of this paper posted on Preprints.org, Table S1: Concentration (ng/µL), purity ratios (A260/280 and A260/230), and RNA integrity number equivalent (RINe) for DNA and RNA samples extracted under different conditions. Samples labelled with "16S rRNA" correspond to RNA extraction for transcriptomic analysis.
Author Contributions
M.B.E.; Methodology, Investigation, Formal analysis, Validation, Data curation, writing-original draft preparation. I.L.M.: Methodology, Data curation. M.C.: Writing—review & editing, Resources. E.O.C: Supervision, Project administration. F.A.A.: Supervision, Project administration. M.B: Conceptualization, Supervision, Writing—review & editing. M-J.B: Conceptualization, Supervision, Writing—review & editing.
Funding
This research was co-financed by the European Union through the European Regional Development Fund, within the Operational Programme of the Valencian Community 2014-2020 within the BIOREQ project with grant number IMDEEA/2021/11; Project UAIND21-02B from University of Alicante.
Data Availability Statement
The datasets presented in this study are available on request to the corresponding author.
Conflicts of Interest
The authors declare no conflict of interest.
References
- Narayanan, P.; Janardhanan, S.K. An Approach towards Identification of Leather from Leather-like Polymeric Material Using FTIR-ATR Technique. Collagen and Leather 2024, 6, 1. [Google Scholar] [CrossRef]
- Bai, Z.; Wang, X.; Zheng, M.; Yue, O.; Xie, L.; Zha, S.; Dong, S.; Li, T.; Song, Y.; Huang, M.; et al. Leather for Flexible Multifunctional Bio-Based Materials: A Review. Journal of Leather Science and Engineering 2022, 4, 16. [Google Scholar] [CrossRef]
- Onem, E.; Yorgancioglu, A.; Karavana, H.A.; Yilmaz, O. Comparison of Different Tanning Agents on the Stabilization of Collagen via Differential Scanning Calorimetry. J Therm Anal Calorim 2017, 129, 615–622. [Google Scholar] [CrossRef]
- Meyer, M.; Dietrich, S.; Schulz, H.; Mondschein, A. Comparison of the Technical Performance of Leather, Artificial Leather, and Trendy Alternatives. Coatings 2021, 11, 226. [Google Scholar] [CrossRef]
- Covington, A.D. Tanning Chemistry: The Science of Leather; Royal Society of Chemistry, 2009; ISBN 978-0-85404-170-1.
- China, C.R.; Maguta, M.M.; Nyandoro, S.S.; Hilonga, A.; Kanth, S.V.; Njau, K.N. Alternative Tanning Technologies and Their Suitability in Curbing Environmental Pollution from the Leather Industry: A Comprehensive Review. Chemosphere 2020, 254, 126804. [Google Scholar] [CrossRef]
- Zhang, Y.; Ingham, B.; Cheong, S.; Ariotti, N.; Tilley, R.D.; Naffa, R.; Holmes, G.; Clarke, D.J.; Prabakar, S. Real-Time Synchrotron Small-Angle X-Ray Scattering Studies of Collagen Structure during Leather Processing. Ind. Eng. Chem. Res. 2018, 57, 63–69. [Google Scholar] [CrossRef]
- Vico, A.; Maestre-Lopez, M.I.; Arán-Ais, F.; Orgilés-Calpena, E.; Bertazzo, M.; Marhuenda-Egea, F.C. Assessment of the Biodegradability and Compostability of Finished Leathers: Analysis Using Spectroscopy and Thermal Methods. Polymers 2024, 16, 1908. [Google Scholar] [CrossRef]
- Alugoju, P.; Rao, C.S.V.; Babu, R.; Thankappan, R. Assessment of Biodegradability of Synthetic Tanning Agents Used in Leather Tanning Process. International Journal of Engineering and Technology 2011, 3, 302–308. [Google Scholar]
- Stefan, D.; Dima, R.; Pantazi-Bajenaru, M.; Ferdes, M.; Meghea, A. Identifying Microorganisms Able to Perform Biodegradation of Leather Industry Waste. Molecular Crystals and Liquid Crystals - MOL CRYST LIQUID CRYST 2012, 556, 301–308. [Google Scholar] [CrossRef]
- Masi, C.; Gemechu, G.; Tafesse, M. Isolation, Screening, Characterization, and Identification of Alkaline Protease-Producing Bacteria from Leather Industry Effluent. Annals of Microbiology 2021, 71, 24. [Google Scholar] [CrossRef]
- Pandey, K.; Saharan, B.S.; Kumar, R.; Jabborova, D.; Duhan, J.S. Modern-Day Green Strategies for the Removal of Chromium from Wastewater. Journal of Xenobiotics 2024, 14, 1670–1696. [Google Scholar] [CrossRef]
- Abdulmalik, A.F.; Yakasai, H.M.; Usman, S.; Muhammad, J.B.; Jagaba, A.H.; Ibrahim, S.; Babandi, A.; Shukor, M.Y. Characterization and Invitro Toxicity Assay of Bio-Reduced Hexavalent Chromium by Acinetobacter Sp. Isolated from Tannery Effluent. Case Studies in Chemical and Environmental Engineering 2023, 8, 100459. [Google Scholar] [CrossRef]
- Kanagaraj, G.; Elango, L. Chromium and Fluoride Contamination in Groundwater around Leather Tanning Industries in Southern India: Implications from Stable Isotopic Ratio δ53Cr/δ52Cr, Geochemical and Geostatistical Modelling. Chemosphere 2019, 220, 943–953. [Google Scholar] [CrossRef]
- Bisht, H.; Kumar, N. Identification and Characterization of Aluminium Tolerant Bacteria Isolated from Soil Contaminated by Electroplating and Automobile Waste. Nat. Env. Poll. Tech 2023, 22, 411–416. [Google Scholar] [CrossRef]
- Farh, M.E.-A.; Kim, Y.-J.; Sukweenadhi, J.; Singh, P.; Yang, D.-C. Aluminium Resistant, Plant Growth Promoting Bacteria Induce Overexpression of Aluminium Stress Related Genes in Arabidopsis Thaliana and Increase the Ginseng Tolerance against Aluminium Stress. Microbiological Research 2017, 200, 45–52. [Google Scholar] [CrossRef]
- Arti; Mehra, R. Analysis of Heavy Metals and Toxicity Level in the Tannery Effluent and the Environs. Environ Monit Assess 2023, 195, 554. [Google Scholar] [CrossRef]
- Gillard, B.; Chatzievangelou, D.; Thomsen, L.; Ullrich, M.S. Heavy-Metal-Resistant Microorganisms in Deep-Sea Sediments Disturbed by Mining Activity: An Application Toward the Development of Experimental in Vitro Systems. Frontiers in Marine Science 2019, 6. [Google Scholar] [CrossRef]
- Ashraf, S.; Naveed, M.; Afzal, M.; Ashraf, S.; Rehman, K.; Hussain, A.; Zahir, Z.A. Bioremediation of Tannery Effluent by Cr- and Salt-Tolerant Bacterial Strains. Environ Monit Assess 2018, 190, 716. [Google Scholar] [CrossRef]
- Bakshi, A.; Panigrahi, A.K. Chromium Contamination in Soil and Its Bioremediation: An Overview. In Advances in Bioremediation and Phytoremediation for Sustainable Soil Management: Principles, Monitoring and Remediation; Malik, J.A., Ed.; Springer International Publishing: Cham, 2022; ISBN 978-3-030-89984-4. [Google Scholar]
- Fatima, Z.; Azam, A.; Iqbal, M.Z.; Badar, R.; Muhammad, G. A Comprehensive Review on Effective Removal of Toxic Heavy Metals from Water Using Genetically Modified Microorganisms. Desalination and Water Treatment 2024, 319, 100553. [Google Scholar] [CrossRef]
- Kulakovskaya, T. Inorganic Polyphosphates and Heavy Metal Resistance in Microorganisms. World J Microbiol Biotechnol 2018, 34, 139. [Google Scholar] [CrossRef]
- Fardami, A.; Balarabe, U.; Sabitu, M.; Lawal, A.; Adamu, A.; Aliyu, A.; Lawal, I.; Abdullahi Dalhatu, I.; Zainab, M.; Farouq, A. Mechanisms of Bacterial Resistance to Heavy Metals: A Mini Review. UMYU Scientifica 2023, 2, 76–87. [Google Scholar] [CrossRef]
- Pande, V.; Pandey, S.C.; Sati, D.; Bhatt, P.; Samant, M. Microbial Interventions in Bioremediation of Heavy Metal Contaminants in Agroecosystem. Front. Microbiol. 2022, 13. [Google Scholar] [CrossRef]
- Hu, J.; Xiao, Z.; Zhou, R.; Deng, W.; Wang, M.; Ma, S. Ecological Utilization of Leather Tannery Waste with Circular Economy Model. Journal of Cleaner Production 2011, 19, 221–228. [Google Scholar] [CrossRef]
- Rosu, L.; Varganici, C.; Crudu, A.; Rosu, D. Influence of Different Tanning Agents on Bovine Leather Thermal Degradation. J Therm Anal Calorim 2018, 134, 583–594. [Google Scholar] [CrossRef]
- Moktadir, Md.A.; Ahmadi, H.B.; Sultana, R.; Zohra, F.-T.-; Liou, J.J.H.; Rezaei, J. Circular Economy Practices in the Leather Industry: A Practical Step towards Sustainable Development. Journal of Cleaner Production 2020, 251, 119737. [Google Scholar] [CrossRef]
- Alam, Md.A.; Mondal, A.K.; Uddin, Md.T.; Razzaq, Md.A.; Chowdhury, M.J.; Saha, M.S. Chemical Investigation and Separation of Chromium from Chrome Cake of BSCIC Tannery Industrial Estate at Hemayetpur, Dhaka, Bangladesh. Journal of Environmental and Public Health 2023, 2023, 6685856. [Google Scholar] [CrossRef]
- Hashem, Md.A.; Sahen, Md.S.; Hasan, M.; Payel, S.; Nur-A-Tomal, Md.S. Tannery Liming Sludge in Compost Production: Sustainable Waste Management. Biomass Conv. Bioref. 2023, 13, 9305–9314. [Google Scholar] [CrossRef]
- Cervantes, C.; Campos-García, J.; Devars, S.; Gutiérrez-Corona, F.; Loza-Tavera, H.; Torres-Guzmán, J.C.; Moreno-Sánchez, R. Interactions of Chromium with Microorganisms and Plants. FEMS Microbiology Reviews 2001, 25, 335–347. [Google Scholar] [CrossRef]
- Bhardwaj, A.; Kumar, S.; Singh, D. Tannery Effluent Treatment and Its Environmental Impact: A Review of Current Practices and Emerging Technologies. Water Quality Research Journal 2023, 58. [Google Scholar] [CrossRef]
- Shahnawaz, Mohd. ; Sangale, M.K.; Ade, A.B. Plastic Waste Disposal and Reuse of Plastic Waste. In Bioremediation Technology for Plastic Waste, Shahnawaz, Mohd., Sangale, M.K., Ade, A.B., Eds.; Springer: Singapore, 2019; ISBN 9789811374920. [Google Scholar]
- Verma, S.K.; Sharma, P.C. Current Trends in Solid Tannery Waste Management. Critical Reviews in Biotechnology 2023, 43, 805–822. [Google Scholar] [CrossRef]
- Wang, Y.; Zhang, Y.; Wang, Z. Biodegradability of Leather: A Crucial Indicator to Evaluate Sustainability of Leather. Collagen & Leather 2024, 6, 12. [Google Scholar] [CrossRef]
- Bonilla-Espadas, M.; Zafrilla, B.; Lifante-Martínez, I.; Camacho, M.; Orgilés-Calpena, E.; Arán-Aís, F.; Bertazzo, M.; Bonete, M.-J. Selective Isolation and Identification of Microorganisms with Dual Capabilities: Leather Biodegradation and Heavy Metal Resistance for Industrial Applications 2024.
- Sahoo, S.; Sahoo, R.K.; Gaur, M.; Behera, D.U.; Sahu, A.; Das, A.; Dey, S.; Dixit, S.; Subudhi, E. Environmental Carbapenem-Resistant Acinetobacter Baumannii in Wastewater Receiving Urban River System of Eastern India: A Public Health Threat. Int. J. Environ. Sci. Technol. 2023, 20, 9901–9910. [Google Scholar] [CrossRef]
- Jeong, J.; Ahn, S.; Truong, T.C.; Kim, J.-H.; Weerawongwiwat, V.; Lee, J.-S.; Yoon, J.-H.; Sukhoom, A.; Kim, W. Description of Mycolicibacterium Arenosum Sp. Nov. Isolated from Coastal Sand on the Yellow Sea Coast. Curr Microbiol 2024, 81, 73. [Google Scholar] [CrossRef]
- Ali, A.; Li, M.; Su, J.; Li, Y.; Wang, Z.; Bai, Y.; Ali, E.F.; Shaheen, S.M. Brevundimonas Diminuta Isolated from Mines Polluted Soil Immobilized Cadmium (Cd2+) and Zinc (Zn2+) through Calcium Carbonate Precipitation: Microscopic and Spectroscopic Investigations. Science of The Total Environment 2022, 813, 152668. [Google Scholar] [CrossRef]
- Jia, X.; Tan, R.; Peng, B. Preparation and Application of Polyethylene Glycol Triazine Derivatives as a Chrome-Free Tanning Agent for Wet-White Leather Manufacturing. Environ Sci Pollut Res 2022, 29, 7732–7742. [Google Scholar] [CrossRef]
- Rivela, B.; Moreira, M.T.; Bornhardt, C.; Méndez, R.; Feijoo, G. Life Cycle Assessment as a Tool for the Environmental Improvement of the Tannery Industry in Developing Countries. Environ. Sci. Technol. 2004, 38, 1901–1909. [Google Scholar] [CrossRef]
- Parisi, M.; Nanni, A.; Colonna, M. Recycling of Chrome-Tanned Leather and Its Utilization as Polymeric Materials and in Polymer-Based Composites: A Review. Polymers 2021, 13, 429. [Google Scholar] [CrossRef]
- Santos, R.J.; Agostini, D.L.S.; Cabrera, F.C.; Budemberg, E.R.; Job, A.E. Recycling Leather Waste: Preparing and Studying on the Microstructure, Mechanical, and Rheological Properties of Leather Waste/Rubber Composite. Polymer Composites 2015, 36, 2275–2281. [Google Scholar] [CrossRef]
- IULTCS ISO 20136:2020 Available online:. Available online: https://www.iso.org/standard/75892.html (accessed on 20 November 2023).
- Español - Curtidos Segorbe, S.L. Available online:. Available online: http://www.curtidosegorbe.com/curtidos-segorbe-s-l/espanol/ (accessed on 22 February 2024).
- Collagen from bovine achilles tendon powder, suitable for substrate for collagenase | 9007-34-5 Available online:. Available online: http://www.sigmaaldrich.com/ (accessed on 20 November 2023).
- RNAprotect® Handbook 2019.
- QIAsymphony RNA Kit Available online:. Available online: https://www.qiagen.com/us/products/discovery-and-translational-research/dna-rna-purification/rna-purification/total-rna/qiasymphony-rna-kit (accessed on 4 January 2025).
- RNeasy MinElute Cleanup Kit | RNA Concentration | QIAGEN Available online:. Available online: https://www.qiagen.com/us/products/discovery-and-translational-research/dna-rna-purification/rna-purification/rna-clean-up/rneasy-minelute-cleanup-kit (accessed on 4 January 2025).
- Klindworth, A.; Pruesse, E.; Schweer, T.; Peplies, J.; Quast, C.; Horn, M.; Glöckner, F.O. Evaluation of General 16S Ribosomal RNA Gene PCR Primers for Classical and Next-Generation Sequencing-Based Diversity Studies. Nucleic Acids Research 2013, 41, e1. [Google Scholar] [CrossRef]
- Nextera XT DNA Library Prep Kit | Sequence Small Genomes, Plasmids, cDNA Available online:. Available online: https://emea.illumina.com/products/by-type/sequencing-kits/library-prep-kits/nextera-xt-dna.html (accessed on 20 November 2023).
- Quant-iTTM PicoGreenTM dsDNA Assay Kits and dsDNA Reagents Available online:. Available online: https://www.thermofisher.com/order/catalog/product/es/en/P7589 (accessed on 20 November 2023).
- Illumina Ribo-Zero Plus rRNA Depletion Kit | Standalone rRNA Depletion Available online:. Available online: https://emea.illumina.com/products/by-type/molecular-biology-reagents/ribo-zero-plus-rrna-depletion.html (accessed on 5 January 2025).
- Altschul, S.F.; Gish, W.; Miller, W.; Myers, E.W.; Lipman, D.J. Basic Local Alignment Search Tool. J Mol Biol 1990, 215, 403–410. [Google Scholar] [CrossRef]
- Bokulich, N.A.; Kaehler, B.D.; Rideout, J.R.; Dillon, M.; Bolyen, E.; Knight, R.; Huttley, G.A.; Gregory Caporaso, J. Optimizing Taxonomic Classification of Marker-Gene Amplicon Sequences with QIIME 2’s Q2-Feature-Classifier Plugin. Microbiome 2018, 6, 90. [Google Scholar] [CrossRef] [PubMed]
- Silva - High Quality Ribosomal RNA Database Available online:. Available online: https://www.arb-silva.de/ (accessed on 10 February 2025).
- Zhang, J.; Kobert, K.; Flouri, T.; Stamatakis, A. PEAR: A Fast and Accurate Illumina Paired-End reAd mergeR. Bioinformatics 2014, 30, 614–620. [Google Scholar] [CrossRef]
- Martin, M. Cutadapt Removes Adapter Sequences from High-Throughput Sequencing Reads. EMBnet.journal 2011, 17, 10–12. [Google Scholar] [CrossRef]
- Callahan, B.J.; McMurdie, P.J.; Rosen, M.J.; Han, A.W.; Johnson, A.J.A.; Holmes, S.P. DADA2: High Resolution Sample Inference from Illumina Amplicon Data. Nat Methods 2016, 13, 581–583. [Google Scholar] [CrossRef]
- Nucleotide BLAST: Search Nucleotide Databases Using a Nucleotide Query Available online:. Available online: https://blast.ncbi.nlm.nih.gov/Blast.cgi?PROGRAM=blastn&BLAST_SPEC=GeoBlast&PAGE_TYPE=BlastSearch (accessed on 10 February 2025).
- HUMAnN3– The Huttenhower Lab.
- UniRef | UniProt Available online:. Available online: https://www.uniprot.org/uniref/ (accessed on 8 February 2025).
- Gene Ontology (GO) | UniProt Help | UniProt Available online:. Available online: https://www.uniprot.org/help/gene_ontology (accessed on 1 February 2025).
- Kanehisa, M.; Furumichi, M.; Sato, Y.; Matsuura, Y.; Ishiguro-Watanabe, M. KEGG: Biological Systems Database as a Model of the Real World. Nucleic Acids Research 2025, 53, D672–D677. [Google Scholar] [CrossRef]
- Delannée, V.; Nicklaus, M.C. ReactionCode: Format for Reaction Searching, Analysis, Classification, Transform, and Encoding/Decoding. Journal of Cheminformatics 2020, 12, 72. [Google Scholar] [CrossRef]
- Cantarel, B.L.; Coutinho, P.M.; Rancurel, C.; Bernard, T.; Lombard, V.; Henrissat, B. The Carbohydrate-Active EnZymes Database (CAZy): An Expert Resource for Glycogenomics. Nucleic Acids Res 2009, 37, D233–D238. [Google Scholar] [CrossRef]
- Ijaz, U.Z.; Sivaloganathan, L.; McKenna, A.; Richmond, A.; Kelly, C.; Linton, M.; Stratakos, A.C.; Lavery, U.; Elmi, A.; Wren, B.W. Comprehensive Longitudinal Microbiome Analysis of the Chicken Cecum Reveals a Shift from Competitive to Environmental Drivers and a Window of Opportunity for Campylobacter. Frontiers in microbiology 2018, 9, 2452. [Google Scholar] [CrossRef]
- Butt, M.Q.; Zeeshan, N.; Ashraf, N.M.; Akhtar, M.A.; Ashraf, H.; Afroz, A.; Shaheen, A.; Naz, S. Environmental Impact and Diversity of Protease-Producing Bacteria in Areas of Leather Tannery Effluents of Sialkot, Pakistan. Environ Sci Pollut Res 2021, 28, 54842–54851. [Google Scholar] [CrossRef]
- Tian, R.; Ning, D.; He, Z.; Zhang, P.; Spencer, S.J.; Gao, S.; Shi, W.; Wu, L.; Zhang, Y.; Yang, Y.; et al. Small and Mighty: Adaptation of Superphylum Patescibacteria to Groundwater Environment Drives Their Genome Simplicity. Microbiome 2020, 8, 51. [Google Scholar] [CrossRef]
- Chaudhary, D.K.; Dahal, R.H.; Kim, J. Flavobacterium Silvisoli Sp. Nov., Isolated from Forest Soil. International Journal of Systematic and Evolutionary Microbiology 2019, 69, 2762–2766. [Google Scholar] [CrossRef] [PubMed]
- Sharma, M.; Khurana, H.; Singh, D.N.; Negi, R.K. The Genus Sphingopyxis: Systematics, Ecology, and Bioremediation Potential - A Review. Journal of Environmental Management 2021, 280, 111744. [Google Scholar] [CrossRef] [PubMed]
- Oksanen, J.; Blanchet, F.G.; Friendly, M.; Kindt, R.; Legendre, P.; McGlinn, D.; Minchin, P.R.; O’hara, R.B.; Simpson, G.L.; Solymos, P. Vegan: Community Ecology Package. R Package Version 2.5-7. 2020. Preprint at.
- Graciano-Ávila, G.; Aguirre-Calderón, Ó.A.; Alanís-Rodríguez, E.; Lujan-Soto, J.E. Composición, Estructura y Diversidad de Especies Arbóreas En Un Bosque Templado Del Noroeste de México. Ecosistemas y recursos agropecuarios 2017, 4, 535–542. [Google Scholar] [CrossRef]
- Moreno, C.E. Métodos para medir la biodiversidad; SEA, 2001; ISBN 978-84-922495-2-7.
- Weiss, S.; Xu, Z.Z.; Peddada, S.; Amir, A.; Bittinger, K.; Gonzalez, A.; Lozupone, C.; Zaneveld, J.R.; Vázquez-Baeza, Y.; Birmingham, A.; et al. Normalization and Microbial Differential Abundance Strategies Depend upon Data Characteristics. Microbiome 2017, 5, 27. [Google Scholar] [CrossRef]
- Shannon, C.E. A Mathematical Theory of Communication. The Bell System Technical Journal 1948, 27, 379–423. [Google Scholar] [CrossRef]
- Simpson, E.H. Measurement of Diversity. Nature 1949, 163, 688–688. [Google Scholar] [CrossRef]
- ENZYME - 2.7.7.6 DNA-Directed RNA Polymerase Available online:. Available online: https://enzyme.expasy.org/EC/2.7.7.6 (accessed on 18 February 2025).
- Lauranzano, E.; Pozzi, S.; Pasetto, L.; Stucchi, R.; Massignan, T.; Paolella, K.; Mombrini, M.; Nardo, G.; Lunetta, C.; Corbo, M.; et al. Peptidylprolyl Isomerase A Governs TARDBP Function and Assembly in Heterogeneous Nuclear Ribonucleoprotein Complexes. Brain 2015, 138, 974–991. [Google Scholar] [CrossRef]
- Osaki, S.; Walaas, O. Kinetic Studies of Ferrous Ion Oxidation with Crystalline Human Ferroxidase: II. RATE CONSTANTS AT VARIOUS STEPS AND FORMATION OF A POSSIBLE ENZYME-SUBSTRATE COMPLEX. Journal of Biological Chemistry 1967, 242, 2653–2657. [Google Scholar] [CrossRef]
- Valeika, V.; Beleska, K.; Valeikiene, V.; Sirvaityte, J. Common Tormentil Tannins as Tanning Material for Leather Processing. Вісник Київськoгo націoнальнoгo університету технoлoгій та дизайну.
- Bhaskar, N.; Sakhare, P.Z.; Suresh, P.V.; Gowda, L.; Mahendrakar, N. Biostabilization and Preparation of Protein Hydrolysates from Delimed Leather Fleshings. Journal of Scientific & Industrial Research.
- Chang, A.; Jeske, L.; Ulbrich, S.; Hofmann, J.; Koblitz, J.; Schomburg, I.; Neumann-Schaal, M.; Jahn, D.; Schomburg, D. BRENDA, the ELIXIR Core Data Resource in 2021: New Developments and Updates. Nucleic Acids Res 2020, 49, D498–D508. [Google Scholar] [CrossRef]
- Tschesche, H.; Kupfer, S. C-Terminal-Sequence Determination by Carboxypeptidase C from Orange Leaves. European Journal of Biochemistry 1972, 26, 33–36. [Google Scholar] [CrossRef]
- Ye, Y.; Chen, C.; Ren, Y.; Wang, R.; Zhang, C.; Han, S.; Ju, Z.; Zhao, Z.; Sun, C.; Wu, M. Pseudomonas Mangrovi Sp. Nov., Isolated from Mangrove Soil. Int J Syst Evol Microbiol 2019, 69, 377–383. [Google Scholar] [CrossRef] [PubMed]
- Wang, J.; Song, J.J.; Franklin, M.C.; Kamtekar, S.; Im, Y.J.; Rho, S.H.; Seong, I.S.; Lee, C.S.; Chung, C.H.; Eom, S.H. Crystal Structures of the HslVU Peptidase–ATPase Complex Reveal an ATP-Dependent Proteolysis Mechanism. Structure 2001, 9, 177–184. [Google Scholar] [CrossRef] [PubMed]
- Urakami, T.; Araki, H.; Oyanagi, H.; Suzuki, K.-I.; Komagata, K. Transfer of Pseudomonas Aminovorans (Den Dooren de Jong 1926) to Aminobacter Gen. Nov. as Aminobacter Aminovorans Comb. Nov. and Description of Aminobacter Aganoensis Sp. Nov. and Aminobacter Niigataensis Sp. Nov. International Journal of Systematic and Evolutionary Microbiology 1992, 42, 84–92. [Google Scholar] [CrossRef]
- Li, J.-M.; Ou, J.-H.; Verpoort, F.; Surmpalli, R.Y.; Huang, W.-Y.; Kao, C.-M. Toxicity Evaluation of a Heavy-Metal-Polluted River: Pollution Identification and Bacterial Community Assessment. Water Environment Research 2023, 95, e10904. [Google Scholar] [CrossRef]
- Gupta, R.S.; Lo, B.; Son, J. Phylogenomics and Comparative Genomic Studies Robustly Support Division of the Genus Mycobacterium into an Emended Genus Mycobacterium and Four Novel Genera. Front Microbiol 2018, 9, 67. [Google Scholar] [CrossRef]
- Chauhan, P.S.; Mishra, S.K.; Misra, S.; Dixit, V.K.; Pandey, S.; Khare, P.; Khan, M.H.; Dwivedi, S.; Lehri, A. Evaluation of Fertility Indicators Associated with Arsenic-Contaminated Paddy Fields Soil. Int. J. Environ. Sci. Technol. 2018, 15, 2447–2458. [Google Scholar] [CrossRef]
- Martínez-Martínez, J.G.; Rosales-Loredo, S.; Hernández-Morales, A.; Arvizu-Gómez, J.L.; Carranza-Álvarez, C.; Macías-Pérez, J.R.; Rolón-Cárdenas, G.A.; Pacheco-Aguilar, J.R. Bacterial Communities Associated with the Roots of Typha Spp. and Its Relationship in Phytoremediation Processes. Microorganisms 2023, 11, 1587. [Google Scholar] [CrossRef]
- Dou, X.; Zhang, J.; Zhang, C.; Ma, D.; Chen, L.; Zhou, G.; Li, J.; Duan, Y. Calcium Carbonate Regulates Soil Organic Carbon Accumulation by Mediating Microbial Communities in Northern China. CATENA 2023, 231, 107327. [Google Scholar] [CrossRef]
- Panda, J.; Sarkar, P. Bioremediation of Chromium by Novel Strains Enterobacter Aerogenes T2 and Acinetobacter Sp. PD 12 S2. Environ Sci Pollut Res 2012, 19, 1809–1817. [Google Scholar] [CrossRef]
- Ilias, M.; Rafiqullah, I.Md.; Debnath, B.C.; Mannan, K.S.B.; Mozammel Hoq, Md. Isolation and Characterization of Chromium(VI)-Reducing Bacteria from Tannery Effluents. Indian J Microbiol 2011, 51, 76–81. [Google Scholar] [CrossRef]
- Gong, D.; Ye, F.; Pang, C.; Lu, Z.; Shang, C. Isolation and Characterization of Pseudomonas Sp. Cr13 and Its Application in Removal of Heavy Metal Chromium. Curr Microbiol 2020, 77, 3661–3670. [Google Scholar] [CrossRef] [PubMed]
- Izrael-Živković, L.; Rikalović, M.; Gojgić-Cvijović, G.; Kazazić, S.; Vrvić, M.; Brčeski, I.; Beškoski, V.; Lončarević, B.; Gopčević, K.; Karadžić, I. Cadmium Specific Proteomic Responses of a Highly Resistant Pseudomonas Aeruginosa San Ai. RSC Adv. 2018, 8, 10549–10560. [Google Scholar] [CrossRef] [PubMed]
- Biswas, J.K.; Mondal, M.; Rinklebe, J.; Sarkar, S.K.; Chaudhuri, P.; Rai, M.; Shaheen, S.M.; Song, H.; Rizwan, M. Multi-Metal Resistance and Plant Growth Promotion Potential of a Wastewater Bacterium Pseudomonas Aeruginosa and Its Synergistic Benefits. Environ Geochem Health 2017, 39, 1583–1593. [Google Scholar] [CrossRef]
- Tasleem, M.; Hussein, W.M.; El-Sayed, A.-A.A.A.; Alrehaily, A. An In Silico Bioremediation Study to Identify Essential Residues of Metallothionein Enhancing the Bioaccumulation of Heavy Metals in Pseudomonas Aeruginosa. Microorganisms 2023, 11, 2262. [Google Scholar] [CrossRef]
- Tasleem, M.; El-Sayed, A.-A.A.A.; Hussein, W.M.; Alrehaily, A. Pseudomonas Putida Metallothionein: Structural Analysis and Implications of Sustainable Heavy Metal Detoxification in Madinah. Toxics 2023, 11, 864. [Google Scholar] [CrossRef]
- Konieczna, W.; Mierek-Adamska, A.; Chojnacka, N.; Antoszewski, M.; Szydłowska-Czerniak, A.; Dąbrowska, G.B. Characterization of the Metallothionein Gene Family in Avena Sativa L. and the Gene Expression during Seed Germination and Heavy Metal Stress. Antioxidants 2023, 12, 1865. [Google Scholar] [CrossRef]
- Chatterjee, S.; Kumari, S.; Rath, S.; Priyadarshanee, M.; Das, S. Diversity, Structure and Regulation of Microbial Metallothionein: Metal Resistance and Possible Applications in Sequestration of Toxic Metals. Metallomics 2020, 12, 1637–1655. [Google Scholar] [CrossRef]
- Jin, Y.; Luan, Y.; Ning, Y.; Wang, L. Effects and Mechanisms of Microbial Remediation of Heavy Metals in Soil: A Critical Review. Applied Sciences 2018, 8, 1336. [Google Scholar] [CrossRef]
- Biernacka, D.; Gorzelak, P.; Klein, G.; Raina, S. Regulation of the First Committed Step in Lipopolysaccharide Biosynthesis Catalyzed by LpxC Requires the Essential Protein LapC (YejM) and HslVU Protease. International Journal of Molecular Sciences 2020, 21, 9088. [Google Scholar] [CrossRef]
Figure 1.
The biodegradation results of the ISO 20136 assay were performed with three different types of leather samples (chrome, zeolite, and Biole). The graph shows biodegradation percentage versus time for each sample. Collagen was purchased from (Sigma-Aldrich (MO, USA). Louis, Missouri, USA) used as a positive control sample 3.2.
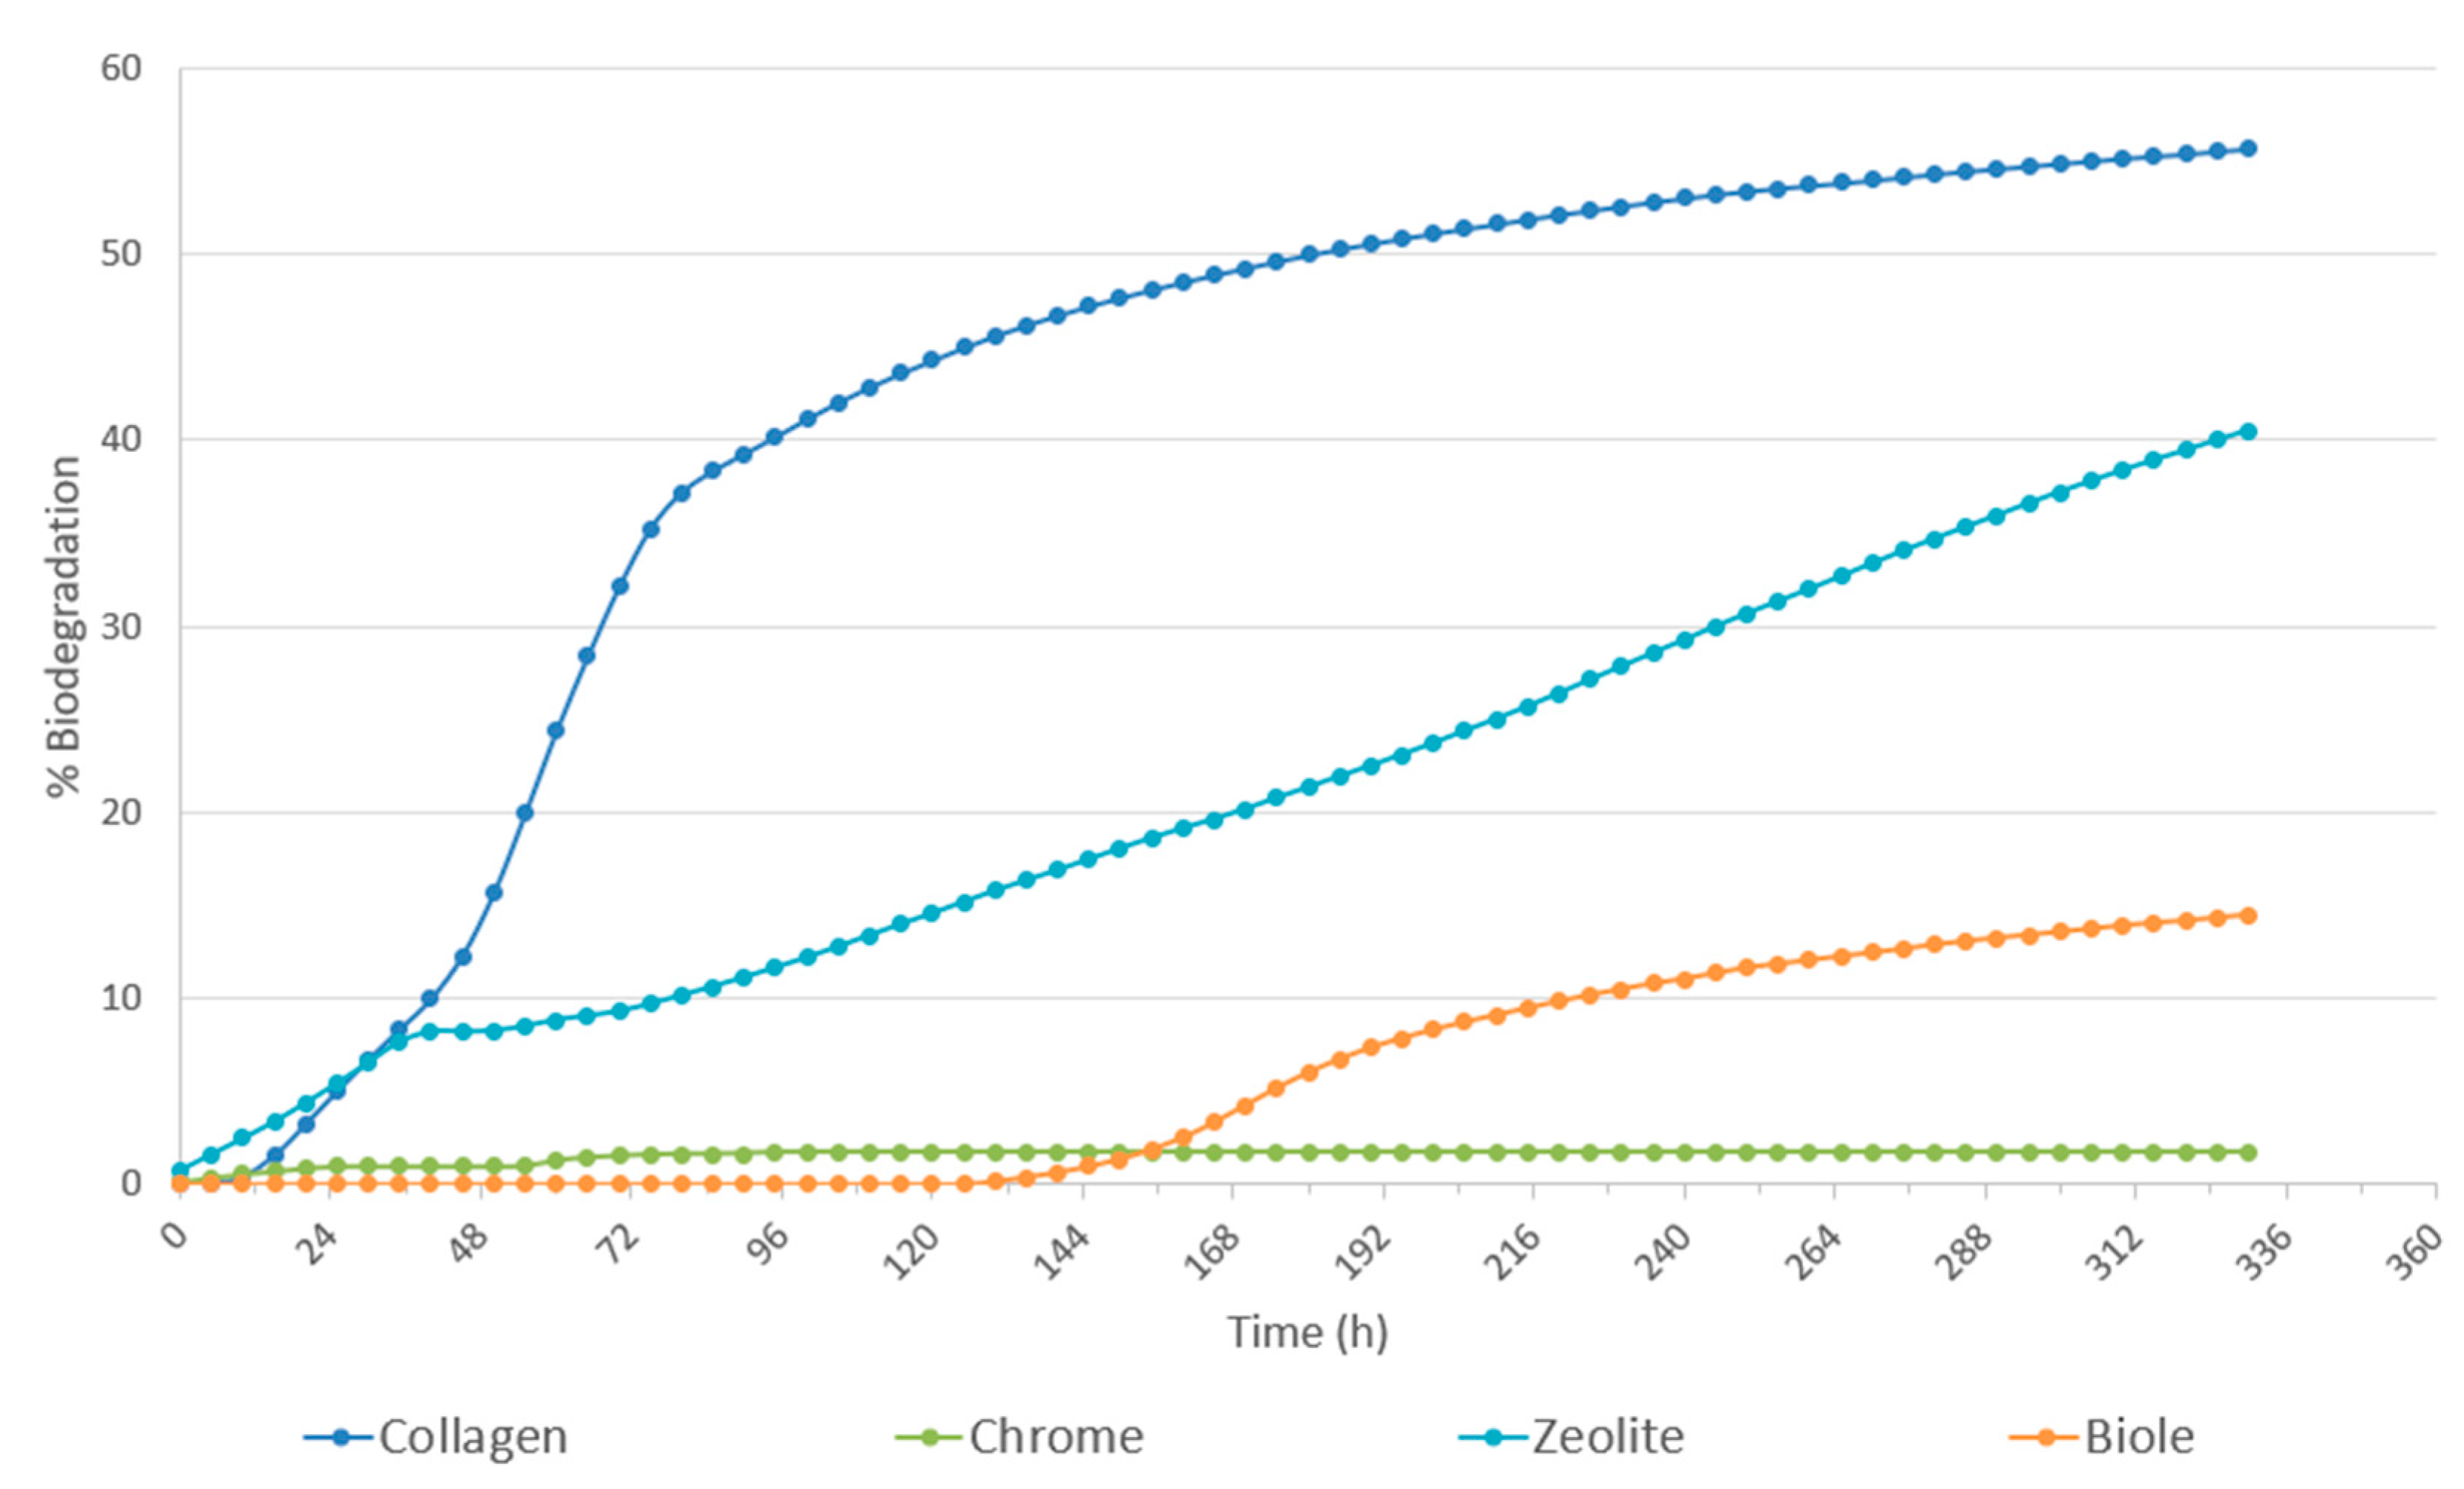
Figure 2.
Bar plots at the phylum level representing the taxonomic profiles and LCBD values of the bacterial communities in the analysed samples. The “Inoculum” sample corresponds to the microbial inoculum used in the biodegradation assay. All samples shown refer to those analysed for 16S rRNA-based taxonomic profiling, as listed in Table 2. The “Others” category includes bacterial taxa with annotations that do not reach the phylum level and/or exhibit low relative abundance across samples.
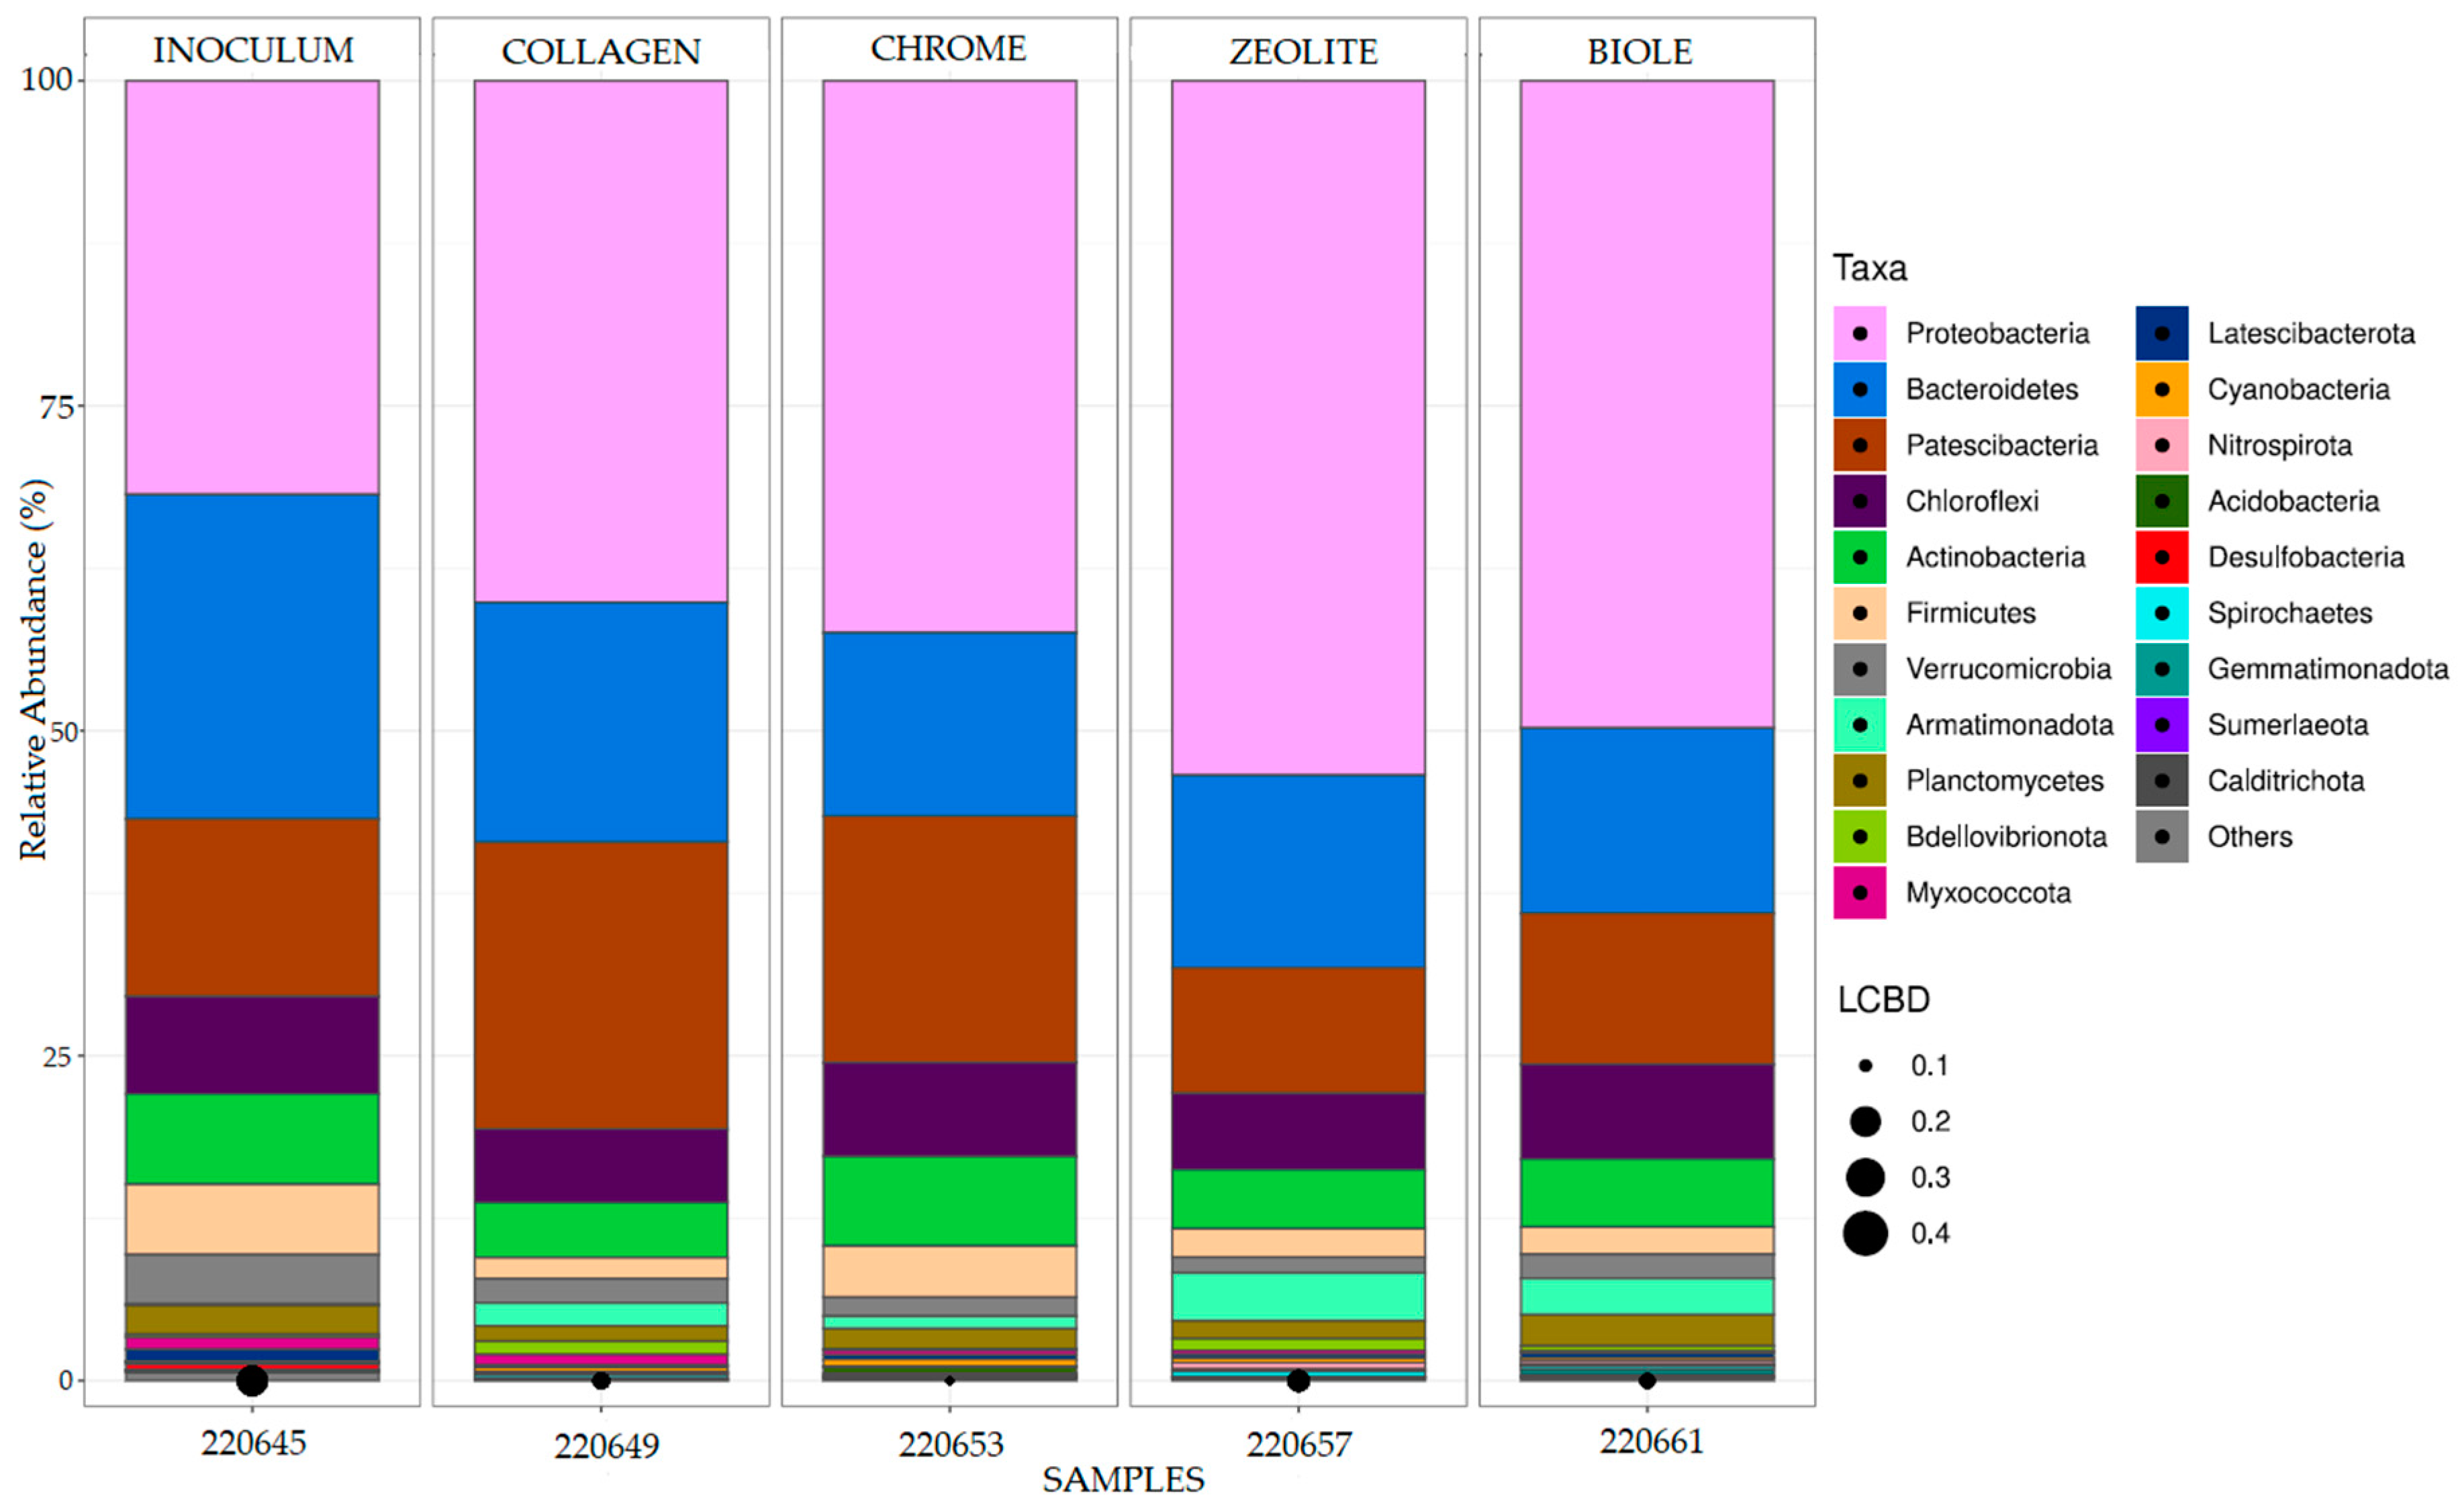
Figure 3.
Bar plots at the genus level representing the taxonomic profiles and LCBD values of the bacterial communities in the analysed samples. The “Inoculum” sample corresponds to the microbial inoculum used in the biodegradation assay. All samples shown refer to those analysed for 16S rRNA-based taxonomic profiling, as listed in Table 2. The “Others” category includes bacterial taxa with annotations that do not reach the phylum level and/or exhibit low relative abundance across samples.In the collagen sample, the microbial community was enriched in Pararheinheimera and Lysobacter, whereas chrome, zeolite, and Biole exhibited greater diversity in genus composition with the presence of genera such as Pseudomonas, Flavobacterium, and Mesorhizobium. Sphingopyxis is known for its ability to survive in extreme conditions and degrade various xenobiotics and environmental contaminants [70]. Acinetobacter, known for its metabolic versatility[13], were present across multiple sample types, suggesting their potential role in microbial interactions within these environments. The Local Contribution to Beta-Diversity (LCBD) values, represented by dot sizes at the bottom of each bar plot, indicate the uniqueness of each microbial community compared with the others. The inoculum sample exhibited a distinct composition, potentially reflecting its role as a baseline microbial population before exposure to the experimental conditions.
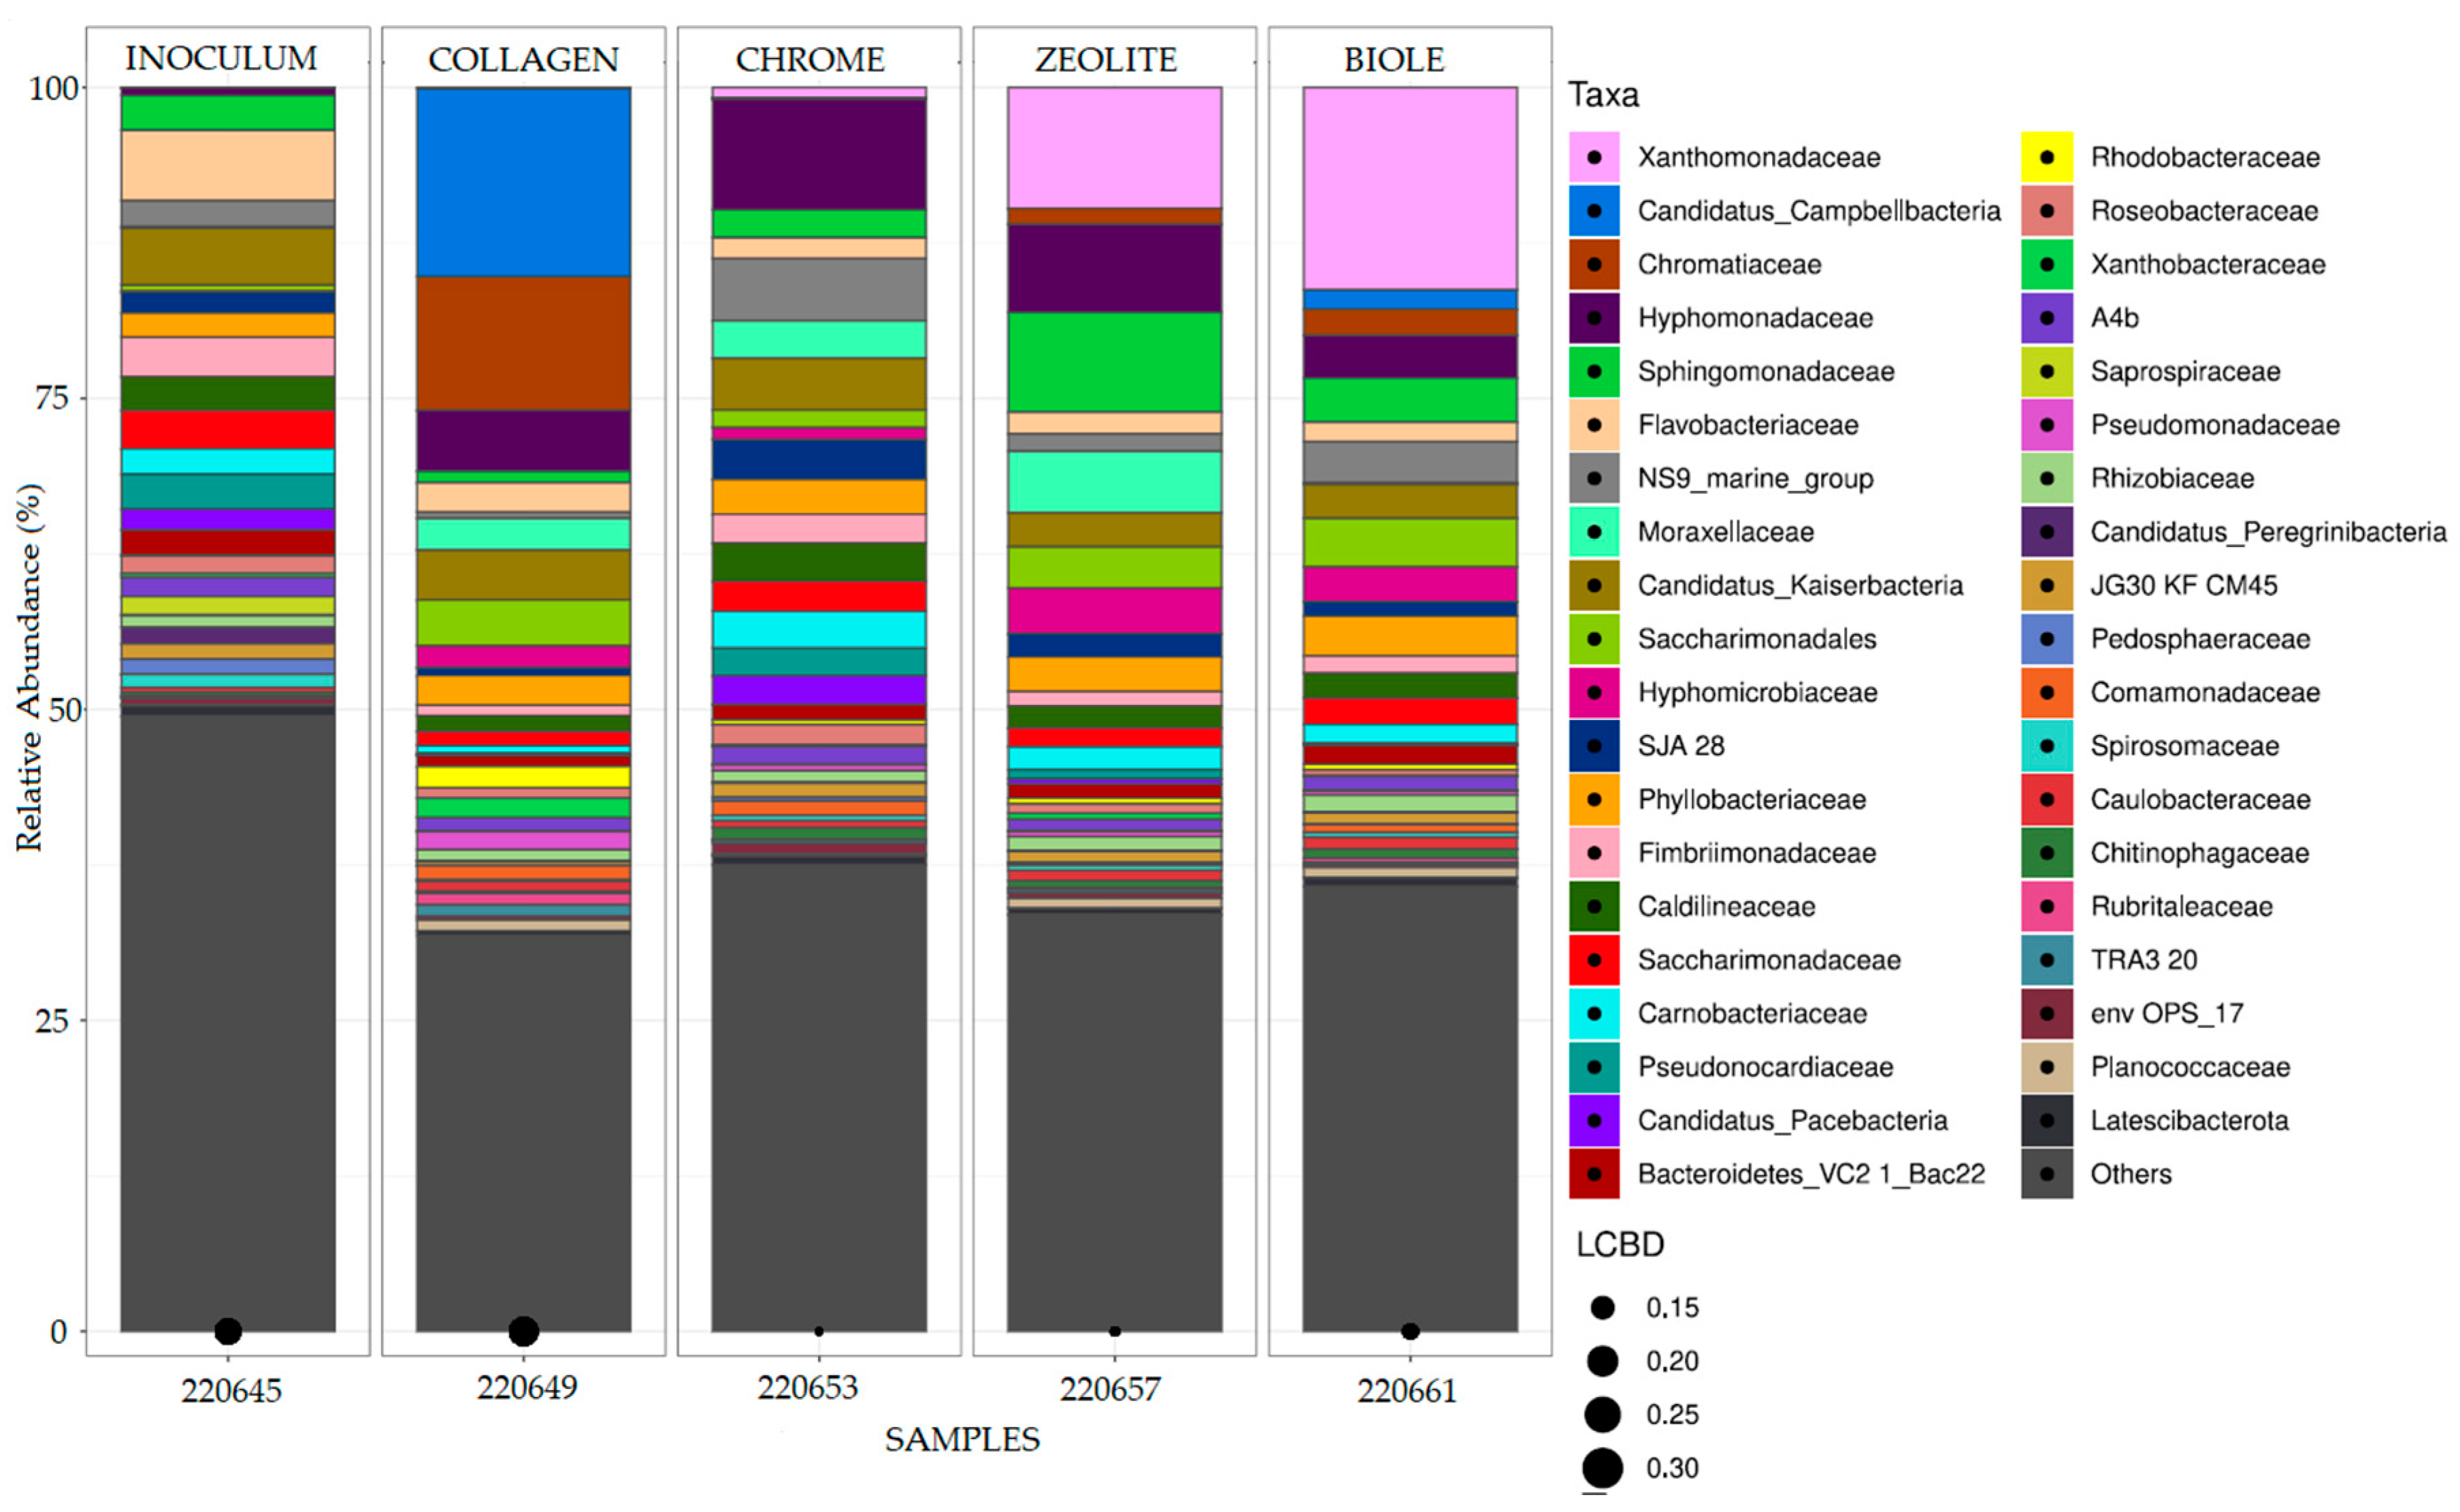
Figure 4.
Boxplot of alpha diversity at the Amplicon Sequence Variant (ASV) level based on the studied variables. The displayed parameters correspond to the Richness, Simpson index (Simpson), and Shannon index.
Figure 4.
Boxplot of alpha diversity at the Amplicon Sequence Variant (ASV) level based on the studied variables. The displayed parameters correspond to the Richness, Simpson index (Simpson), and Shannon index.
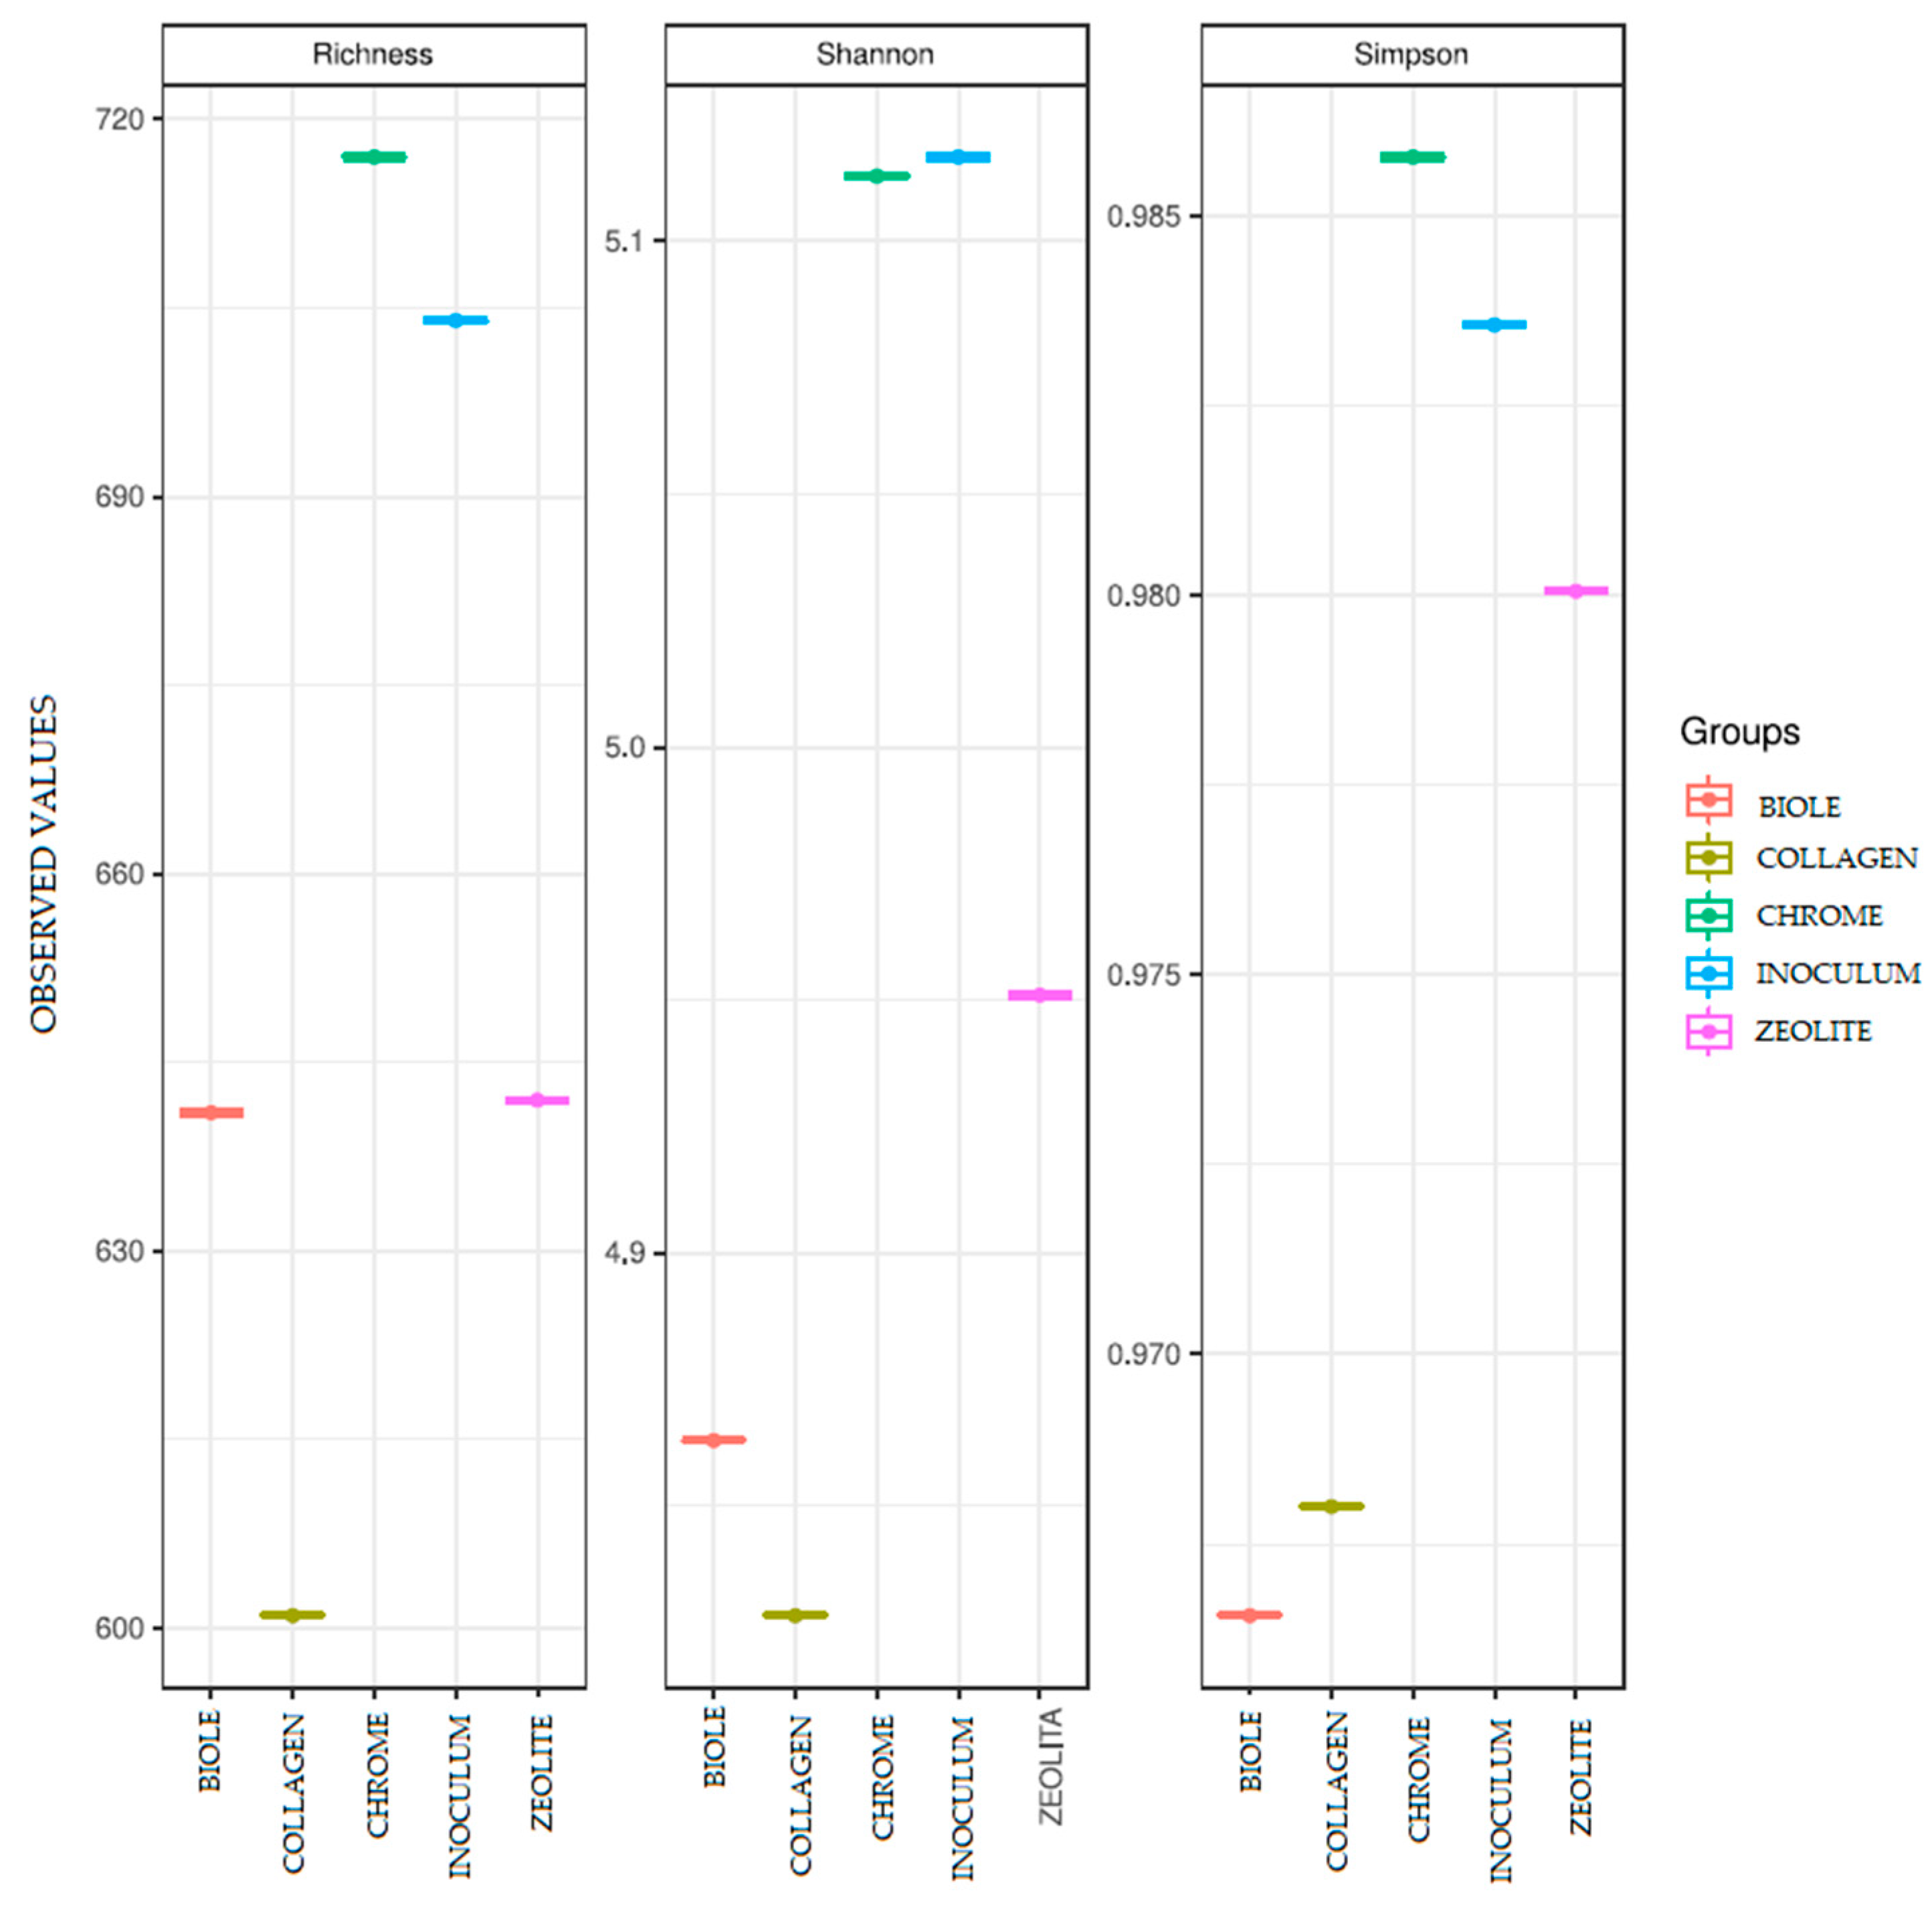
Figure 5.
Normalized expression counts per million (CPM) for the total enzymes detected in the analysed samples. Sample numbers corresponding to each leather type are provided in Table 2. The 30 most abundant enzymes are individually annotated, while enzymes with lower relative abundance are grouped under the category “Others” for clarity.
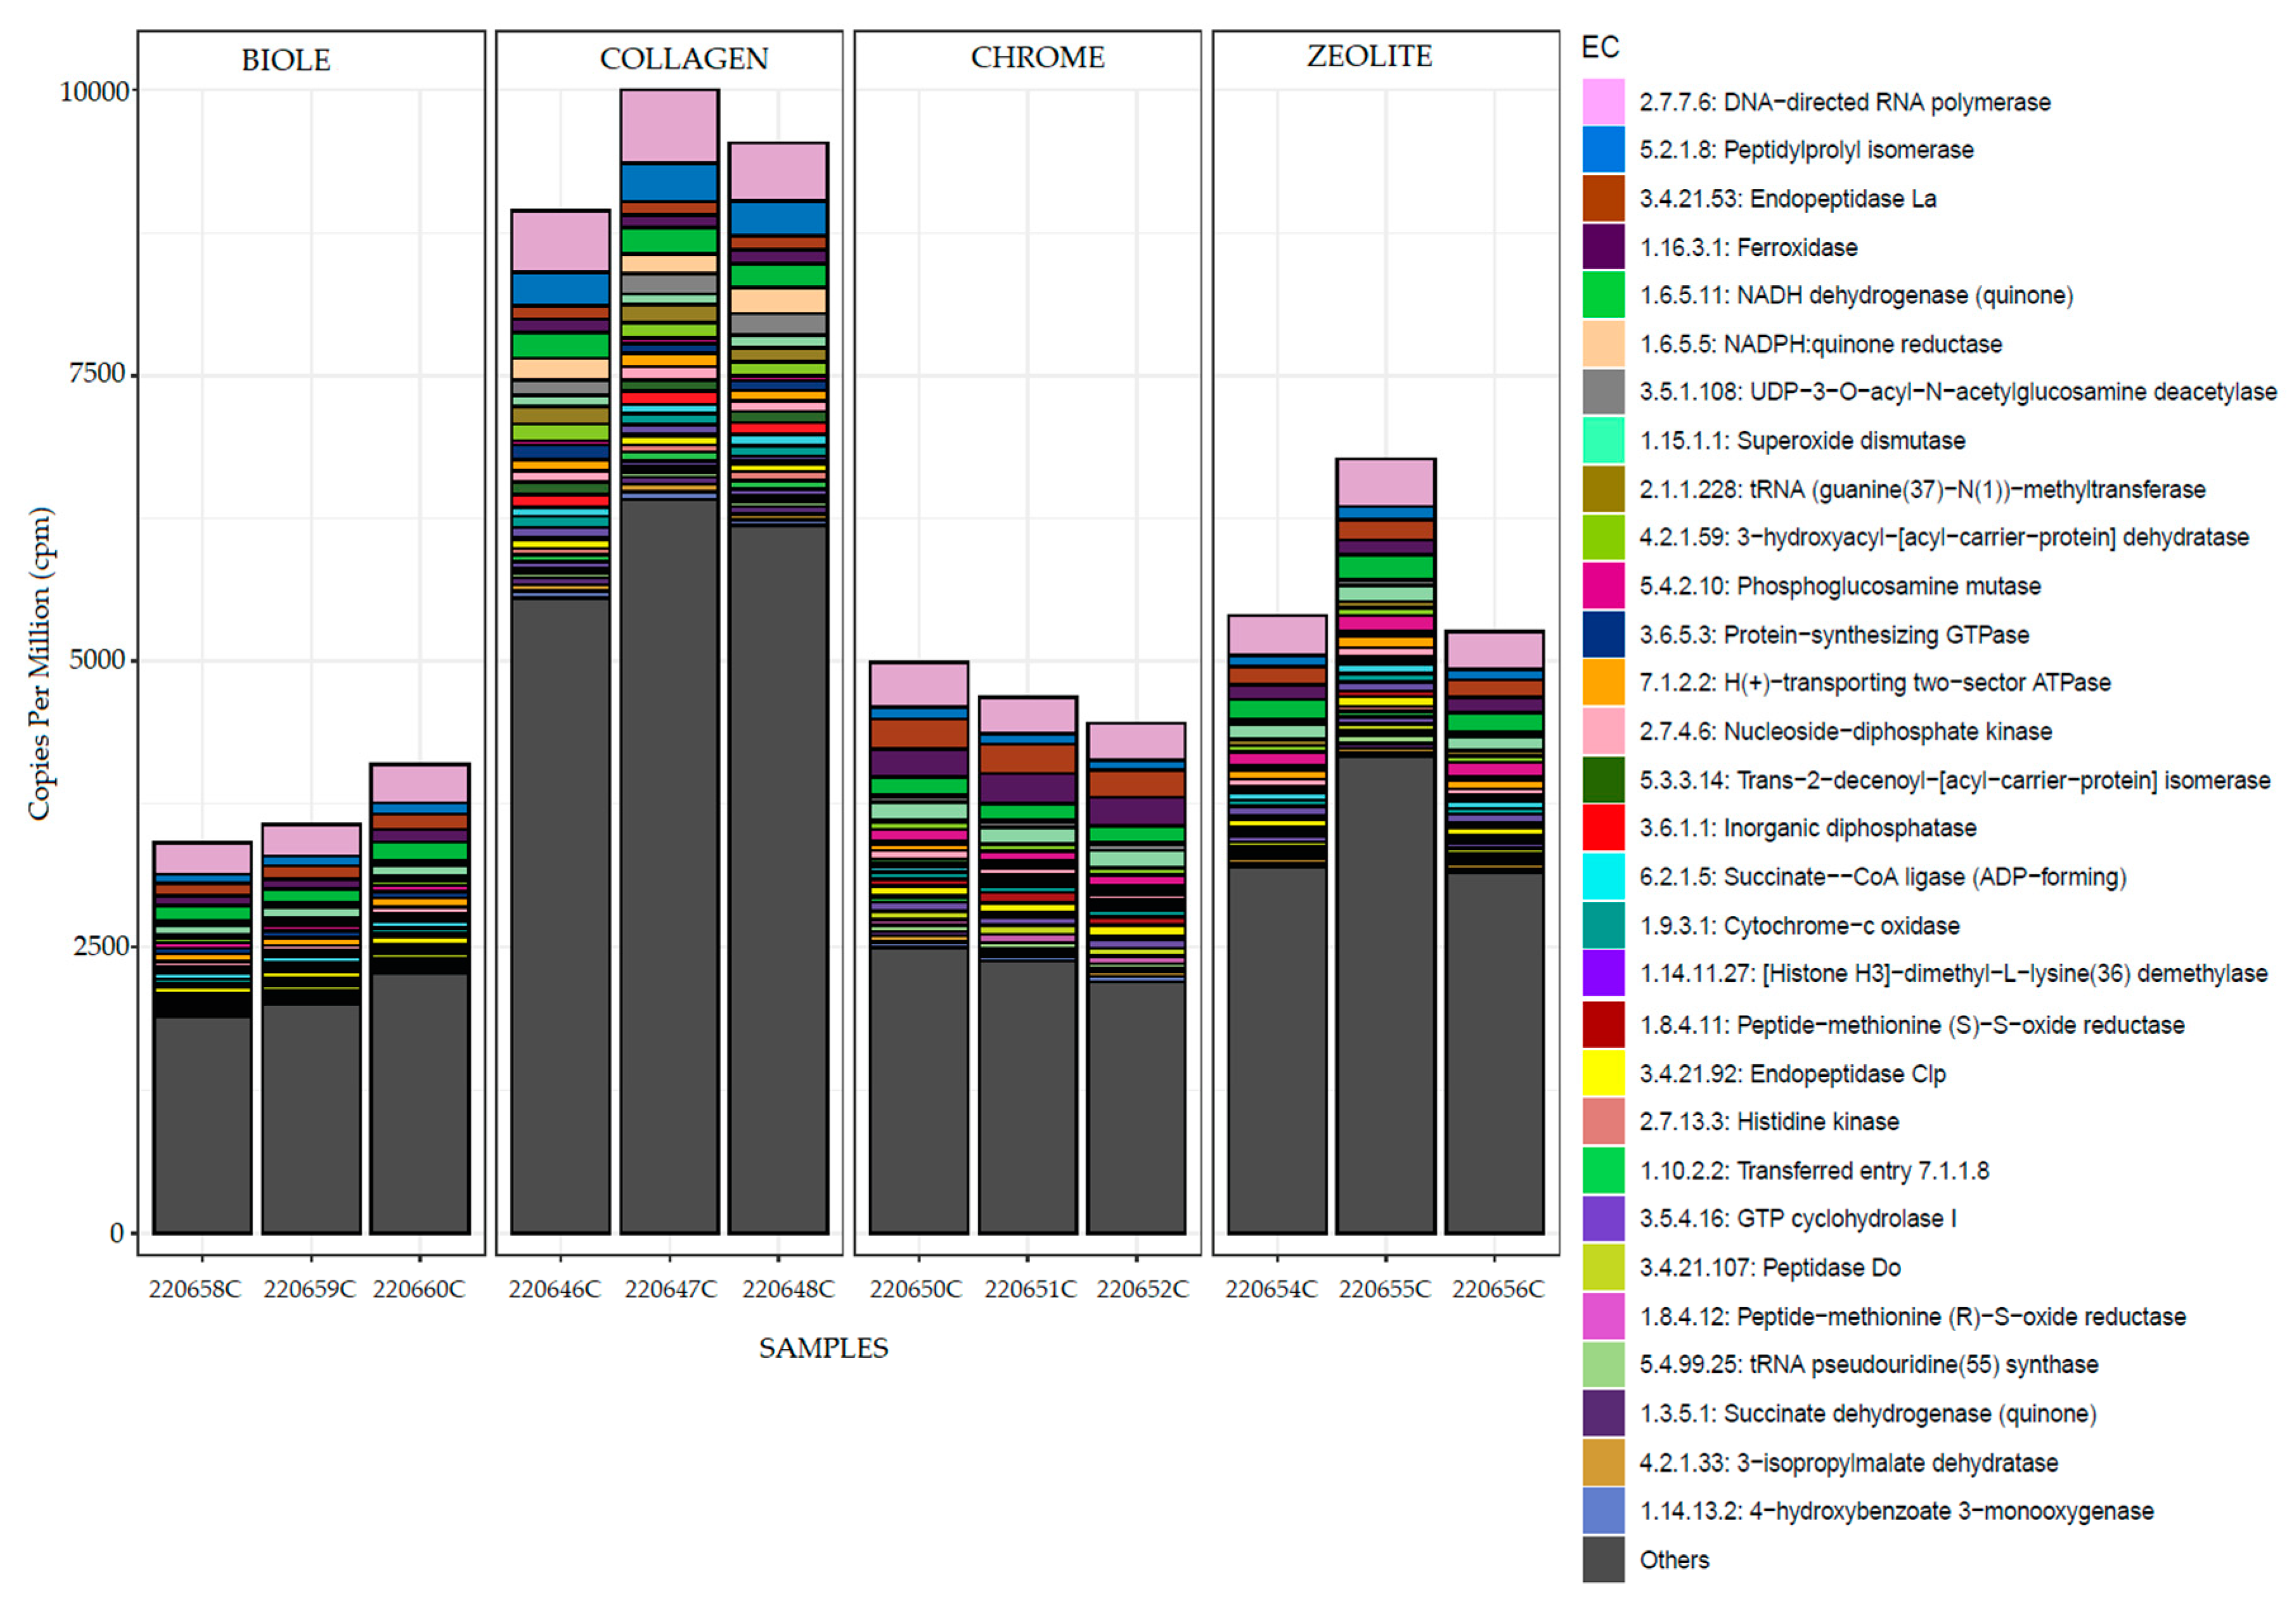
Figure 6.
Number of shared and uniquely expressed enzymes among the different leather sample groups. The total number of enzymes for each comparison is displayed at the top of the bars.
Figure 6.
Number of shared and uniquely expressed enzymes among the different leather sample groups. The total number of enzymes for each comparison is displayed at the top of the bars.
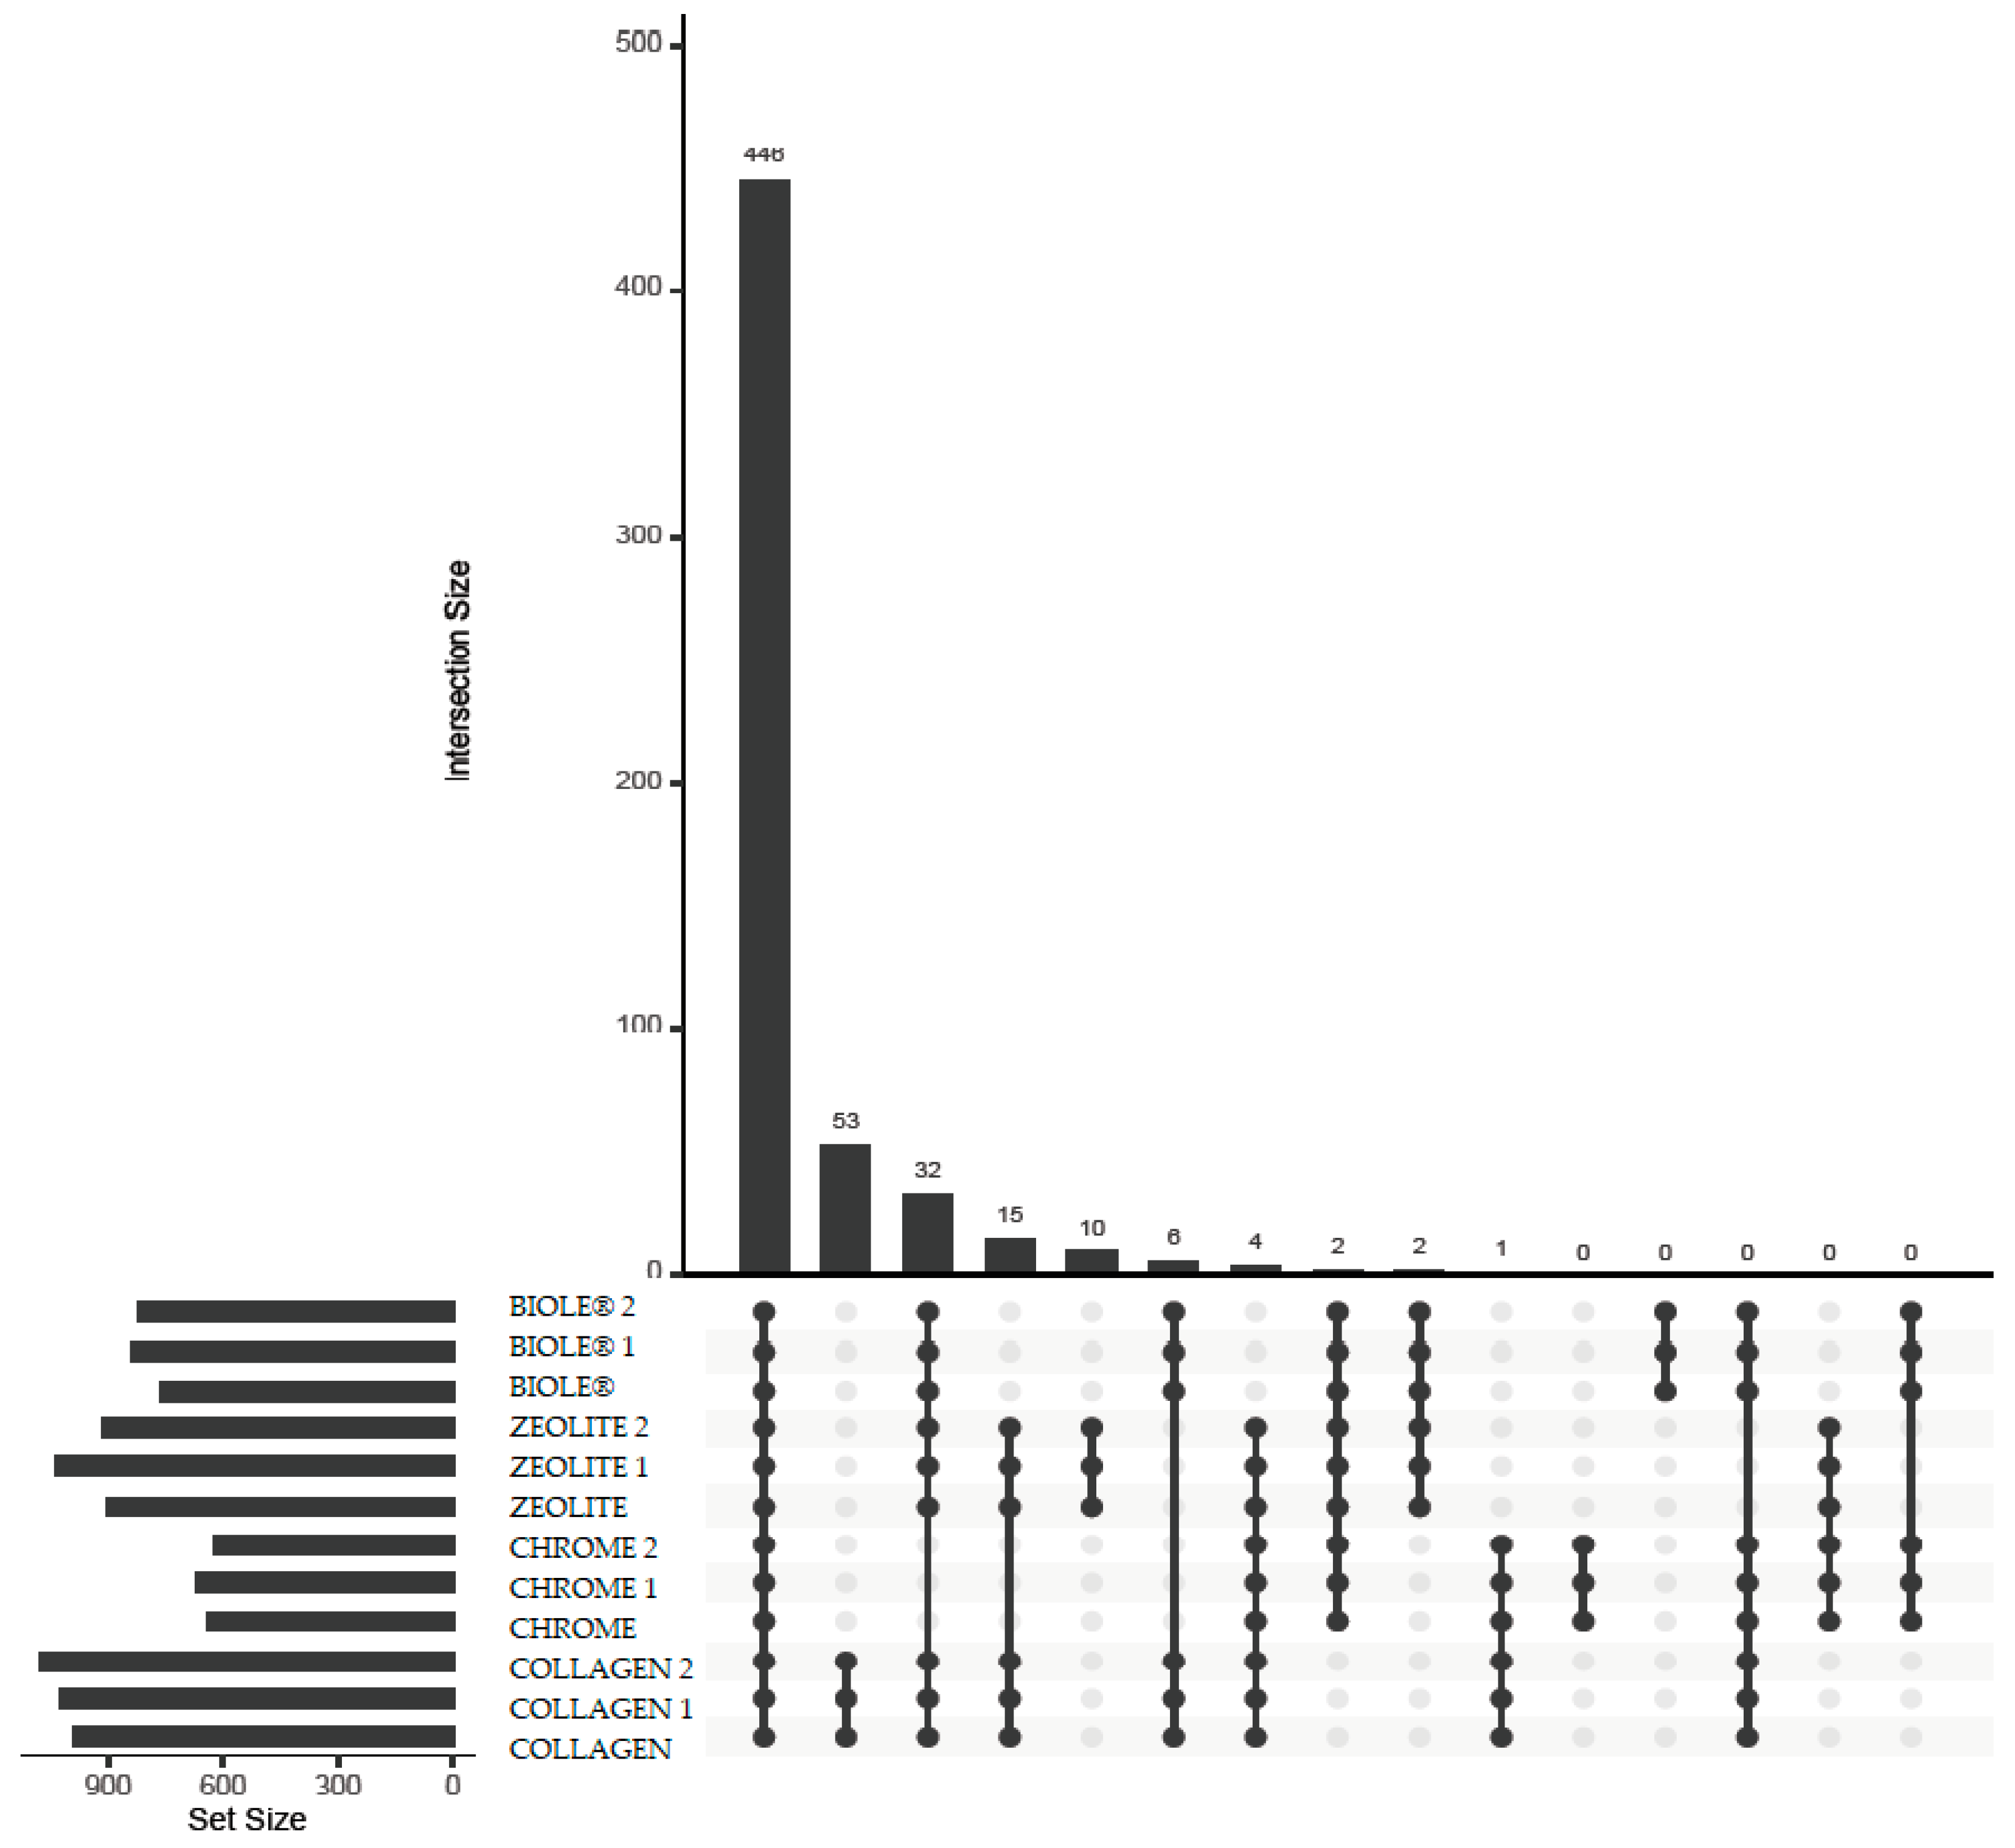
Figure 7.
Normalized expression counts per million (CPM) of proteases detected in the analysed samples. Sample codes corresponding to each leather type are detailed in Table 2. The 31 most abundant proteases are individually annotated, while those with lower relative abundance are grouped under the category “Others” for improved readability.
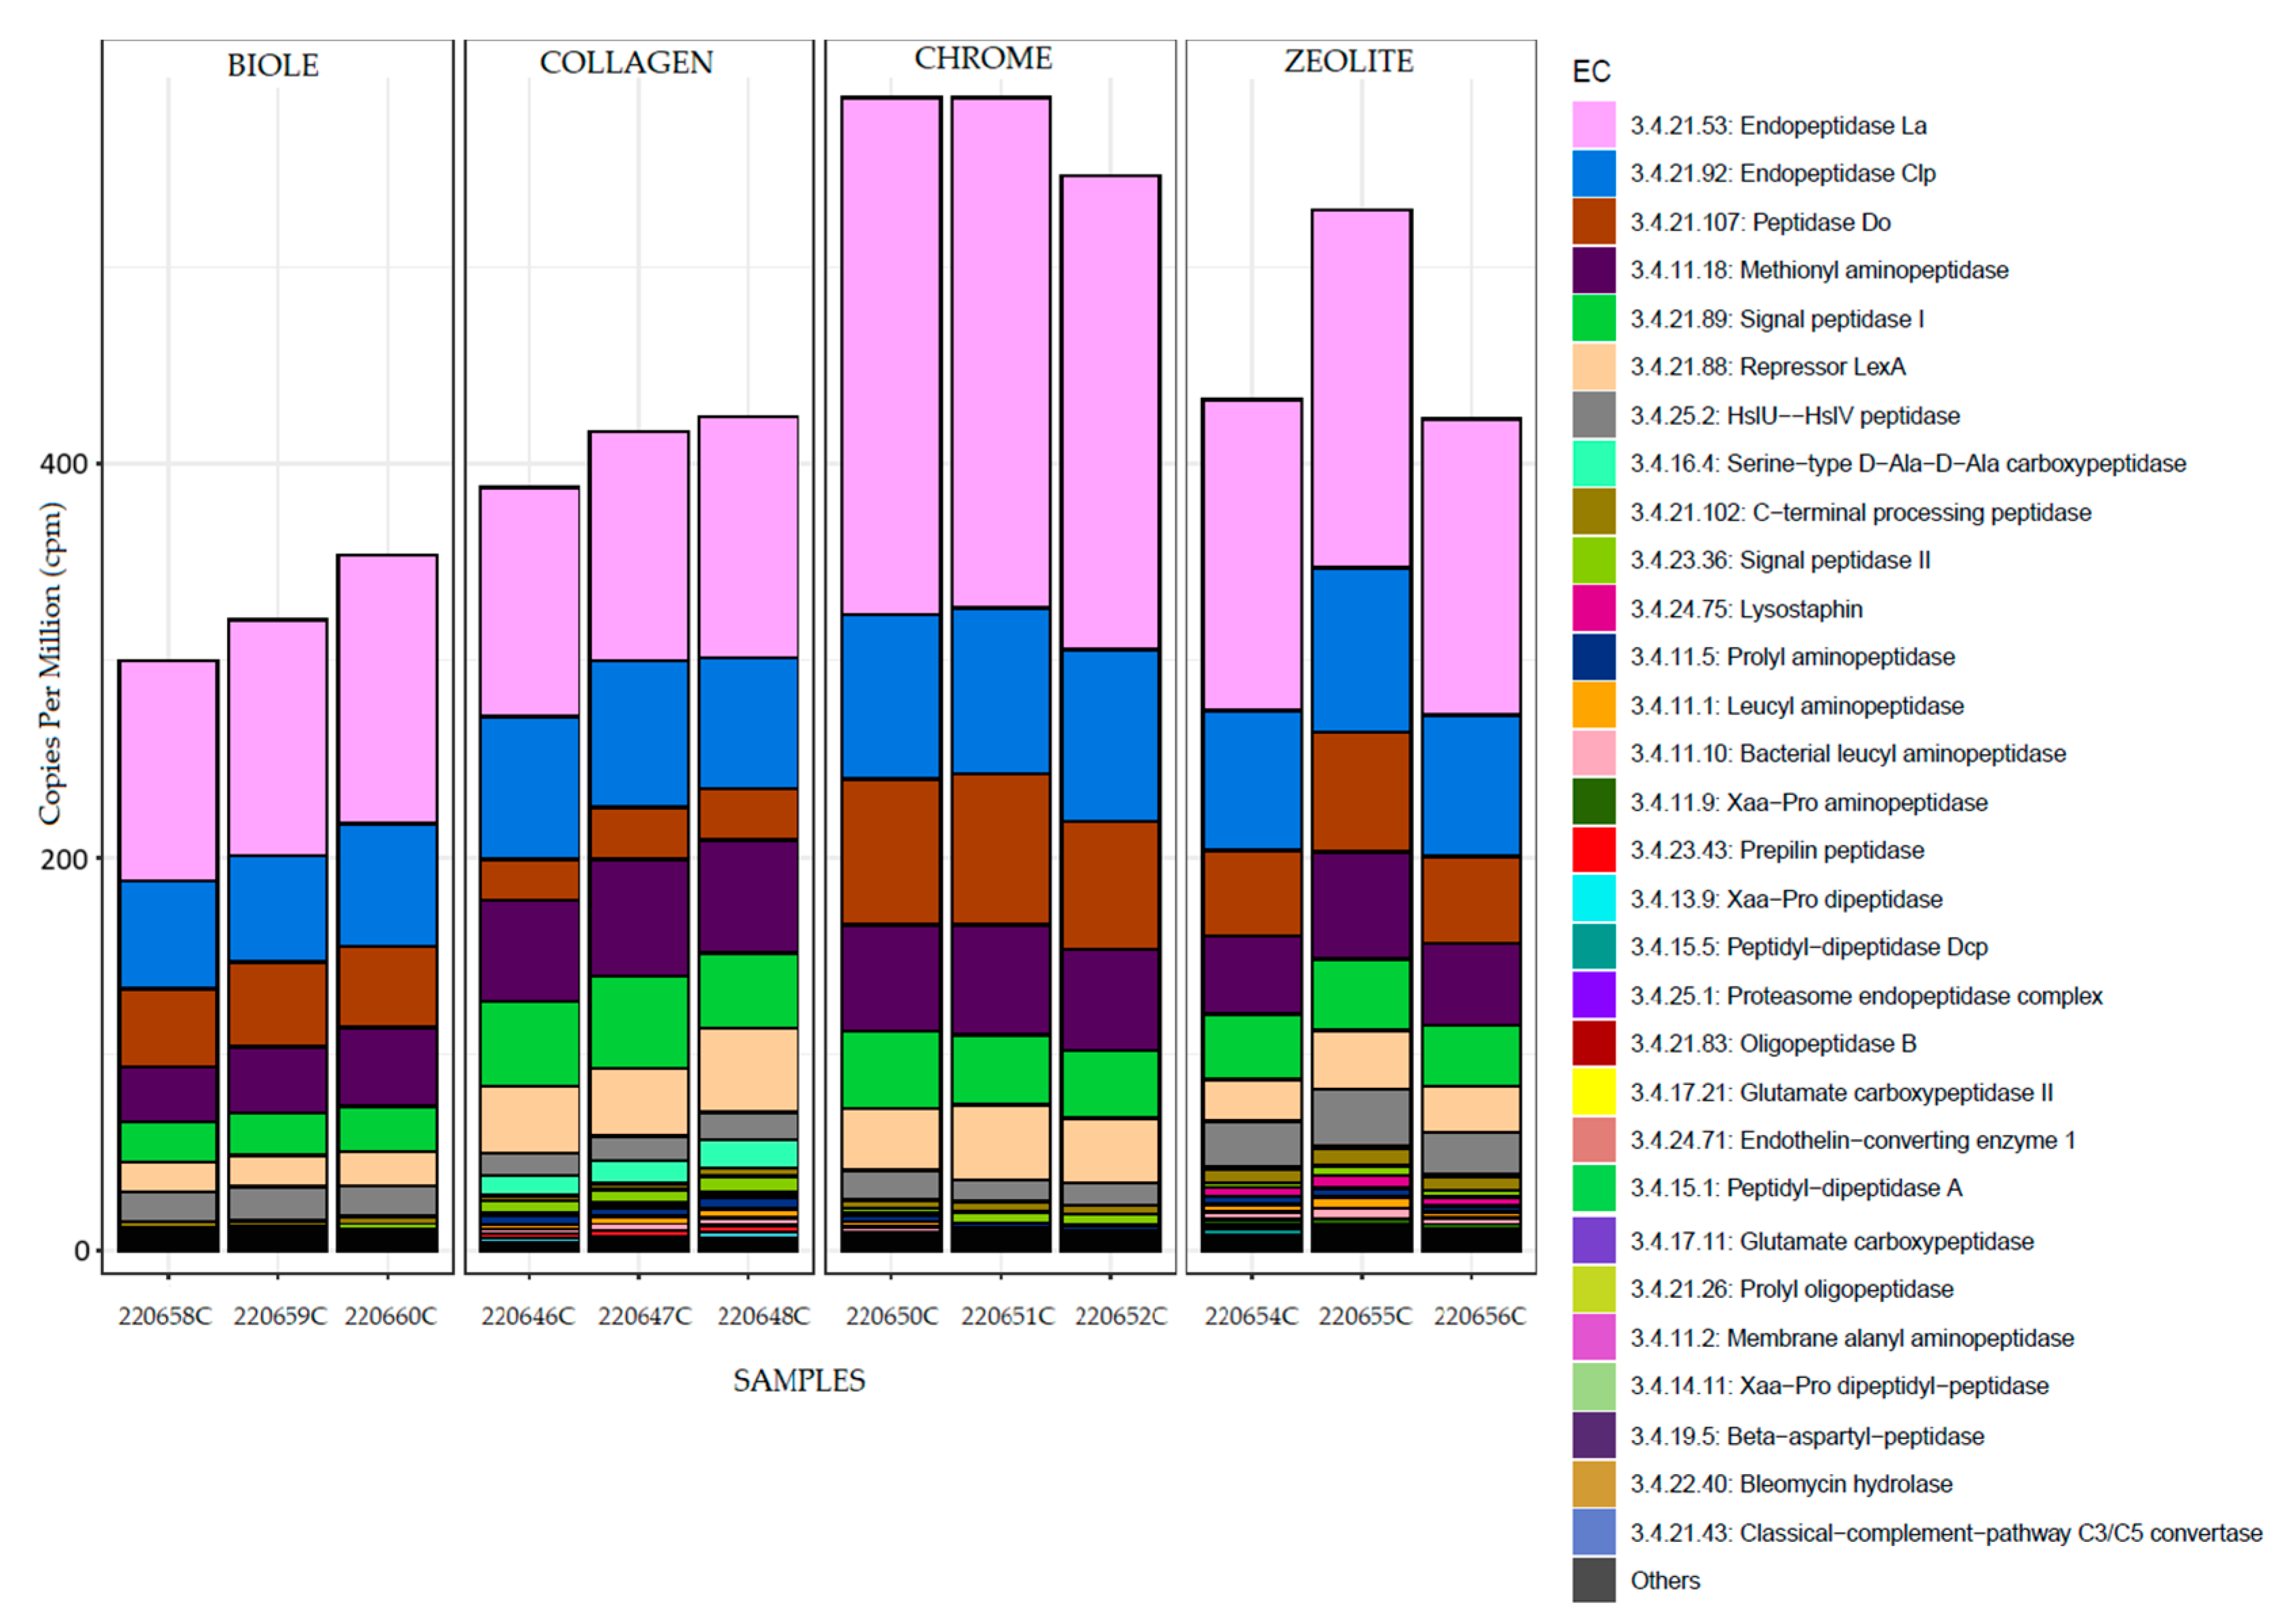
Figure 8.
Boxplot of alpha diversity for the functional expression profile of the analysed samples. The displayed parameters correspond to the Simpson index (Simpson) and the Shannon index (Shannon).
Figure 8.
Boxplot of alpha diversity for the functional expression profile of the analysed samples. The displayed parameters correspond to the Simpson index (Simpson) and the Shannon index (Shannon).
Figure 9.
Boxplot of alpha diversity for the functional expression profile of proteases present in the analysed samples. The displayed parameters correspond to the Simpson index (Simpson) and the Shannon index (Shannon).
Figure 9.
Boxplot of alpha diversity for the functional expression profile of proteases present in the analysed samples. The displayed parameters correspond to the Simpson index (Simpson) and the Shannon index (Shannon).
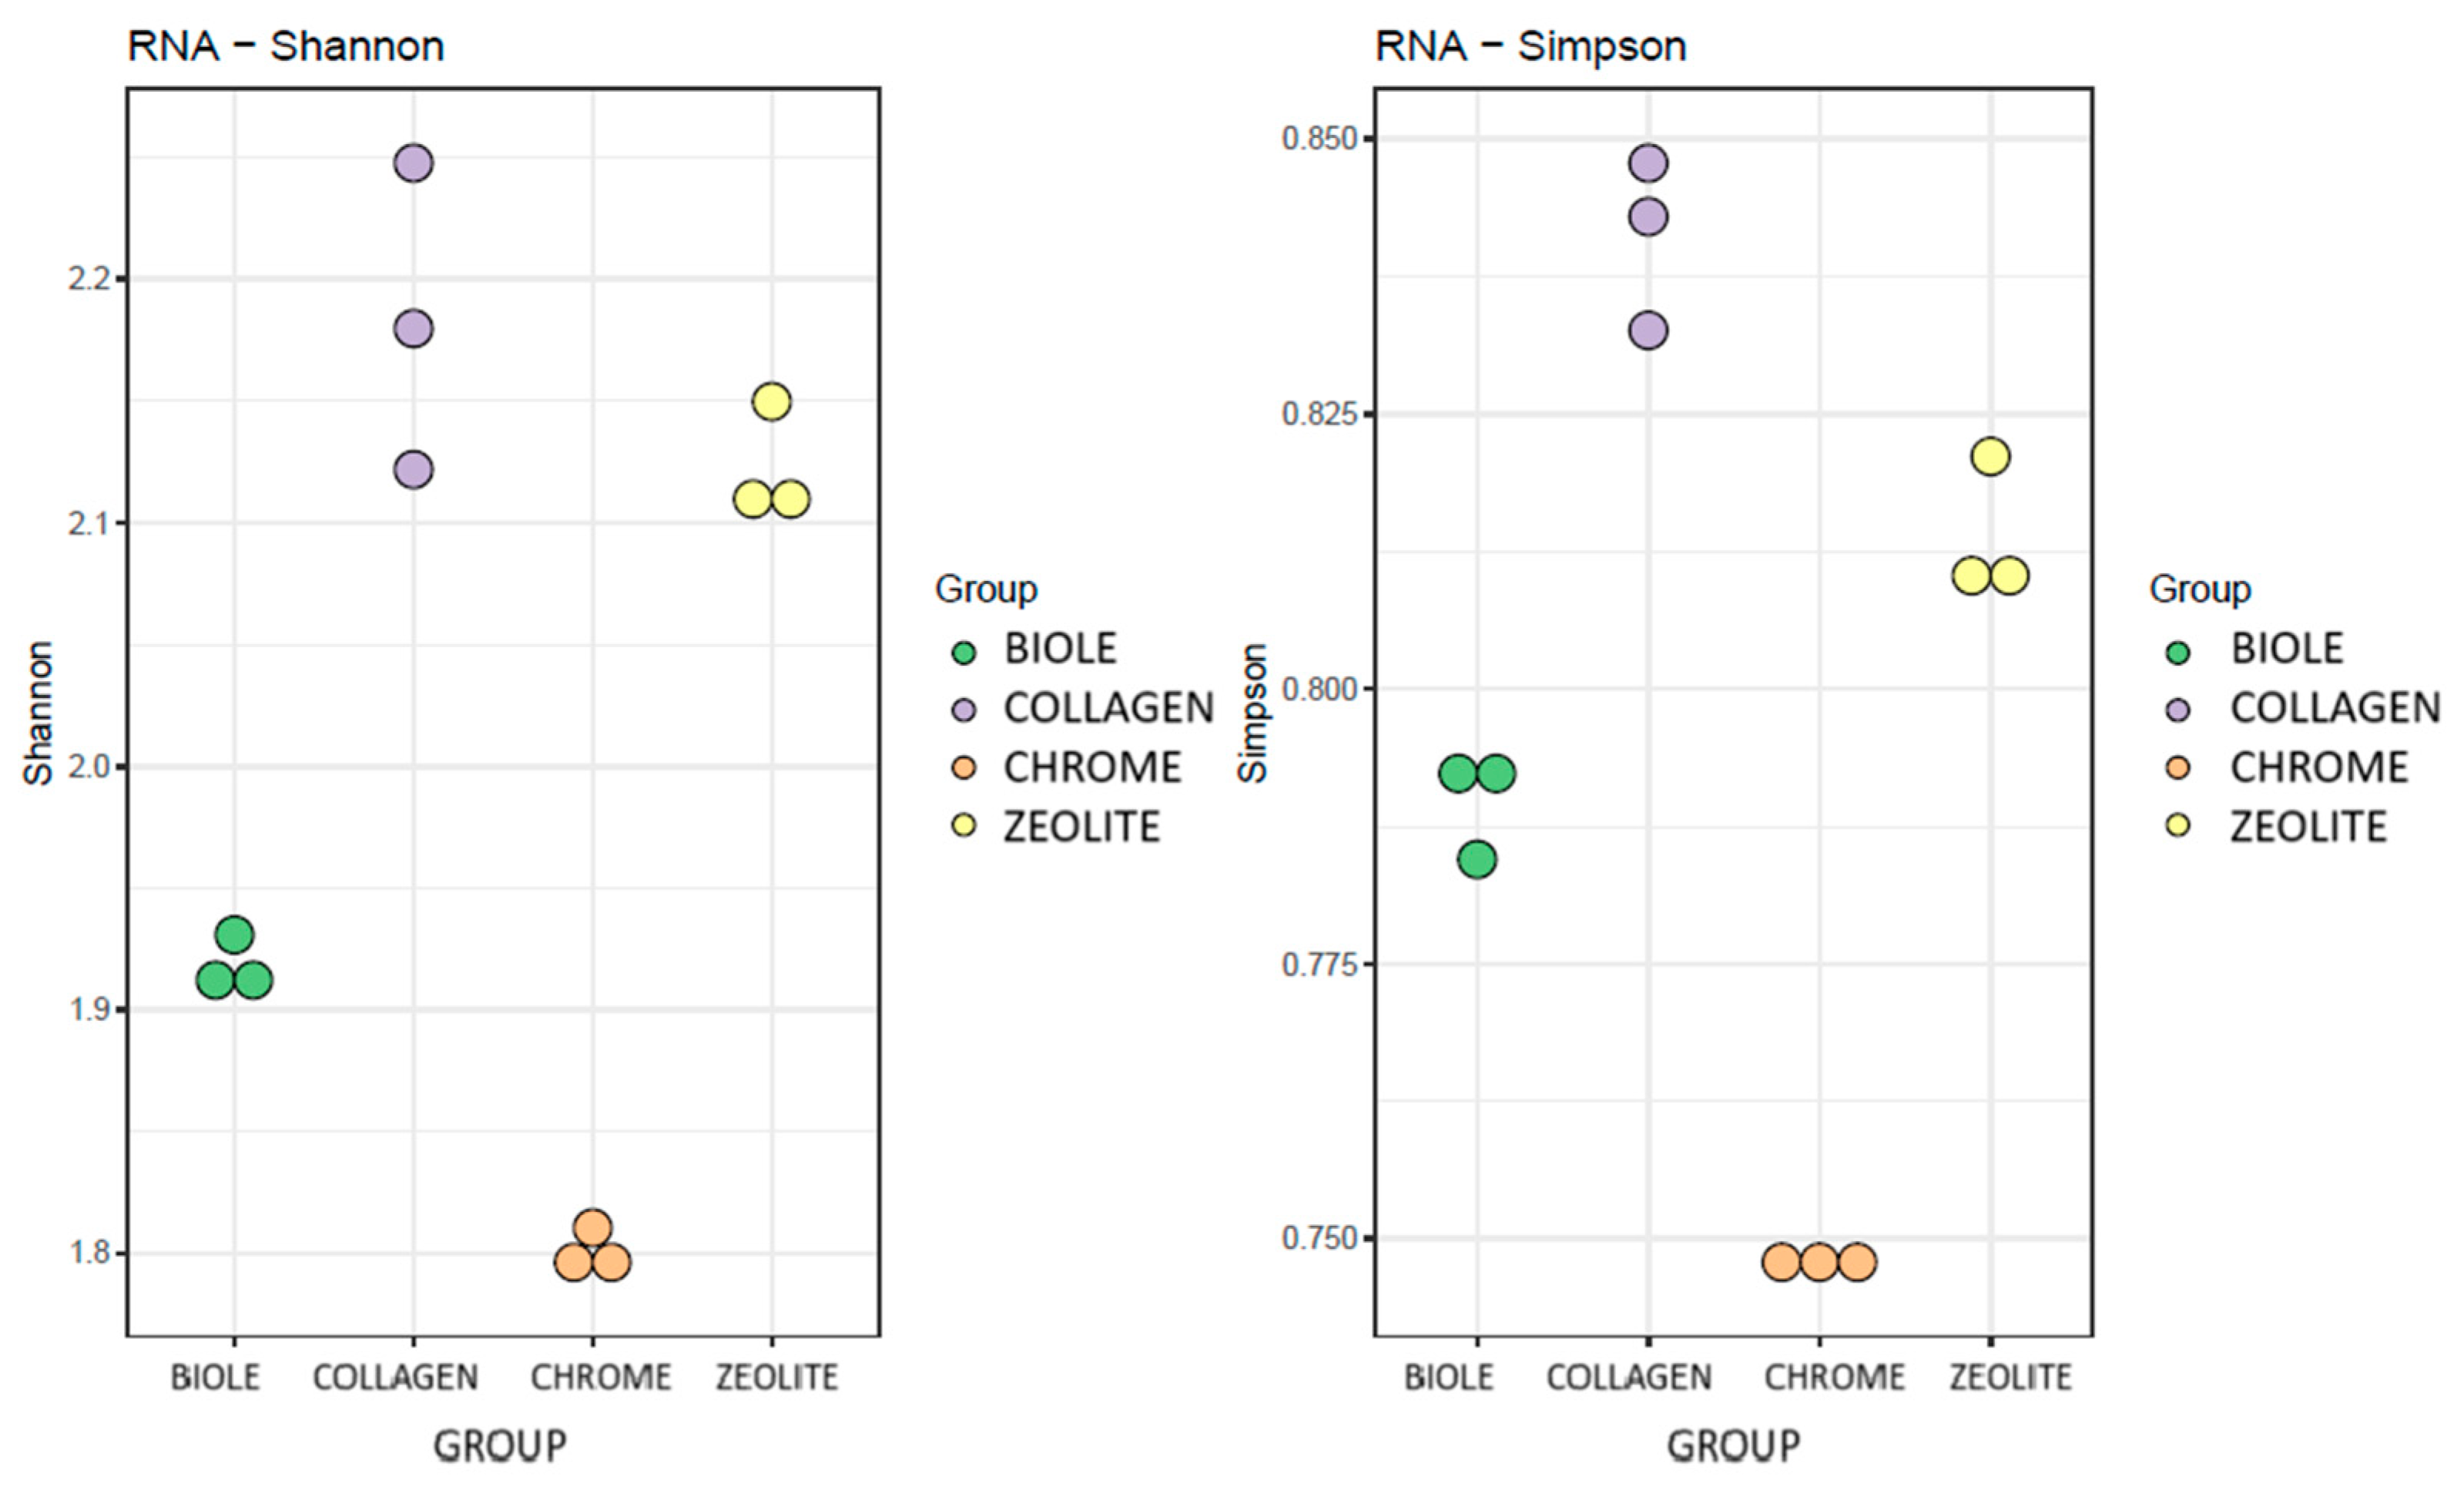
Figure 10.
Principal Coordinates Analysis (PCoA) showing enzymatic-level differences between the analysed groups, based on the Bray-Curtis distance matrix.
Figure 10.
Principal Coordinates Analysis (PCoA) showing enzymatic-level differences between the analysed groups, based on the Bray-Curtis distance matrix.
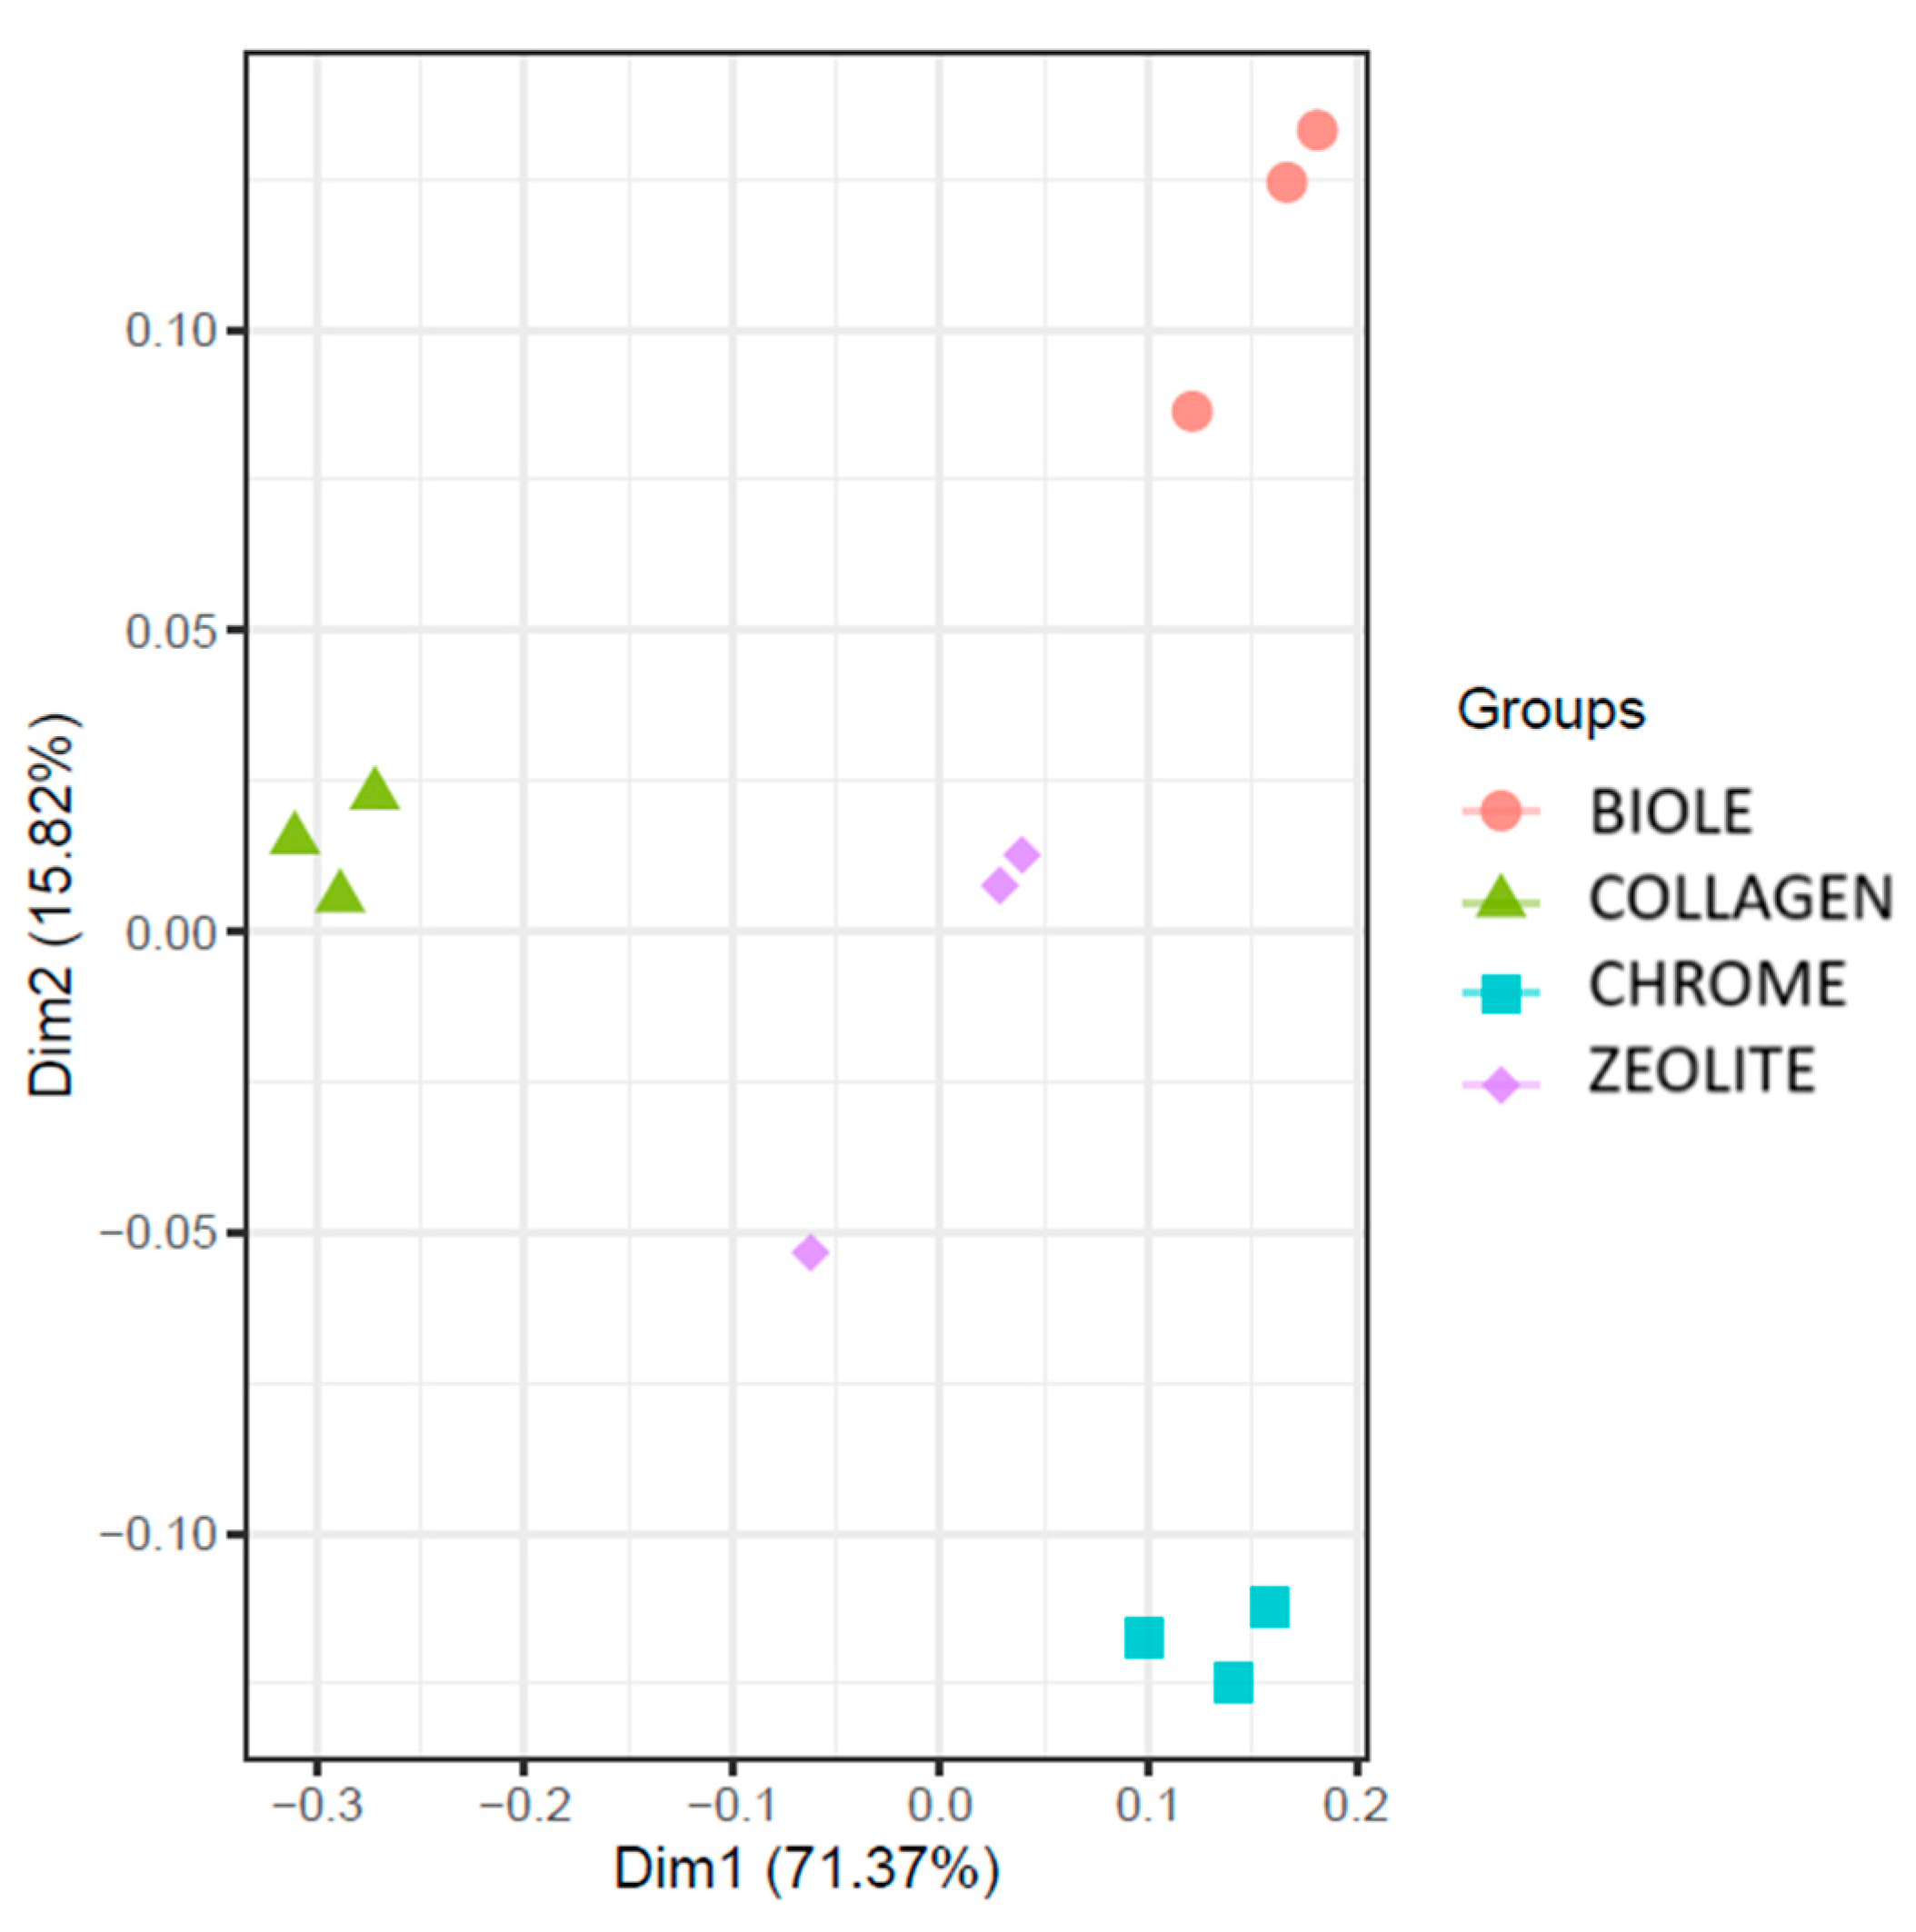
Figure 11.
Summary heatmap of functional marker identification using DESeq2. Enzyme codes highlighted in red indicate higher expression in the first compared group, whereas those highlighted in blue indicate higher expression in the second compared group. The statistical significance levels were as follows: (.) p < 0.1, (*) p < 0.05, (**) p < 0.01.
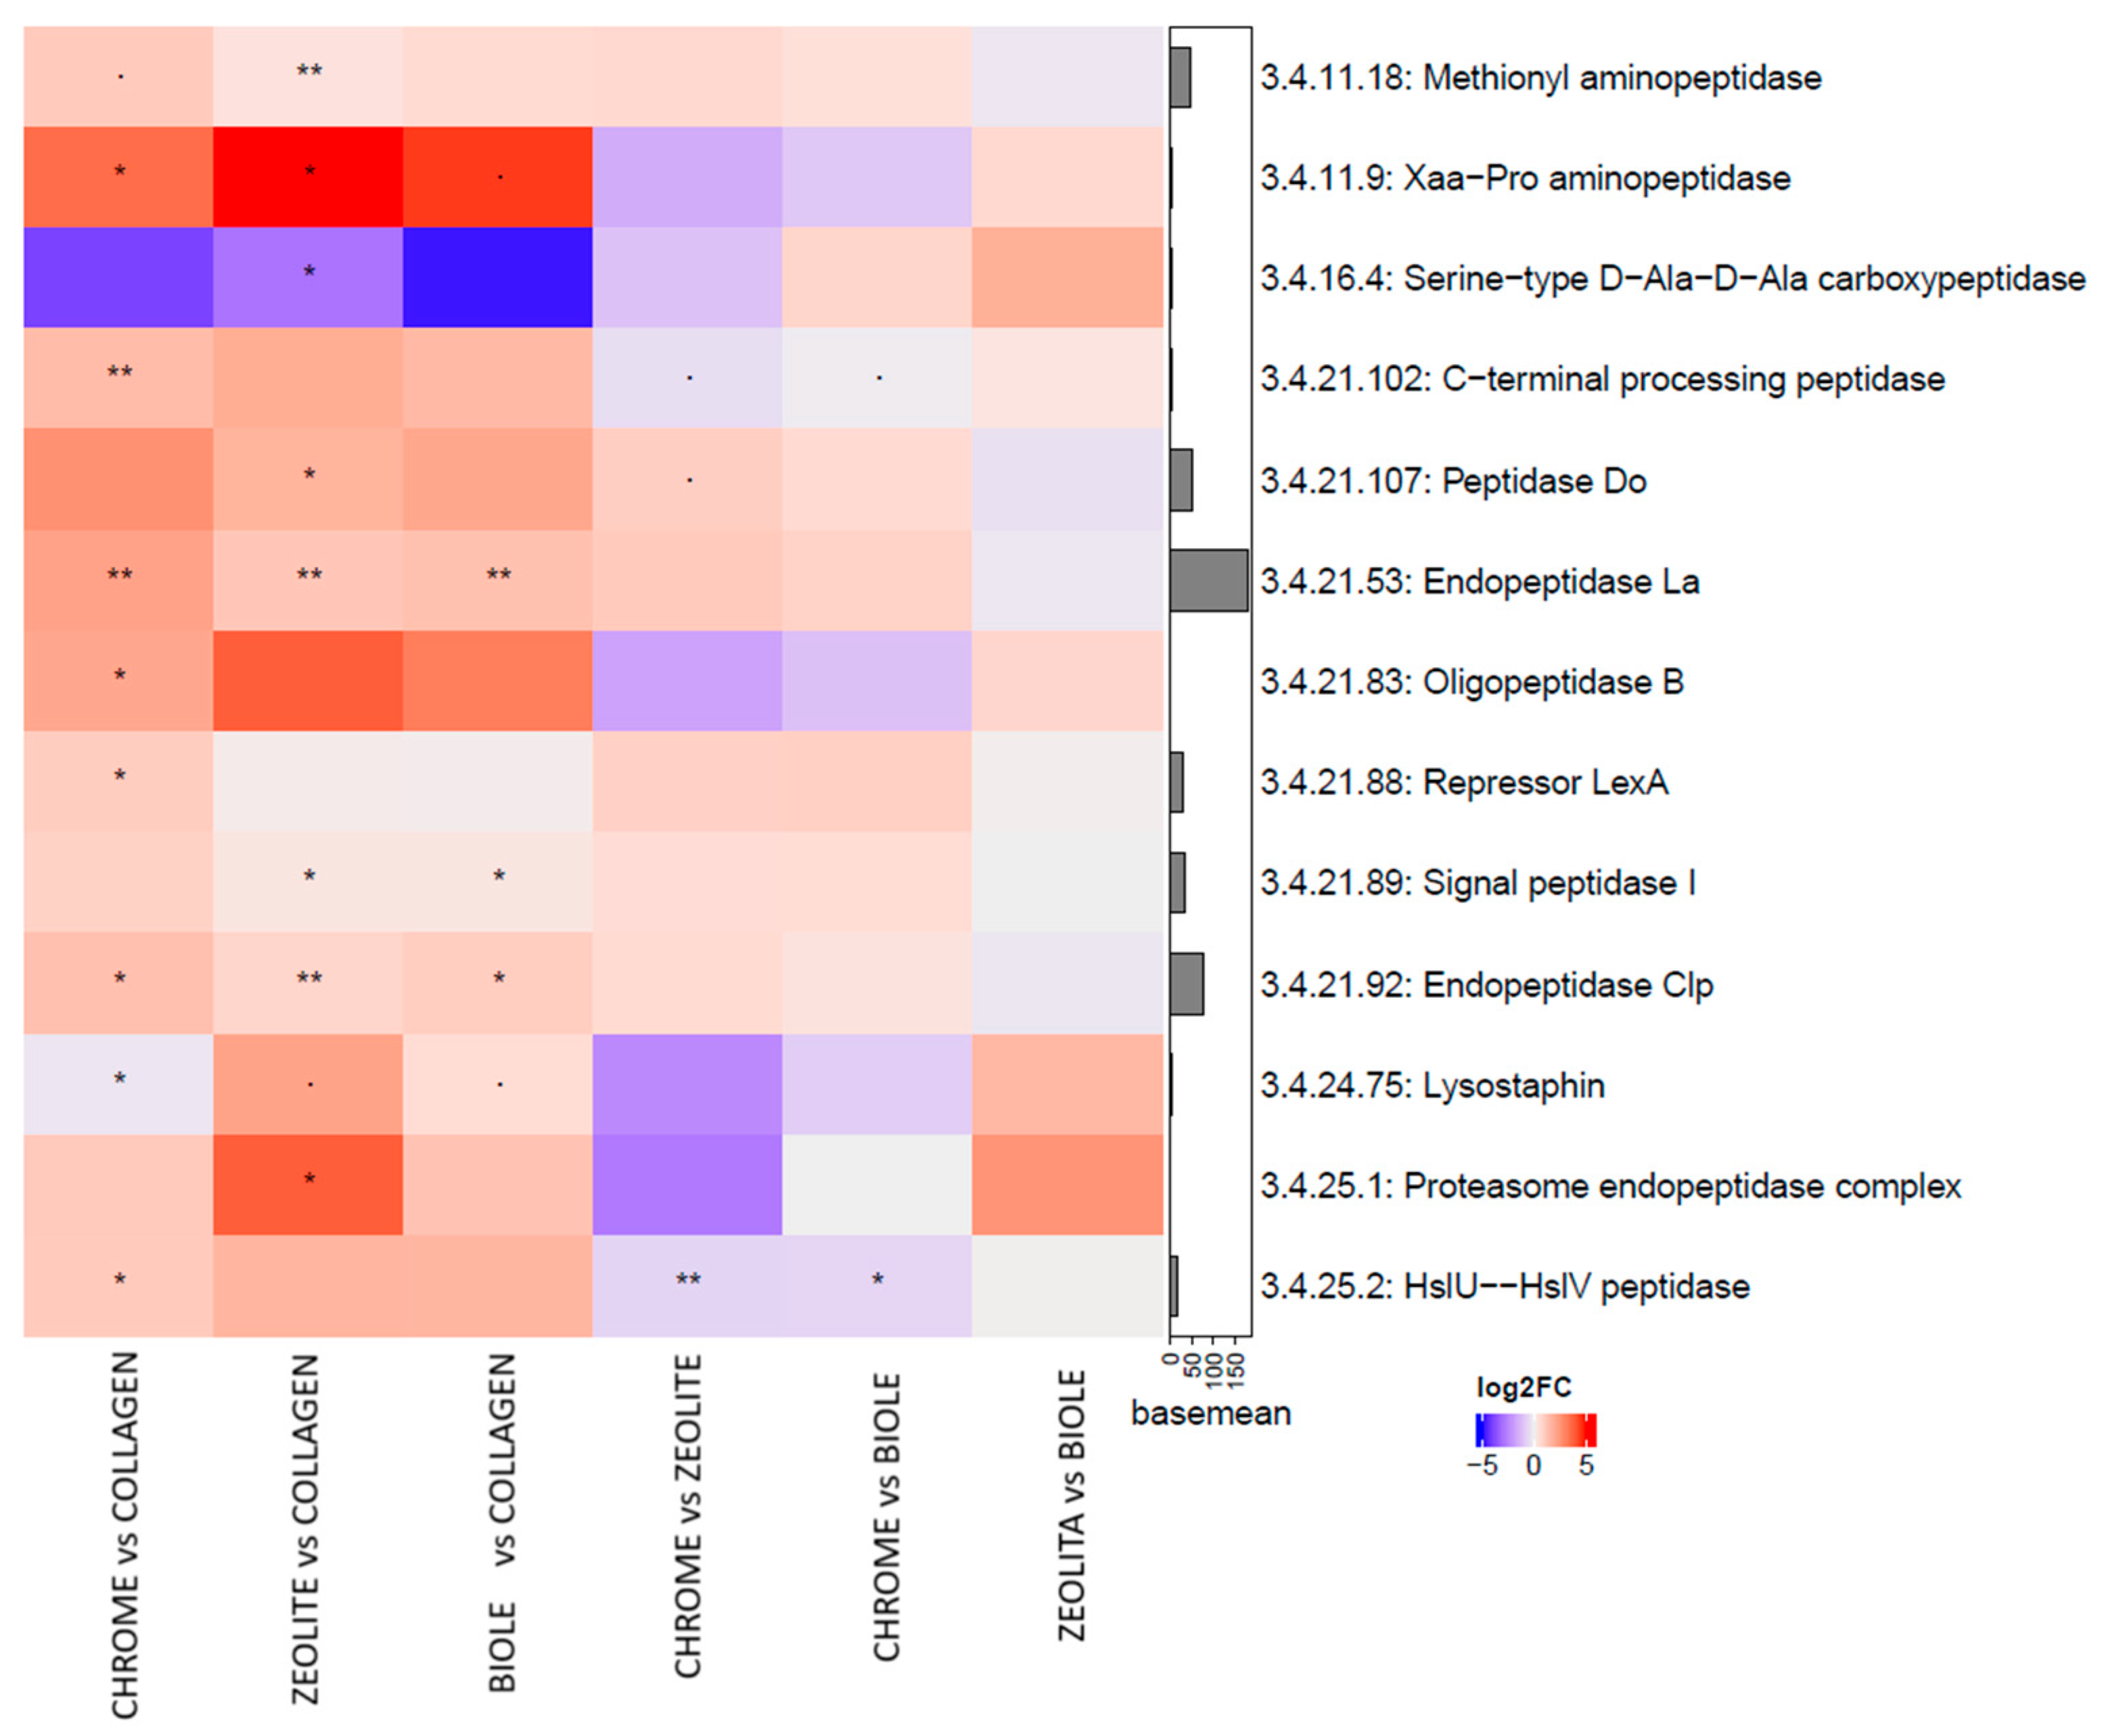

Table 1.
Elemental composition (%C, %N, %H, %S) of leather samples used in this study. Collagen was purchased from (Sigma-Aldrich ( MO, USA). Louis, Missouri, USA) was used as the positive control.
Table 1.
Elemental composition (%C, %N, %H, %S) of leather samples used in this study. Collagen was purchased from (Sigma-Aldrich ( MO, USA). Louis, Missouri, USA) was used as the positive control.
| Sample | Tanning type | % 12C | % N | % H | % S |
|---|---|---|---|---|---|
| Collagen | None | 51.0 | 10.3 | 7.0 | 0.9 |
| M3- Chrome AV-1821 | Chromium | 43.2 | 7.8 | 2.4 | 0.0 |
| M6-Zeolite | Zeolite | 42.2 | 6.2 | 2.3 | 0.0 |
| M7-Biole | Synthetic | 45.2 | 7.5 | 2.5 | 0.0 |
Table 2.
Overview of samples collected during the leather biodegradation assay (ISO 20136), including withdrawal times and corresponding analyses for taxonomic and functional profiling. An inoculum ratio of 50:50 corresponded to the initial inoculum used for the biodegradation assay. Samples marked with “rRNA” correspond to the taxonomic profiling samples.
| Erlenmeyer Position | Sample | Sample number | Time (hours) |
|---|---|---|---|
| - | Inoculum 50:50 | 220645 | 0 |
| 10 | Collagen-16S rRNA | 220649 | 65 |
| 11 | Chrome 16S rRNA | 220653 | 65 |
| 12 | Zeolite-16S rRNA | 220657 | 65 |
| 13 | Biole-16S rRNA | 220661 | 65 |
| 10 | Collagen | 220646C | 65 |
| 11 | Chrome | 220650C | 65 |
| 12 | Zeolite | 220654C | 65 |
| 13 | Biole | 220658C | 65 |
| 10 | Collagen | 220647C | 113 |
| 11 | Chrome | 220651C | 113 |
| 12 | Zeolite | 220655C | 113 |
| 13 | Biole | 220659C | 113 |
| 10 | Collagen | 220648C | 240 |
| 11 | Chrome | 220652C | 240 |
| 12 | Zeolite | 220656C | 240 |
| 13 | Biole | 220660C | 240 |
Table 4.
Sequencing results for the constructed libraries, detailing the sample reference, read orientation, total number of raw sequences obtained, average read length, total sequenced bases measured in megabases (Mb), and average quality score for forward reads (R1). Samples labelled with "16S rRNA" correspond to RNA extraction for transcriptomic analysis.
| Sample | Reference | Num. Secs | Length | Total Md | Quality |
|---|---|---|---|---|---|
| Inoculum 50:50 | 220645 | 195009 | 300.67 | 58.63 | 31.24 |
| Collagen-16S rRNA | 220649 | 179119 | 300.10 | 53.75 | 31.69 |
| Chrome 16S rRNA | 220653 | 192821 | 300.75 | 57.900 | 31.40 |
| Zeolite-16S rRNA | 220657 | 149047 | 299.06 | 44.57 | 31.74 |
| Biole-16S rRNA | 220661 | 185073 | 298.56 | 55.26 | 31.37 |
| Collagen | 220646C | 40,779,401 | 146.73 | 5983.51 | 35.61 |
| Chrome | 220650C | 27,157,015 | 144.75 | 3930.9 | 35.57 |
| Zeolite | 220654C | 44,536,186 | 145.3 | 6471.05 | 35.53 |
| Biole | 220658C | 45,961,880 | 146.2 | 6719.83 | 35.6 |
| Collagen-2 | 220647C | 42,666,212 | 144.72 | 6174.63 | 35.63 |
| Chrome-2 | 220651C | 35,226,190 | 147.57 | 5198.21 | 35.55 |
| Zeolite-2 | 220655C | 79,759,376 | 145.74 | 11624.14 | 35.56 |
| Biole-2 | 220659C | 48,060,016 | 146.31 | 7110.58 | 35.68 |
| Collagen-3 | 220648C | 54,492,337 | 145.85 | 7947.63 | 35.6 |
| Chrome-3 | 220652C | 31,816,911 | 145.14 | 4617.97 | 35.57 |
| Zeolite-3 | 220656C | 47,159,552 | 145.68 | 6870.22 | 35.59 |
| Biole-3 | 220660C | 49,271,570 | 146.86 | 7235.78 | 35.68 |
Disclaimer/Publisher’s Note: The statements, opinions and data contained in all publications are solely those of the individual author(s) and contributor(s) and not of MDPI and/or the editor(s). MDPI and/or the editor(s) disclaim responsibility for any injury to people or property resulting from any ideas, methods, instructions or products referred to in the content. |
© 2025 by the authors. Licensee MDPI, Basel, Switzerland. This article is an open access article distributed under the terms and conditions of the Creative Commons Attribution (CC BY) license (http://creativecommons.org/licenses/by/4.0/).
Copyright: This open access article is published under a Creative Commons CC BY 4.0 license, which permit the free download, distribution, and reuse, provided that the author and preprint are cited in any reuse.


