
Submitted:
02 April 2025
Posted:
03 April 2025
You are already at the latest version
Abstract
The study groups (n=40) included animals with ongoing pregnancy (P+; n=19), with fetal death (FD; n=12), and that were not pregnant (P-; n=8). Blood samples were taken on days 10, 20, 30, 40, 60, 80 and 150 post mating. USG controls were started on day 30. The P4 values was a highly significant different between P+ and P- animals on all days (p<0.001). In regards to AMH values, there was a significant difference between P+ and P- on the 30th day. P4 increased significantly from day 60 to 80 and it continued until day 150. The values remained at basal levels in the P- animals. In FD and P-, the P4 values reached its lowest values. In terms of P4 values, a rapid decrease was observed in the P- group from day 20 onwards. When P4 values was determined a significant statistically difference in P+ compared to FD. Differences in P4 values were also observed between single and twin mothers around days 20 and 40. In terms of AMH, statistically significant differences were identified between P+ and FD groups on the days 10, 20 and 30. In May-June both P4 and AMH values were found to be the highest in P+ sheep. Significant decreases were obtained in Hp values during the May-June period. AMH and Hp values were significantly higher in the body weight on the 10th day, and a significant decrease was observed in the values as the weights increased. These parameters were found to be important in P+ and P- discrimination, singleton and twinning discrimination (P4), FD determination (P4, AMH) and seasonal changes and weight changes (AMH, Hp).
Keywords:
Ewe
; pregnancy
; progesterone
; anti‐Müllerian hormone
; haptoglobin
1. Introduction
Sheep breeding holds an important place in animal farming and provides significant contributions to national economies and public health. The increase in sheep populations is largely driven by higher global meat and dairy consumption, making sheep one of the most important livestock for the economy and industry due to their high production and reproduction characteristics [1]. However, early recognition of pregnancy and the determination of changes in the pregnancy process are essential due to the low number of modern breeding facilities and the fact that most breeding is pasture based [2].
The determination of litter size in ewes is vital for pregnancy management. Particularly, during the last 4-6 weeks of gestation, appropriate dietary rationing is essential for the health of the mother for adequate development of the fetuses in uterus and for a healthy birth weight. Underfeeding or reduced food intake can lead to the birth of weak offspring and metabolic diseases such as pregnancy toxemia. Therefore, adequate and balanced diets can prevent pregnancy toxemia, ensure appropriate birth weight and increase the survival rate of offspring in multiple pregnancies [3,4].
Despite extensive research on domestic animals’ reproductive health, embryonic mortality remains a significant issue causing losses in both commercial breeding and scientific research. Although there is limited information on early fetal mortality in ewes, the rate of early fetal mortality varies between 3.5% and 12%. The diagnosis of pregnancy in ewes is possible with 100% accuracy through a frequency of 3.5 MHz by trans abdominal (TA) route from day 40 [2,5].
Haptoglobin (Hp) belongs to the group of plasma proteins of hepatic origin called acute phase proteins (APP). The acute phase response is physiological reaction that occurs in the first days following tissue injury and/or infection. In veterinary medicine, the determination of APP concentrations can provide useful information confirming the presence of an active inflammatory process. Studies have concluded that an Hp concentration of more than 0.4 g/L indicates an infection, and 0.2 g/L may indicate early or mild infection [6,7,8]. The concentration of APP is low in normal animal plasma; yet it increases 100 or 1000-fold due to inflammation and decreases abruptly 24-48 hours after injury and recovery. Some APPs are directly involved in the immune reaction of the animal, while others have the effect of protecting the tissue from pathogens and enzymes secreted by phagocytic cells [9,10].
Anti-Müllerian Hormone (AMH) is a dimeric glycoprotein, and a member of the transforming growth factor-β (TGF- β) superfamily. It is produced by granulosa cells of early antral follicles in the ovaries. Pursuant to some studies, circulating blood AMH concentrations area reliable endocrine marker for the size of the antral follicle population (AFP), is a key indicator of fertility [11]. In pregnant cows, a significant correlation was found between the number of small antral follicles counted by ovarian USG (Ultrasonography) and plasma AMH concentrations. Thus, these results suggest that the changes in AMH concentrations observed during the stage from pregnancy to the postpartum period are the result of numerical changes in the population of follicles secreting high AMH in the ovaries [12,13].
The concentration of progesterone (P4) in peripheral plasma rises gradually during the luteal phase in the first half of pregnancy, increases markedly at about 90 days post-mating, with levels peaking at 125 days post-mating and declining in the last few days before parturition. In sheep, during the first third of gestation, P4 is produced by the corpus luteum, production is taken over by the placenta after about 50 days post-insemination and removal of the ovaries after this day does not jeopardize fetal development [14,15].
This study aims to determine the changes in Hp, AMH and P4 values and the differences in P+, P- and FD cases determined by USG examinations during pregnancy in sheep. Additionally, the study aims to reveal the relationships between these parameters and phenomena such as maternal weight and twins.
2. Materials and Methods
2.1. Animals, Examinations and Sampling
This study consisted of 40 Assaf sheep ewes, with an average age of 3 years. All the animals were the same age. Day zero was determined as the day of mating, and the weight of the ewes was measured on day 10, 80 and 150. Blood samples were collected (vena jugularis) on days 10, 20, 30, 40, 60, 80 and 150 after mating and serum samples were stored at -20°C until analysis. USG controls were started on the day 30 (Mindray DP-10vet; 5.0 Mhz; Linear probe) and USG controls were continued until day 150 in accordance with the days of blood collection. The days of fetal death / fetal loss were noted, and USG controls were continued until day 150 post mating. Ewes that had previous pregnancies but were not pregnant at the next examination were recorded as having experienced fetal death.
Blood samples collected in January-February (A2), March-April (A4) and May-June (A6) were classified to make comparisons between the relevant periods. The sheep were divided into three groups: P+= Animals with ongoing pregnancy (n=19); FD= Animals with fetal death (Determined after two ultrasonographic controls; Ewes that were pregnant in any of the controls and were determined to be non-pregnant in the subsequent control; n=12); P-= Animals that were determined to be non-pregnant by USG control on the 30th and 40th days of gestation and whose pregnancy did not continue and were not remated (n=8).
2.2. Quantification of P4, AMH, Hp in Sera
Demeditec Progesterone ELISA Kit (DE1651, Lot.23K92) was used to quantitatively assess P4 levels in biological samples [16]. The ELISA procedure was performed following the manufacturer’s instructions and a standard curve was generated to determine P4 concentrations in unknown samples. The intra- and inter-assay coefficient of variations (%CV) were calculated as 3.06% and 6.45%, respectively. The results were expressed in ng/mL.
ANSHLABS AMH (Sheep) ELISA Kit (AL155, Lot.070722) was used for quantitative detection of AMH [17]. The ELISA procedure was performed according to the manufacturer’s instructions. Intra- and inter-assay coefficient of variation (%CV) were calculated as 4.65% and 6.90%, respectively. Results were expressed in ng/mL.
A competitive ELISA kit (ABCAM, AB291064, Lot.10272621, Cambridge, CB2 0AX, UK) was used to quantitatively measure Hp concentration [18]. The ELISA procedure was performed following the manufacturer’s instructions and a standard curve was generated to calculate Hp concentrations in unknown samples. The intra-assay and inter-assay coefficients of variation (%CV) were calculated as 4.19% and 7.00%, respectively. The results were given in µg/mL.
2.3. Statistical Analysis
SPSS Statistics 27.0, IBM, USA program was used for statistical analysis. Descriptive statistics were used to calculate the standard error (±SE) of the data. The homogeneity distribution of the values was tested using a Shapiro-Wilk normality test. For non-homogeneous data, the Kruskal Wallis test was applied to test the difference between two groups and the overall difference between all groups was identified and then the Mann Whitney U test was used to test the difference between each group. The Wilcoxon Test was used for samples that were not homogeneously distributed. T-Test was conducted for homogeneously distributed samples where p < 0.05 was used as the statistical significance criterion.
3. Results
There was a high statistically significant difference between P+ and P- animals in terms of P4 values on all days except day 10 (p < 0.001; p < 0.0001). P4 values were significantly higher in P+. In terms of AMH values, there was a significant difference between P+ and P- animals only on the 30th day (p < 0.01). Regarding the Hp values, there was no difference between P+ and P- animals on the days examined (Table 1).
Although P4 values were still high in P+ animals, they showed a significant decrease on days 30 and 40 (3.88 and 3.57 ng/mL) compared to day 10 (4.97 ng/mL), but increased significantly (5.05 and 5.77 ng/mL) from day 60 to day 80 (p < 0.001) and remained at the same level until day 150 (8.15 ng/mL). In P- animals, there was a significant decrease starting from day 20 of gestation compared to day 10 (p < 0.01) and this decrease remained at the same level until day 150 (<1 ng/mL; only at day 60: 1.70 ng/mL). In FD cases, P4 values started to decrease starting from day 20 (1.73 ng/mL) and this decrease reached lower levels (p < 0.01; p < 0.001) between days 40 and 150 (1.29 ng/mL and 0.23 ng/mL; Figure 1).
In P+, AMH values did not show any difference between days 10 and 60 but on 80th and 150th gestation days, AMH values decreased significantly (p < 0.001) compared to other days. In P-animals, AMH values decreased continuously until the 80th and 150th days (p < 0.01) except for the increase on the 60th day. There was no difference in AMH values between days in FD (Figure 2).
After a significant increase in Hp values, especially on day 20 of pregnancy (p < 0.001), significant decreases were observed starting from day 30 of pregnancy until the 150th day (p < 0.001). Similarly, Hp values in FD showed the same change as in pregnancy. In P- animals, significant decreases in Hp values were observed on days 80 and 150 (p < 0.05; Figure 3).
In terms of P4 values, a rapid decrease (0.73 ng/mL) was observed in P- animals starting from the 20th day, while P4 values remained above 1 ng/mL (1.73 ng/mL) in FD animals on the 20th day. Starting from the 20th day until the 40th day, the P4 value remained below 1 ng/mL in P- animals, while the value was above 1 ng/mL in FD animals (p < 0.01). On the following days, i.e., days 80 and 150, no statistically significant difference was identified between the two groups. There was no statistically significant difference between P- and FD in terms of AMH and Hp values in any period (Table 2).
In P+ group P4 levels, when the values were compared with FDs, there was a statistically significant difference between the two groups from day 20 and the mean values of P+ were significantly higher (p < 0.01; p < 0.001). In terms of AMH, statistically significant differences were identified between P+ and FD on days 10, 20 and 30 (p < 0.05; p < 0.001). In terms of Hp, there was no significant difference between P+ and FD (Table 3).
Considering the study findings, there were statistically significant differences between A2 and A4 periods and the A2 and A6 periods regarding P4 in P+ animals, and the mean values increased significantly during the following periods (A2: 4.46 ng/mL; A6 8.60 ng/mL; p < 0.0001). In the following periods, statistically significant increases were observed in AMH serum values in P+ animals in A6 period, compared to other periods (p < 0.05; p < 0.0001). On the other hand, statistically significant decreases were observed in Hp serum levels in P+ animals in A4 and A6 periods (p < 0.01; p < 0.001).
In P-, there was a significant decrease in Hp values in A6 period compared to A2 period (p < 0.01). However, in P- ewes, neither P4 nor AMH values showed any change in these periods. In terms of FD, a statistically significant continuous decrease was observed in P4 and HP values in the following periods (Table 4).
Based on the weights of animals on day 10, AMH serum values were significantly higher than the weights obtained on days 80 and 150 (p < 0.01; p < 0.001). The same result was also obtained in Hp serum values and the average value of serum values taken according to the weights on day 10 was significantly higher than the weights on days 80 and 150 p < 0.05; p < 0.01). There was no change in P4 values in relation to weights (Table 5).
When single births and twins were compared in terms of these parameters, a difference was obtained only in P4 values. P4 serum values of twin births were significantly higher than those of single births on days 30, 40, and 80 (p < 0.05; p < 0.01) (Figure 4).
4. Discussion
Historically, various studies on P4 changes during pregnancy and pregnancy detection in ewes have been conducted. However, the difference in P4 levels between P+ and P- ewes, the determination of embryonic deaths / losses by P4 levels, and the difference in P4 levels between single and multiple litters are still controversial [19,20,21].
This study concluded that P4 values increased significantly between days 10 and 150. This increase was found to be significantly higher (p < 0.001) starting from the day 60 of gestation. A study by Mukasa-Mugerwa and Viviani (1992) found that P4 values remained at high levels until approximately the 20th week. The authors revealed that there was a statistical difference between P4 measurements made at weekly intervals (p < 0.001). In the same study, serum P4 values, which averaged 8.4 ng/mL in the first trimester (day 35), increased to 13.8 ng/mL in the second trimester (day 75) and remained approximately at this value in the third trimester, with the main decrease in P4 values occurring on the 3rd day of prepartum [22]. Similarly, P4 measurements on the days determined in our study revealed significant differences and an increase between the following days (p < 0.001). Therefore, P4 values reached the highest level on days 80 and 150. P4 is released from the corpus luteum until approximately day 55 to 60 and after that, P4 is additionally released from the placenta in sheep [23,24]. The reason for the increase in P4 values on the days in question would be the additional P4 produced from the placenta. The high level and capacity of luteal tissue in ewes until approximately day 142 of gestation indicates that there is a continuous steroidogenic release [25]. Kaulfuss et al. [26] also argued that this difference occurred due to the increase in P4 in pregnant ewes due to multiple ovulations.
In the present study, the diagnosis of P+ or P- was determined by USG controls performed on days 30 and 40 and controls continued until day 150. Therefore, the blood values on days 10 and 20 were evaluated retrospectively. The data obtained from P- animals showed P4 values, which were 3.99 ng/mL on day 10 after mating, decreased to less than 1ng/mL starting from day 20, and decreased to 0.26 ng/mL on day 150. Karen et al. [27] found that the average P4 serum value in P- animals was 0.4 ng/mL starting from the day 18 and P4 values in these animals remained between 0.2 ng/mL and 0.4 ng/mL until day 50. This difference between P+ and P- animals was also experienced in a study conducted by Al-Mousawe and Ibrahim [28]. In our study, the P4 value was 0.73 ng/mL on day 20 and 0.07 ng/mL and 0.32 ng/mL on days 40 and 80, supporting the findings of these authors. Statistically significant differences (p < 0.0001) were obtained between P+ and P- ewes on all days except day 10, including the 150th day, and it was determined that the P4 values of P+ animals were significantly higher. Weigel et al. (1981) obtained the first serum sample on the 18th day, where the P4 values of ewes were significantly lower, and this low P4 level (<1.48 ng/mL) persisted until the 70th day. One of the important methods to determine the difference between P+ and P- is the measurement of P4 (<1ng/mL) on days 17-21 after mating [27]. In this study, the mean values of P4 in P- ewes were > 1ng/mL on the 10th and 60th days and the values were found to be < 1ng/mL on the 20th day. In a study in which both Pregnancy Associated Glycoprotein (PAG) and P4 serum values were measured in goats, both PAG and P4 values were significantly lower in P- ewes between 22nd and 60th days. During this period, P4 values were found to be significantly lower in P- ewes (0.68 ng/mL (day 60) and 1.16 ng/mL (day 22) compared to P+ ewes (8.0 ng/mL and 2.8 ng/mL) [29]. It is emphasized that the non-return to estrous (NRE) method alone is not sufficient for the diagnosis of P- [30,31]. Therefore, within the context of this study, both NRE and USG methods were used together to determine P- [32].
Early embryonic deaths in ewes occur approximately 25%-50% of the time and are caused by luteal insufficiencies, inadequate release of P4 and failure of the uterus to recognize pregnancy due to various factors [33]. Embryonic deaths occur mostly before day 18 [34,35]. Late embryonic deaths occur on days 25-45, while fetal losses occur after day 45 [36]. In this study, FDs were determined after the controls on days 30 and 40. Embryonic deaths can be determined between the 25th and 45th days, and FDs can occur in later periods up to and including the 150th day [36]. FDs were identified on days 60, 80 and 150 in this study. The fetal mortality rate of this study was 30%. Our results showed that there was no statistically significant difference between P+ and FD in terms of P4 on day 10 after mating. On the other days when P4 serum values were examined (starting from day 20), there was a statistically significant difference (p < 0.0001) between P+ and FD. However, serum P4 values were between 1.28 ng/mL and 2.05 ng/mL in FD between the days 20 and 60. Alternatively, the levels were determined to be < 1ng/mL on days 80 and 150. The fact that P4 values were significantly lower than the P+ group from the beginning and decreased to basal values on the days when fetal losses were determined may be an important indicator in terms of fetal losses. It was reflected that ≥ 2.5 ng/mL value was 91.4% successful in differentiating pregnancy diagnosis in P+ and this value was 98.3% and 85.3% successful in positive and negative diagnosis [19]. The fact that pregnancy levels were above this threshold, while FD levels were well below 2.5 ng/mL (< 1 ng/mL), implies that these specific measurements could play a crucial role in predicting fetal losses. P4 measurements have been shown to be an important parameter in early or late embryonic deaths in ewes [37,38]. An important finding from this study is that P4 values were very low at different periods of FDs (8 ng/mL at day 60; 2 ng/mL at day 80; 2 ng/mL at day 150), especially starting from day 40.
Statistically significant differences in P4 values between single and twin lambs were determined at days 30, 40 and 80. Significant differences in P4 values between single and multiple lambs have been reported in different publications [39,40,41]. They attributed the higher P4 value in twin or triplet pregnancies, compared to single fetus pregnancies, to the increase in CL number. A high positive correlation was found between the number of fetuses, CL diameter and P4 values [42]. In our study, there was no difference between singletons and twins after day 80, which may be related to the release of other placental hormones besides P4 during this period. It should be noted that between days 30 and 80, the P4 values of twins were significantly higher than those of singletons. Research has demonstrated that placental P4 production initially increases between 50 and 70 days of gestation, followed by a second surge between 90 and 120 days. Both phases of heightened P4 secretion were observed in the increased P4 production in placental explants cultured in the lab, as well as in the activity of 3 beta-hydroxysteroid dehydrogenase within the tissue [43]. During this phase, the LH level remained consistently low and unchanged [23]. These hormonal changes after day 80 may have made it difficult to distinguish between singletons and twins
In consideration with the study results, P4 was statistically different between A2 and A4 months and A2 and A6 periods in P+ animals and the values increased significantly in the following months (A2: 4.46 ng/mL; A4: 5.56ng/mL; A6 8.60 ng/mL; p < 0.0001). According to a study conducted between June-September and March-May, P4 levels were found to be significantly higher in June-September than in March-May [44]. Since the highest P4 values were obtained in May-June under our study reinforces the idea that these values may be related to suitable air temperatures and comfortable shelter conditions offered according to the feeding and feeding periods from region to region. For example, Spencer and Bazer [45] revealed that prolactin hormone peaks in mother ewes starting from day 50 until day 120-130 of pregnancy. The fact that P4 values show a seasonal increase in values different from the P4 changes in the later stages of pregnancy suggests that these differences are seasonal.
AMH serum values decreased significantly in both P+ and P- sheep, especially on the days 80 and 150 compared to the initial data (p < 0.05; p < 0.0001). There were no changes in AMH serum values in FDs in the following days. AMH forms a wave-like dynamic profile during pregnancy. In pregnant heifers, AMH serum levels were high in the first trimester, while a significant decrease in serum levels was observed before or close to delivery. Immunohistochemistry studies have proven that AMH is expressed in healthy preantral and antral follicles on day 60 of gestation. Intrafollicular AMH concentration was not different in pregnant and non-pregnant cows at day 60. In this study, generally, no difference was found in AMH serum values on all days except day 30. Both the variation of AMH serum levels between days and the difference between P+ and P- on day 30 may be attributed to the low number of follicles releasing high levels of AMH [12]. In non-fertile ewes, the number of follicles is lower, resulting in lower AMH blood concentrations [46].
Interestingly, there were significant statistical differences (p < 0.05; p < 0.001) in AMH concentrations between P+ and FD on days 10, 20 and 30. There are very few publications on AMH in relation to pregnancy status, which leads to controversial results [47]. The results have shown that AMH is positively correlated with the number of histologically determined primordial, transitory primary, secondary and antral healthy follicles [48]. Hence, low AMH values caused low pregnancy rates in cows [49] and high AMH values eight days after artificial insemination increased pregnancy rates [50]. Our findings show that AMH serum values were significantly higher in P+ ewes from the 10th day until the 30th day compared to the FD group. The fact that high intrafollicular P4 and AMH values affect fertility also supports our findings in this study [47]. Consequently, there was no difference between P- ewes and FD indicates that high AMH values are more important in terms of ovarian activity.
An interesting finding in terms of AMH is that the values in P+ ewes increased to the highest level in A4. The increase of AMH serum value from 1.91 ng/mL in A4 months to 8.15 ng/mL in A6 months (p < 0.0001) is a result that should be taken into consideration and reveals that AMH values change according to different months/seasons. To authors’ knowledge, there is no publication on this subject directly related to the change of AMH by the seasons. AMH values did not show any difference in the gestation period until day 60, but significantly low values were detected on days 80 and 150. On the contrary, significant increases in AMH values were determined in the following A6 period. Moreover, malnutrition influences ovarian structures in heifers and accordingly decreases plasma AMH secretion [51]. This result can be explained by the provision of quality grass and feed in May-June and the ability of animals to move outside to pasture.
The absence of any seasonal change in the P- and FD group may be related to the decrease in the number and quality of follicles and follicle degeneration during this period (A6) [52]. Evaluating pregnancy rates due to seasonal variations is out of scope of the present study. It is essential to analyze the reproductive outcomes in a substantial herd in relation to the A6 period and the AMH values according to the variations in AMH. How-ever, given that these values may fluctuate per country, it is essential to specify the country and the timeframe during which the elevated values are observed.
Within the framework of this study, AMH values decreased significantly with increasing sheep body weight compared to low body weight. In a study conducted in dogs, there were statistically significant differences in AMH serum values between small, medium and large giant breeds [53]. Likewise, the findings of Evci et al. [54], showed AMH values were low in dogs weighing < 10 kg, while the values decreased significantly in dogs weighing 25 kg. The AMH values obtained in sheep showed the same decreasing trend in this study. Such a trend of decreasing AMH levels may be a result of FSH release, and changes in follicle numbers due to weight gain, this decrease in AMH values due to FSH release was also reported by Monniaux et al. [12]. Additionally, the relationship between this decrease in AMH values and subclinical metabolic diseases should be examined in further study. It is noteworthy that changes in P4 values in relation to body weight did not show a statistically significant difference; however, AMH values were significantly lower with weight gain (correlation = -0.897). In terms of Hp, the same course was observed in P+ and P- sheep in the following days. On days 80 and 150, significant decreases were observed in both groups compared to the initial values. The fact that Hp values reached low levels in both FD and P- animals across all the days examined in the study indicates that Hp measurements are not an important parameter for FD discrimination. This situation was the same for P- and P + and there was no significant difference between P- and P+. While statistically significant increases were obtained in AMH and P4 values in P+ animals in A6 (p < 0.0001), in contrast Hp values showed a decreasing trend in all groups (P+, P- and FD). Therefore, seasons did not have a different effect on Hp in these groups. Pursuant to a study by Ulaankhuu et al. [10], Hp values were highest in February. In this study, no distinction was made between P+, P- and FD, and no difference was identified between such groups respectively indicating that seasons do not influence these factors in terms of Hp.
Hp has been shown to act as an indicator in various infectious diseases [55]. where significant increases in Hp values were observed in cases of pregnancy toxemia compared to normal healthy ewes [56,57,58]. These data show that Hp values are more influenced during infections or metabolic disorders.
As in AMH value, this study noted that significant decreases occurred in Hp serum values as ewe weights increased (p < 0.05; p < 0.01). On the other hand, Hp values showed significant decreases in the period two weeks before delivery [59]. In pigs, a high correlation between body weight gain and Hp serum levels was also identified accordingly [60]. Free hemoglobin has toxic and oxidative effects in the blood. By binding to hemoglobin, the formation of oxygen radicals is prevented by the effect of iron and thus oxidative damages through hemolysis are eliminated. Thus, Hp plays a role in the antioxidant system [59]. Hp also has a bacteriostatic effect because it binds iron and inhibits bacterial growth by binding iron [61]. Apparently, in the following days, body weight gain (depending on the growth of the offspring or pups) leads to a decrease in Hp values as the sheep’s mechanism protects itself due to this above-mentioned mechanism.
5. Conclusions
In conclusion, this study found that the pregnancy process can be monitored based on the increases in P4 obtained depending on the days while the P+ and P- ewes can be determined from day 20 of pregnancy since FD can be revealed with low P4 serum results obtained compared to P+ ewes. Moreover, P4 values are significantly lower in ewes with low weight, concluding that special attention should be given to these animals. Determination of single and twin pregnancies from P4 values should be considered in terms of nutrition and protection against metabolic diseases. With regards to the AMH, the significant differences between P+ and FD from day 10 to day 30 suggests that this may be related to the poorer follicle quality of FD compared to the P+ group. Whether this is related to the Graaf follicle at the time of ram mating or to follicle wave follicles is the subject of a separate study. Where the mean AMH values were low (statistically not significant) in P- animals from day 20 onwards, and that there was a difference between P+ and P- animals only on day 30 suggests that there may be a relationship between AMH values and the continuation of pregnancy. The fact that P4 and AMH values were high in A6 period suggests that higher productivity can be obtained by synchronization in ewes and intensifying ram siring in these months. The significant decrease in AMH values in ewes with high body weight in the later gestation days (150th day), together with other hormonal data, indicates that it may be an important parameter for impending parturition. The decreases in Hp values due to the increase in body weight indicate that the body regulates its own defense mechanism.
Author Contributions
Conceptualization, S.A., A.W and H.G.O.; methodology, S.A. and A.W; validation, S.A., A.W and S.S.; investigation, H.G.O., F.Z.T., I.D. and S.S.; resources, A.W.; data curation, H.G.O., S.A. and S.S; writing—original draft preparation, S.A. and H.G.O.; writing—review and editing, S.A., H.G.O., F.Z.T., İ.D., S.S and A.W.; visualization, S.A. and H.G.O.; supervision, S.A. and I.D. All authors have read and agreed to the published version of the manuscript.
Funding
None.
Institutional Review Board Statement
The study was conducted according to the guidelines of the Declaration of Helsinki and approved by the Local Animal Ethics Committee of NEAR EAST UNIVERSITY, Nicosia, North Cyprus, Mersin 10-Turkey (Decision No.154/22.12.2022).
Informed Consent Statement
Not applicable.
Data Availability Statement
The data that support the findings of this study are available from the
corresponding authors upon reasonable request.
Acknowledgments
The authors gratefully acknowledge Wayne Fuller for his insightful comments and thorough English language review. We also extend our sincere thanks to Melyos Hayvancılık Ltd. for generously providing the animal materials used in this study.
Conflicts of Interest
The authors declare no conflicts of interest.
References
- Hameed Ajafar, M.; Hasan Kadhim, A.; Mohammed AL-Thuwaini, T. The Reproductive Traits of Sheep and Their Influencing Factors. Reviews in Agricultural Science 2022, 10, 82–89. [Google Scholar] [CrossRef] [PubMed]
- Allabban, M.; Erdem, H. Koyunlarda Real-Time Ultrasonografik Muayene Ile Gebelik Tanısı. Journal of Bahri Dagdas Animal Research 2020, 9, 47–55. [Google Scholar]
- Jones, A.K.; Reed, S.A. Benefits of Ultrasound Scanning during Gestation in the Small Ruminant. Small Ruminant Research 2017, 149, 163–171. [Google Scholar] [CrossRef]
- Karen, A.; Szabados, K.; Reiczigel, J.; Beckers, J.-F.; Szenci, O. Accuracy of Transrectal Ultrasonography for Determination of Pregnancy in Sheep: Effect of Fasting and Handling of the Animals. Theriogenology 2004, 61, 1291–1298. [Google Scholar] [CrossRef]
- Chundekkad, P.; Blaszczyk, B.; Stankiewicz, T. Embryonic Mortality in Sheep: A Review. Turk J Vet Anim Sci 2020, 44, 167–173. [Google Scholar] [CrossRef]
- Scott, P.R. Ovine Caesarean Operations: A Study of 137 Field Cases. British Veterinary Journal 1989, 145, 558–564. [Google Scholar] [CrossRef] [PubMed]
- Scott, P.R.; Murray, L.D.; Penny, C.D. A Preliminary Study of Serum Haptoglobin Concentration as a Prognostic Indicator of Ovine Dystocia Cases. British Veterinary Journal 1992, 148, 351–355. [Google Scholar] [CrossRef]
- Skinner, J.; Brown, R.; Roberts, L. Bovine Haptoglobin Response in Clinically Defined Field Conditions. Veterinary Record 1991, 128, 147–149. [Google Scholar] [CrossRef]
- Cray, C.; Zaias, J.; Altman, N.H. Acute Phase Response in Animals: A Review. Comp Med 2009, 59, 517–526. [Google Scholar]
- Ulaankhuu, A.; Lkhamjav, G.; Nakamura, Y.; Zolzaya, M. Result of Studying Some Acute Phase Proteins and Cortisol in Pregnant Ewes. Mongolian Journal of Agricultural Sciences 2017, 19, 27–31. [Google Scholar] [CrossRef]
- Alward, K.J.; Bohlen, J.F. Overview of Anti-Müllerian Hormone (AMH) and Association with Fertility in Female Cattle. Reproduction in Domestic Animals 2020, 55, 3–10. [Google Scholar] [CrossRef] [PubMed]
- Monniaux, D.; Drouilhet, L.; Rico, C.; Estienne, A.; Jarrier, P.; Touzé, J.-L.; Sapa, J.; Phocas, F.; Dupont, J.; Dalbiès-Tran, R.; et al. Regulation of Anti-Müllerian Hormone Production in Domestic Animals. Reprod Fertil Dev 2013, 25, 1. [Google Scholar] [CrossRef] [PubMed]
- Turgut, A.O.; Koca, D. Anti-Müllerian Hormone as a Promising Novel Biomarker for Litter Size in Romanov Sheep. Reproduction in Domestic Animals 2024, 59. [Google Scholar] [CrossRef]
- Pasciu, V.; Nieddu, M.; Baralla, E.; Porcu, C.; Sotgiu, F.; Berlinguer, F. Measurement of Progesterone in Sheep Using a Commercial ELISA Kit for Human Plasma. Journal of Veterinary Diagnostic Investigation 2022, 34, 90–93. [Google Scholar] [CrossRef]
- Rahman, A.N.Md.A. Hormonal Changes in the Uterus During Pregnancy—Lessons from the Ewe: A Review. Journal of Agriculture & Rural Development 2006, 4, 1–7. [Google Scholar] [CrossRef]
- Saeed, O.A.; Ahmed, N.K.; Taha, M.M.; Abedal-Majed, M.A.; Ali, F.M.; Samsudin, A.A. Reproductive Performance and Physiological Responses in Awassi Ewes Under Intravaginal Sponges Application and Fed Selenium and Vitamin E. Tropical Animal Science Journal 2024, 47, 265–272. [Google Scholar] [CrossRef]
- Pool, K.R.; Rickard, J.P.; Pini, T.; de Graaf, S.P. Exogenous Melatonin Advances the Ram Breeding Season and Increases Testicular Function. Sci Rep 2020, 10, 9711. [Google Scholar] [CrossRef]
- Zhang, Q.; Li, C.; Niu, X.; Zhang, Z.; Li, F.; Li, F. An Intensive Milk Replacer Feeding Program Benefits Immune Response and Intestinal Microbiota of Lambs during Weaning. BMC Vet Res 2018, 14, 366. [Google Scholar] [CrossRef]
- Boscos, C.; Samartzi, F.; Lymberopoulos, A.; Stefanakis, A.; Belibasaki, S. Assessment of Progesterone Concentration Using Enzymeimmunoassay, for Early Pregnancy Diagnosis in Sheep and Goats. Reproduction in Domestic Animals 2003, 38, 170–174. [Google Scholar] [CrossRef]
- Younis, L.; Akram, S. Assessing Progesterone Levels in Awassi Ewes: A Comparison between Pregnant and Non-Pregnant, Twins, and Singletons during the First Trimester. Egyptian Journal of Veterinary Sciences 2023, 54, 1255–1263. [Google Scholar] [CrossRef]
- Hümmelchen, H.; Wagner, H.; Brügemann, K.; König, S.; Wehrend, A. Effects of Breeding for Short-Tailedness in Sheep on Parameters of Reproduction and Lamb Development. Vet Med Sci 2025, 11. [Google Scholar] [CrossRef] [PubMed]
- Mukasa-Mugerwa, E.; Viviani, P. Progesterone Concentrations in Peripheral Plasma of Menz Sheep during Gestation and Parturition. Small Ruminant Research 1992, 8, 47–53. [Google Scholar] [CrossRef]
- Al-Gubory, K.H.; Solari, A.; Mirman, B. Effects of Luteectomy on the Maintenance of Pregnancy, Circulating Progesterone Concentrations and Lambing Performance in Sheep. Reprod Fertil Dev 1999, 11, 317. [Google Scholar] [CrossRef] [PubMed]
- Sammin, D.; Markey, B.; Bassett, H.; Buxton, D. The Ovine Placenta and Placentitis—A Review. Vet Microbiol 2009, 135, 90–97. [Google Scholar] [CrossRef]
- O’Shea, J.D.; McCoy, K. Weight, Composition, Mitosis, Cell Death and Content of Progesterone and DNA in the Corpus Luteum of Pregnancy in the Ewe. J Reprod Fertil 1988, 83, 107–117. [Google Scholar] [CrossRef] [PubMed]
- Kaulfuss, K.H.; Giucci, E.; May, J. Influencing Factors on the Level of the Ovulation Rate in Sheep during the Main Breeding Season--an Ultrasonographic Study. Dtsch Tierarztl Wochenschr 2003, 110, 445–450. [Google Scholar]
- Karen, A.; Beckers, J.-F.; Sulon, J.; de Sousa, N.M.; Szabados, K.; Reczigel, J.; Szenci, O. Early Pregnancy Diagnosis in Sheep by Progesterone and Pregnancy-Associated Glycoprotein Tests. Theriogenology 2003, 59, 1941–1948. [Google Scholar] [CrossRef]
- Al-Mousawe, A.; Ibrahim, N. Diagnosis of Pregnancy in Iraqi Awassi Ewes Through Progesterone Hormone Measurement and Ultrasonography Following Induction of Fertile Estrus with Sulpiride. Egyptian Journal of Veterinary Sciences 2024, 55, 945–953. [Google Scholar] [CrossRef]
- Younis, L.; Aboud, Q. Evaluate the Effectiveness of Pregnancy-Associated Glycoprotein and Progesterone in Predicting the Gestational Status in Goats. University of Thi-Qar Journal of Agricultural Research 2023, 12, 201–210. [Google Scholar] [CrossRef]
- Ott, R.S.; Memon, M.A. Breeding Soundness Examinations of Rams and Bucks, a Review. Theriogenology 1980, 13, 155–164. [Google Scholar] [CrossRef]
- Das, A.K.; Chakraborty, D.; Gupta, P.; Khan Nusrat, N.; Saba, B. Factors Affecting Performance Traits in Kashmir Merino Sheep. Journal of Animal Research 2012, 2, 81–85. [Google Scholar]
- Hill, J.R.; Thompson, J.A.; Perkins, N.R. Factors Affecting Pregnancy Rates Following Laparoscopic Insemination of 28,447 Merino Ewes under Commercial Conditions: A Survey. Theriogenology 1998, 49, 697–709. [Google Scholar] [CrossRef] [PubMed]
- de Brun, V.; Meikle, A.; Fernández-Foren, A.; Forcada, F.; Palacín, I.; Menchaca, A.; Sosa, C.; Abecia, J.-A. Failure to Establish and Maintain a Pregnancy in Undernourished Recipient Ewes Is Associated with a Poor Endocrine Milieu in the Early Luteal Phase. Anim Reprod Sci 2016, 173, 80–86. [Google Scholar] [CrossRef]
- Moore, N.W.; Rowson, L.E.A.; Short, R.V. Egg Transfer in Sheep. Factors Affecting the Survival and Development of Transferred Eggs. Reproduction 1960, 1, 332–349. [Google Scholar] [CrossRef]
- Quinlivan, T.D.; Martin, C.A.; Taylor, W.B.; Cairney, I.M. Estimates of Pre- and Perinatal Mortality in the New Zealand Romney Marsh Ewe. I. Pre- and Perinatal Mortality in Those Ewes That Conceived to One Service. J Reprod Fertil 1966, 11, 379–390. [Google Scholar] [CrossRef] [PubMed]
- Dixon, A.B.; Knights, M.; Winkler, J.L.; Marsh, D.J.; Pate, J.L.; Wilson, M.E.; Dailey, R.A.; Seidel, G.; Inskeep, E.K. Patterns of Late Embryonic and Fetal Mortality and Association with Several Factors in Sheep1. J Anim Sci 2007, 85, 1274–1284. [Google Scholar] [CrossRef]
- Humblot, P. Use of Pregnancy Specific Proteins and Progesterone Assays to Monitor Pregnancy and Determine the Timing, Frequencies and Sources of Embryonic Mortality in Ruminants. Theriogenology 2001, 56, 1417–1433. [Google Scholar] [CrossRef]
- Domingues, R.R.; Andrade, J.P.N.; Cunha, T.O.; Madureira, G.; Moallem, U.; Gomez-Leon, V.; Martins, J.P.N.; Wiltbank, M.C. Is Pregnancy Loss Initiated by Embryonic Death or Luteal Regression? Profiles of Pregnancy-Associated Glycoproteins during Elevated Progesterone and Pregnancy Loss. JDS Communications 2023, 4, 149–154. [Google Scholar] [CrossRef]
- Kaskous, S.; Gottschalk, J.; Hippel, T.; Grün, E. The Behavior of Growth-Influencing and Steroid Hormones in the Blood Plasma during Pregnancy of Awassi Sheep in Syria. Berl Munch Tierarztl Wochenschr 2003, 116, 108–116. [Google Scholar]
- Kulcsár, M.; Dankó, G.; Magdy, H.G.I.; Reiczigel, J.; Forgach, T.; Proháczik, A.; Delavaud, C.; Magyar, K.; Chilliard, Y.; Solti, L.; et al. Pregnancy Stage and Number of Fetuses May Influence Maternal Plasma Leptin in Ewes. Acta Vet Hung 2006, 54, 221–234. [Google Scholar] [CrossRef]
- Gür, S.; Türk, G.; Demirci, E.; Yüce, A.; Sönmez, M.; Özer, Ş.; Aksu, E. Effect of Pregnancy and Foetal Number on Diameter of Corpus Luteum, Maternal Progesterone Concentration and Oxidant/Antioxidant Balance in Ewes. Reproduction in Domestic Animals 2011, 46, 289–295. [Google Scholar] [CrossRef]
- Manalu, W.; Sumaryadi, M.Y.; Kusumorini, N. Effect of Fetal Number on the Concentrations of Circulating Maternal Serum Progesterone and Estradiol of Does during Late Pregnancy. Small Ruminant Research 1997, 23, 117–124. [Google Scholar] [CrossRef]
- Ricketts, A.P.; Flint, A.P.F. Onset of Synthesis of Progesterone by Ovine Placenta. Journal of Endocrinology 1980, 86, 337–347. [Google Scholar] [CrossRef] [PubMed]
- Takarkhede, R.C.; Honmode, J.D.; Kadu, M.S. Seasonal Variations in Estradiol-17f3 and Progesterone Level during Oestrus Cycle in Malpura Ewes. Indian Journal of Animal Sciences 2002, 72, 296–299. [Google Scholar]
- Spencer, T.E.; Burghardt, R.C.; Johnson, G.A.; Bazer, F.W. Conceptus Signals for Establishment and Maintenance of Pregnancy. Anim Reprod Sci 2004, 82–83, 537–550. [Google Scholar] [CrossRef]
- Cushman, R.A.; Yake, H.K.; Snider, A.P.; Lents, C.A.; Murphy, T.W.; Freking, B.A. An Extreme Model of Fertility in Sheep Demonstrates the Basis of Controversies Surrounding Antral Follicle Count and Circulating Concentrations of Anti-Müllerian Hormone as Predictors of Fertility in Ruminants. Anim Reprod Sci 2023, 259, 107364. [Google Scholar] [CrossRef]
- Daly, J.; Smith, H.; McGrice, H.A.; Kind, K.L.; van Wettere, W.H.E.J. Towards Improving the Outcomes of Assisted Reproductive Technologies of Cattle and Sheep, with Particular Focus on Recipient Management. Animals 2020, 10, 293. [Google Scholar] [CrossRef]
- Ireland, J.L.H.; Scheetz, D.; Jimenez-Krassel, F.; Themmen, A.P.N.; Ward, F.; Lonergan, P.; Smith, G.W.; Perez, G.I.; Evans, A.C.O.; Ireland, J.J. Antral Follicle Count Reliably Predicts Number of Morphologically Healthy Oocytes and Follicles in Ovaries of Young Adult Cattle1. Biol Reprod 2008, 79, 1219–1225. [Google Scholar] [CrossRef]
- Jimenez-Krassel, F.; Scheetz, D.M.; Neuder, L.M.; Ireland, J.L.H.; Pursley, J.R.; Smith, G.W.; Tempelman, R.J.; Ferris, T.; Roudebush, W.E.; Mossa, F.; et al. Concentration of Anti-Müllerian Hormone in Dairy Heifers Is Positively Associated with Productive Herd Life. J Dairy Sci 2015, 98, 3036–3045. [Google Scholar] [CrossRef]
- Ribeiro, E.S.; Bisinotto, R.S.; Lima, F.S.; Greco, L.F.; Morrison, A.; Kumar, A.; Thatcher, W.W.; Santos, J.E.P. Plasma Anti-Müllerian Hormone in Adult Dairy Cows and Associations with Fertility. J Dairy Sci 2014, 97, 6888–6900. [Google Scholar] [CrossRef]
- Mossa, F.; Carter, F.; Walsh, S.W.; Kenny, D.A.; Smith, G.W.; Ireland, J.L.H.; Hildebrandt, T.B.; Lonergan, P.; Ireland, J.J.; Evans, A.C.O. Maternal Undernutrition in Cows Impairs Ovarian and Cardiovascular Systems in Their Offspring1. Biol Reprod 2013, 88. [Google Scholar] [CrossRef]
- Mossa, F.; Evans, A.C.O. Review: The Ovarian Follicular Reserve—Implications for Fertility in Ruminants. animal 2023, 17, 100744. [Google Scholar] [CrossRef]
- Hollinshead, F.; Walker, C.; Hanlon, D. Determination of the Normal Reference Interval for Anti-Müllerian Hormone (AMH) in Bitches and Use of AMH as a Potential Predictor of Litter Size. Reproduction in Domestic Animals 2017, 52, 35–40. [Google Scholar] [CrossRef] [PubMed]
- Evci, E.C.; Aslan, S.; Schäfer-Somi, S.; Ergene, O.; Sayıner, S.; Darbaz, I.; Seyrek-İntaş, K.; Wehrend, A. Monitoring of Canine Pregnancy by Considering Anti-Mullerian Hormone, C-Reactive Protein, Progesterone and Complete Blood Count in Pregnant and Non-Pregnant Dogs. Theriogenology 2023, 195, 69–76. [Google Scholar] [CrossRef] [PubMed]
- Skinner, J.; Roberts, L. Haptoglobin as an Indicator of Infection in Sheep. Veterinary Record 1994, 134, 33–36. [Google Scholar] [CrossRef] [PubMed]
- González, J.F.; Hernández, Á.; Meeusen, E.N.T.; Rodríguez, F.; Molina, J.M.; Jaber, J.R.; Raadsma, H.W.; Piedrafita, D. Fecundity in Adult Haemonchus Contortus Parasites Is Correlated with Abomasal Tissue Eosinophils and Γδ T Cells in Resistant Canaria Hair Breed Sheep. Vet Parasitol 2011, 178, 286–292. [Google Scholar] [CrossRef]
- Albay, M.K.; Karakurum, M.C.; Sahinduran, S.; Sezer, K.; Yildiz, R.; Buyukoglu, T. Selected Serum Biochemical Parameters and Acute Phase Protein Levels in a Herd of Saanen Goats Showing Signs of Pregnancy Toxaemia. Vet Med (Praha) 2014, 59, 336–342. [Google Scholar] [CrossRef]
- Narin, K.; Aytekin, İ. Paraoxonase, Haptoglobin, Serum Amyloid A, Tumor Necrosis Factor and Acetylcholinesterase Levels in Ewes with Pregnancy Toxemia. Turkish Journal of Veterinary Research 2024, 8, 1–6. [Google Scholar] [CrossRef]
- Greguła-Kania, M.; Kosior-Korzecka, U.; Hahaj-Siembida, A.; Kania, K.; Szysiak, N.; Junkuszew, A. Age-Related Changes in Acute Phase Reaction, Cortisol, and Haematological Parameters in Ewes in the Periparturient Period. Animals 2021, 11. [Google Scholar] [CrossRef]
- Eurell, T.E.; Bane, D.P.; Hall, W.F.; Schaeffer, D.J. Serum Haptoglobin Concentration as an Indicator of Weight Gain in Pigs. Canadian Journal of Veterinary Research 1992, 56, 6–9. [Google Scholar]
- Iliev, P.; Georgieva, T. Acute Phase Proteins in Sheep and Goats—Function, Reference Ranges and Assessment Methods: An Overview. Bulg J Vet Med 2018, 21, 1–16. [Google Scholar] [CrossRef]
Figure 1.
P4 change in P+, P- and FD by days. Different letters or asterisk indicate differences between days (*p < 0.05; ** p < 0.01; *** p < 0.001).
Figure 1.
P4 change in P+, P- and FD by days. Different letters or asterisk indicate differences between days (*p < 0.05; ** p < 0.01; *** p < 0.001).
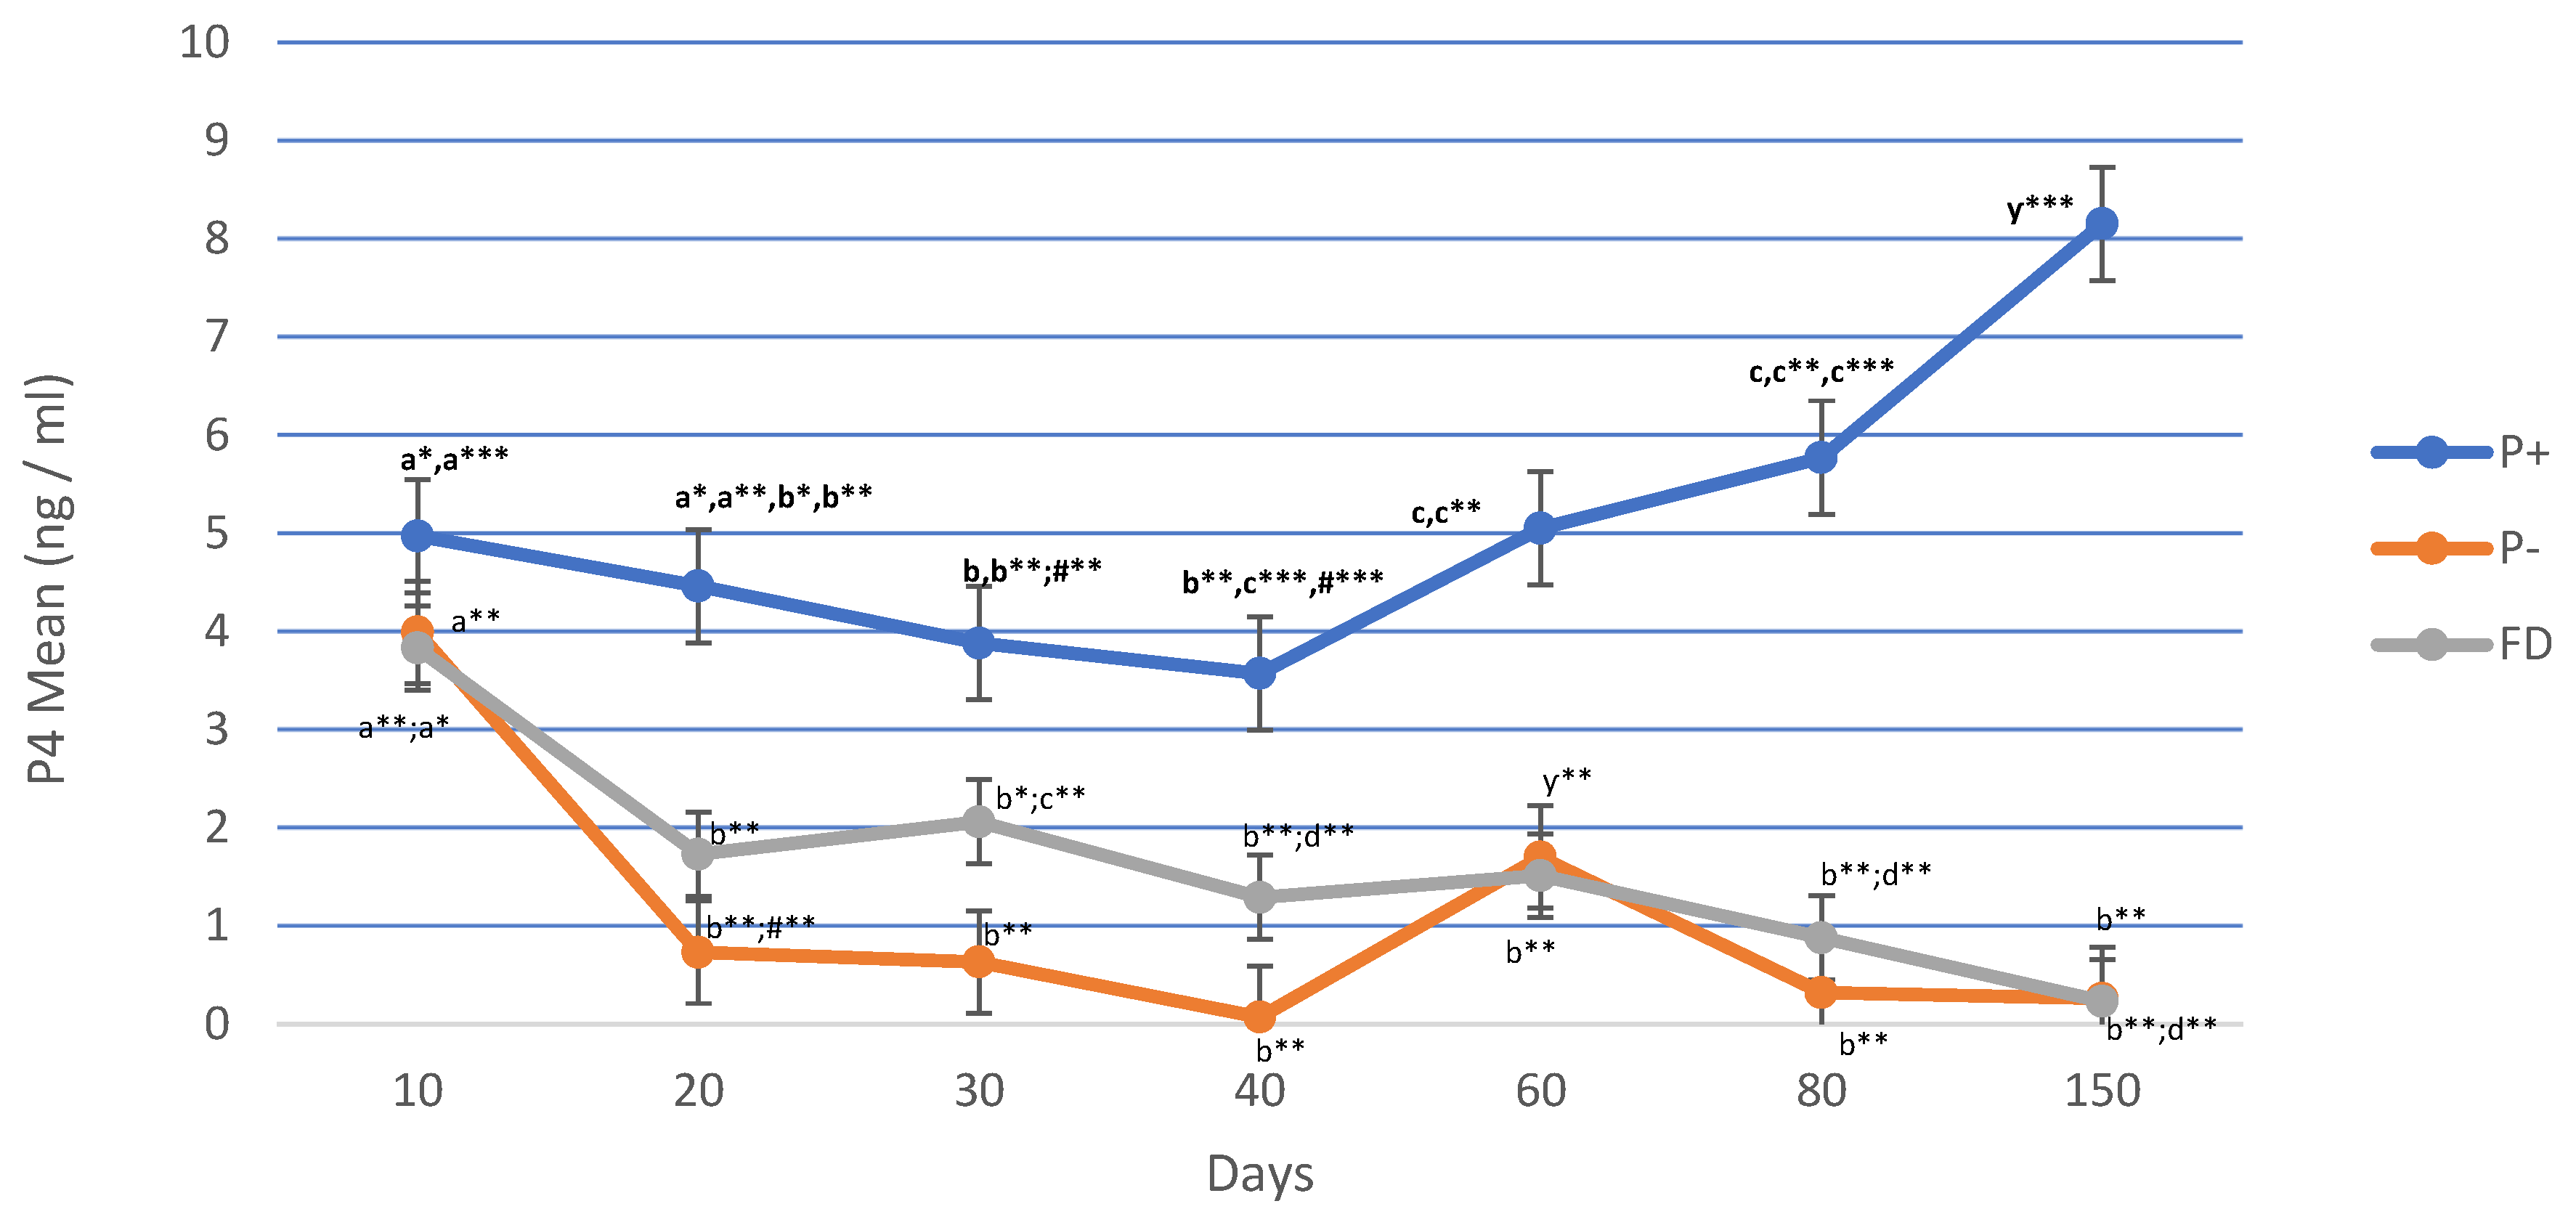
Figure 2.
AMH changes in P+, P- and FD by days. Different letters or asterisk indicate differences between days (*p < 0.05; ** p < 0.01; *** p < 0.001).
Figure 2.
AMH changes in P+, P- and FD by days. Different letters or asterisk indicate differences between days (*p < 0.05; ** p < 0.01; *** p < 0.001).
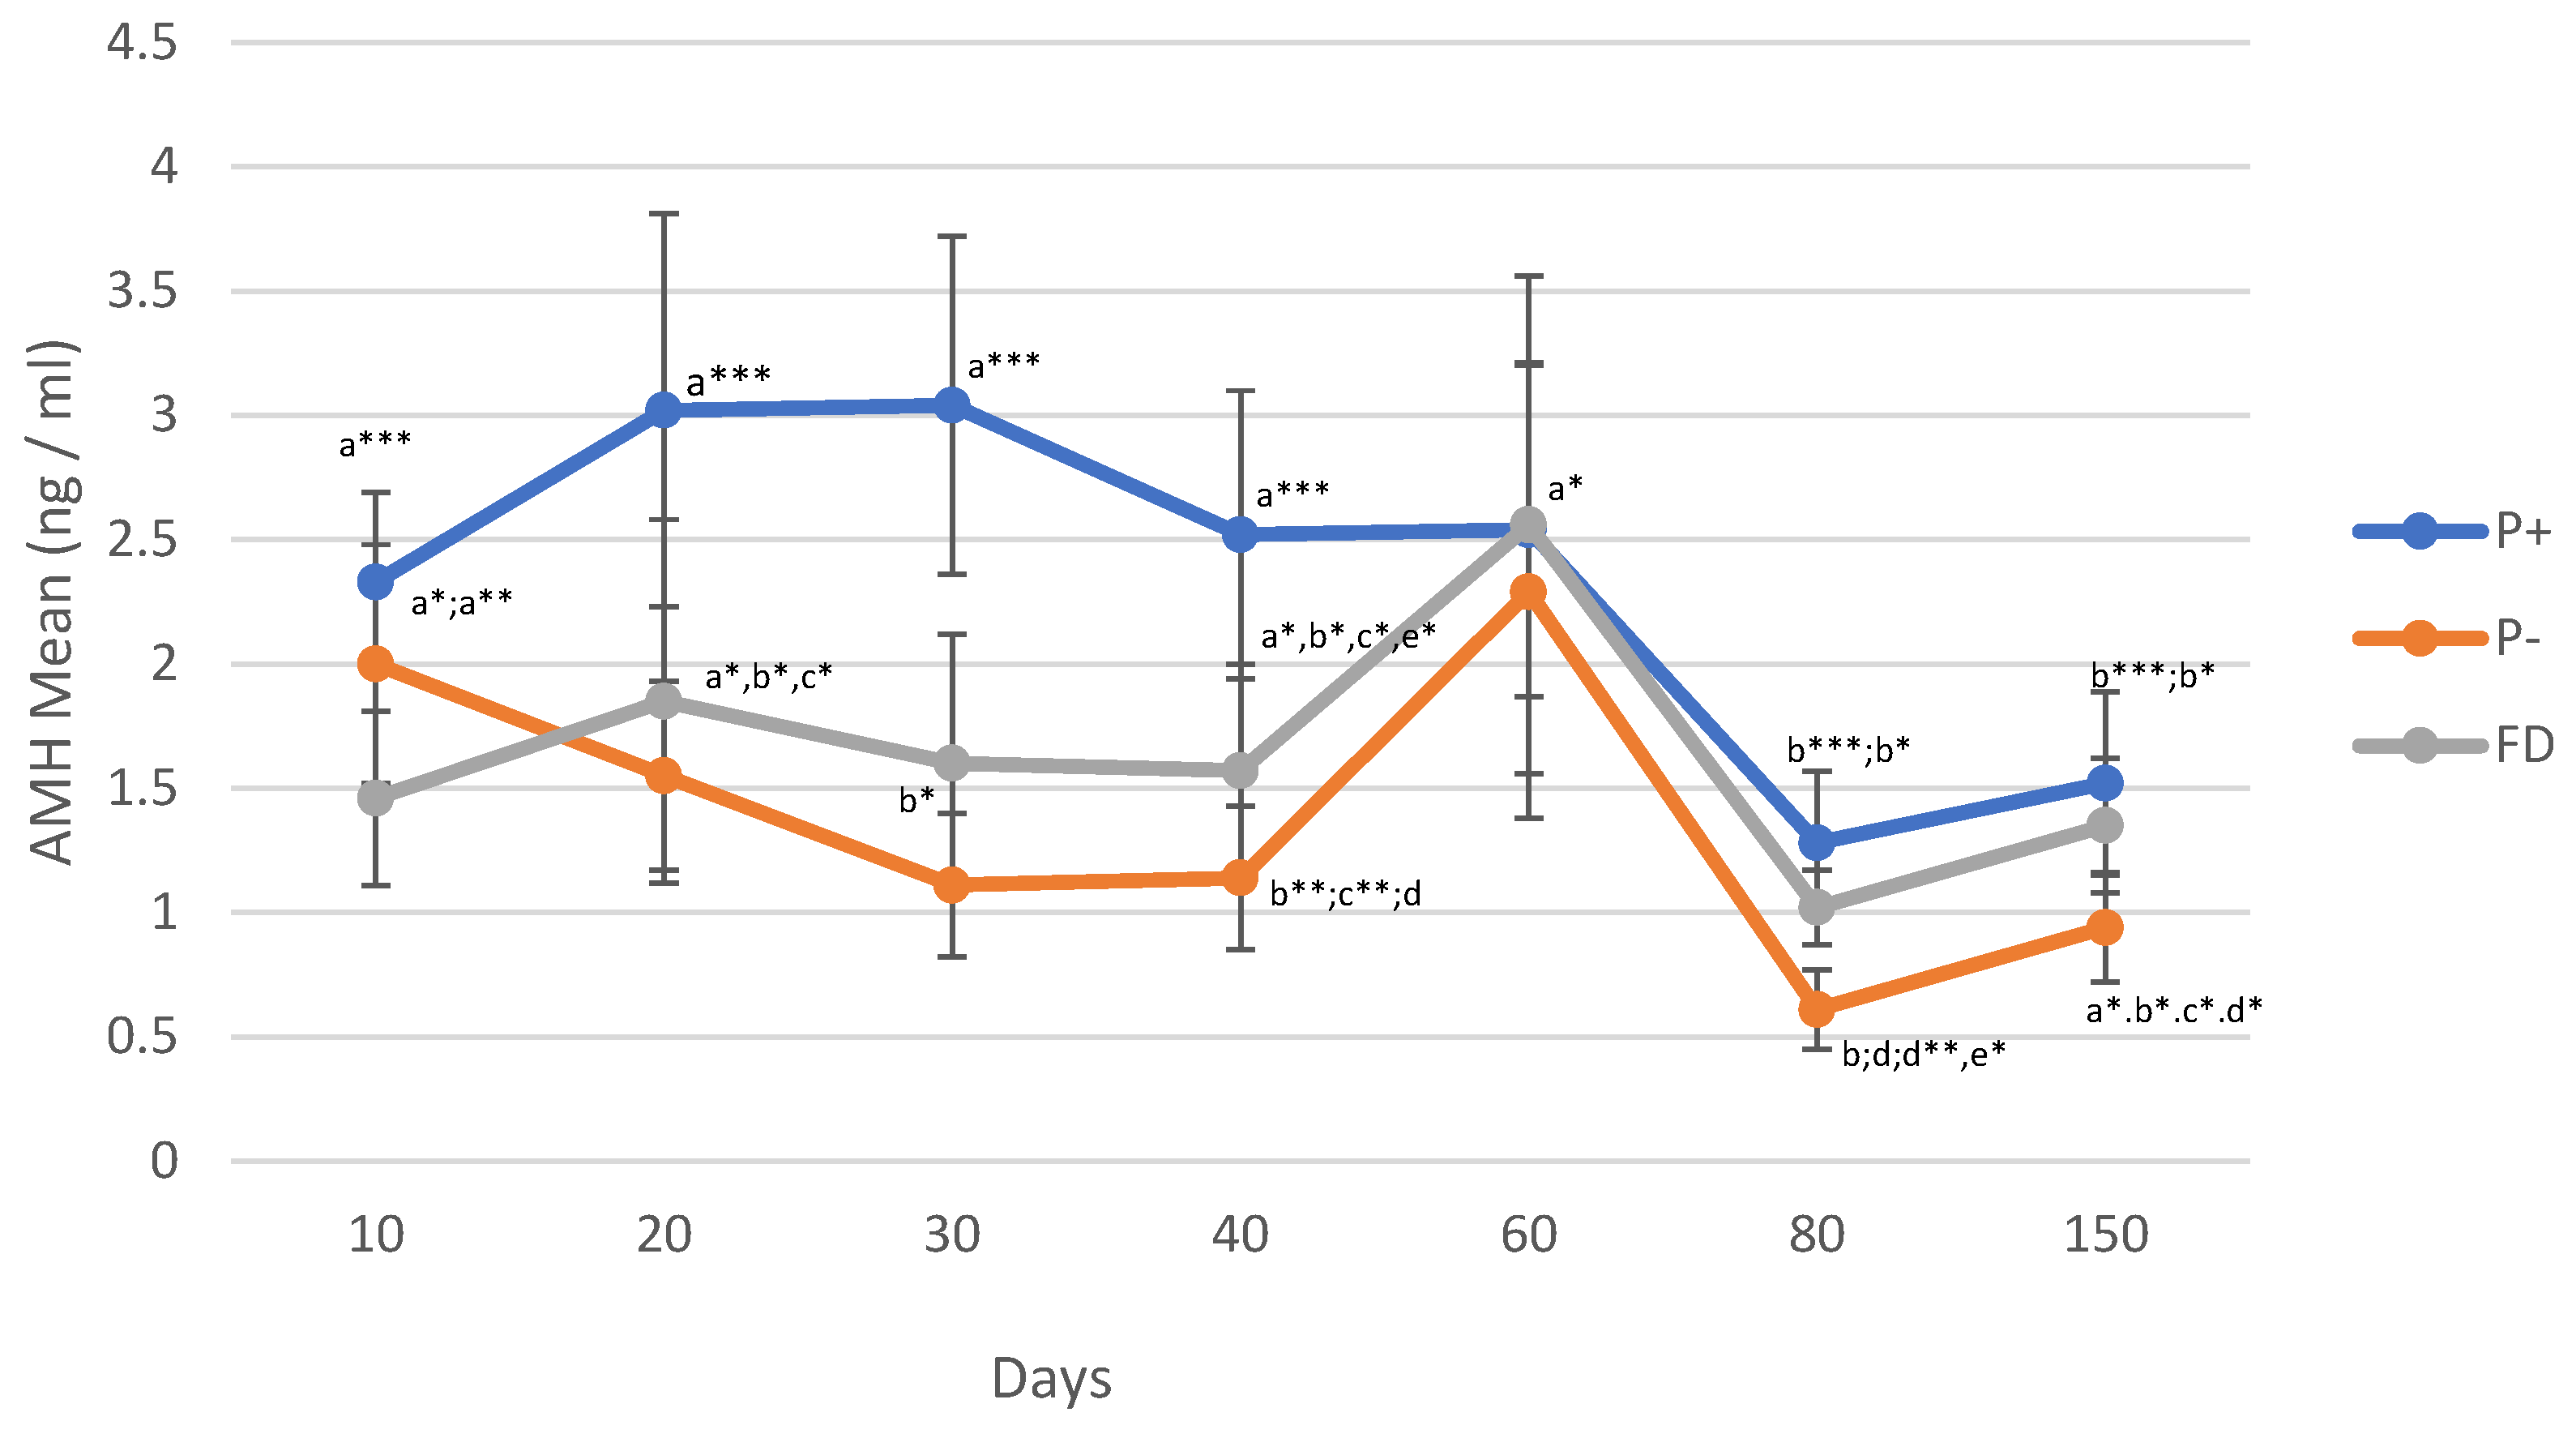
Figure 3.
Hp changes in P+, P- and FD by days. Different letters or asterisk indicate differences between days (*p < 0.05; ** p < 0.01; *** p < 0.001).
Figure 3.
Hp changes in P+, P- and FD by days. Different letters or asterisk indicate differences between days (*p < 0.05; ** p < 0.01; *** p < 0.001).
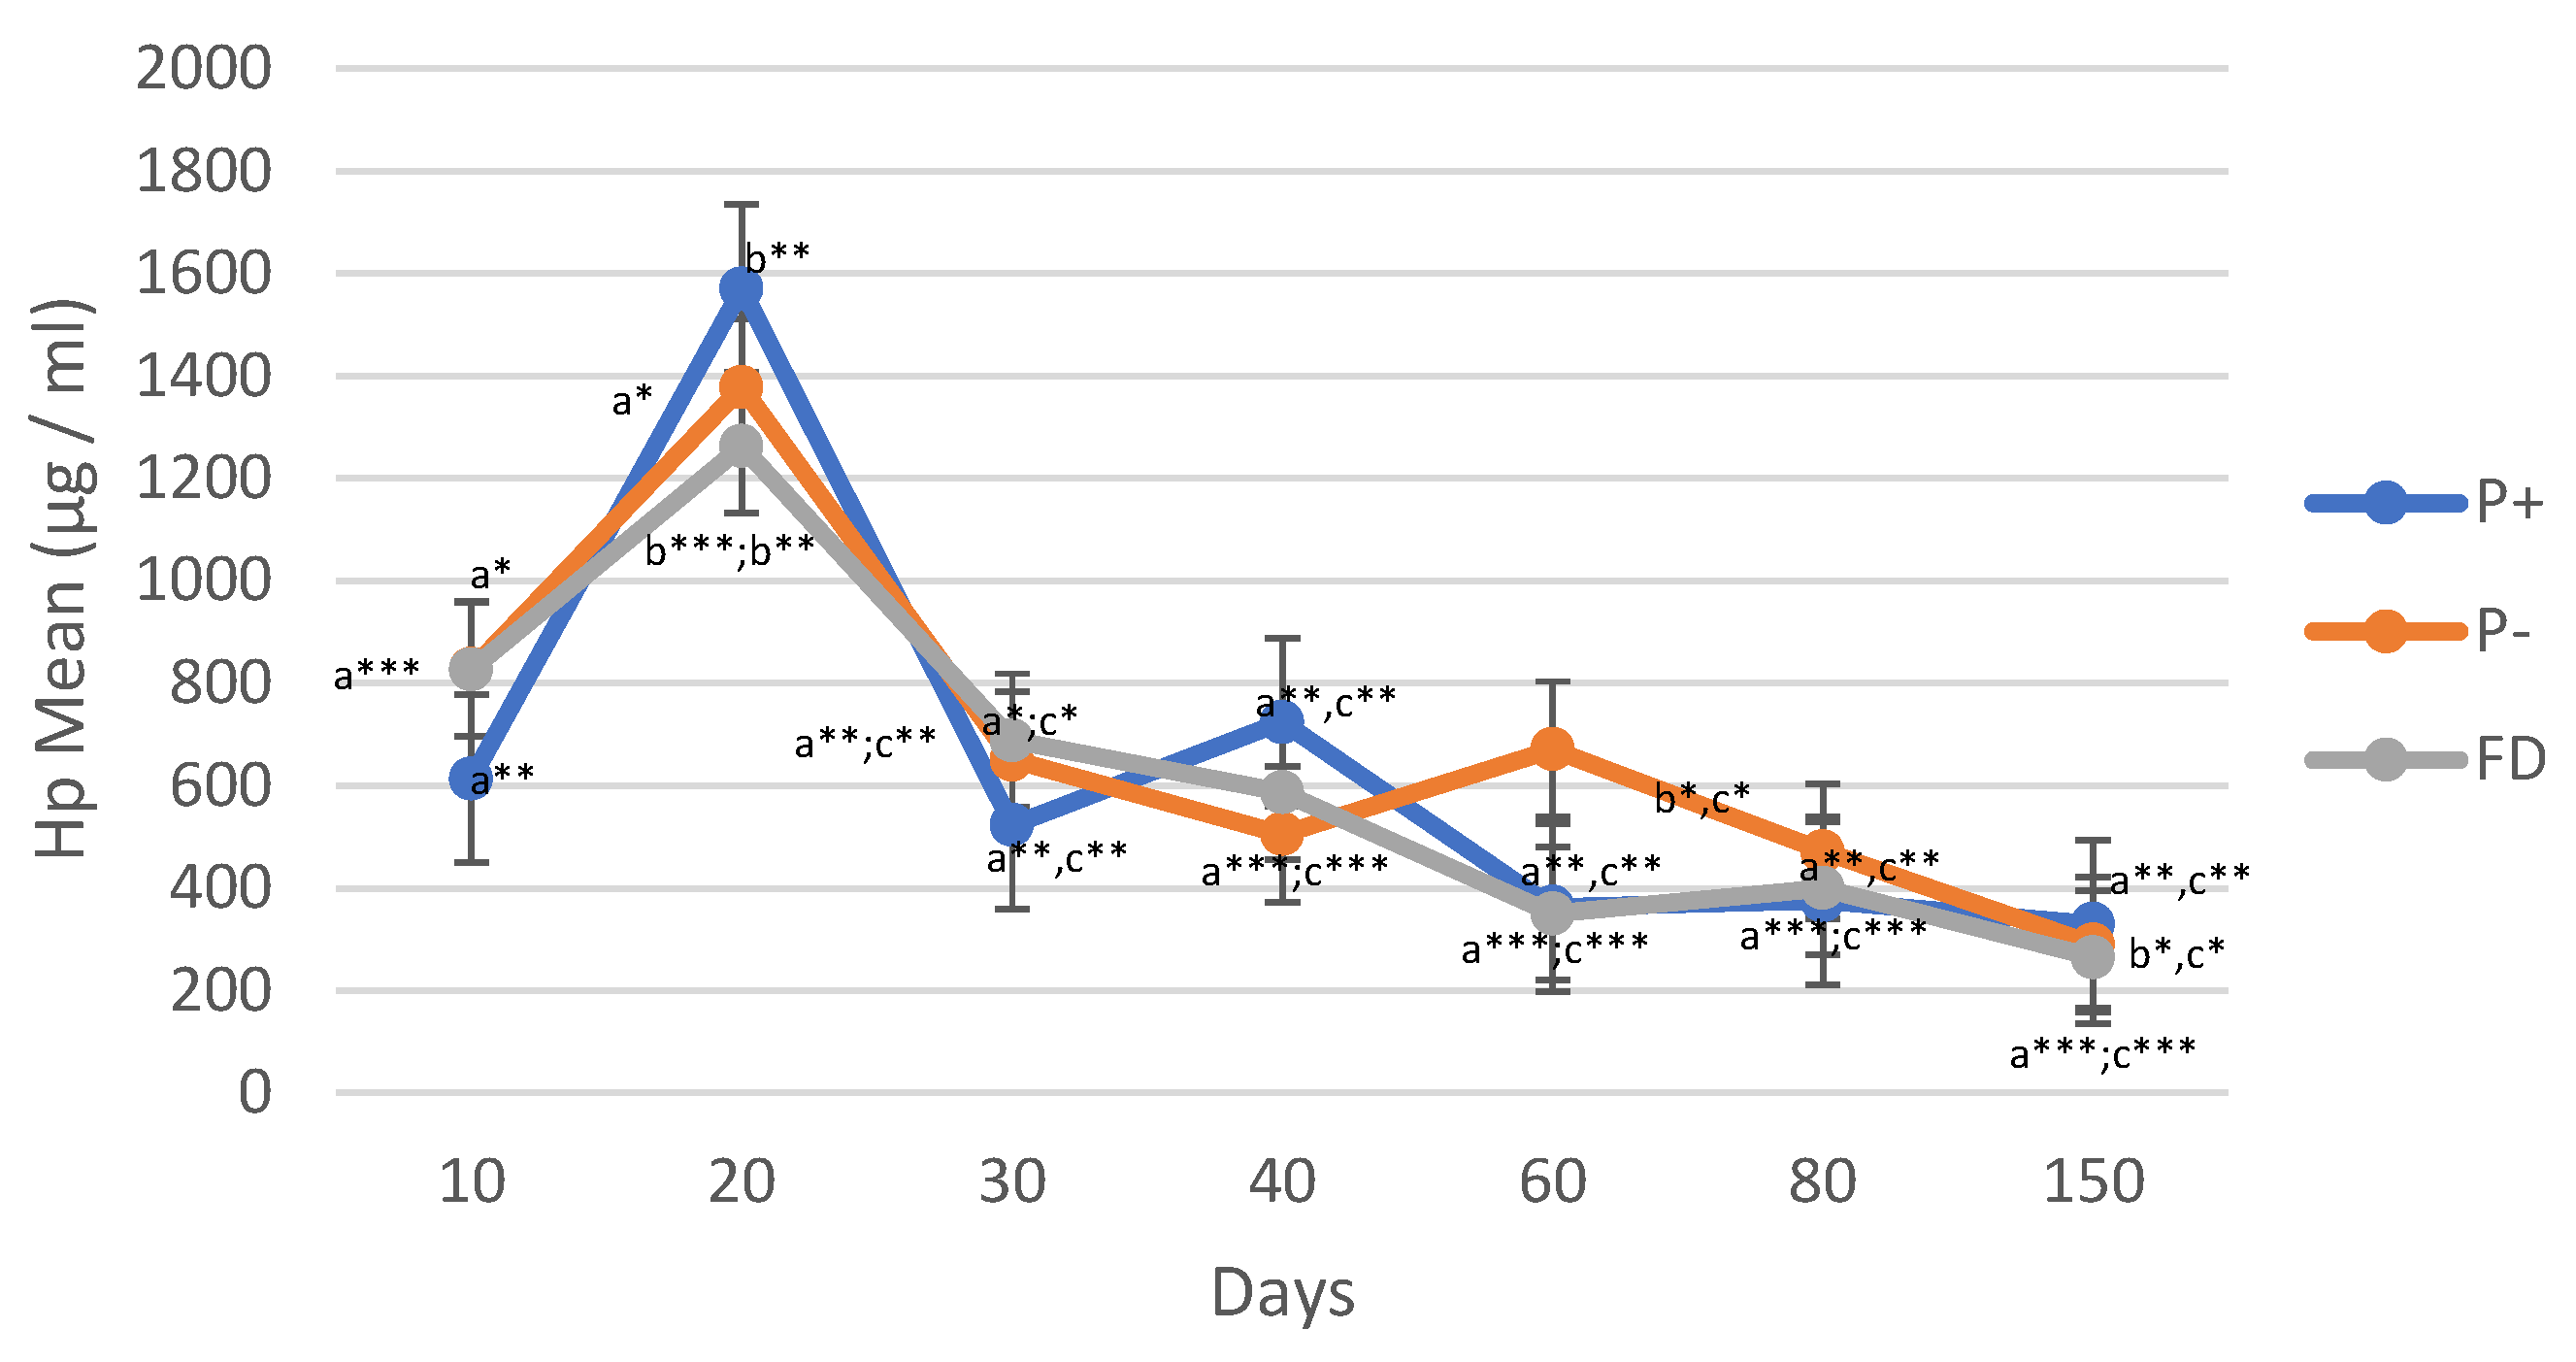
Figure 4.
Comparison of P4 Values in Single and Twin Pregnancies (Single Offspring; n=11); Twin Offspring (n=8)). Different asterisks indicate differences between days (*p < 0.05; **p < 0.01).
Figure 4.
Comparison of P4 Values in Single and Twin Pregnancies (Single Offspring; n=11); Twin Offspring (n=8)). Different asterisks indicate differences between days (*p < 0.05; **p < 0.01).
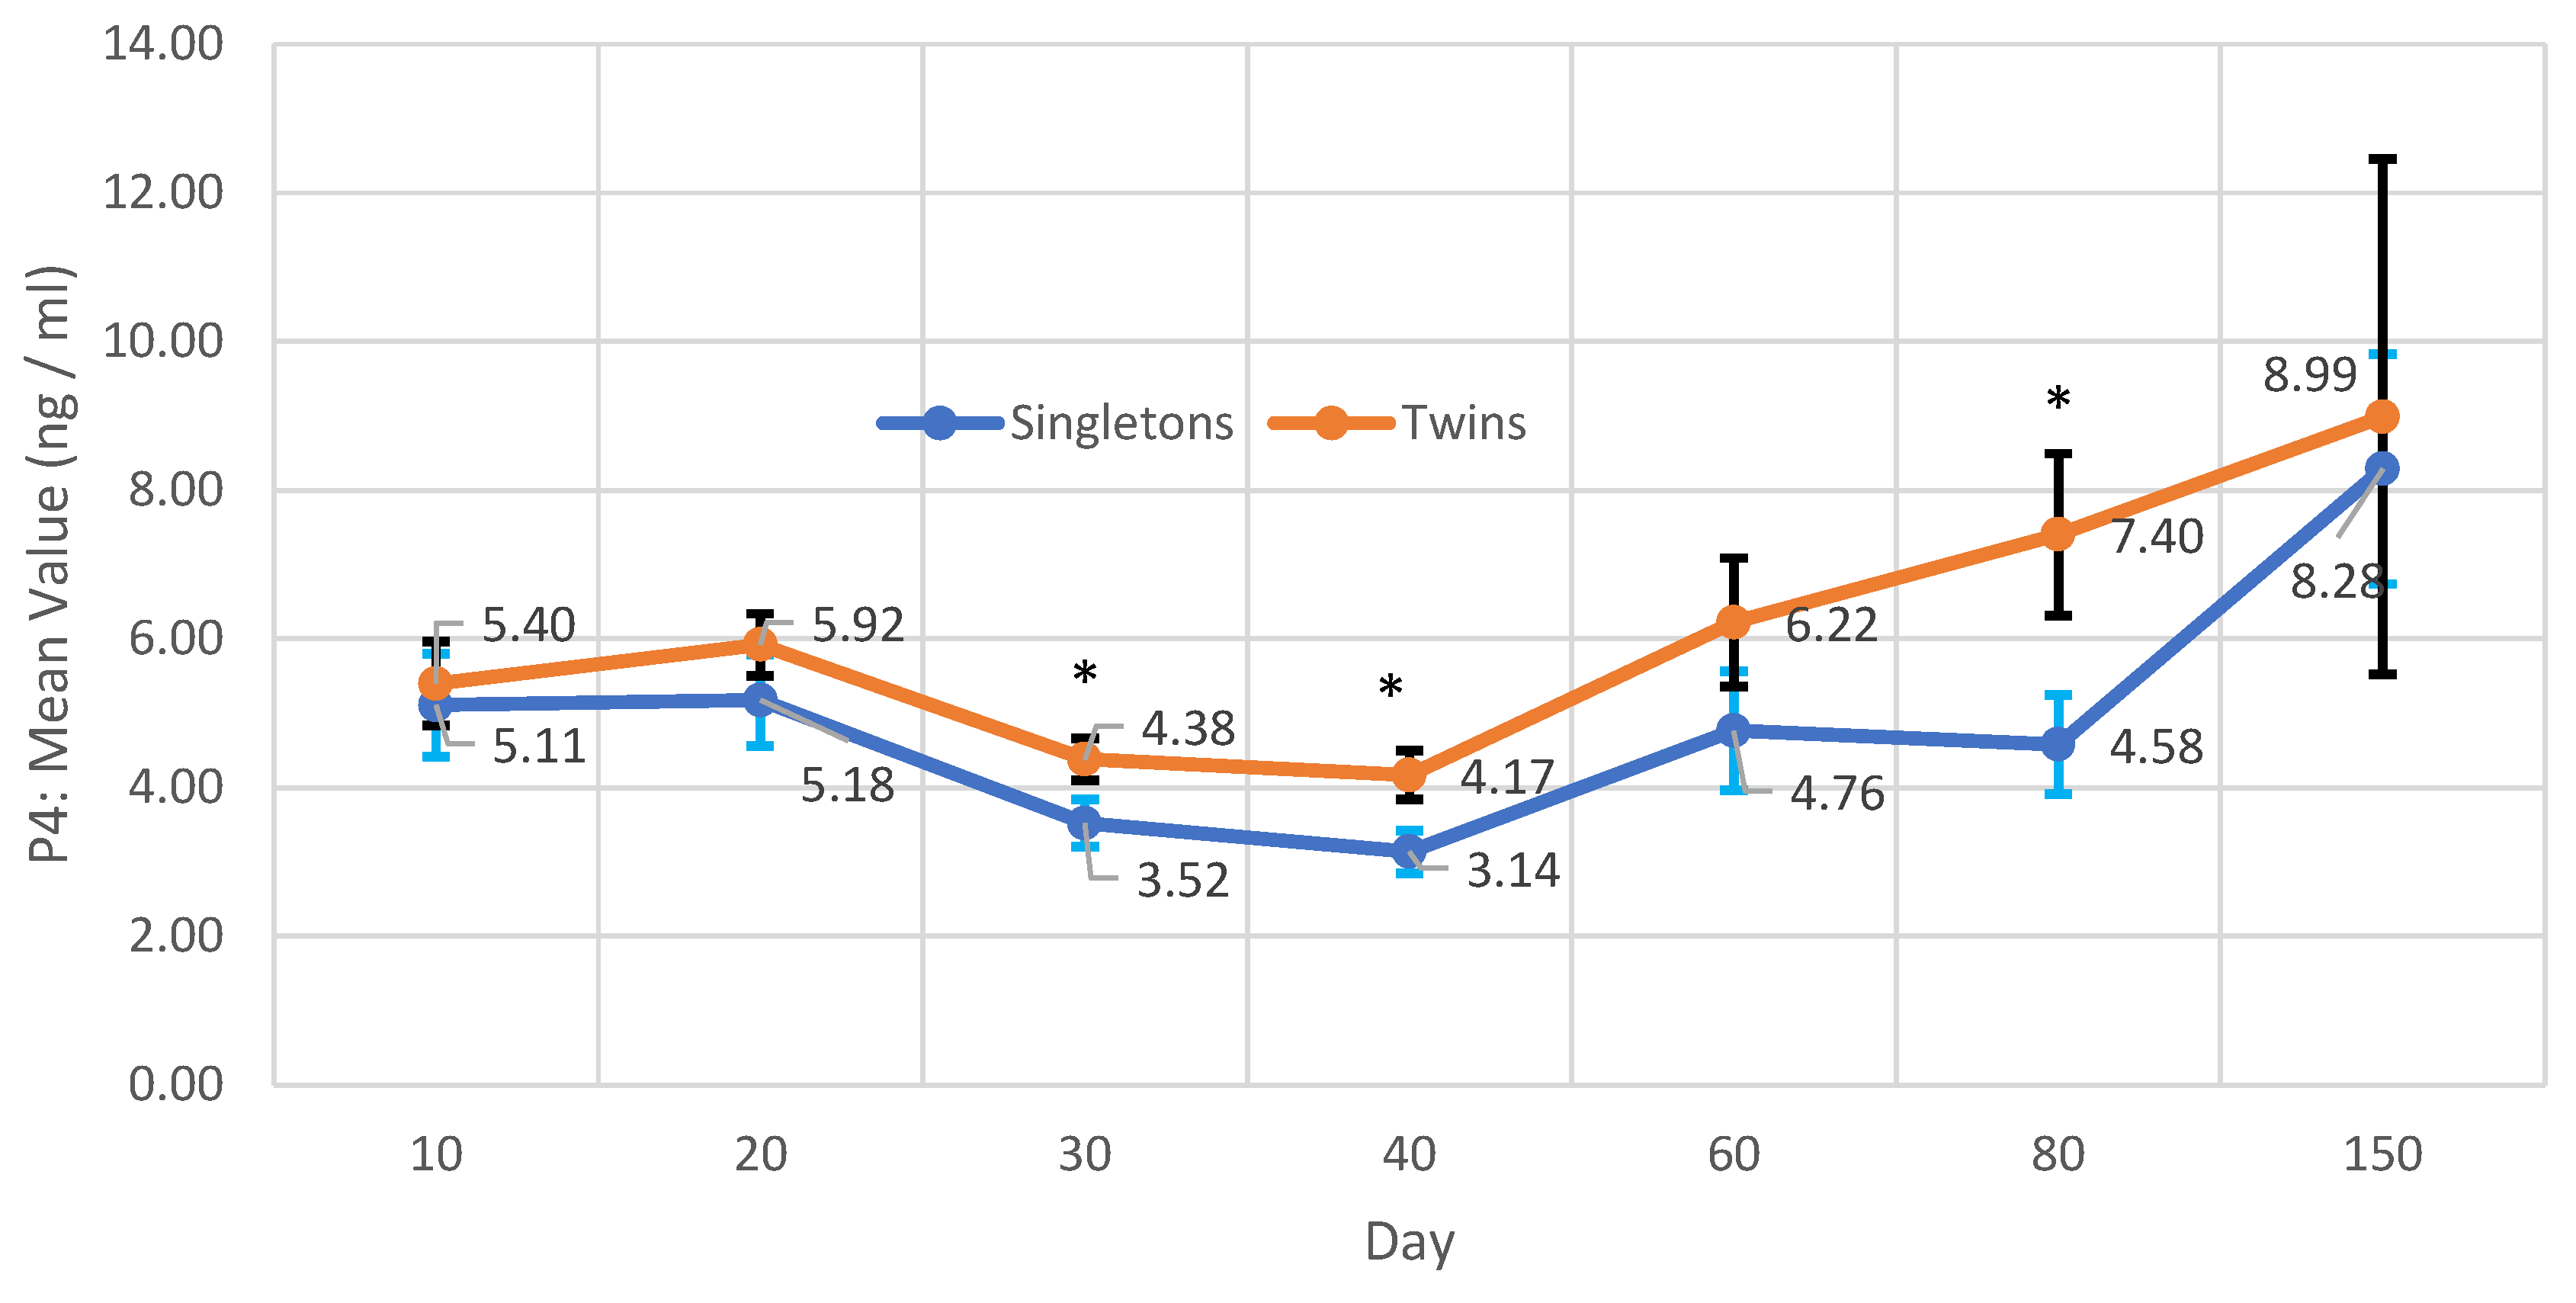

Table 1.
Difference in P4, AMH and Hp Among P+ and P- Ewes. Results are presented in Mean ± SE.
| P4 (ng/mL) | AMH (ng/mL) | Hp (µg/ml) | |||||||
|---|---|---|---|---|---|---|---|---|---|
| DAYS | P+ | P- | p | P+ | P- | p | P+ | P- | p |
| 10 | 4.97±0.50 | 3.99±0.74 | n.s. | 2.33±0.36 | 2.00±0.48 | n.s. | 613.92±88.46 | 827.42±196.72 | n.s. |
| 20 | 4.46±0.57(a***) | 0.73±0.39(b***) | *** p < 0.0001 | 3.02±0.79 | 1.55±0.38 | n.s. | 1570.51±206.54 | 1378.27±296.17 | n.s. |
| 30 | 3.88±0.23(a***) | 0.63±0.46(b***) | *** p < 0.0001 | 3.04±0.68(s**) | 1.11±0.29 b**) | p < 0.01 | 523.13±131.71 | 650.83±202.15 | n.s. |
| 40 | 3.57±0.24(a***) | 0.07±0.01(b***) | *** p < 0.0001 | 2.52±0.58 | 1.14±0.29 | n.s. | 724.33±166.61 | 505.48±110.85 | n.s. |
| 60 | 5.05±0.63(a**) | 1.70±0.75(b**) | ** p < 0.0001 | 2.54±0.67 | 2.29±0.91 | n.s. | 362.65±85.75 | 671.17±167.98 | n.s. |
| 80 | 5.77±0.67(a***) | 0.32±0.16(b***) | *** p < 0.0001 | 1.28±0.29 | 0.61±0.16 | n.s. | 375.72±60.59 | 471.86±130.36 | n.s. |
| 150 | 8.15±1.67(a***) | 0.26 ±0.09(b***) | *** p < 0.0001 | 1.52±0.37 | 0.94±0.22 | n.s. | 329.65±31.65 | 289.90±72.63 | n.s. |
Different letters or asterisks in rows indicate differences between days (** p < 0.01; *** p < 0.0001). n.s. means “statistically no significant difference”).
Table 2.
Comparison P4, AMH and Hp values in P- ewes and FD on different days. Results are presented in Mean ± SE.
Table 2.
Comparison P4, AMH and Hp values in P- ewes and FD on different days. Results are presented in Mean ± SE.
| P4 (ng/mL) | AMH (ng/mL) | Hp (µg/ml) | |||||||
|---|---|---|---|---|---|---|---|---|---|
| DAYS | P- | FD | p | P- | FD | p | P- | FD | p |
| 10 | 3.99±0.74 | 3.83±0.59 | n.s | 2.00±0.48 | 1.46±0.35 | n.s | 827.42±196.72 | 826.76±255.12 | n.s |
| 20 | 0.73±0.39(a*) | 1.73±0.4(b*) | p < 0.05 | 1.55±0.38 | 1.85±0.73 | n.s | 1378.27±296.17 | 1262.95±211.74 | n.s |
| 30 | 0.63±0.46(a**) | 2.06±0.40(b**) | p < 0.01 | 1.11±0.29 | 1.60±0.52 | n.s | 650.83±202.15 | 688.91±214.04 | n.s |
| 40 | 0.07±0.01(a**) | 1.29±0.36(b**) | p < 0.01 | 1.14±0.2 | 1.57±0.43 | n.s | 505.48±110.85 | 586.84±142.42 | n.s |
| 60 | 1.70±0.75(a**) | 1.51±0.43(b**) | p < 0.01 | 2.29±0.91 | 2.56±1.00 | n.s | 671.17±167.98 | 350.08±64.88 | n.s |
| 80 | 0.32±0.16 | 0.88±0.37 | n.s | 0.61±0.16 | 1.02±0.15 | n.s | 471.86±130.36 | 399.90±82.29 | n.s |
| 150 | 0.26±0.09 | 0.23±0.06 | n.s | 0.94±0.22 | 1.35±0.27 | n.s | 289.90±72.63 | 264.96±34.59 | n.s |
Different letters in rows indicate the differences between groups (*p < 0.05; ** p < 0.01). n.s. means “statistically not significant”.
Table 3.
Comparison of P4, AMH and Hp values on different days of pregnancy and fetal deaths. Results are presented in Mean ± SE.
Table 3.
Comparison of P4, AMH and Hp values on different days of pregnancy and fetal deaths. Results are presented in Mean ± SE.
| P4 (ng/mL) | AMH (ng/mL) | Hp (µg/ml) | |||||||
|---|---|---|---|---|---|---|---|---|---|
| DAYS | P+ | FD | p | P+ | FD | p | P+ | FD | p |
| 10 | 4.97±0.50 | 3.83±0.59 | n.s | 2.33±0.36(a*) | 1.46±0.35(b) | n.s | 613.92±88.46 | 826.76±255.12 | n.s |
| 20 | 4.46±0.57(a**) | 1.73±0.47(b**) | ** p < 0.01 | 3.02±0.79(a*) | 1.85±0.73(b) | n.s | 1570.51±206.54 | 1262.95±211.74 | n.s |
| 30 | 3.88±0.23(a***) | 2.05±0.40(b***) | *** p < 0.001 | 3.04±0.68(a*) | 1.60±0.52(b*) | *p < 0.01 | 523.13±131.71 | 688.91±214.04 | n.s |
| 40 | 3.57±0.24(a***) | 1.28±0.36(b***) | **** p < 0.0001 | 2.52±0.58 | 1.57±0.43 | n.s | 724.33±166.61 | 586.84±142.42 | n.s |
| 60 | 5.05±0.63(a***) | 1.51±0.43(b***) | **** p < 0.0001 | 2.54±0.67 | 2.56±1.00 | n.s | 362.65±85.75 | 350.08±64.88 | n.s |
| 80 | 5.77±0.67(a***) | 0.88±0.37(b***) | **** p < 0.0001 | 1.28±0.29 | 1.02±0.15 | n.s | 375.72±60.59 | 399.90±82.29 | n.s |
| 150 | 8.15±1.67(a***) | 0.23±0.06(b***) | **** p < 0.0001 | 1.52±0.37 | 1.35±0.27 | n.s | 329.65±31.65 | 264.96±34.59 | n.s |
Different letters in rows indicate the differences between groups (** p < 0.01; *** p < 0.001; ****p < 0.0001). n.s. means “statistically not significant”.
Table 4.
Changes in P4, AMH and HP values in different months. Results are presented in Mean ± SE.
| P4 (ng/mL) | AMH (ng/mL) | Hp (µg/ml) | ||||||||
|---|---|---|---|---|---|---|---|---|---|---|
| Months | P+ | P- | FD | P+ | P- | FD | P+ | P- | FD | |
| A2 | 4.46±0.19(a***) | 1.35±0.3 (a) | 2.23±0.26 (a**,a***) |
2.52±0.29 (a*, a***) | 1.5±0.19(a) | 1.62±0.26(a) | 857.97±89.78 (a***) |
840.50±116.90(a;b**) | 841.37±108.23 (a*) |
|
| A4 | 5.56±0.45(b***) | 1.01±0.41(a) | 1.20±0.29(b**) | 1.91±0.38(b*) | 1.5±0.50(a) | 1.79±0.52(a) | 369.19±51.79(b***) | 571.52±105.88(a) | 374.99±51.51(b*) | |
| A6 | 8.60±1.71 (b***,c**) |
0.26±0.09(a) | 0.23±0.06 (b***) |
8.15±1.67 (b*,c***) |
0.9±0.22(a) | 1.36±0.27(a) | 329.65±31.65(b***, c**) | 289.90±72.63(c**) | 264.96 ±34.59(b*; c*) | |
Different letters in columns indicate statistical difference (*p < 0.05; **p < 0.001; ***p < 0.0001).
Table 5.
Changes in P4, AMH and Hp values according to body weight measured on different days in pregnant ewes. Results are presented in Mean ± SE.
Table 5.
Changes in P4, AMH and Hp values according to body weight measured on different days in pregnant ewes. Results are presented in Mean ± SE.
| Weight measurement days (days) | Weights | P4 | AMH | Hp |
|---|---|---|---|---|
| 10 | 67.26±6.71 | 4.97±0.50(a*) | 2.39±0.36(a***;a**) | 613.91±88.46(a*;a**) |
| 80 | 76.18±8.98 | 5.77±0.66(a*) | 1.27±0.29(b***) | 375.72±60.58(b*) |
| 150 | 86.15±9.14 | 8.15±1.67(a*) | 1.52±0.37(b**) | 329.64±31.64(b*;b**) |
| p | p > 0.05 | p > 0.05 | a**:b** p < 0.01 a***:b*** p < 0.001 |
a*:b* p < 0.05 a**:b** p < 0.01 |
Different letters in columns indicate statistical difference (*p < 0.05; **p < 0.001; ***p < 0.0001).
Disclaimer/Publisher’s Note: The statements, opinions and data contained in all publications are solely those of the individual author(s) and contributor(s) and not of MDPI and/or the editor(s). MDPI and/or the editor(s) disclaim responsibility for any injury to people or property resulting from any ideas, methods, instructions or products referred to in the content. |
© 2025 by the authors. Licensee MDPI, Basel, Switzerland. This article is an open access article distributed under the terms and conditions of the Creative Commons Attribution (CC BY) license (http://creativecommons.org/licenses/by/4.0/).
Copyright: This open access article is published under a Creative Commons CC BY 4.0 license, which permit the free download, distribution, and reuse, provided that the author and preprint are cited in any reuse.


