
Submitted:
02 April 2025
Posted:
03 April 2025
You are already at the latest version
Abstract
The deployment of utility-scale hybrid wind-solar PV power plants is gaining global attention due to their enhanced performance in power systems with high renewable energy penetration. To assess their potential, accurate estimations must be derived from available data, addressing key challenges such as: (1) spatial and temporal resolution requirements, particularly for renewable resource characterization; (2) energy balances aligned with various business models; (3) regulatory constraints (environmental, technical, etc.); and (4) cost dependencies of different components and system characteristics. When conducting such analyses at regional or national scales, a trade-off must be achieved to balance accuracy with computational efficiency. This study reviews existing experiences in hybrid plant deployment, with a focus on Spain, and proposes a simplified methodology for country-level analysis.
Keywords:
hybrid power plant
; potential mapping
; utility-scale
1. Introduction
The development of renewable energy generation in Europe is clearly outlined [1]: “the revised Renewable Energy Directive (RED) sets a binding target for renewable energy of 42.5% of the EU’s gross final energy consumption, with the aspiration to reach 45% by 2030. This requires doubling the EU’s renewable energy share by 2030 in the energy mix compared to the 2022 level of 23%, and a sharp increase of the share of renewable energy sources (RES) in the electricity mix. As a result, between 2020 and 2030, the installed wind and solar power generation capacity is also projected to double, to 510 GW and 592 GW, respectively.”
At the European level, in response to the energy market disruption caused by Russia-Ukraine’ War, the European Commission launched the REPowerEU Plan. Under this initiative, Spain updated its recovery and resilience plan (RRP), funded by the NextGenerationEU program, to include new measures aimed at energy savings and supply diversification [2].
Within Spain’s RRP, Component 17 specifically focuses on infrastructure improvements, including the enhancement of R&D&I capacities for hybrid renewable technologies. A key objective of this project is to identify Spain’s national hybridization potential [3].
This research is being conducted within this framework, with the primary goal of developing a map that identifies the potential for utility-scale hybridization in Spain. The mapping process consists of three stages: the first involved analyzing the necessary data and available data sources, as described in [4]. The second stage, covered in this paper, focuses on reviewing the calculations needed to derive meaningful results from the identified data. The final stage will involve the creation of the definitive hybridization potential map and will be addressed in future work.
Since this paper describes the second stage of the mapping process, its motivation aligns with that of the first stage, as detailed in [4]. However, the significance of this research has grown beyond its initial project-based interest. The increasing focus on suitable areas for European renewable energy deployment has led to the introduction of a new concept: particularly suitable areas, known as ‘renewables acceleration areas’ (RAAs) [5]. These areas balance economic feasibility with societal and environmental considerations while complying with other legislative frameworks. Hybridization of renewable projects and the multi-functional use of land and sea—such as combining electricity production with other activities—are considered effective strategies for reducing land use conflicts, mitigating grid-related constraints, and increasing public acceptance.
The revised EU directives emphasize the importance of comprehensive mapping and spatial planning for renewable energy projects, introducing new obligations for Member States:
- Article 15b mandates that Member States translate their national contributions toward the revised EU renewable energy targets into spatially defined areas required for renewable projects. This mapping must be completed by 21 May 2025, using digital tools such as Geographic Information System (GIS) technology [1].
- Article 15c requires Member States to designate specific areas as RAAs, building upon the initial mapping under Article 15b. At least one renewable energy technology must be prioritized in each country [1].
- Member States must incorporate the latest available data and align their planning with evolving scientific knowledge, technological advancements, environmental concerns, and local community needs [6].
This research aligns with these directives, further reinforcing its relevance and increasing the significance of its outcome.
The review of current research in this field will primarily focus on activities in Spain, given their direct relevance to this study. However, significant international initiatives will also be briefly examined. Before delving into the specifics of these activities, it is useful to outline the different levels of potential exploitation for Hybrid Power Plants (HPPs). Understanding these levels will facilitate the classification of existing studies. The potential of a renewable energy resource at a given site or area can be assessed at four levels [7,8]:
a. Resource potential: for solar PV generation, the irradiance and other relevant parameters such as temperature; for wind generation, the wind speed and other relevant environment parameters such as obstacles and roughness.
b. Technical potential: considers the available suitable surface area, system performance, and sustainability criteria where applicable.
c. Economic potential: accounts for technology costs and avoided supply costs.
d. Market potential: evaluates deployment feasibility in the context of competition with other energy sources, regulatory policies, permitting processes, incentives, and socio-cultural factors.
These four levels represent a progressive refinement of analysis, with market potential assessments encompassing economic potential, which in turn includes technical potential, which itself builds upon resource potential.
The following sections provide an overview of renewable hybridization activities in Spain (Section 2) and internationally (Section 3). Section 4 presents an update on available data sources and reviews various tools for HPP design. Finally, Section 5 highlights a simplified application for mapping hybridization potential in Spain, incorporating suitability and profitability analyses for selected areas.
2. Activities in Spain
For the description of activities in Spain, the categories used in energy system planning analyses, as described in [4], will be followed. These four categories were proposed by the International Renewable Energy Agency (IRENA): generation expansion planning (Long-Term Energy Scenarios, LTES); geospatial planning; dispatch planning (production cost models); and technical network studies (subdivided into static and dynamic grid models) [9].
2.1. Long-Term Energy Scenarios (LTES)
In electricity planning, a distinction is made between binding planning, which refers to the development of transmission networks, and indicative planning, which establishes possible demand evolution scenarios and target generation capacity in terms of electricity generation and supply [10]. Indicative planning is fully reflected in the National Energy and Climate Plans (NECPs) of EU member states. NECPs define CO2 targets, policies, and actions of EU countries as their contributions to the EU's climate and energy objectives, often with little (if any) coordination between them during their definition [11]. These plans are examples of LTES analyses.
Some pioneering studies were conducted for Spain [12], but it was not until the development of the Spanish 2019 NECP that several studies emerged in parallel. These studies shared common characteristics, such as: forecasting the technology mix for the 2030 and 2050 horizons, falling under the LTES category, assessing technical potential, and being scenario-based, with results depending on the specific model used.
Despite their relatively simple calculations, these studies yield different results due to varying assumptions and parameter values. For example, Table 1 compares the projected wind and solar PV generation capacities for 2030 from different analyses using national spatial resolution and multi-year time resolution.
Another common characteristic to all these studies is the so-called “single-node hypothesis, which neglects the relevance of spatial resolution by assuming infinite capacity of the transmission network.”[11].
Although these energy system-planning tools can be used for preliminary design of the HPPs, they have some major limitations. For example, operational aspects, physical and electrical infrastructure design and interactions between the technologies are not usually included [21]. However, some attempts [22,23,24] have been made within this LTES category to work with higher temporal (hours) and spatial resolutions. In particular, some works [11,25] have worked on the allocation of wind and solar PV capacities in Spain, based on the PyPSA tool (one of the most popular Python-based open-source toolboxes for the simulation and optimization of modern power systems [26]), that considers physical and electrical infrastructure design and interactions between the technologies at a regional level, searching for the trade-off between generation and decarbonization. They open a door in the direction of transforming LTES category into more detailed analyses, as the availability of high-resolution data and the computational resources becomes higher.
2.2. Geo-Spatial Planning
GIS and associated modelling approaches offer the potential to spatially outline areas that are suitable for the deployment of renewable energy plants, using a wide range of physical, technical, legal, economic and social criteria, including those related to energy demand and infrastructure availability. Spatial decision support systems also offer the opportunity to compare various scenarios and criteria weightings [27].
Previous studies in the literature employs GIS-based approaches for both the evaluation of suitable locations for PV, wind, and hybrid systems [28,29,30,31] and for solar and wind resources evaluation [32,33]. In particular, GIS data can be employed as inputs in different Multi-Criteria Decision Making (MCDM) approaches. GIS applications enable georeferenced data storage, management and visualization, along with calculations and analysis using data from different sources, such as databases, spatial data infrastructures with open data and national or international institutions. Therefore, combinations of GIS and MCDM approaches result in valuable methods for the assessment of suitable locations for hybrid plants.
In Spain, several multi-criteria GIS-based approach to integrate solar PV, wind and biomass have been proposed. One case is the province of Málaga, an area with high energy demand for residential and tourist use, where these types of generation plants both individually and in combination have also been analysed. Additionally, they included a cluster evaluation of the land availability distribution for this type of installation in all the municipalities of the province [34]. For the province of Jaén, its integration with the existing local power plants and the electric grid was considered. They combined the environmental, technical and geographical factor with economic and social-acceptability attributes [35].
In this LCOE calculation approach, the Intigis model estimates the equivalent cost of electrification to compare various energy systems. The application incorporates both renewable and conventional technologies, as well as the possibility of hybridizing them. It focuses on isolated systems and rural electrification, providing a comparative analysis of microgrid implementation versus home system installations. The model has been applied extensively in Latin America, Africa, and Europe, evolving to emphasize load clustering and the use of open-source software in its current development [36].
Main efforts within the geo-spatial planning category have been performed in two disciplines, in relation to HPP deployment in Spain: complementarity of resources and environmental zoning.
- -
-
Complementarity in the wind and the solar resources has been identified as one of the main issues for the deployment of HPPs. Even though some study has been made for off-shore applications [37], most of the initiatives are related with the peninsular territory in Spain. From all of them, two open-source applications are outlined here:
- ○
- ○
-
SOWISP [40]: “the SOlar and Wind Installed Spanish Power (SOWISP) database. SOWISP provides the actual installed capacity of wind and photovoltaic solar energy in each Spanish town, with a monthly resolution, and covering the period of 2015–2020. In addition, a Python package (available on GitHub) was developed for managing this database”. Two applications have been derived from the SOWISP tool:
- ▪
- RetroDB, an enhanced database of the Spanish wind energy resources, which provides high spatial and temporal estimates of both wind speed and wind energy CFs, spanning several decades [41].
- ▪
- SHIRENDA_PV, an enhanced open access database of Spanish solar PV energy resources. This database consists of hourly values of solar PV capacity factors for the Spanish NUTS 3 regions covering the period of 1990–2020 [42]
- -
- Environmental zoning for the implementation of renewable energies [43]. The Ministry for Ecological Transition and the Demographic Challenge, has developed a tool to identify the areas of the national territory that present the greatest environmental conditioning factors for the implementation of these projects, through a territorial model that groups together the main environmental factors, resulting in a zoning of the environmental sensitivity of the territory. The environmental zoning tool for renewable energies consists of two layers of information (one for wind energy and the other for solar PV energy) that show the value of the environmental sensitivity index existing at each point on the map, and the environmental indicators associated with that point.
2.3. Product Cost Models
These models are commonly used for analysis and design of individual HPPs, but it is not so common to find them for the mapping of the potential of these installations in wider areas, with only a few studies exploring the techno-economic potential for retrofitting existing wind power plants into PV-wind HPPs [44]. The reason for this is twofold: firstly, the common unavailability of the necessary data to perform such an analysis and, secondly, the computational requirements when covering national or even regional areas.
No activity has been identified in this category in Spain for HPPs. So this gap is identified as the main target of the proposed map to evaluate the potential of HPPs in Spain, including the point of view of the interest for the promoter of the plant. Latest auctions with no interested promoter, even in the field of off-shore wind farms in Denmark [45], show that planning must take into account not only the environmental and physical viability of the plants, but also the interest for the developers and financers, which is related with renewable resources and existing infrastructure, but also with the market and regulation functioning and stability.
In Section 4, a review will be made of existing product cost models for HPPs.
2.4. Technical Network Studies
As mentioned previously, a distinction is made in electricity planning between binding planning and indicative planning. Indicative planning was described in Section 1.1.1, whereas binding planning is carried out by the Transmission System Operator (TSO), Red Eléctrica de España (REE) in the case of Spain. [46] The aim of the binding planning is the design of the transmission networks to fulfil the desired requirements expressed in [10]. Therefore, it is out of the scope of the initiative proposed in this paper. However, there is one particular task in this binding planning that is of great interest in this review, for its similarity with the approach of the proposed initiative: the estimation of the location of new renewable generation defined in the NCEP, establishing a hypothesis of the location of future renewable generation facilities -mainly wind and solar PV generation facilities-. Traditionally, the connection requests were used to make this estimation, but the volume of both access requests and proposals for the connection of renewable generation greatly exceeds the goal in the 2026 horizon in Spain. Therefore, a methodology has been developed for this estimation.
This methodology is inspired by the guiding principles of maximization of renewable production, evacuation of renewables based on resources, compatibility with resource-based renewables, compatibility with environmental constraints, maximizing the use of the existing grid, and compliance with the principles of efficiency and economic sustainability.
The established methodology consists of the following four steps:
- Analysis and obtaining of the geographical distribution of the resource. For the solar resource, historical series of actual production of solar PV generators currently in service have been used. For wind resource, data came from IDAE’s wind atlas. However this atlas is no longer available and the website of the atlas, redirects either to the New European Wind Atlas (NEWA) [47] (and the derived platform for Iberia [48]) and to the Global Wind Atlas (GWA) [49], that are within the sources covered in [4]. In both cases, the annual number of equivalent hours of production has been chosen in order to use an indicator that is independent of the size of the installation and standardized.
- Analysis and obtaining of the geographical distribution of the ease/difficulty of carrying out the processing, considering the absence of environmental restrictions and conditioning factors for the implementation of solar PV or wind power plants. This step is based on the study [43], described in Section 2.2, which is conceived as a tool to help in the decision-making process on the location of these energy infrastructures.
- Analysis and obtaining of the geographic distribution of the probability of success of the construction of solar PV or wind power plants based on resource distributions, production efficiency and ease of processing. A synthetic indicator has been developed by combining the previous indicators of production capacity (resource and efficiency) and ease of environmental processing (zoning map), which is an indicator of the probability of success of locating in a given area.
- Allocation by node of the new renewable capacity in the 2026 study scenario: estimation of the best requested locations (requests for access to the transmission grid, both those granted and those denied and proposed to the planning process) based on the probability of success and weighted by the weight of the intentions of the promoters in each autonomous community. Figure 1 shows a graphical result of the overall process.
The technology and aim of this study from the TSO (estimation of the location of wind and solar PV generation) are different from the technology and aim of this paper (establishing the potential of HPPs). However, it has been described in more detail as it is considered to have many points in common in the scope, such as the four steps of the methodology. Hence, the indicator in the third step will differ in both approaches (in REE study, the indicator is strongly based on the easiness to connect to the grid, whereas in the proposed study the financial viability of the investment is the chosen criterion), but the methodology will be very similar.
2.5. Conclusions of Activities in Spain
A review of the activities related with the mapping of HPPs in Spain has been shown, following the four categories: LTES, geo-spatial planning, product cost models, and technical networks studies. In general, the review shows that there is an important activity in relation to the mapping of HPPs in Spain. In particular, LTES models are particularly numerous, although none of them addresses the mapping of HPPs directly. Some GIS tools have been identified that are directly involved in HPP mapping, but no product cost model has been found for its use at a national or even regional level. Finally, Spanish TSO is engaged in an interesting task, the estimation of the location of new renewable generation defined in the NCEP. It is not exactly the same approach that the one of this review, but it has some attractive similarities.
3. Other Activities (Outside Spain)
As mentioned earlier, this review aims to develop a map evaluating the potential of hybrid power plants (HPPs) in Spain. Consequently, the primary focus has been on activities within Spain. However, significant research efforts in this field have also been undertaken in other countries. This section provides a brief overview of some noteworthy initiatives outside Spain.
3.1. IEA Wind Task 50 [51]
The general purpose of the proposed IEA Wind Task is to coordinate international research and development in the field of hybrid wind power plants. The elaboration of maps for the potential evaluation of HPPs is not directly included in any of the activities of this Task. However, some of the work packages (WP) are indirectly related, such as WP1, Collection of research results, state-of-the-art and expert consensus; WP2: Design of a suite of reference hybrid plants and WP3: Overview of design and operation technology/algorithms.
There are nine participant countries (Belgium, Canada, Denmark, Germany, Ireland, Netherlands, Norway, Sweden and US) and five observer countries (Australia, France, India, Spain, UK)
3.2. Activities in USA
The effort to develop HPPs in the US is one of the most ambitious and best documented ones in the world, both in terms of deployment and research. In terms of deployment, wind-solar-storage hybrid power plants represent a significant and growing share of new proposed projects in the United States [52]. A description of the Status of operating and proposed HPP is presented in [53]: 80 new hybrid power plants with 7.9 GW of operational generating capacity and 11.6 GWh of operational storage capacity in 2023 (66 of them were solar-plus-storage).
In terms of research, an informal task force on hybrid energy systems was established in 2020, with the ultimate goal of identifying R&D activities that multiple offices can collaborate on to increase impact. The opportunities identified are categorized into three research areas: markets, policy, and regulation; Valuation, and technology development [54]. These research areas are directly related to the elaboration of a potential map for HPPs. A deeper analysis focused on hybrid power plants using only renewable generation can be found in [55]. It established the starting point for the improvement on the design and optimization, and control and operation of these systems.
In this sense, although there are different research centers and labs involved, the Berkeley lab is a reference in providing data of HPPs deployment and, mainly, NREL is the most active center for HPPs research. A brief description of the NREL’s activities is shown, as some of them will be referred later.
3.2.1. NREL - Hybrid Energy Systems Research
NREL is active in different areas regarding HPPs. For their close relationship with this paper, the development of software tools and the identification of best locations for HPPs will be addressed briefly.
NREL is developing robust open-source modelling tools capable of simulating and optimizing a range of hybrid energy systems. The Hybrid Optimization and Performance Platform (HOPP) is a software tool (part of the NREL suite of systems engineering tools) that enables detailed analysis and optimization of hybrid power plants down to the component level, and it is described in Section 4.2.2. HOPP leverages other NREL-developed tools [56] such as: ReOpt, finds the combination of technologies and dispatch strategy that minimizes lifecycle cost of energy to the site; System Advisor Model, SAM, for detailed performance and financial modeling, will be described in Section 4.2.2; Wind-Plant Integrated System Design and Engineering Model (WISDEM®), couples flow models with other system performance and cost models to enable design optimization; Regional Energy Deployment System model architecture (ReEDS), models the evolution and operation of generation, transmission, and end-use demand technologies [57].
Regarding the identification of the best locations for hybrid plant development, “NREL has created high-resolution wind and solar maps using a national database called the WIND Toolkit for wind integration and forecasting, as well as National Solar Radiation Database data. This data enables a full understanding of the complementarity of resource, a crucial piece in determining the optimal deployment of hybrid plants” [8].
3.2.2. Resource Characterization, Forecasting, and Maps
In a chronological order, these are some of the main initiatives in relation with maps elaboration:
- -
- RE Potential: was an estimation of the economic potential of several renewable resources available for electricity generation in the US [58]. Though it was not HPPs specific, it had some interesting characteristics, such as: high-resolution temporal data (hourly); relatively high-resolution spatial data (100000 sites for wind and 710000 sites for solar PV); and use of an economic indicator (LCOE) for the sites classification.
- -
- -
- Complementarity analysis, the first HPP oriented map: it is only the first step, addresses what future work would require: 1) consistent resource data, 2) more detailed local analysis, and 3) consideration of resilience-specific complementarity metrics [61].
- -
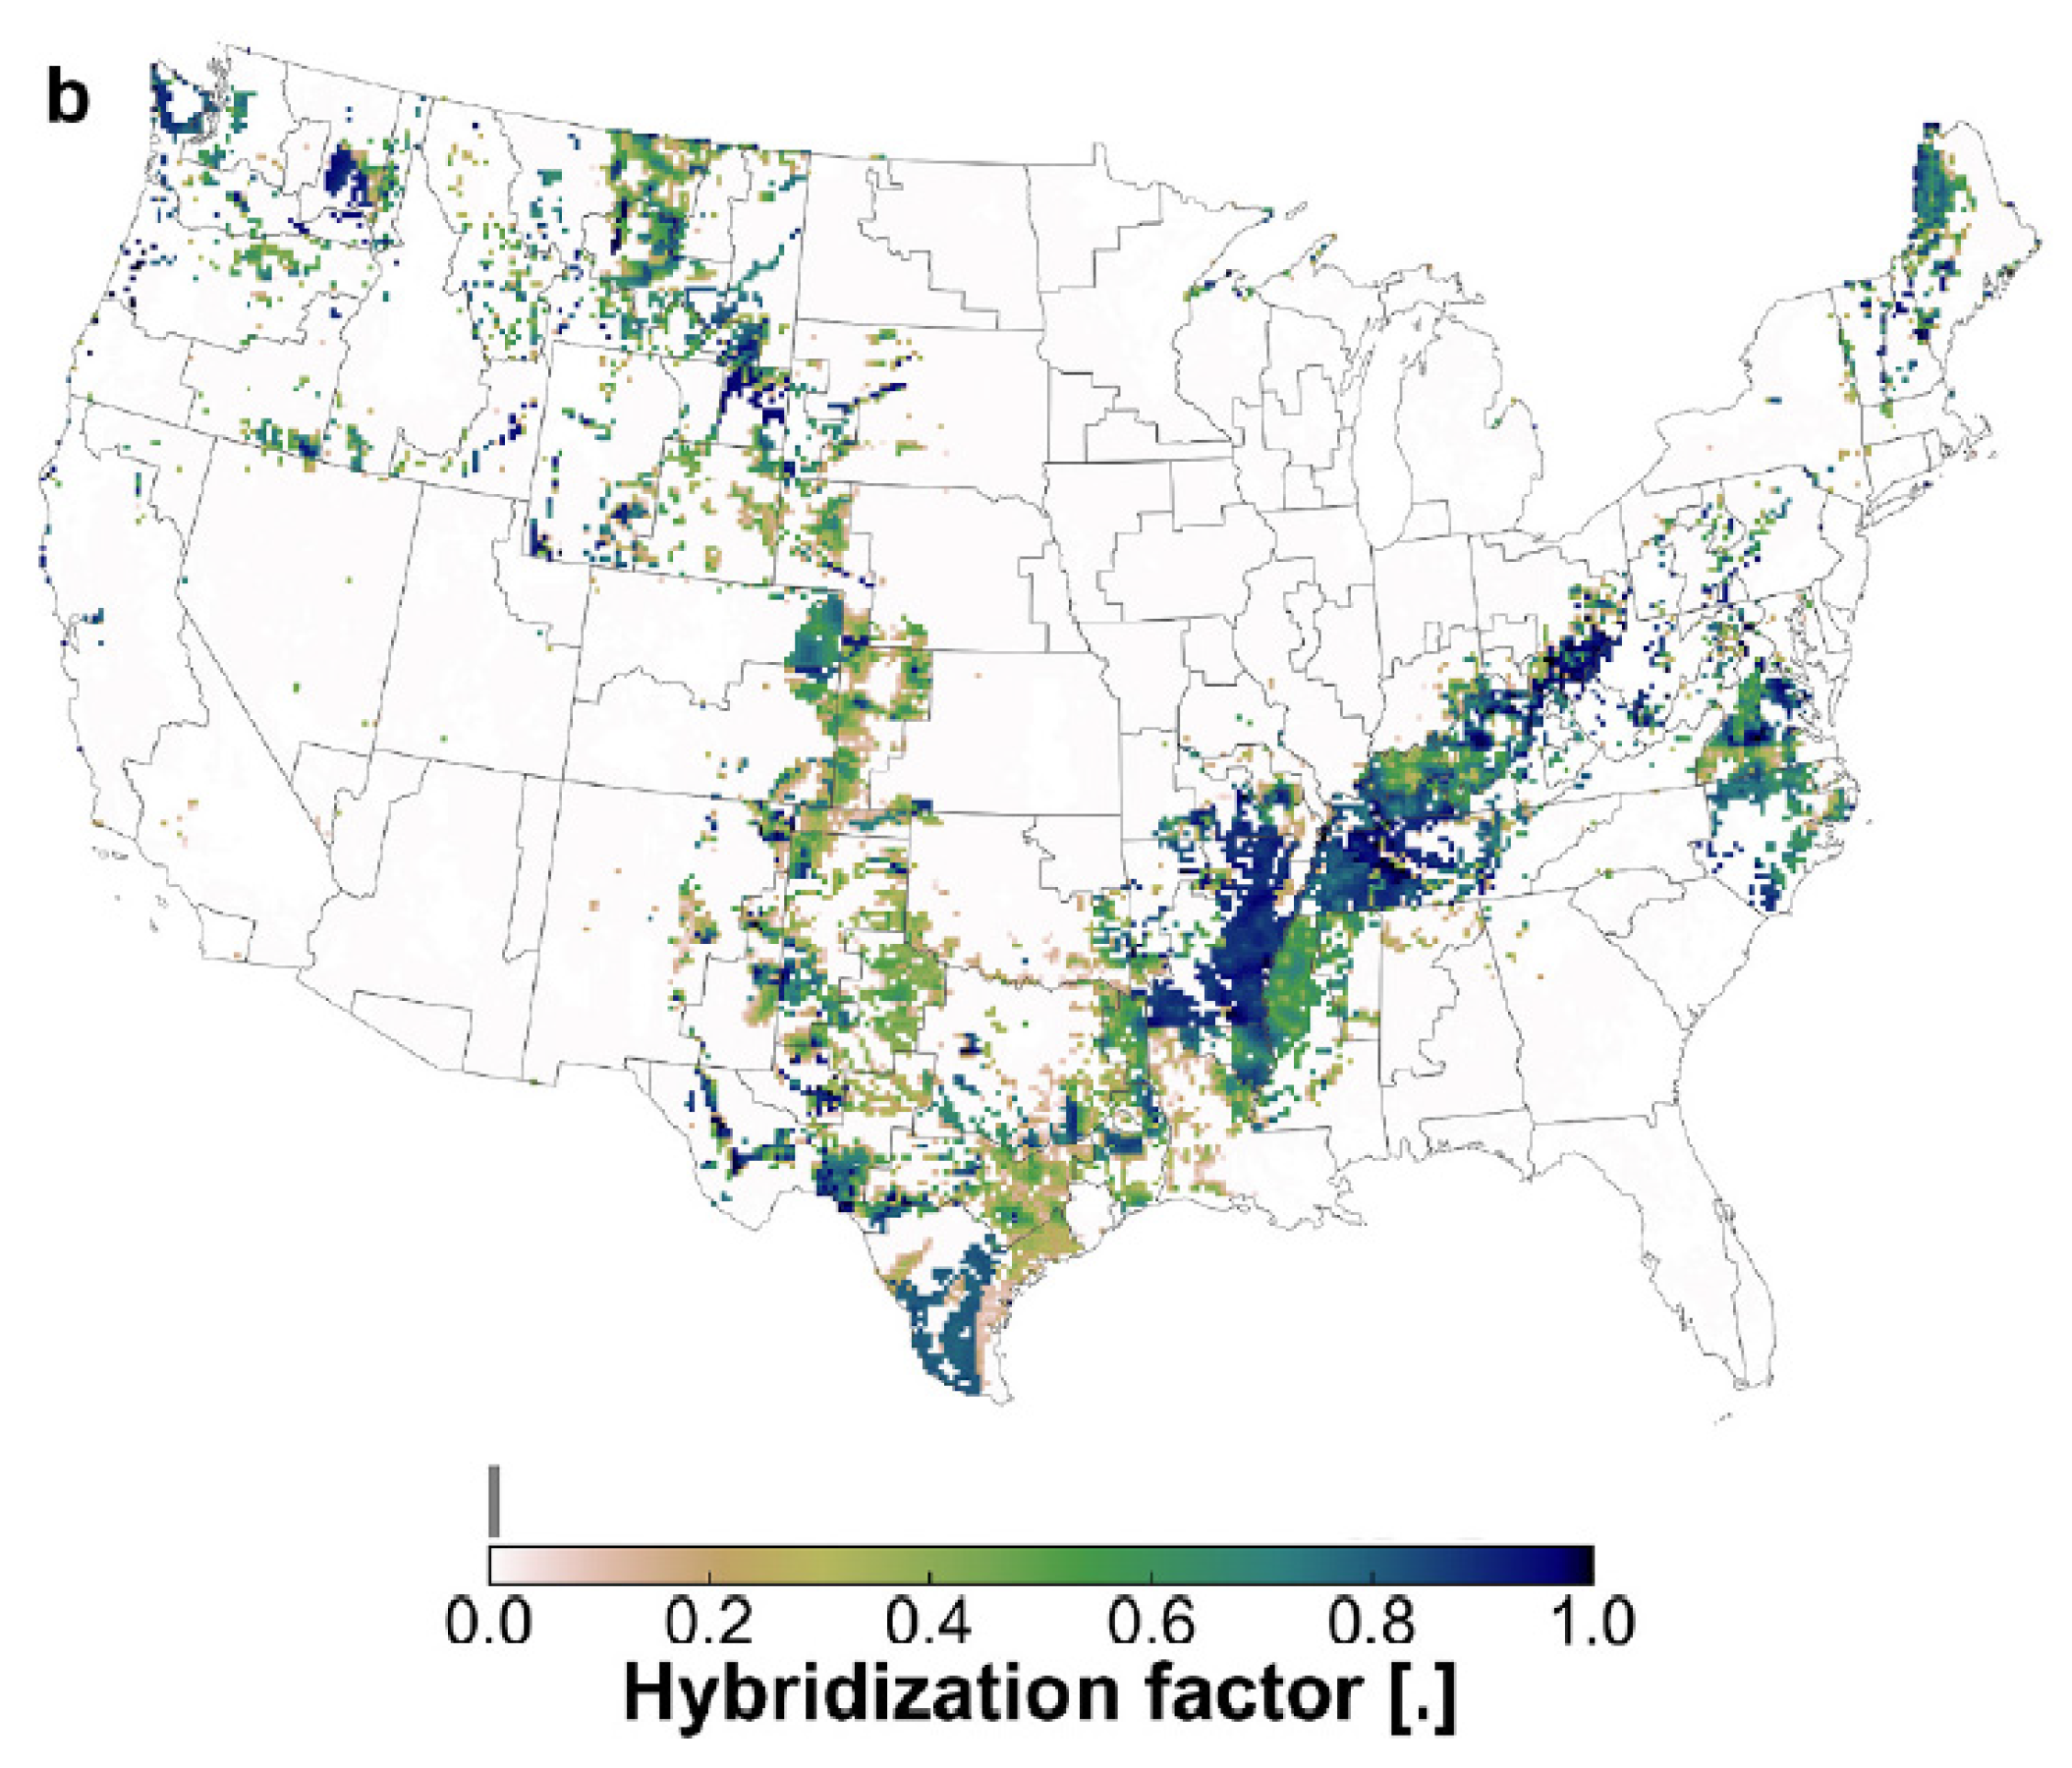
- High-resolution national-scale capacity expansion model [62]: to explore electricity-system-cost-minimizing deployment of PV-wind hybrid systems across the U.S. in scenarios that achieve a zero-carbon electricity mix in 2040. It introduces the Hybridization factor that varies piecewise-linearly between 1 when wind and solar capacities are equal, and 0 when one of wind and solar capacities are zero. ReEDS tool is used. Taking into account the influence of the point of interconnection (POI) in the design of the HPPs, “the cost-optimal solution includes 290 GW of POI capacity with a hybridization factor > 0.5 (i.e., with a site PV/wind capacity ratio between 1:3 and 3:1)”. Figure 26 shows the hybridization factor by site across the US.
Figure 2.
Hybridization factor by site across the US for the site-LCOE-minimizing model [62].
Figure 2.
Hybridization factor by site across the US for the site-LCOE-minimizing model [62].
3.3. Activities in Denmark
Similarly to what it was described in the US, the activity on HPPs in Denmark has led to the constitution of the Danish Hybrid Wind Power Plant Forum. It is formed by most of the major Danish stakeholders in the field of HPPs (Technical University of Denmark, DTU, is the main responsible, with the universities of Aalborg, Aarhus and Syddansk as partners) comprising mainly wind, solar and storage technologies [63].
In particular, research at DTU on HPPs has a long history [64], as a legacy from previous research on hybrid systems. This research on HPPs has produced different outcomes, mainly in the form of MSc and PhDs thesis, projects (such as HYBRIDize) participation in HPPs working groups (such as the abovementioned Danish Forum and the IEA Task50), HPP facility, and the National Energy System Transition Facilities (NEST) [65].
In relation to the development of tools, two of them are particularly interesting for the development of HPPS:
- HyDesign: it will be described later in Section 4.2.2.
3.4. Activities in Australia
The following remarkable activities have been found in relation to the potential of HPPs in Australia:
- Within the analysis called “Prospective hydrogen production regions of Australia” [67], the Scenario 1 analyses renewable wind, solar and hydropower resource potential, without infrastructure constraints. A map [68] was produced, showing where highest potential wind and solar coexist or where renewable resources could be firmed by hydropower.
- One of the 100% Renewable Energy Group outputs is the Australian Solar PV and Wind Heat Maps [69]. They are heat maps, showing an indicative cost of electricity (in AUD/MWh) for each pixel (1km x 1km for solar and 250m x 250m for wind), comprising the cost of energy from a solar/wind farm PLUS an associated power line connecting the solar/wind farm to the existing and planned high voltage transmission network. Though it is not a HPPs map, its approach is very similar to the HPP approach in some of the related aspects.
-
Australian National University has produced FIRM energy planning model. It is an open-source model, and has been applied in different places like the wind-constrained Sunbelt countries [70], Malaysia [71] or Japan [72]. The value of FIRM compared to other capacity expansion / long-term energy planning models is [73]:
- -
- All new generation is expected to come from solar and wind within the model. In 2023, 84% of new capacity around the world was solar and wind, while 2% was from all other renewables.
- -
- Energy balance is performed over large time horizons (10 – 40 years), making sure that long-duration energy storage for infrequent calm, cloudy weeks is properly modelled. These are the biggest driver of energy storage capacity and associated costs.
3.5. Activities in India
The Government of India issued the National Wind-Solar Hybrid Policy [74] to regulate and coordinate the deployment of these systems. The National Institute of Wind Energy (NIWE) of India has developed the Hybrid (Wind-Solar) Map Portal [75]. The Wind-Solar Hybrid Map has been prepared by combining the wind potential map and solar atlas prepared by National Institute of Wind Energy (NIWE), Chennai. Both maps are combined in terms of %CUF at the 500m spatial resolution. Combined %CUF is defined as the ratio of the actual energy supplied from a hybrid plant over the year to the maximum possible energy that can be supplied against the declared project evacuation capacity in a year. In order to estimate the hybrid suitability, the %CUF values of both the maps are initially normalized to 0 – 50% and added together to the maximum value of 100%. The regions with Wind %CUF more than 35% and solar %CUF more than 20% are considered as the most suitable sites for Hybrid with suitability factor of 100%.
A comprehensive review of the mapping activities in India performed at the Standford University, along with another onshore wind energy atlas accounting for altitude and land use restrictions and co-located solar, can be found in [76]. The analysis performed by NREL through the Greening the Grid initiative, explores the technical and economic feasibility of integrating 175 GW of wind and solar capacity into India’s electricity grid by 2022 after screening for suitable sites, at a 500m resolution [77].
3.6. Activities in Saudi Arabia
Reference [78] proposes a spatio-temporal decision-making model for solar, wind, and hybrid systems, and uses Saudi Arabia as a case study. The study includes the potential analysis of solar, wind and hybrid systems. In relation to hybrid systems, the key finding is that HPPs covering 27.7 % of the country show high potential, especially in central and eastern regions, but curtailment in some areas reduces efficiency.
Nevertheless, this reference is also a complete and comprehensive analysis in relation to the goal of this publication, the mapping of the potential of HPPs. Firstly; the study performs a literature review, identifying the main research gaps. From those identified gaps, introduces a novel Spatio-Temporal Decision-Making Model (STDMM), proposing for that the following methodology:
- Calculate the technical and economic potential for HPPs using ERA5 reanalysis spatio-temporal weather data and technology-specific parameters.
- Suitability map: from results of phase 1, other topographical, social, logistical, and regulatory perspectives criteria (up to 20) are added through a 1 km2 raster analysis based on a multi-layered hybrid GIS-Bayesian BWM model. For the selection of the optimal weights for the selected criteria, a consultation of a group of experts from different energy-related fields was carried out, via a questionnaire analysis.
- Elaboration of the maps that highlight optimal locations for hybrid systems, by analysing the complementarity of these resources and the benefits co-located PV and WT installations.
- Evaluation and validation of the proposed sites by comparing them with existing power plants, along with a comparative analysis with other related studies from the literature.
Finally, this work also includes a comprehensive review of existing activities in this area, and it will be crucial for the following conclusions section.
3.7. Conclusions of Activities Outside Spain
As a summary, this review of the main activities for getting the necessary results for the mapping of HPPs at a regional or national level has shown that there are different methods and tools available and, according to the particular aim of the study, different methodologies can be used (including different calculations, spatial and temporal resolutions, etc.). The aims of the studies range from the analysis of resources complementarity, to planning for power independence.
As stated before, reference [78] offers a valuable comprehensive review of existing activities on mapping the potential of RES. The study may be considered as exhaustive, having identified more than 100 references (it should be taken into account that not all of them refer to HPPs, as they also include only solar PV-only and wind-only power plants). The main findings of this review suitable for HPPs are summarized now: the integration of GIS and multi-criteria decision-making (MCDM) (e.g., Analytic Hierarchy Process, AHP) for site selection and evaluation, the predominance of data normalization techniques such as reclassification and sensitivity analysis via weight variation, and the importance of considering both geographical and cost-based feasibility alongside spatiotemporal characteristics in mapping approaches.
Finally, the main recommendations for the mapping of HPPs identified in the mentioned reference work [78] are summarized now: consider not only geographical but also cost-based feasibility, and consider spatiotemporal characteristics. These insights align closely with the objectives of this paper, reinforcing the necessity of a comprehensive methodology for HPP potential evaluation.
4. From Data to Results
The elaboration of the mapping of RES starts with the data covering resources, cost, prices, and so forth, the elaboration of criteria for the selection and suitability evaluations, and the calculation for the techno-economic performance evaluation for each area. This section reviews the options for this process, starting with an update on data sources and followed by an overview of existing tools for generating the desired results.
4.1. From Data… An Update on Data Sources
In the first paper of this series [4], the analysis of data was carried out in terms of variables and parameters, sources of information and spatial and temporal resolution. Since its publication, new data sources have emerged that can enhance and complement this information. For example, updated resource data is now available [79]. Additionally, new EU regulations [5] aim to help Member States identify Renewable Energy Acceleration Areas (REAAs) for the rapid deployment of renewable energy projects. These regulations emphasize the need for digitally consolidated datasets on energy and environmental factors. Key data sources include: PVGIS, for solar radiation and PV system performance; the Global Wind Atlas (GWA) and the New European Wind Atlas (NEWA) for wind power generation; but the Energy and Industry Geography Lab [81] is the proposed reference. It brings together a wealth of geospatial information on energy, including datasets on the renewable energy potential at NUTS2 level, industry and environmental factors. In early 2024, it included the following datasets: Natura 2000 sites, nationally designated protected areas, key biodiversity areas, important bird areas, ecologically or biologically significant marine areas (EBSAs), peatlands, industrial facilities, and wastewater treatment plants. In addition to the listed digital tools and databases, the Earth Observation data, for instance from the Copernicus Programme [82], could be used.
This regulation also provides with some recommendations for the Member States in relation with RAAs: they should not lead to the creation of ’no-go areas’, and the zones where renewable energy should not be developed (‘exclusion zones’) should be reduced to the necessary minimum [27].
Finally, as this mapping activity is foreseen to be active during these years, this information may evolve with new sources of information and new parameters of interest, with maybe even more accurate temporal and spatial resolution for particular analysis [80].
In Section 4, a simplified application will be presented for Spain. The initial data for the suitability evaluation, related with the analysed parameters, comprehend a series of layers (Table 3) for both PV plants and wind plants. The available data have been obtained from various geographic data portal and provided by governmental institutions. Some of them were collected and assembled in previous works conducted in CIEMAT [83,84].
4.2. … To Results: Tools and Methods for the Design of HPPs
As stated before, the core of this paper is a review of the existing tools and methods available for the calculation of the results of the design of HPPs. This is the topic covered in this Section. The existing research on power output modeling related to utility-scale HPPs is presented in [89], which includes a comprehensive overview and identifies knowledge-gaps. An analysis of the optimal Sizing of HPP Technologies is addressed in [90], identifying some challenges, like the complexity of sizing and the obstacle of solving the collection system cable layout optimization, and some opportunities, like the novel approaches of modeling wind and solar time series considering high-frequency fluctuations and the impact of climate changes.
The approach in this Section will be different, as it will be focused on the commonly available tools, either because they are commercially available or because they are open-source. So, proprietary tools for the design of HPPs, such as those of CIRCE [91], Tekniker [92] or GE’s FLEXIQ [93]; and non-publicly available research tools, will not be addressed in this review. The review does not pretend to be exhaustive but indicative regarding the existing both commercial and open-source tools.
4.2.1. Existing Commercial Tools
HPPs may be considered as an evolution of Hybrid Systems, in which at least the size and the business model may be different, but they obviously maintain some common characteristics, such as the complementarity of the resources, or the optimization and sizing algorithms for the design and the control. Therefore, although HPPs is a relatively new technical solution, Hybrid systems have existed for decades and, so, some commercial tools for their design were in the market. Some of these existing commercial tools have included a new toolbox or a new version for the design of HPPs. Some of the most important ones are HOMER Pro and iHOGA. HOMER Pro and iHOGA are well known in the electrification of stand-alone systems [94].
WindPro is a reference in the design and simulation of wind farms, and recently includes a module for the design of HPPs.
A brief description in their approaches to the design of HPPs is presented in the following subsections.
- From HOMER Pro to HOMER Front
“HOMER Pro (Hybrid Optimization Model for Multiple Energy Resources) by UL is a simulation tool meant to design viable microgrids. It can optimize the design of microgrids by simulating various combinations coupled with sensitivity analysis.” [21].
HOMER® Front software by UL Solutions performs techno-economic analysis on HPPs, providing a web-based platform. It is specially focused on the integration of energy storage systems to existing power plants, providing with the calculation of the project value, mitigate potential risks and optimize multiple areas, such as energy markets, business models, and battery capacity (including degradation, augmentation and replacement strategies) to determine the internal rate of return (IRR) [95]. A description of HOMER Front can be found in [96].
- From iHOGA to MHOGA
iHOGA / MHOGA are two versions of the Hybrid Optimization by Genetic Algorithms (HOGA) software, developed in C++ by researchers of the University of Zaragoza (Spain) for the simulation and optimization of Electric Power Generation Systems based on Renewable Energies. iHOGA is for systems from few W up to 5 MW power, whereas MHOGA is for MW power systems, without any limit [97] and it was developed with the collaboration of the company Sisener Ingenieros. A description of MHOGA version can be found in [98].
- WindPRO
windPRO is a software suite for design and planning of wind farm projects. windPRO covers everything from wind data analysis, calculation of energy yields, quantification of uncertainties, assessment of site suitability, to calculation and visualization of environmental impact. windPRO can also be used for detailed post-construction analysis of production data, all available in separate modules as needed. The HYBRID module is available in version windPRO 4.0, and it allows the analysis of HPPs. A description of the HYBRID Module can be found in [99].
- A comparison of the commercial tools
A comparison of these three commercial tools is shown in Table 4.
4.2.2. Open-Source Tools
These tools have appeared in the academic and research environment, and their orientation is double: it may serve as a tool for the design of one single HPP, as the ones in Section 3.1, but they are open-source and can be integrated in a co-simulation tool for the elaboration of maps and public knowledge, in order to aim the technical decisions for policy makers. A brief description in their approaches to the design of HPPs is presented in the following subsections.
- System Advisor Model (SAM) [100]
Using time-series weather data, system specification features including physical layout, and inputs for system losses, SAM can predict the electricity production and costs over time as well as the income from different revenue streams (energy, capacity, incentives) and use them to perform a detailed financial analysis of the system performance for various high-level objectives including LCOE, NPV, payback periods, and more [101].
SAM evaluates the feasibility and potential of renewable energy projects and identifies potential opportunities for improvement. It allows users to enter detailed information about the site, the technology, and the financial parameters and then generates performance and economic predictions based on that data. However, it did not model hybrid systems until version 2023.12.17 r1 SSC 290, where this new capability was added. Another important characteristic of SAM is PySAM [102], a Python package that can be used in Python code to make calls to the SAM compute modules.
The available hybrid system configurations are: solar PV generation, wind generation, battery storage, and fuel cell [103]. SAM's hybrid system models combine two or more power generation subsystems with battery storage. SAM estimates the annual energy production for a given system configuration using reduced-order models, databases of component performance, and loss factors at multiple points along the simulation. [104].
- Hybrid Optimization and Performance Platform (HOPP) [105]
Hybrid Optimization and Performance Platform (HOPP) is an open-source software tool developed by NREL for the detailed analysis and optimization of HPP, which is integrated with other open-source tools, such as SAM. HOPP has the capability to assess and optimize projects that contain combinations of wind (onshore and offshore), solar, storage, geothermal, and hydro [106]. It takes into account physical design constraints, such as shadow flicker effects and irregular boundaries, when optimizing the layout of wind and solar power plants.
- HyDesign [107]
HyDesign is a state-of-the-art optimization tool developed at the DTU [108]. It provides the optimal hybrid plant sizing based on a user specified financial metric, such as net present value over capital costs (NPV/CAPEX) or levelized cost of energy (LCOE). The design variables of the optimization include wind turbine design (blade tip to ground clearance, specific power, rated power), wind plant design (number of wind turbines, wind power density), solar plant design (AC power, surface tilt angle, surface azimuth angle, DC/AC ratio), battery sizing (power rating, energy storage duration).
- A comparison of the open-source tools
A comparison of these three open-source tools is shown in Table 5.
5. A Simplified Example of Application
To illustrate the potential outcomes of a mapping exercise, this section presents a simplified application. The simplification primarily concerns the temporal resolution of the data, while the spatial resolution aligns with the target value of 1 km². The results provide a representative overview in terms of shape and granularity, though future work will be required to enhance accuracy.
A general scheme of the methodology is represented in the scheme below (Figure 3). The process consists of three main steps, which will be described in the following sections:
- Suitability Map Creation, for hybrid systems: using ArcGIS Pro software.
- Optimal Sizing and Profitability Model for hybrid plants.
- Profitability Map Generation for Spain: implementing the model in ArcGIS.
5.1. Suitability Map Creation
As a first step, a preliminary suitability map for PV-wind hybrid systems in Spain is built integrating GIS based and MCDM process. The initial layers for the suitability evaluation, related with the analysed parameters, were presented in Table 3.
To build the map, the software ArcGIS Pro and its geographic analysis and processing tools are used. As MCDM method for the evaluation of the suitability, a combination of Boolean logic and fuzzy logic is considered. The Boolean logic for exclusion layers, allows to associate to each cell of a raster a number equal to 0 or 1, according to a previously defined criterion. Value 0 represents the cells that are unavailable for the installations of renewable energy systems, while value 1 are the available ones [109]. Besides, the Fuzzy logic for the ponderation layers allows associating to each cell a number between 0 and 1, according to a defined “fuzzy membership”. They enable to set the suitability of the cells according to each parameter. In this case, the memberships employed are “linear increasing” and “linear decreasing”. The first one gives 0 to the lowest value of the scale and 1 to the highest one and the values increase as the parameter value increases. In the second one, 0 is assigned to the highest value of the scale and 1 to the lowest one, while all the others decrease as the parameter values increase.
The exclusion and ponderation layers are combined to generate a suitability map for PV systems and other for wind systems that finally are overlaid to create a suitability map for PV-Wind Hybrid map. Subsequently, all the exclusion layers are multiplied to obtain a final exclusion cover and the ponderation layers are fuzzy superposed with the parameter gamma set to 0.9, since it is demonstrated to be the recommended one for this type of operation [110]. Each parameter for the construction of the suitability map is associated either with the Boolean or the Fuzzy logic through the criterions listed in Table 6. The choice of the ranges for the Boolean variables and of the fuzzy memberships for the weighted variables are the results of the research work carried out in [43,83,110,111].
Through ArcGIS pro tools, the suitability index map for hybrid system is represented in Figure 4, ranging from a “0” value (not suitable) to a maximum value of “1” (completely suitable). Once the overlay process is completed, the resulting map is represented with a raster resolution of 1,000 m X 1,000 m and a Geographic Coordinate System of WGS 1984.
The territory selected for the analysis of the profitability corresponds to all the suitable area obtained where the suitability index is higher than 0.5, in absence of a more precise criterion to select the area for the analysis. This value is chosen arbitrarily, to make sure that the points chosen for the profitability analysis will have a higher chance of being characterized by a high profitability. The validity of the selection of this threshold will be checked against the results of the profitability analysis, both in terms of the area and in terms of the results.
Considering the number of pixels that form the final raster layer, the percentage of the suitable area is calculated, and it is equal to the 24% of the total considered area.
5.2. Model for Sizing
The model for the evaluation of the optimal size of the hybrid plant and for the evaluation of its profitability consists of: a) evaluation of solar and wind resources; b) numerical method for the evaluation of the optimal size of the wind and solar PV power plant composing the hybrid system; c) evaluation of the profitability of the hypothetical plant.
5.2.1. Evaluation of Solar and Wind Energy Production
In this simplified example of application, it is based on monthly average values of solar irradiation and wind speed. The initial data consists of twelve raster layers representing the monthly average global daily irradiation on a horizontal plane, expressed in kWh/day, and twelve raster layers representing the monthly average daily wind speed, measured at 100 m, expressed in m/s. From these data, the energy available for each source is evaluated.
First, regarding the solar resource, the available energy has been calculated as a linear proportion between the Performance Ratio (PR, a value of 0.8 is assumed [112]), the power of the PV power plant (in MW) and the Peak Sun Hours (PSH, expressed in h/day), considering optimal capture each month.
Subsequently, to calculate the available wind energy, as demonstrated in [113], the monthly profile of the produced wind energy can be expressed through a linear relationship with the wind speed. So, the linearized relationship between the average monthly wind speed and monthly produced energy has been obtained from the brochure [114] of a particular wind turbine, the VESTAS V150- 6 MW – IEC S wind turbine. Consequently, for each month, the average wind energy available is calculated.
5.2.2. Evaluation of Optimal Size
To evaluate the optimal size of the wind and of the PV system composing the hybrid plant, a pure numerical method is employed. The following assumptions have been made:
-
Search space of wind and solar PV sizes in determined by:
- ○
-
The maximum installable power per unit area, in MW/km2:
- ○
- The unit size of generation: a value of 5 MW has been chosen both for wind and for solar PV generation.
- Evacuation capacity per unit area: considering that the grid capacity is usually one of the main limitations when installing new RES power plants, a theoretical value of 10 MW/km2 has been chosen for the evacuation capacity in this example, the same for every unit area, allowing the analysis of overplanting. However, the actual existing capacity for each area will be included for a more accurate analysis.
-
Business model: a simplified model has been selected for this example application, based on a PPA characterized by:
- ○
- PPA price: even though PPA prices have decreased during the last months [117], an optimistic value of 75 €/MWh has been selected for the results shown. However, it is one of the parameters suggested for sensibility analysis in our future work.
- ○
- Maximum energy delivered per unit area: it would be 240 MWh/day per square kilometre, considering a 100% capacity factor of the assumed 10 MW evacuation capacity.
- ○
- Minimum energy delivered per unit area: considering a margin of flexibility for the energy contracted in the PPA, it is assumed that that the HPP needs to deliver a minimum value, which has been chosen as 90% of the maximum energy delivered per unit area. No combinations that produce an amount of energy smaller than this minimum are considered.
- Components costs: Table 7 shows the values that have been used.
Analyzing the cost of each combination, the one with the minimum cost is found and the size of the two components will correspond to the optimal one for a hybrid combination. The most common combination of capacities is composed of a wind farm of 15 MW and a PV plant of 30 MW.
5.3. Profitability Map Creation
The model discussed in the previous section is implemented in ArcGIS pro through an algorithm written with python, including the calculation of the Internal Rate of Return (IRR), as the selected index to represent the profitability of the investment. This enables the iteration of the calculations of the model for each cell, and consequently, for each of the sites that were declared as suitable for the installation of a HPP in the preliminary suitability analysis. As a result, the map in Figure 5 is obtained for the representation of the IRR.
The sites with the highest value of IRR are the northern regions, in particular in Galicia, Aragón, Navarra, Castile and León. In the centre and south of Spain, a relevant number of profitable areas can be found in Castile -La Mancha and Andalucía
The sites that fulfil the design constraints represent the 99.4% of the suitable sites. The suitable areas that present an IRR higher than 7% are 89.9% of the total suitable area, and 21.9% of the total considered area. The maximum value of IRR is 20.4% while the minimum one is 3.3%.
6. Discussion
This study reviewed activities related to the mapping of HPPs in Spain, categorizing them into four areas: LTES models, geo-spatial planning, product cost models, and technical network studies. The review reveals significant activity in HPP mapping, particularly in LTES models, though none directly address HPP mapping. Several geo-spatial tools have been identified for HPP mapping, but no product cost models have been developed for national or regional use. Additionally, the Spanish TSO is actively engaged in estimating the locations of new renewable generation as defined in the NCEP. This paper proposes to address this gap by developing a product cost model for HPP mapping in Spain.
The review of international activities highlights the availability of diverse methods and tools, with methodologies tailored to specific study objectives. These range from analyzing resource complementarity to planning for energy independence. Key findings include:
- The widespread use of GIS tools integrated with MCDM techniques, particularly the AHP, for site selection and suitability evaluation.
- The predominant use of reclassification for data normalization and sensitivity analysis through weight adjustments.
The main recommendations from this review are to consider both geographical and cost-based feasibility and to account for spatiotemporal characteristics. These recommendations will be integrated into the development of HPP mapping in Spain, particularly using a product cost model.
Simplified Example and Findings
A simplified example was conducted to identify suitable locations for wind-solar hybrid systems with high profitability. The process involved:
- Suitability Mapping: A map of suitable sites for PV-wind installations in Spain was generated using Boolean and Fuzzy logic, considering climatic, ecological, and economic factors.
- Optimal Sizing and Profitability Model: A simplified model was developed to evaluate the optimal size and profitability of hybrid plants.
- Profitability Mapping: The model was implemented to produce a profitability map for each site in Spain.
Limitations and Future Work
The review of the suitability and profitability maps indicates the need for a more in-depth analysis to improve result precision. Key areas for future work include:
- Incorporating economic factors into the CAPEX and OPEX evaluation to study the influence of different components.
- Exploring different PPA models to assess their impact on profitability.
- Including storage systems, which are often associated with HPPs.
- Using hourly averages for energy production to improve the accuracy of optimal sizing.
- Incorporating georeferenced data on evacuation capacity.
- Investigating alternative metrics to better highlight the advantages of HPPs.
These refinements will enhance the accuracy and applicability of the model, providing a more robust tool for HPP mapping and decision-making in Spain.
Author Contributions
conceptualization: L.A., J.D.; methodology: L.A., J.D.; writing – original draft: L.A, M.B, A.M., J.D., J.N.; writing – review and editing: all; project administration: J.D; funding acquisition: I.C. All authors have read and agreed to the published version of the manuscript.
Funding
This research was funded by MEDIDA C17.I2G: CIEMAT. Nuevas tecnologías renovables híbridas, Ministerio de Ciencia e Innovación, Componente 17 “Reforma Institucional y Fortalecimiento de las Capacidades del Sistema Nacional de Ciencia e Innovación” funded by the European Union – NextGenerationEU.
Institutional Review Board Statement
Not applicable.
Data Availability Statement
links to publicly archived datasets analyzed during the study can be found mainly in Section 4.1.
Acknowledgments
The authors acknowledge the Erasmus Plus traineeship scholarship that funded Michael Borsato traineeship at CIEMAT.
Conflicts of Interest
The authors declare no conflict of interest.
References
- Directorate-General for Energy (2024): Guidance on designating renewables acceleration areas (SWD) Guidance on designating renewables acceleration areas - European Commission (europa.eu). https://energy.ec.europa.eu/publications/guidance-designating-renewables-acceleration-areas_en (Accessed on 19 March 2025).
- Spain’s recovery and resilience plan. https://commission.europa.eu/business-economy-euro/economic-recovery/recovery-and-resilience-facility/country-pages/spains-recovery-and-resilience-plan_en (accessed on 4 March 2025).
- Plan de Recuperación, Transformación y Resiliencia. COMPONENTE 17. Reforma institucional y fortalecimiento de las capacidades del sistema nacional de ciencia, tecnología e innnovación. Presidencia de Gobierno. 2023 https://planderecuperacion.gob.es/sites/default/files/2023-10/0310203_adenda_plan_de_recuperacion_componente17.pdf (Accessed on 4 March 2025, in Spanish).
- Arribas, L.; Lechón, Y.; Perula, A.; Domínguez, J.; Ferres, M.; Navarro, J.; Zarzalejo, L.F.; García Barquero, C.; Cruz, I. Review of Data and Data Sources for the Assessment of the Potential of Utility-Scale Hybrid Wind–Solar PV Power Plants Deployment, under a Microgrid Scope. Energies 2021, 14, 7434. [CrossRef]
- Commission Recommendation (EU) 2024/1343 of 13 May 2024 on speeding up permit-granting procedures for renewable energy and related infrastructure projects. https://eur-lex.europa.eu/legal-content/EN/TXT/PDF/?uri=OJ:L_202401343 (Accessed on February 4 2025).
- EEB’s response to the European Commission’s call for evidence: Renewable energy – guidance on designating renewables acceleration areas. 23 February 2024.
- Katalin Bódis, Ioannis Kougias, Arnulf Jäger-Waldau, Nigel Taylor, Sándor Szabó, A high-resolution geospatial assessment of the rooftop solar photovoltaic potential in the European Union, Renewable and Sustainable Energy Reviews, Volume 114, 2019, 109309, ISSN 1364-0321, . [CrossRef]
- https://www.nrel.gov/wind/hybrid-energy-systems-research.html (Accessed on 19 March 2025).
- IRENA (2017), Planning for the Renewable Future: Long-term modelling and tools to expand variable renewable power in emerging economies, International Renewable Energy Agency, Abu Dhabi.
- Resolución de 8 de abril de 2022, de la Secretaría de Estado de Energía, por la que se publica el Acuerdo del Consejo de Ministros de 22 de marzo de 2022, por el que se aprueba la planificación de la red de transporte de energía eléctrica Horizonte 2026.
- Cristobal Gallego-Castillo, Marta Victoria, PyPSA-Spain: an extension of PyPSA-Eur to model the Spanish energy system. 2024. arXiv:2412.06571 [physics.comp-ph] . [CrossRef]
- Domínguez Bravo, J., Garcia Casals, X., & Pinedo-Pascua, I. (2007). GIS approach to the definition of capacity and generation ceilings of renewable energy technologies. Energy Policy, 35(10), 4879-4892. https://dx.doi.org/10.1016/j.enpol.2007.04.025.
- European Commission: Directorate-General for Climate Action, Directorate-General for Energy, Directorate-General for Mobility and Transport, De Vita, A., Apostolaki, E. et al., EU energy, transport and GHG emissions, trends to 2050 – Reference scenario 2013, Publications Office, 2014, https://data.europa.eu/doi/10.2833/17897 (Accessed on 19 March, 2025).
- AEE, Elementos necesarios para la transición energética. Propuestas para el sector eléctrico. 2017, https://www.aeeolica.org/uploads/Elementos_necesarios_para_la_Transicin_Energtica_FINAL.pdf (Accessed on February 1, 2025, in Spanish).
- CEPSA, CEPSA Energy outlook 2030, 2017 edition. https://www.moeveglobal.com/stfls/corporativo/FICHEROS/Cepsa-Energy-Outlook-2030.pdf (Accessed on February 1, 2025).
- Greenpeace. Estudio técnico de viabilidad de escenarios de generación eléctrica en el medio plazo en España. 2018. https://es.greenpeace.org/es/wp-content/uploads/sites/3/2018/03/Generacion-Electrica_baja_5-03-2018.pdf (Accessed on February 1, 2025, in Spanish).
- Linares, P. et al. Escenarios para el sector energético en España 2030-2050. Technical report, Economics for Energy - Instituto de Investigación Tecnológica (U.P. Comillas), 2017. https://www.iit.comillas.edu/documentacion/informetecnico/IIT-17-189I/Escenarios%20para%20el%20sector%20energ%C3%A9tico%20en%20Espa%C3%B1a%202030-2050.pdf (Accessed on February 1, 2025, in Spanish).
- Deloitte, Una transición inteligente hacia un modelo energético sostenible para España en 2050: la eficiencia energética y la electrificación. 2018. https://www.deloitte.com/content/dam/assets-zone2/es/es/docs/services/consulting/2023/Deloitte-ES-MonitorDeloitte-Modelo-energetico-Espana-2050.pdf (Accessed on February 1, 2025, in Spanish).
- Comisión de Expertos de Transición Energética. Análisis y propuestas para la descarbonización. Ministerio de Energía, Turismo y Agenda Digital, 2018. http://www6.mityc.es/aplicaciones/transicionenergetica/informe_cexpertos_20180402_veditado.pdf (Accessed on February 1, 2025, in Spanish).
- MITERD. Plan Nacional Integrado de Energía y Clima 2021-2030. Ministerio para la Transición Ecológica y el Reto Demográfico, 2024. https://www.miteco.gob.es/content/dam/miteco/es/energia/files-1/pniec-2023-2030/PNIEC_2024_240924.pdf. (Accessed on February 1, 2025, in Spanish).
- Das, K., Murcia Leon, J. P., Habbou, H., Assaad, C., Pérez-Rúa, J.-A., Zhu, R., & Sørensen, P. E. (2022). HyDesign: A Tool For Design and Operation of Renewable Hybrid Renewable Plants. Paper presented at 21st Wind & Solar Integration Workshop, The Hague, Netherlands. [CrossRef]
- Marta Victoria and Cristobal Gallego-Castillo. Hourly-resolution analysis of electricity decarbonization in Spain (2017-2030). Applied Energy, 233:674–690, 2019. [CrossRef]
- Cristóbal Gallego-Castillo and Marta Victoria. Improving Energy Transition Analysis Tool through Hydropower Statistical Modelling. Energies, 14(1):98, 2021. [CrossRef]
- Bonilla J, Blanco J, Zarza E, Alarcón-Padilla DC, Feasibility and practical limits of full decarbonization of the electricity market with renewable energy: Application to the Spanish power sector, Energy (2021). [CrossRef]
- Santos-Alamillos, F., Pozo-Vázquez, D., Sánchez-Hernández, G., Jiménez-Garrote, A., López-Cuesta, M., DeFelipe-García, S., Ruiz-Arias, J. A., and Tovar-Pescador, J.: Analysis of the optimal allocation of wind and solar PV capacities in a decarbonized power system in Spain using PyPSA, EGU General Assembly 2024, Vienna, Austria, 14–19 Apr 2024, EGU24-1723, https://doi.org/10.5194/egusphere-egu24-1723, 2024. [CrossRef]
- Sarad Basnet, Karine Deschinkel, Luis Le Moyne, Marie Cécile Péra, A review on recent standalone and grid integrated hybrid renewable energy systems: System optimization and energy management strategies, Renewable Energy Focus, Volume 46, 2023, Pages 103-125, . [CrossRef]
- 2024; 27. Guidance on designating renewables acceleration areas Accompanying the document Commission Recommendation on speeding up permit-granting procedures for renewable energy and related infrastructure projects {C(2024) 2660 final} - {SWD(2024) 124 final}.
- Ali, S.; Taweekun, J.; Techato, K.; Waewsak, J.; Gyawali, S., GIS based site suitability assessment for wind and solar farms in Songkhla, Thailand. Renewable Energy 2019, 132, 1360-1372. [CrossRef]
- Sekeroglu, A.; Erol, D., Site selection modeling of hybrid renewable energy facilities using suitability index in spatial planning. Renewable Energy 2023, 219, 119458. [CrossRef]
- Subagyo; Moh. Yanuar, J. P.; Bambang, P. N.; Saleh, A.; Akhmad, F. W., The Suitable Location for a Hybrid Renewable Energy Wind-Solar Power Plant: A Review by Bibliometric. IOP Conference Series: Earth and Environmental Science 2023, 1266, (1), 012090. [CrossRef]
- Rekik, S.; El Alimi, S., Optimal wind-solar site selection using a GIS-AHP based approach: A case of Tunisia. Energy Conversion and Management: X 2023, 18, 100355. [CrossRef]
- Oh, M.; Kim, C. K.; Kim, B.; Kim, H.-G., A novel model to estimate regional differences in time-series solar and wind forecast predictability across small regions: A case study in South Korea. Energy 2024, 291, 130284. [CrossRef]
- Wu, H.; West, S. R., Co-optimisation of wind and solar energy and intermittency for renewable generator site selection. Heliyon 2024, 10, (5), e26891. [CrossRef]
- Díaz-Cuevas, P., Domínguez-Bravo, J., & Prieto-Campos, A. (2019). Integrating MCDM and GIS for renewable energy spatial models: assessing the individual and combined potential for wind, solar and biomass energy in Southern Spain. Clean Technologies and Environmental Policy, 21(9), 1855–1869. [CrossRef]
- Osorio-Aravena, J. C.; Rodríguez-Segura, F. J.; Frolova, M.; Terrados-Cepeda, J.; Muñoz-Cerón, E., How much solar PV, wind and biomass energy could be implemented in short-term? A multi-criteria GIS-based approach applied to the province of Jaén, Spain. Journal of Cleaner Production 2022, 366, 132920. [CrossRef]
- Torres-Pérez, M.; Peña Abreu, M.; Domínguez, J. Improvements to the IntiGIS Model Related to the Clustering of Consumers for Rural Electrification. 2024, 14335, 260-272. [CrossRef]
- Rubén Vázquez, William Cabos, José Carlos Nieto-Borge, Claudia Gutiérrez, Complementarity of offshore energy resources on the Spanish coasts: Wind, wave, and photovoltaic energy, Renewable Energy, Volume 224, 2024, . [CrossRef]
- http://climax.inf.um.es/ (Accessed on 19 march, 2025).
- Jerez, S., Barriopedro, D., García-López, A., Lorente-Plazas, R., Somoza, A. M., Turco, M., et al. (2023). An action-oriented approach to make the most of the wind and solar power complementarity. Earth's Future,11, e2022EF003332. [CrossRef]
- Antonio Jiménez-Garrote, Guadalupe Sánchez-Hernández, Miguel López-Cuesta, David Pozo-Vázquez, SOWISP—A retrospective high spatial and temporal resolution database of the installed wind and solar PV power in Spain, Solar Energy, Volume 256, 2023, Pages 44-54, . [CrossRef]
- Jiménez-Garrote, A.; Santos-Alamillos, F.J.; Sánchez-Hernández, G.; López-Cuesta, M.; Ruiz-Arias, J.A.; Pozo-Vázquez, D. Evaluation of a Database of the Spanish Wind Energy Resources Derived from a Regional Reanalysis. Energies 2024, 17, 1523. [CrossRef]
- Guadalupe Sánchez-Hernández, Antonio Jiménez-Garrote, Miguel López-Cuesta, Inés M. Galván, Ricardo Aler, David Pozo-Vázquez, A novel method for modeling renewable power production using ERA5: Spanish solar PV energy, Renewable Energy, Volume 240, 2025, . [CrossRef]
- Ministerio para la Transición Ecológica y el Reto Demográfico (MITECO). Zonificación ambiental para energías renovables: Eólica y fotovoltaica. https://www.miteco.gob.es/es/calidad-y-evaluacion-ambiental/temas/evaluacion-ambiental/zonificacion_ambiental_energias_renovables.html (Accessed on 19 march, 2025).
- Øyvind Sommer Klyve, Ville Olkkonen, Magnus Moe Nygård, David Lingfors, Erik Stensrud Marstein, Oskar Lindberg, Retrofitting wind power plants into hybrid PV–wind power plants: Impact of resource related characteristics on techno-economic feasibility, Applied Energy, Volume 379, 2025, . [CrossRef]
- https://windeurope.org/newsroom/press-releases/no-offshore-bids-in-denmark-disappointing-but-sadly-not-surprising/ (Accessed on 19 march, 2025).
- Plan de desarrollo de la Red de Transporte de Energía Eléctrica Período 2021-2026. https://www6.serviciosmin.gob.es/Aplicaciones/Planificacion/PLAN_DESARROLLO_RdT_H2026_COMPLETO.pdf (Accessed on 19 march, 2025).
- https://map.neweuropeanwindatlas.eu/ (Accessed on 19 march, 2025).
- https://www.mapaeolicoiberico.com/ (Accessed on 19 march, 2025).
- https://globalwindatlas.info/ (Accessed on 19 march, 2025).
- https://sig.mapama.gob.es/geoportal/ (Accessed on 19 march, 2025).
- https://iea-wind.org/task50/ (Accessed on 19 march, 2025).
- Clark, Caitlyn E., Aaron Barker, Jennifer King, and James Reilly. 2022. Wind and Solar Hybrid Power Plants for Energy Resilience. Golden, CO: National Renewable Energy Laboratory. NREL/TP-5R00-80415. https://www.nrel.gov/docs/fy22osti/80415.pdf (Accessed on 19 march, 2025).
- Will Gorman, Joe Rand, Nick Manderlink, Anna Cheyette, Mark Bolinger, Joachim Seel, Seongeun Jeong, Ryan Wiser. Hybrid Power Plants. Lawrence Berkeley National Laboratory. 2024 Edition. (https://www.utilitydive.com/news/hybrid-power-plants-account-for-majority-of-proposed-us-solar-storage-capacity-LBNL/728582/#:~:text=Dive%20Brief%3A,a%20higher%20price.) (Accessed on 19 march, 2025).
- U.S. Department of Energy (DOE). 2021. Hybrid Energy Systems: Opportunities for Coordinated Research. Golden, CO: National Renewable Energy Laboratory. DOE/GO-102021-5447. https://www.nrel.gov/docs/fy21osti/77503.pdf (Accessed on 19 march, 2025).
- Dykes, Katherine, Jennifer King, Nicholas DiOrio, Ryan King, Vahan Gevorgian, Dave Corbus, Nate Blair, Kate Anderson, Greg Stark, Craig Turchi, Pat Moriarity. 2020. Opportunities for Research and Development of Hybrid Power Plants. Golden, CO: National Renewable Energy Laboratory. NREL/TP-5000-75026. https://www.nrel.gov/docs/fy20osti/75026.pdf.
- https://www.nrel.gov/wind/data-tools.html (Accessed on 19 march, 2025).
- Brown, Maxwell, Wesley Cole, Kelly Eurek, Jon Becker, David Bielen, Ilya Chernyakhovskiy, Stuart Cohen et al. Regional Energy Deployment System (ReEDS) Model Documentation: Version 2019. Golden, CO: National Renewable Energy Laboratory. 2020. NREL/TP-6A20-74111. https://www.nrel.gov/docs/fy20osti/74111.pdf (Accessed on 19 march, 2025).
- Austin Brown, Philipp Beiter, Donna Heimiller, Carolyn Davidson, Paul Denholm, Jennifer Melius, Anthony Lopez, Dylan Hettinger, David Mulcahy, and Gian Porro. Estimating Renewable Energy Economic Potential in the United States: Methodology and Initial Results. Golden, CO: National Renewable Energy Laboratory. 2016. https://www.nrel.gov/docs/fy15osti/64503.pdf (Accessed on 19 march, 2025).
- Brinkman, Gregory, Dominique Bain, Grant Buster, Caroline Draxl, Paritosh Das, Jonathan Ho, Eduardo Ibanez, et al. The North American Renewable Integration Study: A U.S. Perspective. Golden, CO: National Renewable Energy Laboratory. 2021. NREL/TP-6A20-79224. https://www.nrel.gov/docs/fy21osti/79224.pdf (Accessed on 19 march, 2025).
- https://www.nrel.gov/analysis/naris.html (Accessed on 19 march, 2025).
- Clark, Caitlyn E., Aaron Barker, Jennifer King, and James Reilly. 2022. Wind and Solar Hybrid Power Plants for Energy Resilience. Golden, CO: National Renewable Energy Laboratory. NREL/TP-5R00-80415. https://www.nrel.gov/docs/fy22osti/80415.pdf (Accessed on 19 march, 2025).
- Patrick R. Brown, Travis Williams, Maxwell L. Brown, Caitlin Murphy, System-cost-minimizing deployment of PV-wind hybrids in low-carbon U.S. power systems, Applied Energy, Volume 365, 2024, . [CrossRef]
- https://hybrid-vindenergi.dtu.dk/about (Accessed on 19 march, 2025).
- https://iea-wind.org/wp-content/uploads/2022/01/Hybrid-wind-power-plants-research-at-DTU-Wind.pdf (Accessed on 19 march, 2025).
- https://orbit.dtu.dk/en/projects/optimized-design-and-operation-of-hybrid-power-plant (Accessed on 19 march, 2025).
- Matti Koivisto. Correlations in renewable energy sources (CorRES) A time series simulation tool for variable renewable energy. DTU, 2022. https://corres.windenergy.dtu.dk/static/pdf/corres_about.pdf (Accessed on 19 march, 2025).
- Feitz, A.J., Tenthorey, E., Coghlan, R. 2019. Prospective hydrogen production regions of Australia. Record 2019/15. Geoscience Australia, Canberra. https://d28rz98at9flks.cloudfront.net/130930/Rec2019_015.pdf (Accessed on 19 march, 2025).
- https://d28rz98at9flks.cloudfront.net/130930/130930_Hydrogen_Production_Prospectivity_Scenario_1_map.pdf (Accessed on 19 march, 2025).
- https://re100.eng.anu.edu.au/heatmaps/ (Accessed on 19 march, 2025).
- Weber, T.; Blakers, A.; Firnando Silalahi, D.; Catchpole, K.; Nadolny, A. Grids dominated by solar and pumped hydro in wind-constrained sunbelt countries. Energy Convers Manage 2024, 308, 118354. [CrossRef]
- https://github.com/TimWeberRE100/FIRM_Malaysia_Complex.
- Cheng, C.; Blakers, A.; Stocks, M.; Lu, B. 100% renewable energy in Japan. Energy Convers Manage 2022, 255, 115299. [CrossRef]
- Personal communication with Timothy Weber, Research Officer at the Australian National University, on 19 may, 2024.
- Ministry of New & Renewable Energy, India. National Wind-Solar Hybrid Policy. https://cdnbbsr.s3waas.gov.in/s3716e1b8c6cd17b771da77391355749f3/uploads/2022/12/2022122036.pdf . (Accessed on 19 march, 2025).
- https://maps.niwe.res.in/resource_map/map/hybrid/ (Accessed on 19 march, 2025).
- von Krauland, A.-K.; Jacobson, M.Z. India onshore wind energy atlas accounting for altitude and land use restrictions and co-located solar. Cell Reports Sustainability 2024, 1, 100083. [CrossRef]
- USAID and Ministry of Power. GREENING THE GRID: Pathways to Integrate 175 Gigawatts of Renewable Energy into India’s Electric Grid, Vol. II. Regional Study. https://www.nrel.gov/docs/fy18osti/68744.pdf. (Accessed on 19 march, 2025).
- Mohamed R. Elkadeem, Ali Younes, Jakub Jurasz, Atif S. AlZahrani, Mohammad A. Abido, A spatio-temporal decision-making model for solar, wind, and hybrid systems – A case study of Saudi Arabia. Applied Energy, Volume 383, 2025. [CrossRef]
- Sánchez-del Rey, A.; Gil-García, I.C.; García-Cascales, M.S.; Molina-García, Á. Online Wind-Atlas Databases and GIS Tool Integration for Wind Resource Assessment: A Spanish Case Study. Energies 2022, 15, 852. [CrossRef]
- Guidance on Article 20a on sector integration of renewable electricity of Directive (EU) 2018/2001 on the promotion of energy from renewable sources, as amended by Directive (EU) 2023/2413. https://energy.ec.europa.eu/document/download/efcd200c-b9ae-4a9c-98ab-73b2fd281fcc_en?filename=C_2024_5041_1_EN_ACT_part1_v10.pdf (Accessed on 19 march, 2025).
- https://energy-industry-geolab.jrc.ec.europa.eu/.
- https://www.copernicus.eu/es.
- Ferres González, M.J. Elaboración del mapa de hibridación de energía eólica y solar en España. MsC, Universidad Complutense de Madrid, Madrid, 2021. https://hdl.handle.net/20.500.14352/5158 (Accessed on 19 march, 2025).
- Borsato, M. Assessment of Utility-scale Hybrid Systems, based on Wind and PV plants, and mapping of potential installation sites in Spain. MsC, Unuversita’ Degli Studi di Padova, 2024. https://hdl.handle.net/20.500.12608/66029. (Accessed on 19 march, 2025).
- Centro de Investigaciones Científicas y Medioambientales (CIEMAT). ADRASE. Acceso a datos de radiación solar de España. 2012.
- https://www.idee.es/csw-inspire-idee/srv/spa/catalog.search?#/metadata/spaignMDT200-2.
- https://www.ign.es/web/resources/docs/IGNCnig/actividades/OBS/Programa_Marco_Copernicus_User_Uptake/9_Corine_Land_Cover.pdf.
- https://www.ign.es/resources/docs/IGNCnig/BTN/ESPBTN.pdf.
- Oskar Lindberg, Johan Arnqvist, Joakim Munkhammar, and David Lingfors. Review on power-production modeling of hybrid wind and PV power parks. J. Renewable Sustainable Energy 13, 042702 (2021); https:/doi.org/10.1063/5.0056201.
- Das, K., Hansen, A.D., Leon, J.P.M., Zhu, R., Gupta, M., Pérez-Rúa, J.-A., Long, Q., Pombo, D.V., Barlas, A., Gocmen, T., Sogachev, A., Koivisto, M., Cutululis, N.A. and Sørensen, P.E. (2025), Research Challenges and Opportunities of Utility-Scale Hybrid Power Plants. WIREs Energy Environ, 14: e70001. [CrossRef]
- https://www.fcirce.es/en/services/hybridisation-renewable-generation-and-storage (Accessed on 19 march, 2025).
- https://issuu.com/tekniker/docs/ficha_besssizingtool_en (Accessed on 19 march, 2025).
- https://www.gevernova.com/power-conversion/solar-storage/flexiq (Accessed on 19 march, 2025).
- IEA Task 18 Off-Grid and Edge-of-Grid Photovoltaic Systems. Evaluation of Software Tools for Standalone MicrogridDesign and Optimization. https://iea-pvps.org/wp-content/uploads/2024/03/IEA-PVPS-TASK-18-Report-Software-Tools-.pdf (Accessed on 19 march, 2025).
- https://www.ul.com/software/ultrus/homer-hybrid-energy-optimization (Accessed on 19 march, 2025).
- HOMER Front web Manual. https://homerenergy.com/products/front/docs/1.0/index.html (Accessed on 19 march, 2025).
- https://ihoga.unizar.es/en/ (Accessed on 19 march, 2025).
- https://ihoga.unizar.es/Desc/MHOGAbroch.pdf (Accessed on 19 march, 2025).
- https://help.emd.dk/knowledgebase/content/windPRO3.6/c15-UK_WindPRO3.6-HYBRID.pdf (Accessed on 19 march, 2025).
- Available: https://sam.nrel.gov/.
- Blair, Nate, Nicholas DiOrio, Janine Freeman, Paul Gilman, Steven Janzou, Ty Neises, and Michael Wagner. 2018. System Advisor Model (SAM) General Description (Version 2017.9.5). Golden, CO: National Renewable Energy Laboratory. NREL/ TP-6A20-70414. https://www.nrel.gov/docs/fy18osti/70414.pdf.Blair(Accessed on 19 march, 2025).
- https://sam.nrel.gov/software-development-kit-sdk/pysam.html (Accessed on 19 march, 2025).
- https://samrepo.nrelcloud.org/help/hybrid_systems.html (Accessed on 19 march, 2025).
- Tripp, C., Guittet, D., King, J., and Barker, A.: A simplified, efficient approach to hybrid wind and solar plant site optimization, Wind Energ. Sci., 7, 697–713, 2022. [CrossRef]
- Tripp, Charles E., Guittet, Darice, Barker, Aaron, King, Jennifer, and Hamilton, Bill. Hybrid Optimization and Performance Platform (HOPP). Computer Software. https://github.com/NREL/HOPP. USDOE Office of Energy Efficiency and Renewable Energy (EERE), Renewable Power Office. Wind Energy Technologies Office. 14 Nov. 2019. Web. [CrossRef]
- Kotarbinski, Matthew, Brinn McDowell, Jonty Katz, Genevieve Starke, Nicholas Riccobono. 2024. A 2023 Perspective: What Is the Value of Hybridization? Golden, CO: National Renewable Energy Laboratory. NREL/TP-5000-87824. https://www.nrel.gov/docs/fy24osti/87824.pdf (Accessed on 19 march, 2025).
- https://topfarm.pages.windenergy.dtu.dk/hydesign/ (Accessed on 19 march, 2025).
- Habbou, H., Leon, J. P. M., & Das, K. (2023). Profitability of hybrid power plants in European markets. In A. R. Nejad (Ed.), WindEurope Annual Event 2023 (Vol. 2507). Article 012009 IOP Publishing. [CrossRef]
- Aghaloo, K.; Ali, T.; Chiu, Y.R.; Sharifi, A. Optimal site selection for the solar-wind hybrid renewable energy systems in Bangladesh using an integrated GIS-based BWM-fuzzy logic method. Energy Conv. Manag. 2023, 283, 116899. [CrossRef]
- Sekeroglu, A.; Erol, D. Site selection modeling of hybrid renewable energy facilities using suitability index in spatial planning. Renewable Energy 2023, 219, 119458. [CrossRef]
- Tarife, R.; Nakanishi, Y.; Zhou, Y.; Estoperez, N.; Tahud, A. Integrated GIS and Fuzzy-AHP Framework for Suitability Analysis of Hybrid Renewable Energy Systems: A Case in Southern Philippines. Sustainability 2023, 15. [CrossRef]
- M. Khalid, “Performance ratio – Crucial parameter for grid connected PV plants,” Renewable and Sustainable Energy Reviews, 2016. [CrossRef]
- García-Bustamante, E., González-Rouco, J.F., Jiménez, P.A., Navarro, J. and Montávez, J.P. (2009), A comparison of methodologies for monthly wind energy estimation. Wind Energ., 12: 640-659. [CrossRef]
- Vestas Wind Systems, EnVentus platform brochure, Vestas, 2025. https://www.vestas.com/content/dam/vestas-com/global/en/brochures/onshore/EnVentus_Platform_Brochure.pdf.coredownload.inline.pdf (Accessed on 19 march, 2025).
- P. Enevoldsen and M. Jacobson, “Data investigation of installed and output power densities of onshore and offshore wind turbines worldwide,” Energy for Sustainable Development, no. 60, pp. 40-51, 2021. [CrossRef]
- International Renewable Energy Agency (IRENA), “Renewable Technology Innovation Indicators: Mapping progress in costs, patents and standards,” Abu Dhabi, United Arab Emirates, 2022. https://www.irena.org/-/media/Files/IRENA/Agency/Publication/2022/Mar/IRENA_Tech_Innovation_Indicators_2022_.pdf (Accessed on 19 march, 2025).
- Pexapark European PPA market outlook 2024. https://pexapark.com/european-ppa-market/ (Accessed on 19 march, 2025).
- Internation Energy Agency (IEA), “Electricity Market Report 2023,” Paris, France, 2023. https://iea.blob.core.windows.net/assets/255e9cba-da84-4681-8c1f-458ca1a3d9ca/ElectricityMarketReport2023.pdf (Accessed on 19 march, 2025).
- National Renewable Energy Laboratory, “2021 Cost of Wind Energy Review,” NREL, 2022. https://www.nrel.gov/docs/fy23osti/84774.pdf (Accessed on 19 march, 2025).
- National Renewable Energy Laboratory, “U.S. Solar Photovoltaic System and Energy Storage Cost Benchmarks, With Minimum Sustainable Price Analysis: Q1 2022,” NREL, 2022. https://www.nrel.gov/docs/fy23osti/87303.pdf (Accessed on 19 march, 2025).
Figure 1.
Nodal distribution of new wind (18,000 MW) and solar PV (19,000 MW) generation in the REE study scenario [46].
Figure 1.
Nodal distribution of new wind (18,000 MW) and solar PV (19,000 MW) generation in the REE study scenario [46].
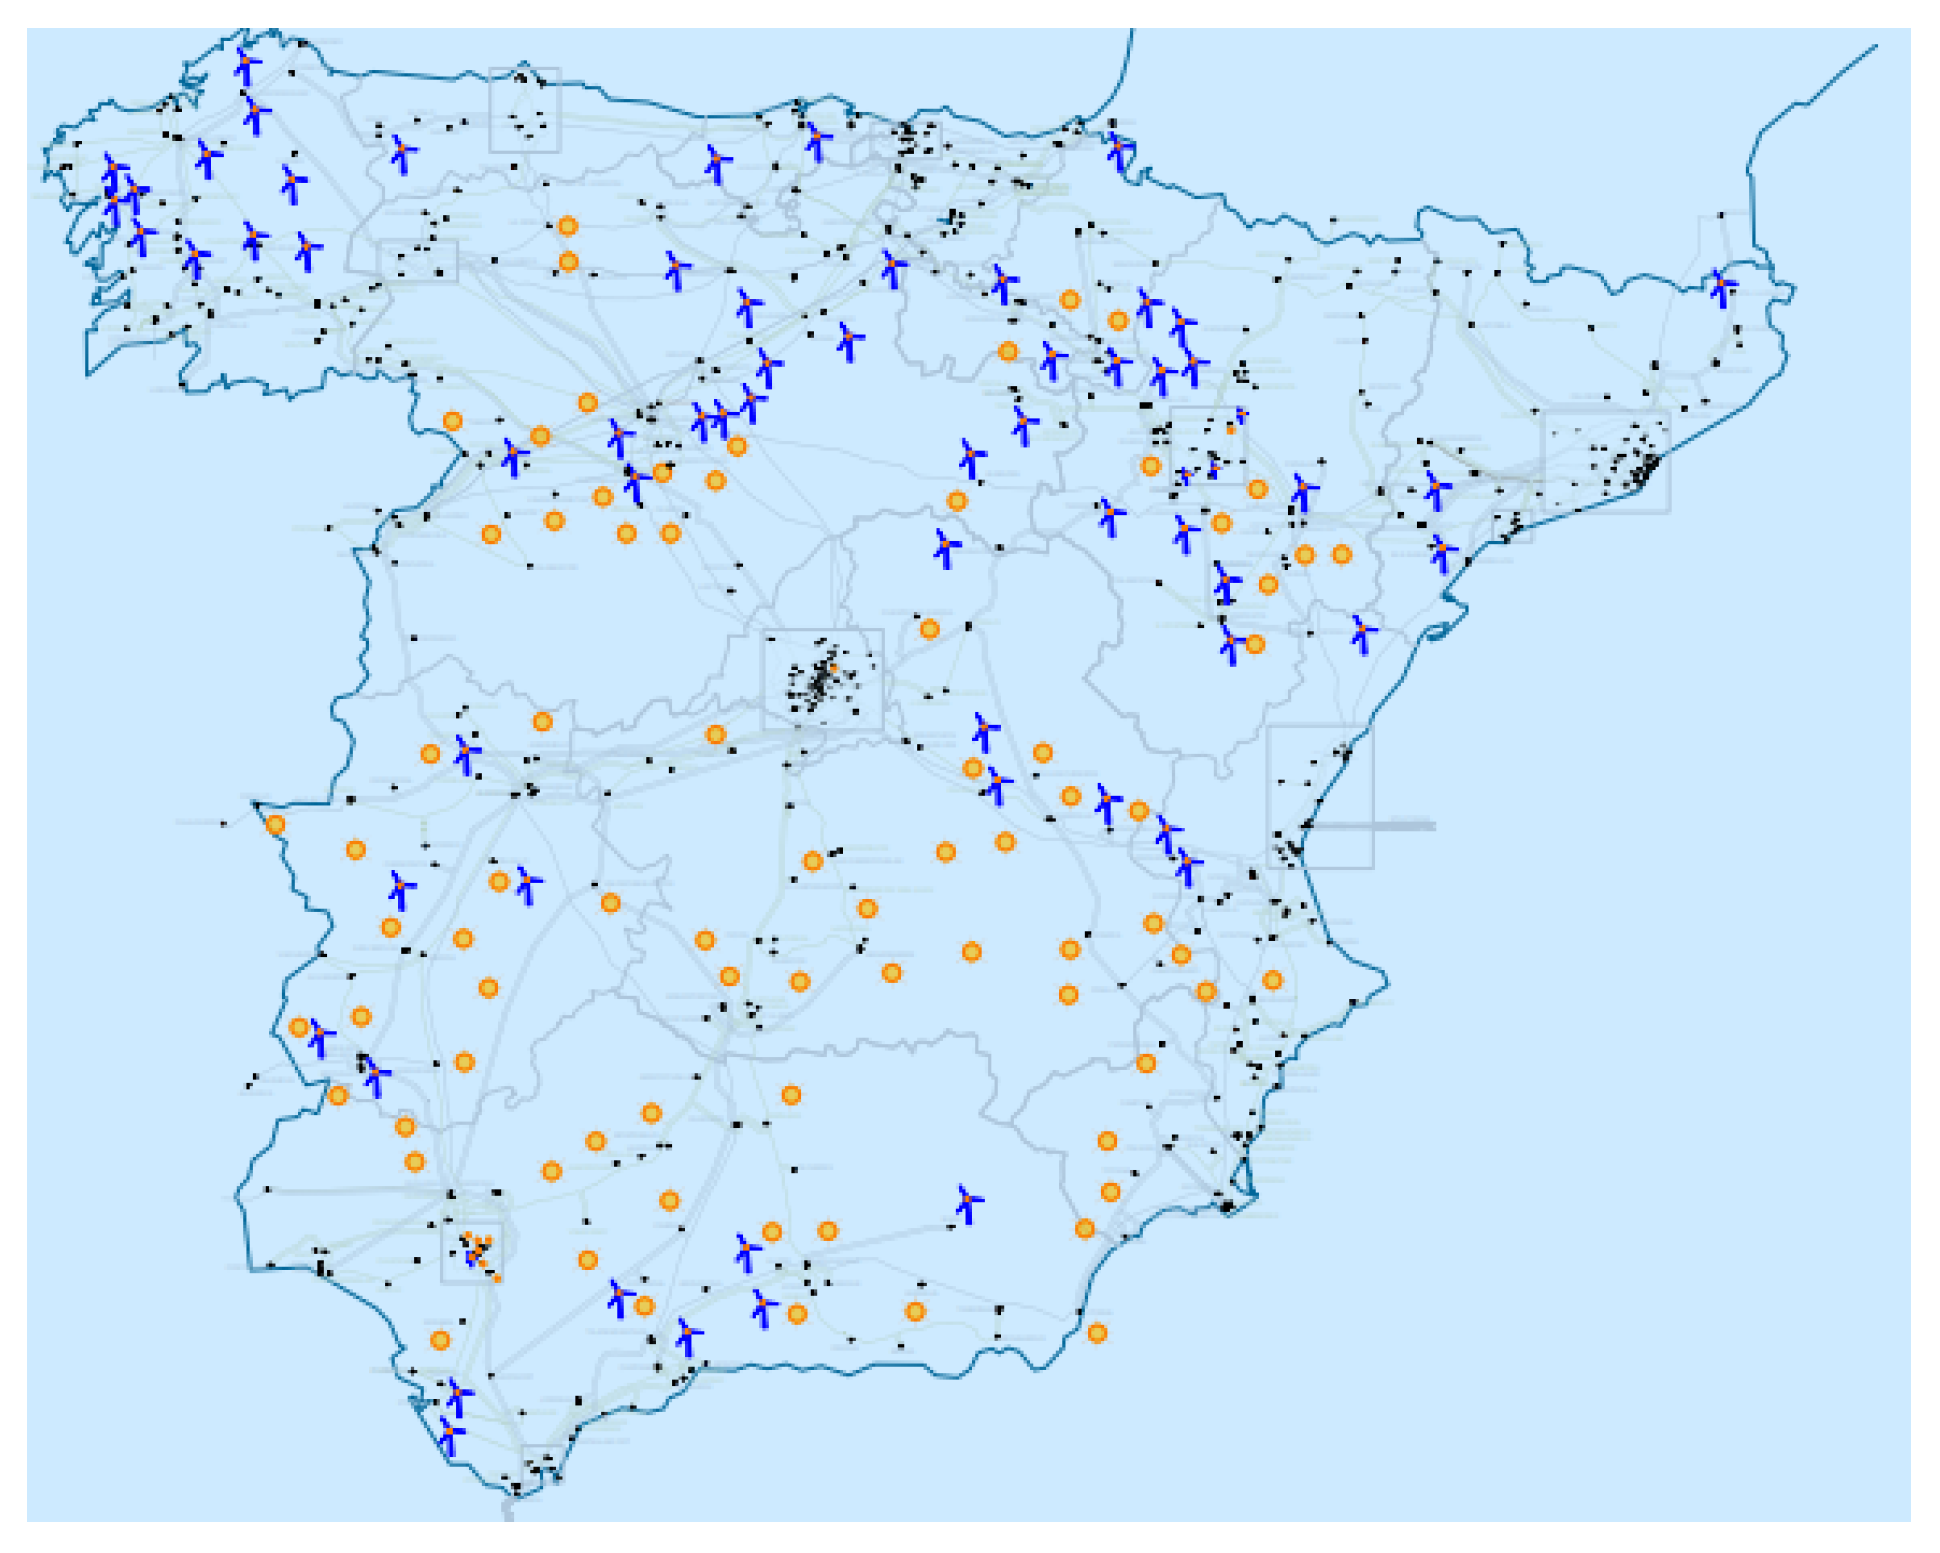
Figure 3.
General scheme of the methodology used for the simplified example [84].
Figure 3.
General scheme of the methodology used for the simplified example [84].
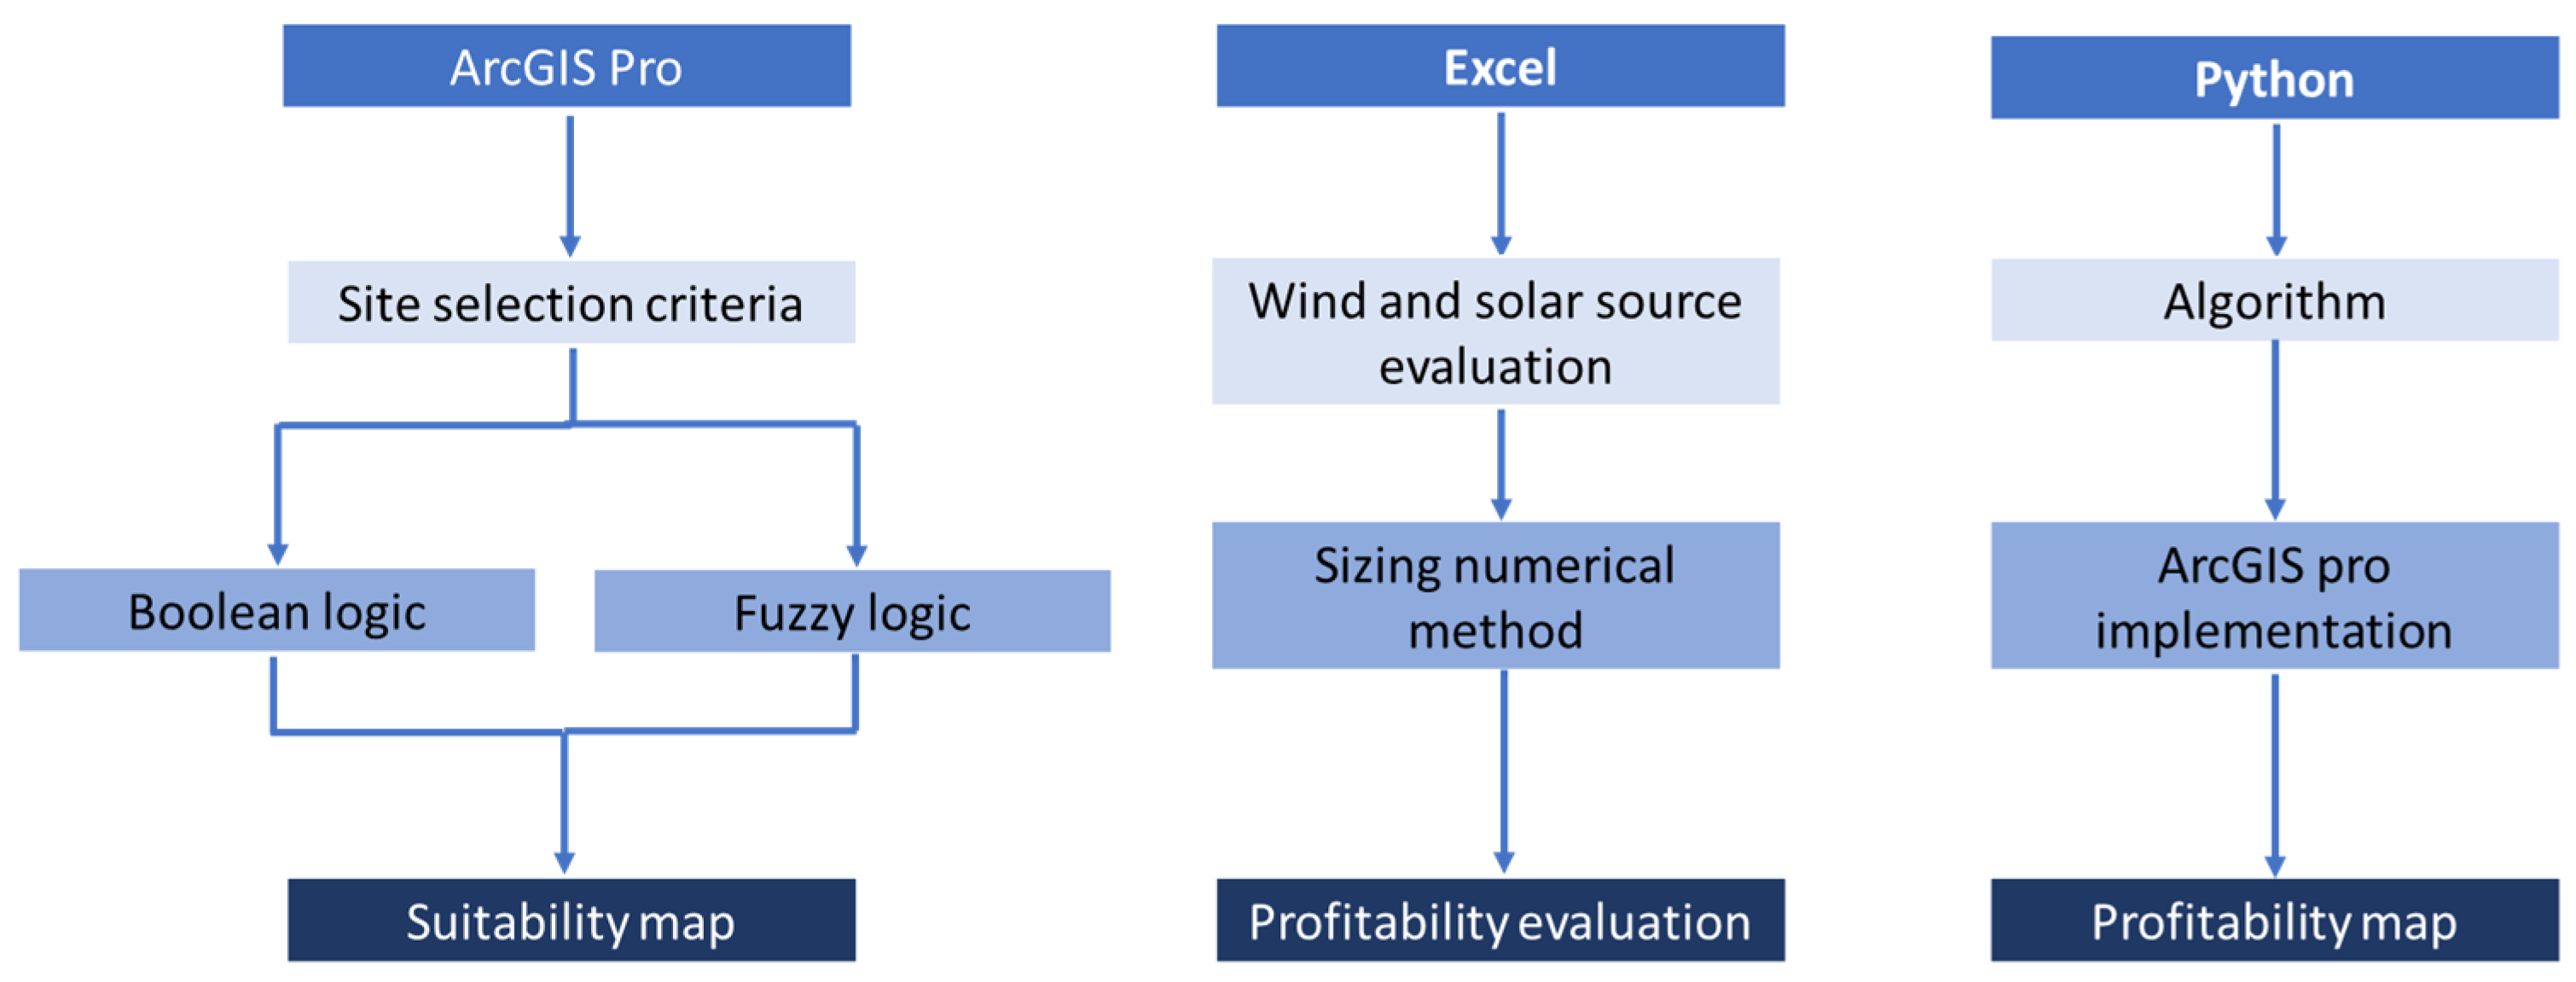
Figure 4.
Hybrid Suitability Index (elaboration from [84]).
Figure 4.
Hybrid Suitability Index (elaboration from [84]).
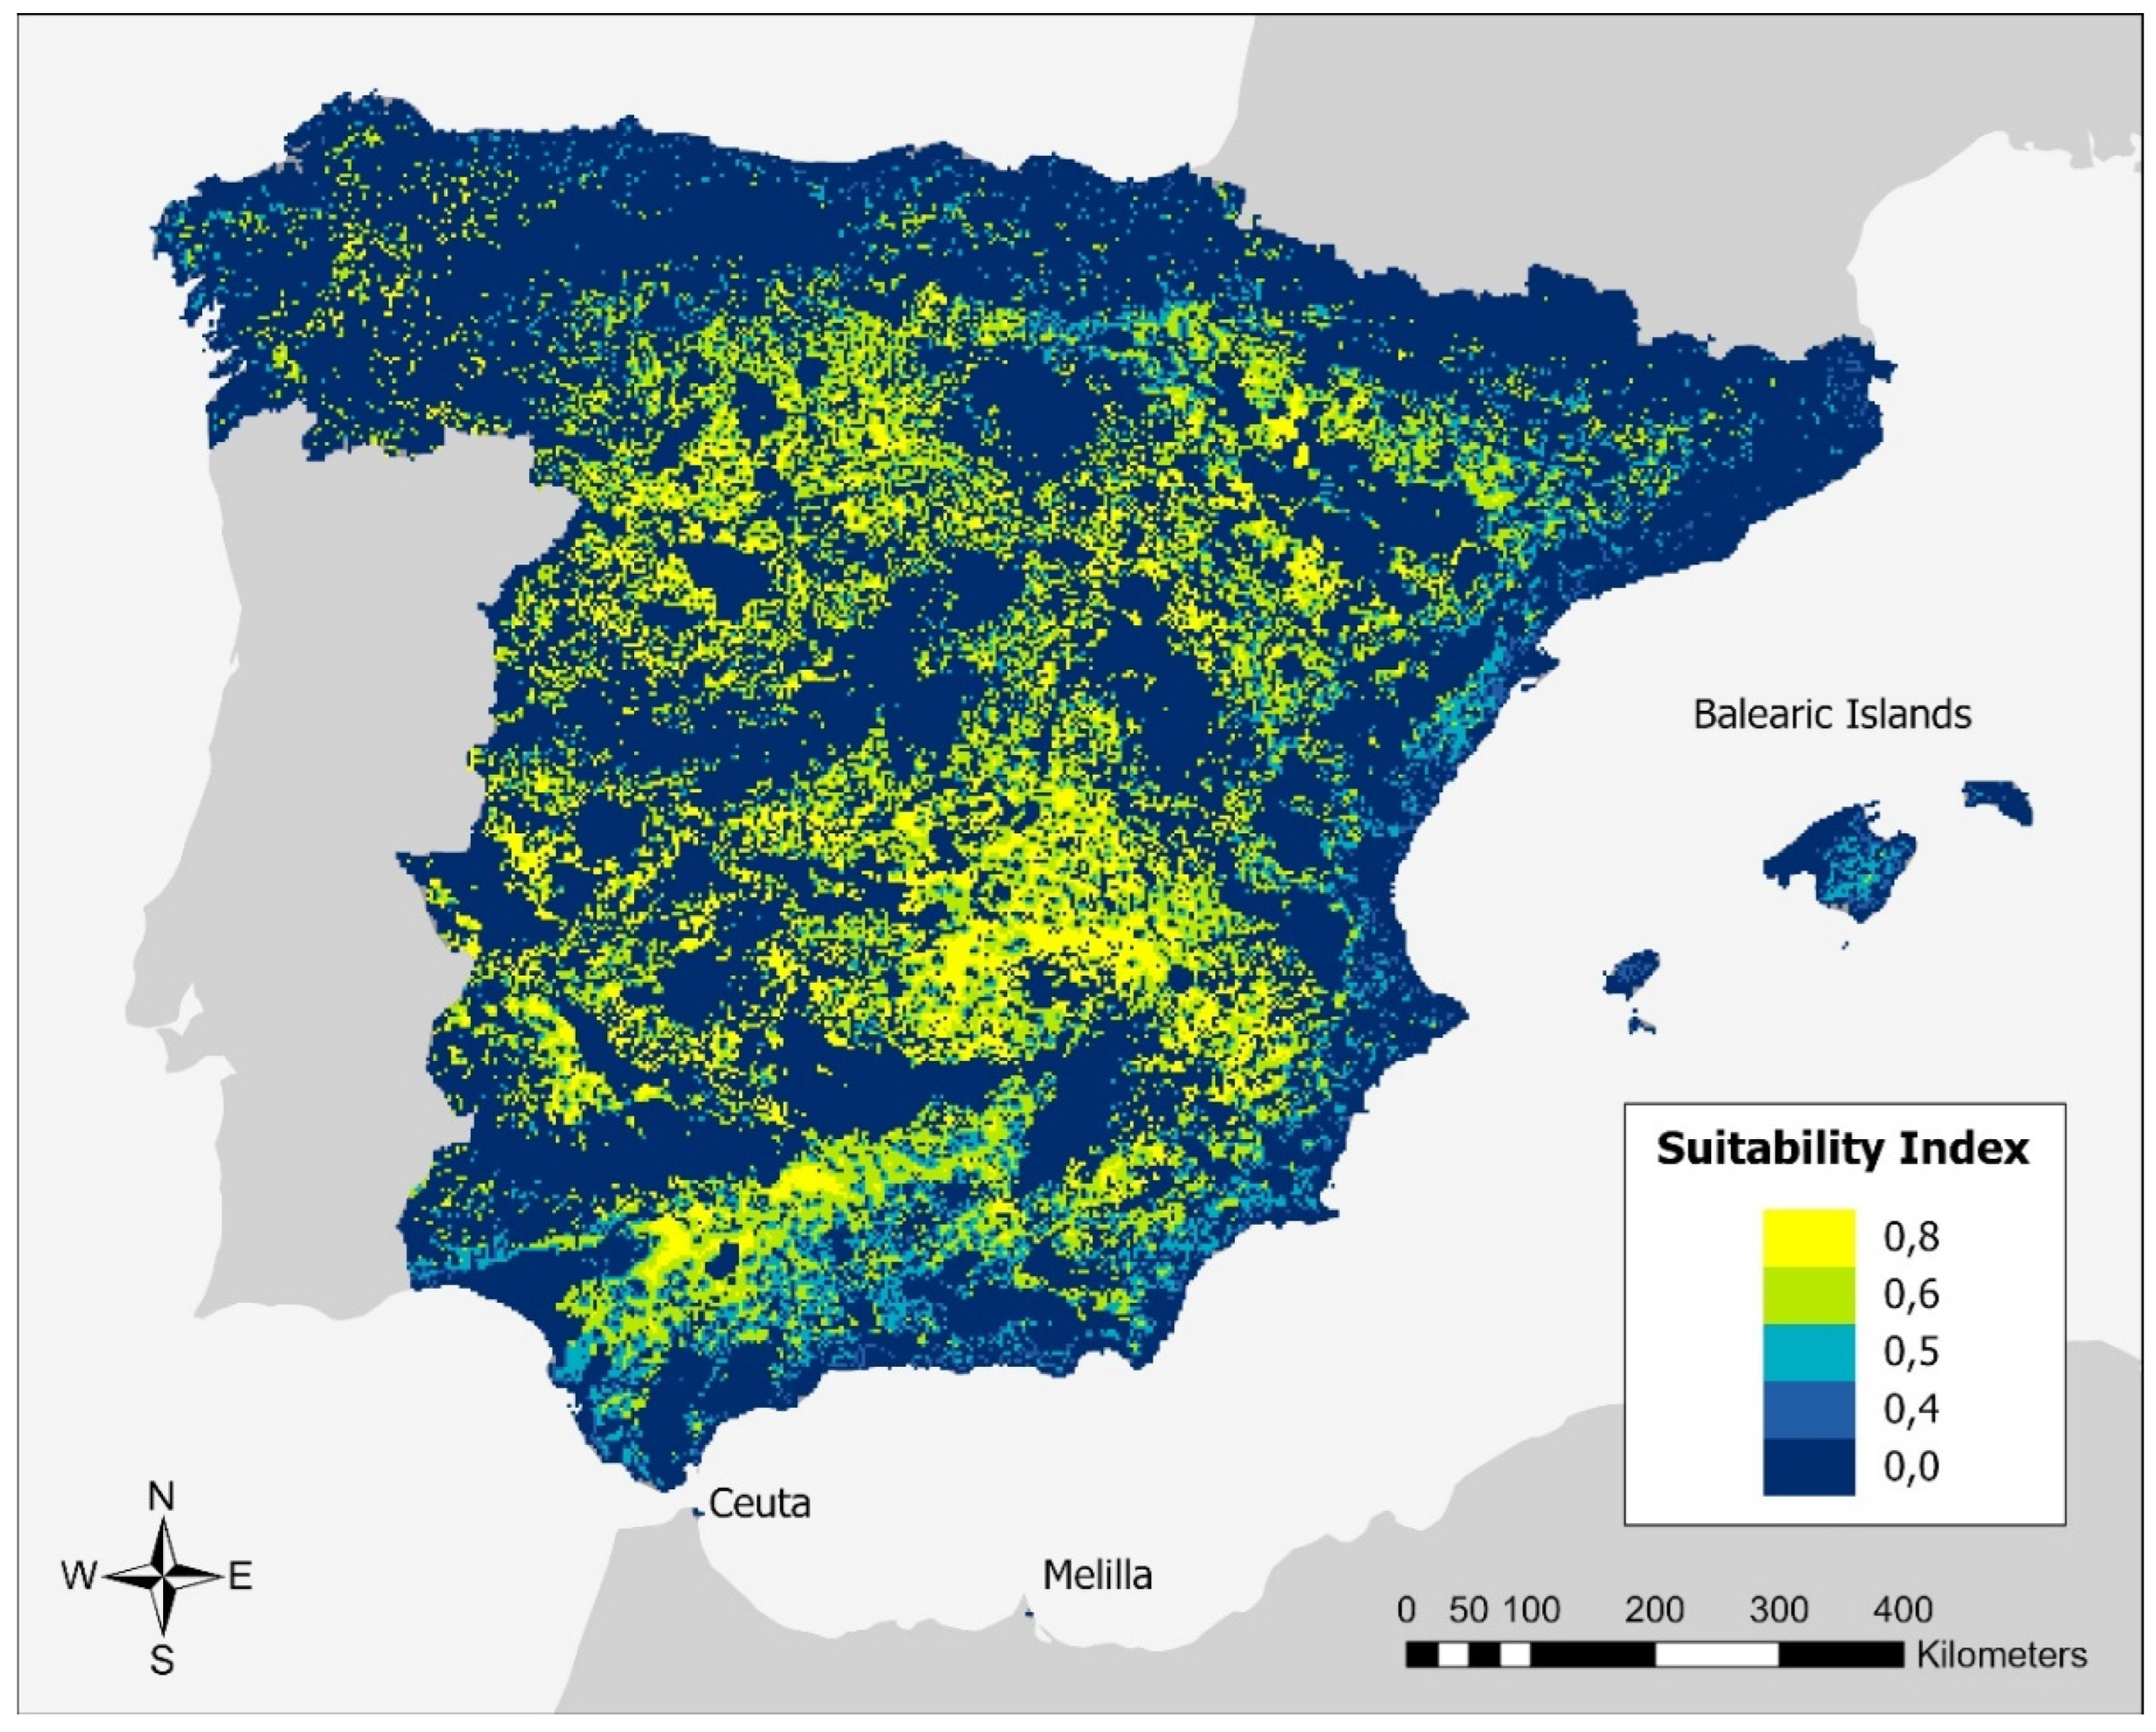
Figure 5.
IRR with evacuation capacity of 10 MW and PPA price of 75 €/MWh (elaboration from [84]).
Figure 5.
IRR with evacuation capacity of 10 MW and PPA price of 75 €/MWh (elaboration from [84]).
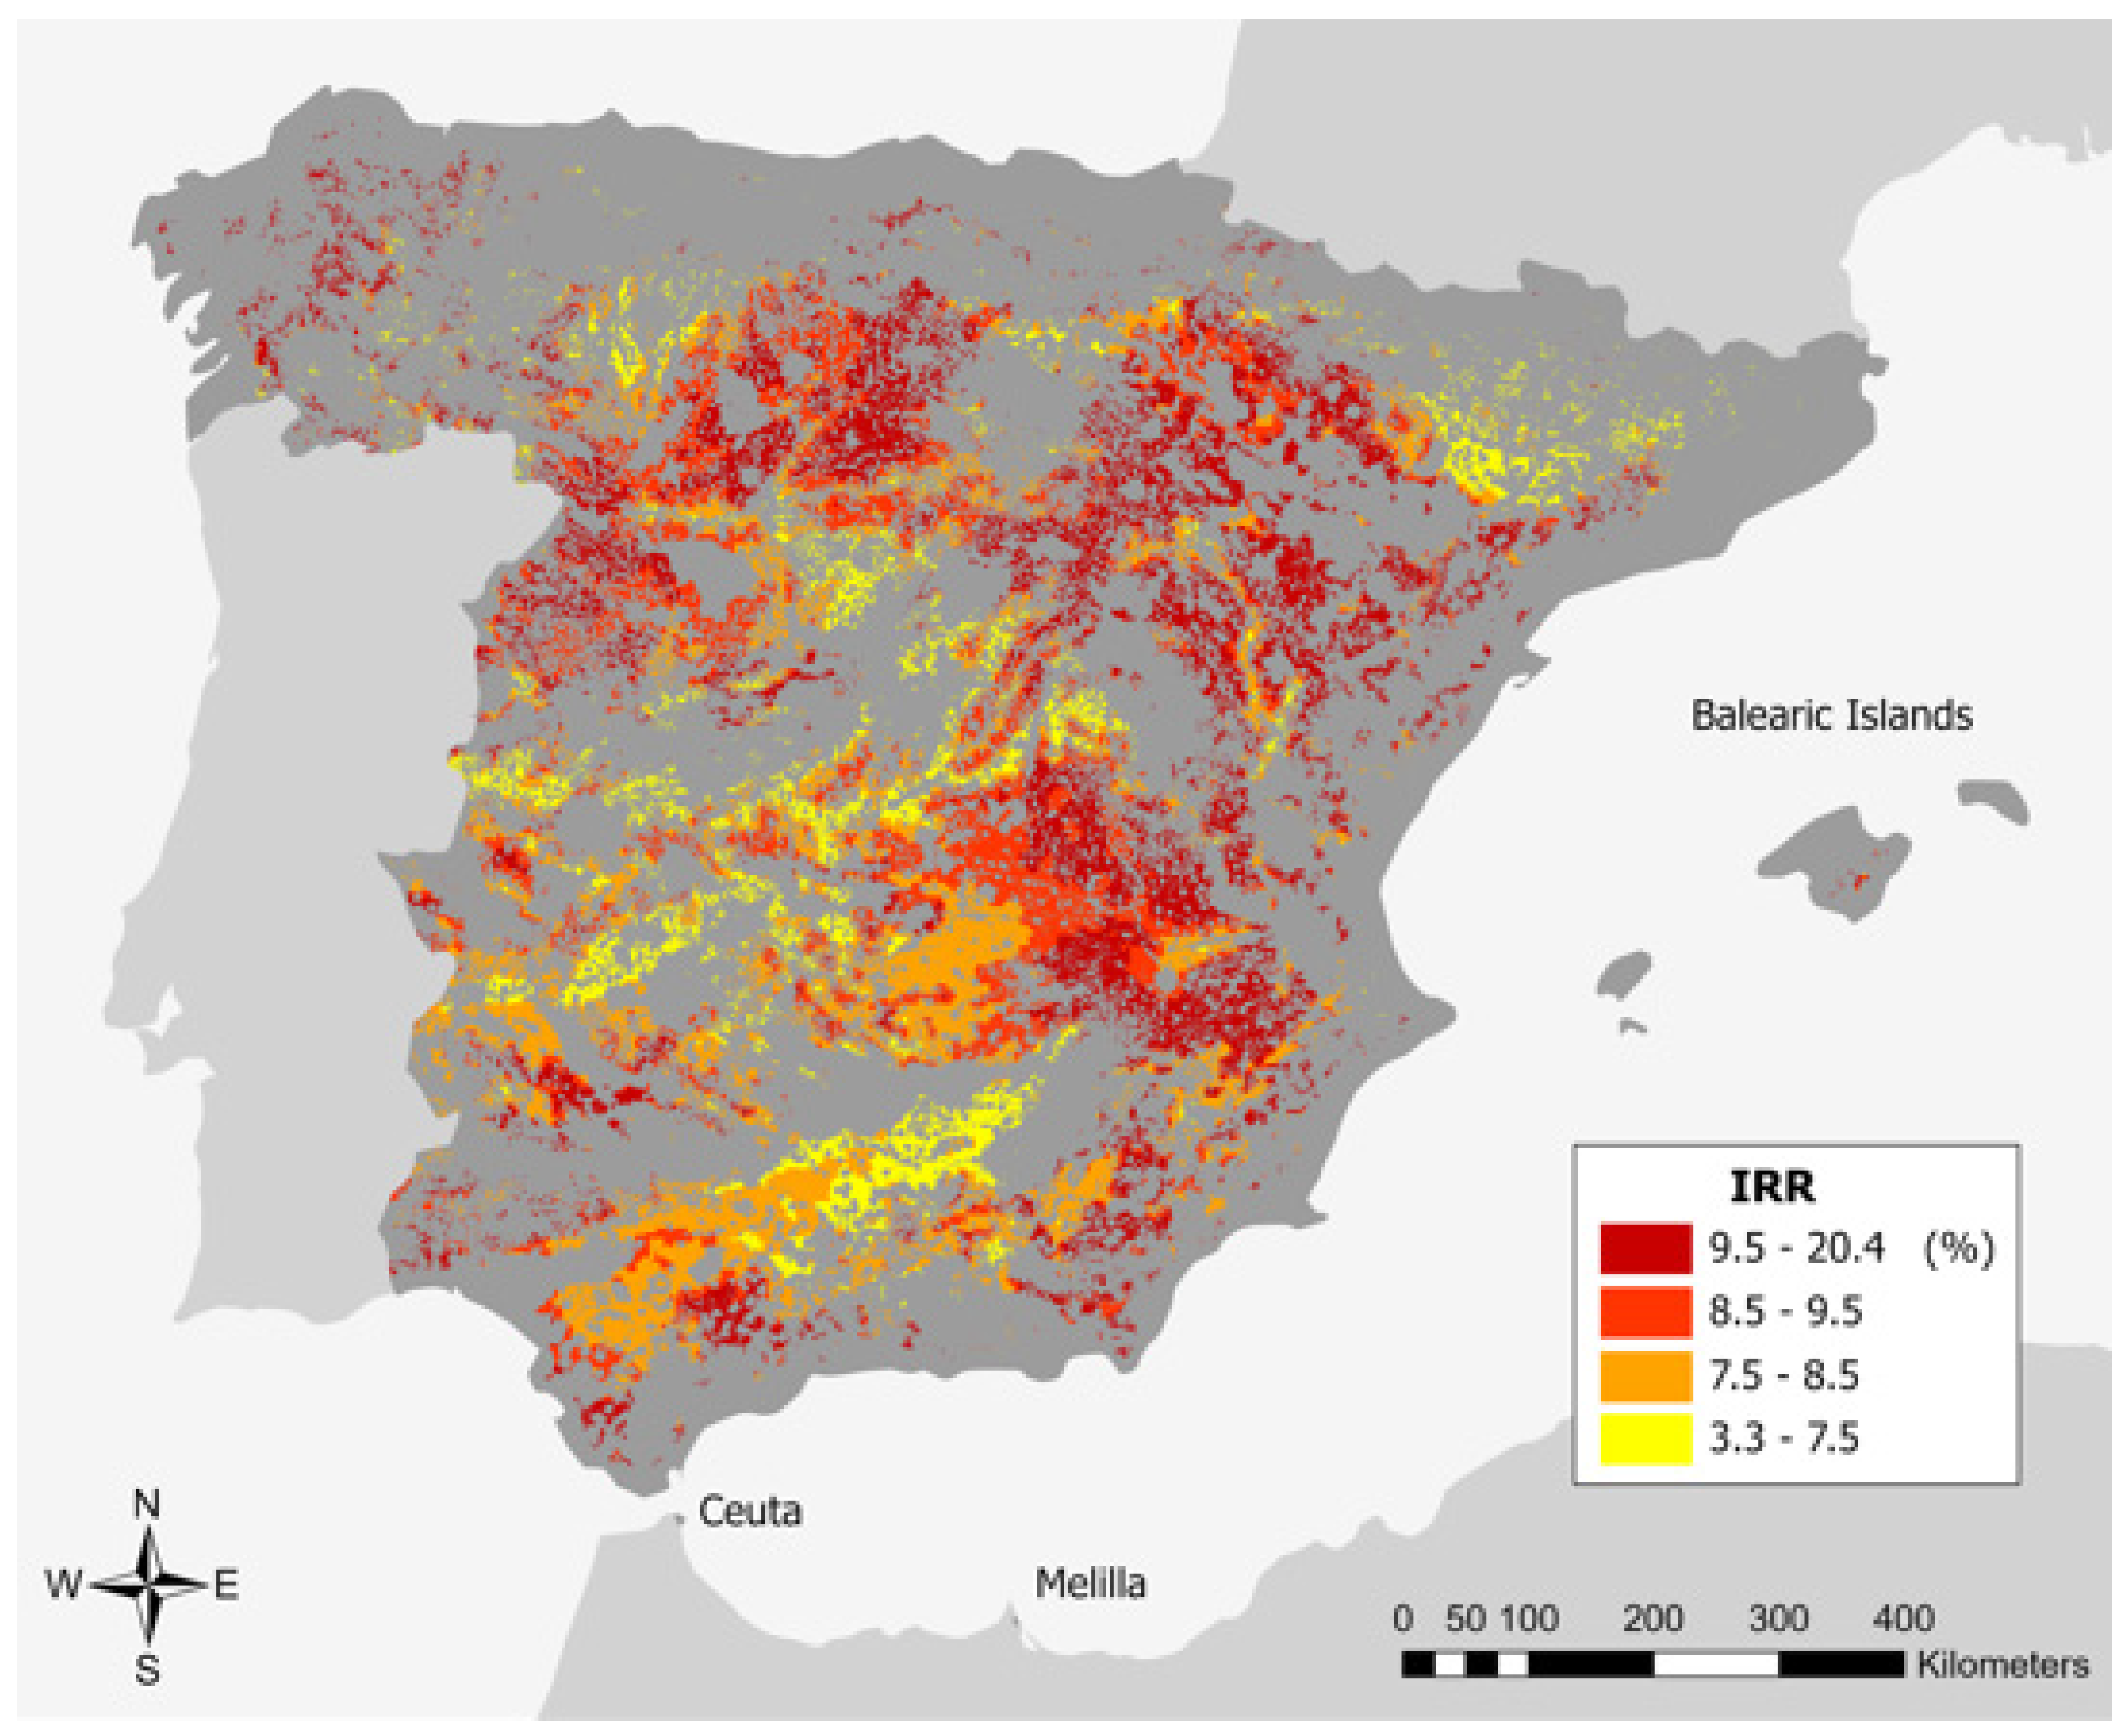

Table 1.
Summary of some LTES analyses in Spain.
| Characteristic \ Model | PRIMES | AEE | CEPSA | Greenpeace | ITT | Deloitte | Experts commission | NECP |
|---|---|---|---|---|---|---|---|---|
| Wind installed power in 2030 (GW) | 30 | 40 | 47 | 26.6 %1 | 34 | 842 | 31 | 62 |
| Solar PV installed power in 2030 (GW) | 25 | 25 | 29 | 12.35 %1 | 16 | 40 | 76 | |
| References | [13,14] | [14] | [15] | [16] | [17] | [18] | [19] | [20] |
PRIMES: Price-Induced Market Equilibrium System Model; AEE: Spanish Wind Association; ITT: Institute for Research in Technology (U.P. Comillas). 1 For the “low demand and medium renewable” scenario. It refers to the percentage of the total demanded energy generated with the technology. 2 For the “high electric efficiency” scenario. It includes hydraulic, wind, solar PV and solar thermal renewable generation.
Table 2.
Summary of CorRES tool main characteristics.
| Characteristic | Wind | Solar |
|---|---|---|
| Weather reanalysis data | ERA 5 | ERA 5 |
| Spatial resolution | 10x10km | 10x10km |
| For higher spatial resolution | Global Wind Atlas | ERA5-Land |
| Temporal resolution | Hourly | Hourly |
| For higher temporal resolution | Stochastic simulation | - |
| Conversion to power generation | Power curve + PyWake | PV-Lib |
| Forecast error | Flexible forecast horizons | Beta version |
Table 3.
Geographic and thematic layers used for the suitability map presented in Section 5.
Table 3.
Geographic and thematic layers used for the suitability map presented in Section 5.
| Data layers | Type of file | Source | Resolution or scale |
|---|---|---|---|
| Monthly average daily solar irradiation (kWh/m²) | Raster | Solar Radiation Data from Spain - ADRASE (CIEMAT) [85] | 5,000 m x 5,000 m |
| Monthly average wind speed (m/s) | Raster | Simulation with Weather Research and Forecasting Model (CIEMAT) | 1,000 m x 1,000 m |
| Digital Terrain Model (DTM) | Raster | Digital Terrain Model - MDT200 2nd coverage (IGN) [86] | 200 m x 200 m |
| Land Cover | Vector (polygons) | CORINE Land Cover 2018 (IGN) [87] | 1:100,000 |
| Urban and rural residential areas | Vector (polygons) | Settlement and construction data of National Topographic Base BTN100 (IGN) ([88]) | 1:100,000 |
| Airports | Vector (polygons) | Data provided by AENA (Aeropuertos Españoles y Navegación Aérea) | - |
| Roads transport network | Vector (lines) | Transport data of National Topographic Base BTN100 (IGN) | 1:100,000 |
| Coast line | Vector (lines) | Geographic reference information - Coast line (IGN) | 1:100,000 |
| Electrical grid | Vector (lines) | Energy and conductions data of National Topographic Base BTN100 (IGN) | 1:100,000 |
| Electric power plant | Vector (polygons) | Energy and conductions data of National Topographic Base BTN100 (IGN) | 1:100,000 |
| Electrical substation | Vector (Points) | Energy and conductions data of National Topographic Base BTN100 (IGN) | 1:100,000 |
| Environmental sensibility for PV and wind | Raster | Environmental zoning for renewable energies: Wind and photovoltaic (MITECO) [43] | 25 m x 25 m |
Table 4.
Comparison of commercial tools.
| Tool | Feasibility Study | Physical layout | Optimization |
|---|---|---|---|
| HOMER® Front | ✓ | ✗ | ✓ |
| MHOGA | ✓ | ✗ | ✓ |
| windPRO | ✓ | ✓(wind) | ✗ |
Table 5.
Comparison of open-source tools.
| Model\Tool | SAM / PySAM | HOPP | HyDesign |
|---|---|---|---|
| Developer | NREL | NREL | DTU |
| Weather | Solar: NSRDB Wind: Wind toolkit |
SAM | ERA5, GWA |
| Wind Power Plant | SAM's Wind Power model (includes wake) | FLORIS | Surrogate model (includes wake) |
| PV Power Plant | PVWATTS | PVWATTS | Generic 1MW plant |
| EMS | ✗ | ✗ | ✓ (battery) |
| Financial | PPA, Single owner, Merchant | SAM | PV: Simple model Wind: WISDEM Battery: Simple model Grid, BOS, land |
| Optimization | ✗ | ✓ | ✓ |
| Programming framework | SSC / Python | Python | Python - OpenMDAO |
| Reference | [104] / [102] | [106] | [108] |
Table 6.
Analyzed criteria for the PV-Wind hybrid suitability map.
| Parameters |
GIS processing (ED = Euclidean distance) |
Boolean | Fuzzy membership function |
| Annual average daily solar irradiation (kWh/m²) | Calculated by Map Algebra an average from monthly global daily irradiation data | - | Linear increasing |
| Annual average wind speed (m/s) | Calculated by Map Algebra an average from monthly wind speed data | - | Linear increasing |
| Ground elevation (m) | Reclassified elevation data from MDT200 | Exclusion > 1,500 m | - |
| Ground inclination (degree) | Generated Slope from MDT200 | Exclusion > 15° | Linear decreasing (Inclination ≤ 15°) |
| Land Cover | Reclassified CORINE Land Cover classes [83,84] | - | - |
| Distance from urban and rural residential areas (m) | ED from the residential areas polygons | - | Linear increasing |
| Distance from rivers and surface water (m) | - | Exclusion result of MITECO |
- |
| Distance from airports (m) | ED from airports polygons | Exclusion > 7,000 m | - |
| Distance from roads network (m) | ED from roads lines | - | Linear decreasing |
| Distance from coast line (m) | ED from coast line | - | Linear increasing |
| Distance from electrical grid (m) | ED from electrical grid lines | - | Linear decreasing |
| Distance from electric power plants (m) | ED from power plants polygons | - | Linear decreasing |
| Distance from electrical substations (m) | ED from electrical substations points | - | Linear decreasing |
| Environmental sensibility for PV and wind | - | Exclusion result of MITECO analyst | Weighted result of MITECO analyst |
Disclaimer/Publisher’s Note: The statements, opinions and data contained in all publications are solely those of the individual author(s) and contributor(s) and not of MDPI and/or the editor(s). MDPI and/or the editor(s) disclaim responsibility for any injury to people or property resulting from any ideas, methods, instructions or products referred to in the content. |
© 2025 by the authors. Licensee MDPI, Basel, Switzerland. This article is an open access article distributed under the terms and conditions of the Creative Commons Attribution (CC BY) license (http://creativecommons.org/licenses/by/4.0/).
Copyright: This open access article is published under a Creative Commons CC BY 4.0 license, which permit the free download, distribution, and reuse, provided that the author and preprint are cited in any reuse.


