
Submitted:
10 March 2025
Posted:
10 March 2025
You are already at the latest version
Abstract
This research evaluates how wind and solar PV balance together. Increasing the share of sto-chastic renewable energy production in electricity and hot turning reserve deficit are welcome compensation issues. This research used weather station data from an open seashore for the last 10 years, 2014-2023, on the Estonian island Saaremaa's west coast to evaluate yearly fluctuations. We use the indicator demand cover factor to estimate the coincidence of wind generation and PV solar electricity. For clarity, the initial data was prepared by assuming equality of production and consumption annual data by scaling the obtained data. The study demonstrates that the best compensating possibilities are the share of wind generation and solar PV electricity mix, respec-tively, equal to 0.7/ 0,3 and 0.8/0.2, reaching the demand cover factor of 0.62. The article evaluates the demand cover factor's dependence on increased production compared to consumption. The article uses different batteries to research the influence of these demand cover factors. Further-more, this research makes a significant contribution by showcasing - how to turn weather station data into real wind generator and PV panel production data.
Keywords:
solar PV
; self-consumption
; battery
; energy storage
; weather data
; wind speed
; solar total irra-diation
; data scaling
; simulation of microgrids
; demand cover factor
1. Introduction
The increasing share of renewable energy sources in electricity generation is essential for achieving a sustainable and low-carbon energy system [1]. Among the most widely used renewable energy technologies, wind power (wind) and solar photovoltaic (solar PV) systems stand out due to their availability, scalability, and decreasing costs. However, both sources exhibit stochastic production patterns, leading to challenges in balancing supply and demand within the power grid. Understanding the relationship between these two sources is essential for optimizing energy generation, minimizing curtailment, and ensuring a stable electricity supply [2,3] .
The balance between wind and solar PV production has become a key concern in energy system planning, particularly in regions with high penetration of variable renewable energy. While wind and solar PV are complementary to some extent, their combined production characteristics must be thoroughly analyzed to determine the optimal mix that maximizes electricity generation while minimizing reserve deficits. The main challenge arises from the intermittent nature of these energy sources, requiring effective strategies to enhance grid stability and self-sufficiency [4].
There has been a slight setback in the development of green technologies recently. For example, the USA plans to withdraw from green agreements. Europe has begun to realize the negative economic impact of overly rapid clean energy development plans. Despite everything, the development of renewable energy—specifically wind and solar—continues regardless of the wishes of top executives. The driving force behind this is humanity's pursuit of a cleaner environment for future generations. There have not been many studies in recent years specifically on the compensatory properties between wind and solar PV generation equipment and their practical applicability.
Wind and solar PV are combined, with biomass also included, proposed in [5]. However, it does not analyze the interaction between wind and solar PV. Moreover, batteries are listed alongside energy sources such as wind and solar PV, which is incorrect. The seasonal variations of solar and wind energy are analysed in the Commonwealth of Kentucky, USA. When considering daily patterns, the wind was found to follow solar generation with an offset [6]. The results indicate the potential of solar and wind energy across most African regions and emphasize the importance of considering solar, wind, or their combined energy mix for local energy planning and storage solutions [7]. The use of flexible solar and wind fleets as a secondary reserve, combined with an implicit storage technique, has been proposed [8]. Integrating multiple energy sources into a single hybrid renewable energy system effectively addresses challenges like intermittency and geographical limitations associated with individual renewable systems. Therefore, the continuous development and implementation of an energy management system are crucial for achieving key objectives such as energy efficiency, resilience, stability, and sustainability [9]. Several studies related to this field have been reviewed and are summarized as follows:
Benato et al. [10] examined the integration of energy storage systems with photovoltaic power plants, showing that the Virtual Power Plant (VPP) model effectively smooths PV power peaks and enhances supply stability. Niu and Luo [11] explored economic efficiencies of distributed PV systems and storage solutions, revealing that optimized storage frameworks enhance grid adaptability and stability. Ho-Tran and Fiedler [12] studied seasonal extreme events in Germany’s renewable production, highlighting increased risk of low power production in summer due to stationary cyclonic weather patterns. Fasihi et al. [13] investigated the potential of green ammonia production using hybrid PV-wind plants, identifying cost-competitive scenarios by 2040. Dietrich [14] analysed zero-energy buildings in different climates, emphasizing land-use trade-offs and optimized renewable integration strategies. Salkuti [15] proposed optimal railway electrification using renewable sources, demonstrating cost benefits and enhanced grid integration.
Chen et al. [16] examined land-use conflicts in renewable energy deployment in Northern Europe, concluding that offshore wind expansion could reduce land demands. Silva et al. [17] proposed a stochastic approach for optimizing renewable energy market participation, showing significant profit gains and imbalance reductions. Nnodim et al. [18] analyzed wind and solar integration into electricity grids, recommending curtailment and storage for effective intermittency management. Al-Dahidi et al. [19] developed machine learning models for PV power predictions, improving forecasting accuracy for better grid management. Santos-Alamillos et al. [20] studied wind-solar spatiotemporal balancing in the Iberian Peninsula, concluding that co-location reduces generation variability. Veluchamy [21] introduced an optimization algorithm for microgrid energy management, achieving cost reductions in distributed networks. Velosa et al. [22] developed an open-source simulator for energy community power demand and generation scenarios, facilitating testing of optimization strategies. Lippert [23] discussed lithium-ion energy storage in wind farms, demonstrating effective output control and ancillary service provision. Tafarte et al. [24] investigated bioenergy’s role in mitigating fluctuations from wind and solarPV, concluding that flexible bioenergy operation enhances grid stability. Schmidt et al. [25] analyzed Brazil’s hydro-thermal system, highlighting the benefits of wind-PV expansion in reducing thermal backup needs. Carbajales-Dale et al. [26] assessed storage energy costs for wind and solar PV, revealing that wind energy can support large-scale storage while PV is limited in storage affordability. Haegel and Kurtz [27] tracked global PV adoption trends, showing rapid expansion and increasing storage integration.
Hadi et al. [28] proposed a demand response algorithm to optimize renewable penetration in microgrids, reducing peak demand and enhancing system balance. Stamatakis et al. [29] examined energy management in super-tankers, demonstrating CO2 reductions through PV-wind-hydrogen integration. Shepherd et al. [30] developed feasibility tools for green ammonia production, assessing storage needs and balancing strategies. Hou et al. [31] analyzed climate change impacts on solar power generation, identifying changes in seasonal production variability. Madiba et al. [32] optimized under-frequency load shedding in microgrids, improving reliability through renewable integration. Coles et al. [33] studied tidal stream power’s impact on energy system security, demonstrating its role in supply-demand balancing. Jiang et al. [34] applied machine learning for energy management in grid-connected microgrids, achieving cost reductions and efficiency improvements. Following Table 1. summarizes methodologies, objectives, and results from relevant studies.
Unlike previous studies that focus on large-scale datasets, our research provides a site-specific analysis by examining real-world data from Saaremaa, Estonia, offering localized insights into wind and PV integration. The use of a decade-long dataset (2014-2023) ensures robustness in assessing renewable energy balancing, making our findings more reliable. Furthermore, this study applies the demand cover factor indicator to quantitatively evaluate the effectiveness of wind-PV synergy in covering local electricity consumption, a methodology that is rarely explored in existing literature. While previous studies primarily analyze wind and PV separately, our research uniquely assesses the role of different battery storage solutions in influencing the demand cover factor. Additionally, our findings provide practical recommendations for policymakers and grid operators in Estonia and similar regions, contributing to renewable energy policy advancements.
The core objective of this research is to identify the most effective combination of wind and solar PV generation that enhances energy balance and minimizes reliance on external energy sources. The research presents a comprehensive analysis of the balancing issues between wind and solar PV production, emphasizing the significance of data-driven approaches in optimizing renewable energy generation. The study highlights the importance of selecting an appropriate energy mix, utilizing advanced forecasting techniques, and incorporating battery storage solutions to achieve a more reliable and sustainable energy supply. The insights derived from this research will be valuable for informing future renewable energy policies and strategies, particularly in regions with similar climatic and geographical conditions.
2. Data and Methods
In the article, the settlement of Roomaassaare on the west coast of Saaremaa was chosen as the location for the wind generator and PV panels described in the article. This choice was primarily due to good wind conditions and the simultaneous availability of PV and wind speed data at the measuring station. Another factor in favor of this choice was that the location is on an island and at the same time in a remote area with a foreseeable weak electricity grid. The article interpreted the wind and solar PV production data using hourly wind speed and total solar radiation data from the Roomassare weather station (N58°13´05“; E22°30`3“) [36]. The article uses 10 years of hourly data from 2014-2023. Wind speed data are measured at the weather station at a height of 10 m. Figure 1 shows that the wind generator and PV solar production data are sometimes summarized and sometimes exist alone. It is the best time in spring to follow the coincidence of wind and PV solar production data.
Scaling wind generator production and solar PV data means that the sums of both annual data sets equal the sum of yearly consumption.
Wind speed from a height of 10 m was extrapolated to 18 m as the initial data of wind generator TUGE 20 [37] using a logarithmic equation [38]:
where V2 – extrapolated wind speed at the height of 18 m, m/s;
V1 – measured wind speed at the height of 10 m, m/s;
h2 – wind generator hub height, 18 m;
h1 – the height of measured wind speed in the weather station, 10 m ;
z0 – roughness coefficient, for flat landscape, z0= 0.03.
TUGE 20 power curve data [37] turn to interpolation by the formula 2, R2 = 0,9994:
where P – wind generator output capacity, kW;
V0 – scaled wind speed at a height of 18 m;
The power curve described by Formula 2 is present in Figure 1.
Figure 2 shows that the sixth-order polynomial is described quite well for the power curve, R2 = 0.9994. As the cut in wind speed for TUGE 20 is 3.5 m/s, power values below 3.5 m/s were removed. It is a typical small wind generator power curve.
The approximation of the solar irradiation data from the weather station horizontal plane measurements for real PV panels output data (angle to the ground 35°, azimuth 180°, efficiency 0.213; panel size a´= 2297 x 1134 mm, quantity 10, Ja Solar JAM72S30 550W, monocrystal) starting from the angle of incidence calculations by Formula 3 [39]:
where Af – angle of incidence, °;
Ѳz – zenith angle, °;
ß – slope, the angle between the plane of the surface in question and horizontal, °;
ϒs – solar azimuth angle, °;
ϒ – surface azimuth angle, °.
GHI – total sun solar irradiation on a horizontal surface in Roomassaare weather station, W/m2;
G0 – solar constant, 1367 W/m2;
Zs – zenith angle, °.
Direct normal irradiance – DNI:
Direct solar irradiance – Gdir:
Solar diffused irradiation - Gdif:
Solar irradiation reflection Gref:
Total irradiation – Gtotal:
PV panel production – P:
where P – PV panel produced capacity, W;
S - total panel area, m2;
ⴄ - PV panel efficiency.
The modelled family size in a private house is two people and an area of 90 m2. The con-sumption schedule is measured in 2023. The yearly 2023 consumption is 3276 kWh. The household has wood log stoves, electrical floor heating in the WC, two refrigerators, and an electric stove. There are no heat pumps. The yearly consumption graph is supposed to be close for all years from 2014 to 2023. New devices were not obtained during these ten years in this private house.
Calculations in the article scaled the wind generator and PV panel's annual productions to equal the yearly consumption. PV panel production scaling by the consumption:
where scaled annual production graph equal to the sum of consumption, kWh;
PPVh – hourly production of PV panels, kW;
KVP – scaling coefficient for PV panels:
where Wcy – the yearly sum of consumption graph, kWh;
WPVy – the sum of yearly PV panel consumption, kWh.
Wind generator production by consumption:
where scaled wind generator annual production equal to the sum of consumption, kWh;
PWh – hourly production of wind generator, kW;
KW – scaling coefficient for wind generator:
where Wwy – is the sum of yearly wind generator production, kWh.
Total power graph, what is equal to the consumption:
where a – percentage 0…1, b = (1-a)
The indicator being modelled is the self-consumption rate or in other words, the demand cover factor YD [41,42,43,44]:
where PS is the local power supply, and PD is the local power demand. The time when PD(t) ≤ PS (t) is denoted as t0 … t1 and t1 … t2 is the time when PD(t) ≥ PS(t) [41]. The demand cover factor is defined as `the ratio in which the local supply covers the energy demand and indicates the „self-generation“ [41].
This article investigates whether there may be differences in the best wind and PV electricity in different years when self-consumption is highest. It finds the margins of the fluctuation and evaluates the optimal battery size.
The article is used for the comparison of production capabilities among years in the capacity factor (CF) [45]
where P – annual production graph hourly capacities, kW;
Prated – rated capacity of production device, kW;
t – hours per year, t = 8760 h.
The capacity factor is the quotient between annual actual production, conceivable production, and the yearly permanent rated production.
The multiplication coefficient FD is calculated as follows [46]:
where Wprod – actual wind generator and PV panel production mix, kWh;
– yearly consumed electricity, kWh.
3. Results
This section presents results for calculating wind and PV solar balancing properties together. Table 2 presents capacity factors CFwind and CFPV as annual capacity factors for wind generators and PV panels, Vavg is the average wind speed by year, Pwind and PPV are the average yearly scaled wind generator and PV panel capacities. CFwind is desired high for this site. CFPV is similar in all places in Estonia. In the seashores and lakeshores, it is a little higher as here presents and inland, it keeps near 0.11. The fluctuations are higher with CFwind due to the nature of the wind conditions. In conclusion, the analysis of CFwind and CFPV representatives separated the average year 2019, minimum 2018, and maximum 2020, when both capacities were similarly average, minimum or maximum.
This means that by high yearly solar irradiation, the potential output of wind generators is high, too. More energy from the sun induces more energy in the wind. Pwind and PPV denote the average annual capacity by 100 % of production separately.
Figure 3 presents the demand cover factor YD by different energy mixes. Energy mixes are annual electricity productions.
Figure 3 depicts YD dependence from different wind and solar PV energy mixes. The highest value of 2019 YD = 0.62 was achieved in the energy mix values 0.2/0.8 and 0.3/0.7 simultaneously, as well as solar PV and wind. In this area, the curve is very smooth; it lowers rapidly on the side of 100 % PV solar YD = 0.33 and the opposite side of the figure when wind share is 100 % YD = 0.6. This means that wind generation has more influence on the YD than solar PV.
Figure 4 depicts the influence of the multiplicity FD of production on consumption in 2019 by energy mix 0.2/0.8.
According to analyses supported by Figure 4, some consequences can be made. The YD is significantly reduced by reducing production to half of consumption according to expectation. The YD growth slackens by increasing FD over one, reaching the value FD = 2.5 when YD has reached 0.78. This means that YD no longer grows proportionally when FD increases beyond 2.5. More precisely, the limit could be considered as FD = 2.
Figure 5 depicts the influence of adding batteries to the solution by FD = 1 in 2019, using an energy mix of 0.2/0.8.
4. Discussion
This calculation does not take battery efficiency and ageing parameters into account. The authors assume that modern lithium batteries have high efficiency and that ageing parameters remain within the range uncertainty. The calculated YD appears relatively high compared to previous results [46]. Earlier calculations used a wind generator with CFwind = (0.05…0.08); now, it is around 0.4. Solar PV CF was a little bit less, too. Previous used different consumer data [41] were used at night with zero consumption. The current consumption data is an unbroken chart. There are fewer consumption at night and more in the daytime. However, consumption was still small at night.
As depicted in Figure 4 and Figure 5, the YD is calculated using the average value in 2019. If using minimum and maximum year values, the YD is changed between margins 0.59 and 0.65. The uncertainty is less than ± 5 %.
Wind speed and total solar irradiation are often measured at weather stations, but how can these measurements be interpolated into technical production data? This article addresses that question. Although it appears to be a case study, it provides insights that can be scaled up or down to another solution.
5. Conclusions
This study provided significant insight into balancing wind and PV solar production research in small-scale regions like Estonia. We used self-consumption, measured as a demand cover factor YD, as an indicator for evaluating wind and solar PV balancing potential together. A smooth peak appears on the demand cover factor curve, wind and solar PV production, particularly in shares of 30/70 and 20/80 for PV solar and wind, respectively. The maximum YD in the peak is 0.62 and maintaining a high level of YD favors wind generation, where 100% wind production yields a YD of 0.6, compared to only 0.33 for 100% solar PV energy. Production capacity needed to be increased relative to consumption to achieve optimal results, with the best outcomes occurring at FD = 2.5 and YD = 0.78. FD increases over 2.5 slowly, rapidly. Adding battery storage further improved capacity utilization, with a 10-kWh battery achieving a YD of 0.82. It is important to note that wind conditions with a high CF, as presented in this study, provide only a small balancing effect between wind and solar PV production, whereas lower CF values for wind enhance the impact of balancing. Finally, this article presents a method for calculating the actual output of production devices based on measured weather, wind and total solar irradiation data.
Author Contributions
Conceptualization, A.A. and W.Y.; methodology, A.A., Ri.M; software, Ri.M.; validation, K.H., W.Y.; formal analysis, K.H., Re.M., M.G.; investigation, A.A.; resources, A.A., K.H.; data curation, Ri.M, Re.M.; writing—original draft preparation, Re.M., M.G.; A.A. writing—review and editing, A.A., Re.M., M.G.; visualisation, Ri.M., M.G.; supervision, A.A.; project administration, A.A. All authors have read and agreed to the published version of the manuscript.
Funding
This research received no external funding.
Data Availability Statement
Not applicable.
Acknowledgements
The authors would like to thank Tuge Energia Ltd. (TUGE Ltd., Paldiski, Estonia) for making the data of the 20 kW wind generator available, the Estonian Environment Agency Weather Service department for making wind and solar irradiation data available, and the Chair of Energy Application Engineering at the Estonian University of Life Sciences for support.
Conflicts of Interest
The authors declare no conflict of interest.
References
- Benhacene, H.L.M.; Hussien, A.M. The Impact of Adopting Renewable Energy Resources on Sustainable Development in Saudi Arabia: A Qualitative View. Sustainability 2025, 17, 768. [CrossRef]
- Kies, A.; Schyska, B.; Von Bremen, L. The Demand Side Management Potential to Balance a Highly Renewable European Power System. Energies (Basel) 2016, 9, 955. [CrossRef]
- Shen, C.-L.; Shen, Y.-S. Output Filter Design for a Novel Dual-Input PV-Wind Power Converter by Energy Balance Principle. Applied Sciences 2016, 6, 263. [CrossRef]
- Boubii, C.; Kafazi, I. El; Bannari, R.; El Bhiri, B.; Bossoufi, B.; Kotb, H.; AboRas, K.M.; Emara, A.; Nasiri, B. Synergizing Wind and Solar Power: An Advanced Control System for Grid Stability. Sustainability 2024, 16, 815. [CrossRef]
- Frimpong, S.O.; Agbehadji, I.E.; Abayomi, A.; Millham, R.C.; Freeman, E.; Ujakpa, M.M. Economic and Reliability Determination of Sustainable Renewable Energy Mix Based on Social Spider Prey Optimization Algorithm. Soft comput 2023, 27, 10687–10718. [CrossRef]
- Syed, A.S.; Patrick, A.; Lauf, A.; Elmaghraby, A. Assessing the Complementarity of Wind and Solar Energy in Kentucky. Energies (Basel) 2024, 17, 3226. [CrossRef]
- Larsen, M.A.D.; Bournhonesque, J.; Thiery, W.; Halsnæs, K.; Hattermann, F.F.; Hoff, H.; Salack, S.; Adenle, A.; Liersch, S. Renewable Energy Planning in Africa: Robustness of Mean and Extreme Multi-Model Climate Change Patterns in Solar PV and Wind Energy Potentials. Environ Res Commun 2024, 6, 15001. [CrossRef]
- Pierro, M.; Barba, M.; Perez, R.; Perez, M.; Moser, D.; Cornaro, C. Ancillary Services via Flexible Photovoltaic/Wind Systems and “Implicit” Storage to Balance Demand and Supply. Solar RRL 2023, 7, 2200704. [CrossRef]
- Belhadef, O.; Merahi, F.; Badoud, A.E. Energy Management Systems for Hybrid Renewable Energy Systems: A Comprehensive Review. In Proceedings of the 2024 2nd International Conference on Electrical Engineering and Automatic Control (ICEEAC); IEEE: Setif, Algeria, May 2024; pp. 1–6.
- Benato, A.; De Vanna, F.; Stoppato, A. Levelling the Photovoltaic Power Profile with the Integrated Energy Storage System. Energies (Basel) 2022, 15. [CrossRef]
- Niu, X.; Luo, X. Policies and Economic Efficiency for Distributed Photovoltaic and Energy Storage Industry. Distributed Generation and Alternative Energy Journal 2023, 38, 1197 – 1222. [CrossRef]
- Ho-Tran, L.; Fiedler, S. More Summertime Low-Power Production Extremes in Germany with a Larger Solar Power Share. Solar Energy 2024, 283. [CrossRef]
- Fasihi, M.; Weiss, R.; Savolainen, J.; Breyer, C. Global Potential of Green Ammonia Based on Hybrid PV-Wind Power Plants. Appl Energy 2021, 294. [CrossRef]
- Dietrich, U. Zero-Energy Buildings in Cities with Different Climates and Urban Densities: Emergy Demand, Renewable Energy Harvest On-Site and Off-Site and Total Land Use for Different Renewable Technologies. International Journal of Energy Production and Management 2021, 6, 335 – 346. [CrossRef]
- Salkuti, S.R. Optimal Operation of Electrified Railways with Renewable Sources and Storage. Journal of Electrical Engineering and Technology 2021, 16, 239 – 248. [CrossRef]
- Chen, Y.; Kirkerud, J.G.; Bolkesjø, T.F. Balancing GHG Mitigation and Land-Use Conflicts: Alternative Northern European Energy System Scenarios. Appl Energy 2022, 310. [CrossRef]
- Silva, A.R.; Pousinho, H.M.I.; Estanqueiro, A. A Multistage Stochastic Approach for the Optimal Bidding of Variable Renewable Energy in the Day-Ahead, Intraday and Balancing Markets. Energy 2022, 258. [CrossRef]
- Nnodim, C.T.; Kpu, G.C.; Okhuegbe, S.N.; Ajani, A.A.; Adebayo, S.; Diarah, R.S.; Aliyu, S.J.; Onokwai, A.O.; Osueke, C.O. Figures of Merit for Wind and Solar PV Integration in Electricity Grids. J Sci Ind Res (India) 2022, 81, 349 – 357.
- Al-Dahidi, S.; Ayadi, O.; Adeeb, J.; Alrbai, M.; Qawasmeh, B.R. Extreme Learning Machines for Solar Photovoltaic Power Predictions. Energies (Basel) 2018, 11. [CrossRef]
- Santos-Alamillos, F.J.; Pozo-Vázquez, D.; Ruiz-Arias, J.A.; Lara-Fanego, V.; Tovar-Pescador, J. Analysis of Spatiotemporal Balancing between Wind and Solar Energy Resources in the Southern Iberian Peninsula. J Appl Meteorol Climatol 2012, 51, 2005 – 2024. [CrossRef]
- Veluchamy, K.; Veluchamy, M. A New Energy Management Technique for Microgrid System Using Muddy Soil Fish Optimization Algorithm. Int J Energy Res 2021, 45, 14824 – 14844. [CrossRef]
- Velosa, N.; Gomes, E.; Morais, H.; Pereira, L. PROCSIM: An Open-Source Simulator to Generate Energy Community Power Demand and Generation Scenarios. Energies (Basel) 2023, 16. [CrossRef]
- Lippert, M. Balancing Renewables with Li-Ion Energy Storage. Power 2014, 158.
- Tafarte, P.; Hennig, C.; Dotzauer, M.; Thrän, D. Impact of Flexible Bioenergy Provision on Residual Load Fluctuation: A Case Study for the TransnetBW Transmission System in 2022. Energy Sustain Soc 2017, 7. [CrossRef]
- Schmidt, J.; Cancella, R.; Pereira, A.O. The Role of Wind Power and Solar PV in Reducing Risks in the Brazilian Hydro-Thermal Power System. Energy 2016, 115, 1748 – 1757. [CrossRef]
- Carbajales-Dale, M.; Barnhart, C.J.; Benson, S.M. Can We Afford Storage? A Dynamic Net Energy Analysis of Renewable Electricity Generation Supported by Energy Storage. Energy Environ Sci 2014, 7, 1538 – 1544. [CrossRef]
- Haegel, N.M.; Kurtz, S.R. Global Progress Toward Renewable Electricity: Tracking the Role of Solar (Version 3). IEEE J Photovolt 2023, 13, 768 – 776. [CrossRef]
- Hadi, A. Al; Silva, C.A.S.; Hossain, E.; Challoo, R. Algorithm for Demand Response to Maximize the Penetration of Renewable Energy. IEEE Access 2020, 8, 55279 – 55288. [CrossRef]
- Stamatakis, M.E.; Stamataki, E.E.; Stamelos, A.P.; Ioannides, M.G. Energy Management in a Super-Tanker Powered by Solar, Wind, Hydrogen and Boil-Off Gas for Saving CO2 Emissions. Electronics (Switzerland) 2024, 13. [CrossRef]
- Shepherd, J.; Haider Ali Khan, M.; Amal, R.; Daiyan, R.; MacGill, I. Open-Source Project Feasibility Tools for Supporting Development of the Green Ammonia Value Chain. Energy Convers Manag 2022, 274. [CrossRef]
- Hou, X.; Wild, M.; Folini, D.; Kazadzis, S.; Wohland, J. Climate Change Impacts on Solar Power Generation and Its Spatial Variability in Europe Based on CMIP6. Earth System Dynamics 2021, 12, 1099 – 1113. [CrossRef]
- Madiba, T.; Bansal, R.C.; Justo, J.J.; Kusakana, K. Optimal Control System of under Frequency Load Shedding in Microgrid System with Renewable Energy Resources. Green Energy and Technology 2017, 0, 71 – 96. [CrossRef]
- Coles, D.; Wray, B.; Stevens, R.; Crawford, S.; Pennock, S.; Miles, J. Impacts of Tidal Stream Power on Energy System Security: An Isle of Wight Case Study. Appl Energy 2023, 334. [CrossRef]
- Jiang, H., Du, E., He, B., Zhang, N., Wang, P., Li, F., & Ji, J. (2023). Analysis and modeling of seasonal characteristics of renewable energy generation. Renewable Energy, 219, 119414. [CrossRef]
- Frank, C.; Fiedler, S.; Crewell, S. Balancing Potential of Natural Variability and Extremes in Photovoltaic and Wind Energy Production for European Countries. Renew Energy 2021, 163, 674 – 684. [CrossRef]
- Keskkonnaagentuur ILM. Estonian Environment Agency Weather Services. https://www.ilmateenistus.ee/?lang=en.
- TUGE20. TUGE small wind turbines. https://www.tuge.ee/products/tuge20.
- Land Monitoring Service. https://land.copernicus.eu/en/products/corine-land-cover.
- Duffie, J.A.; Beckman, W.A. Solar Engineering of Thermal Processes; 4th ed.; Wiley: Hoboken, 2013; ISBN 9780470873663.
- Erbs, D.G.; Klein, S.A.; Duffie, J.A. Estimation of the Diffuse Radiation Fraction for Hourly, Daily and Monthly-Average Global Radiation. Solar Energy 1982, 28, 293–302. [CrossRef]
- Annuk, A.; Hovi, M.; Kalder, J.; Kabanen, T.; Ilves, R.; Marss, M.; Martinkauppi, B.; Miidla, P. Methods for Increasing Shares of Self-Consumption in Small PV Solar Energy Applications. In Proceedings of the 2020 9th International Conference on Renewable Energy Research and Application (ICRERA); IEEE: Glasgow, United Kingdom, September 2020; pp. 184–187.
- Põder, V.; Lepa, J.; Palge, V.; Peets, T.; Annuk, A. The Estimation of Needed Capacity of a Storage System According to Load and Wind Parameters. Oil Shale 2009, 26,283–293. [CrossRef]
- Khan, T.; Waseem, M.; Muqeet, H.A.; Hussain, M.M.; Yu, M.; Annuk, A. 3E Analyses of Battery-Assisted Photovoltaic-Fuel Cell Energy System: Step towards Green Community. Energy Reports 2022, 8, 184–191. [CrossRef]
- Vanhoudt, D.; Geysen, D.; Claessens, B.; Leemans, F.; Jespers, L.; Van Bael, J. An Actively Controlled Residential Heat Pump: Potential on Peak Shaving and Maximization of Self-Consumption of Renewable Energy. Renew Energy 2014, 63, 531–543. [CrossRef]
- Annuk, A.; Allik, A.; Prikk, P.; Uiga, J.; Tammoja, H.; Toom, K.; Olt, J. Increasing Renewable Fraction by Smoothing Consumer Power Charts in Grid-Connected Wind-Solar Hybrid Systems. Oil Shale 2013, 30, 257. [CrossRef]
- Kalder, J.; Allik, A.; Hõimoja, H.; Jõgi, E.; Hovi, M.; Märss, M.; Kurnitski, J.; Fadejev, J.; Lill, H.; Jasinskas, A.; et al. Optimal Wind/Solar Energy Mix for Residential Net Zero-Energy Buildings. In Proceedings of the Proccedings of International Scientific Conference “RURAL DEVELOPMENT 2017”; Aleksandras Stulginskis University: Aleksandras Stulginskis University, Lithuania, February 2018.
Figure 1.
Production and consumption scaled profiles in one week (08.04.2023-14.04.2023).
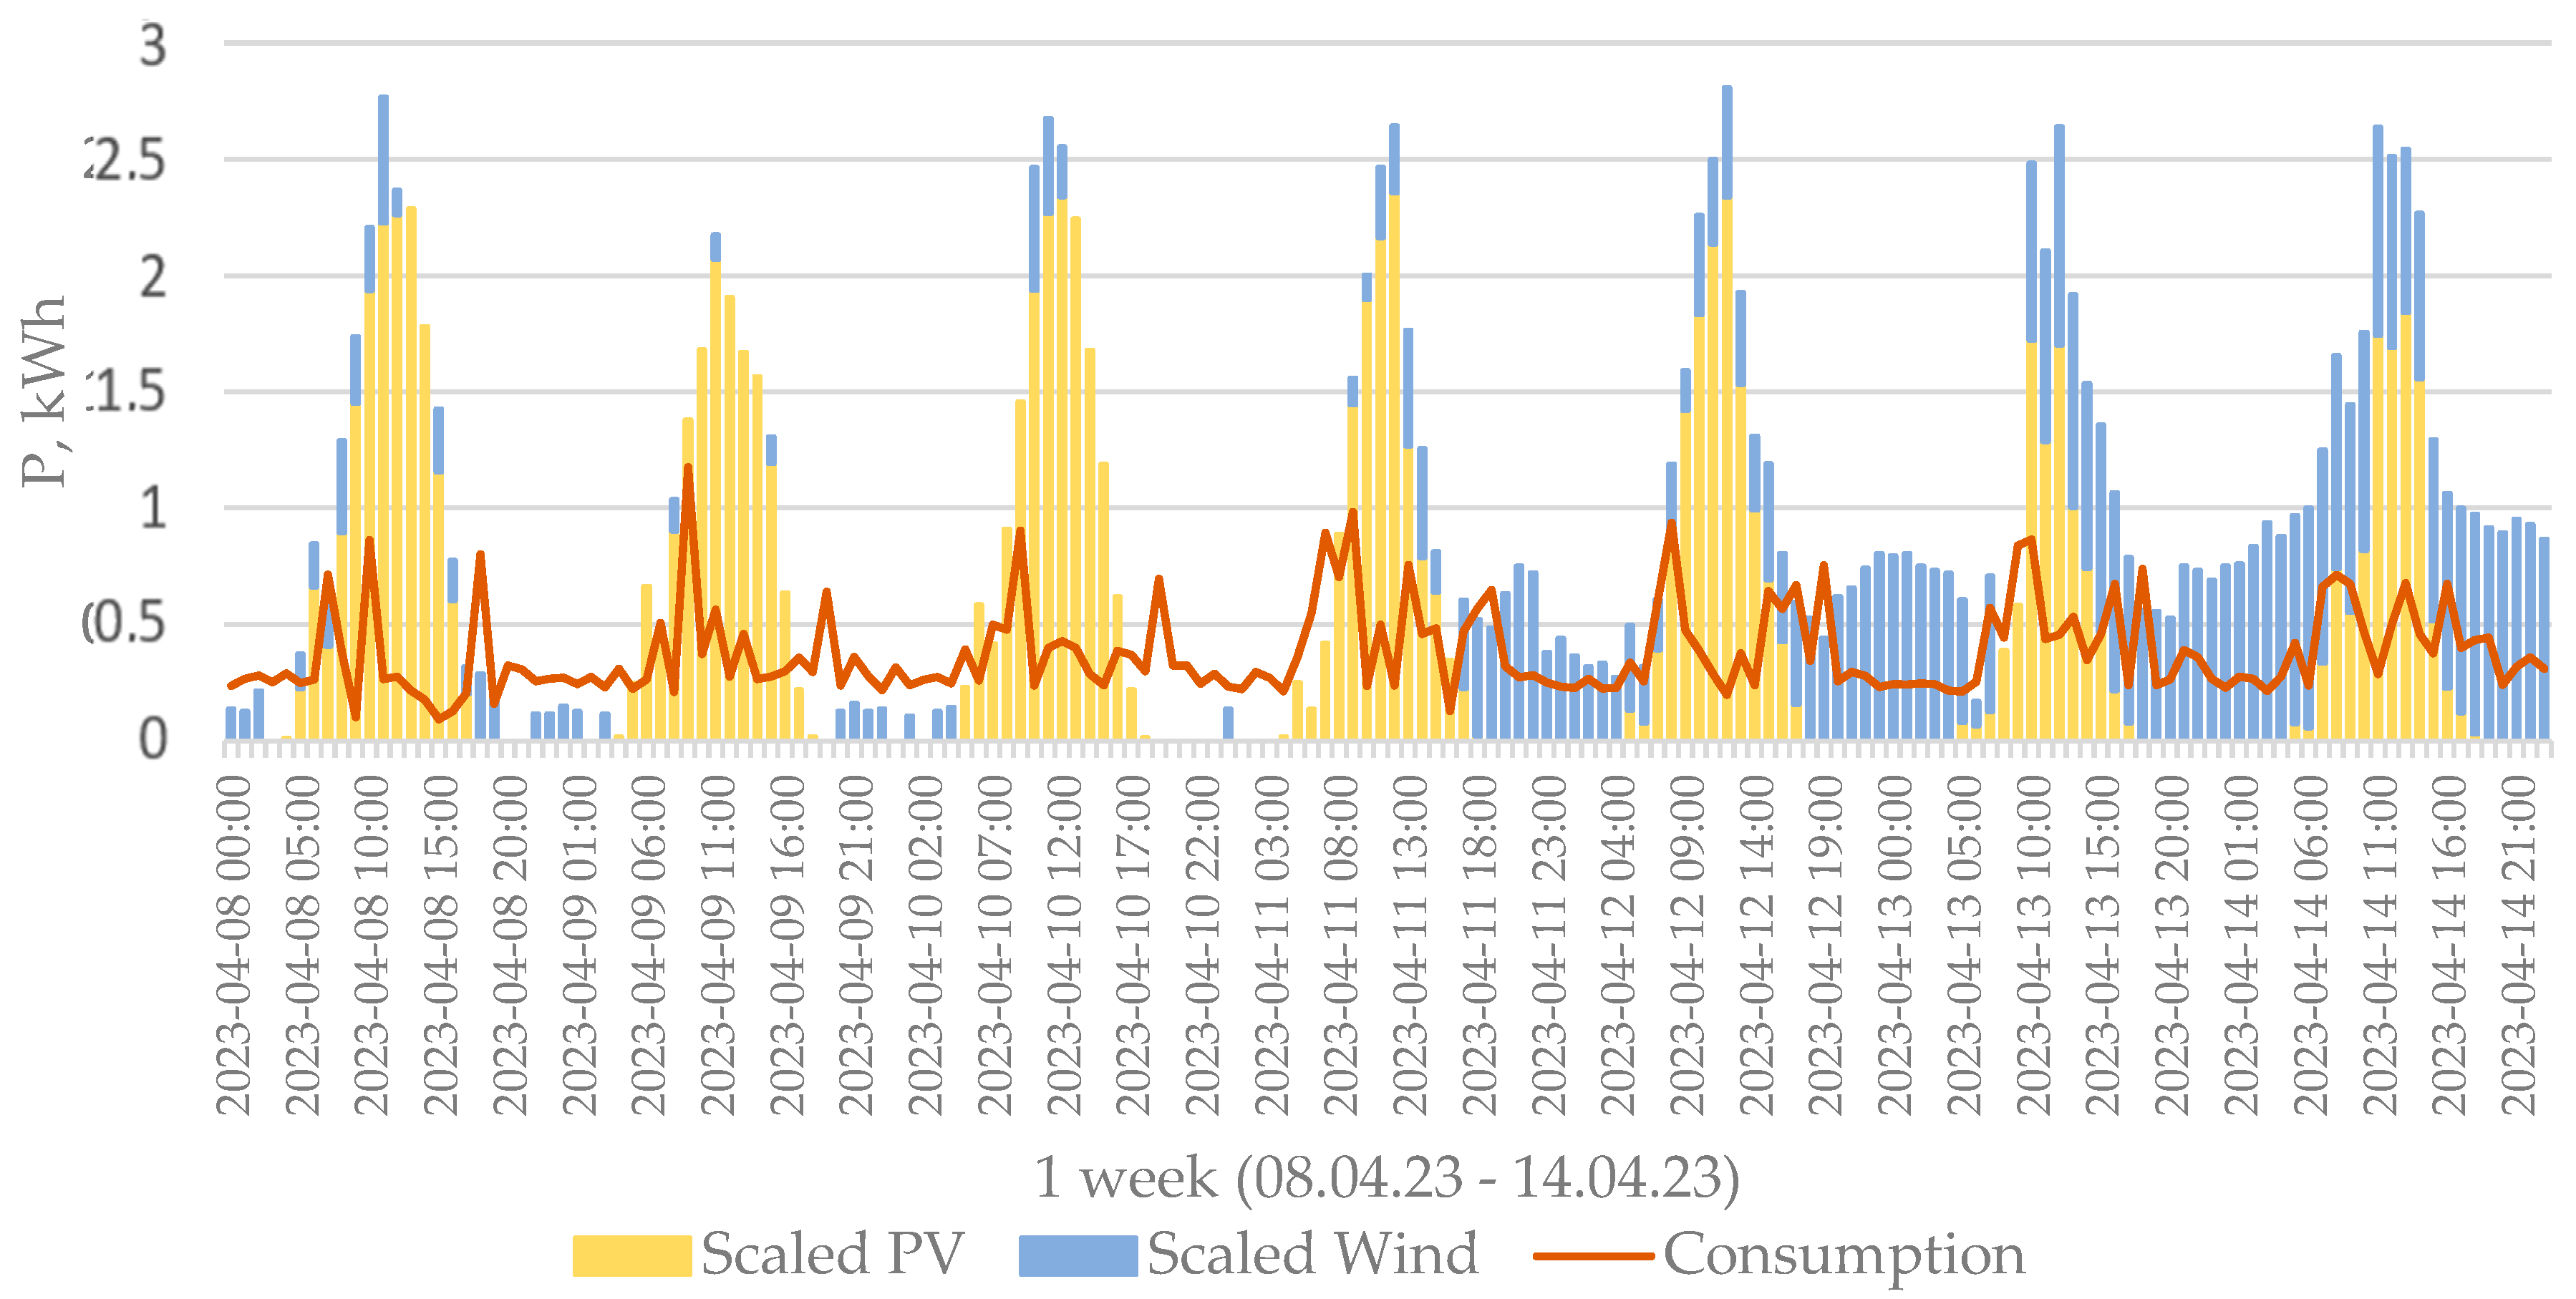
Figure 2.
The power curve of the wind generator is TUGE 20 [37].
Figure 2.
The power curve of the wind generator is TUGE 20 [37].
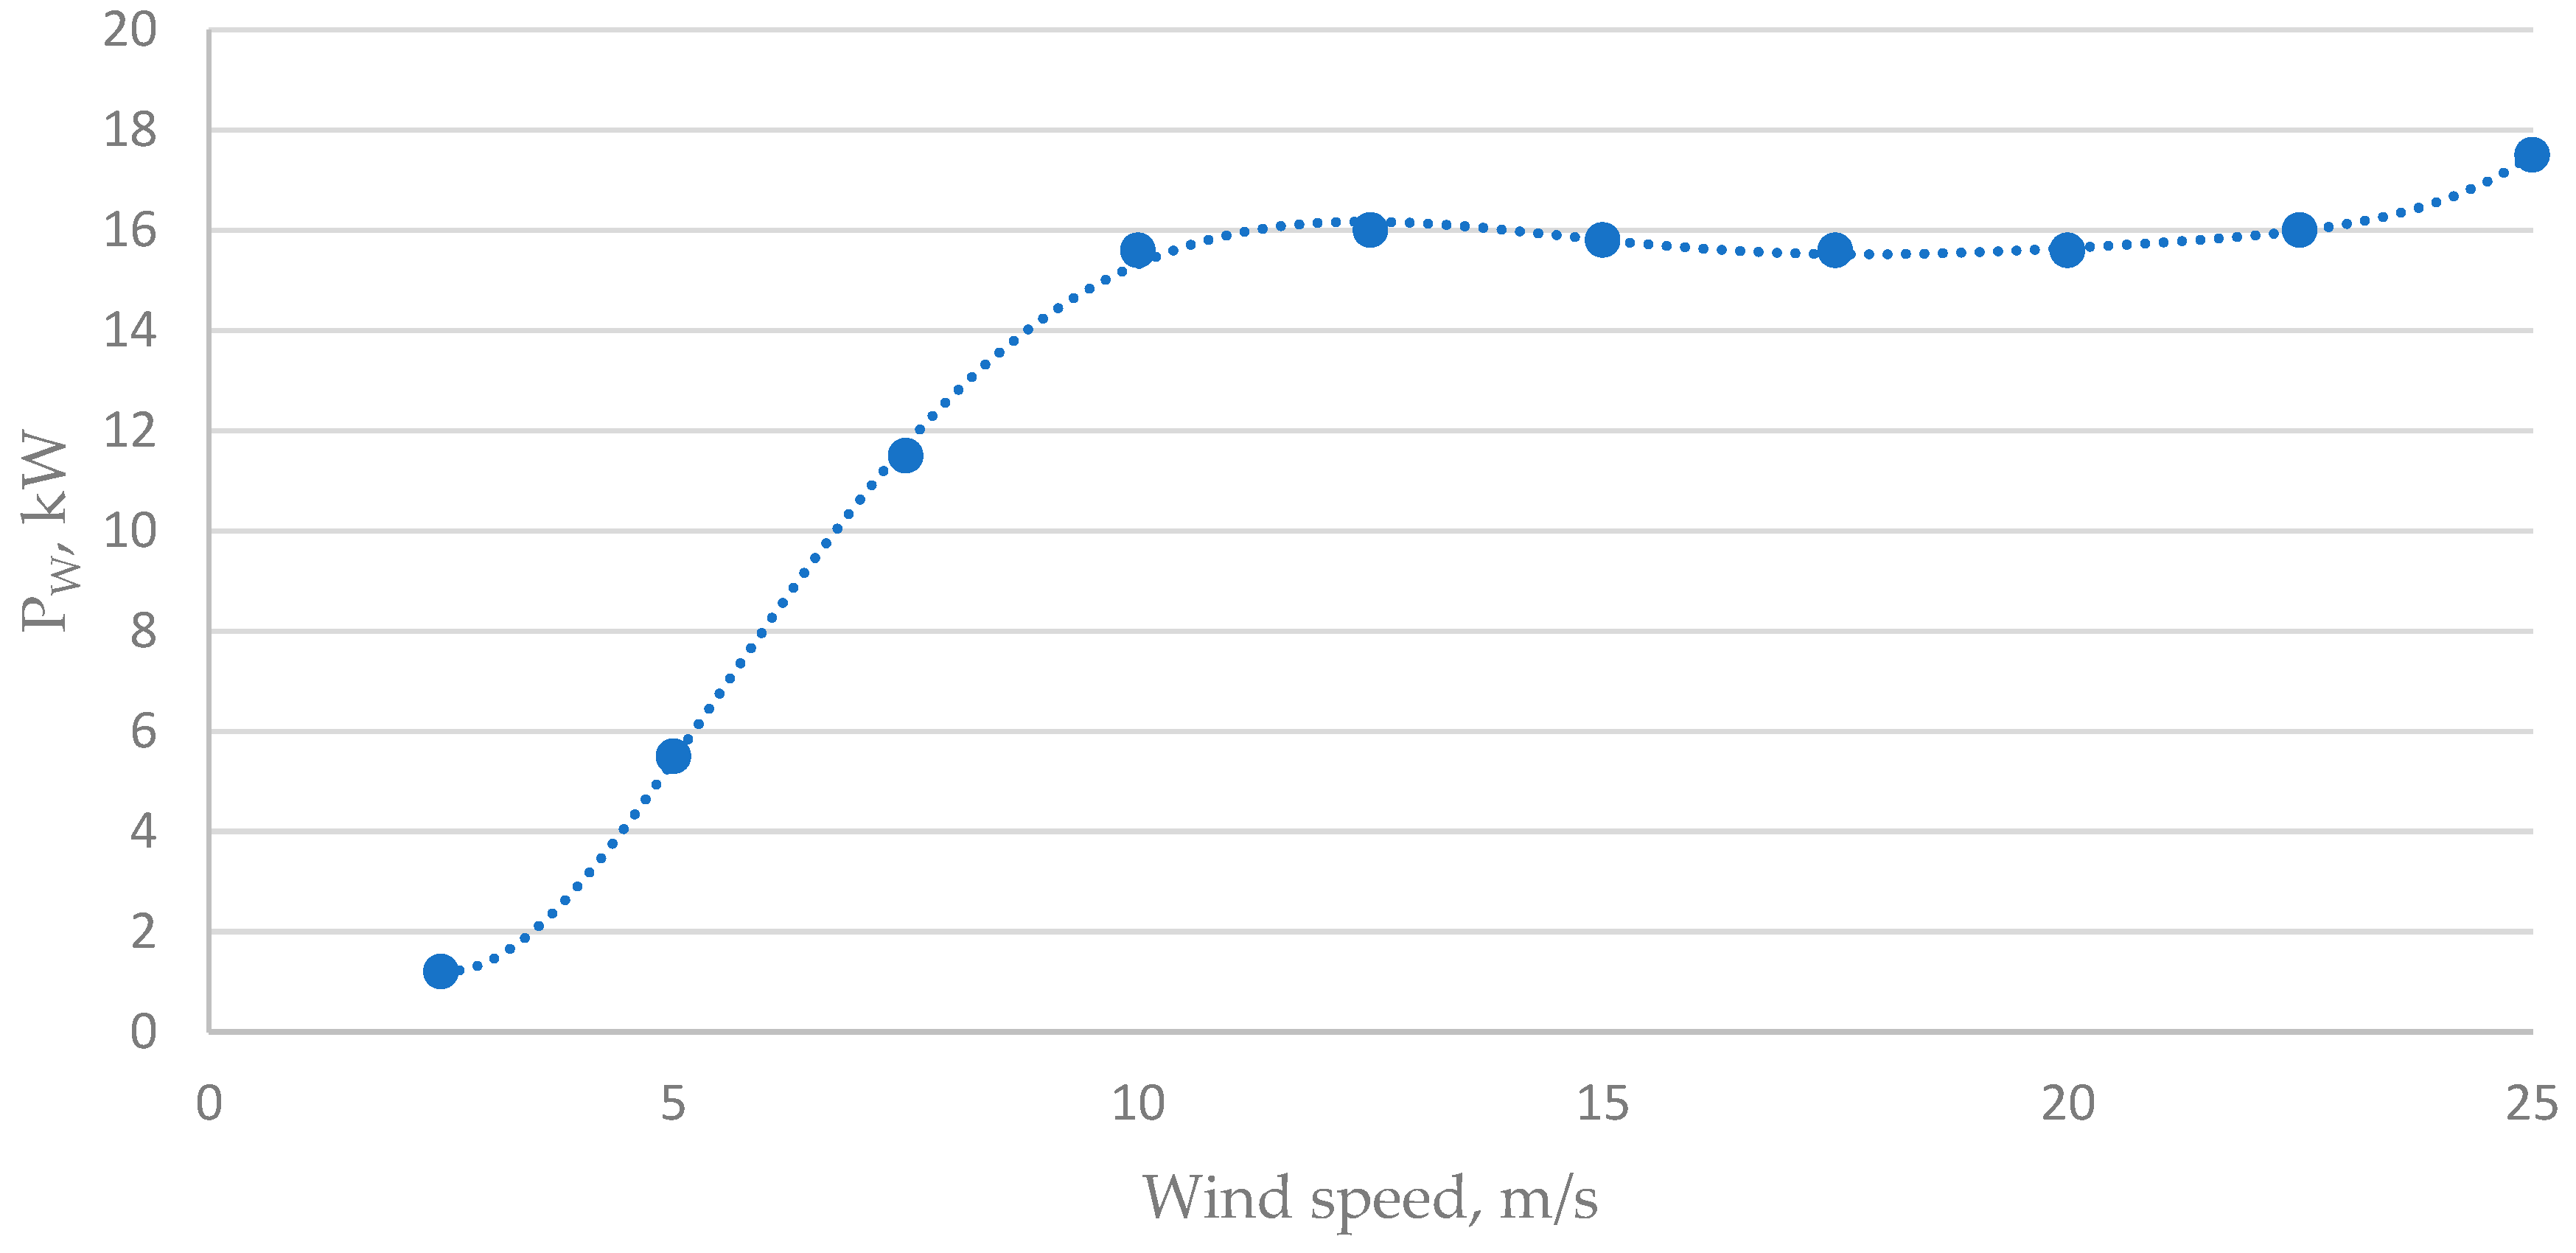
Figure 3.
Dependence on a share of wind and solar PV for CF in 1018, 2019 and 2020.
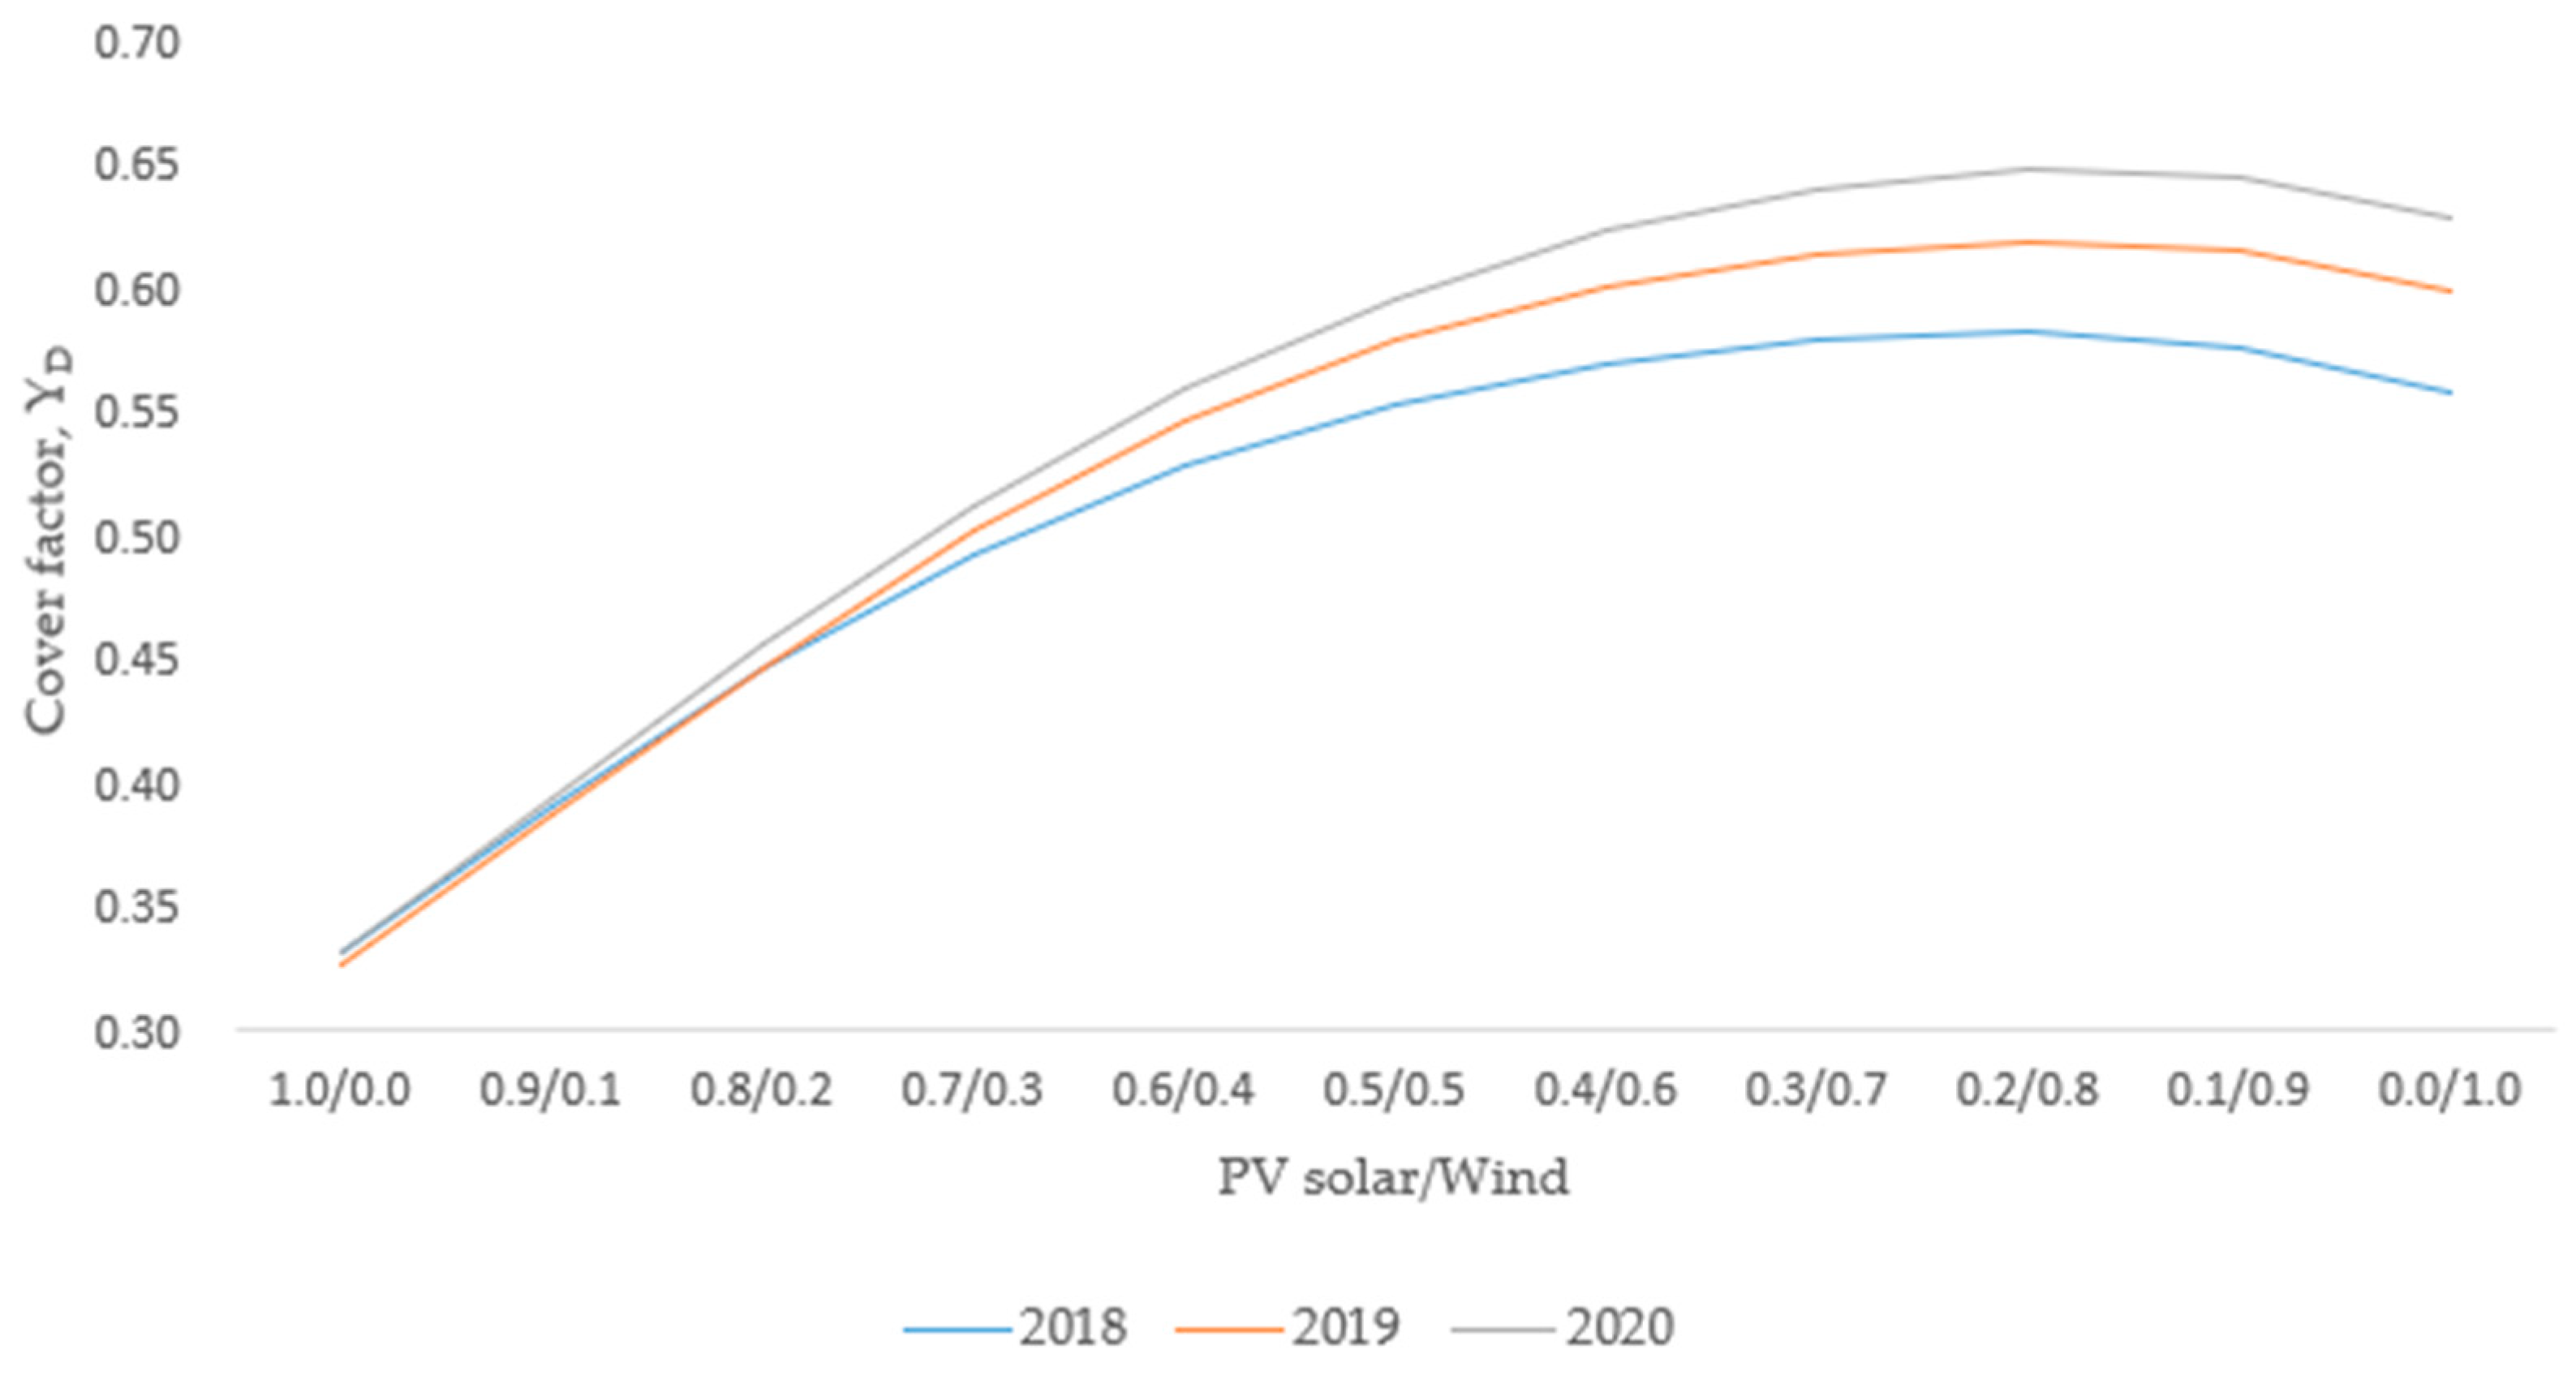
Figure 4.
Dependence from a multiplicity of production to YD in the year 2019.
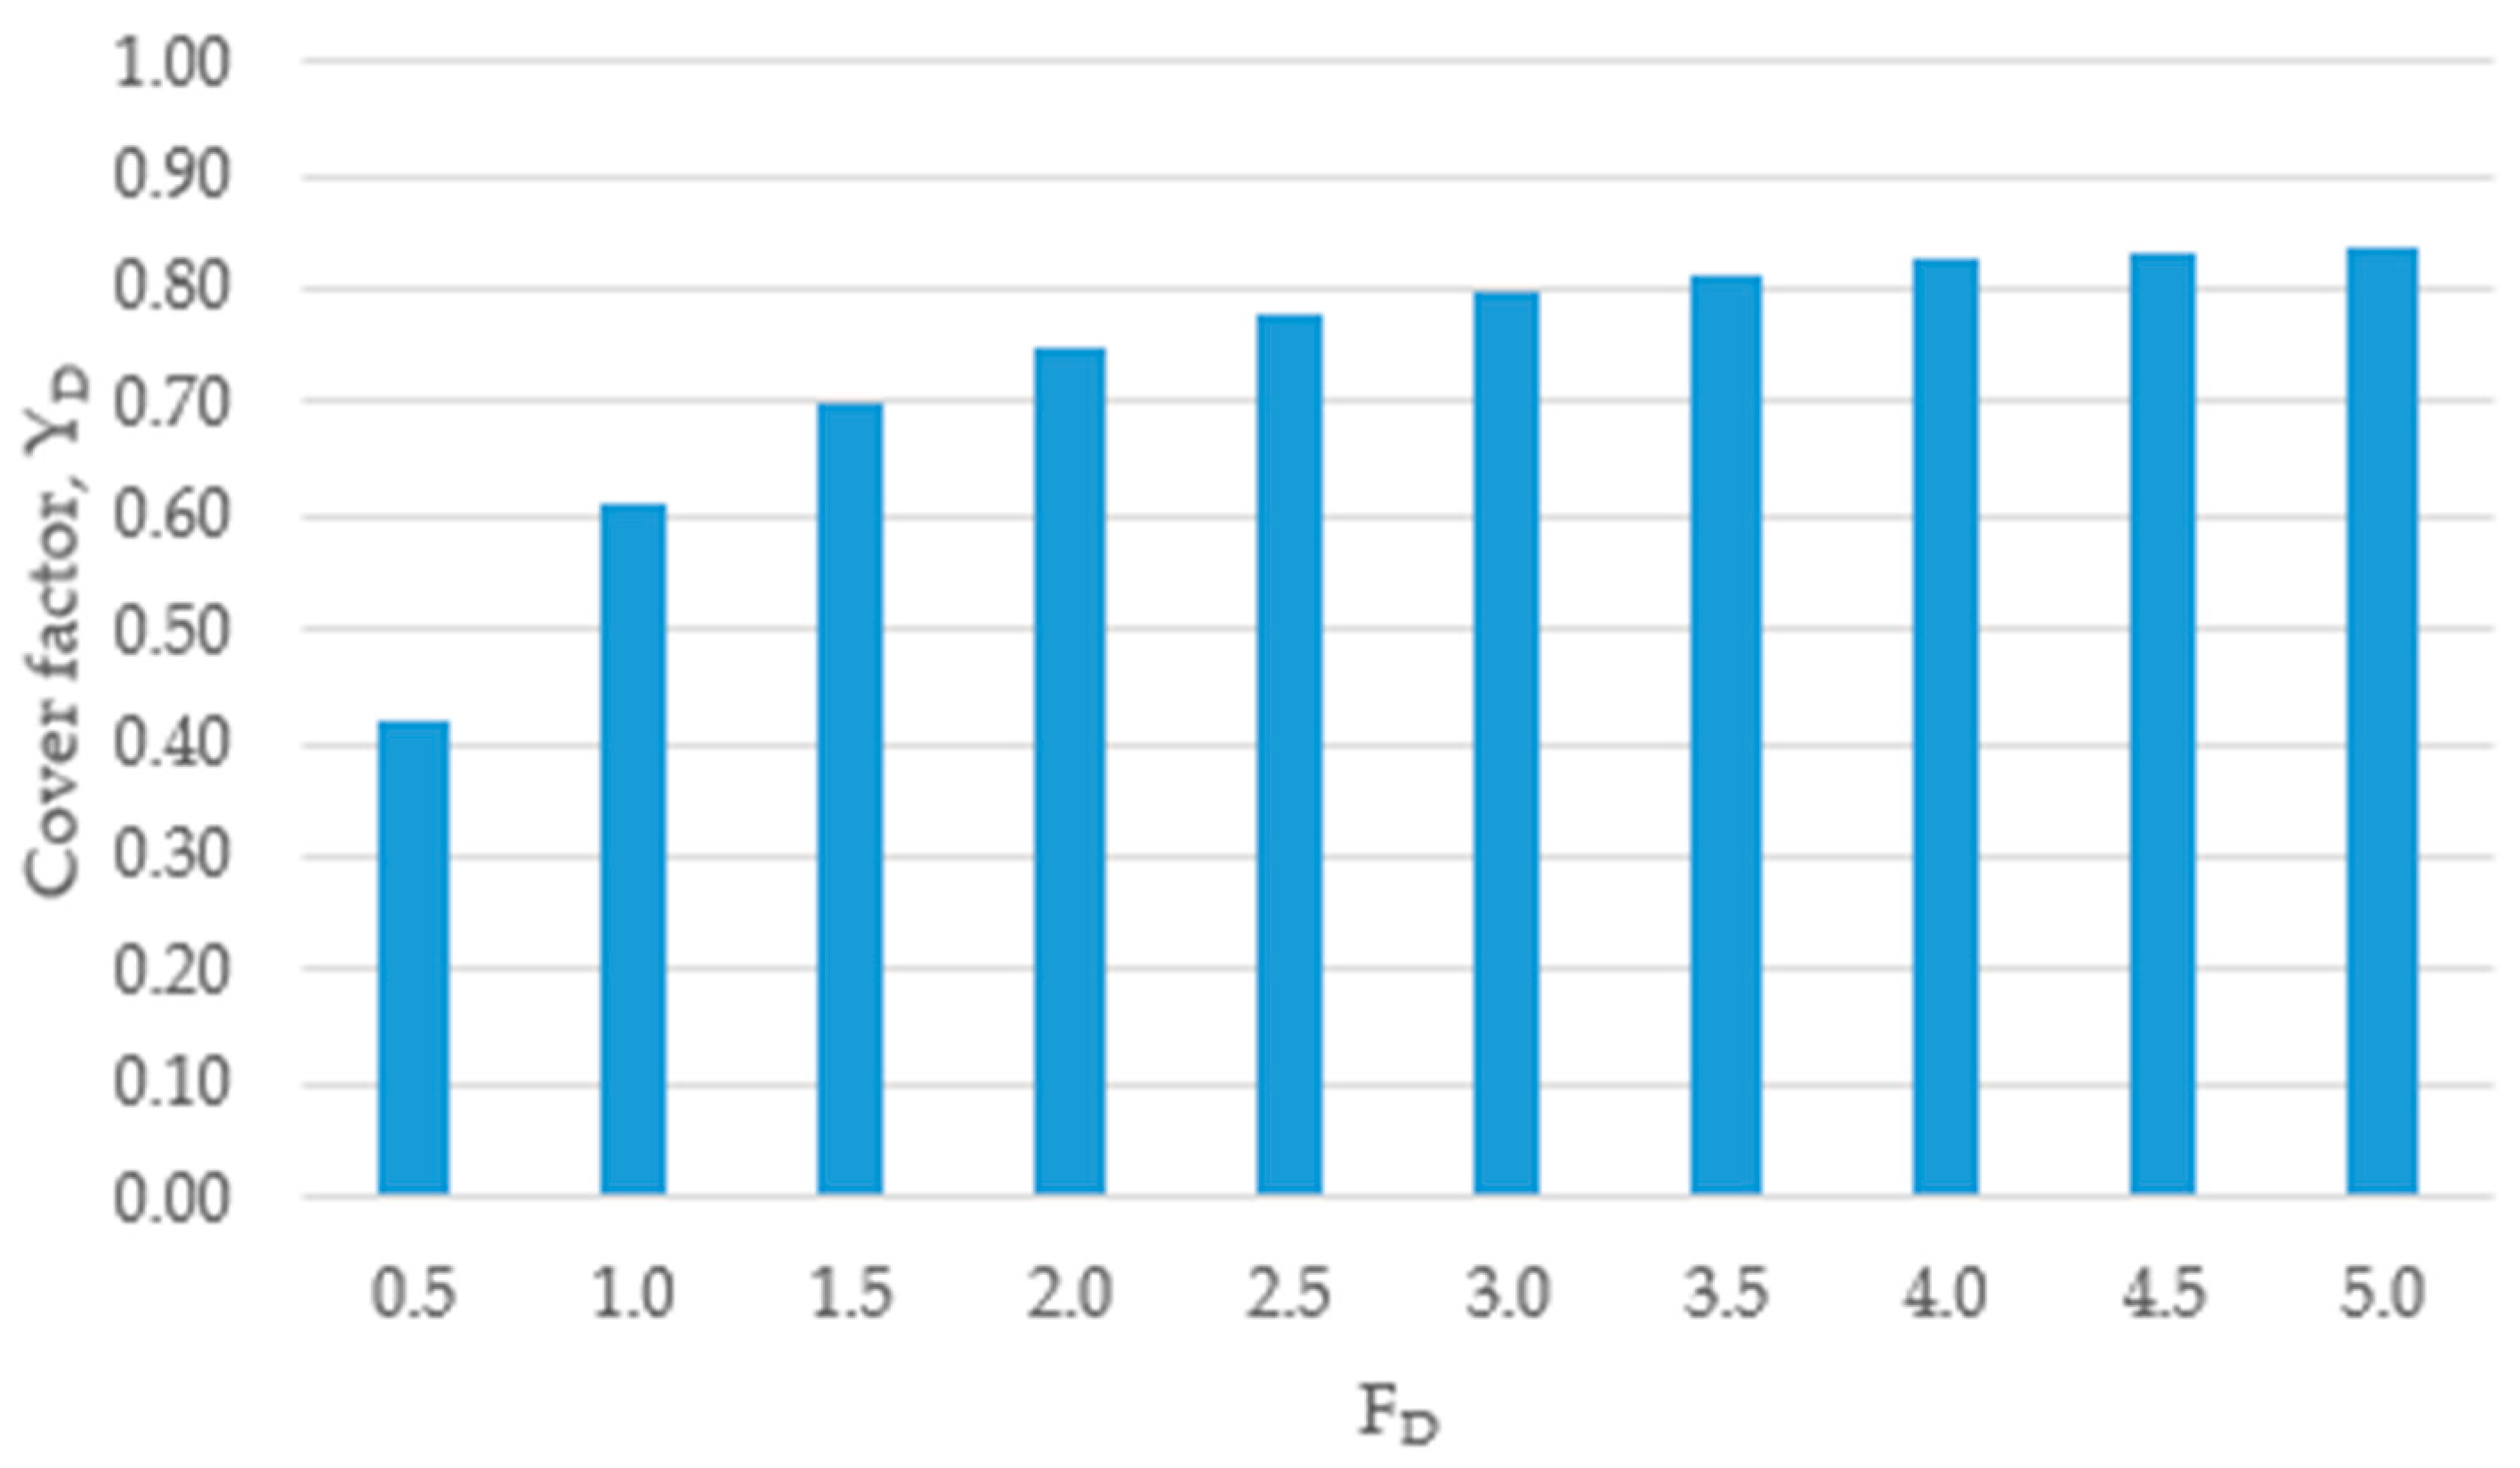
Figure 5.
Dependence on the capacity volumes in 2019.
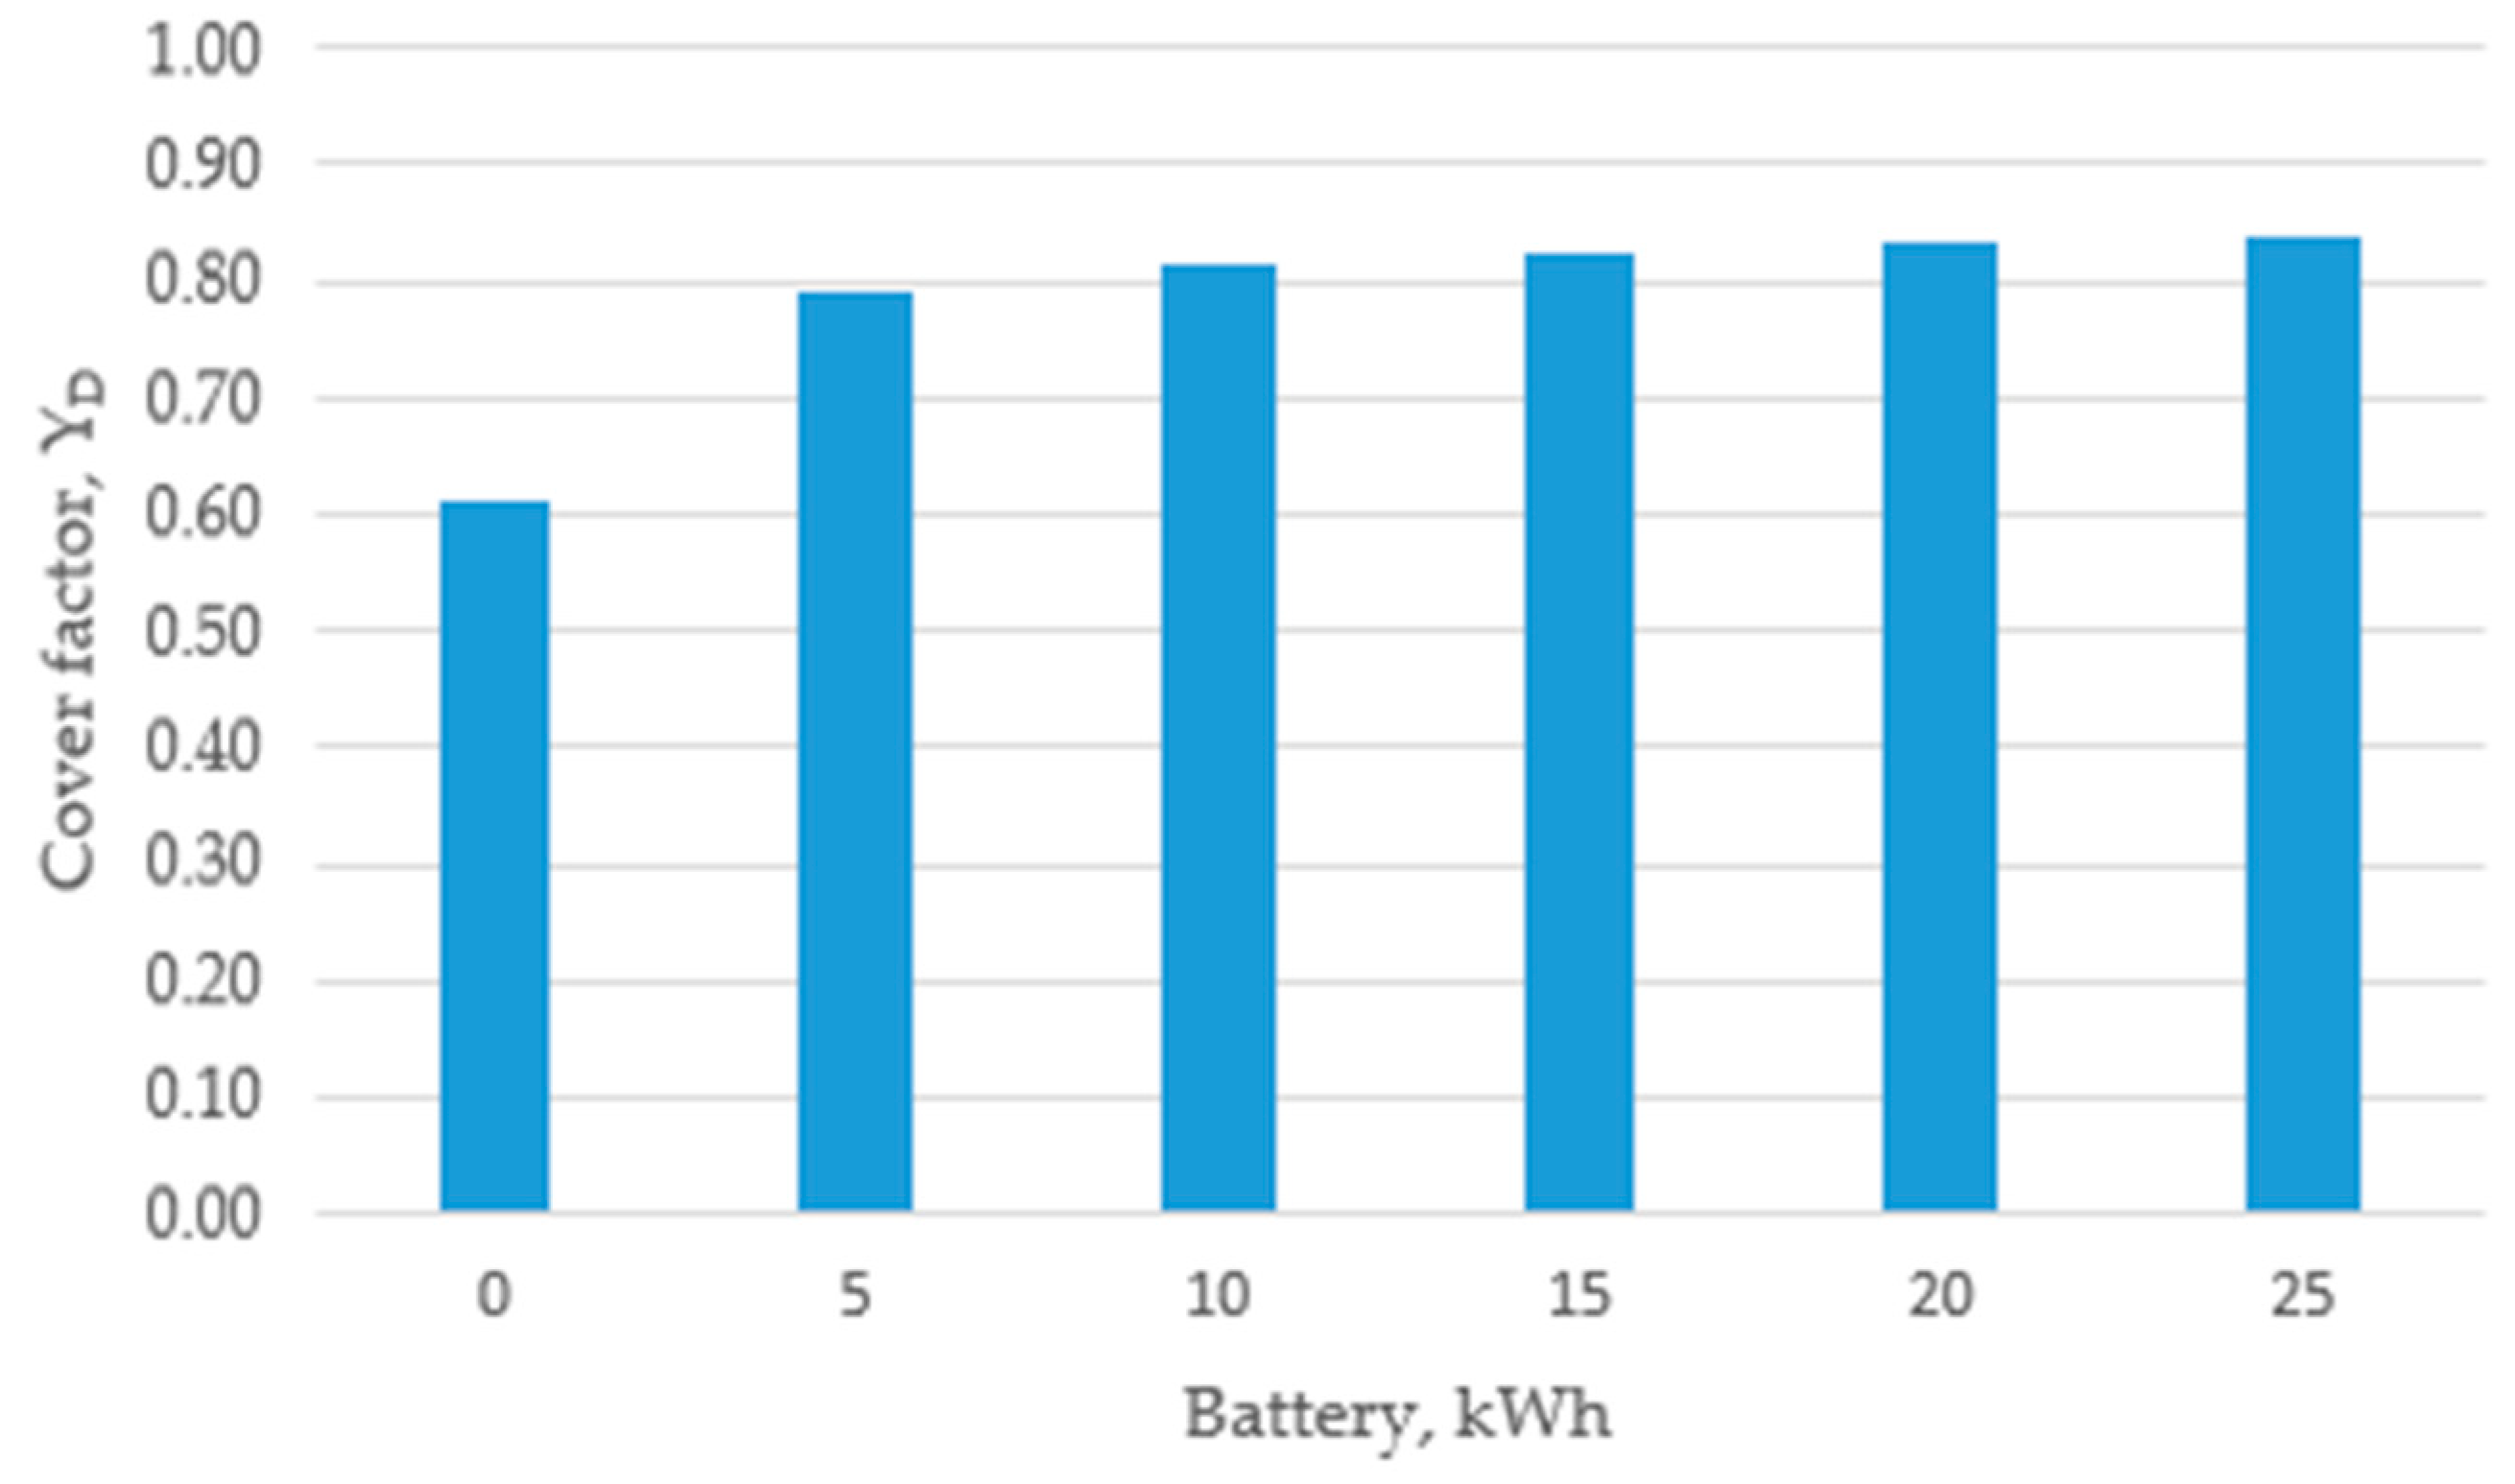

Table 1.
Comparison of some high-related studies.
| Study | Methodology | Objectives | Results |
|---|---|---|---|
| Benato et al. [10] | Integration of energy storage with PV systems | Optimize power output stabilization | Virtual Power Plant model improved power stability |
| Niu & Luo [11] | Economic analysis of distributed PV & storage | Evaluate grid adaptability & storage efficiency | Optimized framework enhanced stability & reliability |
| Frank et al. [35] | Analysis of seasonal renewable production in Germany | Study extreme low power events | Identified increased risk of summer production deficits |
| Fasihi et al. [13] | Green ammonia production with hybrid PV-wind | Assess cost competitiveness | Found feasible cost levels for green ammonia by 2040 |
Table 2.
Yearly properties of production devices.
| Year | Capacity | Factor | Vavg | Pwind | PPV |
|---|---|---|---|---|---|
| CFwind | CFPV | m/s | kW | kW | |
| 2023 | 0.363 | 0.120 | 5.13 | 7.26 | 0.66 |
| 2022 | 0.367 | 0.117 | 5.21 | 7.35 | 0.65 |
| 2021 | 0.382 | 0.116 | 5.37 | 7.65 | 0.64 |
| 2020 | 0.488 | 0.118 | 6.48 | 9.77 | 0.65 |
| 2019 | 0.398 | 0.116 | 5.53 | 7.96 | 0.64 |
| 2018 | 0.346 | 0.121 | 4.91 | 6.91 | 0.66 |
| 2017 | 0.397 | 0.111 | 5.54 | 7.95 | 0.61 |
| 2016 | 0.372 | 0.114 | 5.24 | 7.44 | 0.63 |
| 2015 | 0.443 | 0.117 | 5.96 | 8.87 | 0.64 |
| 2014 | 0.394 | 0.115 | 5.48 | 7.88 | 0.64 |
| Average | 0.395 | 0.116 | 5.49 | 7.90 | 0.64 |
Disclaimer/Publisher’s Note: The statements, opinions and data contained in all publications are solely those of the individual author(s) and contributor(s) and not of MDPI and/or the editor(s). MDPI and/or the editor(s) disclaim responsibility for any injury to people or property resulting from any ideas, methods, instructions or products referred to in the content. |
© 2025 by the authors. Licensee MDPI, Basel, Switzerland. This article is an open access article distributed under the terms and conditions of the Creative Commons Attribution (CC BY) license (https://creativecommons.org/licenses/by/4.0/).
Copyright: This open access article is published under a Creative Commons CC BY 4.0 license, which permit the free download, distribution, and reuse, provided that the author and preprint are cited in any reuse.


