Submitted:
02 April 2025
Posted:
03 April 2025
You are already at the latest version
Abstract
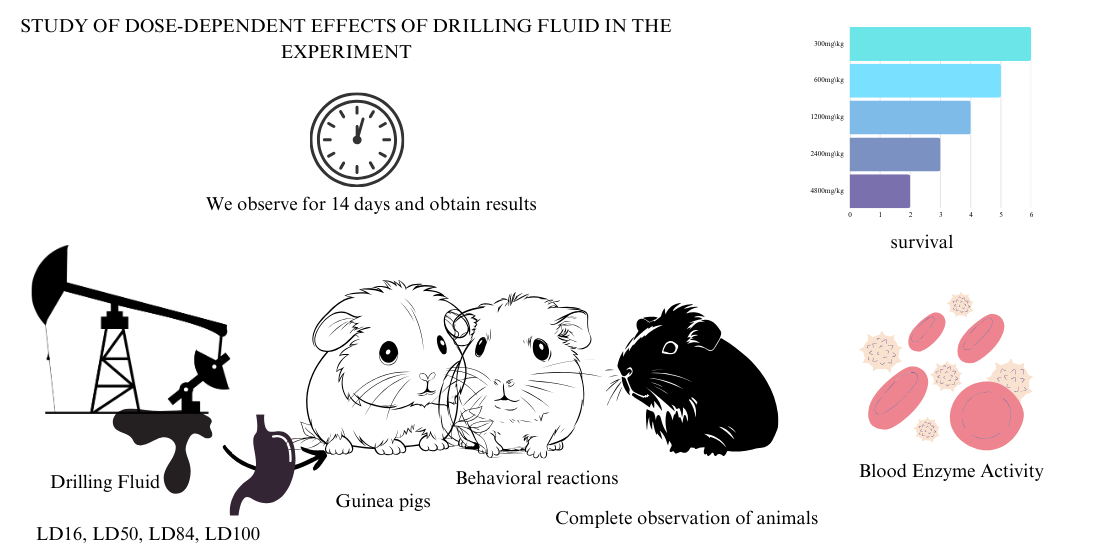
Drilling fluids (DF) and the resulting drill cuttings (DC), widely used in oil production, pose a serious threat to the environment and human health. The issue of toxicity and danger of drilling fluids and drill cuttings still remains poorly understood and controversial. In this paper, we evaluate the dose-dependent effects of drilling fluid in an acute experiment with scientific substantiation of lethal doses, general condition and behavioral reactions, indices of enzymatic activity of detoxifying systems and morphological picture of peripheral blood. The obtained factual material convincingly demonstrates that drilling fluid has an adverse effect on adult guinea pigs. Lethal doses of drilling fluid (LD16, LD50, LD84, LD100) for a single intragastric administration, as well as indices of potential danger of acute poisoning are scientifically substantiated; The time of death and survival of experimental animals were calculated, which was dose-dependent. It was proven that the drilling fluid in an acute experiment leads to significant changes in the general condition of the experimental animals, accompanied by a decrease in food intake and water consumption, disruption of behavioral reactions and an emotional component. The dose dependence of the toxic effect of the drilling fluid was also established by the indicators of the dynamics of body weight gain, the activity of cytolytic enzymes, as well as the picture of peripheral blood. The features of the general toxic effect of the drilling fluid that we identified, with its acute single effect, indicate the systemic nature of the toxicity and danger of the drilling fluid.
Keywords:
drilling fluid
; oil production
; environment
; toxicity
; experimental animals
; acute experience
1. Introduction
Among the environmentally hazardous industries in Kazakhstan, oil and gas production plays a leading role, contributing to significant anthropogenic pollution [1,2]. The extraction and processing of hydrocarbon resources not only exert an intensive impact on the environment but also involve the extensive use of various chemical reagents in drilling, extraction, and oil treatment processes [3,4,5]. Drilling fluids (DF), drill cuttings (DC), and drilling wastewater contain numerous toxic components, including heavy metals, salts, and hydrocarbons, posing significant environmental and public health risks [6,7,8]. Despite existing safety regulations, the full extent of DF toxicity remains poorly understood and is a subject of ongoing debate.Many chemical components in DF contribute to soil and water contamination, leading to potential adverse effects on ecosystems and human health [9,10].
Heavy metals can inhibit key metabolic enzymes, disrupt the nervous system, and contribute to cardiovascular, respiratory, and systemic diseases [11]. Polycyclic aromatic hydrocarbons (PAHs) in oil-based drilling fluids (OBDF) are associated with increased carcinogenic risks, including lung, skin, and stomach cancer, as well as reproductive toxicity [12,13]. Furthermore, exposure to radionuclides and toxic metals in OBDF presents both short-term and long-term health hazards [14]. Studies have also indicated that chemicals associated with drilling and hydraulic fracturing can cause endocrine-mediated changes and significant alterations in immune function [15].
Despite growing evidence of the environmental and health hazards associated with DF, existing research remains fragmented and often lacks a comprehensive toxicological assessment. A deeper understanding of the systemic toxic effects of DF is essential for ensuring environmental safety and public health protection.
The aim of this study was to evaluate the dose-dependent toxic effects of DF in an acute experiment, focusing on lethal dose assessment, general condition, behavioral responses, detoxifying enzyme activity, and peripheral blood morphology in mammals.
2. Materials and Methods
In an acute toxicity experiment, the general toxic effects of drilling fluid were studied in sexually mature male guinea pigs weighing 330–350 g. The animals were randomly assigned into groups, ensuring that body weight variation within each group did not exceed 10%. Six experimental groups (n = 6 per group) were formed, including a control group (Group A) consisting of intact animals that were not subjected to any manipulations. Five experimental groups received a single intragastric administration of drilling fluid at doses of 300 mg/kg (Group B), 600 mg/kg (Group C), 1200 mg/kg (Group D), 2400 mg/kg (Group E), and 4800 mg/kg (Group F). The drilling fluid samples were collected from the Zhanazhol oil and gas field, located in the Aktobe region, Western Kazakhstan.
The animals were housed under standard vivarium conditions with free access to water and food, under natural light. The ambient temperature was maintained at 20–22°C, in compliance with sanitary regulations (Sanitary Rules for the Arrangement, Equipment, and Maintenance of Experimental Biological Clinics [Vivariums], No. 8.01.004.97, 19.06.1997). The study design followed Guideline P1.2.31.56-13 (Assessment of Toxicity and Hazard of Chemicals and Their Mixtures for Human Health, Moscow: Rospotrebnadzor, 2014), which aligns with international OECD standards. Additionally, OECD Test Guideline 420 (Acute Oral Toxicity – Fixed Dose Procedure) and GOST 33216-2014 (Guidelines for the Maintenance and Care of Laboratory Animals) were taken into account.
2.1. Chemical Analysis of Drilling Fluid and Cuttings
The content of heavy metals (HMs) in drilling fluid and drill cuttings was determined using atomic absorption spectroscopy (Agilent AA240FS). Samples were collected from Well SIV No. 64013 and analyzed at the Aktobe Regional Center for Sanitary and Epidemiological Expertise. HM concentrations in drilling fluid (DF) and drill cuttings (DC) were measured according to GOST 26929-94 (Raw Materials and Food Products. Sample Preparation. Mineralization for the Determination of Toxic Element Content). The limits of quantification (LOQ) for chemical elements were as follows (ng/L): Cd – 0.08, Cu – 0.41, Pb – 0.16, Zn – 1.02, Mn – 0.66, Cr – 0.99, Co – 0.14, As – 0.41. For geological samples, LOQ values were (µg/L): Cd – 0.4, Pb – 6.0, Zn – 0.5, Mn – 0.2, Cr – 1.0, As – 5.0.
The elemental composition of unwashed and liquid drilling cuttings was analyzed at LLP Geoplasma using atomic emission spectroscopy. Chemical analysis for metal and oxide content was conducted on 10 samples, while lithological and petrographic studies, along with luminescent-bituminological analysis, were performed on 20 DC samples. The analysis followed MVI No. 01-IL-2016 and MVI No. 499-AES/MS MKHA methodological guidelines.
2.2. Animal Observations and Behavioral Assessments
Prior to the single intragastric administration of drilling fluid, animals were fasted for 12 hours. After administration, continuous monitoring was performed, assessing general condition, signs of toxicity, survival rate, and food and water consumption. Observations were conducted for 6 hours on Day 1, at 24-hour intervals thereafter, and continued for 14 days. Behavioral assessments included spontaneous locomotor activity, rearing behavior (duration measured for 5 minutes, frequency recorded for 1 hour on Days 1, 7, and 14), and the frequency of grooming episodes as an indicator of emotional response.
Body weight dynamics were monitored weekly throughout the observation period. At the end of the experiment, euthanasia was performed, and biomaterial was collected. Internal organs (stomach, liver, lungs, spleen, heart, kidneys, adrenal glands, brain) were harvested for histomorphological analysis. Organ-to-body weight ratios were also calculated.
2.3. Toxic Dose Calculation
Toxic doses LD16, LD50, LD84, and LD100, as well as acute poisoning hazard indices (S, R), were determined based on mortality data. Two groups of methods were used:
Classical lethal dose estimation methods (Behrens, Kerber, Pershin) for LD50 calculations.
Probit analysis methods (Finney, Prozorovsky), which provide confidence intervals and standard errors for toxicity assessment.
Probit analysis was performed using the StatPlus v7 and StatPlus 5 Pro Version 6 software packages, enabling precise toxicity parameter calculations. These tools allowed data import into MS Excel, facilitating analysis of dose-response relationships. The Cox proportional hazards model, embedded in the StatPlus program, was applied to calculate survival probabilities and time-to-death estimates.
2.4. Biochemical and Hematological Assessments
Blood enzyme activity was determined using the Cobas 6000 automatic modular analyzer (immunochemical module C 501-1). The following parameters were assessed:
Alanine aminotransferase (ALT); Aspartate aminotransferase (AST); Alkaline phosphatase (ALP); Lactate dehydrogenase (LDH); C-reactive protein; Gamma-glutamyl transpeptidase (GGTP).
Hematological parameters were measured using the Sysmex XN 550 (II) hematology analyzer, including:
Red blood cell indices: Hemoglobin, erythrocyte count, hematocrit, mean corpuscular volume (MCV), mean corpuscular hemoglobin (MCH), mean corpuscular hemoglobin concentration (MCHC), red cell distribution width (RDW).
Platelet indices: Platelet count, thrombocrit, mean platelet volume (MPV).
White blood cell indices: Total leukocyte count, neutrophil count, eosinophil count, basophil count, monocyte count, lymphocyte count.
Erythrocyte sedimentation rate (ESR): Measured by both Panchenkov and Westergren methods.
2.5. Statistical Analysis
All results were analyzed using parametric (Student’s t-test with Bonferroni correction) and nonparametric (Mann-Whitney U-test) methods. Data were presented as mean ± standard deviation (M ± SD) or median (Me) and interquartile range (Q1, Q3). Categorical variables were compared using Pearson’s chi-square test. Correlation analysis was performed using Spearman’s rank correlation coefficient. Results were considered statistically significant at p ≤ 0.05.
2.6. Ethical Approval and Funding
This study was conducted within the framework of the scientific project IRN AP19676915 (Development of Toxicometric Criteria for the Hazard and Toxicity of Drilling Fluid and Cuttings), funded by the Science Committee of the Ministry of Science and Higher Education of the Republic of Kazakhstan. Ethical approval was obtained from the Local Commission on Bioethics of West Kazakhstan Marat Ospanov Medical University (Protocol No. 3/14, 15.03.2023).
3. Results
Of considerable interest is the section of research related to the assessment of lethal doses of drilling fluid under conditions of single intragastric administration, as well as survival rates. The results obtained indicate that a single acute exposure to drilling fluid is accompanied by a significant range of changes in experimental guinea pigs, including food and water consumption, changes in body weight dynamics, enzymatic activity of the blood, and the morphological profile of red and white blood cells. Table 1 presents the corresponding logarithms (Log10) and probits (Probit) of the dose-dependent effects on animal mortality in the acute experiment (probit analysis by the Finney method). A mathematical calculation of the presented data convincingly demonstrates that with increasing doses of the drilling fluid, the corresponding indicators (Log10 and Probit%) also increase proportionally. At the same time, other calculated indicators—actual number (Actual Count), expected number (Expected), and difference (Difference)—also follow this trend. The mortality rates (N) presented in the table emphasize the dose dependence: at a dose of 1200 mg/kg, one guinea pig died; at a dose of 2400 mg/kg, two guinea pigs died; at a dose of 4800 mg/kg, three experimental animals died.
Figure 1 shows the sigmoidal dose-response curves and their 95% confidence intervals, clearly demonstrating the dose-dependent toxicity of the studied drilling fluid. The use of logistic regression to plot the curves confirms that drilling fluid at doses of 2400 mg/kg and 4800 mg/kg has a lethal effect on guinea pigs. The median lethal dose (LD50) of the drilling fluid was 2,069.24 mg/kg (Standard Error: 776.16). The 95% confidence interval ranged from 1,211.04 to 5,100.73 mg/kg. In this case, the logarithm Log10[LD50] was 3.3158, with a Standard Error of 0.1593.
In Table 2, the dose-dependent effects of animal mortality (according to Prozorovsky) are presented by the corresponding probits (Probit (Y)) and weight coefficients (Weight (Z)), whose absolute values correspond to the magnitude of single doses of drilling fluid administered intragastrically. It should be noted that the highest probit values and corresponding weight coefficients are proportional to the highest doses of drilling fluid. Animal mortality also increases in accordance with the rising doses of drilling fluid.
A single intragastric administration of drilling fluid at a dose of 1200 mg/kg resulted in the death (N) of one guinea pig; at a dose of 2400 mg/kg, two guinea pigs died; and at a dose of 4800 mg/kg, three guinea pigs died.
The parameters for calculating lethal doses of drilling fluid after a single intragastric administration showed the following picture. The average lethal dose (LD50) of drilling fluid was 2,587.6094 mg/kg (confidence interval 95%, Lower 95% - 1,294.3861 mg/kg, Upper 95% - 3,880.8327 mg/kg), Standard Error - 587.5657. Other parameters of lethal doses of drilling fluid (mg/kg) were also calculated: LD10 - 742.8991, LD16 - 1,148.3733, LD84 - 4,026.8455, LD90 - 4,432.3197, LD100 - 4,746.4635.
Figure 2 graphically presents the parameters of drilling fluid toxicity, where the dose-effect curves are clearly confirmed by the corresponding regression line curves and the experimental points located on them. At the same time, the use of ever-increasing doses of drilling fluid is accompanied by an increase in probits and the death of experimental animals.
The probit analysis method used allows one to obtain quite important and extensive information on the toxicity and danger of drilling fluid. At present, the probit analysis method is the most adequate and complete method in preventive toxicology for assessing dose-effect dependencies [20-22].
In the survival analysis, we addressed the problem of assessing the survival rates of animals in experimental groups under conditions of a single exposure to different doses of drilling fluid (Figure 3). The Cox proportional hazards model, applied in an acute experiment with a single intragastric administration of drilling fluid, showed that the death of experimental animals occurred on the 8th day (1 animal), 12th day (3 animals), 13th day (1 animal), and 14th day (1 animal).
Using statistical tools embedded in the StatPlus program, we calculated the following parameters. Overall Model Fit: Null model -2 Log Likelihood: 20.3508; Full model -2 Log Likelihood: 17.6682; Chi-square (d.f. = 1): 2.6826; p-value: 0.1015. Coefficients and Standard Errors: Risk Ratio Exp(B): 1.0005; LCL: 0.9999; UCL: 1.0010; Standard Error: 0.0003; p-value: 0.1089.
The Cox regression model used in this survival analysis demonstrated that this mathematical approach adequately reflects the dose-dependent mortality of experimental animals.
In further studies, we analyzed the general condition and behavior of the experimental groups of animals, the nature and severity of toxic manifestations, as well as indicators of eating behavior and body weight dynamics. In guinea pigs from the experimental group, changes were observed in coat condition and grooming behavior compared to the control group, along with alterations in behavioral responses, food intake, and water consumption.
In the experimental animals, the coat became dull, losing its shine and neatness. A notable decrease in general functional and muscular activity was also observed. Food and water consumption showed a tendency to decline, which was accompanied by a decrease in body weight in the experimental groups of guinea pigs (Table 3 and Table 4).
The analysis of feed consumption in the experimental groups, compared to the control group, revealed significant differences. By the 7th day of the experiment, animals that had received drilling fluid at doses of 1200, 2400, and 4800 mg/kg exhibited the lowest feed intake per day. By the 14th day of the experiment, in groups D, E, and F, feed consumption showed a tendency to increase.
A similar trend was observed in the analysis of daily water consumption. A particularly significant decrease in water intake was recorded in groups E and F, where animals received a single dose of drilling fluid at 2400 mg/kg and 4800 mg/kg. However, by the 14th day of the experiment, daily water consumption no longer differed from that of the control group.
The study of body weight dynamics in experimental animals clearly demonstrated dose-dependent effects, influenced by both the duration of the experiment and the dose of drilling fluid administered. On days 7 and 14 of the experiment, in experimental groups E and F, where guinea pigs received drilling fluid at doses of 2400 mg/kg and 4800 mg/kg, body weight was statistically significantly lower compared to the control group. In these experimental groups, body weight was at its lowest on the 7th day of the experiment compared to days 1 and 14.
Assessing weight gain under experimental conditions provides insight into the dynamics of central mechanisms regulating eating behavior, the overall course of metabolic processes, digestive function, and gastrointestinal health. It is well known that hunger and thirst regulation largely depend on the activation of neural structures in various regions of the hypothalamic-limbic-reticulo-cortical system, which play a key role in forming eating behavior, thirst motivation, and the functional integration of the digestive system [23, 24].
The adverse effects of drilling fluid on eating behavior may be associated with intestinal inflammation, a reduction in bile acid synthesis and excretion in the liver, which are essential for digestion and lipid absorption.
In toxicological experiments, the behavioral responses of experimental animals play a crucial role in assessing the functional state of the central and peripheral nervous systems, as well as the excitability of the neuromuscular apparatus. Table 5 and Table 6 present the results of our observations regarding the duration and frequency of rearings in animals from both the control and experimental groups following acute single exposure to drilling fluid.
On days 1 and 7 of the experiment, the number of rearings in the experimental groups (B, C, D, E, F) decreased as the administered dose of drilling fluid increased. However, no such trend was observed on day 14. Notably, in experimental groups E (2400 mg/kg) and F (4800 mg/kg), the number of rearings on day 14 increased compared to day 1.
The study of changes in the duration of rearings in the experiment revealed the following disturbances. On the 1st and 7th days of the experiment, the duration of rearings decreased in the experimental groups (e, f), where the animals received drilling fluid in doses of 2400 mg/kg and 4800 mg/kg. However, on the 14th day of the experiment, no statistically significant changes were found in experimental groups (b, c, d) compared to the control. At the same time, in groups e and f, the duration of rearings exceeded the control group indicators on the 14th day of the experiment.
The observed changes in the behavioral reactions of the experimental animals following a single acute intragastric administration of the drilling fluid indicate its adverse toxic effects. The alterations in the number and duration of rearings largely reflect functional shifts in the experimental animals' bodies. These dynamics closely correlate with numerous changes observed in the functional state of oil company shift workers under various work and rest conditions [25].
The parameters characterizing the frequency and duration of grooming, presented in Figure 4 and Figure 5, also indicate that drilling fluid at high doses (2400 mg/kg and 4800 mg/kg) has a negative impact on the studied indicators. This effect is particularly pronounced on the 1st and 7th days of the experiment. However, by the 14th day, the frequency and duration of grooming show a clear tendency to increase.
The grooming test, which allows for an assessment of the emotional component of animal behavior, also provides an objective evaluation of the quality and quantity of behavioral reactions in the experimental animals.
To assess the toxic effects of the drilling fluid, in addition to studying feeding behavior, body weight dynamics, and behavioral reactions, we also analyzed the activity of enzymes involved in metabolic regulation, as well as the morphological composition of peripheral blood. Blood, as a highly functional system, rapidly responds to various environmental factors, including harmful chemical exposures in industrial settings [26, 27].
The analysis of clinical and biochemical blood parameters, particularly the activity of cytolytic enzymes (ALT, AST, ALP), showed a clear tendency toward increased activity in rats from the experimental groups (Table 7). The highest values were observed in animals that received drilling fluid at doses of 1200 mg/kg, 2400 mg/kg, and 4800 mg/kg. A similar trend was noted in LDH activity, while less pronounced changes were found in C-reactive protein levels and GGTP activity.
The impact of drilling fluid in an acute experiment is likely associated with a disruption of plasma membrane permeability, leading to the release of marker enzymes indicative of hepatocellular damage (ALT, AST, LDH), as well as cholestatic processes (ALP). A study of early metabolic disorders in workers at an oil production enterprise revealed that harmful occupational factors contribute to an increase in cytolytic enzyme activity, activation of lipid peroxidation processes, and elevated levels of medium-molecular peptides in blood serum, confirming the presence of endogenous intoxication syndrome [28]. Long-term exposure to aliphatic hydrocarbons was also associated with a significant increase in ALT, AST, ALP, and GGTP activity in the blood serum of workers [26].
The morphological composition of blood is presented in Table 8. It should be noted that under experimental conditions involving a single acute exposure to drilling fluid, no significant changes in red blood cell parameters were detected. Indicators such as erythrocyte count, color index, hematocrit, mean erythrocyte volume, mean hemoglobin content per erythrocyte, and erythrocyte volume distribution did not show statistically significant changes compared to the control group. However, the mean hemoglobin concentration per erythrocyte tended to increase in the experimental groups in proportion to the administered dose of drilling fluid. Platelet count and thrombocrit levels also increased in the experimental groups. The leukocyte formula did not undergo significant changes; however, a slight upward trend in neutrophils and basophils, as well as a statistically significant increase in monocytes, was observed.
In our research, we also analyzed the content of heavy metals in drilling fluid and drilling cuttings. It was found that the lead concentration in the drilling fluid was 0.073±0.006 mg/L, while arsenic was detected at 0.00014±0.0004 mg/L. In the drilling cuttings, lead content was 13.22±3.45 mg/kg, and manganese was 77.6±0.17 mg/kg. These values were determined using the atomic absorption spectroscopy method.
According to the engineering and technical personnel working at the oil extraction enterprise, the composition of the drilling fluid included the following components: bentonite clay (60 kg/m³), lime (8 kg/m³), ferrochrome lignosulfonate (12 kg/m³), carboxymethylcellulose (5 kg/m³), caustic soda (3 kg/m³), and barium sulfate (BaSO₄) (90 kg/m³).
Additionally, we studied the chemical composition of drilling cuttings using the atomic emission spectroscopy method. The analysis revealed that the drilling cuttings (%) contained phosphorus oxide (P₂O₅ – M=0.114, m=0.006992), silicon dioxide (SiO₂ – M=33.79, m=2.023995), calcium oxide (CaO – M=20.51, m=1.412209), sodium oxide (Na₂O – M=1.104, m=0.083293), and potassium oxide (K₂O – M=0.756, m=0.04402).
Of particular interest is the presence of heavy metals in the drilling cuttings, which exhibited a broad spectrum including arsenic, barium, cadmium, chromium, copper, manganese, nickel, lead, and zinc (Table 9). The luminescent-bituminological analysis of drilling cuttings samples revealed the presence of the following components: LB – light bitumen, OB – oily bitumen, RB – resinous bitumen, OAB – oily-asphaltene bitumen, and RAB – resinous-asphaltene bitumen.
4. Discussion
The obtained results convincingly demonstrate that the drilling fluid has an adverse effect on adult guinea pigs. Using modern methods for estimating average lethal doses (probit analysis method), we scientifically substantiated the lethal doses of the drilling fluid (LD16, LD50, LD84, LD100) for a single intragastric administration, as well as indicators of the potential danger of acute poisoning (S, R), which were calculated based on animal mortality data. The application of the Cox proportional hazards model allowed us to determine the time of death and survival rates of the experimental animals. Mortality in this experiment was dose-dependent and was highest in the groups that received the drilling fluid in doses of 2400 mg/kg and 4800 mg/kg.
Acute single exposure to the drilling fluid by intragastric administration led to significant changes in the general condition of the experimental animals, accompanied by a decrease in food and water intake, disruption of behavioral responses (such as the number and duration of rearings), and changes in the emotional component (grooming behavior). The dose-dependent toxic effect of the drilling fluid was also confirmed by the dynamics of body weight gain, changes in cytolytic enzyme activity, and peripheral blood parameters. The identified characteristics of the general toxic effect of the drilling fluid in acute single exposure conditions indicate its systemic toxicity and potential hazard.
A review of the global literature on this topic has shown that a significant number of drilling fluids and drilling waste pose little threat to the environment and worker health based on their chemical composition and toxicity levels. However, some components used in drilling fluid formulations are highly toxic and dangerous to aquatic and marine fauna, mammals, and humans [29,30,31,32]. As demonstrated by both our own observations and literature data, the methodology for assessing the toxicity and hazards of drilling fluids and drilling waste should be comprehensive, incorporating studies not only on aquatic organisms and plant biocenoses but also on mammals.
The primary purpose of using drilling fluids in oil production is to control formation damage, maintain wellbore stability, transport drilling fluid, and lubricate and cool the drill bit. Therefore, operators often use a wide range of chemical substances added to drilling fluids to enhance their effectiveness. Drilling fluids mainly consist of bentonite and various additives, such as fluid loss regulators, shale swelling inhibitors, corrosion inhibitors, alkalinity regulators, and weighting agents [33]. Environmental contamination with drilling fluid and drilling cuttings leads to the accumulation of heavy metals in soil, vegetation, and water bodies, as well as polycyclic aromatic hydrocarbons in the air [34], which can have toxic effects on oil workers and populations living in oil and gas production regions.
One of the main components of drilling fluid is bentonite, a clay with many industrial and household applications. Bentonite is a mixture of minerals and therefore does not have a specific molecular formula or molecular weight, but it predominantly consists of oxides of sodium, potassium, iron, calcium, magnesium, and silicon [35]. Literature data on the toxicology and epidemiology of bentonite are extensive. In the vast majority of cases, bentonite is considered non-toxic, as determined by experimental and clinical observations. According to the National Industrial Chemicals Notification and Assessment Scheme (NICNAS) developed by the Australian government, bentonite is considered to pose a low risk to human health. Moreover, the European Food Safety Authority (EFSA, 2007) included bentonite in the Register of Feed Additives [36]. However, bentonite has been found to cause pulmonary alveolar proteinosis [37]. Some studies mentioning bentonite exposure also include combined exposure to other materials, making their relevance unclear [38].
In the 1970s and 1980s, assessing the quality of chemical reagents used for drilling and their toxicological properties was relatively straightforward, as they were either produced domestically (in the Soviet Union) or imported under government orders. Thus, drilling operations were carried out exclusively by domestic enterprises. However, with the transition to a market economy, this system of organizing oil production ceased to exist [39]. Today, a significant share of drilling operations in Kazakhstan is conducted by foreign companies, and most chemical reagents and drilling fluid materials are imported from abroad. The toxicological characteristics, chemical composition, and environmental and occupational hazards of these substances are often unknown and largely classified by manufacturers. The only available regulatory documents for these products are foreign-style safety data sheets (MSDS), which occasionally provide maximum allowable workplace concentrations but lack a complete list of toxicometric indicators.
Our laboratory research revealed the presence of heavy metals such as lead and arsenic in the drilling fluid. Additionally, the composition of the drilling fluid included bentonite clay, lime, ferrochrome lignosulfonate, carboxymethylcellulose, caustic soda, and BaSO₄. These chemical substances significantly contribute to the toxicity and hazard of the drilling fluid.
Furthermore, a detailed chemical analysis of the drilling cuttings showed the presence of phosphorus oxide, silicon dioxide, calcium oxide, sodium oxide, and potassium oxide. A broad spectrum of heavy metals, including arsenic, barium, cadmium, chromium, copper, manganese, nickel, lead, and zinc, was identified. The presence of bituminous components in the drilling cuttings was also established.
The results of our studies, conducted on guinea pigs under acute experimental conditions, convincingly demonstrate the toxicity and hazards of the drilling fluid, manifested through systemic general toxic and specific effects. The average lethal dose and survival rates of the experimental animals were scientifically substantiated, feeding behavior patterns and functional response dynamics were characterized, and changes in cytolytic enzyme activity and peripheral blood composition were identified.
5. Conclusions
The results of our study confirm the systemic toxic effects of drilling fluid on mammals, demonstrating dose-dependent changes in metabolic and physiological parameters. Acute exposure to drilling fluid led to hepatocellular damage, altered feeding behavior, and disturbances in hematological indicators, emphasizing its potential risks to both environmental and occupational health.
Given the widespread use of drilling fluids in the oil and gas industry, our findings highlight the necessity of strengthening environmental monitoring systems, particularly in assessing soil and water contamination in oil-producing regions. Developing standardized toxicological indicators and refining laboratory monitoring techniques will provide critical data for occupational safety measures and regulatory policies in the industry.
Author Contributions
Conceptualization, A.M., Zh.K., S.B.; Methodology, A.M., Zh.K.; Formal Analysis, K.B., Zh.K., K.Sh., A.K.; Investigation, K.B., Zh.K., L.S., G.K., K.Sh.; Data Curation, K.B., G.K., F.R.; Writing—Original Draft Preparation, A.M., K.B., Zh.K., S.B.; Writing—Review and Editing, K.B., Zh.K., A.K., S.B.; Supervision, A.M.; Project Administration, A.M.; Funding Acquisition, A.M. All authors have read and agreed to the published version of the manuscript.
Funding
The research was funded by the Science Committee of the Ministry of Science and Higher Education of the Republic of Kazakhstan (Grant No. AR19676915).
Institutional Review Board Statement
"The study was conducted in accordance with the Declaration of Helsinki and approved by the Institutional Local Bioethics Committee of West Kazakhstan Medical University (protocol code 3/14, approval date: 15 March 2023)."
Informed Consent Statement
Not applicable.
Data Availability Statement
Data are available from the corresponding author upon request.
Conflicts of Interest
The authors declare no conflicts of interest.
References
- Mamyrbayev, A.A. Harmful Chemicals at Enterprises for the Extraction and Processing of Hydrocarbon Raw Materials; Editorial Publishing Center of West Kazakhstan Marat Ospanov Medical University: Aktobe, Kazakhstan, 2021; p. 352. [Google Scholar]
- Mamyrbayev, A.A. Medical and Ecological Assessment of Population Health in Hydrocarbon Production Regions; Aimaganbet, A.A. IE: Aktobe, Kazakhstan, 2019; p. 170.
- Murtaza, M.; Tariq, Z.; Kamal, M.S.; Rana, A.; Saleh, T.A.; Mahmoud, M.; Alarifi, S.A.; Syed, N.A. Improving Water-Based Drilling Mud Performance Using Biopolymer Gum: Integrating Experimental and Machine Learning Techniques. Molecules 2024, 29(11), 2512. [Google Scholar] [CrossRef]
- Agwu, O.E.; Akpabio, J.U.; Ekpenyong, M.E.; Inyang, U.G.; Asuquo, D.E.; Eyoh, I.J.; Adeoye, O.S. A Critical Review of Drilling Mud Rheological Models. J. Pet. Sci. Eng. 2021, 203, 108659. [Google Scholar] [CrossRef]
- Asadimehr, S. Narrative Review Article: Investigating the Use of Drilling Mud and Reasons for Its Use. Eurasian J. Chem. Med. Pet. Res. 2024, 3, 543–551. [Google Scholar]
- Baloyan, B.M.; Chudnova, T.A.; Shapovalov, D.A. Environmental Justification of the Use of Drill Cuttings in the Soil. Int. Agric. J. 2019, 1, 50–55. [Google Scholar] [CrossRef]
- Dzhanzakov, I.I.; Medetov, Sh.M.; Imangalieva, G.E.; Bashirov, V.D.; Sagitov, R.F. Analysis of the Environmental Status and Measures for Safety and Environmental Protection in Oil and Gas Producing Areas. IOP Conf. Ser.: Mater. Sci. Eng. 2019, 560, 012089. [Google Scholar] [CrossRef]
- Al-Hameedi, A.T.T.; Alkinani, H.H.; Alkhamis, M.M.; Dunn-Norman, S. Utilizing a New Eco-Friendly Drilling Mud Additive Generated from Wastes to Minimize the Use of the Conventional Chemical Additives. J. Pet. Explor. Prod. Technol. 2020, 10, 3467–3481. [Google Scholar] [CrossRef]
- Xu, T.; Wang, L.; Wang, X.; Li, T.; Zhan, X. Heavy Metal Pollution of Oil-Based Drill Cuttings at a Shale Gas Drilling Field in Chongqing, China: A Human Health Risk Assessment for the Workers. Ecotoxicol. Environ. Saf. 2018, 165, 160–163. [Google Scholar] [CrossRef]
- Al-Haleem, A.A.; Awadh, S.M.; Saeed, E.A. Environmental Impact from Drilling and Production of Oil Activities: Sources and Recommended Solutions. In Proceedings of the 2nd International Conference on Iraq Oil Studies, 11–12 December 2013; pp. 46–50. [Google Scholar]
- Wollin, K.M.; Damm, G.; Foth, H.; Freyberger, A.; Gebel, T.; et al. Critical Evaluation of Human Health Risks Due to Hydraulic Fracturing in Natural Gas and Petroleum Production. Arch. Toxicol. 2020, 94, 967–1016. [Google Scholar] [CrossRef]
- Xiong, D.; Han, X. Particular Pollutants, Human Health Risk and Ecological Risk of Oil-Based Drilling Fluid: A Case Study of Fuling Shale Gas Field. Environ. Geochem. Health 2023, 45, 981–995. [Google Scholar] [CrossRef]
- Bamberger, M.; Oswald, R.E. Long-Term Impact of Unconventional Drilling Operations on Human and Animal Health. J. Environ. Sci. Health A 2015, 50, 447–459. [Google Scholar] [CrossRef]
- Okoro, E.E.; Ochonma, C.; Sanni, S.E.; Omeje, M.; Igwilo, K.C.; Olawole, O.C. Risk Assessment of Human Exposure to Radionuclides and Heavy Metals in Oil-Based Mud Samples Used for Drilling Operation. Int. J. Environ. Health Res. 2022, 32(5), 972–983. [Google Scholar] [CrossRef]
- McLoone, P.; Dyussupov, O.; Nurtlessov, Z.; Kenessariyev, U.; Kenessary, D. The Effect of Exposure to Crude Oil on the Immune System: Health Implications for People Living Near Oil Exploration Activities. Int. J. Environ. Health Res. 2021, 31(7), 762–787. [Google Scholar] [CrossRef] [PubMed]
- Behrens, B.; Schlosser, L. Beitrag zur Bestimmung der LD50 und der Berechnung ihrer Fehlerbreite. Arch. Exp. Pathol. Pharmacol. 1957, 250(1), 59–72. [Google Scholar] [CrossRef]
- Belenkiy, M.L. Elements of Quantitative Assessment of Pharmacological Effect; Leningrad, Russia, 1963; p. 151.
- Finney, D.J. Probit Analysis, 3rd ed.; Cambridge University Press: Cambridge, UK, 1980; pp. 154–196. [Google Scholar]
- Prozorovsky, V.B. Statistical Processing of Pharmacological Research Results. Psychopharmacol. Biol. Narcology, 2090. [Google Scholar]
- Sitnikova, Y.A.; Rogozhnikova, Y.P.; Mardanly, S.G.; Kiselyeva, V.A. Study of Acute Toxicity of Nifuroxazide Preparations in Suspension Form. Toxicol. Bull. 2019, 1(154), 29–33. [Google Scholar]
- Shadrin, P.V.; Batuashvili, T.A.; Simutenko, L.V.; Neugodova, N.P. Calculation of the Average Lethal and Minimum Lethal Dose of Drugs Using the Biometric Software CombiStats. Bull. Sci. Cent. Exp. Med. Prod. 2021, 11(2), 135–142. [Google Scholar]
- Shitikov, V.K.; Malenev, A.L.; Gorelov, V.A.; Bakiyev, A.G. Dose-Effect Models with Mixed Parameters on the Example of Assessing the Toxicity of the Venom of the Common Viper Vipera berus. Princip. Ecol. 2018, 2, 150–160. [Google Scholar] [CrossRef]
- Gerasimov, D.V. Analysis of Functional Changes in the Central Nervous System of Rodents with a Single Receipt of a Mixed Oxide Depleted Uranium with Water. Toxicol. Bull. 2017, 1, 42–46. [Google Scholar]
- Buresh, Y.A.; Bureshova, O.; Huston, D. Techniques and Basic Experiments for Study of Brain and Behavior; Vysshaya Shkola: Moscow, Russia, 1991. [Google Scholar]
- Korneyeva, Y.A.; Simonova, N.N.; Korneyeva, A.V.; Dobrynina, M.A. Functional States of Shift Personnel of an Oil and Gas Exploration Enterprise in the Southeast of the Russian Federation. Hyg. Sanit. 2024, 103, 44–50. [Google Scholar] [CrossRef]
- Zemlyanova, M.A.; Koldibekova, Y.V.; Peskova, E.V.; Ukhabov, V.M. Changes in Biochemical Parameters in Workers Exposed to Chemical Production Factors (Heptane and Hexane). Occup. Med. Ind. Ecol. 2021, 61, 379–384. [Google Scholar] [CrossRef]
- Gorokhova, A.G.; Kizichenko, N.V.; Ulanova, E.V.; Korsakova, T.G. On the Toxic Effect of m-Bromoaniline Sulfate on the Blood System. Occup. Med. Ind. Ecol. 2021, 61, 187–190. [Google Scholar] [CrossRef]
- Gimranova, G.G.; Timasheva, G.V.; Bakirov, A.B.; Beygul, N.A.; et al. Diagnostic Markers of Early Metabolic Disorders in Workers of an Oil Producing Enterprise. Occup. Med. Ind. Ecol. 2022, 62(2), 130–135. [Google Scholar] [CrossRef]
- Antia, M.; Ezejiofor, A.N.; Obasi, C.N.; Orisakwe, O.E. Environmental and Public Health Effects of Spent Drilling Fluid: An Updated Systematic Review. J. Hazard. Mater. Adv. 2022, 7, 100120. [Google Scholar] [CrossRef]
- Mamyrbayev, A.A.; Baitenov, K.K.; Kulbayeva, A.B. Toxicological Assessment of Drilling Fluid, Drilling Cuttings and Components Included in Their Composition. Pharm. Kazakhstan 2024, 1(252), 323–332. [Google Scholar] [CrossRef]
- Chris, D.I.; Wokeh, O.K.; Téllez-Isaías, G.; Kari, Z.A.; Azra, M.N. Ecotoxicity of Commonly Used Oilfield-Based Emulsifiers on Guinean Tilapia (Tilapia guineensis) Using Histopathology and Behavioral Alterations as Protocol. Sci. Prog. 2024, 107(1), 368504241231663. [Google Scholar] [CrossRef]
- Martin, C.; Nourian, A.; Babaie, M.; Nasr, G.G. Environmental, Health and Safety Assessment of Nanoparticle Application in Drilling Mud – Review. Geoenergy Sci. Eng. 2023, 226, 211767. [Google Scholar] [CrossRef]
- Pan, Y.; Cui, X.; Wang, H.; Lou, X.; Yang, S.; Oluwabusuyi, F.F. Research Progress of Intelligent Polymer Plugging Materials. Molecules 2023, 28, 2975. [Google Scholar] [CrossRef]
- Awaka-Ama, J.J.; Udo, G.J.; Nyong, A.E.; Umanah, I.; Bassey, M.E. Heavy Metals, Polycyclic Aromatic Hydrocarbons, Total Petroleum Hydrocarbons and Total Hydrocarbon Contents in Drilling Mud Effluents from Eastern Obolo Oilfield in the Niger Delta Region of Nigeria. J. Appl. Sci. Environ. Manag. 2024, 28(9), 2849–2854. [Google Scholar] [CrossRef]
- Maxim, L.D.; Niebo, R.; McConnell, E.E. Bentonite Toxicology and Epidemiology - A Review. Inhal. Toxicol. 2016, 28(13), 591–617. [Google Scholar] [CrossRef]
- European Food Safety Authority (EFSA). Scientific Opinion on the Safety and Efficacy of Bentonite (Dioctahedral Montmorillonite) as a Feed Additive for All Animal Species. EFSA J. 2007, 9, 24. [Google Scholar]
- Ghio, A.; Sangani, R.; Roggli, V. Expanding Spectrum of Particle- and Fiber-Associated Interstitial Lung Diseases. Turk. Thorac. J. 2014, 15, 1–8. [Google Scholar] [CrossRef]
- Dehgan, F.; Mohammadi, S.; Sadeghi, Z.; Attarchi, M. Respiratory Complaints and Spirometric Parameters in Workers in Tile and Ceramic Factories. Tanaffos 2009, 8(4), 19–25. [Google Scholar]
- Samutin, N.M.; Vorob’ev, V.O.; Butorina, N.N. Influence of the Oil and Gas Industry on Environmental Safety and Public Health in Khanty-Mansi Autonomous Okrug – Yugra. Hyg. Sanit. 2013, 5, 34–36. [Google Scholar]
Figure 1.
Sigmoidal dose-response curves of drilling fluid (according to Finney).
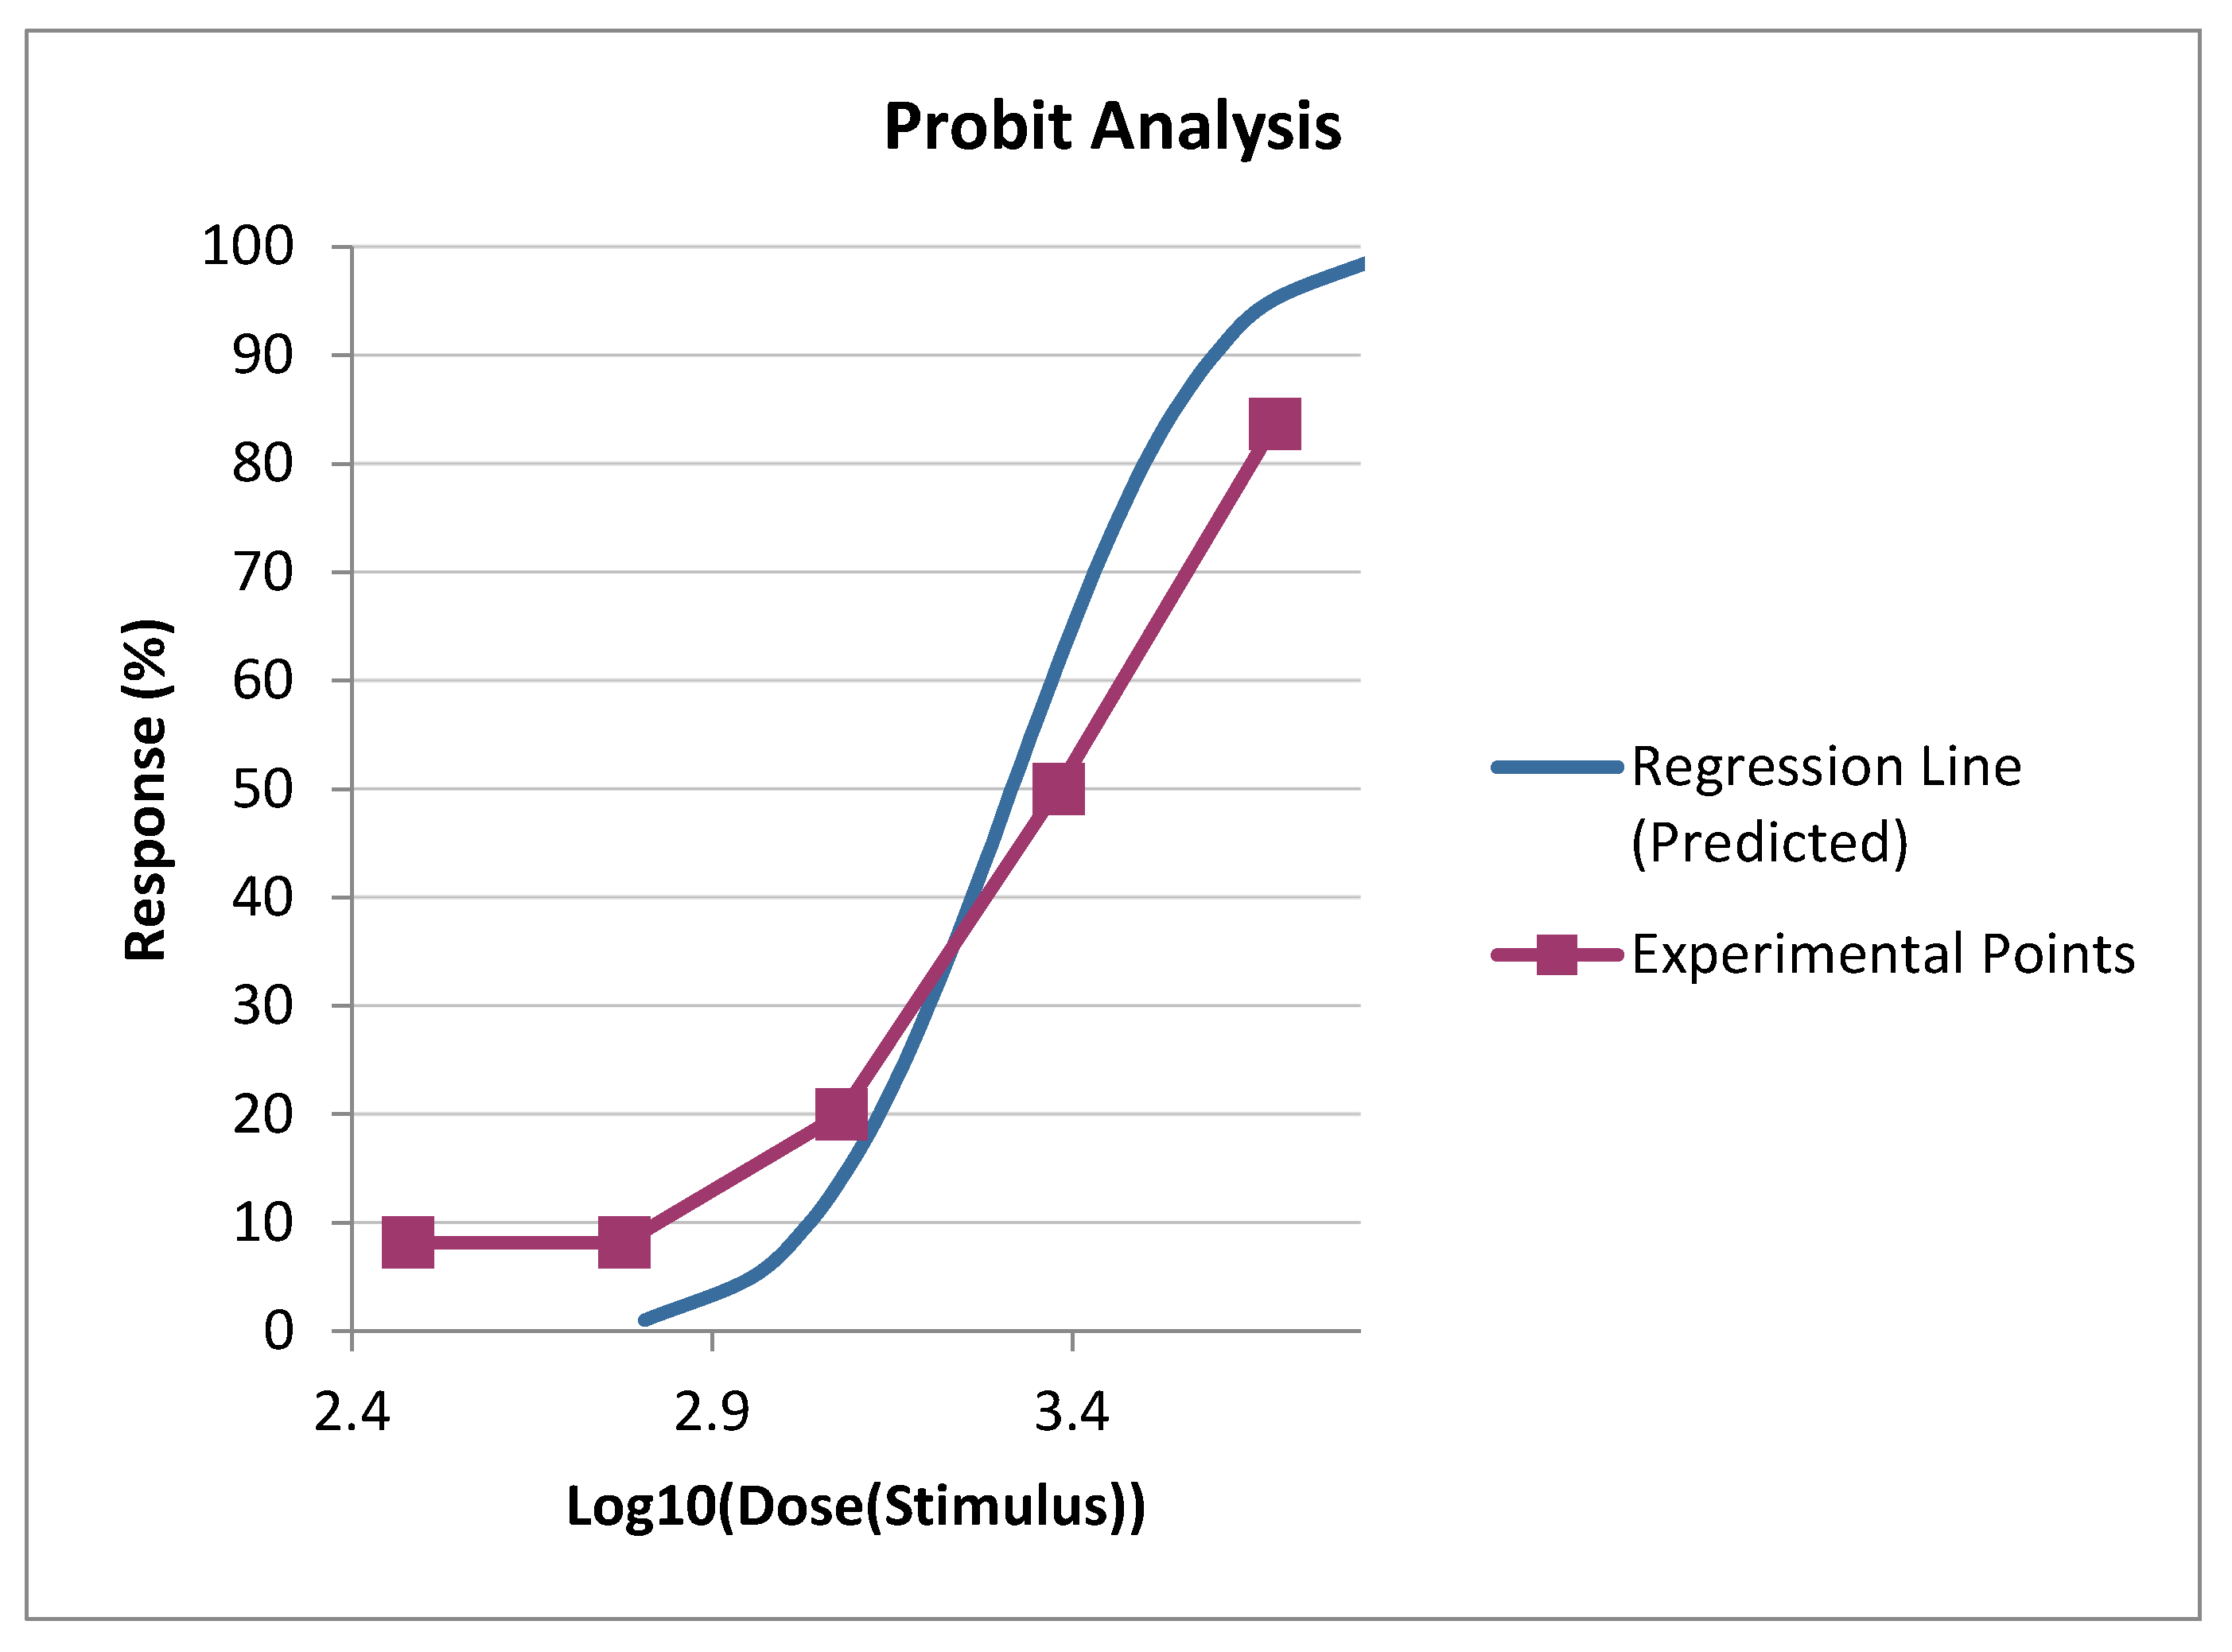
Figure 2.
Sigmoidal dose-response curves of drilling fluid (according to Prozorovsky).
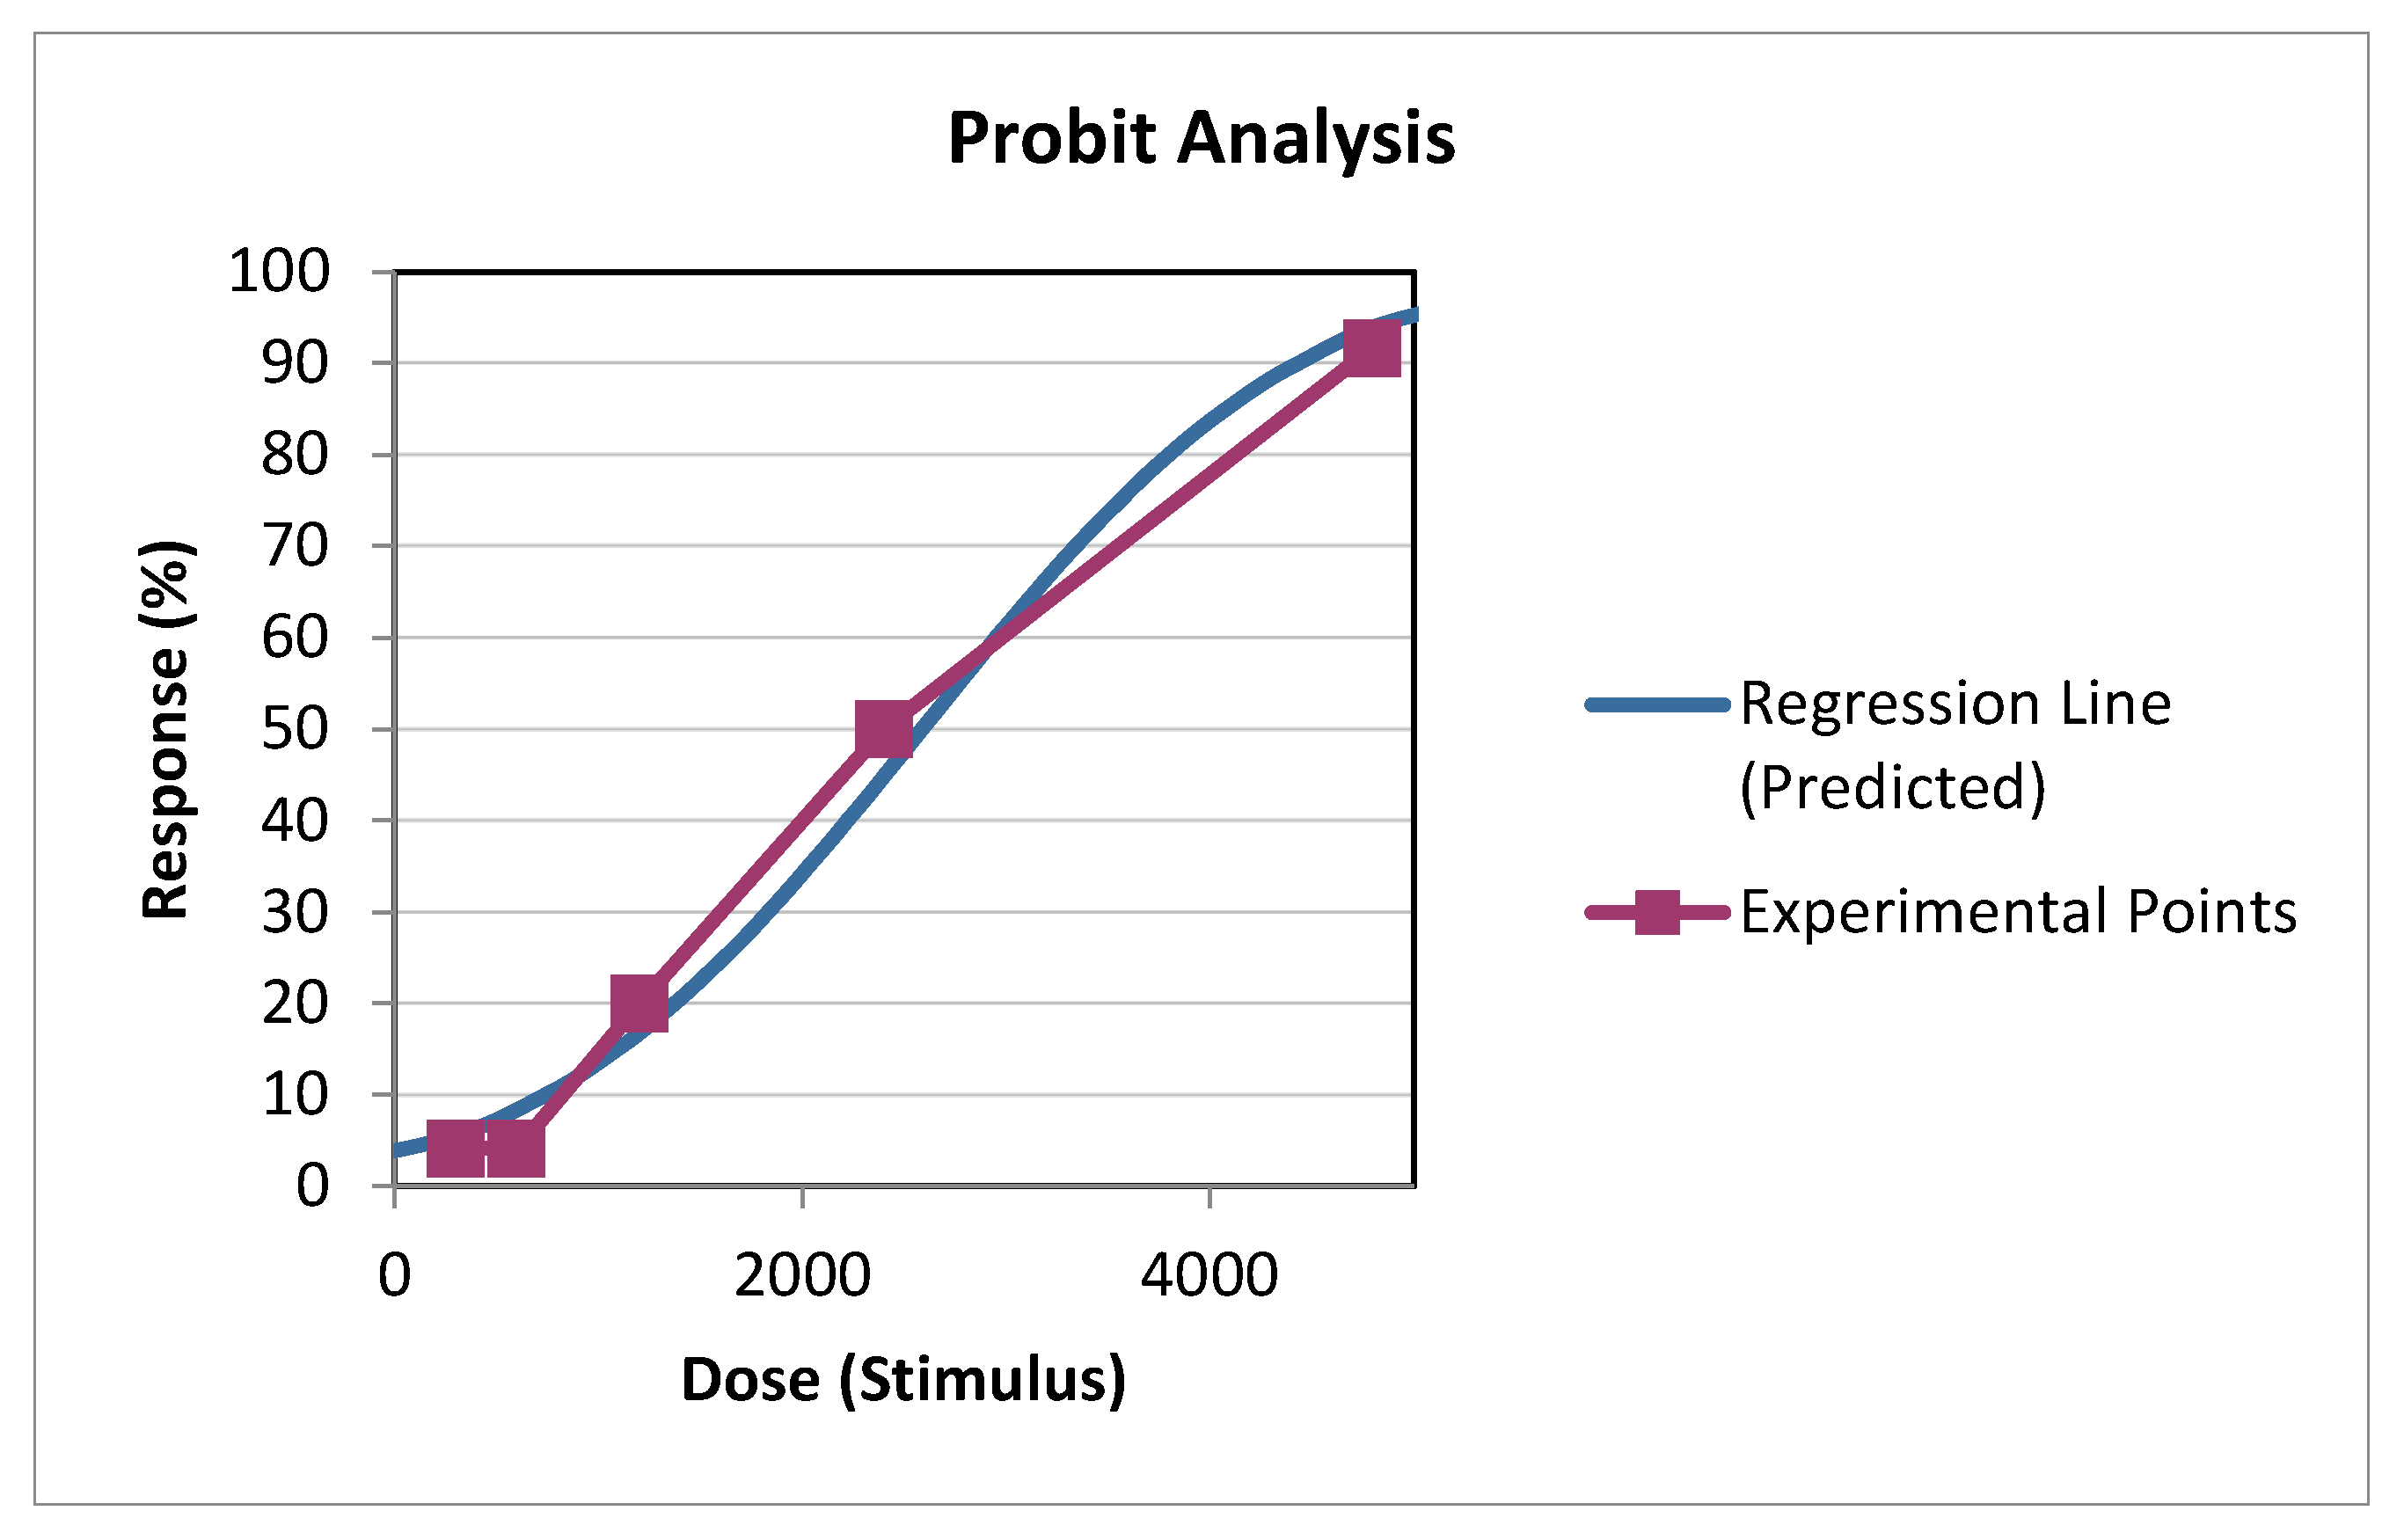
Figure 3.
Cox proportional intensity model.
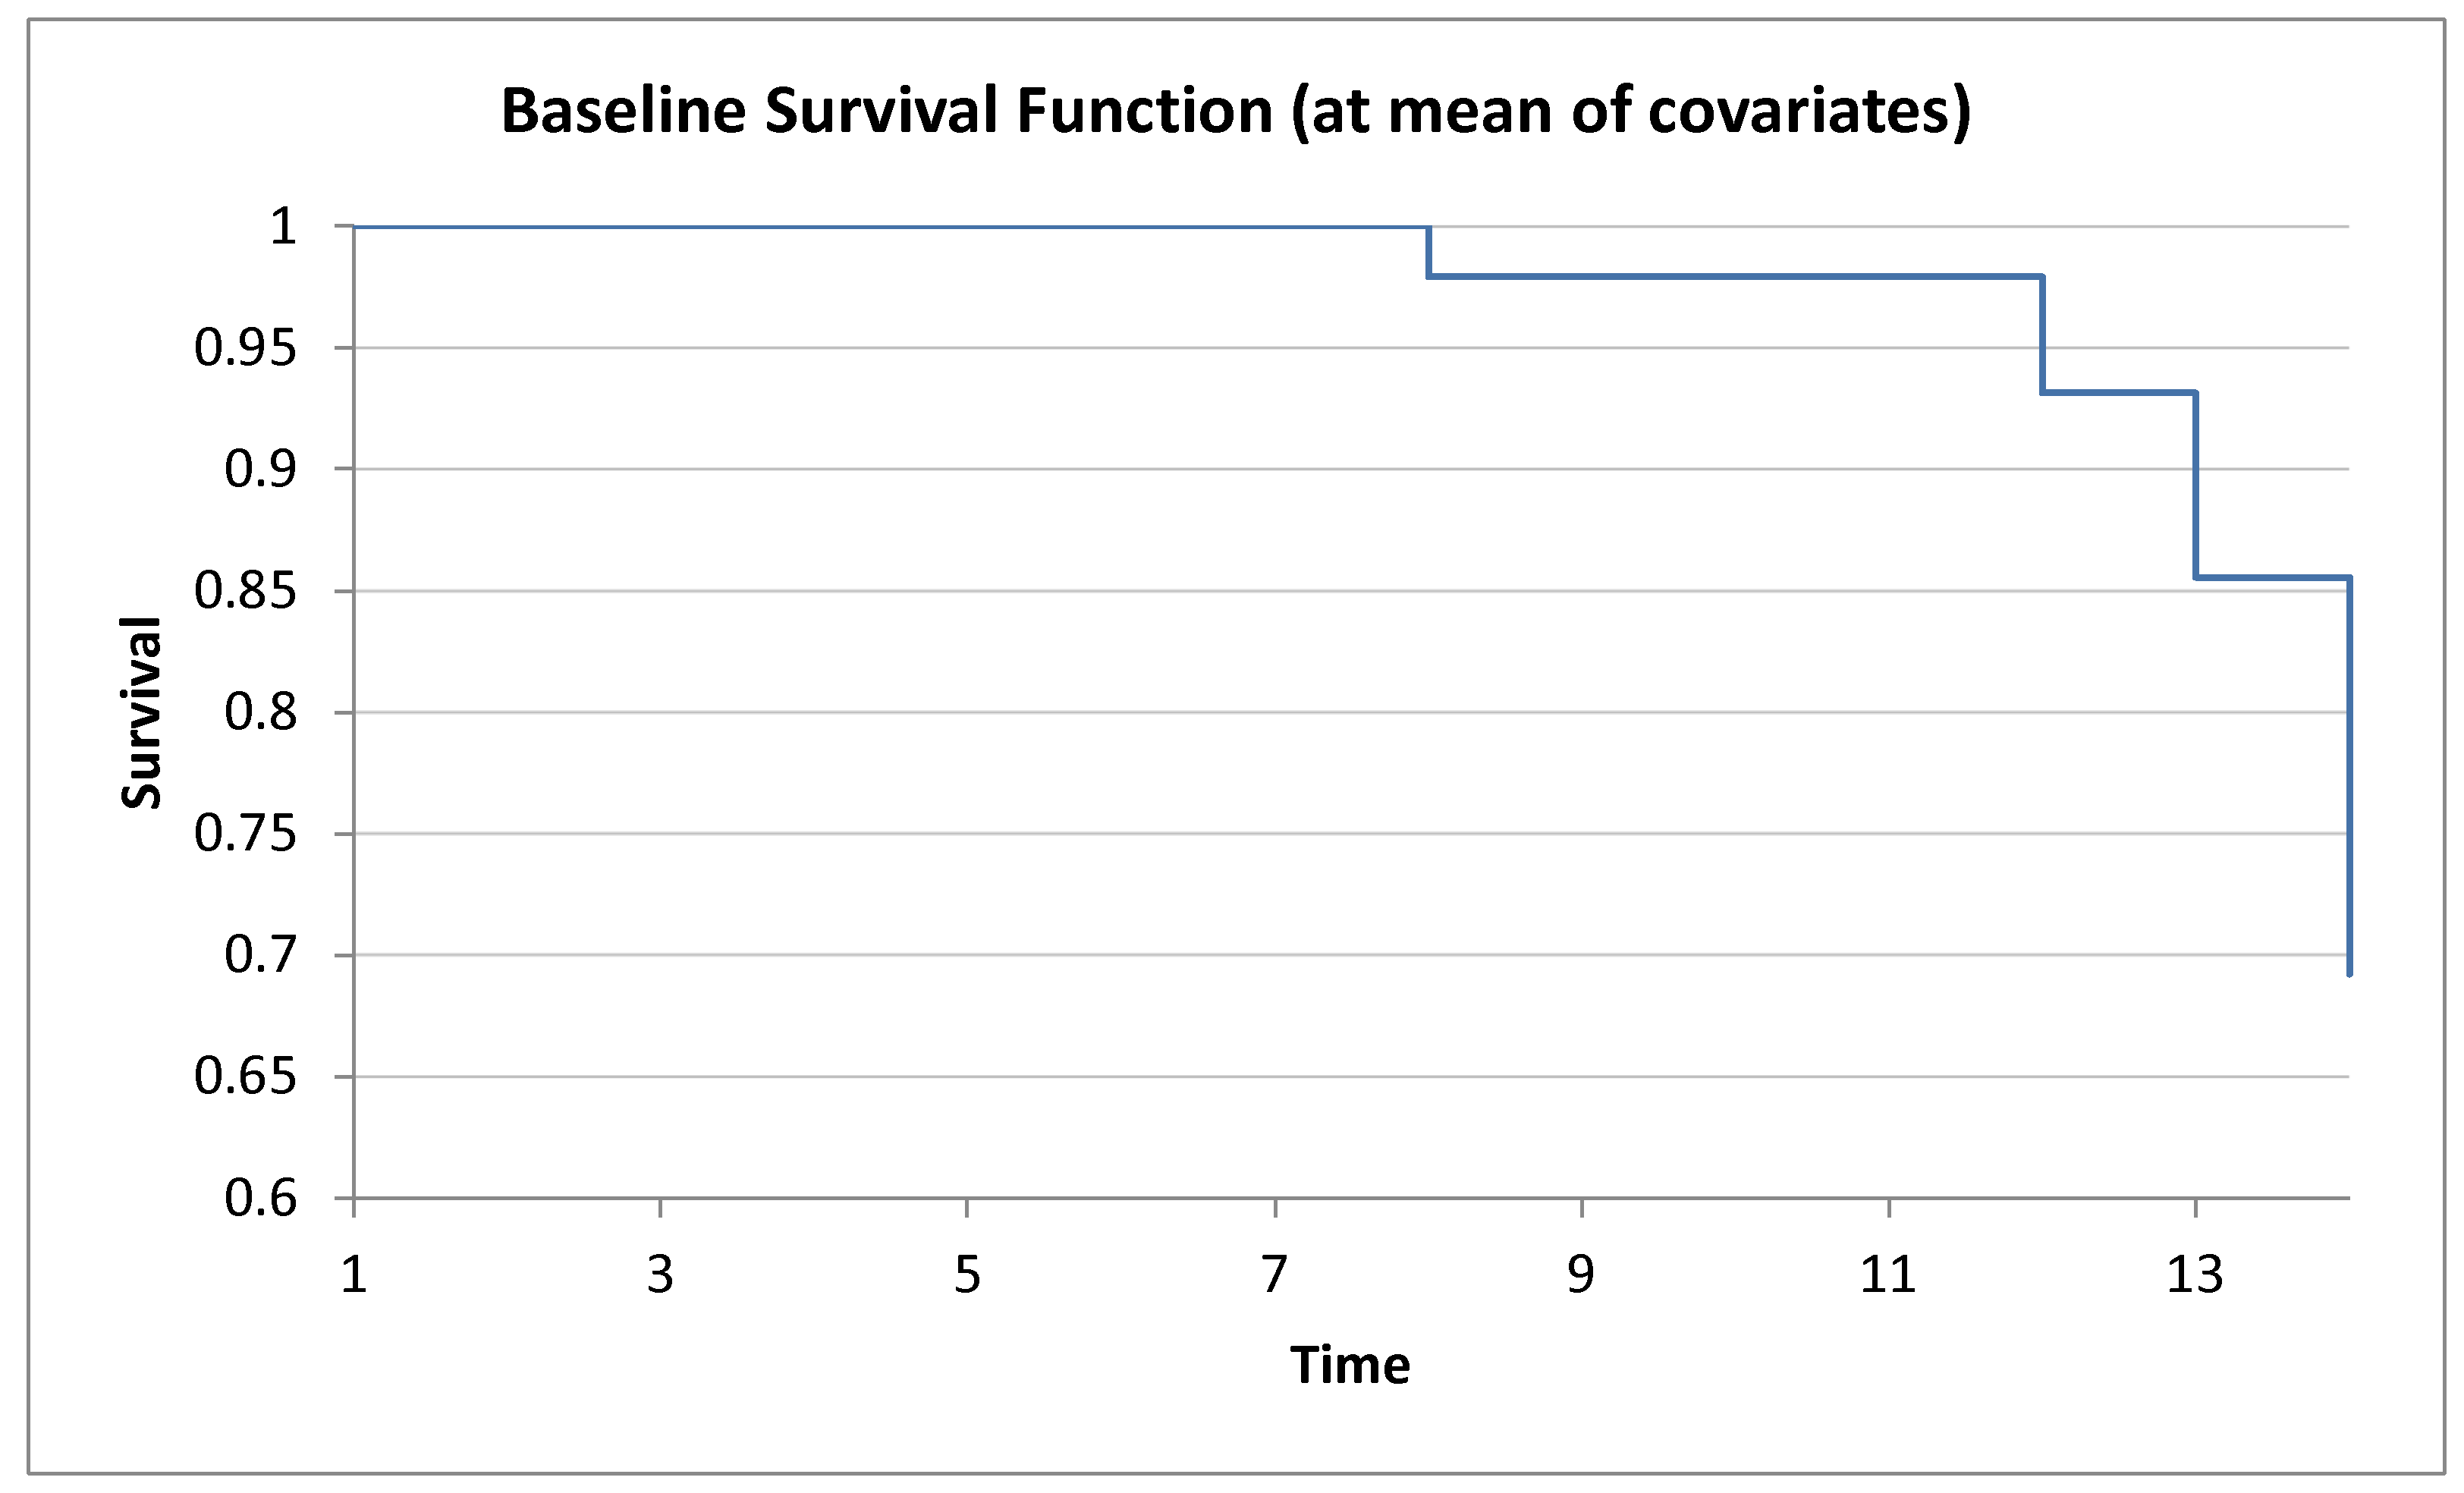
Figure 4.
Grooming frequency.
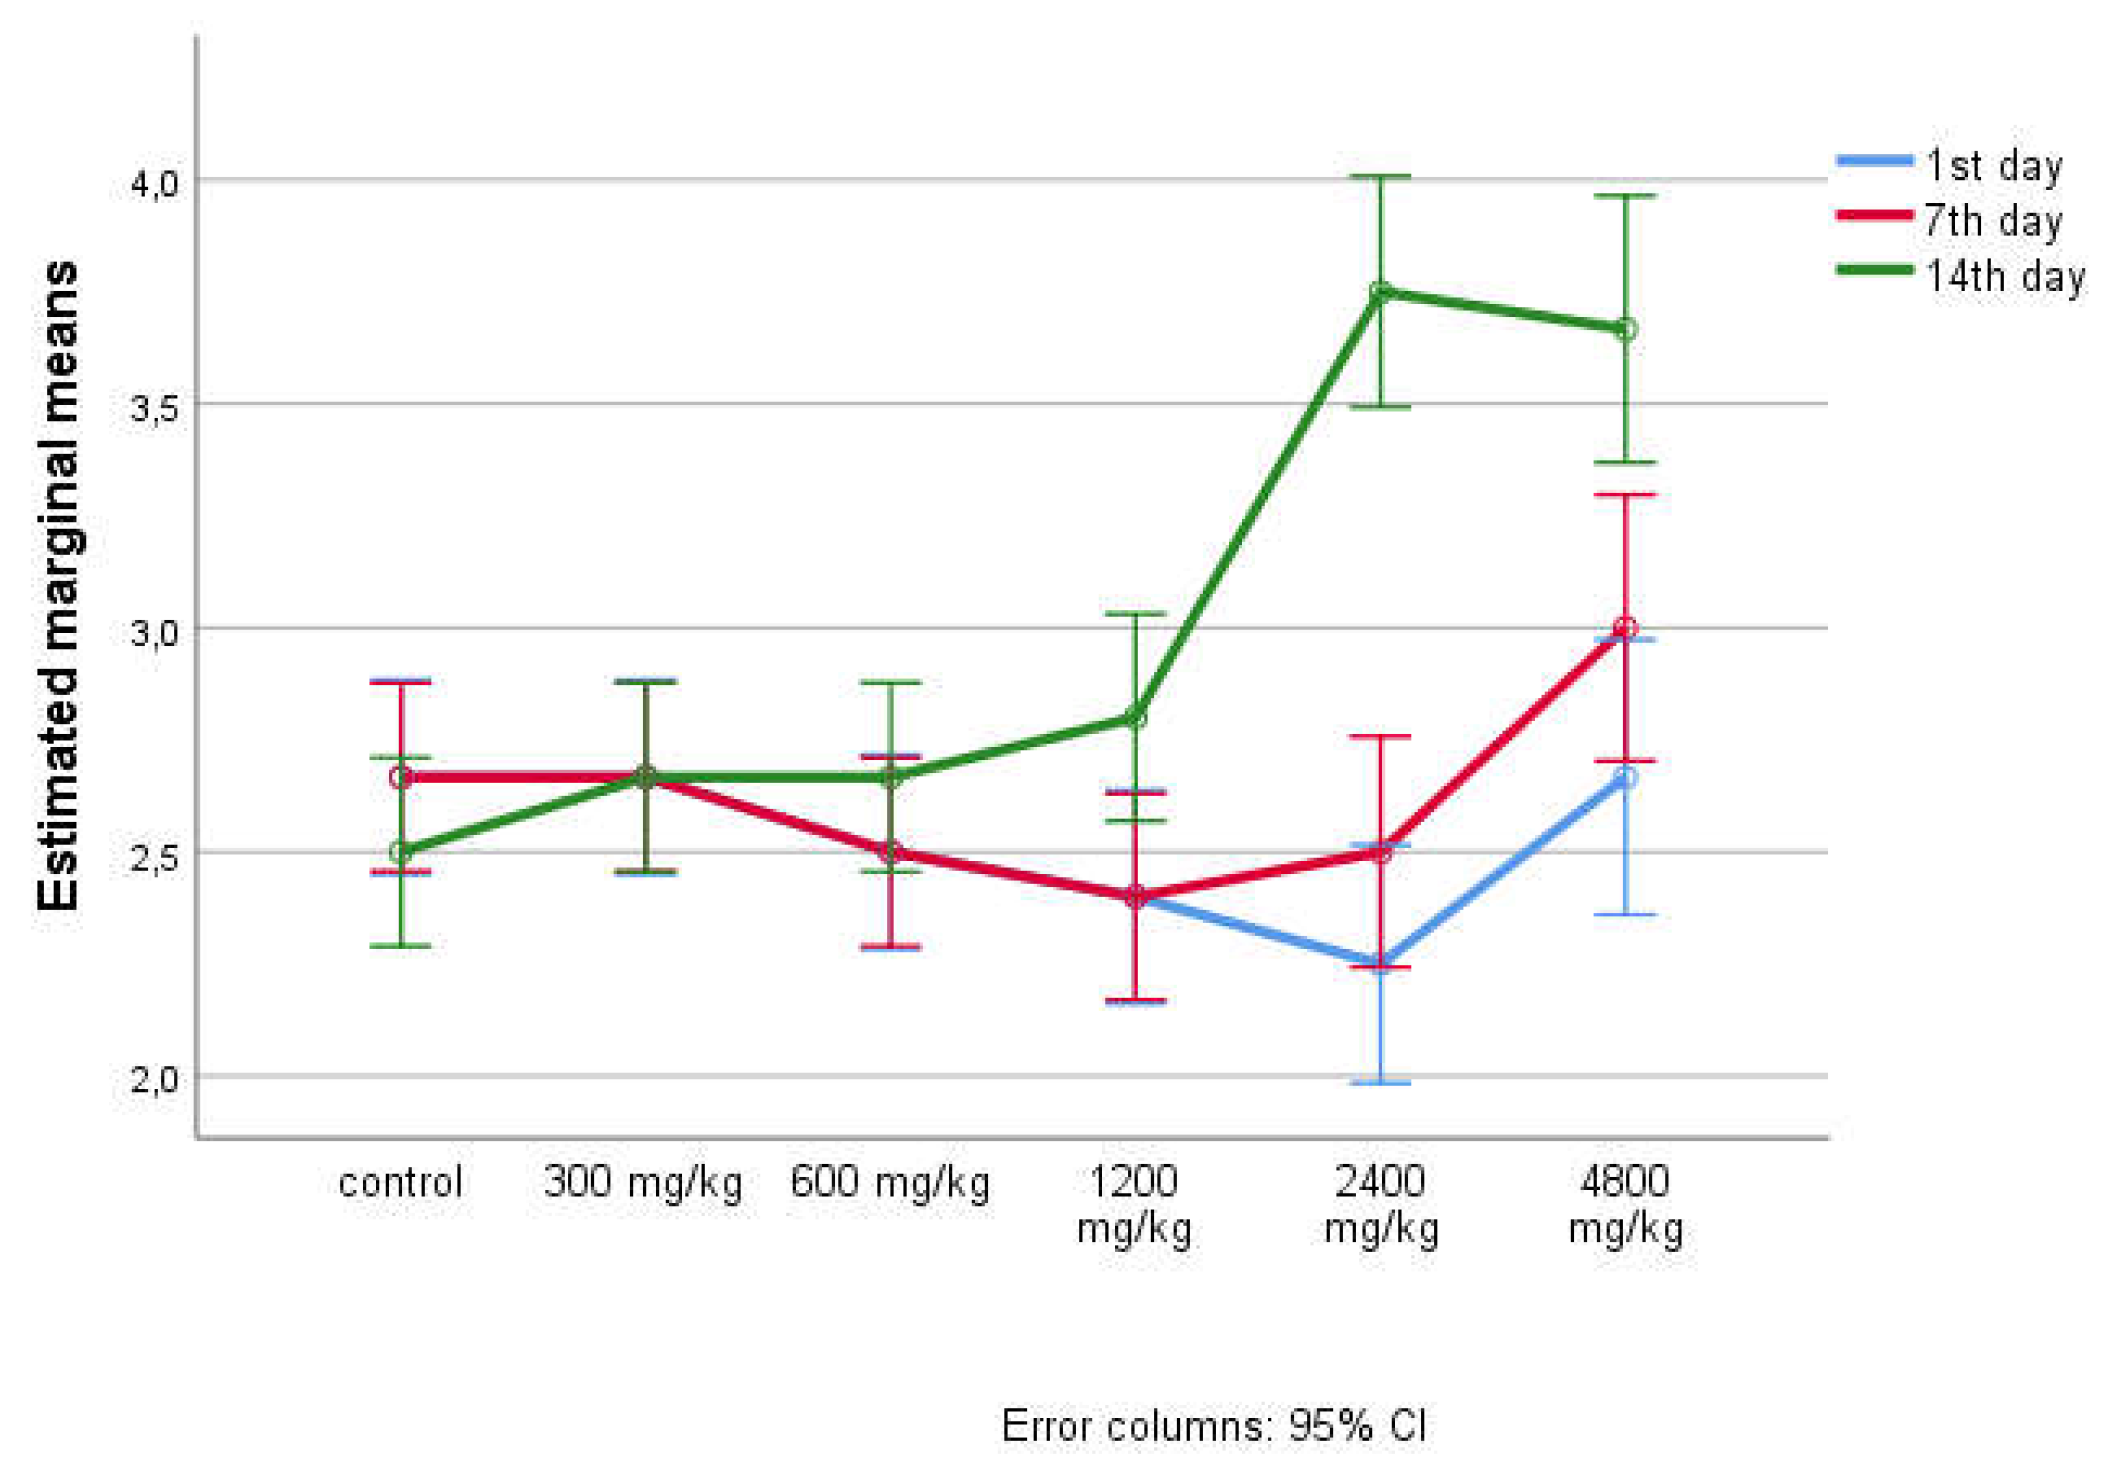
Figure 5.
Duration of grooming.
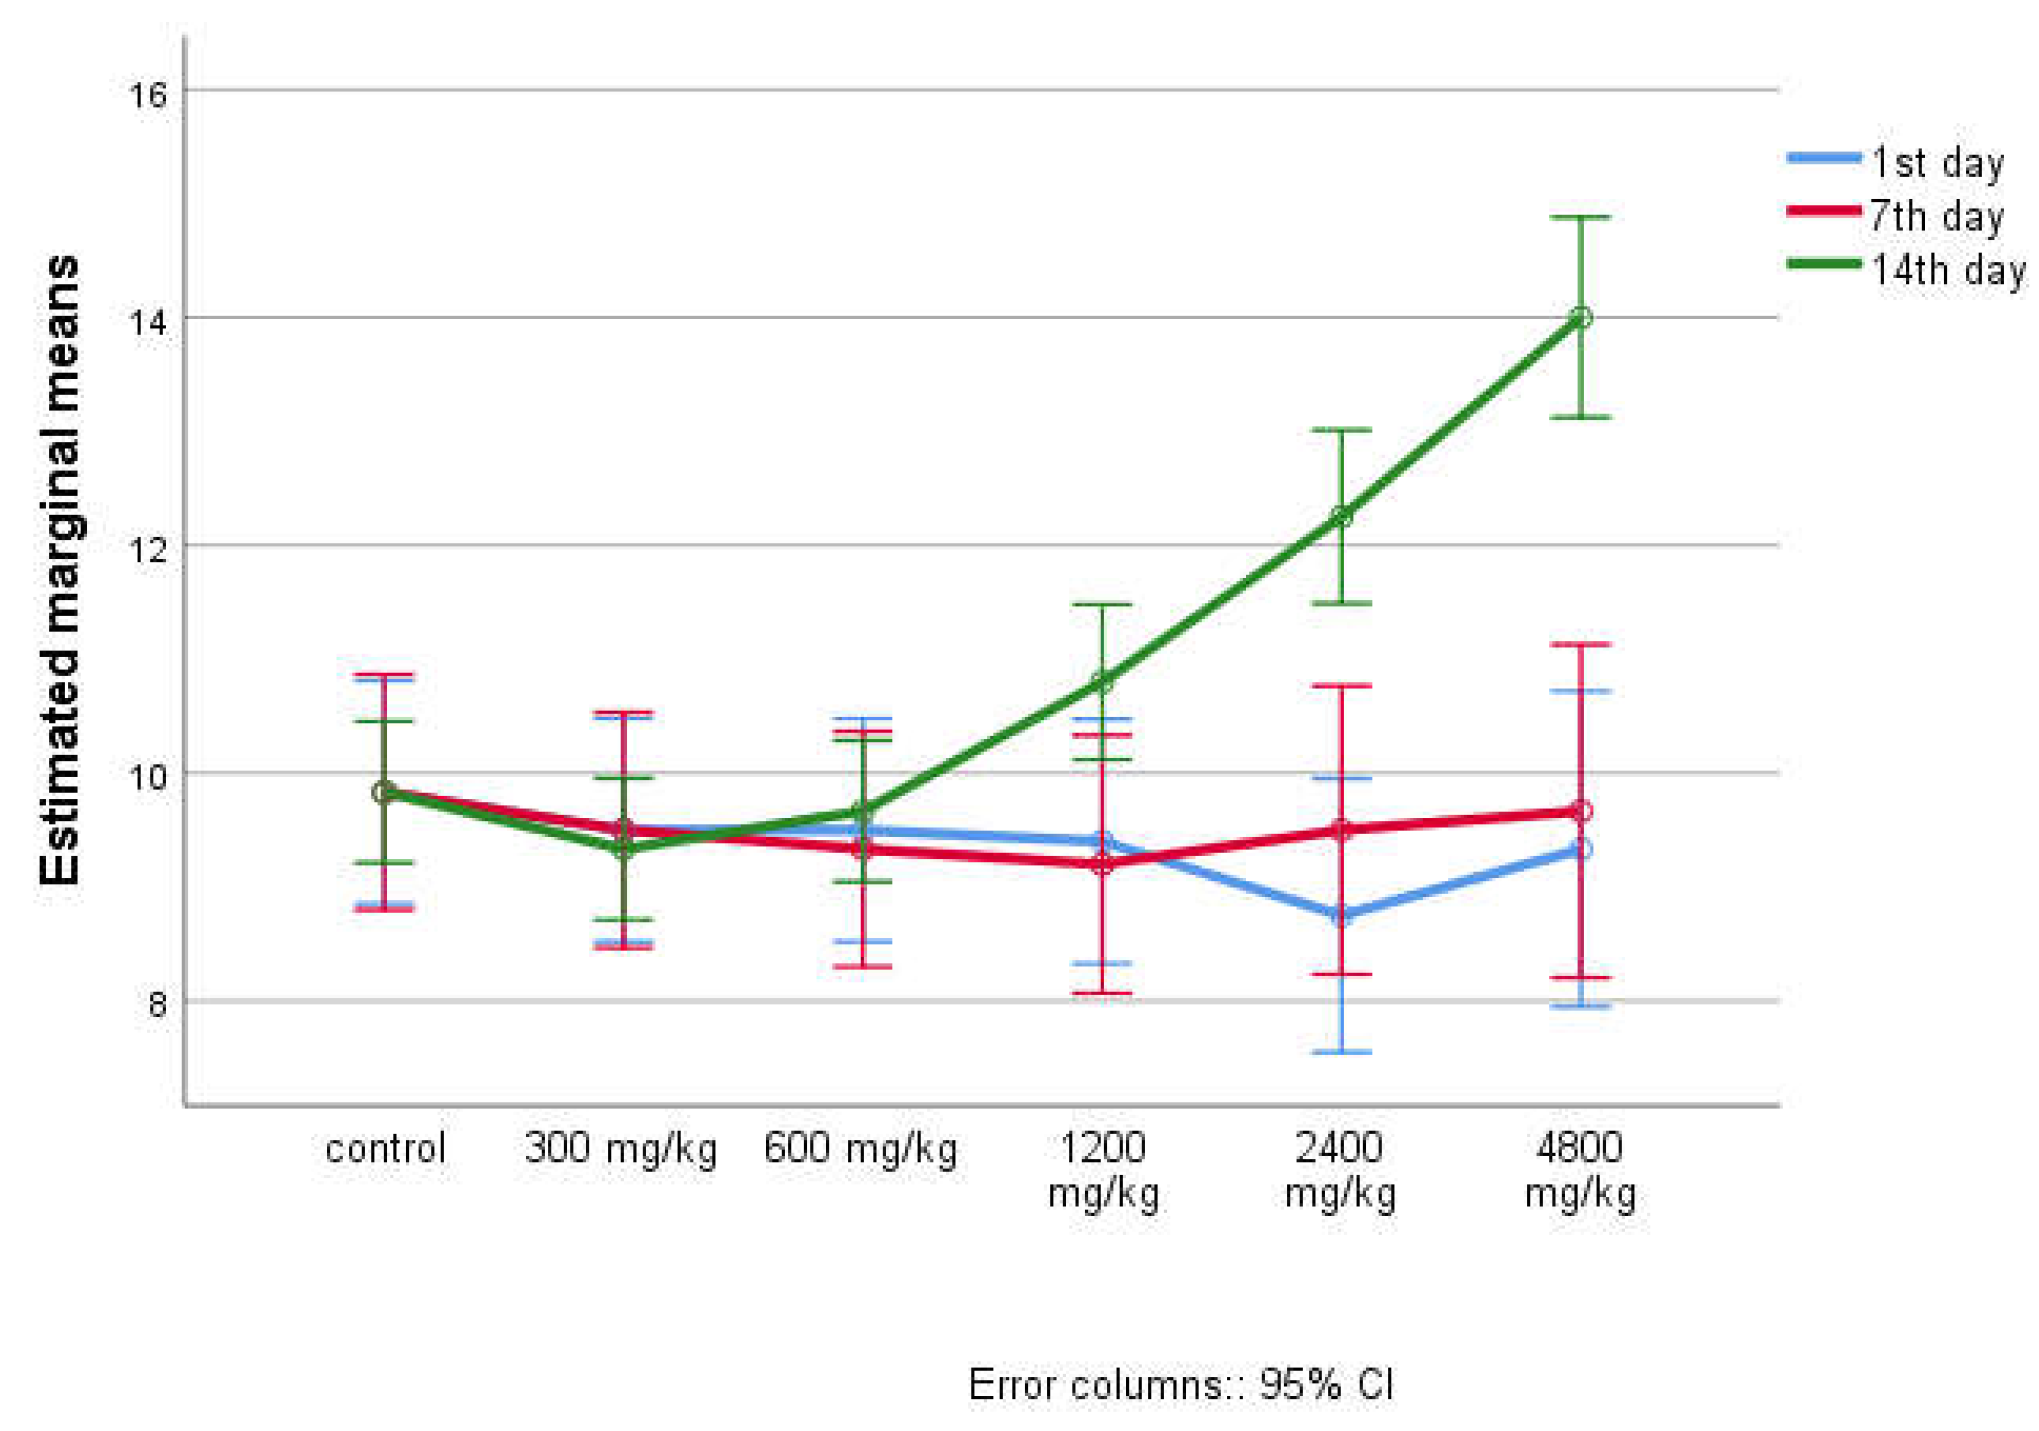

Table 1.
Dose-dependent effects of animal mortality (according to Finney).
| Dose (Stimulus) | Log10[Dose] | Actual % | Probit % | N | Actual Count | Expected | Difference |
| 300.0000 | 2.4771 | 8.1667% | 6.4458E-5 | 6 | 0.4900 | 0.0004 | 0.4896 |
| 600.0000 | 2.7782 | 8.1667% | 0.7056% | 6 | 0.4900 | 0.0423 | 0.4477 |
| 1 200.0000 | 3.0792 | 20.0000% | 14.0025% | 5 | 1.0000 | 0.7001 | 0.2999 |
| 2 400.0000 | 3.3802 | 50.0000% | 61.5618% | 4 | 2.0000 | 2.4625 | -0.4625 |
| 4 800.0000 | 3.6812 | 83.6667% | 95.2361% | 3 | 2.5100 | 2.8571 | -0.3471 |
Table 2.
Dose-dependent effects of animal death (according to Prozorovsky).
| Probit Analysis - Least squares fit (Normal Distribution) | ||||
| Dose (Stimulus) | Actual % | N | Probit (Y) | Weight (Z) |
| 300.0000 | 4.1667% | 6 | 3.2680 | 1.5359 |
| 600.0000 | 4.1667% | 6 | 3.2680 | 1.5359 |
| 1 200.0000 | 20.0000% | 5 | 4.1585 | 3.8171 |
| 2 400.0000 | 50.0000% | 4 | 5.0000 | 5.0000 |
| 4 800.0000 | 91.6667% | 3 | 6.3832 | 2.3503 |
Table 3.
Feed and water consumption.
| 24 hours of the experiment | Animal groups | Amount of feed per day (g/kg) | Amount of water per day (ml/kg) | ||
| ± SD | 95%CI | ± SD | 95% CI | ||
| 1st day | a - control | 28.83 ± 1.329 29.33 ±0.816 29.00±1.549 24.50±2.34 525.67±1.211 27.50 ±1.517 |
(27.44 - 30.23) (28.48-30.19) (27.37-30.63) (22.04-26.96) (24.40-26.94) (25.91-29.09) |
49.50 ±0.837 49.33±0.816 49.33±0.516 48.00±0.707 44.50±1.291 42.67 ±0.577 |
(48.62-50.38) (48.48-50.19) (48.79-49.88) (47.12-48.88) (42.45-46.55) (41.23-44.10) |
| b - 300 mg/kg | |||||
| c - 600 mg/kg | |||||
| d - 1200 mg/kg | |||||
| e - 2400 mg/kg | |||||
| f - 4800 mg/kg | |||||
| 7th day | a - control | 29.33 ±1.033 28.83±1.329 29.17±1.329 21.00±10.450 23.17±4.53 521.83±4.875 |
(28.25–30.42) (27.44–30.23) (27.77–30.56) (10.03–31.97) (18.41–27.93) (16.72–26.95) |
48.83±0.983 46.33±1.033 46.83±0.408 46.20±0.447 35.25±1.258 34.33±0.577 |
(47.80–49.87) (45.25–47.42) (46.40–47.26) (45.64–46.76) (33.25–37.25) (32.90–35.77) |
| b - 300 mg/kg | |||||
| c - 600 mg/kg | |||||
| d - 1200 mg/kg | |||||
| e - 2400 mg/kg | |||||
| f - 4800 mg/kg | |||||
| 14th day |
a - control | 30.0 ±1.712 28.67±1.211 30.0±1.332 23.50±11.640 18.83±14.621 13.83±15.158 |
(28.43–31.95) (27.40-29.94) (28.12–31.52) (11.28–35.72) (3.49-34.18) (−2.07–29.74) |
47.67 ±1.033 47.83±0.753 47.50±0.548 47.60±0.548 46.25±0.957 41.67±0.577 |
(46.58–48.75) (47.04–48.62) (46.93–48.07) (46.92–48.28) (44.73–47.77) (40.23–43.10) |
| b - 300 mg/kg | |||||
| c - 600 mg/kg | |||||
| d - 1200 mg/kg | |||||
| e - 2400 mg/kg | |||||
| f - 4800 mg/kg | |||||
Table 4.
Dynamics of body weight.
| Weight indicator |
a - control group |
Experimental groups (dose mg/kg) | p – between groups | ||||
| b - 300 | c - 600 | d - 1200 | e - 2400 | f - 4800 | |||
| 1st day | 339.00 ± 8.30 | 343.83 ± 4.71 | 343.17 ± 5.49 | 343.17 ± 6.15 | 343.00 ± 6.69 | 340.67 ± 3.88 | p = 0.712* |
| 7th day | 347.67 ± 8.2 4 | 340.83 ± 5.49 | 339.50 ± 5.24 | 337.00 ± 6.57 | 331.83 ± 3.97 | 330.17±2.79 | p<0.001* pa-d=0.030 pa-e<0.001 pa-f<0.001 pb-f=0.030 |
| 14th day | 354.50±7.37 | 344.83±5.04 | 344.17±5.60 | 341.40±6.03 | 336.25±5.32 | 335.33±3.22 | p<0.001* pa-c=0.050 pa-d=0.012 pa-e =0.001 pa-f =0.001 |
| р | р < 0.001** p1-2 < 0.001 p1-3 < 0.001 p2-3 < 0.001 |
р = 0.002** p1-2 < 0.001 p2-3 < 0.001 |
р = 0.001** p1-2 < 0.001 p2-3 < 0.001 |
р = 0.001** p1-2 < 0.001 p2-3 < 0.001 |
р = 0.009** p2-3 < 0.001 |
р = 0.074** | |
Note: * - differences in indicators are statistically significant (analysis of independent groups by ANOVA) (p <0.05). ** - changes in indicators are statistically significant (analysis of dependent groups by ANOVA for repeated measures) (p < 0.05)
Table 5.
Number of racks.
| Days of observation | a - control group | Experienced groups | P * -between groups | ||||
| b -300 mg/kg | c -600 mg/kg | d -1200 mg/kg | e -2400 mg/kg | f-4800 mg/kg | |||
| 1st day | 17.17±0.75 | 16.00±1.41 | 14.67±1.03 | 13.80±0.83 | 12.75±2.06 | 11.33±1.52 | p a-c =0.004 p a-d = 0.003 p a-e =0.004 p a-f =0.004 |
| 7th day | 16.67±0.8 | 15.83±0.75 | 14.33±1.63 | 13.40±0.89 | 13.00±1.82 | 11.00±1.00 | p a-c =0.013 p a-d = 0.003 p a-e =0.004 p a-f =0.004 |
| 14th day | 17.00±0.89 | 15.67±1.03 | 14.17±0.75 | 12.40±0.54 | 15.00±0.81 | 16.33±0.57 | p a − b =0.044 p a −c =0.003 p a − d =0.00 5p a-e=0.017 |
| P** | p = 0.742 | p = 0.401 | p = 0.478 | p = 0.055 | p = 0.404 | p =0.074p2-3 =0.012p1-3 =0.039 | |
Note: p * - statistically significant differences between independent groups according to GLM, p ** - statistically significant differences between dependent groups according to GLM for repeated measurements.
Table 6.
Duration of stands.
| Days of observation | a - control group | Experienced groups | P * -between groups | ||||
| b - 300mg/kg |
c -600mg/kg | d -1200 mg/kg | e -2400 mg/kg | f -480 0 mg/kg | |||
| 1st day | 144.67±1.75 | 143.50±1.87 | 142.83±0.75 | 140.40±2.51 | 137.50±5.80 | 136.00±2.00 | p a-d=0.019 p a-e=0.008 p a-f =0.004 |
| 7th day | 144.50±1.04 | 143.17±1.16 | 142.33±0.81 | 139.80±2.58 | 137.75±5.56 | 135.67±1.52 | p ac =0.007 p a-d=0.00 5p a-e=0.008 p a-f =0.004 |
| 14th day | 145.50±1.37 | 144.00±0.89 | 142.67±0.51 | 148.40±0.54 | 160.75±1.25 | 162.67±0.57 | p a-c=0.003 p b-d=0.00 5p c-d=0.001 p a-f =0.019 |
| P ** | p = 0.582 | p = 0.019p 2-3=0.012 | p = 0.694 | p = 0.004p 1-3=0.003 | p = 0.0022 | p = 0.029 | |
Note: p * - statistically significant differences between independent groups according to GLM, p ** - statistically significant differences between dependent groups according to GLM for repeated measurements.
Table 7.
Clinical and biochemical blood parameters.
| Table 7. Clinical and biochemical blood parameters. | |||||||
| Indicators |
a - control group |
Experimental groups (dose mg/kg) | p – between groups | ||||
| b - 300 | c - 600 | d - 1200 | e - 2400 | f - 4800 | |||
| ALT (U/l) | 54.5 2 ± 5.97 |
5 3.23 ± 5.3 9 |
48.8 5± 4.49 |
58.28 ± 3.31 |
56.20 ± 11.71 |
64.50 ± 3.56 |
p = 0.028 p c-f =0.0 16 |
| AST (U/l) | 60.92 ± 7.92 |
59.63 ± 8.56 |
70.33 ± 14,01 |
74.74 ± 8,65 |
87.80 ± 5,51 |
95.7 7 ± 2.00 |
р < 0,001 pa-e=0,002 pa-f<0,001 pb-е=0,001 pb-f<0,001 pc-f=0,008 pd-f=0,048 |
| Alkaline phosphatase (U/l) |
67.83 ± 10.63 |
67.50 ± 7.96 |
81.43 ± 6.62 |
72.16 ± 10.31 |
70.00 ± 17.03 |
73.6 7 ± 12.10 |
р =0.260 |
| C-reactive protein (mg/L) | 0.2 5± 0.078 |
0.26 ± 0.08 |
0.28 ± 0.08 |
0.34 ± 0.07 |
0.33 ± 0.11 |
0.24 ± 0.07 |
р =0.304 |
| GGTP (U/l) | 17.89 ± 6.38 |
18.04 ± 6.20 |
15.1 5± 4.19 |
20.90 ± 6.24 |
19.69 ± 4.00 |
21.33 ± 2.39 |
р = 0.504 |
| LDH total in erythrocyte (U/l) | 450.33 ± 80.34 |
441.17 ± 41.88 |
430.17 ± 57.78 |
477.80 ± 28.89 |
578.7 5± 70.47 |
620.00 ± 13.53 |
р < 0.001 pa-e=0.019 pa-f=0.003 pb-e=0.010 pb-f=0.002 pc-e=0.00 5pc-f=0.001 pd-f=0.022 |
Note: * - differences in indicators are statistically significant (p <0.05).
Table 8.
Morphological composition of blood.
| Indicators |
a- control group |
Experimental groups (dose mg/kg) | p – between groups | ||||
| b - 300 | c - 600 | d - 1200 | e - 2400 | f - 4800 | |||
| Hemoglobin (g/l) | 133.17 ± 4.79 |
131.33 ± 4.63 |
129.83 ± 1.72 |
132.80 ± 5.89 |
131.7 5± 4.35 |
139.33 ± 3.22 |
p =0.103 |
| Erythrocytes (* 10 12 /l) |
5.42 ± 0.19 |
5.54 ± 0.17 |
5.4667 ± 0.14 |
5.4240 ± 0.04 |
5.4300 ± 0.19 |
5.4967 ± 0.12 |
р =0.766 |
| Color indicator (in units of calculation) |
0.72 ± 0.03 |
0.73 ± 0.02 |
0.73 ± 0.01 |
0.74 ± 0.02 |
0.75 ± 0.02 |
0.76 ± 0.01 |
р =0.089 |
| Hematocrit (%) | 43.38 ± 1.56 |
44.1 5± 1.51 |
44.38 ± 1.04 |
43.22 ± 1.54 |
44.00 ± 1.78 |
43.50 ± 1.84 |
р =0.759 |
| Mean corpuscular volume (fl) | 79.067 ± 2.4304 |
77.317 ± 1.8925 |
78.767 ± 1.7580 |
78.680 ± 2.3552 |
77.67 5± 1.0145 |
78.933 ± 2.2189 |
p = 0.644 |
| Hb content in erythrocyte (pg) | 25.32 ± 0.50 |
24.78 ± 0.97 |
24.717 ± 0.77 |
25.18 ± 0.69 |
25.0 5± 0.58 |
25.27 ± 0.59 |
р = 0.654 |
| Mean Hb concentration in erythrocyte (g/l) | 309.33 ± 5.61 |
310.17 ± 4.36 |
311.00 ± 6.07 |
314.80 ± 5.26 |
322.7 5± 4.99 |
315.67 ± 1.53 |
р = 0.006 pa-e=0.00 5pb-e=0.010 pc-e=0.017 |
| Distribution of red blood cells by volume (%) | 11.67 ± 0.25 |
11.6 5± 0.29 |
11.7 5± 0.36 |
11.86 ± 0.31 |
11.7 5± 0.48 |
11.93 ± 1.53 |
p = 0.968 |
| Platelets (*10 9 /l) |
826.50 ± 19.84 |
815.50 ± 23.41 |
826.00 ± 23.35 |
862.40 ± 70.89 |
829.00 ± 32.2 |
875.00 ± 46.70 |
p = 0.190 |
| Platelet Count (PCT, %) | 0.6 5± 0.03 |
0.66 ± 0.04 |
0.67 ± 0.05 |
0.71 ± 0.05 |
0.73 ± 0.06 |
0.78 ± 0.10 |
р = 0.013 pa-f=0.019 pb-f=0.039 |
| Mean platelet volume (fl) | 7.58 ± 0.15 |
7.63 ± 0.16 |
7.4 5± 0.14 |
7.70 ± 0.10 |
7.53 ± 0.22 |
7.60 ± 0.26 |
р = 0.23 5 |
| Leukocytes (*10 9 /l) | 5.72 ± 0.27 |
5.76 ± 0.36 |
5.76 ± 0.25 |
5.81 ± 0.28 |
5.94 ± 0.38 |
6.08 ± 0.41 |
p =0.630 |
| Neutrophils (%) | 31.90 ± 0.96 |
31.92 ± 1.01 |
31.83 ± 1.27 |
32.54 ± 0.86 |
31.53 ± 0.50 |
34.73 ± 2.33 |
р =0.017 pa-f=0.022 pb-f=0.024 pc-f=0.019 pe-f=0.015 |
| Neutrophils (abs. count) (*10 9 /l) |
1.4 5± 0.38 |
1.61 ± 0.09 |
1.69 ± 0.08 |
1.66 ± 0.07 |
1.6 5± 0.11 |
1.72 ± 0.16 |
р = 0.29 5 |
| Eosinophils (%) | 0.43 ± 0.11 |
0.41 ± 0.09 |
0.44 ± 0.18 |
0.44 ± 0.08 |
0.54 ± 0.25 |
0.43 ± 0.15 |
р = 0.831 |
| Eosinophils (abs. count) (*10 9 /l) |
0.10 ± 0.09 |
0.16 ± 0.12 |
0.13 ± 0.08 |
0.22 ± 0.11 |
0.28 ± 0.10 |
0.09 ± 0.02 |
р =0.064 |
| Basophils (%) | 1.2 5± 0.15 |
1.28 ± 0.16 |
1.18 ± 0.17 |
1.42 ± 0.29 |
1.43 ± 0.15 |
1.40 ± 0.35 |
p =0.333 |
| Basophils (abs. count) (*10 9 /l) |
0.08 ± 0.04 |
0.11 ± 0.05 |
0.1 5± 0.09 |
0.14 ± 0.04 |
0.18 ± 0.10 |
0.06 ± 0.02 |
р = 0.104 |
| Monocytes (%) | 6.93 ± 0.44 |
6.81 ± 0.17 |
6.84 ± 0.23 |
6.99 ± 0.38 |
7.73 ± 0.19 |
7.49 ± 0.53 |
р =0.001 pa-e=0.012 pb-e=0.003 pc-e=0.004 pd-e=0.031 |
| Monocytes (abs.quantity) (*10 9 /L) |
0.40 ± 0.04 | 0.41 ± 0.03 | 0.42 ± 0.02 | 0.41 ± 0.04 | 0.48 ± 0.05 | 0.47 ± 0.06 | p =0.016 pa-e=0.027 |
| Lymphocytes (%) | 47.23 ± 3.19 | 47.75 ± 2.69 | 47.0 2 ± 4.25 | 47.06 ± 1.94 | 42.28 ± 3.42 | 48.23 ± 4.46 | р = 0.172 |
| Lymphocytes (abs. count) (*10 9 /l) |
3.3 6 ±0.27 | 3.08 ± 0.42 |
3.29 ± 0.34 | 3.19 ± 0.42 |
3.59 ± 0.17 | 3.71 ± 0.08 | р = 0.089 |
| ESR (according to Panchenkov) (mm/hour) |
1.33 ± 0.516 | 1.00 ± 0.001 | 1.17 ± 0.408 | 1.60 ± 0.548 | 1.50 ± 0.577 | 1.67 ± 0.577 | p = 0.210 |
| ESR (according to Westergren) (mm/hour) |
1.33 ± 0.516 |
1.00 ± 0,001 | 1.17 ± 0.408 | 1.60 ± 0.548 | 1.50 ± 0.577 | 1.67 ± 0.577 | р = 0.210 |
Table 9.
Metal Content in Drilling Cuttings (%10⁻⁴).
| As | Ba | Cd | Cr | Cu | Mn | Ni | Pb | Zn | |
| М | 57.6 | 5418.6 | 1.074 | 90.68 | 354.8 | 946.1 | 33.41 | 655.6 | 3326.9 |
| m | 1.821477 | 321.5225 | 0.03534 | 13.16332 | 18.29876 | 30.52303 | 1.868719 | 34.16691 | 376.6482 |
Disclaimer/Publisher’s Note: The statements, opinions and data contained in all publications are solely those of the individual author(s) and contributor(s) and not of MDPI and/or the editor(s). MDPI and/or the editor(s) disclaim responsibility for any injury to people or property resulting from any ideas, methods, instructions or products referred to in the content. |
© 2025 by the authors. Licensee MDPI, Basel, Switzerland. This article is an open access article distributed under the terms and conditions of the Creative Commons Attribution (CC BY) license (http://creativecommons.org/licenses/by/4.0/).
Copyright: This open access article is published under a Creative Commons CC BY 4.0 license, which permit the free download, distribution, and reuse, provided that the author and preprint are cited in any reuse.


