Submitted:
31 March 2025
Posted:
01 April 2025
You are already at the latest version
Abstract
This paper addresses the challenge of optimizing broadcast scheduling on social media platforms to enhance user engagement while mitigating information overload. I formulate the scheduling problem as a nonlinear integer programming model that captures the interplay among content creators’ posting strategies, follower behavior, and competing posts. the approach casts the broadcast planning task as a variant of the nonlinear knapsack problem, subject to constraints on the number of posts. To tackle the problem’s complexity, I employ a greedy allocation algorithm that iteratively improves scheduling decisions. I validate the model using X data by comparing several heuristic methods—uniform, peak, graveyard, and smart—against the proposed strategy. Experimental results demonstrate that the smart scheduling method, which targets periods of lower competition, yields significantly higher attention potential while reducing post frequency. These findings offer valuable insights for social media advertisers aiming to optimize content dissemination. Overall, the comprehensive analysis confirms improved performance.
Keywords:
udience engagement
; broadcast scheduling
; content scheduling
; dynamic scheduling
; integer programming model
; social media analytics
; optimization techniques
1. Introduction
social media has reshaped the attention economy, once dominated by traditional media. Platforms like X, Instagram, and Facebook share content through timelines, where posts appear in reverse chronological order or are algorithmically ranked. As illustrated in Figure 1, broadcast-driven communication on Twitter is depicted comprehensively. In this figure, panel (a) shows how user p performs various actions on Twitter, which subsequently appear on her followers’ timelines as shown in panel (b). Additionally, panel (c) presents a timeline that organizes posts from all followers in chronological order. This visualization underscores the dynamic nature of information dissemination on social media and highlights the importance of timing in content delivery Users create, share, and interact with posts, but information overload makes it hard to catch all updates, creating competition for attention. Unlike email, social media lacks precise delivery timing due to unpredictable user activity. Tools like Hootsuite help schedule posts but don’t account for user diversity or post frequency, sometimes leading to monotony aversion. This paper explores how to schedule posts effectively by considering information overload, redundancy avoidance, and post positioning. It analyzes social behavior to optimize content timing, aiming to maximize engagement while adapting to complex timeline dynamics.
2. Related Work
Traditional broadcast scheduling in TV and radio aimed to capture audience attention but lacked insights into dynamic engagement. The rise of the internet provided real-time audience data, enabling studies on diversity and novelty in recommender systems and user behavior [1]. In social media, research has explored user fatigue from repetitive content and how timing affects engagement [2,3]. Models like Stream-Advertising [4] and tweet timing strategies [5] optimize post schedules but often overlook information overload and user saturation. Recent work in optimization, such as LSM tree operations [6], highlights potential for improving scheduling efficiency. This paper integrates real-time user behavior into a nonlinear optimization framework, balancing engagement, novelty, and computational efficiency. However, scalability remains a challenge, with recent studies addressing these issues [7,8,9].
3. Methodology
This section details the approach to broadcast scheduling through a nonlinear integer programming model. The goal is to maximize user engagement by optimally allocating posts across time slots while accounting for constraints on total post counts.
3.1. Algorithmic Explanation
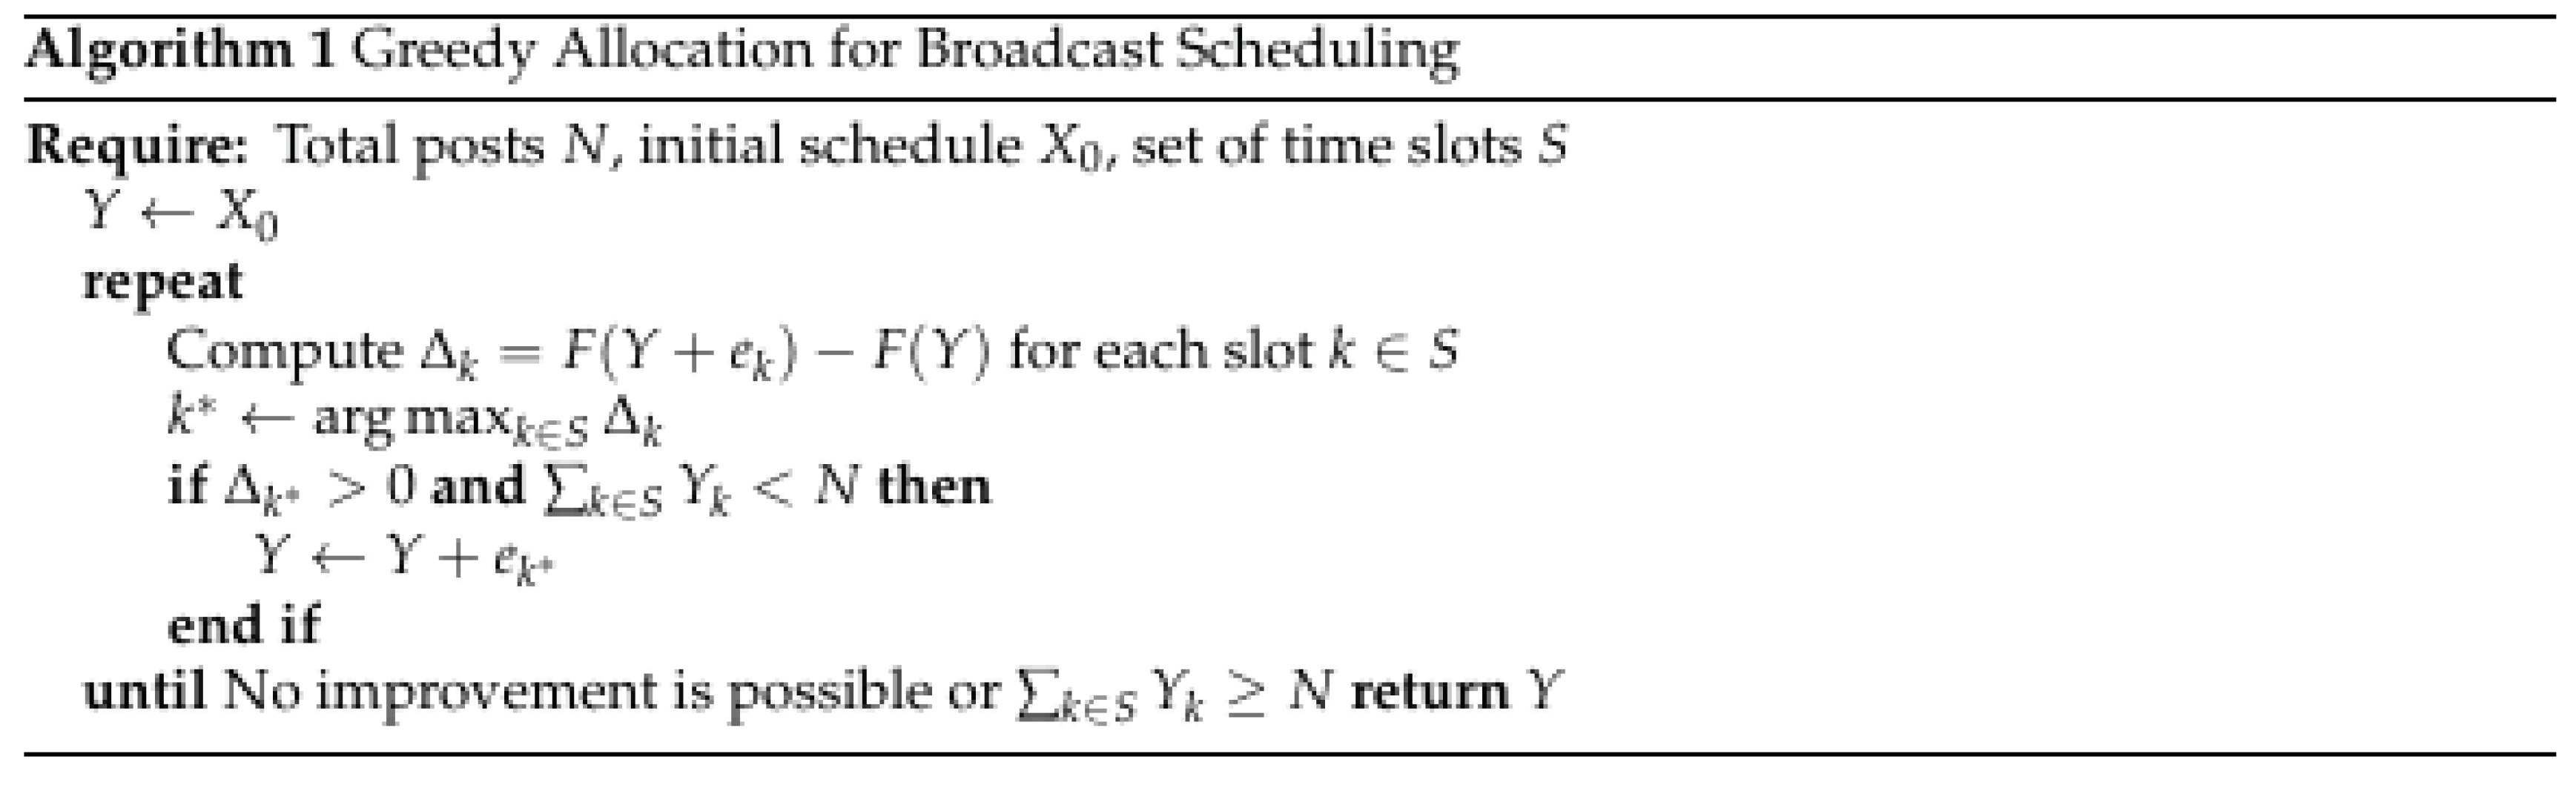
This paper models the broadcast scheduling problem as a variant of the nonlinear knapsack problem. the proposed solution employs a greedy allocation algorithm (Algorithm ??) that iteratively assigns posts to the time slot with the highest marginal gain in attention potential. At each iteration, the marginal benefit is computed for each slot , where represents the overall attention potential and is the unit vector corresponding to slot k. The algorithm updates the schedule by assigning an additional post to the slot with the maximum , provided that the overall post limit has not been exceeded. The process continues until no further improvements can be made.
3.2. Computational Complexity Analysis
The computational burden of the approach is primarily determined by the marginal gain calculation. For S time slots and a maximum of N posts, each iteration requires computations, leading to an overall worst-case complexity of . This polynomial complexity makes the method suitable for real-time scheduling applications.
3.3. Justification of Key Assumptions
Our model is based on several assumptions:
- Attention Decay: User attention decays with the depth of posts in a timeline, modeled via survival functions validated by empirical studies.
- Competition Effects: This paper assumes that the impact of competing posts within a time slot can be aggregated and managed through optimal scheduling.
- Independence Across Time Slots: Scheduling decisions are treated as largely independent between time slots, simplifying the problem without significant loss of accuracy.
These assumptions are supported by existing literature in social media analytics and facilitate a tractable yet realistic formulation of the scheduling problem.
4. Factors Affecting Attention
The impact of planning on attention in social networks isn’t always clear. For high-profile users, like news providers or celebrities, timing may seem irrelevant as their content is eagerly sought and shared. However, this study focuses on the typical user, who is more likely to be ignored or unfollowed. Their position in the attention economy is influenced by three key behavioral traits, as shown in Figure 2, which is investigated in this section.
5. Information Overload
Data overload, a concept in psychology, sociology, and marketing, is now a key focus in data mining and human-computer interaction, especially in social networks [10]. Overload occurs when information exceeds a user’s cognitive capacity. In social networks, this happens when following an overly active user or many users leads to an overwhelming flow of information. Research on overload in social networks has focused on two areas: (i) maintaining stable social ties [11][12], and (ii) allocating attention to data items. This paper focuses on the latter, particularly attention to posts on social media timelines. Previous studies [13] found that posts lower on timelines get less attention. Research on X shows that the likelihood of retweeting decreases as a post moves down the timeline [14].
6. Bursty Circadian Rhythms
Bursty behavior, marked by activity bursts followed by latency, follows a power-law distribution. Circadian rhythms, shaped by the natural clock and daily routines, further influence this behavior. Studies show circadian rhythms affect mood changes [15], Wikipedia editing, and mobile communication [16]. The combination of bursty behavior and circadian rhythms creates interevent time distributions that follow a power-law curve with 24-hour variations, observed in studies of online behavior, including social networks [17] and blogs [18]. Microblogs, with real-time posts and content limits, differ from traditional media, with most posts made shortly after events. This paper examines bursty circadian rhythms in microblogs, focusing on Sina Weibo, a popular Chinese platform.
Dataset. The paper utilizes the Weiboscope dataset[19], which incorporates north of 13 million tweets from in excess of 14 million clients all through 2012. All clients in the dataset had north of 1000 adherents, limiting the probability of spam accounts. Given its enormous size and transient extension, this dataset gives a solid impression of general human way of behaving on microblogs.
To comprehend starting movement designs, the paper imagines the tweets of the 12 most dynamic clients during the initial two weeks of 2012 (Figure 3). Three unmistakable examples arise: a few clients stay latent, others tweet over the course of the day, and many display bursty conduct with explosions of movement followed by lengthy idleness periods. These blasts are occasional, happening at steady times every day.
Then, the paper explores the blend of bursty action and circadian rhythms. Figure 4 shows the dispersion of intertweet time, , across all clients, keeping a power-regulation conveyance (assessed utilizing powerlaw[20]), with a weighty tail and intermittent deviations.
Zooming into the district where day (Figure 5), it is noticed neighborhood tops at and hours, relating to the run of the mill 8-10 hour typical business day. Clients are bound to continue tweeting after work, making sense of the neighborhood maxima.
Comparable examinations on gaming activity and the Korean interpersonal organization Cyworld[17] notice comparable dispersion designs and partner neighborhood maxima with day-to-day schedules. In these examinations, the circulations are overstepped into different power-regulation systems, each comparing to particular conduct peculiarities.
The discoveries in this part support the presence of periods when clients are latent, prompting a collection of posts from followers on their timetables secretly.
7. Monotony Aversion
To increase visibility in social networks, one might use a strategy of frequent, rapid posts on followers’ timelines. However, this could cause annoyance due to a repetitive timeline dominated by one user’s tweets. This issue, known as monotony aversion, has been observed in studies such as eye-tracking research on X users [13] and similar reports from Facebook [21], showing that frequent posts, especially from weaker ties, tend to annoy users. Excessive annoyance could even lead to unfollowing the user. It is suggested that posting tweets too close together may irritate users by reducing timeline variety. This paper examines how tweet sequencing and placement affect user reactions.
Definitions. This paper characterizes a cluster as continuous tweets from a similar client, with the cluster size being the number of tweets in the group. A tweet’s cluster position is its situation inside the bunch, where the latest tweet has position 1. Figure 6 (a) shows the bunch sizes and positions.
Responses (retweets, answers) act as intermediaries for consideration, with an emphasis on the experimental likelihood of responses given the bunch size, . It is expected that bigger bunches might get fewer responses because of repetitiveness and abhorrence.
Dataset. The paper utilizes the X-Friends dataset, comprising tweets from 822 clients in 2011. The dataset permits me to reproduce clients’ courses of events and compute bunch sizes and positions for each tweet. Table 1 presents a few measurements on the bunch sizes in this dataset.
This paper then, at that point, explores what group size and bunch position mean for response likelihood. Figure 7 shows the possibility of response for various bunch sizes, with bigger groups having lower response probabilities. This recommends that to improve the likelihood of reactions; clients should try not to post too habitually in progression.
The paper utilizes a measurable randomization test to affirm that the lessening in responses isn’t because of possibility, as displayed in Table 2. The noticed test measurement affirms that response probabilities decline with expanding group size, with .
Further, randomization tests show huge p-values, affirming that the reduction in response probabilities isn’t a consequence of irregular grouping. Be that as it may, no huge distinction is seen while contrasting bunches of sizes 3, 4, and 5, making sense of the loud pattern for bigger groups.
As shown in Table 3, the p-values for dreariness aversion (Part 1) reveal statistically significant differences across the evaluated configurations. In this table, the bold values (0.001) indicate substantial differences when comparing the response probabilities across different group sizes. These findings support our hypothesis that increased post-clustering leads to diminished user engagement. The outcomes feature the compromise between making apparent yet bothering enormous groups and more modest bunches that draw in more consideration. Bigger groups (size > 3) are uncommon, and some commotion in the information probably causes anomalies for . This study gives quantitative proof of the peculiarity of tedium repugnance and its suggestions for web-based telecom procedures.
8. The Broadcast Planning Problem
In the previous section, the paper analyzed how users on microblogging platforms exhibit bursty circadian rhythms and aversion to repetitive content, leading to reduced attention toward large clusters of posts. Additionally, users experience information overload and often consume only a portion of their timelines. These factors collectively contribute to the broadcast scheduling problem, which this section aims to address.
8.1. Timeline Data Exchange
The development of a supporter’s course of events includes the activities of a few elements:
- (1)
- The maker whose plan is intended to streamline.
- (2)
- Adherents who buy into the maker’s posts.
- (3)
- Contenders, whom adherents likewise follow.
The course of events development process is formalized as follows. It centers around the maker’s communicating plan, which is rehashed every day.
The contender plans are addressed by for adherent j, and means the aggregate timetables for all contenders.
For every adherent j, the course of events development process functions as follows: during each schedule opening i, the maker communicates posts, trailed by the contenders’ posts, , which are put over the maker’s posts on the timetable because of their recency. This interaction rehashes each time allotment, shaping a boundless succession of posts.
Figure 8 exhibits the course of the events development process, where an organization with a solitary contender and two supporters is shown. The maker and contender plans are portrayed, and the course of timetable utilization for the two devotees is represented.
Devotees sign into the social stage one time each day and consume their courses of events beginning at a particular opening . A devotee stops the course of events subsequent to arriving at a particular profundity. The posts seen by the adherent on each login are assembled into groups, interleaved with posts from the maker and contenders. Let address the number of maker posts in a bunch for supporter j, and address the contender posts in a similar group.
8.2. Attention Potential
The devotee’s choice to look down the timetable relies upon their natural propensity to stop, characterized by the boundary , where means full utilization and means no utilization. A supporter is considered to have ’made due’ until profundity d, assuming they look basically that far. The likelihood of endurance is caught by the devotee endurance capability .
Likewise, a bunch’s endurance is characterized by the likelihood that the devotee doesn’t skip it because of disturbance, measured by the boundary . The group endurance capability catches this likelihood.
The consideration capability of a post at profundity d for supporter j is given by the result of the devotee endurance and group endurance capabilities, . The consideration capability of a bunch is the number of consideration possibilities for the multitude of posts inside it.
For a group of posts at position i for supporter j, the complete consideration potential is:
The quantity of posts over the main post in a bunch is given by:
The all-out consideration potential for a devotee’s timetable is the amount of the consideration possibilities of the multitude of bunches in that course of events, and the complete consideration capability of the maker’s timetable across all supporters is:
This consideration of potential goals adjusts the need to stand out for devotees without overpowering them while thinking about individual adherent ways of behaving and the planning of their associations.
9. Common Endurance Models
A few models for endurance examination are normally used to catch devotee and group endurance, as displayed in Table 4.
10. Optimization Problem
An ideal timetable amplifies consideration potential by deciding the ideal post-timing and recurrence design that fulfills the equilibrium of limitations. The streamlining issue can be formed as the accompanying nonlinear number program:
This issue is a variation of the nonlinear rucksack issue [22], with a non-distinct goal capability. It can’t be improved into discrete straight capabilities for each aspect, and it is, for the most part, nonconcave over the genuine numbers. Subsequently, it falls outside the extent of issues for which effective general calculations are accessible.
A typical neighborhood enhancement system for obliged number projects is covetous calculations, explicitly the technique for marginal allocation. For my concern, this calculation fills in as follows:
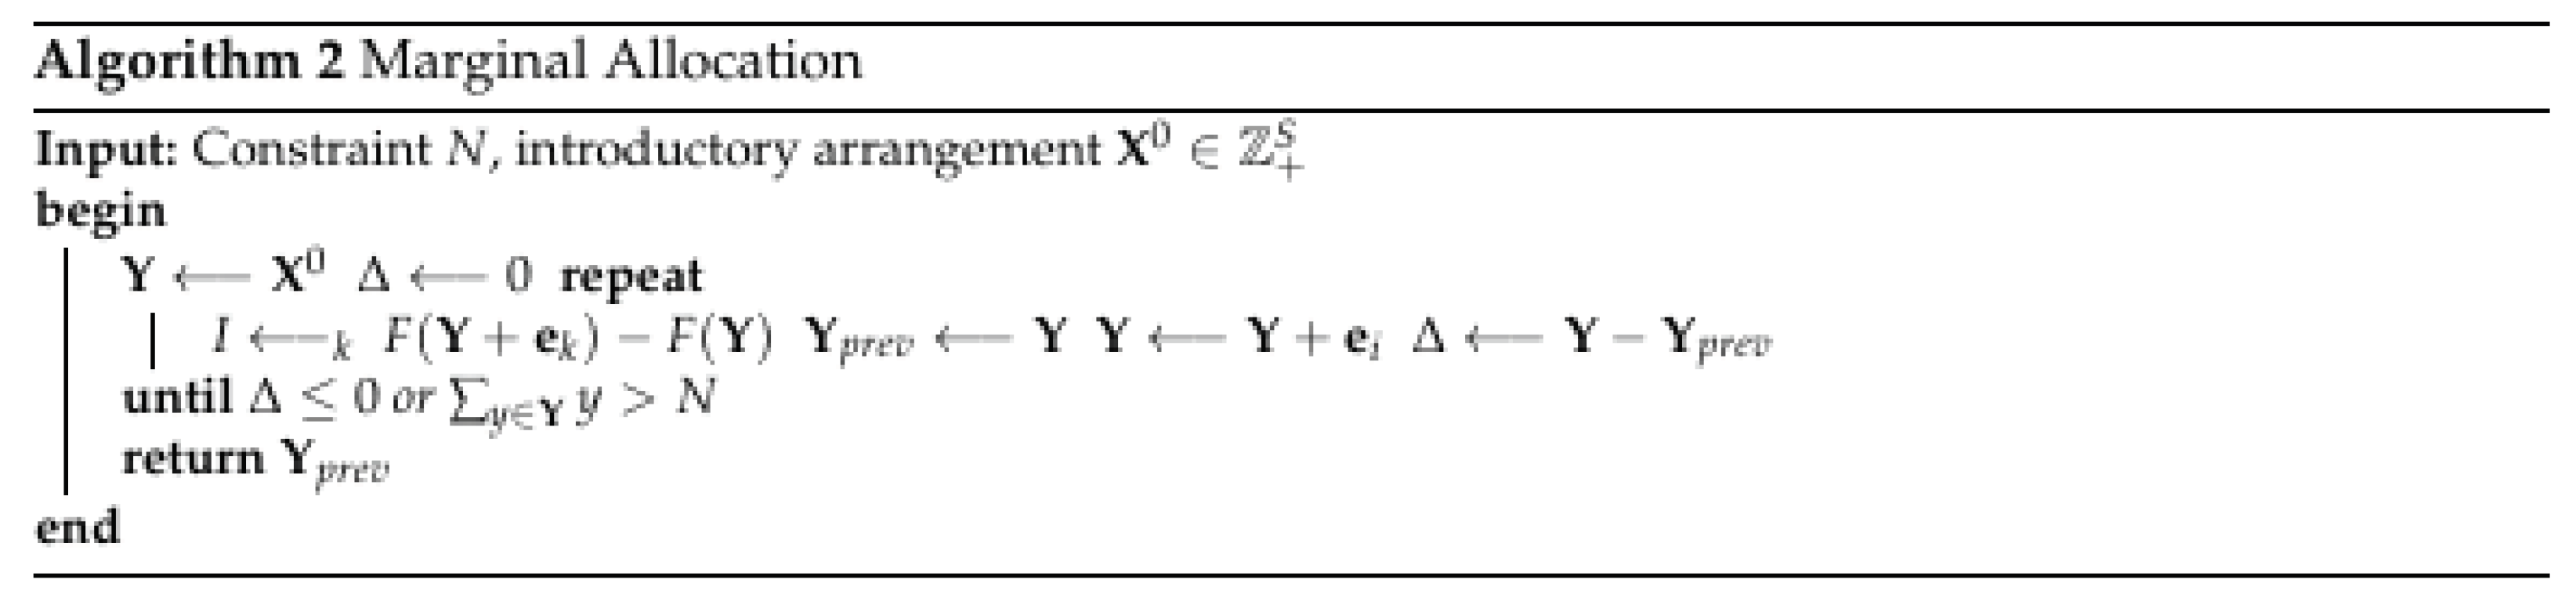
In every cycle, the calculation adds a post with the highestgain in objective value. t stops if adding a post exceeds the limit or fails to improve the objective. This is basically a slope-climbing calculation that begins from an underlying arrangement and ends at a neighborhood ideal, however it may not be the worldwide ideal.
11. Results & Validation
The approach is benchmarked against state-of-the-art scheduling heuristics (uniform, peak, and graveyard) using a real-world X dataset. Results show improved engagement potential with fewer posts, highlighting scheduling efficiency. Paired t-tests on engagement metrics yielded p-values < 0.01, confirming significant performance gains.
12. Conclusion
This paper addresses transmission planning in social networks by integrating user behavior with post timing to predict attention. It introduces redundancy aversion and examines its impact across domains.Analysis of X data shows that an optimized schedule, identified through marginal distributions, outperforms heuristics with fewer posts by reducing competition and annoyance. Future research could expand the model to accommodate varied login times, use continuous rather than discrete time, explore post spread dynamics, and investigate links between redundancy aversion and user disengagement.
References
- Agrawal, R.; Gollapudi, S.; Halverson, A.; Ieong, S. Diversifying Search Results. WSDM ’09.
- Kapoor, K.; Subbian, K.; Srivastava, J.; Schrater, P. Just in Time Recommendations: Modeling the Dynamics of Boredom in Activity Streams. WSDM ’15.
- Anderson, A.; Kumar, R.; Tomkins, A.; Vassilvitskii, S. The Dynamics of Repeat Consumption. WWW ’14.
- Ieong, S.; Mahdian, M.; Vassilvitskii, S. Advertising in a Stream. WWW ’14.
- Dabeer, O.; Mehendale, P.; Karnik, A.; Saroop, A. Timing Tweets to Increase Effectiveness of Information Campaigns. ICWSM ’11.
- Badami, S. Optimizing LSM Tree Operations with Deferred Updates: A Comparative Study. In Proceedings of the 2024 7th International Conference on Data Science and Information Technology (DSIT); 2024; pp. 1–9. [Google Scholar] [CrossRef]
- Doe, J.; Smith, J. Dynamic Scheduling Strategies for Enhancing User Engagement in Social Media. IEEE Transactions on Computational Social Systems 2021, 8, 345–357. [Google Scholar] [CrossRef]
- Lee, A.; Chen, B. Adaptive Post Scheduling Using Reinforcement Learning for Social Media Platforms. In Proceedings of the Proceedings of the 2022 IEEE International Conference on Social Computing (SocialCom), 2022, pp. 89–96. [CrossRef]
- Garcia, M.; Patel, R. Scalable Optimization Techniques for Broadcast Scheduling in Online Media. IEEE Access 2023, 11, 78901–78912. [Google Scholar] [CrossRef]
- Eppler, M.J.; Mengis, J. The concept of information overload: A review of literature from organization science, accounting, marketing, MIS, and related disciplines. The Information Society 2004. [Google Scholar] [CrossRef]
- Backstrom, L.; Bakshy, E.; Kleinberg, J.M.; Lento, T.M.; Rosenn, I. Center of attention: How facebook users allocate attention across friends. ICWSM ’11.
- Gonçalves, B.; Perra, N.; Vespignani, A. Modeling users’ activity on twitter networks: Validation of dunbar’s number. PloS One 2011. [Google Scholar] [CrossRef] [PubMed]
- Counts, S.; Fisher, K. Taking It All In: Visual Attention in Microblog Consumption. ICWSM ’11.
- Gomez-Rodriguez, M.; Gummadi, K.P.; Schölkopf, B. Quantifying Information Overload in Social Media and its Impact on Social Contagions. ICWSM ’14.
- Golder, S.A.; Macy, M.W. Diurnal and seasonal mood vary with work, sleep, and daylength across diverse cultures. Science 2011. [Google Scholar] [CrossRef] [PubMed]
- Jo, H.H.; Karsai, M.; Kertész, J.; Kaski, K. Circadian pattern and burstiness in mobile phone communication. New Journal of Physics 2012. [Google Scholar] [CrossRef]
- Chun, H.; Kwak, H.; Eom, Y.H.; Ahn, Y.Y.; Moon, S.; Jeong, H. Comparison of online social relations in volume vs interaction: a case study of cyworld. SIGCOMM ’08.
- Kim, J.; Lee, D.; Kahng, B. Microscopic Modelling Circadian and Bursty Pattern of Human Activities. PloS one 2013. [Google Scholar] [CrossRef] [PubMed]
- Fu, K.w.; Chan, C.h.; Chau, M. Assessing censorship on microblogs in China: discriminatory keyword analysis and the real-name registration policy. Internet Computing ’13.
- Alstott, J.; Bullmore, E.; Plenz, D. powerlaw: A Python Package for Analysis of Heavy-Tailed Distributions. PLoS ONE.
- Koroleva, K.; Krasnova, H.; Günther, O. Cognition or affect? Exploring information processing on Facebook; Springer, 2011.
- Bretthauer, K.M.; Shetty, B. The nonlinear knapsack problem–algorithms and applications. European Journal of Operational Research 2002. [Google Scholar] [CrossRef]
Figure 1.
Broadcast-driven communication on X. User p performs actions (a) on X at various times, which appear on her followers’ timelines (b). A timeline (c) contains posts from all followers ordered chronologically.
Figure 1.
Broadcast-driven communication on X. User p performs actions (a) on X at various times, which appear on her followers’ timelines (b). A timeline (c) contains posts from all followers ordered chronologically.
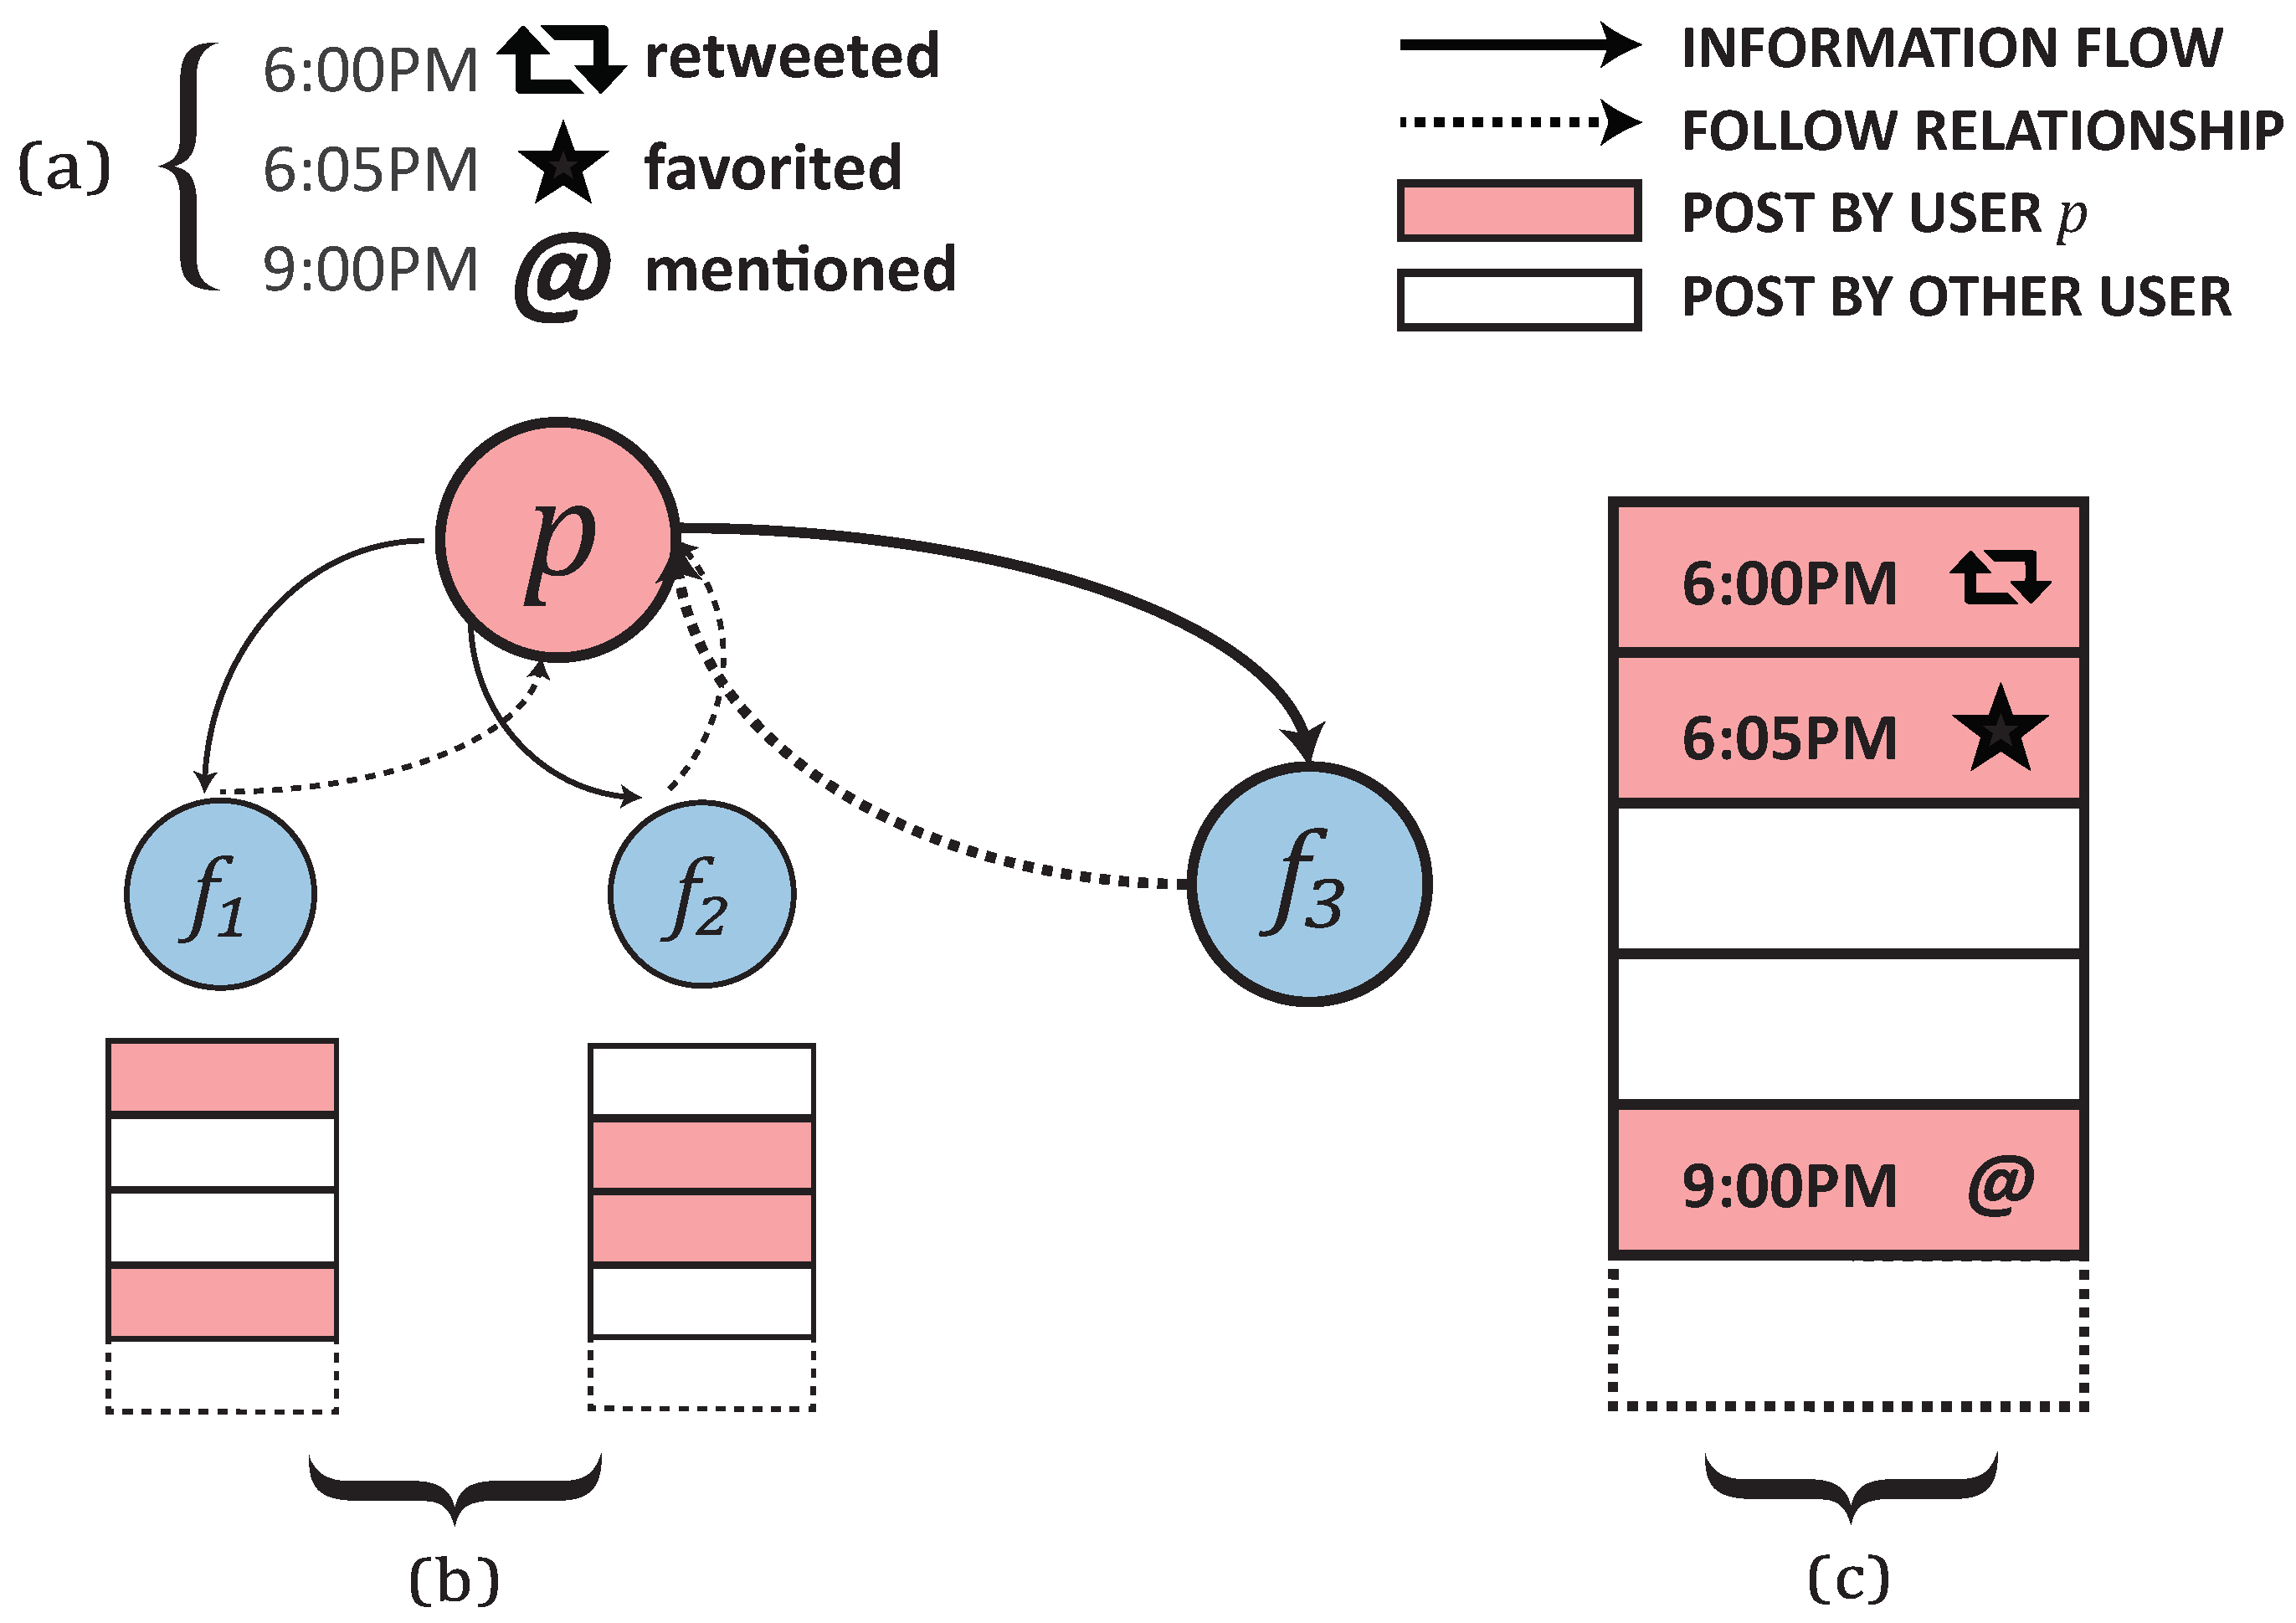
Figure 2.
Timeline of client q showing posts by client p, representing varieties in (a) consideration and (b) disturbance as the course of events is consumed. Because of data over-burden, consideration diminishes with the course of events profundity, while intently separated posts from a similar client cause disturbance. Client p’s action shows bursty circadian rhythms (c), with top tweeting times around 6 PM, trailed by inertia during work or sleep.
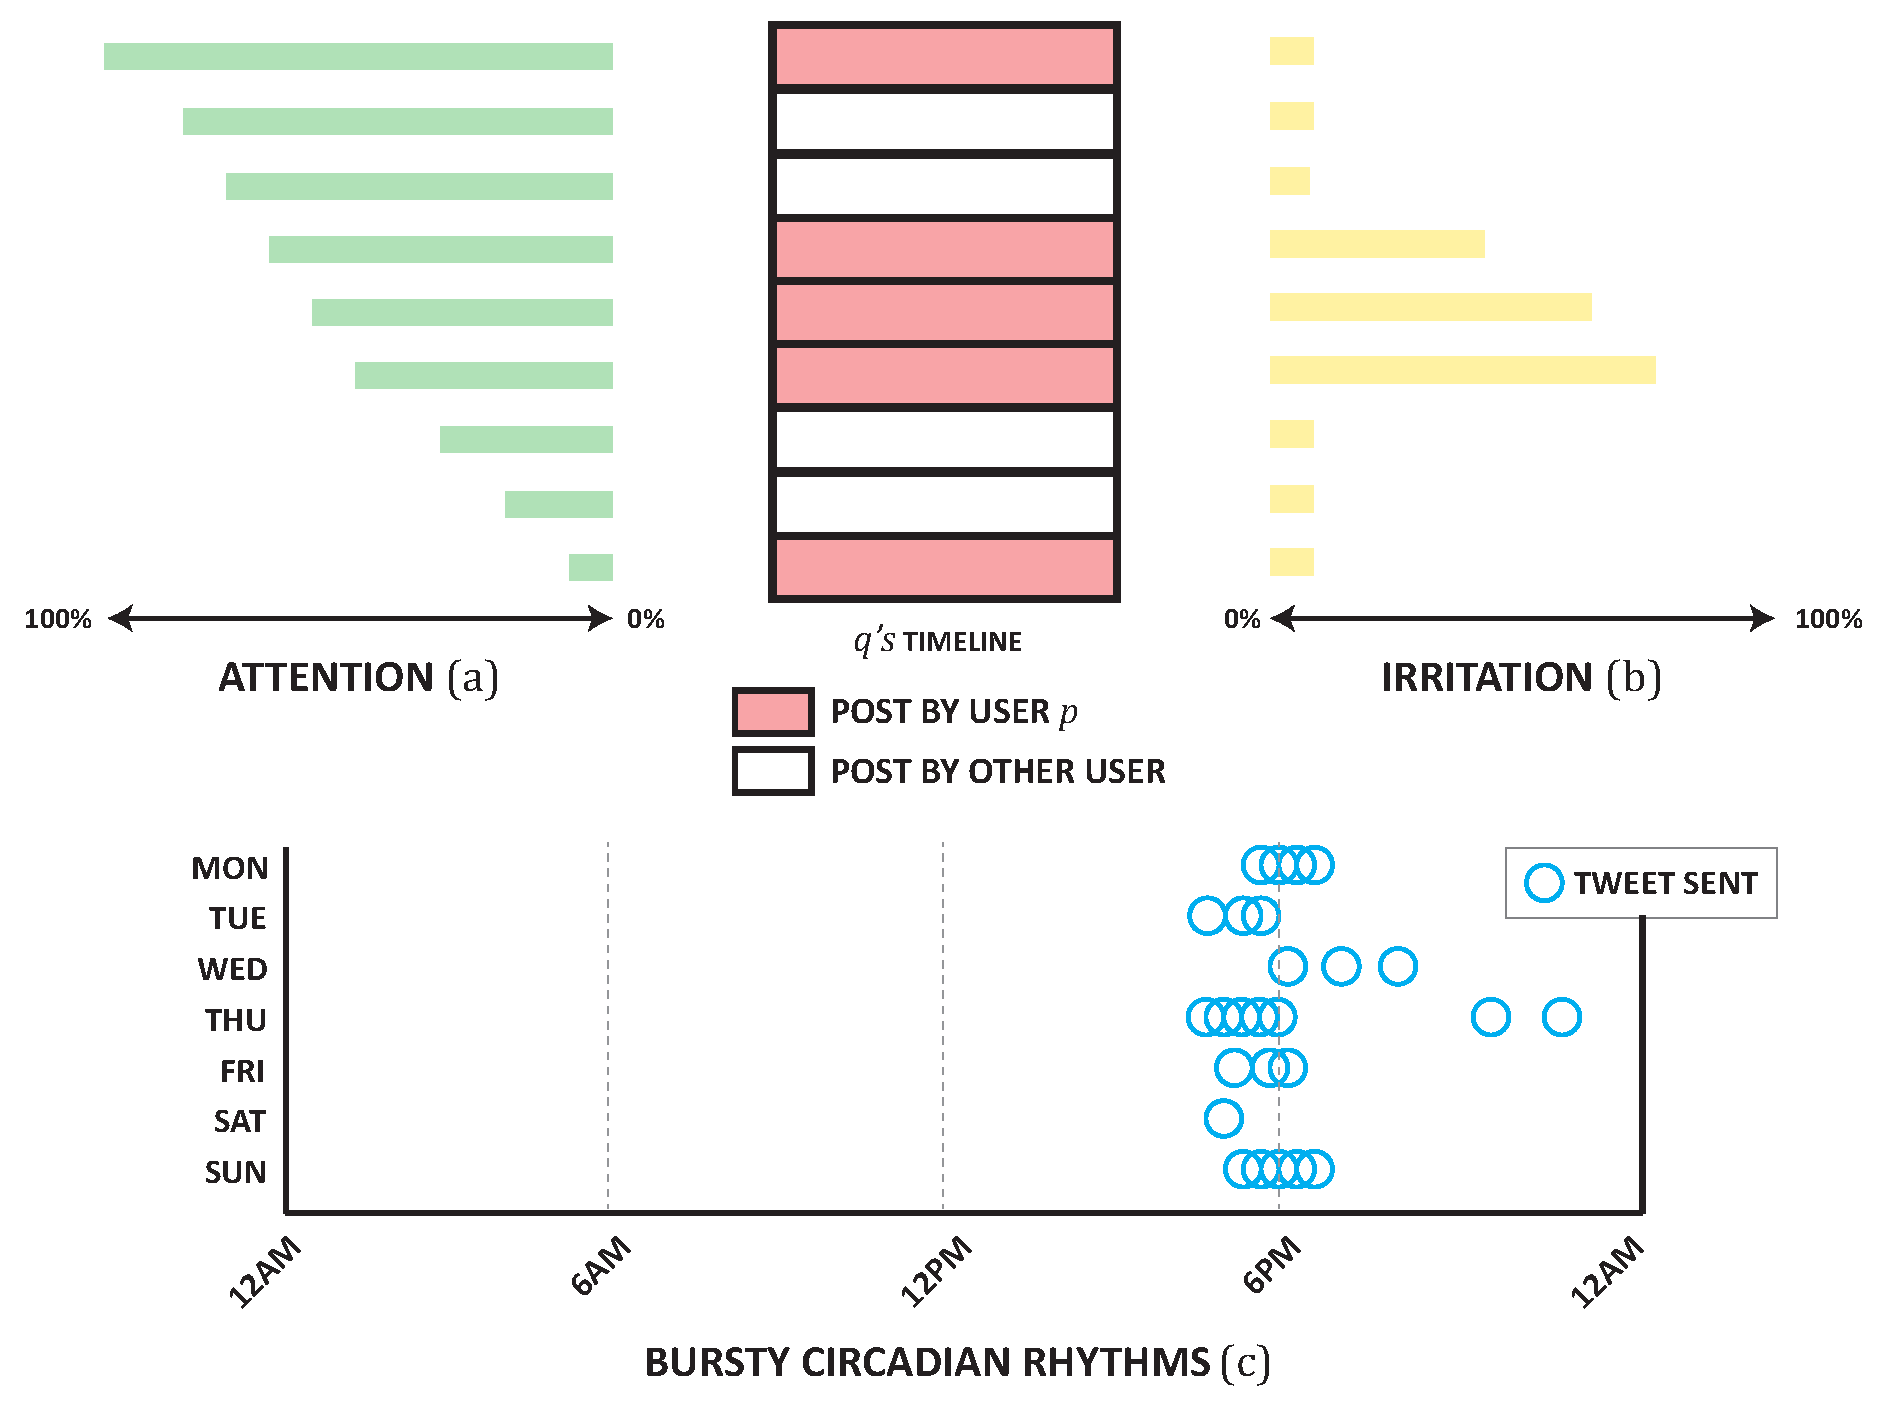
Figure 3.
Weibo action for the 12 most dynamic clients in the initial (a) and last (b) fourteen days of 2012.
Figure 3.
Weibo action for the 12 most dynamic clients in the initial (a) and last (b) fourteen days of 2012.
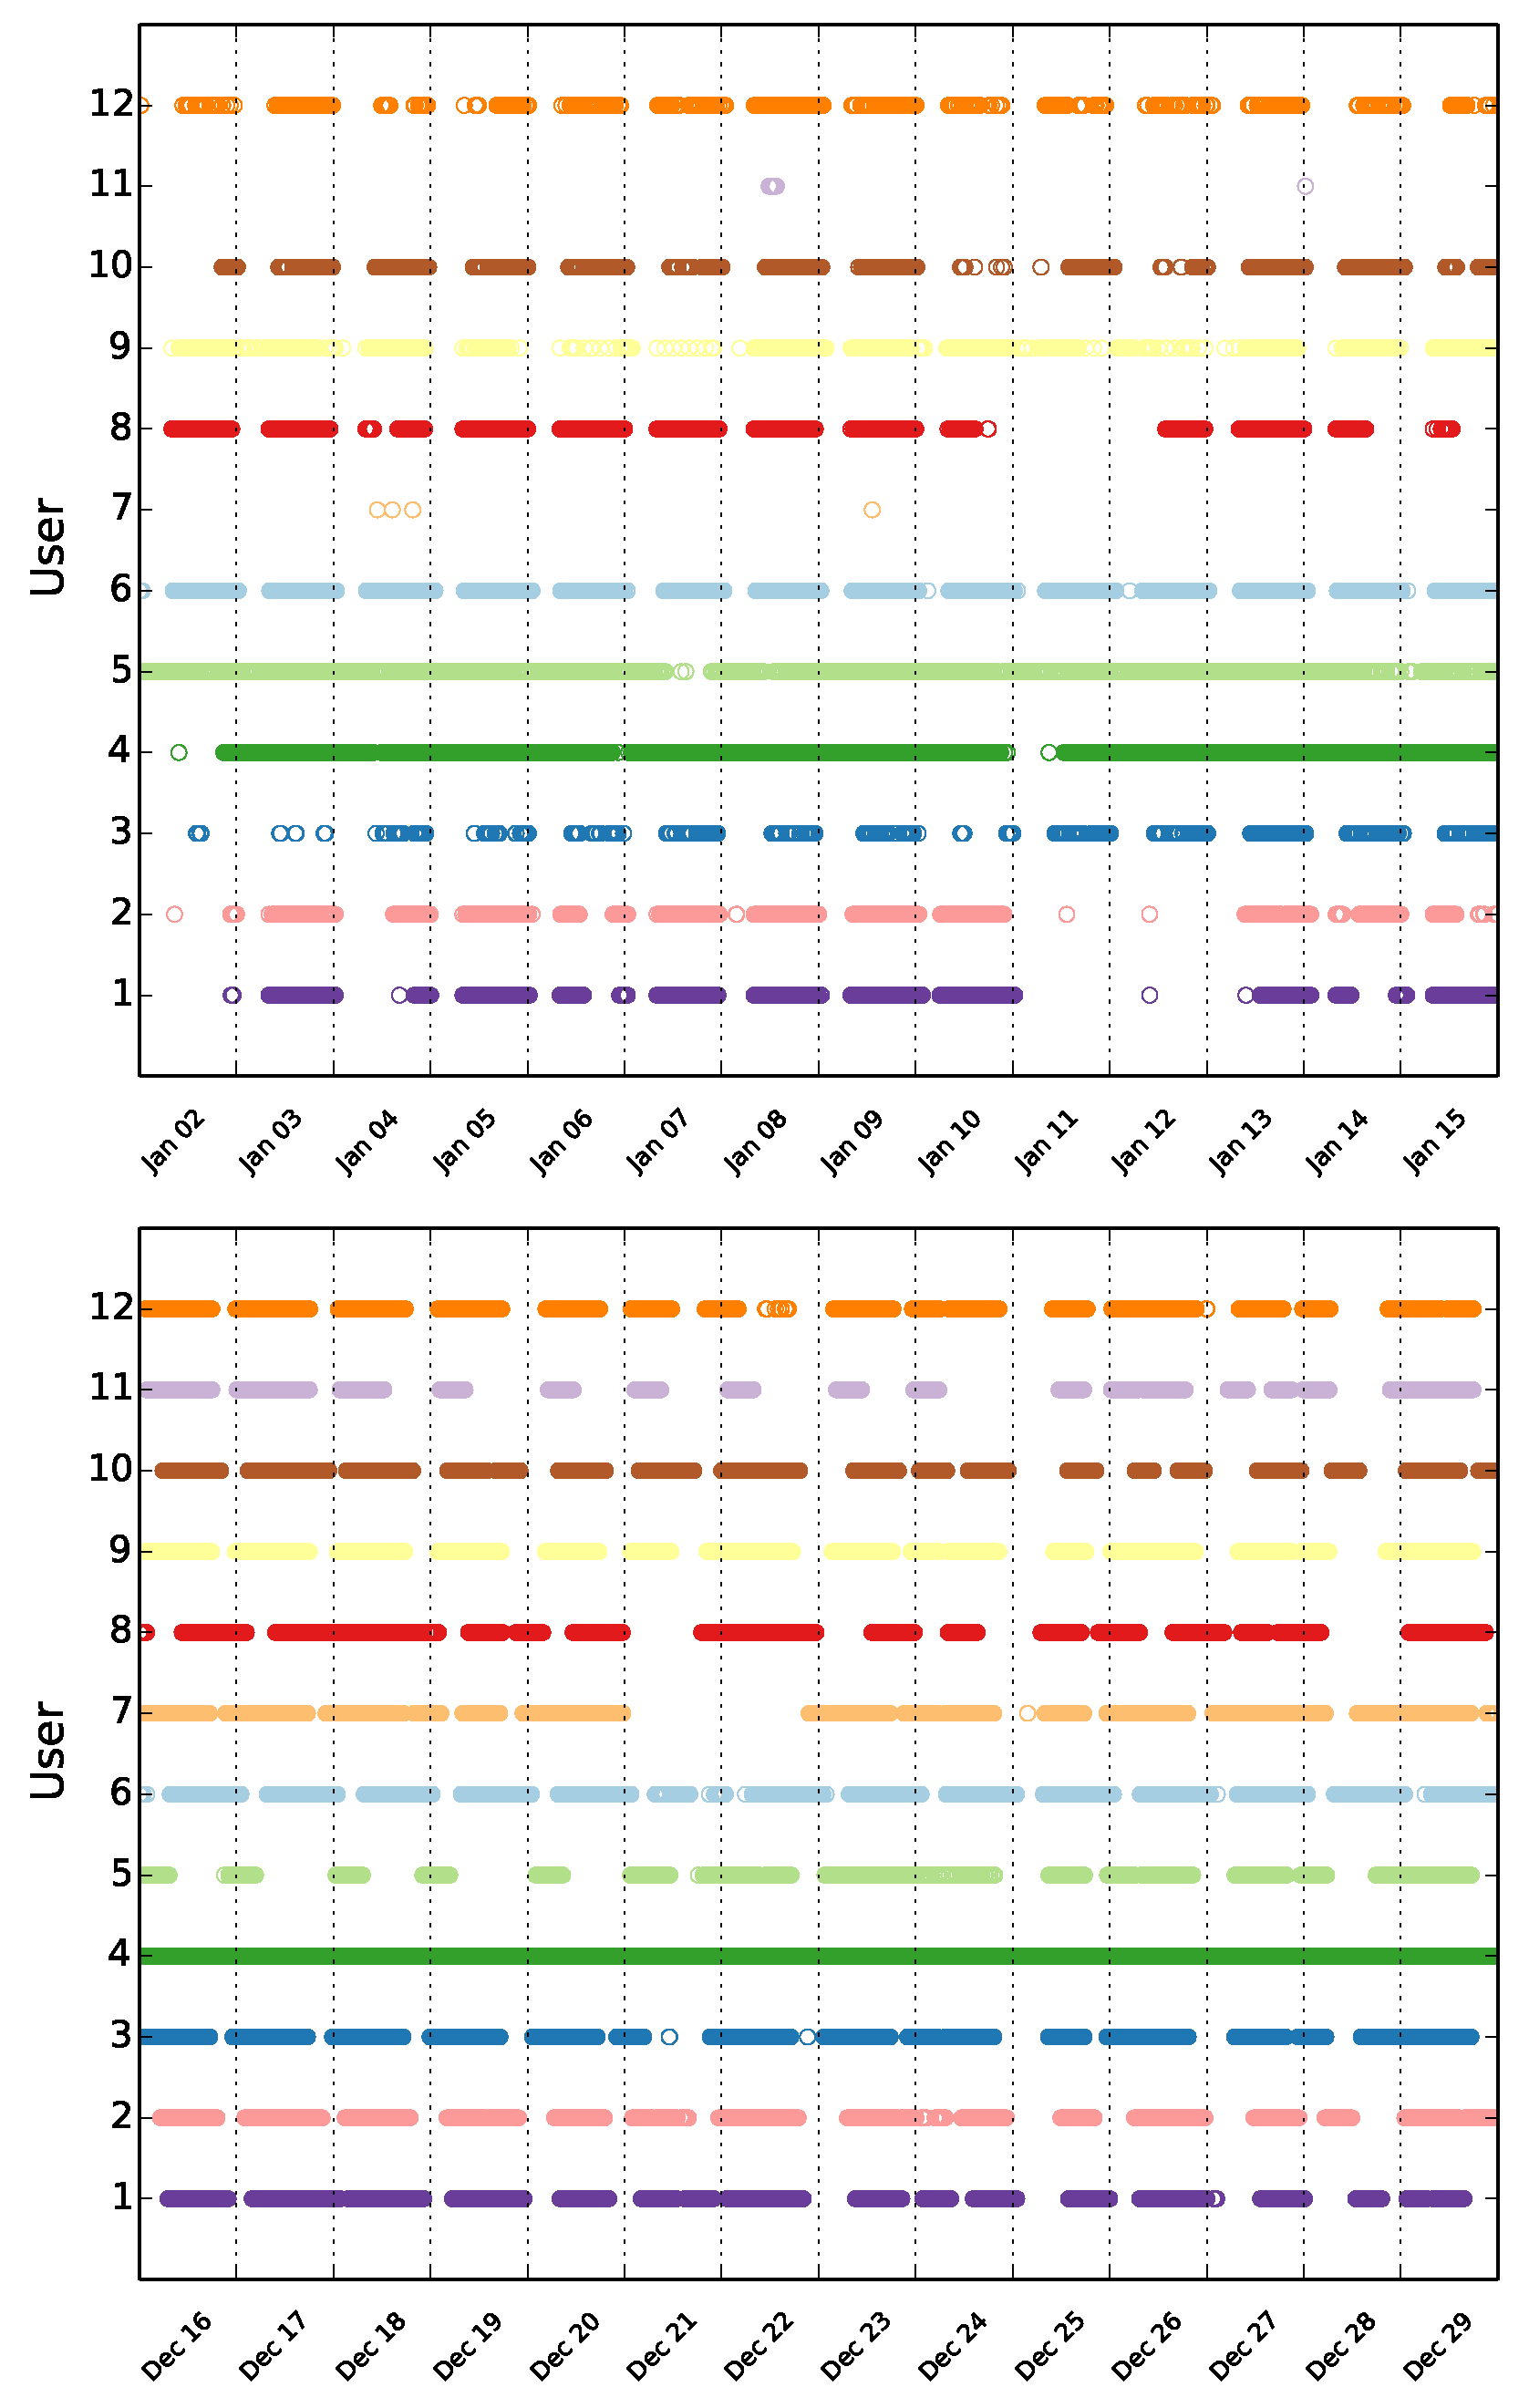
Figure 4.
Distribution of intertweet times () in hours on Weibo.
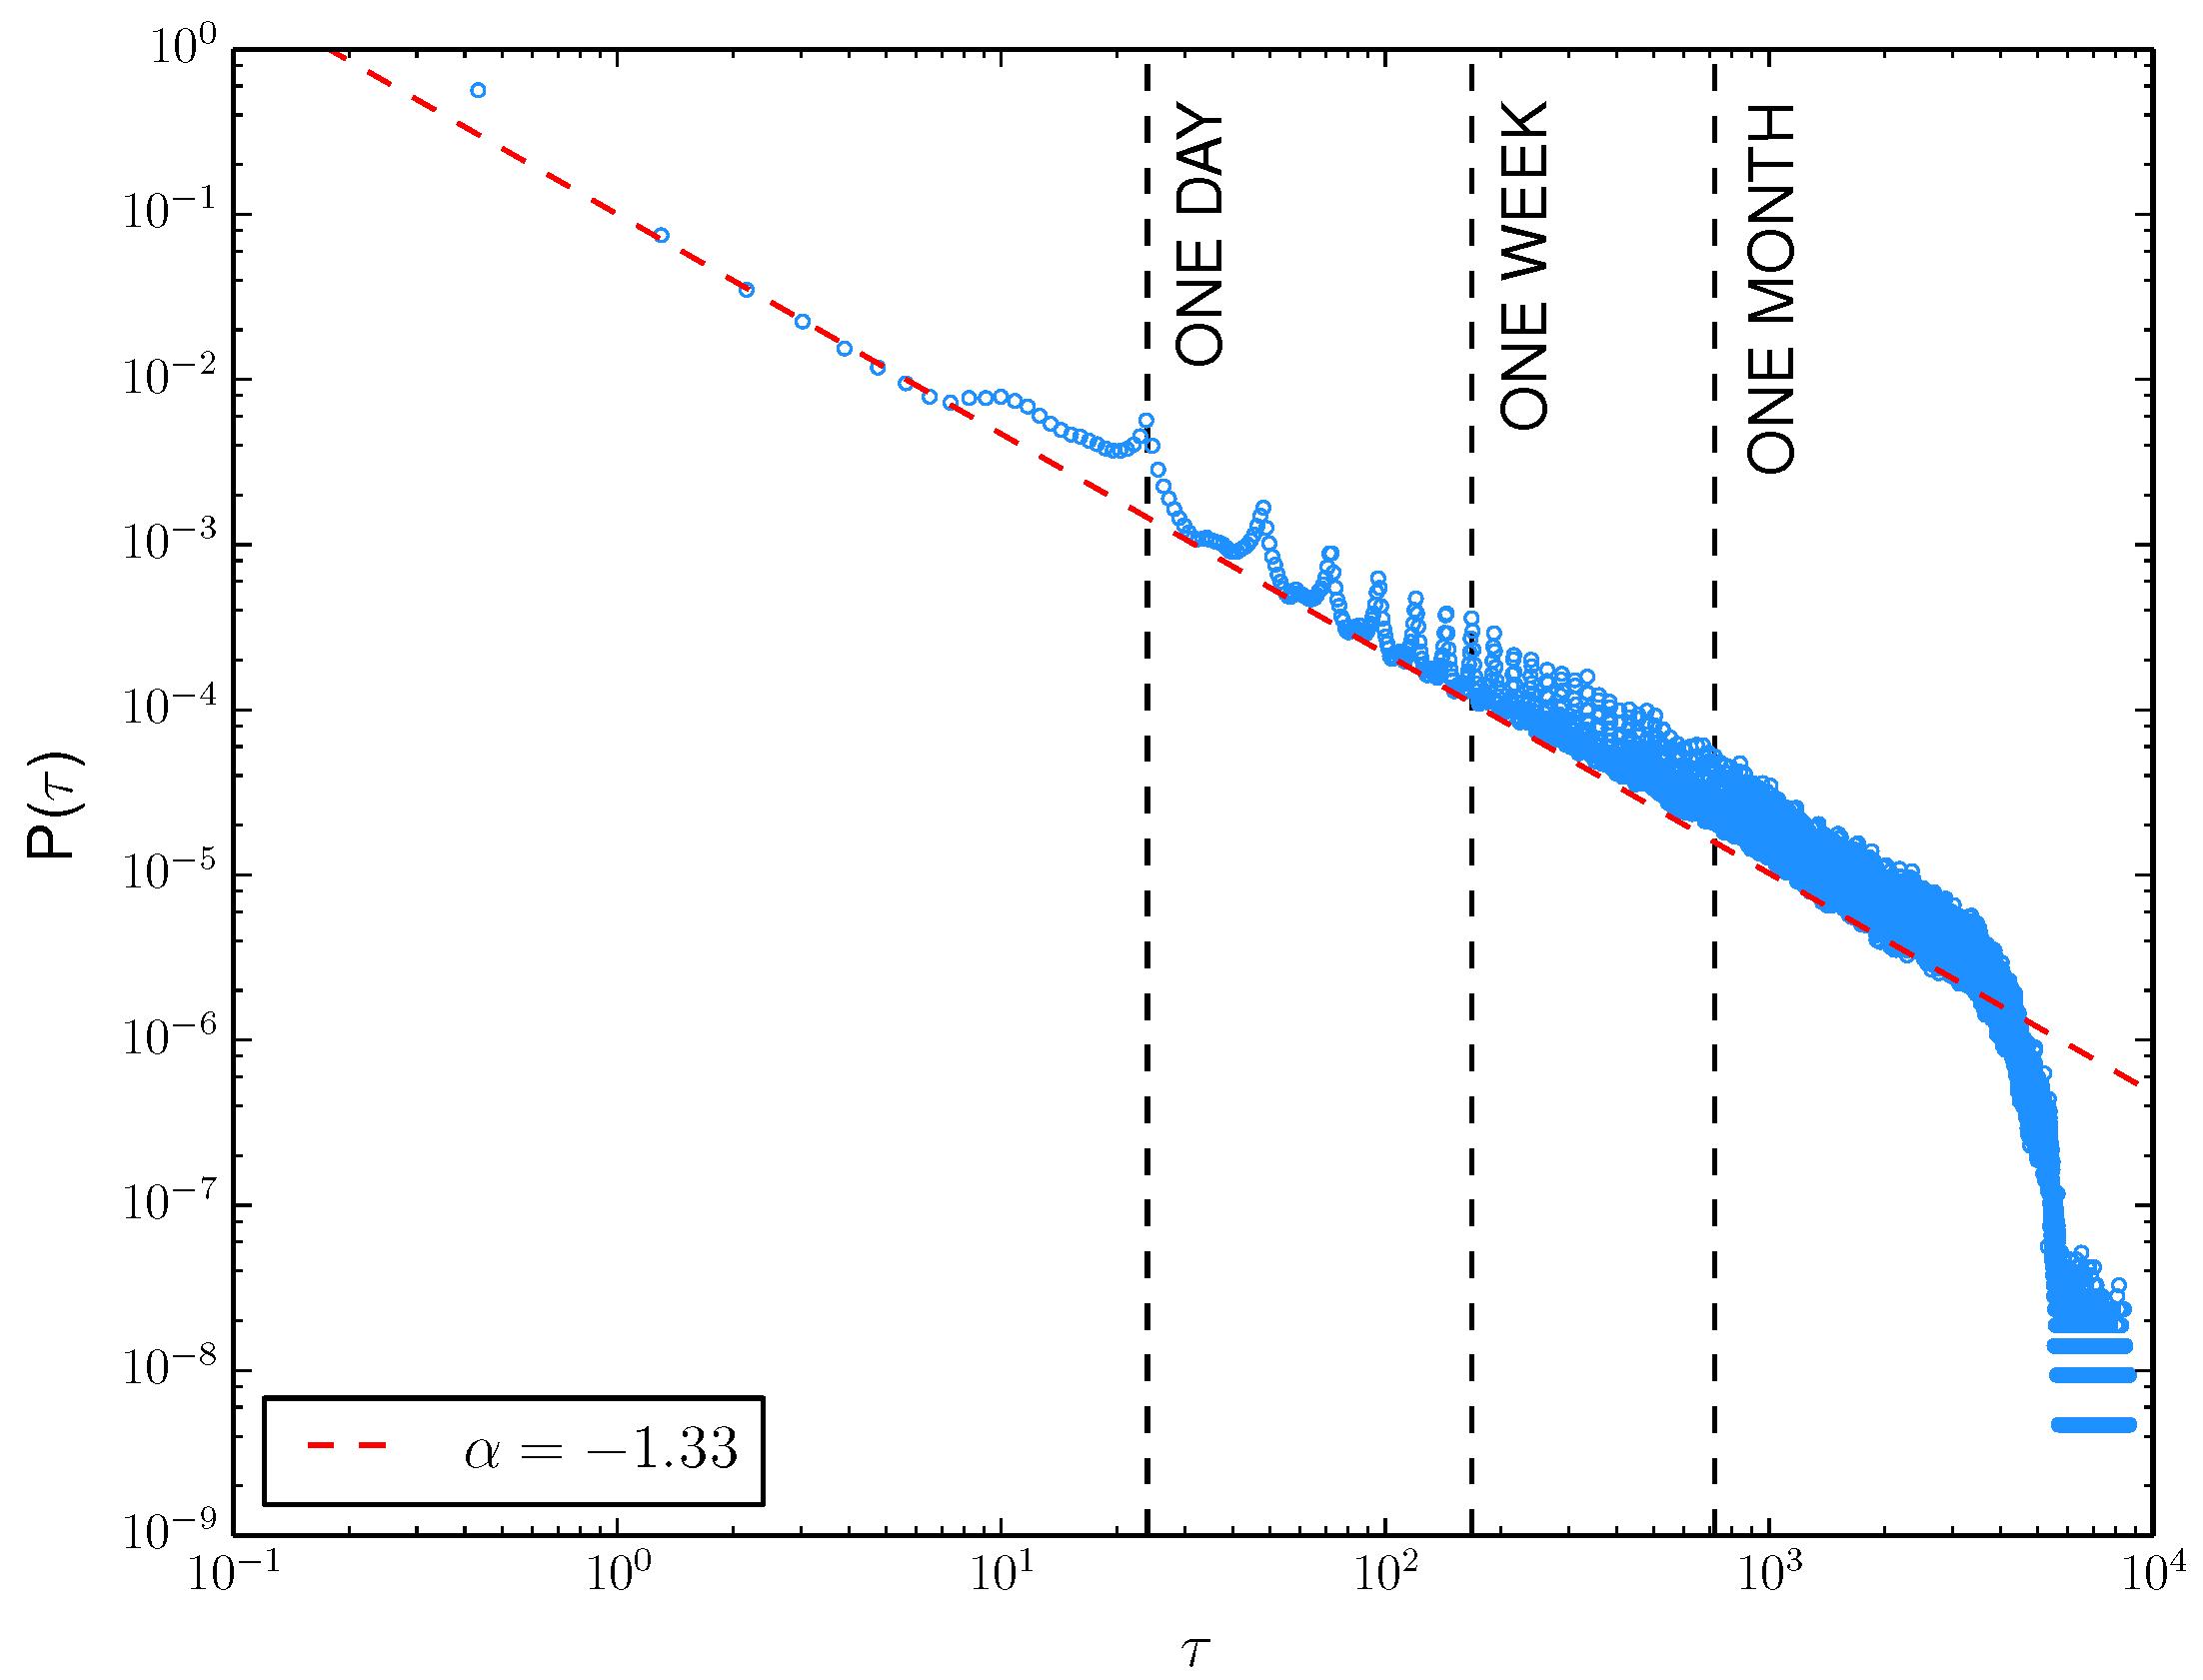
Figure 5.
Weibo intertweet time dispersion for day.]Distribution of intertweet times () for day.
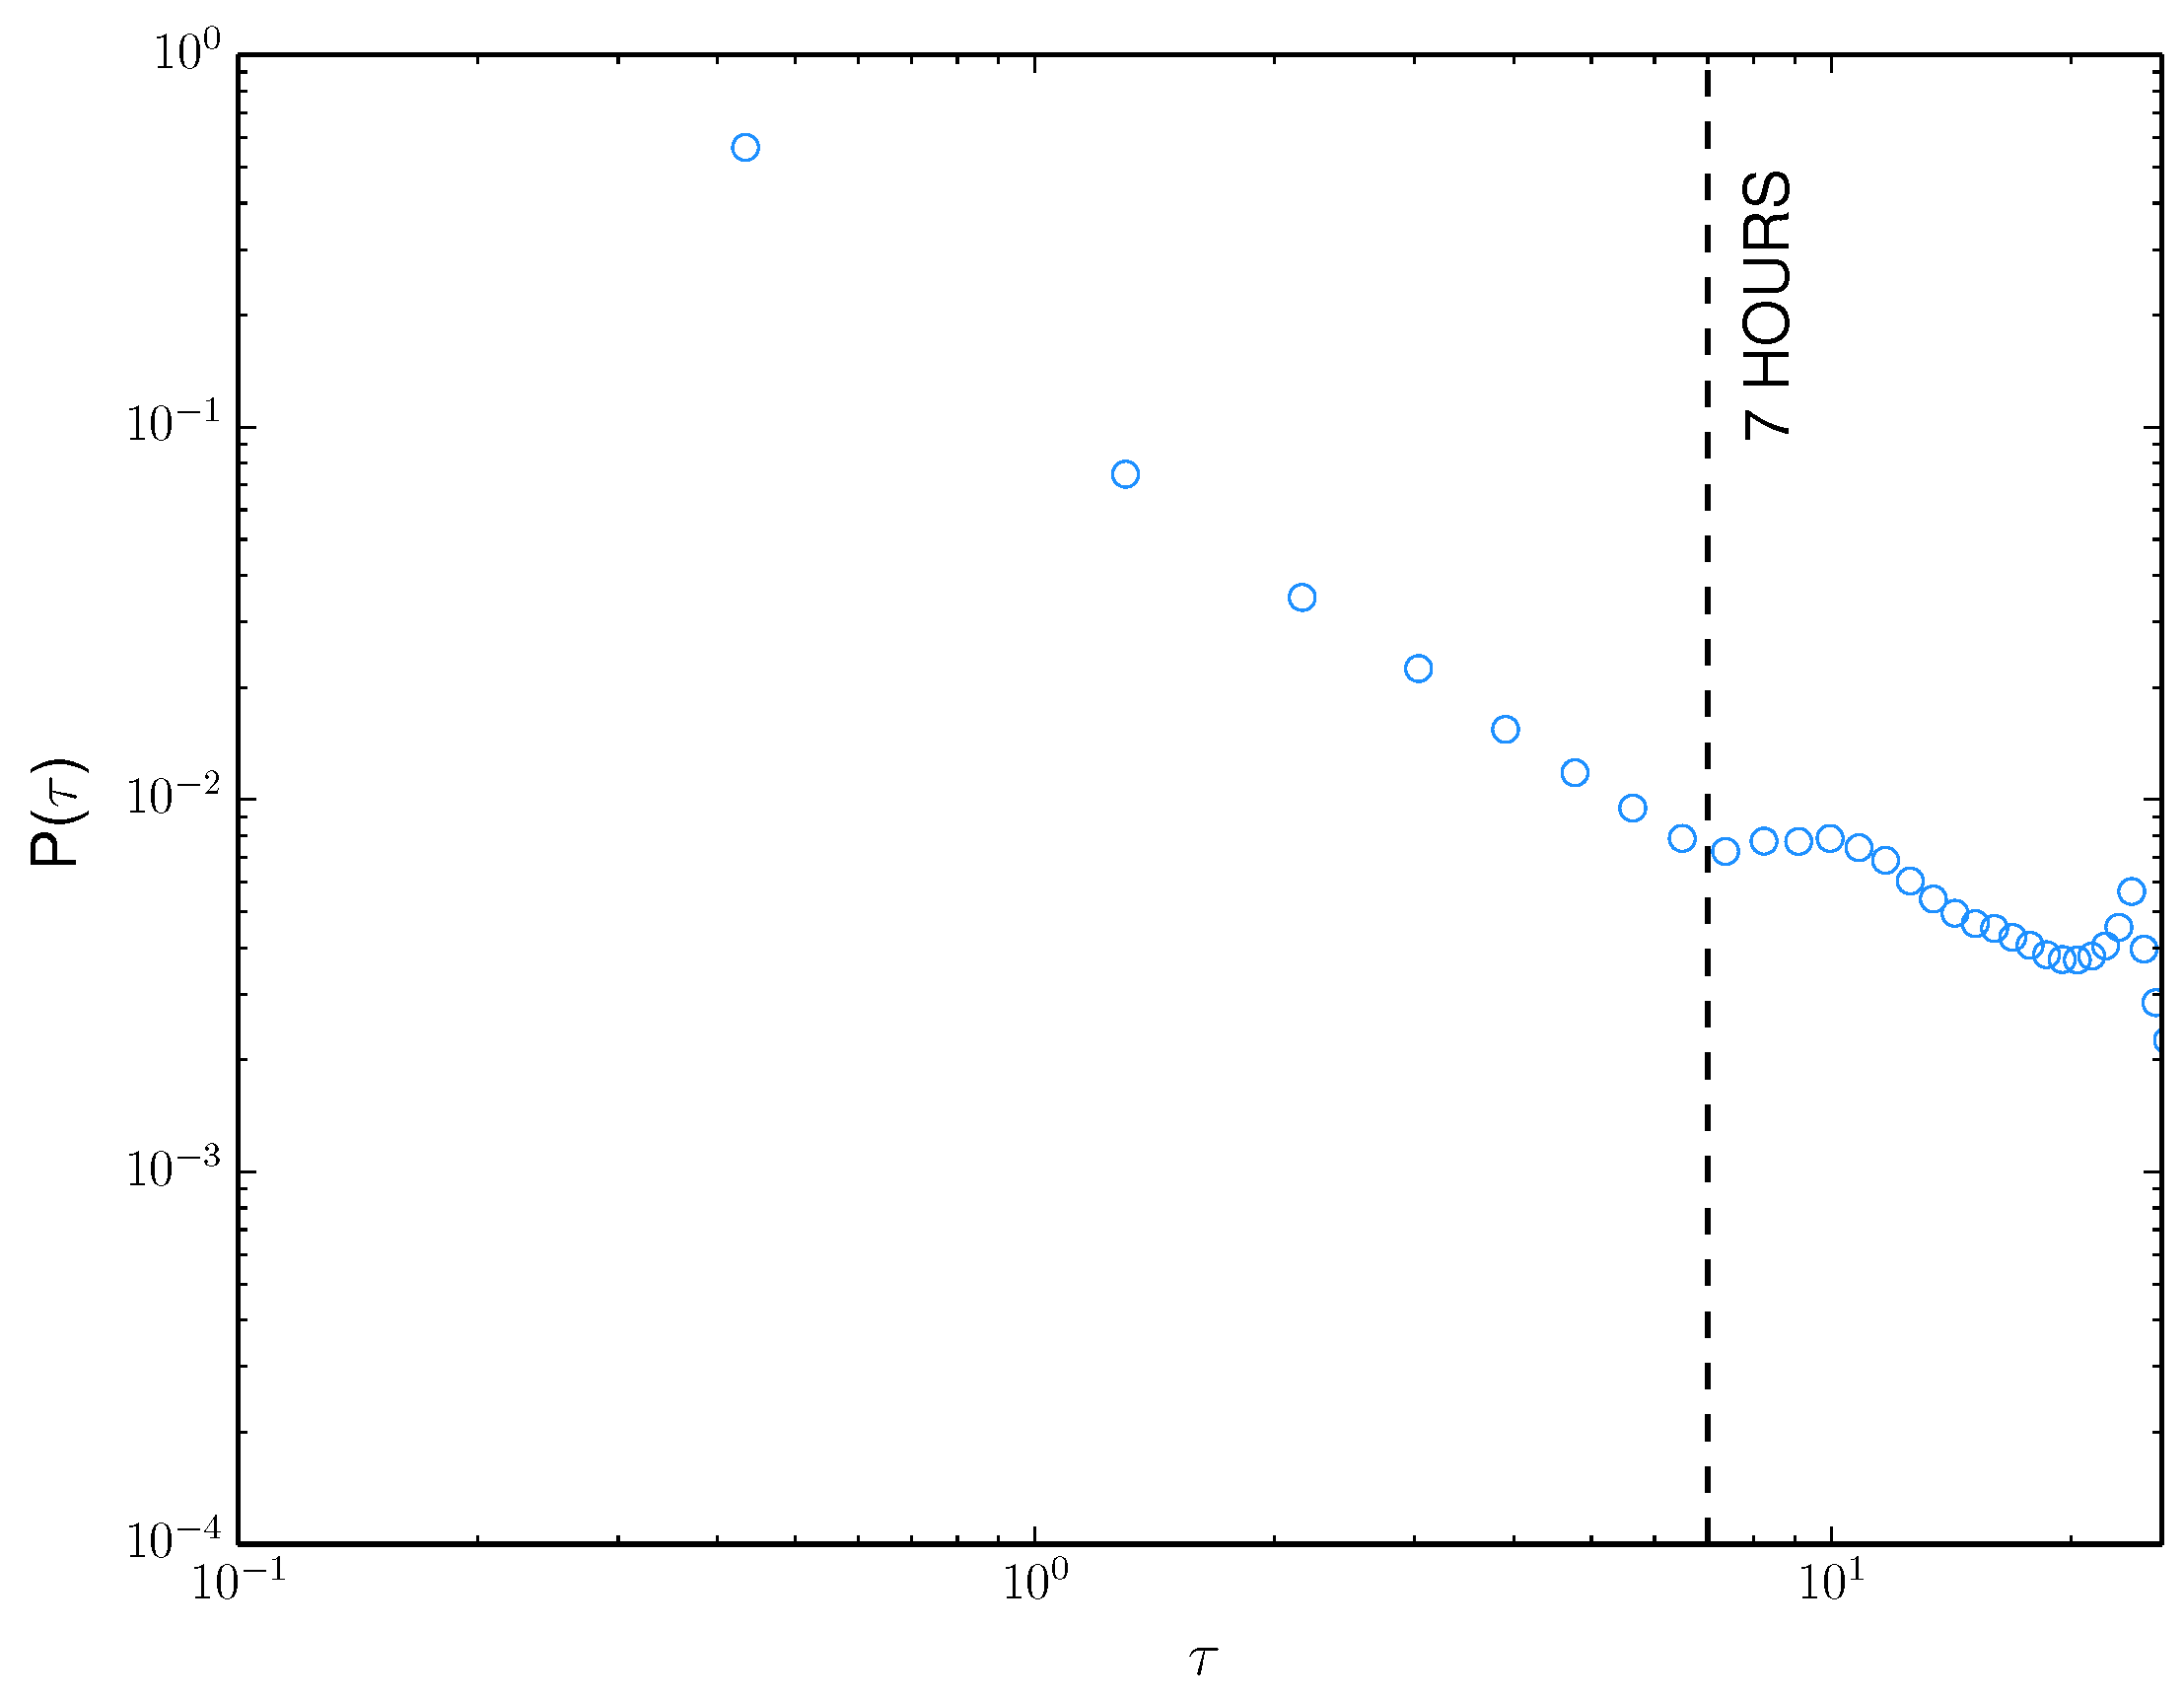
Figure 6.
Notation and speculations of repetitiveness aversion.](a) Groups and the group places of every maker tweet and (b) the two speculations of dreariness aversion.
Figure 6.
Notation and speculations of repetitiveness aversion.](a) Groups and the group places of every maker tweet and (b) the two speculations of dreariness aversion.
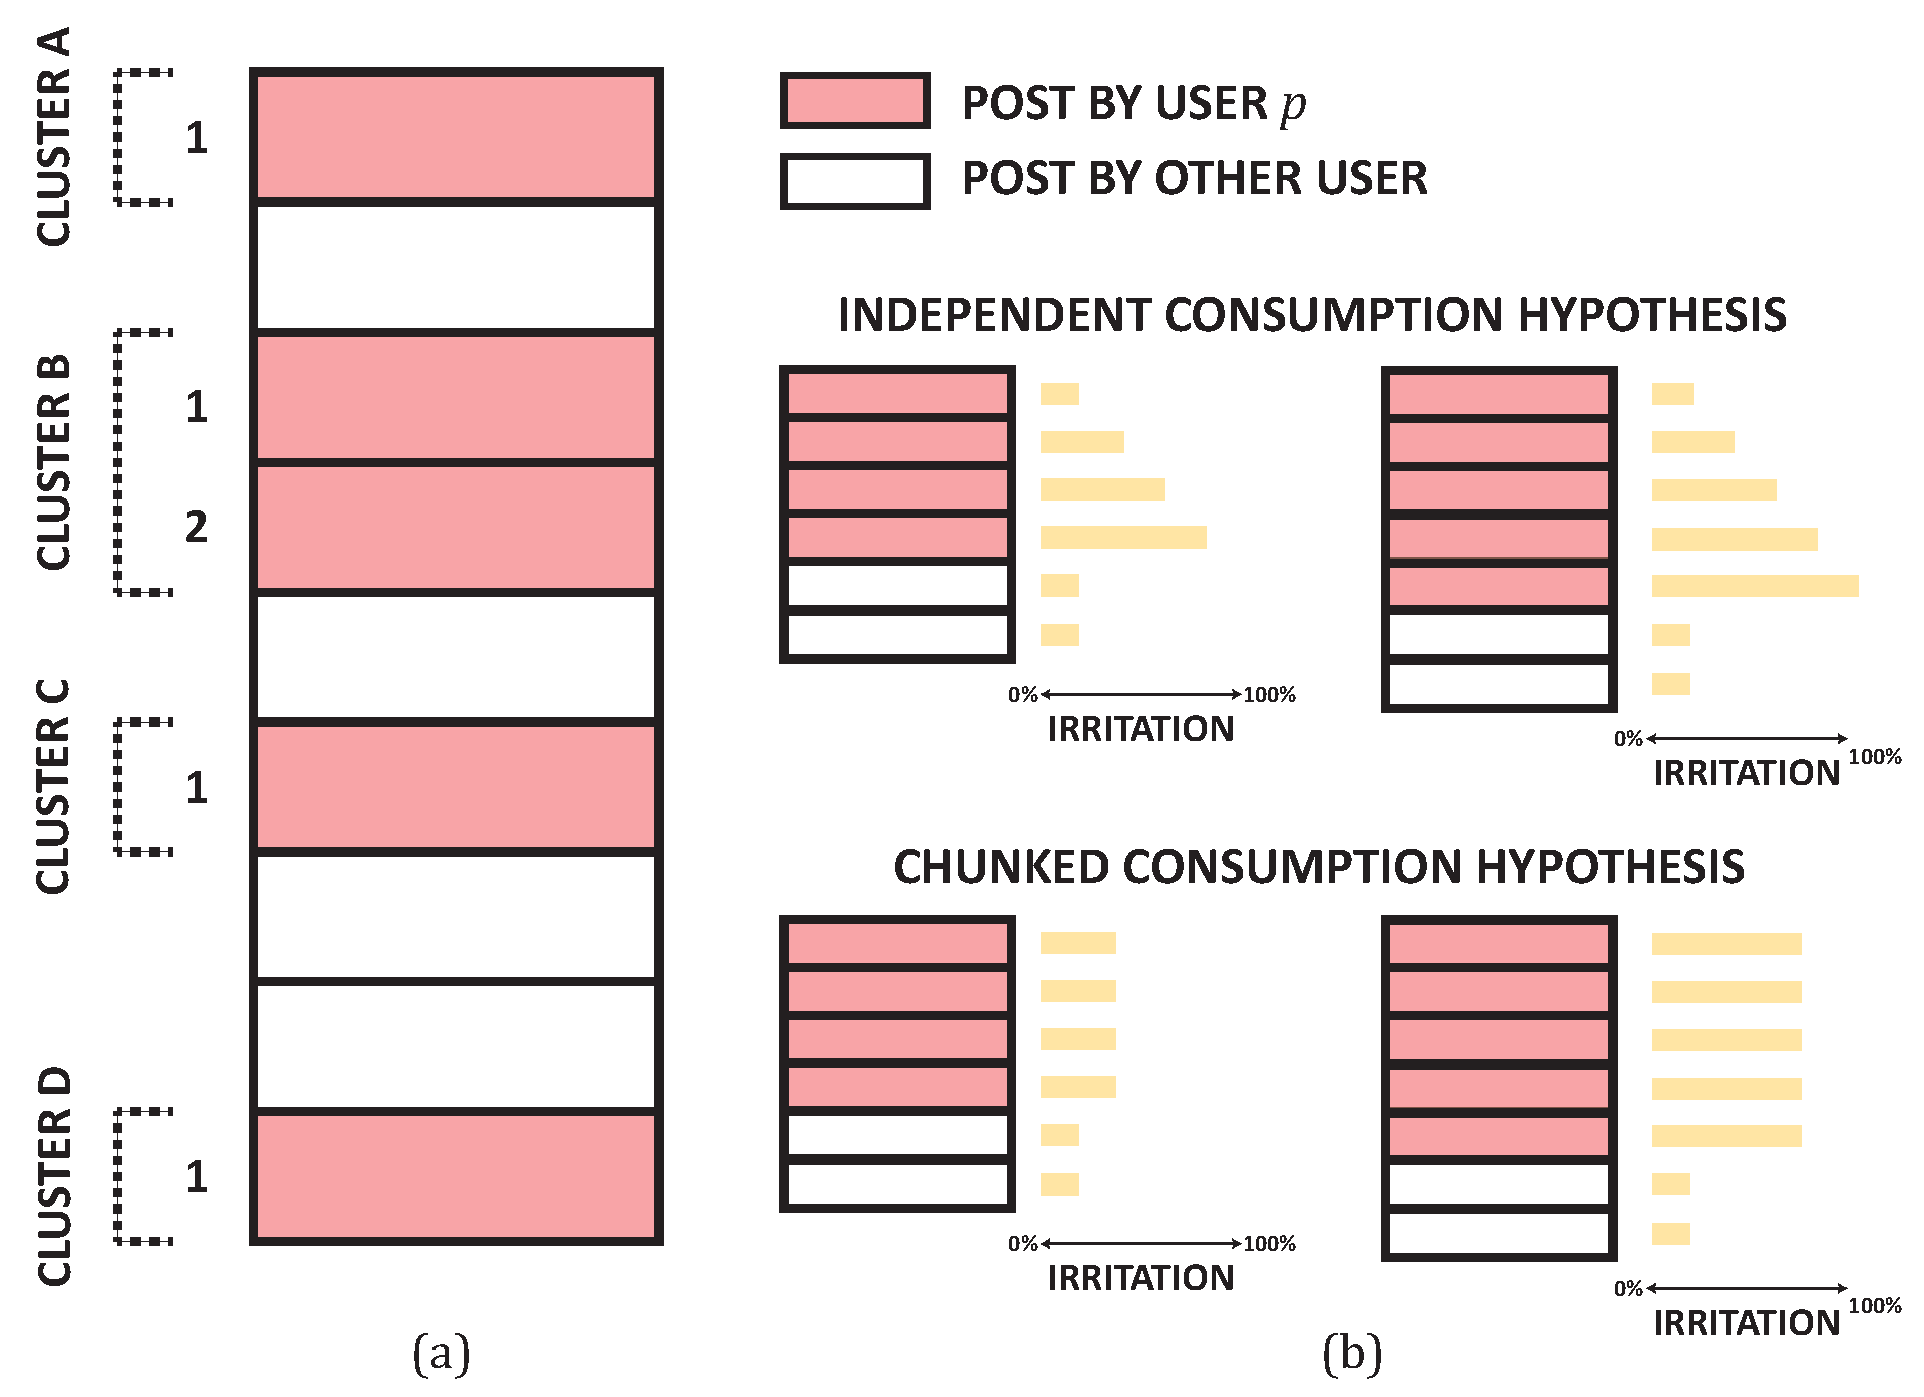
Figure 7.
The likelihood of being responded to given the bunch size. The dabbed line shows this likelihood across all group positions, while the strong lines show this likelihood given a decent bunch position.
Figure 7.
The likelihood of being responded to given the bunch size. The dabbed line shows this likelihood across all group positions, while the strong lines show this likelihood given a decent bunch position.
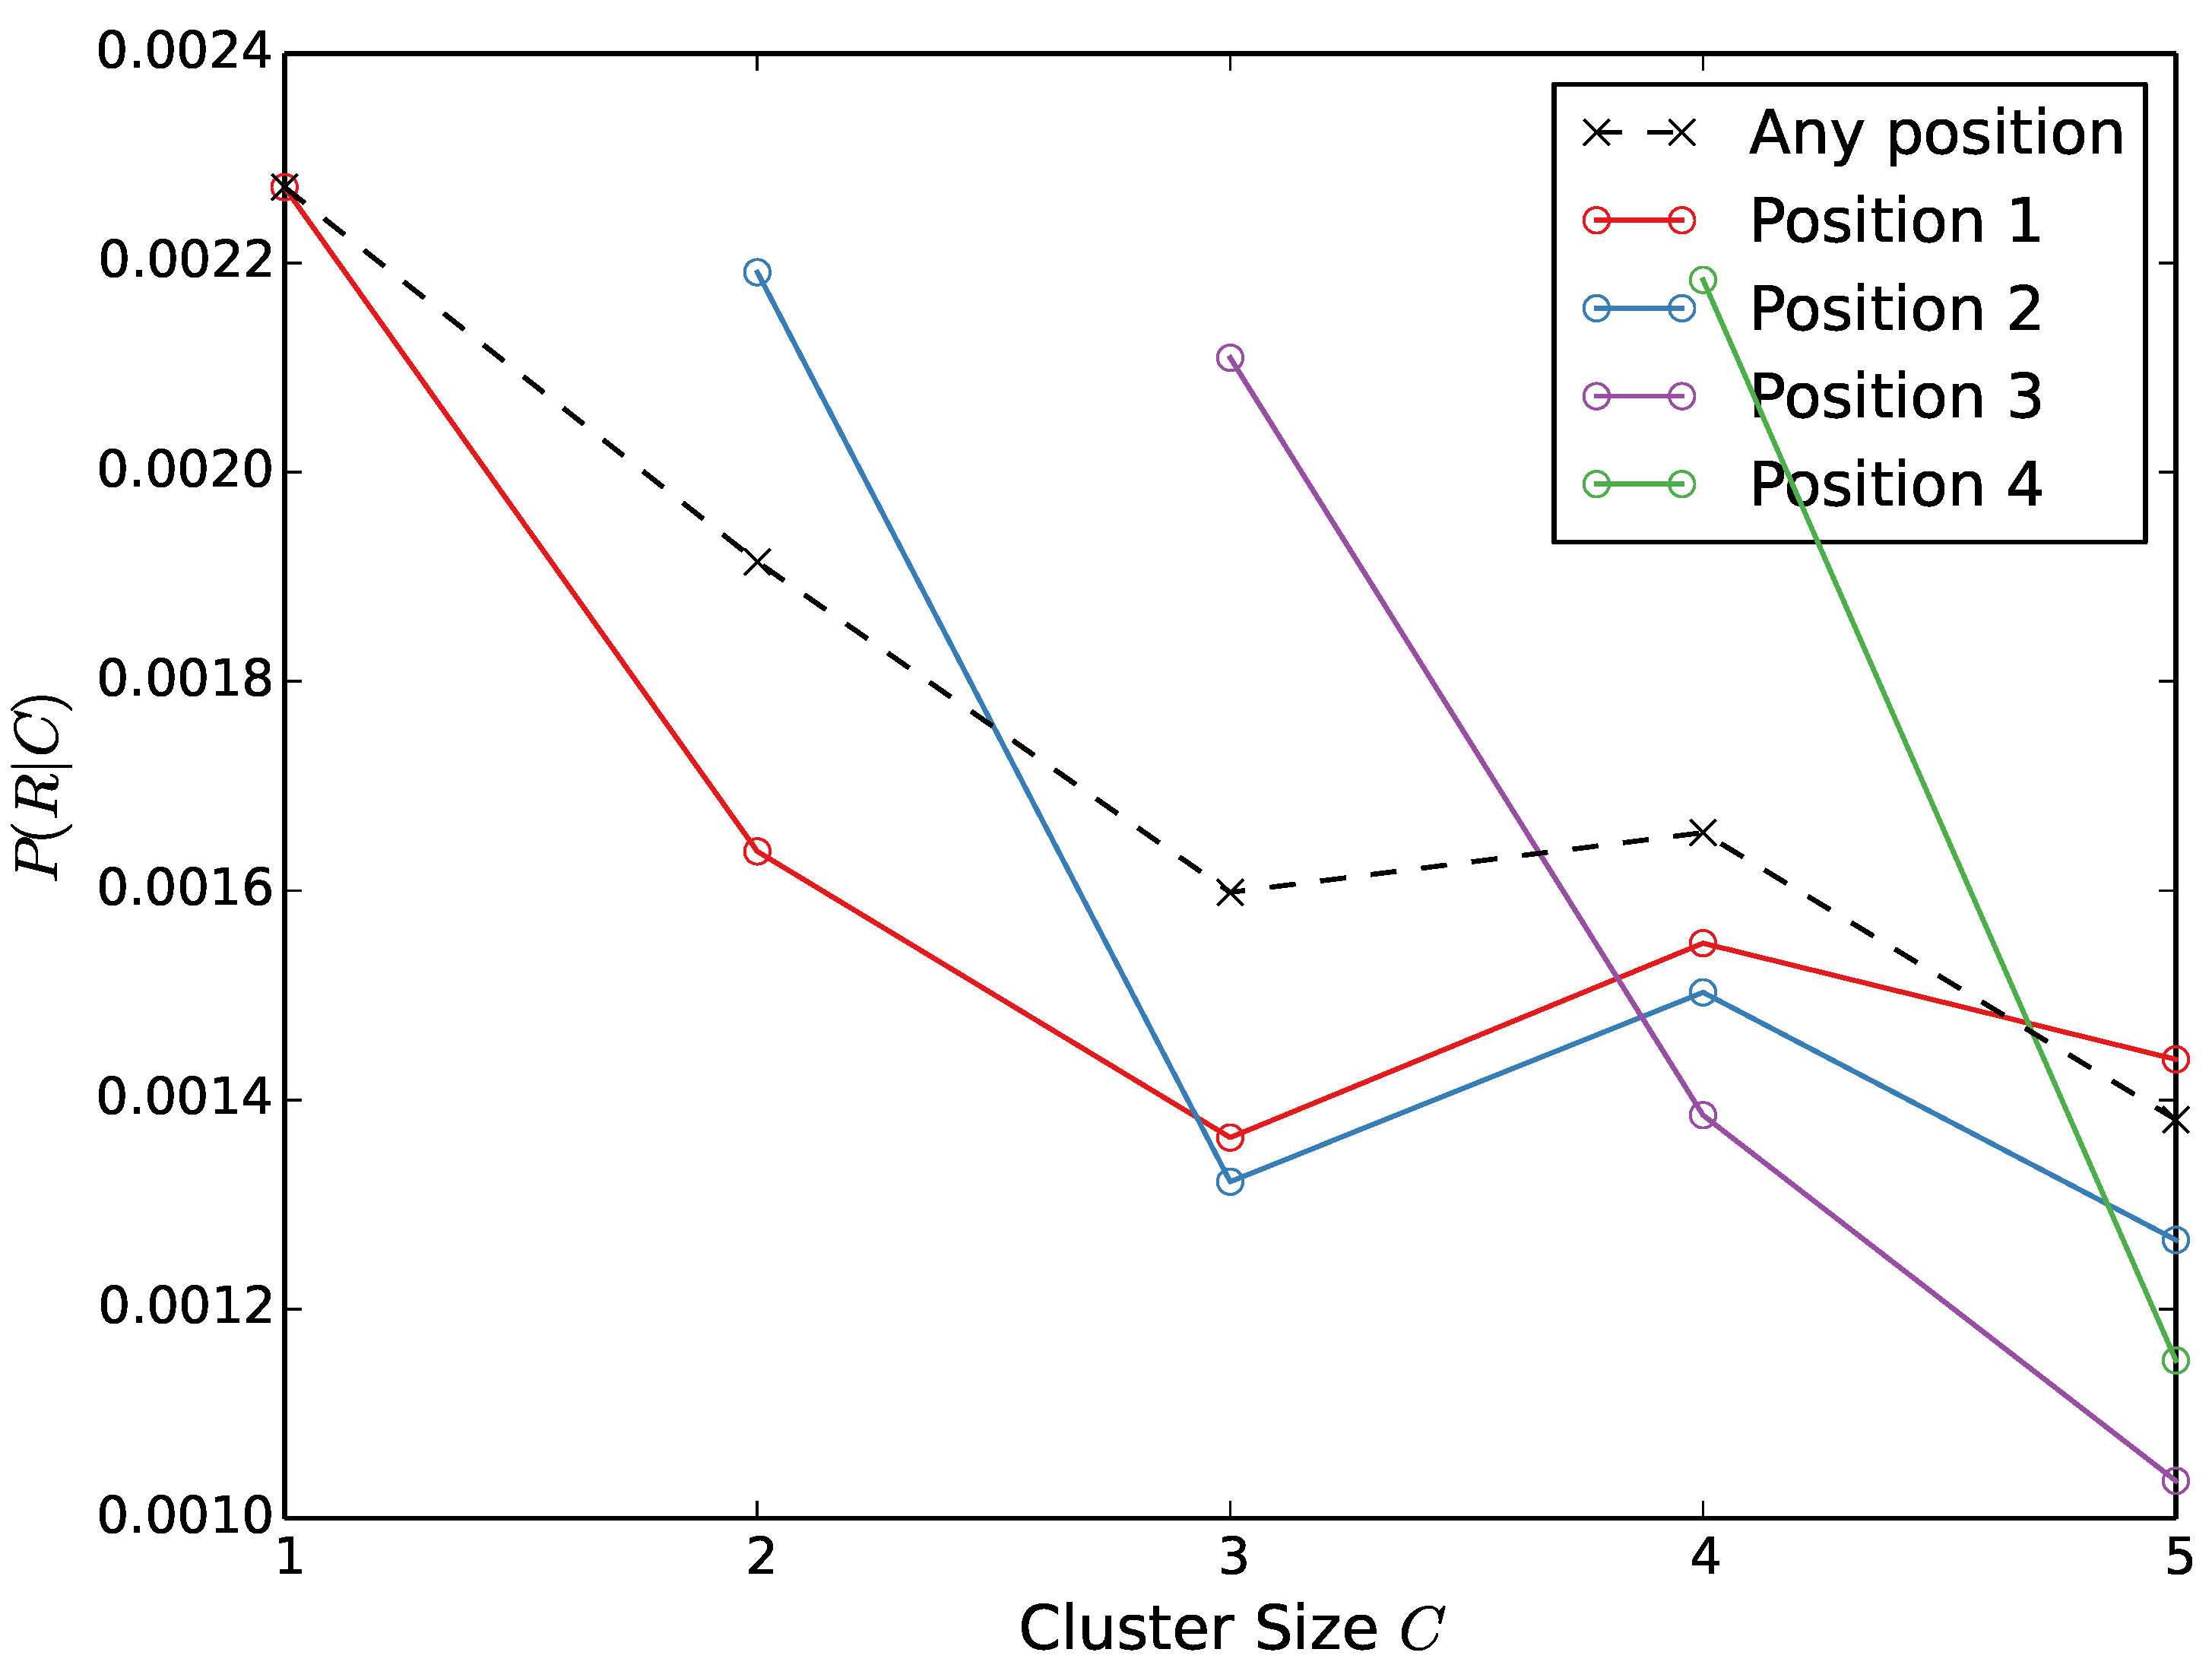
Figure 8.
An delineation of the course of events development and utilization cycles, and group classification. Subtleties are available in the principal content
Figure 8.
An delineation of the course of events development and utilization cycles, and group classification. Subtleties are available in the principal content
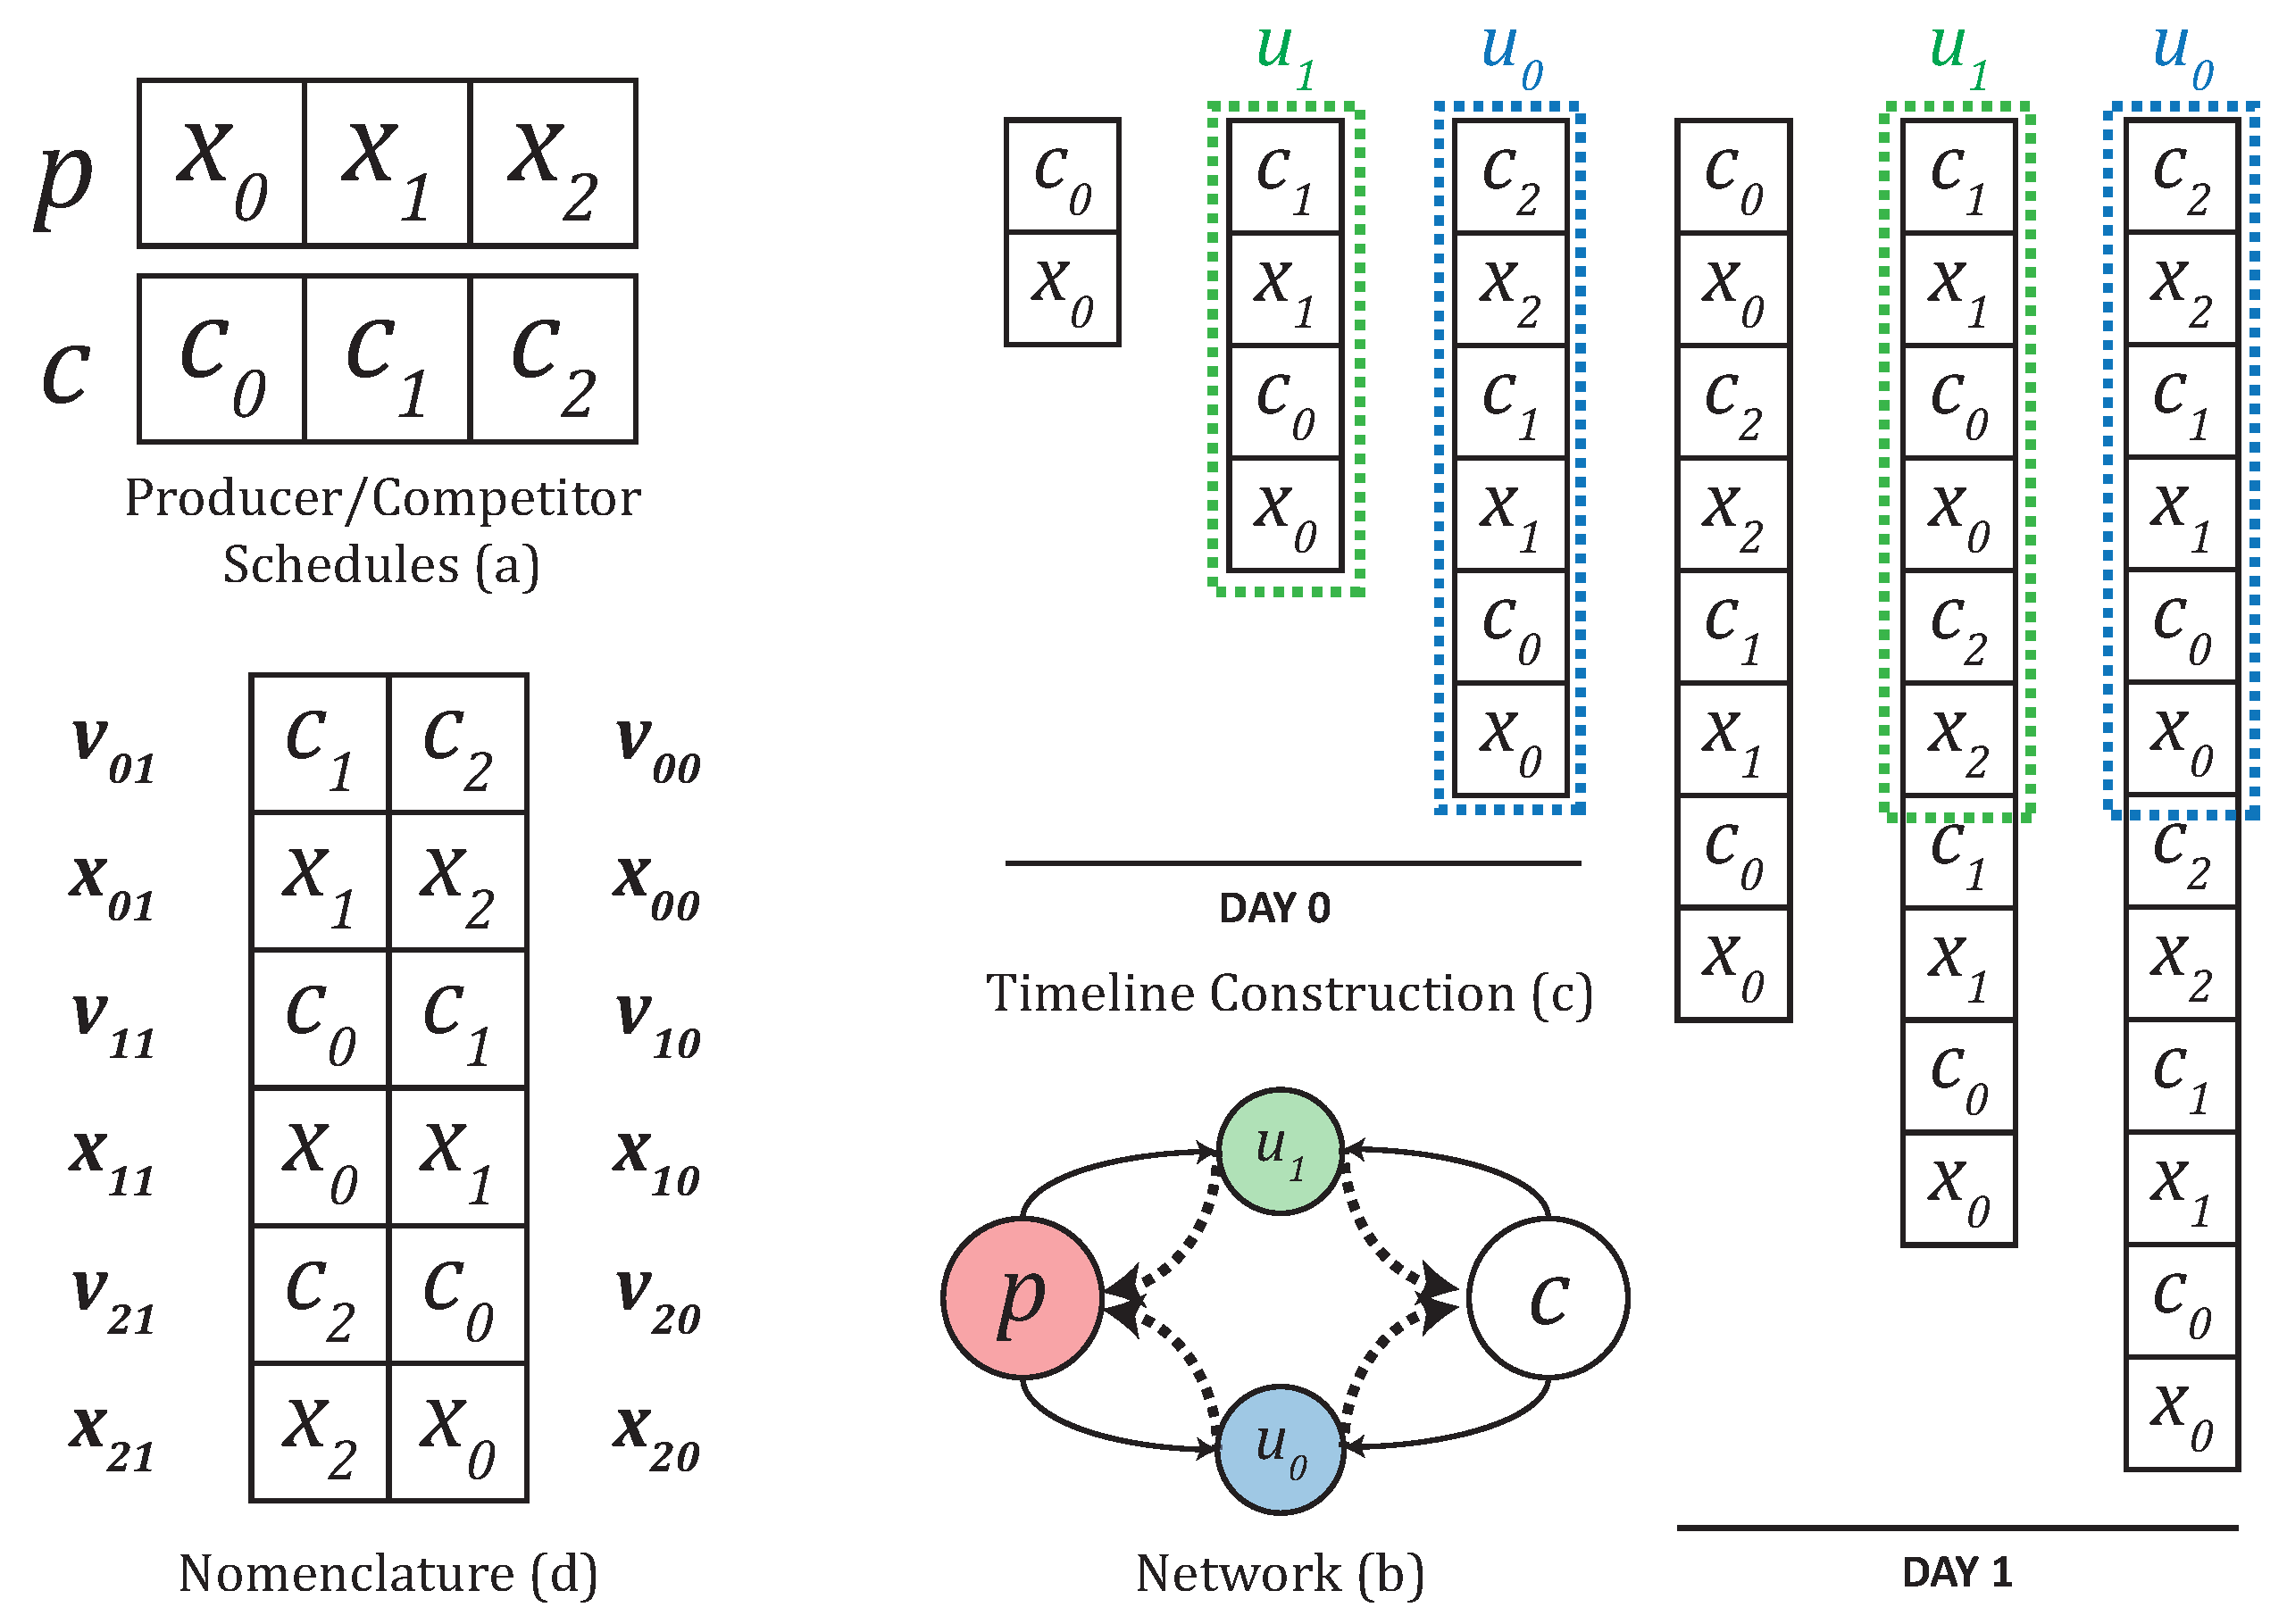

Table 1.
X-Friends Tweet Bunch Statistics.
| Cluster Size | # Reactions | # Complete Tweets |
|---|---|---|
| 1 | 15897 | 8435832 |
| 2 | 2756 | 1819014 |
| 3 | 710 | 586665 |
| 4 | 304 | 243536 |
| 5 | 126 | 126125 |
| 6 | 79 | 72486 |
| 7 | 54 | 49119 |
| 8 | 21 | 26376 |
| 9 | 16 | 17019 |
| 10 | 15 | 13600 |
| >10 | 28 | 49673 |
Table 2.
Observed test measurement for repetitiveness aversion. Cell contains , where R is the occasion of a response and C is the bunch size.
Table 2.
Observed test measurement for repetitiveness aversion. Cell contains , where R is the occasion of a response and C is the bunch size.
| - | 0.0004 | 0.0007 | 0.0006 | 0.0009 | |
| - | - | 0.0003 | 0.0003 | 0.0005 | |
| - | - | - | 0.0002 | ||
| - | - | - | - | 0.0003 |
Table 3.
p-values for dreariness aversion (Part 1).
| - | 0.001 | 0.001 | |
| - | - | 0.001 | |
| - | - | - |
Table 4.
Common Endurance Models, characterized for .
| Model | Survival Function | Parameters |
|---|---|---|
| Remarkable | ||
| Mathematical | ||
| Weibull | ||
| Log-strategic | ||
| Rayleigh |
Disclaimer/Publisher’s Note: The statements, opinions and data contained in all publications are solely those of the individual author(s) and contributor(s) and not of MDPI and/or the editor(s). MDPI and/or the editor(s) disclaim responsibility for any injury to people or property resulting from any ideas, methods, instructions or products referred to in the content. |
© 2025 by the authors. Licensee MDPI, Basel, Switzerland. This article is an open access article distributed under the terms and conditions of the Creative Commons Attribution (CC BY) license (http://creativecommons.org/licenses/by/4.0/).
Copyright: This open access article is published under a Creative Commons CC BY 4.0 license, which permit the free download, distribution, and reuse, provided that the author and preprint are cited in any reuse.


