
Submitted:
31 March 2025
Posted:
01 April 2025
You are already at the latest version
Abstract
Banana is an important cash and food crop worldwide. Recent outbreaks of banana diseases are threatening the global banana industry and smallholder livelihoods. Remote sensing data offer the potential to detect the presence of disease, but there is a need for formal analysis to compare inferred with observed disease data. Here we use Landsat-8 data to investigate the detection of two banana diseases: banana bunchy top disease (BBTD) and Fusarium wilt Tropical Race 4 (TR4). We use satellite imagery to develop meteorology-driven predictive models for vegetation phenology, specifically based on healthy crops. Machine learning is then applied to identify anomalies associated with diseased plants by comparing the predicted vegetation indices of healthy crops with the observed indices from published data when disease is present. Our results show a correlation between changes in vegetation indices and the number of infected cases, highlighting the potential of this approach for large-scale disease surveillance.
Keywords:
remote sensing
; plant disease detection
; Landsat
; machine learning
1. Introduction
Bananas are one of the most widely consumed fruits globally [1] as well as one of the world’s most valuable primary agricultural commodities [2]. However, banana production is affected by numerous diseases, including black leaf streak (Black Sigatoka) [3,4], yellow Sigatoka [5], banana streak [6], Xanthomonas wilt [7], Panama disease (Fusarium wilt) [8] and banana bunchy top [9]. These diseases can cause substantial yield losses, threatening livelihoods and food availability in affected regions [10,11]. Novel and rapid methods for the timely detection of diseases will enable more effective surveillance and facilitate the development of control measures with increased efficiency [12].
Traditional methods for detecting banana diseases, such as field inspections and laboratory testing, are often labour-intensive, time-consuming, and costly [13]. Moreover, ground-based approaches are limited in their capacity to monitor large plantations efficiently, especially in remote or hard-to-access areas. Advances in remote sensing technologies and machine learning can offer new possibilities to address these challenges [14].
The primary objective of this study is to evaluate the detection of banana diseases based on satellite observations. Landsat-8, a satellite launched as part of the Landsat program, provides high-resolution, multispectral imagery [15]. The spectral bands of Landsat-8 capture critical information on plant reflectance in visible, near-infrared (NIR), and shortwave infrared (SWIR) regions, which are sensitive to changes in vegetation health. Landsat imagery has been used to monitor plant diseases such as wheat powdery mildew [16], sudden oak death [17] and pine wilt disease [18].
We investigate two banana diseases that pose major threats to banana production globally: banana bunchy top disease (BBTD) and Fusarium wilt Tropical Race 4 (TR4) [19]. Banana bunchy top disease is caused by banana bunchy top virus (BBTV) that is transmitted from infected to healthy plants by an aphid vector Pentalonia nigronervosa with additional transmission to field sites by the use of infected propagation material [20]. The most characteristic symptom is the "bunchy" appearance of banana plants, where new leaves become narrow, upright, with chlorotic margins, and crowded at the top of the plant, giving it a rosette or "bunchy top" look [21]. When plants are infected with BBTV, their leaves may become smaller, firmer, and more brittle, often developing wavy or crinkled edges [22]. The appearance of BBTV symptoms and symptom expression can vary amongst cultivars [23]. The second disease, widely known as Foc TR4, is a form of Fusarium wilt or Panama disease, caused by the fungus Fusarium oxysporum f. sp. cubense Tropical Race 4 [24]. The most common symptom of Fusarium TR4 is the yellowing of older leaves, which starts at the leaf margins and progresses toward the midrib [25]. Affected leaves wilt, droop, and collapse, often hanging down along the pseudostem, eventually drying out and dying. Fusarium TR4 causes 100% loses of infected banana plants [2].
In this study, we present an innovative approach for detecting banana diseases using high-resolution remote sensing data in combination with non-parametric statistical methods within a machine learning framework. Our model predicts vegetation indices (VIs) as a function of meteorological conditions at specific locations, effectively capturing seasonal dynamics in VI variations. By generating expected VI values under healthy conditions, the model enables the identification of anomalies indicative of disease outbreaks. To validate our approach, we analysed two case studies: a BBTD outbreak in a banana plantation located in the Northern Rivers Region of New South Wales, Australia, and a Tropical Race 4 (TR4) outbreak in a banana plantation, in Nampula Province in northern Mozambique, both selected due to the availability of published epidemiological data. We included an analysis of an additional plantation in the Northern Rivers Region of New South Wales with no reported presence of disease as a control. Our findings reveal a correlation between VI anomalies and the number of infected cases, demonstrating the potential of this methodology for large-scale, early disease surveillance and precision agriculture applications.
2. Materials and Methods
2.1. Case Studies
2.1.1. Banana Bunchy Top Disease
The first case study involves the spread of BBTD in a banana plantation located in the Northern Rivers Region of New South Wales, Australia, which we call ’NSW1 plantation’ [26]. The plantation covers an area of approximately 12 hectares. Surveys to record the occurrence of disease were conducted at monthly intervals from December 2014 to January 2018. In addition to the NSW1 plantation, we selected a second plantation 20km away in the same region, which had no reported presence of banana diseases from April 2013 to March 2016, to serve as a control for testing the methodology. We call this plantation ’NSW2’.
2.1.2. Fusarium TR4
The second case study is on Panama disease Fusarium oxysporum f. sp. cubense tropical race 4 (TR4) in Nampula Province in northern Mozambique, which we call ’NM plantation’ [27]. The plantation covers an area of approximately 265 hectares. Between April 2013 and October 2015, the number of affected plants was recorded weekly, with total cases aggregated every three months. Plant counting was discontinued in October 2015 due to the overwhelming number of dead plants, making it difficult to accurately determine infections in newly affected plants [27].
2.2. Methodological Approach
Figure 1 presents the workflow of our study, which consists of three key stages. First, we compile data for plantation area, incorporating eight surface reflectance bands from Landsat-8, meteorological variables (temperature and precipitation), and disease surveillance records. Following pre-processing of the surface reflectance time series, we derive 11 vegetation indices (VIs) to serve as key indicators of plant health. In the second stage, we develop pixel-level random forest (RF) models to predict VIs from historical meteorological data specific to each location. The RF models are fine-tuned through hyperparameter optimization, guided by multiple performance evaluation metrics to ensure robust predictive accuracy of VI values of healthy crops. The optimized RF models are then employed to estimate expected VI values under healthy, disease-free conditions across the plantation area. In the final stage, disease presence is detected by quantifying the deviations between observed and predicted VIs. This allows identification of potential outbreak zones.
2.3. Datasets
2.3.1. Remote Sensing Imagery
We used Landsat 8 OLI surface reflectance data. The surface reflectance images were collected from April 1, 2013, to January 1, 2019. The data have a 30 m spatial resolution with a 16-day revisit cycle. The cloud-free mask algorithm was used to remove bad-quality observations that were identified as clouds, cloud shadows, and snow. All data were exported from Google Earth Engine [28]. The image data ID for the surface reflectance data on Google Earth Engine was ‘LANDSAT/LC08/C02/T1_L2’.
2.3.2. Temperature Data
The MOD11A1 V6 product provides Daytime Land Surface Temperature (band ’LST_Day_1km’) and Nighttime Land Surface Temperature (band ’LST_Night_1km’) [29]. The data have a 1 km spatial resolution. Data were extracted for the period from January 1, 2010, to January 1, 2019 and converted from Kelvin to Celsius.
2.3.3. Precipitation Data
We used the NASA GES DISC product ’NASA/GPM_L3/IMERG_MONTHLY_V06’, which provides merged satellite-gauge precipitation estimates [30] at 10 km spatial and monthly temporal resolution. Data were extracted for the period from January 1, 2010, to January 1, 2019 and converted from mm/hr to mm/d.
2.4. Pre-Processing and Analysis
2.4.1. Plantation Boundary Delineation
We used coordinates provided in [26] and [27] as the locations of the centres of the NSW1 and NM plantations, respectively (Figure 2A,C). Plantation boundaries were delineated manually together with location of the centre of the NSW2 plantation from high spatial resolution airborne imagery in Google Earth Engine [28]. The boundaries of the NSW1, NSW2 and NM plantations are shown in Figure 2B,C,E.
2.4.2. Smoothing of Time Series Data
2.5. Vegetation Indices
A set of 11 commonly used vegetation indices (VIs) was selected. The formulas for these VIs, along with their respective references, are provided in Table 1. After calculating the vegetation indices, their values were interpolated at regular 10-day intervals.
2.6. Model Construction
The random forest (RF) classifier is an ensemble learning method that generates multiple decision trees using randomly selected subsets of training samples and features [44]. The RF model was constructed using the R package ’randomForest’ [45]. To train and test the RF model, we used VI values from April 2013 to March 2016 for training of models and from April 2016 to December 2016 for testing of models. The starting date was limited by the availability of Landsat-8 data. We used daytime temperature, nighttime temperature, and precipitation from to days preceding each VI observation. The parameter K was treated as a hyperparameter. An RF model was fitted for each individual 30 m × 30 m pixel.
2.7. Model Accuracy Assessment
Vegetation indices were randomly split into training and testing datasets with an 80%:20% ratio. The training dataset was used to optimize the random forest regression model, while the testing dataset was used to evaluate the model’s predictive reliability. We varied the value of the parameter K (days of lag) and the number of trees in the random forest. The performance of each model was assessed using the root mean square error () and the Spearman correlation coefficient () between the observed and predicted vegetation indices from the testing dataset. The model with the lowest and highest correlation was selected as the final model.
3. Results
3.1. Year-to-Year Dynamics of Temperature and Precipitation
First, we analysed the differences in meteorological conditions amongst seasons at each of the two (Northern NSW and Northern Mozambique) locations. This step was necessary to ensure that any anomalies observed in vegetation indices were not caused by unusual weather patterns. Daytime and nighttime temperatures showed very similar profiles within sites across different years at both Northern NSW location (Figure 3A) and Northern Mozambique location (Figure 3C). There was some variability in monthly precipitation in Northern NSW location, but overall, the heaviest rainfall occurred during the first quarter of the year (Figure 3B). The monthly precipitation profile for region occupied by Northern Mozambique was more consistent, with very low rainfall levels between April and November (Figure 3D).
3.2. Hyper-Parameter Selection for the Random Forest Model
Vegetation index data from the NSW1 banana plantation were utilized for tuning the Random Forest (RF) model. There was no significant difference in model performance when the number of trees was varied from 100 to 1000 (Figure 4A). The root mean square error decreased when the number of days for meteorological data used as covariates was increased from one month ( to three years () (Figure 4A). The correlation coefficient between observed and predicted VIs also increased when the length of the covariate window was extended (Figure 4B). Therefore, we fixed and (3 months) for the main analyses.
3.3. Effect of Seasonal Variation on VIs
Seasonal variations in VIs could potentially obscure the presence of diseases or interfere with its accurate detection by introducing fluctuations unrelated to disease symptoms. These variations may be caused by changes in environmental factors such as temperature, rainfall, and sunlight availability, which influence plant growth and spectral reflectance patterns. To account for these potential confounding effects, we applied the method to the NSW2 plantation, where no banana disease presence was reported during 2013-2016.
To assess vegetation health dynamics, we quantified the deviation between observed vegetation indices (VIs) from Landsat-8 surface reflectance imagery and expected VI values in the absence of disease. Data were partitioned into one year for training a Random Forest (RF) model and two years for forecasting. Substantial temporal and spatial variability in VI values was observed over the study period. For instance, NDVI ranged from 0.6 to 0.9 (Figure 5A).
Model performance was evaluated using the normalized error metric , representing the ratio between the predicted and observed VI differences and the observed VI values. The relative error remained within ±10% during the training phase and below ±4% for the forecasting period for NDVI (Figure 5B). Notably, the highest normalised errors corresponded to grid cells with lower observed NDVI, likely linked to abiotic stress rather than seasonal effects. A consistent trend was observed across all VIs, with forecasting errors remaining within ±10% (Figure 5D), demonstrating the robustness of the approach for vegetation monitoring and disease impact assessment.
3.4. Detecting BBTD Presence at the NSW1 Banana Plantation
We used the optimised RF model to predict VI values from April 2013 to December 2019, where the period Jan 2016 to Dec 2019 was used for forecasting (see Table 2. The presence of BBTD was assessed by calculating the difference between the observed VI values and the VI values predicted using the RF model. In the generated curves, yellow shading represents a negative difference, indicating that observed VI values exceed the predicted values, which may suggest areas of unusually high vegetation vigour (Figure 6A). In contrast, deep purple hues highlight regions where the observed VI values are substantially lower than expected, potentially indicating plant stress or disease presence. These variations in shading facilitate the identification of anomalies in crop health. All of the VIs showed a decline in their values from around the middle of 2016. For example, the difference in NDVI has values of up to 0.5, indicating a mild to very severe reduction in photosynthetic activity in the plants.
The BBTD outbreak in the NSW1 banana plantation dataset included spatially documented locations of infected plants [26]. The pixel with the highest number of infected plants (n=109) exhibited one of the strongest correlations (0.73) between infection count and the discrepancy between predicted and observed NDVI values. Assuming a planting density of 2,000 plants per hectare, this suggests that approximately 60% of plants within the 30 m × 30 m area were affected. Notably, at this location, the decline in NDVI values preceded the observed rise in infection cases by approximately two months (2016-08-11 vs. 2016-10-15; Figure ??B), highlighting the potential of remote sensing for early disease detection.
3.5. Detecting TR4 Presence
We used the optimized RF model to predict VI values from April 2013 to October 2015. This period overlaps with the available surveillance data for the NM plantation (Figure 7, top left panel). Similar to the BBTD case, all of the VIs showed a decline in their values from a critical time, in the case of TR4 around the middle of 2014, but the curves exhibited more complex variability (Figure 7A) than was the case for BBTD.
A key insight derived from the TR4 analysis is the ability to track disease spread over time. We identified clusters of pixels with similar trajectories in vegetation index (VI) changes between 2014 and 2015. One group exhibited a decline in VI values beginning in June 2014, while another showed a reduction starting in October 2014 (Figure 7B). Spatial mapping of these pixel groups revealed a clear pattern of TR4 spread, originating from the top-left corner of the plantation and progressing outward (Figure 7C). This demonstrates the potential of remote sensing for monitoring disease progression involving Fusarium TR4 in a banana plantation at a fine spatial scale.
3.5.1. Performance of VIs
To assess changes in crop health, we employed 11 vegetation indices, each varying in sensitivity to different physiological traits. While some VIs are more responsive to alterations in leaf structure, others are primarily influenced by variations in chlorophyll or water content [46]. As illustrated in Figure 6 and Figure 7, all VIs exhibited a decline in observed values compared with predicted values characteristic of healthy crops during both BBTV and TR4 outbreaks. For BBTV, the strongest correlation between the number of cases and the difference between predicted and observed values was observed with the Ratio Vegetation Index (RVI) and the Normalized Difference Plant Index (NDPI) (Figure 8). The Ratio Vegetation Index has previously been used to detect stress induced by brown planthopper infestations in rice leaves [47]. In the case of TR4, correlations among VIs were highly consistent, with some pixels exhibiting correlation as high as 0.98 (Figure 8). The substantial variation in correlation suggests that disease spread was spatially heterogeneous, with certain areas experiencing greater impact than others.
4. Discussion
This study investigated the use of Landsat-8 data and machine learning to detect two banana diseases: BBTD and TR4. Early detection of these diseases is critical for implementing timely control measures and mitigating yield losses. By leveraging the high spatial resolution of Landsat-8 imagery, along with machine learning algorithms, our study aimed to identify disease-induced changes in vegetation indices.
The Normalised Difference Vegetation Index (NDVI), along with other vegetation indices, is commonly used to derive key phenological markers of the seasonal cycles of banana plant growth, such as the start of the season, the peak, and the end of the season [48]. Therefore, it can be difficult to distinguish whether a reduction in VI values is due to the end of the growth season or the presence of a disease. We introduced a novel approach for banana disease detection based on a non-parametric statistical method to predict vegetation indices as a function of meteorological conditions at a given location. Daytime temperature, nighttime temperature, and precipitation were the three main factors used as inputs for the VI prediction models. Temperature influences banana crop growth, as confirmed in several studies [49].
The model was applied to generate the expected values of vegetation indices in the absence of disease and to investigate the performance of 11 vegetation indices. We found large variations in VI values amongst 30 m pixels at the NSW2 plantation under disease-free conditions. For example, on October 3, 2014, the NDVI values in the NSW2 plantation ranged from 0.6 to 0.8. This variation could be related to plant spacing in the field [50]. Another reason is the asynchronicity of banana crops. After establishment, the first flowering of a banana plantation is relatively synchronized among plants. However, as flowering cycles progress, individual plants establish their own development stages [51]. This results in a diversity of phenological stages within a field [52]. Therefore, we fitted an RF model for each individual pixel to account for the diversity in planting density as well as the asynchronicity in developmental stages.
To highlight the advantages of the methodology, the resulting curves were compared with published epidemiological data from Australia and Mozambique. The results showed that all the VI values declined from around the middle of 2016 for the NSW1 plantation (BBTD) and the middle of 2014 for the NM plantation (TR4). For example, the difference in NDVI reached values as low as -0.5, indicating a mild to very severe reduction in photosynthetic activity on the ground. There was a strong correlation between the number of disease cases and the deviation in VI values from those detected in the absence of disease, suggesting that remote sensing data can be used to detect the presence of banana diseases. At the pixel with the largest number of infected plants in the NSW1 plantation, the reduction in NDVI values preceded the increase in the number of cases by approximately two months. Our analysis also demonstrated that remote sensing data can be used to track the spread of banana diseases. The locations of pixels with similar profiles of change in VI values from the NM banana plantation were consistent with the spread of TR4 from the top-left corner of the plantation [27]. This approach holds promise for large-scale disease surveillance, offering a cost-effective and scalable method for monitoring plantation health over time.
We applied the method retrospectively to two documented outbreak cases, which defined the temporal scope of the analysis. A key limitation of this study was the availability of remote sensing data. Landsat-8, launched in 2013, coincided with the TR4 outbreak in Mozambique, effectively restricting the volume of data available for training the Random Forest model for the NM banana plantation. However, future applications of the methods will benefit from over a decade of Landsat-8 data, along with Sentinel-2 data, which have been available since 2015 [53]. The higher spatial resolution of Sentinel-2 multispectral products (up to 10m) is expected to enhance the effectiveness of early disease detection in banana plantations, strengthening the utility of the proposed approach.
While satellite imagery, such as the Landsat-8 data used in this study, provides valuable insights into disease presence and spread over large areas, another remote sensing technology gaining prominence for monitoring plant diseases is Unmanned Aerial Vehicles (UAVs) [54]. Several studies have demonstrated the effectiveness of UAV-based imagery for mapping banana plantations [55] and detecting various banana diseases, including Fusarium wilt [56], Xanthomonas wilt [57], BBTV [58,59], and banana blood disease [56]. While UAV technology offers higher accuracy and enables the identification of diseases at the individual plant level, its application is constrained by the requirement for extensive training data — a process that is time-consuming, labour-intensive, and costly to collect and label [60]. Additionally, its spatial coverage is limited, as monitoring large plantations requires multiple flights and increases operational complexity [61,62]. The use of satellite-derived remote sensed data offers potential for detection and mapping of disease over larger regions than would be feasible for UAVs.
Timely disease detection is critical for ensuring the economic sustainability of banana production. Early identification enables rapid intervention, minimizing disease impact and mitigating the risk of widespread crop loss. This study demonstrates the potential of high-resolution remote sensing for detecting BBTV and TR4 at the plantation scale. Future research will focus on developing operational frameworks for leveraging remote sensing data in the detection and continuous monitoring of banana diseases.
Author Contributions
Conceptualization, R.R. and C.A.G.; methodology, R.R.; software, R.R.; validation, R.R.; formal analysis, R.R.; investigation, R.R.; resources, C.A.G..; data curation, R.R..; writing—original draft preparation, R.R., K.S.C, J.E.T. and C.A.G.; writing—review and editing, R.R., K.S.C, J.E.T. and C.A.G.; visualization, R.R.; project administration, C.A.G..; funding acquisition, C.A.G. All authors have read and agreed to the published version of the manuscript.
Funding
This research was funded by the Bill and Melinda Gates Foundation grant INV070408. The funder had no role in study design, data collection and analysis, decision to publish, or preparation of the manuscript. We thank Australian Banana Growers’ Council (ABGC) and banana inspectors for the original data collecting.
Data Availability Statement
Analysis code and data used in this study can be accessed at the following URL: https://github.com/rretkute/BananaDiseasesRS.
Conflicts of Interest
The authors declare no conflicts of interest.
References
- Voora, V.; Larrea, C.; Bermudez, S. Global market report: bananas 2020.
- Ploetz, R.C. Management of Fusarium wilt of banana: A review with special reference to tropical race 4. Crop Protection 2015, 73, 7–15. [Google Scholar] [CrossRef]
- De Bellaire, L.d.L.; Fouré, E.; Abadie, C.; Carlier, J. Black Leaf Streak Disease is challenging the banana industry. Fruits 2010, 65, 327–342. [Google Scholar] [CrossRef]
- Marin, D.H.; Romero, R.A.; Guzmán, M.; Sutton, T.B. Black Sigatoka: an increasing threat to banana cultivation. Plant disease 2003, 87, 208–222. [Google Scholar] [CrossRef] [PubMed]
- Cook, D.; Liu, S.; Edwards, J.; Villalta, O.; Aurambout, J.P.; Kriticos, D.; Drenth, A.; De Barro, P. An assessment of the benefits of yellow Sigatoka (Mycosphaerella musicola) control in the Queensland Northern Banana Pest Quarantine Area. NeoBiota 2013, 18, 67–81. [Google Scholar] [CrossRef]
- Dahal, G.; Hughes, J.; Lockhart, B. Status of banana streak disease in Africa: problems and future research needs. Integrated Pest Management Reviews 1998, 3, 85–97. [Google Scholar] [CrossRef]
- Tripathi, L.; Mwangi, M.; Abele, S.; Aritua, V.; Tushemereirwe, W.K.; Bandyopadhyay, R. Xanthomonas wilt: a threat to banana production in East and Central Africa. Plant Disease 2009, 93, 440–451. [Google Scholar] [CrossRef]
- Kema, G.H.; Drenth, A.; Dita, M.; Jansen, K.; Vellema, S.; Stoorvogel, J.J. Fusarium wilt of banana, a recurring threat to global banana production, 2021. [CrossRef]
- Dale, J.L. Banana bunchy top: an economically important tropical plant virus disease. Advances in virus research 1987, 33, 301–325. [Google Scholar]
- Jeger, M.; Eden-Green, S.; Thresh, J.; Johanson, A.; Waller, J.; Brown, A. Banana diseases. In Bananas and plantains; Springer, 1995; pp. 317–381.
- Drenth, A.; Kema, G. The vulnerability of bananas to globally emerging disease threats. Phytopathology® 2021, 111, 2146–2161. [Google Scholar] [CrossRef]
- Christaki, E. New technologies in predicting, preventing and controlling emerging infectious diseases. Virulence 2015, 6, 558–565. [Google Scholar] [CrossRef]
- Gupta, S.; Tripathi, A.K. Fruit and vegetable disease detection and classification: Recent trends, challenges, and future opportunities. Engineering Applications of Artificial Intelligence 2024, 133, 108260. [Google Scholar] [CrossRef]
- Kashyap, B.; Kumar, R. Sensing methodologies in agriculture for monitoring biotic stress in plants due to pathogens and pests. Inventions 2021, 6, 29. [Google Scholar] [CrossRef]
- Roy, D.P.; Wulder, M.A.; Loveland, T.R.; Woodcock, C.E.; Allen, R.G.; Anderson, M.C.; Helder, D.; Irons, J.R.; Johnson, D.M.; Kennedy, R.; et al. Landsat-8: Science and product vision for terrestrial global change research. Remote sensing of Environment 2014, 145, 154–172. [Google Scholar] [CrossRef]
- Ma, H.; Jing, Y.; Huang, W.; Shi, Y.; Dong, Y.; Zhang, J.; Liu, L. Integrating Early Growth Information to Monitor Winter Wheat Powdery Mildew Using Multi-Temporal Landsat-8 Imagery. Sensors 2018, 18, 3290. [Google Scholar] [CrossRef]
- Wang, H.; Pu, R.; Zhu, Q.; Ren, L.; Zhang, Z. Mapping health levels of Robinia pseudoacacia forests in the Yellow River delta, China, using IKONOS and Landsat 8 OLI imagery. International journal of remote sensing 2015, 36, 1114–1135. [Google Scholar] [CrossRef]
- Long, L.; Chen, Y.; Song, S.; Zhang, X.; Jia, X.; Lu, Y.; Liu, G. Remote Sensing Monitoring of Pine Wilt Disease Based on Time-Series Remote Sensing Index. Remote Sensing 2023, 15, 360. [Google Scholar] [CrossRef]
- Food and Agriculture Organization of the United Nations (FAO). Strengthening the preparedness of West and Central Africa to control Banana Bunch Top Virus and Banana Fusarium Wilt (TR4), 2024. Accessed: December 15, 2024.
- Qazi, J. Banana bunchy top virus and the bunchy top disease. Journal of general plant pathology 2016, 82, 2–11. [Google Scholar] [CrossRef]
- Hooks, C.; Wright, M.; Kabasawa, D.; Manandhar, R.; Almeida, R. Effect of banana bunchy top virus infection on morphology and growth characteristics of banana. Annals of Applied Biology 2008, 153, 1–9. [Google Scholar] [CrossRef]
- Nelson, S.C.; Messing, R.; Hamasaki, R.; Gaskill, D.; Nishijima, W. Banana bunchy top: Detailed signs and symptoms. Knowledge Creation Diffusion Utilization 2004, pp. 1–22.
- Chabi, M.; Dassou, A.G.; Adoukonou-Sagbadja, H.; Thomas, J.; Omondi, A.B. Variation in Symptom Development and Infectivity of Banana Bunchy Top Disease among Four Cultivars of Musa sp. Crops 2023, 3, 158–169. [Google Scholar] [CrossRef]
- on Plant Health (PLH), E.P.; Bragard, C.; Baptista, P.; Chatzivassiliou, E.; Di Serio, F.; Gonthier, P.; Jaques Miret, J.A.; Justesen, A.F.; MacLeod, A.; Magnusson, C.S.; et al. Pest categorisation of Fusarium oxysporum f. sp. cubense Tropical Race 4. EFSA Journal 2022, 20, e07092. [Google Scholar]
- Garcia-Bastidas, F. Fusarium oxysporum f. sp. cubense Tropical race 4 (Foc TR4). CABI Compendium 2022. [CrossRef]
- Varghese, A.; Drovandi, C.; Mira, A.; Mengersen, K. Estimating a novel stochastic model for within-field disease dynamics of banana bunchy top virus via approximate Bayesian computation. PLOS Computational Biology 2020, 16, e1007878. [Google Scholar] [CrossRef]
- Viljoen, A.; Mostert, D.; Chiconela, T.; Beukes, I.; Fraser, C.; Dwyer, J.; Murray, H.; Amisse, J.; Matabuana, E.L.; Tazan, G.; et al. Occurrence and spread of the banana fungus Fusarium oxysporum f. sp. cubense TR4 in Mozambique. South African Journal of Science 2020, 116. [Google Scholar] [CrossRef] [PubMed]
- Gorelick, N.; Hancher, M.; Dixon, M.; Ilyushchenko, S.; Thau, D.; Moore, R. Google Earth Engine: Planetary-scale geospatial analysis for everyone. Remote Sensing of Environment 2017. [Google Scholar] [CrossRef]
- Wan, Z.; Hook, S.; Hulley, G. MOD11A1 MODIS/Terra Land Surface Temperature/Emissivity Daily L3 Global 1km SIN Grid V006, 2015. [CrossRef]
- Huffman, G.J.; Bolvin, D.T.; Braithwaite, D.; Hsu, K.; Joyce, R.; Xie, P.; Yoo, S.H. NASA global precipitation measurement (GPM) integrated multi-satellite retrievals for GPM (IMERG). Algorithm theoretical basis document (ATBD) version 2015, 4, 2020–05. [Google Scholar]
- Frasso, G.; Eilers, P.H. L- and V-curves for optimal smoothing. Statistical Modelling 2014, 15, 91–111. [Google Scholar] [CrossRef]
- Eilers, P.H.; Pesendorfer, V.; Bonifacio, R. Automatic smoothing of remote sensing data. In Proceedings of the 2017 9th International Workshop on the Analysis of Multitemporal Remote Sensing Images (MultiTemp). IEEE, 2017, pp. 1–3. [CrossRef]
- Rouse, J.W.; Haas, R.H.; Schell, J.A.; Deering, D.W.; et al. Monitoring vegetation systems in the Great Plains with ERTS. NASA Spec. Publ 1974, 351, 309. [Google Scholar]
- Camps-Valls, G.; Campos-Taberner, M.; Moreno-Martínez, Á.; Walther, S.; Duveiller, G.; Cescatti, A.; Mahecha, M.D.; Muñoz-Marí, J.; García-Haro, F.J.; Guanter, L.; et al. A unified vegetation index for quantifying the terrestrial biosphere. Science Advances 2021, 7. [Google Scholar] [CrossRef] [PubMed]
- Pearson, R.L.; Miller, L.D. Pearson, R.L.; Miller, L.D. Remote mapping of standing crop biomass for estimation of the productivity of the shortgrass prairie, Pawnee National Grasslands, Colorado. 1972.
- Tucker, C.J. Red and photographic infrared linear combinations for monitoring vegetation. Remote sensing of Environment 1979, 8, 127–150. [Google Scholar] [CrossRef]
- Liu, H.Q.; Huete, A. A feedback based modification of the NDVI to minimize canopy background and atmospheric noise. IEEE transactions on geoscience and remote sensing 1995, 33, 457–465. [Google Scholar] [CrossRef]
- Huete, A.R. A soil-adjusted vegetation index (SAVI). Remote sensing of environment 1988, 25, 295–309. [Google Scholar] [CrossRef]
- Qi, J.; Chehbouni, A.; Huete, A.R.; Kerr, Y.H.; Sorooshian, S. A modified soil adjusted vegetation index. Remote sensing of environment 1994, 48, 119–126. [Google Scholar] [CrossRef]
- Rondeaux, G.; Steven, M.; Baret, F. Optimization of soil-adjusted vegetation indices. Remote sensing of environment 1996, 55, 95–107. [Google Scholar] [CrossRef]
- Wang, C.; Chen, J.; Wu, J.; Tang, Y.; Shi, P.; Black, T.A.; Zhu, K. A snow-free vegetation index for improved monitoring of vegetation spring green-up date in deciduous ecosystems. Remote sensing of environment 2017, 196, 1–12. [Google Scholar] [CrossRef]
- Badgley, G.; Anderegg, L.D.; Berry, J.A.; Field, C.B. Terrestrial gross primary production: Using NIRV to scale from site to globe. Global change biology 2019, 25, 3731–3740. [Google Scholar] [CrossRef]
- Pinty, B.; Verstraete, M. GEMI: a non-linear index to monitor global vegetation from satellites. Vegetatio 1992, 101, 15–20. [Google Scholar] [CrossRef]
- Belgiu, M.; Drăguţ, L. Random forest in remote sensing: A review of applications and future directions. ISPRS journal of photogrammetry and remote sensing 2016, 114, 24–31. [Google Scholar] [CrossRef]
- Liaw, A.; Wiener, M. Classification and Regression by randomForest. R News 2002, 2, 18–22. [Google Scholar]
- Zou, X.; Mõttus, M. Sensitivity of Common Vegetation Indices to the Canopy Structure of Field Crops. Remote Sensing 2017, 9, 994. [Google Scholar] [CrossRef]
- Tan, Y.; Sun, J.Y.; Zhang, B.; Chen, M.; Liu, Y.; Liu, X.D. Sensitivity of a Ratio Vegetation Index Derived from Hyperspectral Remote Sensing to the Brown Planthopper Stress on Rice Plants. Sensors 2019, 19, 375. [Google Scholar] [CrossRef]
- Aeberli, A.; Phinn, S.; Johansen, K.; Robson, A.; Lamb, D.W. Characterisation of Banana Plant Growth Using High-Spatiotemporal-Resolution Multispectral UAV Imagery. Remote Sensing 2023, 15, 679. [Google Scholar] [CrossRef]
- Allen, R.; Dettmann, E.; Johns, G.; Turner, D. Estimation of leaf emergence rates of bananas. Australian Journal of Agricultural Research 1988, 39, 53. [Google Scholar] [CrossRef]
- Gonçalves, L.R.; Oliveira, C.W.; Meireles, A.C.M. Spatial distribution of evapotranspiration by fractional vegetation cover index on irrigated cropland banana (Musa Spp.) in the semiarid. Remote Sensing Applications: Society and Environment 2023, 29, 100878. [Google Scholar] [CrossRef]
- Lamour, J.; Le Moguédec, G.; Naud, O.; Lechaudel, M.; Taylor, J.; Tisseyre, B. Evaluating the drivers of banana flowering cycle duration using a stochastic model and on farm production data. Precision Agriculture 2020, 22, 873–896. [Google Scholar] [CrossRef]
- Lamour, J.; Naud, O.; Lechaudel, M.; Le Moguédec, G.; Taylor, J.; Tisseyre, B. Spatial analysis and mapping of banana crop properties: issues of the asynchronicity of the banana production and proposition of a statistical method to take it into account. Precision Agriculture 2019, 21, 897–921. [Google Scholar] [CrossRef]
- Phiri, D.; Simwanda, M.; Salekin, S.; Nyirenda, V.; Murayama, Y.; Ranagalage, M. Sentinel-2 Data for Land Cover/Use Mapping: A Review. Remote Sensing 2020, 12, 2291. [Google Scholar] [CrossRef]
- Alsadik, B.; Ellsäßer, F.J.; Awawdeh, M.; Al-Rawabdeh, A.; Almahasneh, L.; Oude Elberink, S.; Abuhamoor, D.; Al Asmar, Y. Remote Sensing Technologies Using UAVs for Pest and Disease Monitoring: A Review Centered on Date Palm Trees. Remote Sensing 2024, 16, 4371. [Google Scholar] [CrossRef]
- Kilwenge, R.; Adewopo, J.; Sun, Z.; Schut, M. UAV-Based Mapping of Banana Land Area for Village-Level Decision-Support in Rwanda. Remote Sensing 2021, 13, 4985. [Google Scholar] [CrossRef]
- Wikantika, K.; Ghazali, M.F.; Dwivany, F.M.; Susantoro, T.M.; Yayusman, L.F.; Sunarwati, D.; Sutanto, A. A Study on the Distribution Pattern of Banana Blood Disease (BBD) and Fusarium Wilt Using Multispectral Aerial Photos and a Handheld Spectrometer in Subang, Indonesia. Diversity 2023, 15, 1046. [Google Scholar] [CrossRef]
- Mora, J.J.; Selvaraj, M.G.; Alvarez, C.I.; Safari, N.; Blomme, G. From pixels to plant health: accurate detection of banana Xanthomonas wilt in complex African landscapes using high-resolution UAV images and deep learning. Discover Applied Sciences 2024, 6. [Google Scholar] [CrossRef]
- Gomez Selvaraj, M.; Vergara, A.; Montenegro, F.; Alonso Ruiz, H.; Safari, N.; Raymaekers, D.; Ocimati, W.; Ntamwira, J.; Tits, L.; Omondi, A.B.; et al. Detection of banana plants and their major diseases through aerial images and machine learning methods: A case study in DR Congo and Republic of Benin. ISPRS Journal of Photogrammetry and Remote Sensing 2020, 169, 110–124. [Google Scholar] [CrossRef]
- Alabi, T.R.; Adewopo, J.; Duke, O.P.; Kumar, P.L. Banana Mapping in Heterogenous Smallholder Farming Systems Using High-Resolution Remote Sensing Imagery and Machine Learning Models with Implications for Banana Bunchy Top Disease Surveillance. Remote Sensing 2022, 14, 5206. [Google Scholar] [CrossRef]
- Moradi, S.; Bokani, A.; Hassan, J. UAV-based Smart Agriculture: a Review of UAV Sensing and Applications. In Proceedings of the 2022 32nd International Telecommunication Networks and Applications Conference (ITNAC). IEEE, 2022, p. 181–184. [CrossRef]
- Reddy Maddikunta, P.K.; Hakak, S.; Alazab, M.; Bhattacharya, S.; Gadekallu, T.R.; Khan, W.Z.; Pham, Q.V. Unmanned Aerial Vehicles in Smart Agriculture: Applications, Requirements, and Challenges. IEEE Sensors Journal 2021, 21, 17608–17619. [Google Scholar] [CrossRef]
- Tagami, G.N.; van Westerhoven, A.C.; Seidl, M.F.; van der Sluis, J.; Cozzarelli, M.; Balarezo Camminati, D.; Pflücker, R.; Márquez Rosillo, C.; Clercx, L.; Kema, G.H.J. Aerial Mapping of the Peruvian Chira Valley Banana Production System to Monitor the Expansion of Fusarium Wilt Caused by Tropical Race 4. PhytoFrontiers™ 2024, 4, 196–204. [Google Scholar] [CrossRef]
Figure 1.
Conceptual framework for banana disease detection using remote sensing data. The framework involves three phases: database construction, model construction and model application.
Figure 1.
Conceptual framework for banana disease detection using remote sensing data. The framework involves three phases: database construction, model construction and model application.
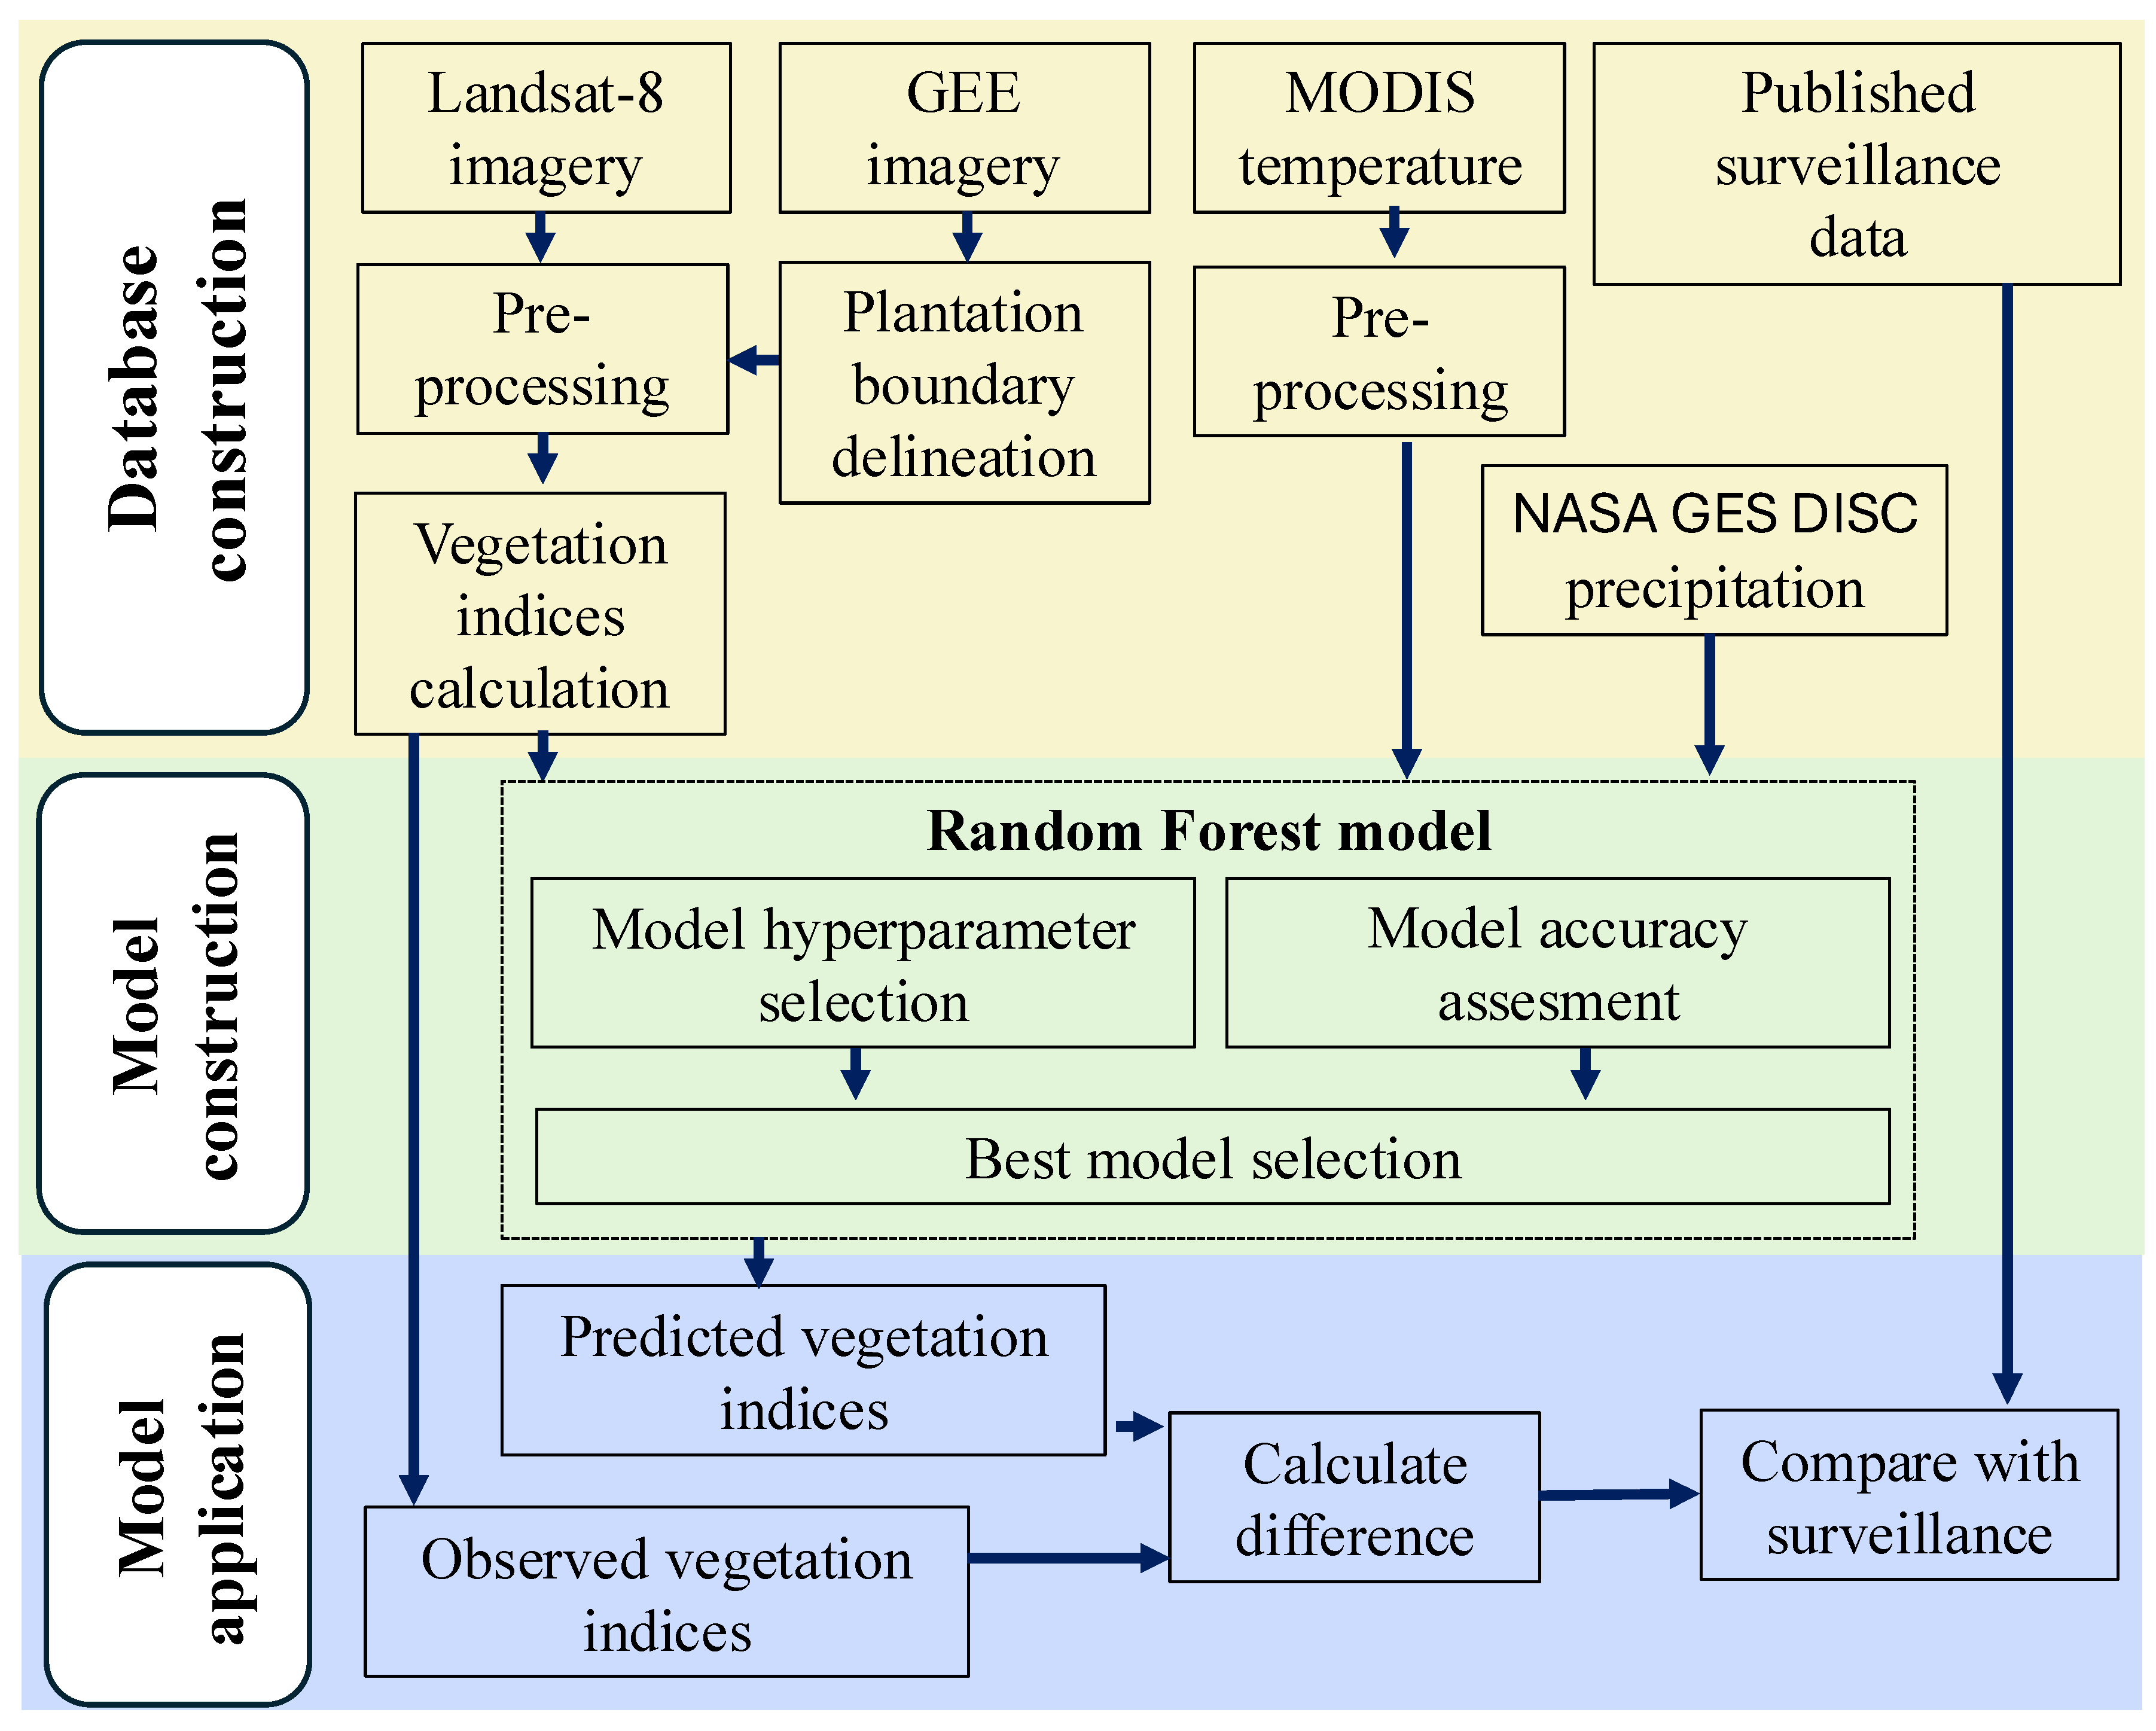
Figure 2.
(A) Locations of the NSW1 and NSW2 banana plantations in Australia (red dots). (B) Boundaries of the NSW1 banana plantation (red polygon). (C) Boundaries of the NSW2 banana plantation (red polygon). (D) Location of the NM banana plantation in Mozambique (red dot). (E) Boundaries of the NM banana plantation (red polygon). Satellite images in (B), (C) and (E) were obtained from Google Earth Engine (Imagery @2024 Airbus, CNES/Airbus, Landsat/ Copernicus, Maxar Technology).
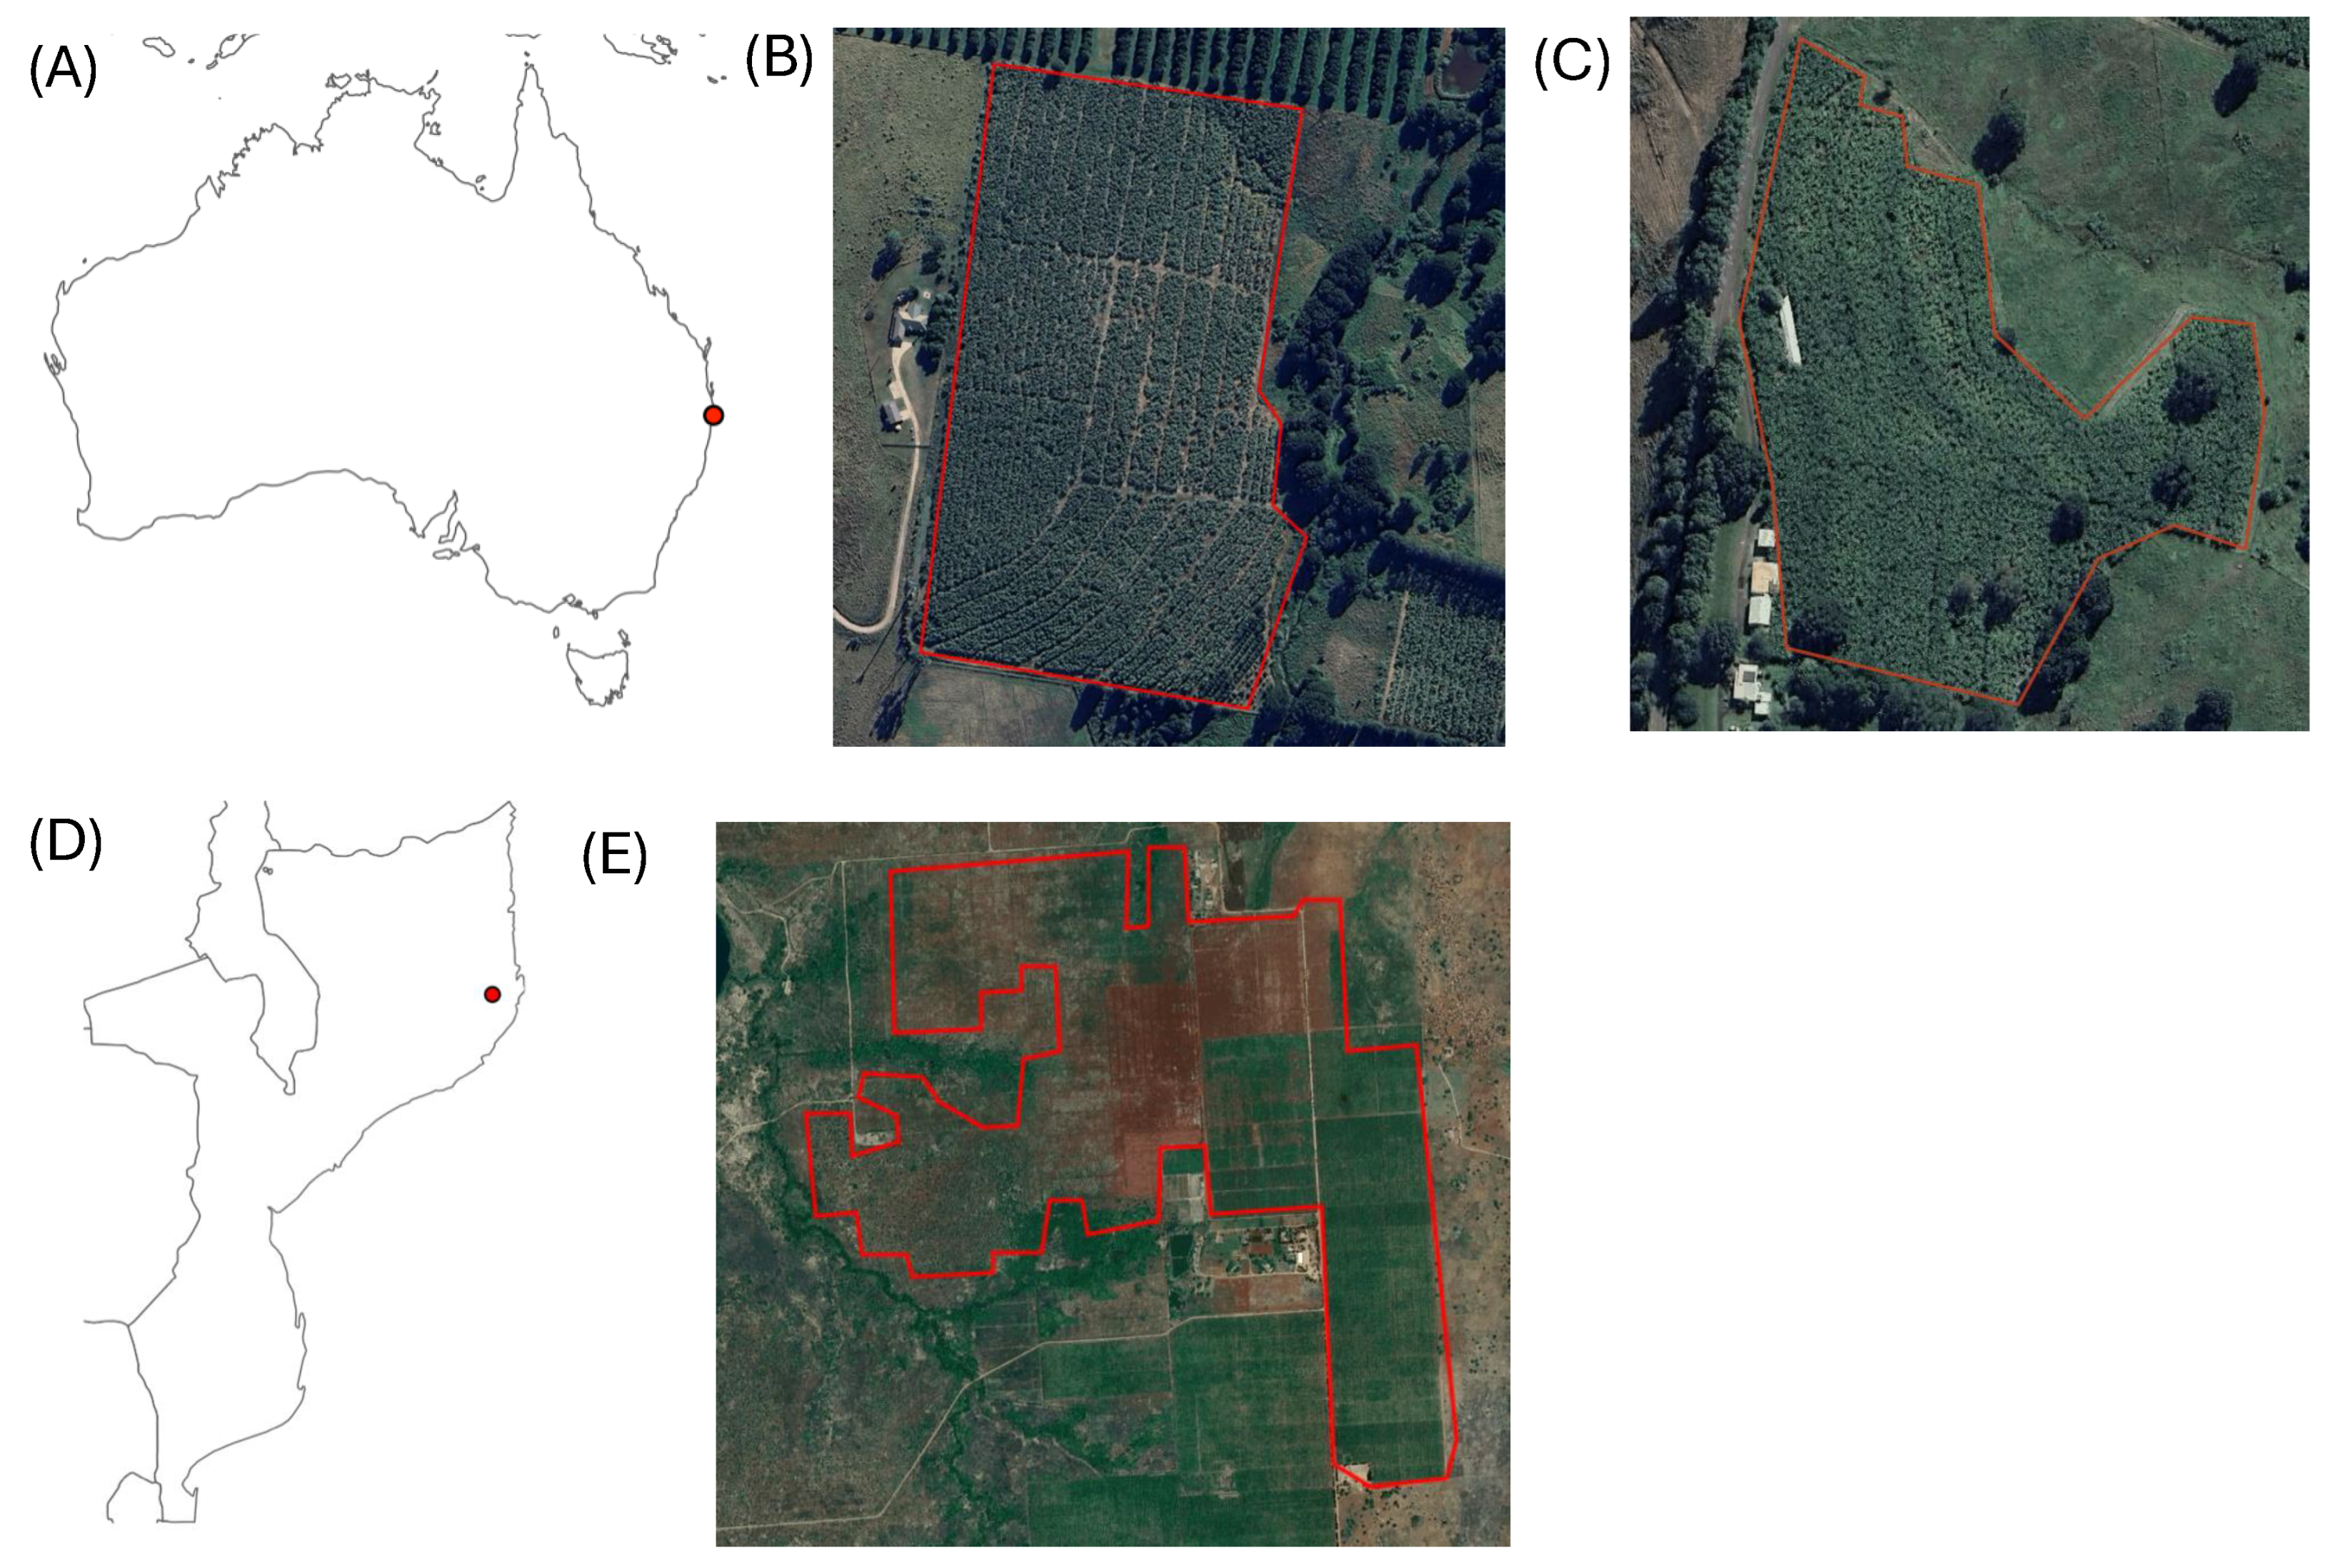
Figure 3.
Meteorological data during the study period. Monthly temperature (A) and precipitation (B) in Northern NSW. Monthly temperature (C) and precipitation (D) in Northern Mozambique.
Figure 3.
Meteorological data during the study period. Monthly temperature (A) and precipitation (B) in Northern NSW. Monthly temperature (C) and precipitation (D) in Northern Mozambique.
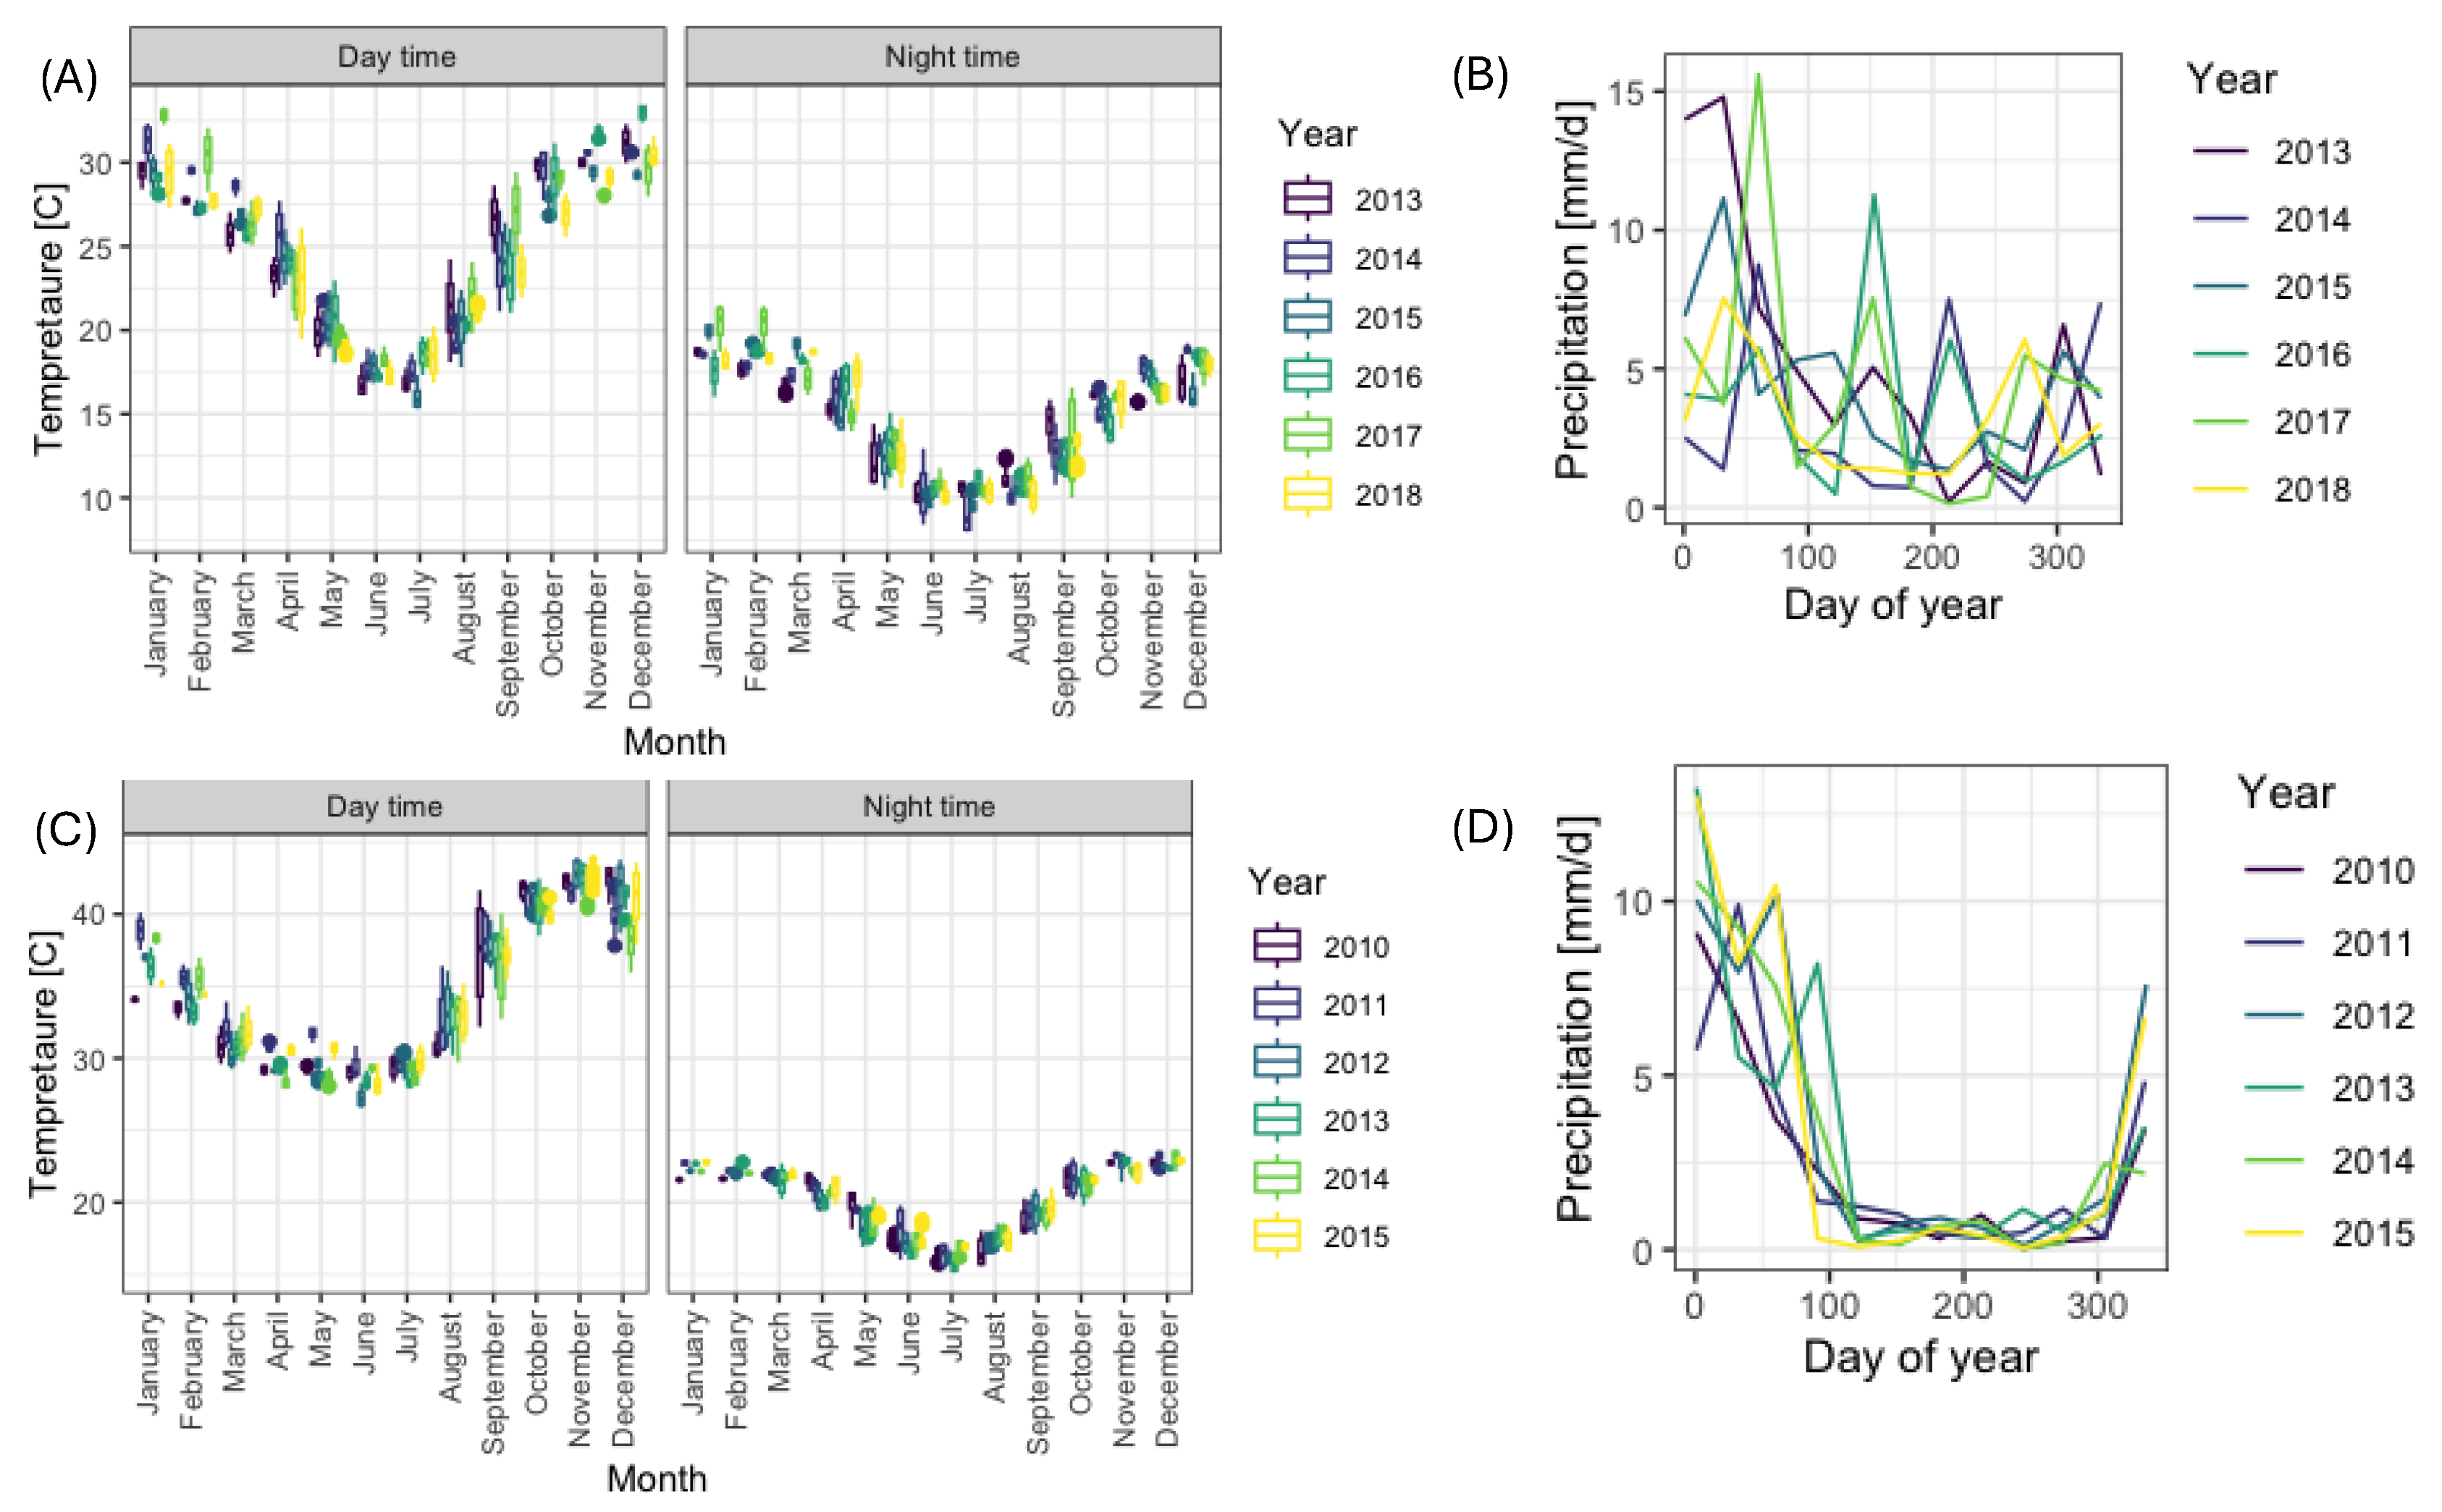
Figure 4.
Root mean square error (A) and Spearman correlation coefficient (B) between observed and predicted vegetation indices from a testing dataset as a function of number of days for feature construction (K) and a number of trees in RF model (columns). Results are for NDVI values at the NSW1 banana plantation.
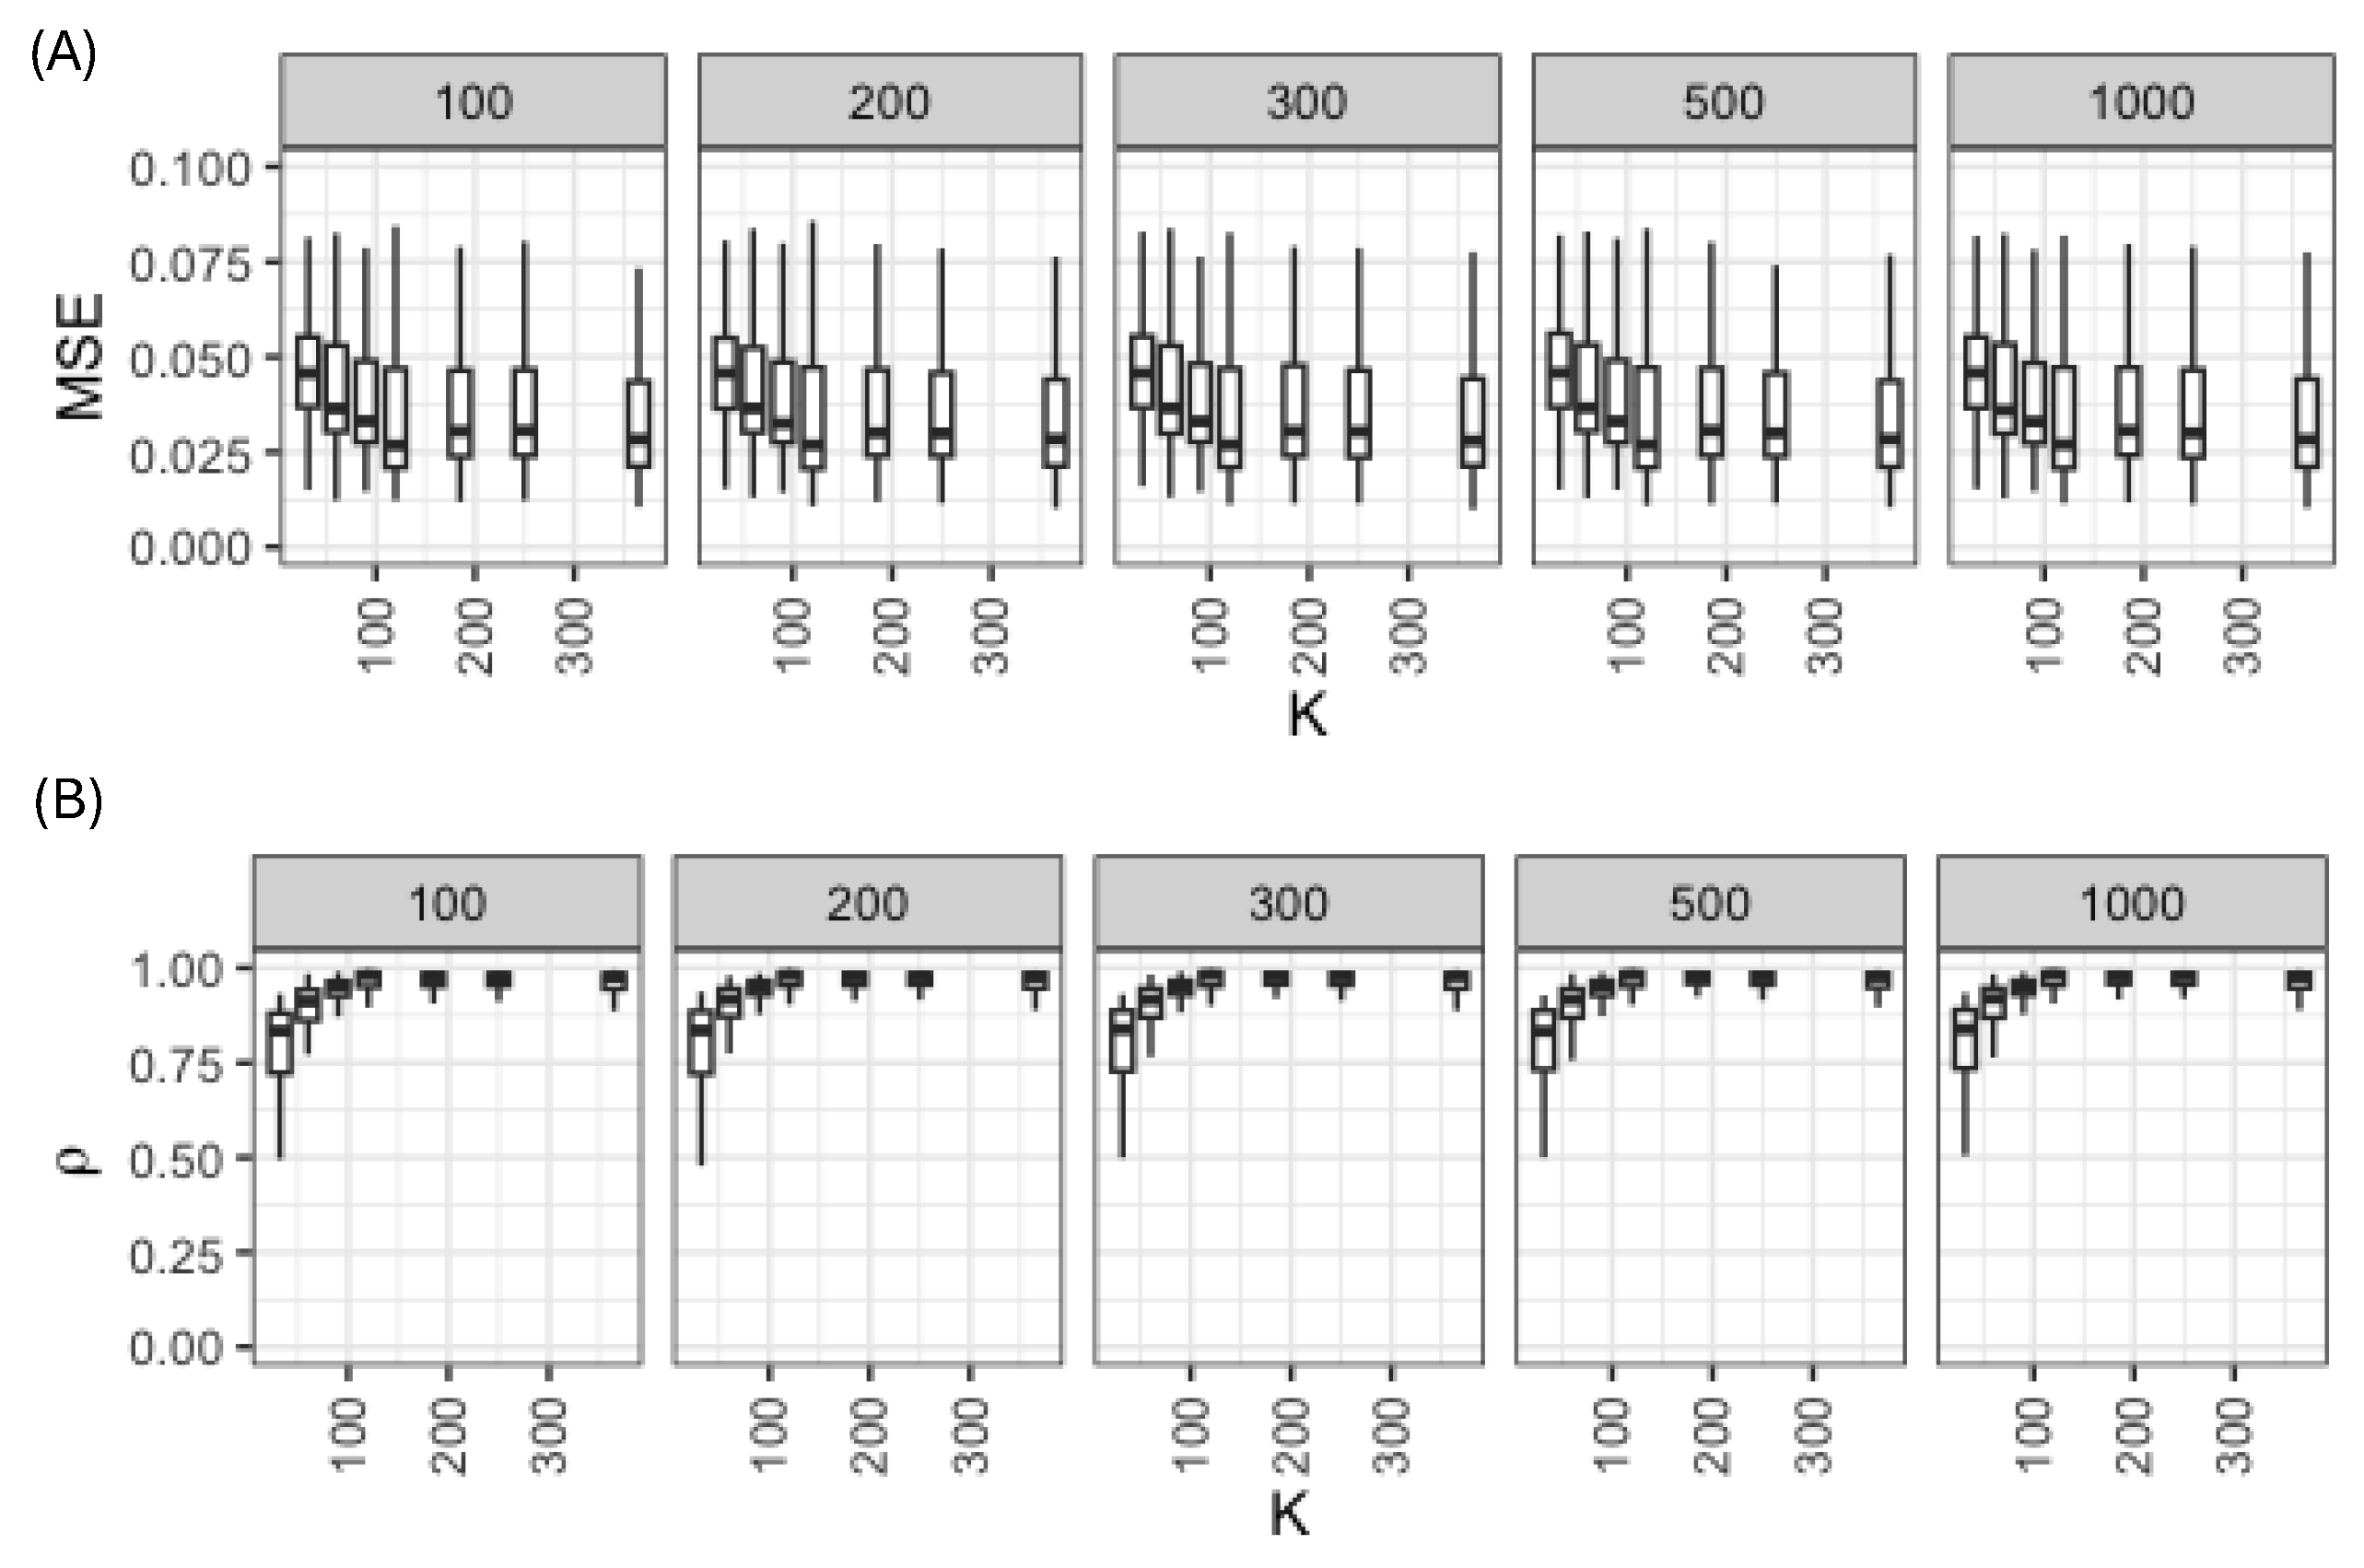
Figure 5.
Comparing observed and predicted VIs at the NSW2 plantation, to test the methodology with respect to seasonality in the absence of disease. (A) Observed values of NDVI over time. (B) Relative error between predicted and observed NDVI. Colour shows observed values of NDVI. (C) Distribution of relative errors for forecasting period for all VIs. In (A) and (B) gray area shows period used to train the RF models.
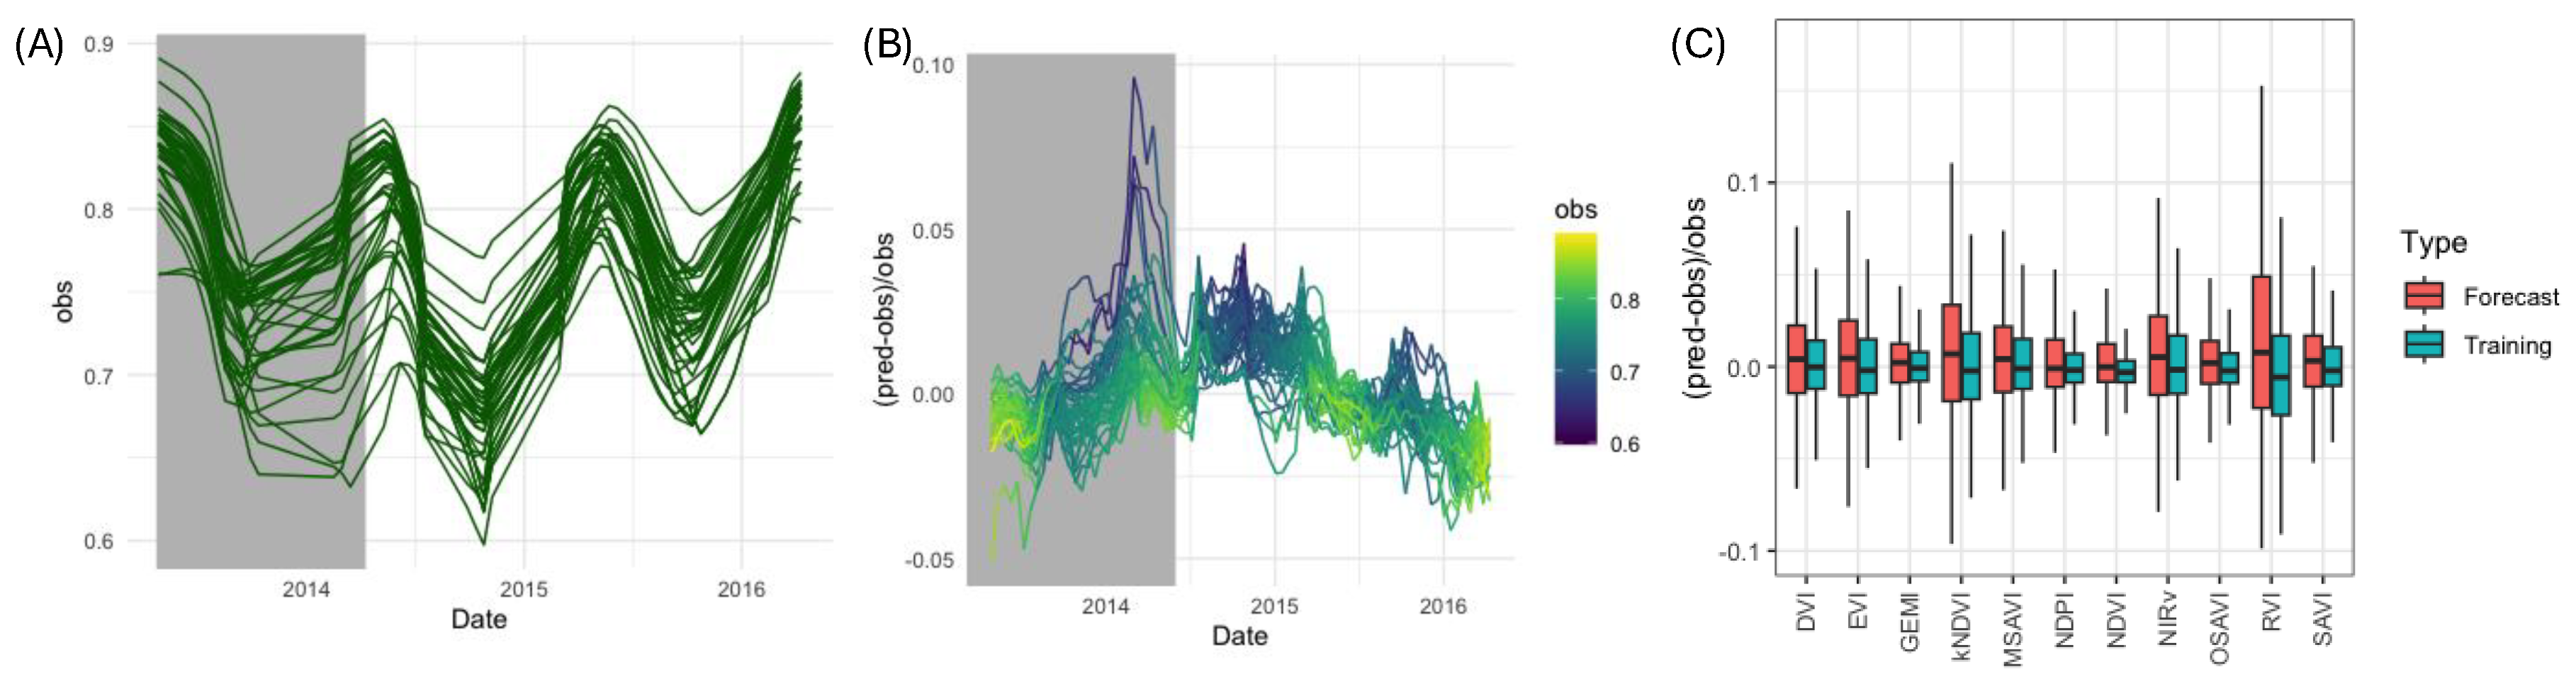
Figure 6.
(A) Number of new monthly cases in the NSW1 banana plantation [26] (red curve) and dynamics of difference between predicted and observed VIs at all pixels. The analyses are done for the range of VIs defined in Table 1. Yellow shading denotes a negative difference, where observed VI values exceed predicted values, while deep purple hues suggest a potential presence of disease. (B) Difference between predicted and observed NDVI and number of new monthly cases at the pixel with the largest number of infections.
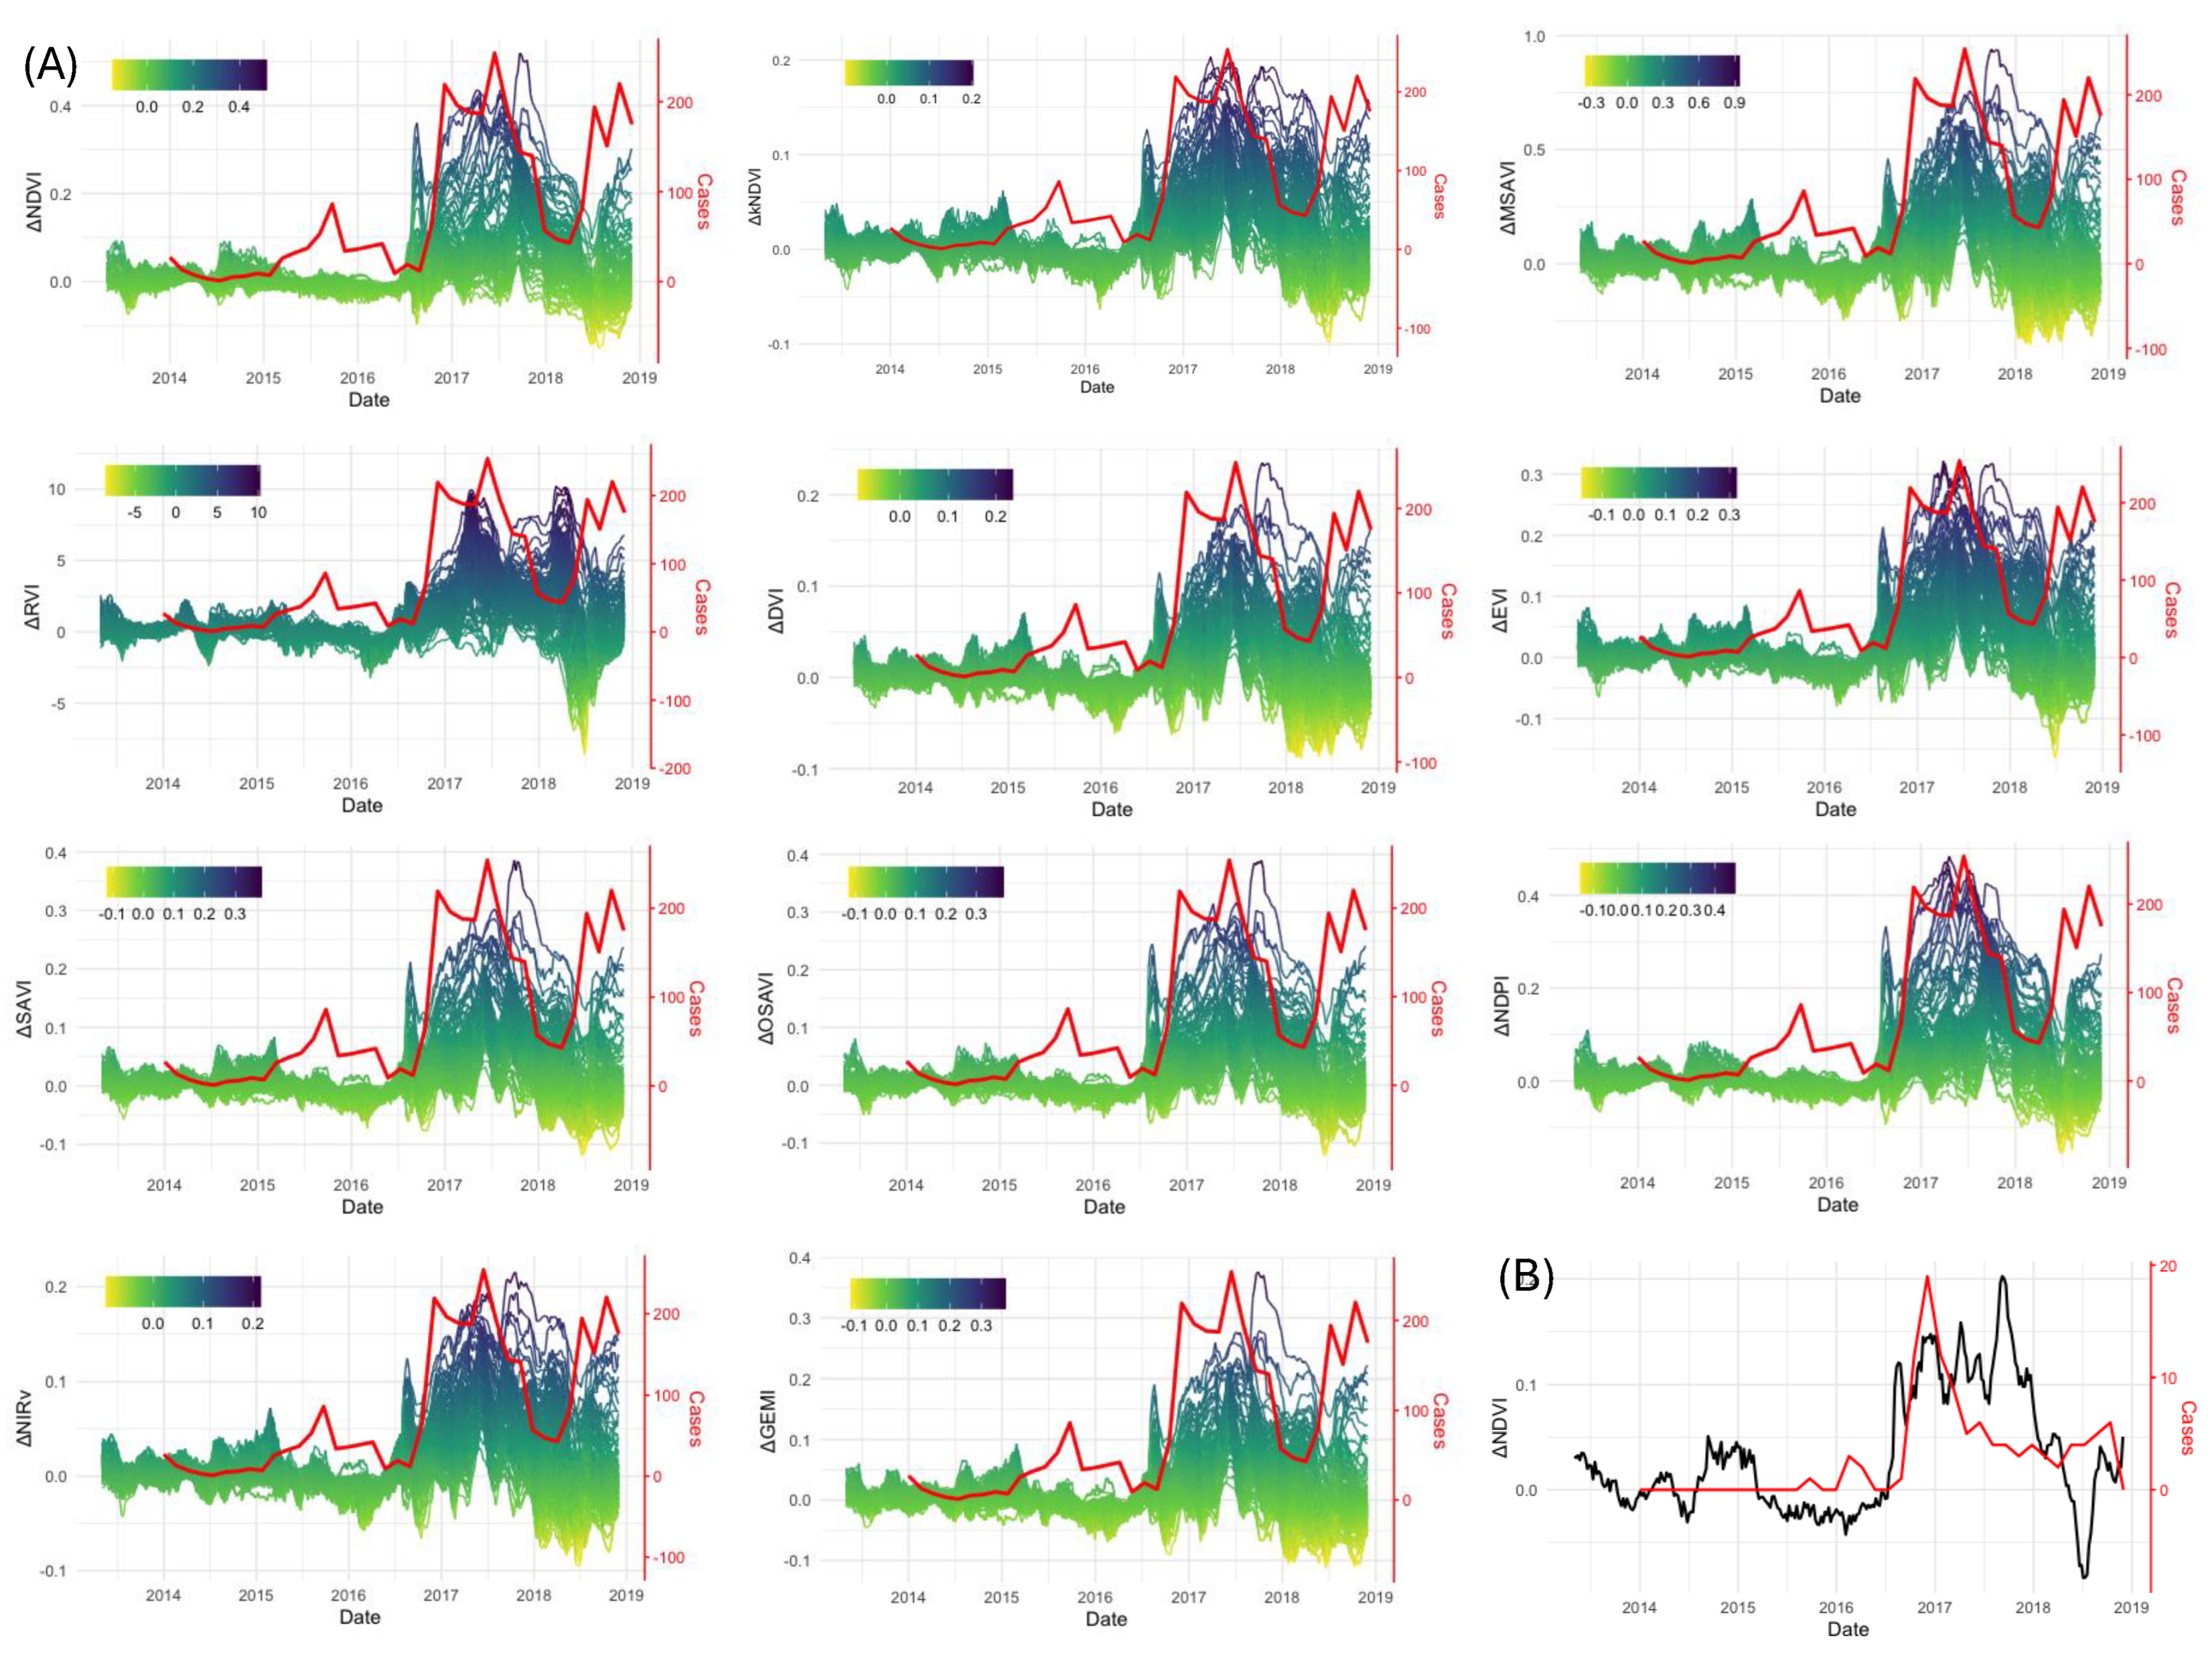
Figure 7.
(A) Number of new monthly cases in the NM banana plantation [27] (red curve) and dynamics of difference between predicted and observed VIs at all pixels. (B) Grouping pixels with similar profiles. (C) Locations of grouped pixels from (B).
Figure 7.
(A) Number of new monthly cases in the NM banana plantation [27] (red curve) and dynamics of difference between predicted and observed VIs at all pixels. (B) Grouping pixels with similar profiles. (C) Locations of grouped pixels from (B).
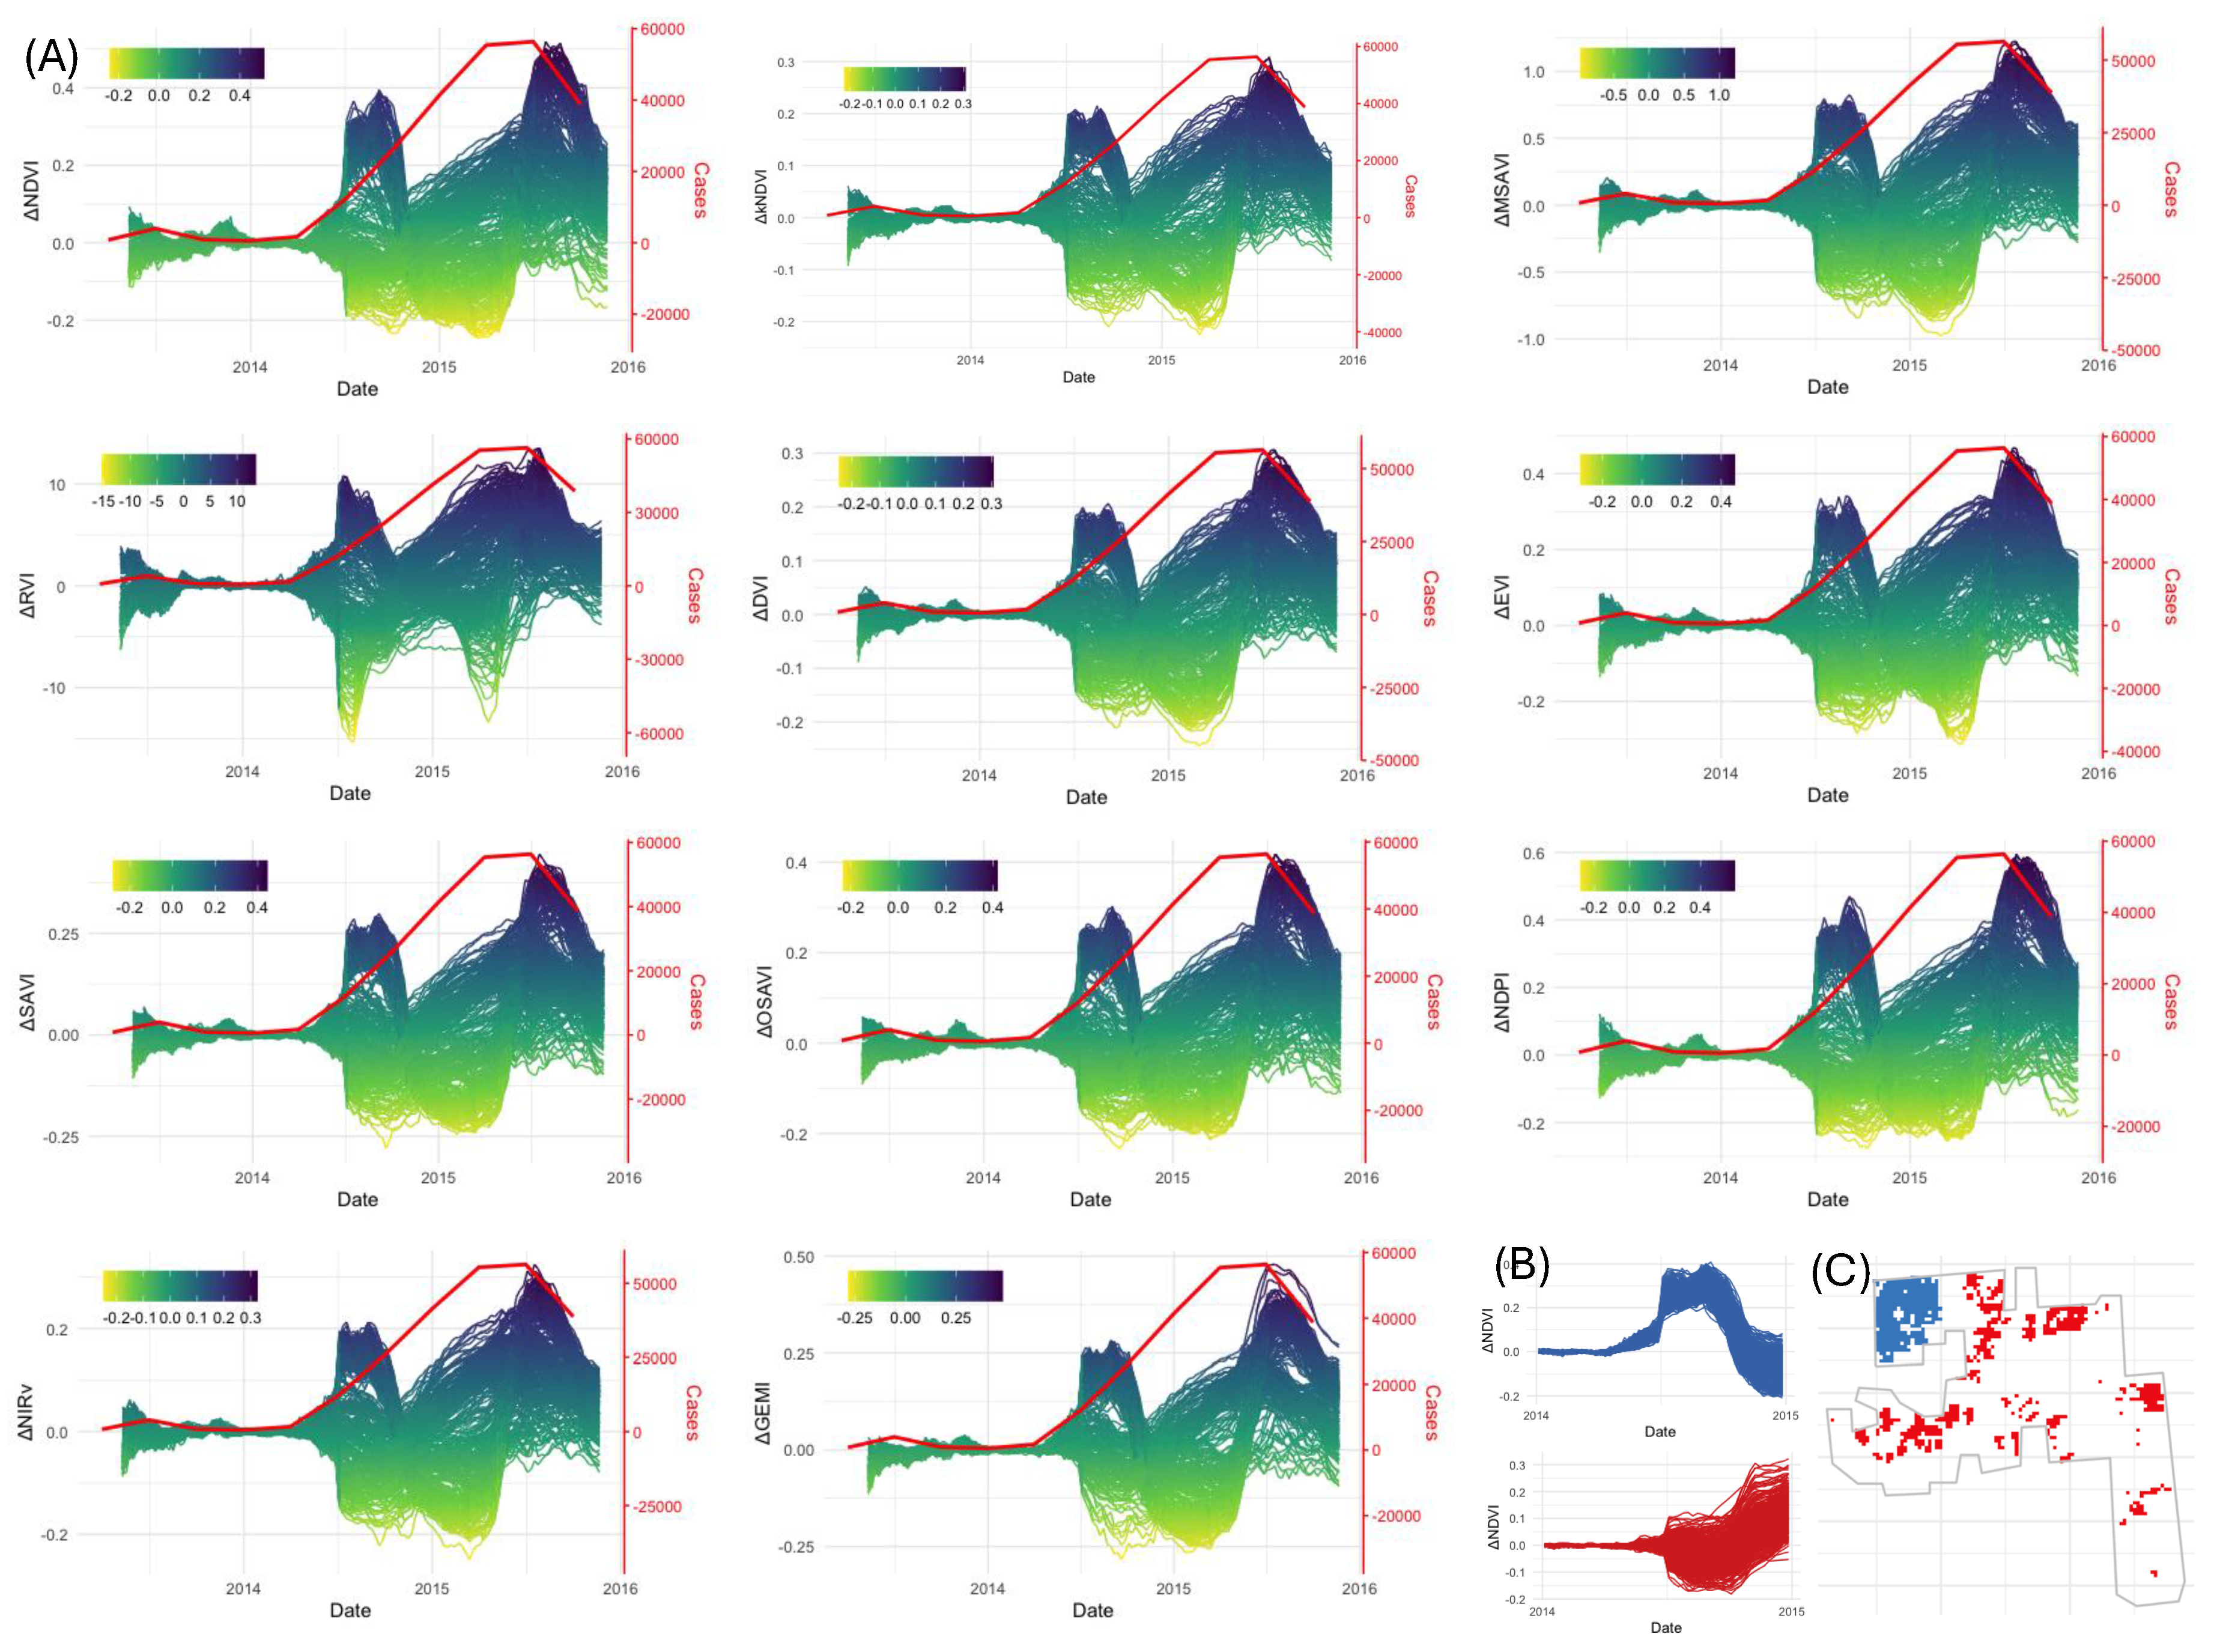
Figure 8.
Correlation between number of cases and difference between predicted and observed VIs.
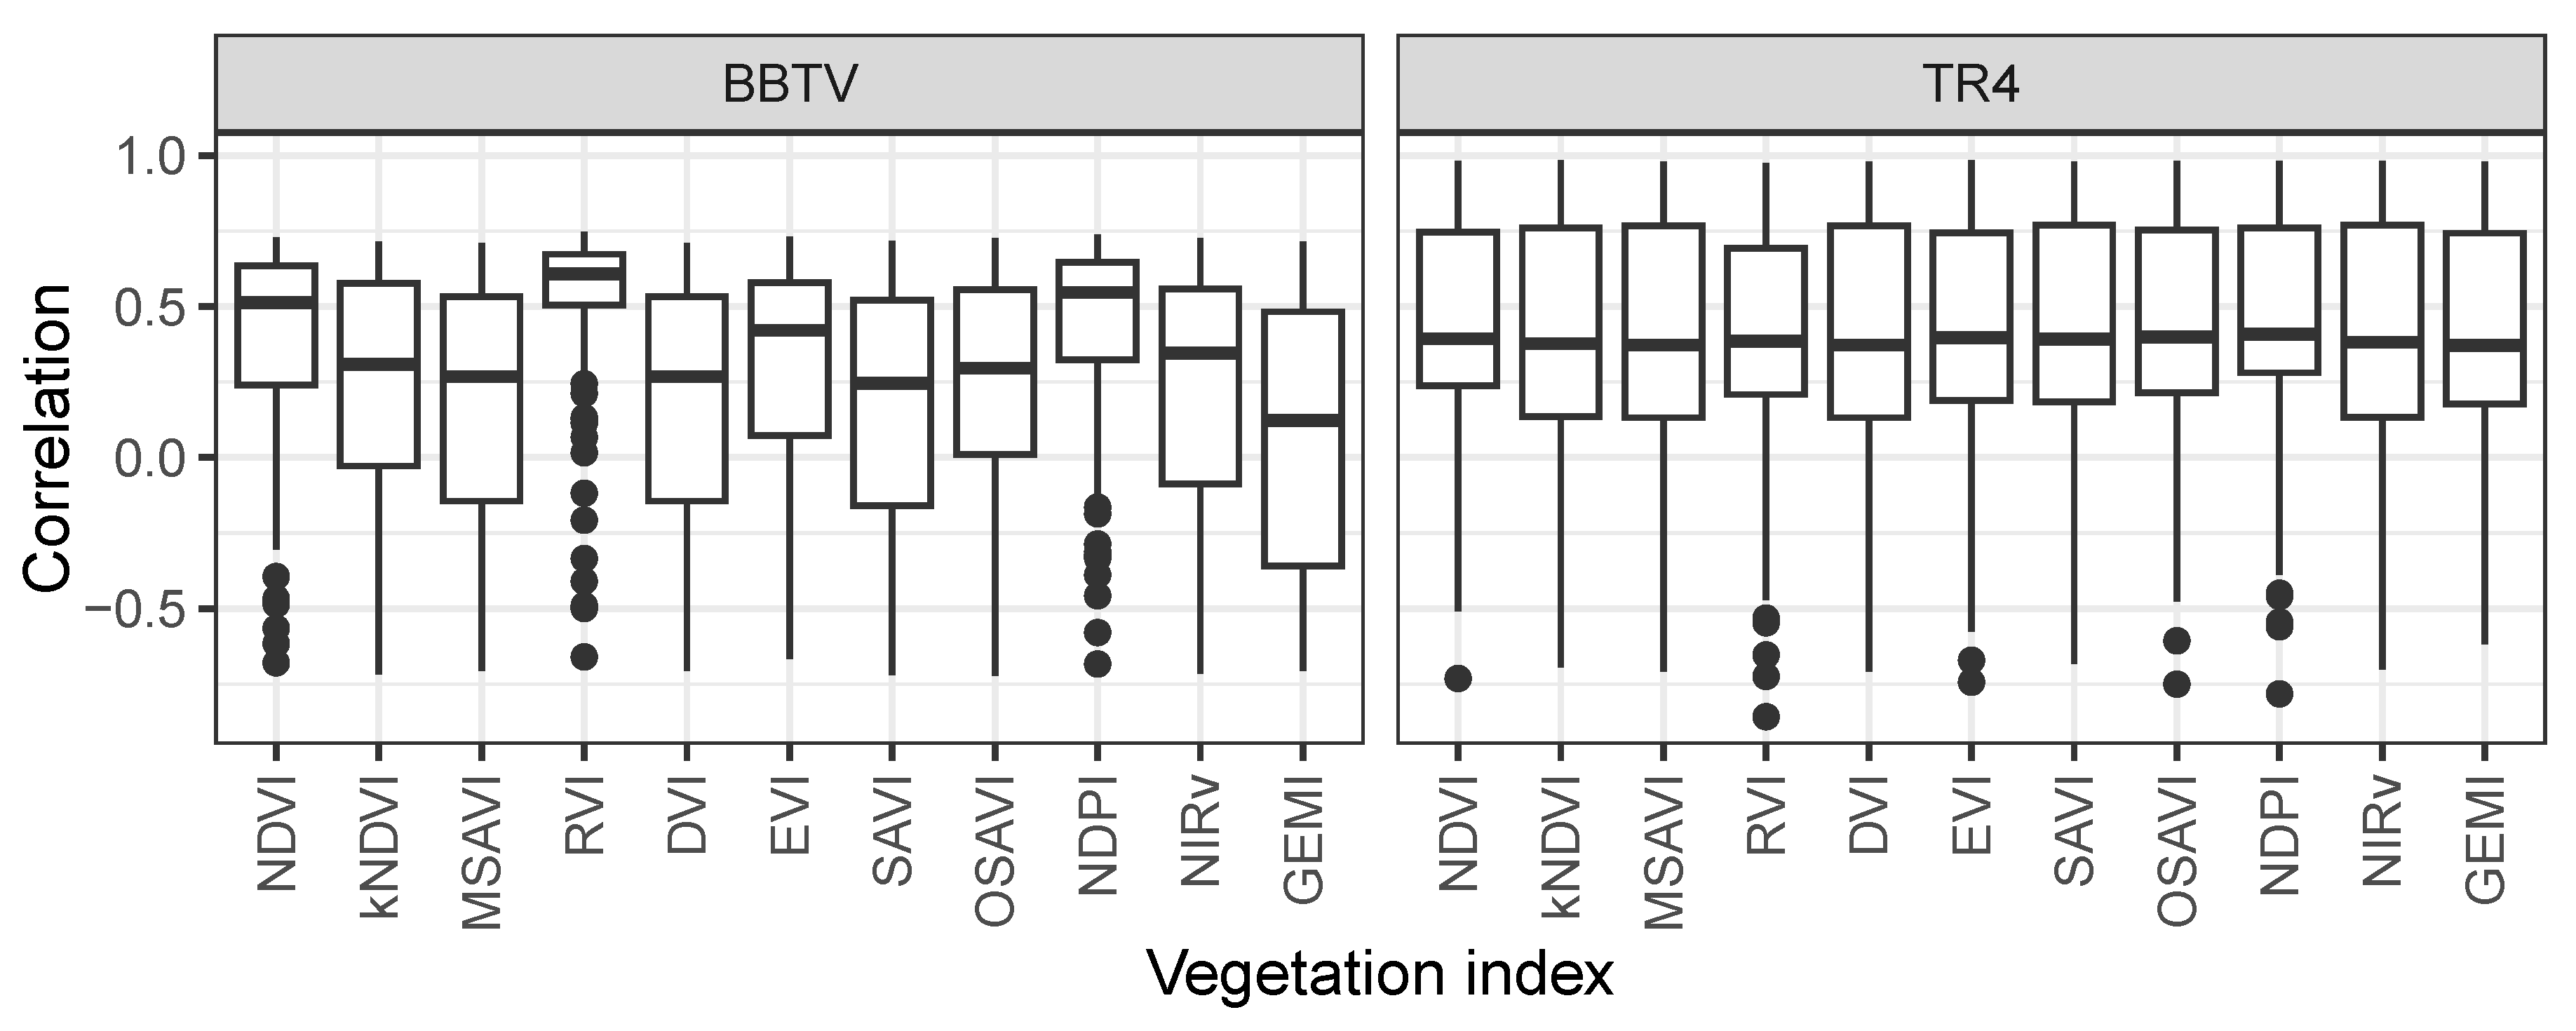

Table 1.
Vegetation indices used in the analyses where BLUE, RED, NIR, and SWIR correspond to the blue (’SR_B2’), red (’SR_B4’), near-infrared (’SR_B5’), and shortwave infrared (’SR_B6’) spectral bands, respectively.
Table 1.
Vegetation indices used in the analyses where BLUE, RED, NIR, and SWIR correspond to the blue (’SR_B2’), red (’SR_B4’), near-infrared (’SR_B5’), and shortwave infrared (’SR_B6’) spectral bands, respectively.
| Index | Formula | Ref. |
| Normalized difference vegetation index | [33] | |
| Kernel NDVI | [34] | |
| Ratio vegetation index | [35] | |
| Difference vegetation index | [36] | |
| Enhanced vegetation index | [37] | |
| Soil-adjusted vegetation index | [38] | |
| Modified soil-adjusted vegetation index | [39] | |
| Optimized soil-adjusted vegetation index | [40] | |
| Normalized difference phenology index | [41] | |
| Near-infrared reflectance of vegetation | [42] | |
| Global environment monitoring index | [43] | |
Table 2.
Division of the observation data into training, testing and forecasting sets. Size is the number of datapoints.
Table 2.
Division of the observation data into training, testing and forecasting sets. Size is the number of datapoints.
| Case | Split | Date range | Size |
| No disease | Training | Apr 2013 to Marc 2014 | 25 |
| No disease | Forecasting | Apr 2014 to Marc 2016 | 50 |
| BBTD | Training | Apr 2013 to Mar 2016 | 100 |
| BBTD | Testing | Apr 2015 to Dec 2015 | 31 |
| BBTD | Forecasting | Jan 2016 to Dec 2019 | 200 |
| Fusarium TR4 | Training | Jun 2013 to Apr 2014 | 48 |
| Fusarium TR4 | Forecasting | May 2014 to Oct 2015 | 79 |
Disclaimer/Publisher’s Note: The statements, opinions and data contained in all publications are solely those of the individual author(s) and contributor(s) and not of MDPI and/or the editor(s). MDPI and/or the editor(s) disclaim responsibility for any injury to people or property resulting from any ideas, methods, instructions or products referred to in the content. |
© 2025 by the authors. Licensee MDPI, Basel, Switzerland. This article is an open access article distributed under the terms and conditions of the Creative Commons Attribution (CC BY) license (http://creativecommons.org/licenses/by/4.0/).
Copyright: This open access article is published under a Creative Commons CC BY 4.0 license, which permit the free download, distribution, and reuse, provided that the author and preprint are cited in any reuse.


