
Submitted:
14 July 2025
Posted:
16 July 2025
You are already at the latest version
Abstract
Banana (Musa spp.) crops face severe yield and economic losses due to foliar diseases such as Moko disease and Black Sigatoka. In Ecuador, Moko outbreaks have increasingly devastated banana plantations, threatening one of the country’s most important export commodities and putting significant pressure on local producers and the national economy. Traditional field inspection methods are labor-intensive, subjective, and often ineffective for timely disease detection and containment. In this study, we propose an improved deep learning-based segmentation approach using YOLOv8 architectures to automatically detect and segment Moko and Black Sigatoka infections from unmanned aerial vehicle (UAV) imagery. Multiple YOLOv8 configurations were systematically analyzed and compared, including variations in backbone depth, model size, and hyperparameter tuning, to identify the most robust setup for field conditions. The final optimized configuration achieved a mean precision of 79.6%, recall of 80.3%, mAP@0.5 of 84.9%, and mAP@0.5:0.95 of 62.9%. The experimental results demonstrate that the improved YOLOv8 segmentation model significantly outperforms previous classification-based methods, offering precise instance-level localization of disease symptoms. This study provides a solid foundation for developing UAV-based automated monitoring pipelines, contributing to more efficient, objective, and scalable disease management strategies.
Keywords:
banana diseases
; Moko
; black Sigatoka
; UAV
; YOLOv8 segmentation
; precision agriculture
1. Introduction
Banana (Musa spp.) is a vital tropical fruit crop globally and represents one of the most significant pillars of the Ecuadorian agricultural economy. Ecuador is recognized as the largest banana exporter worldwide, contributing approximately 29% of global exports and supporting the livelihoods of thousands of farming families [1]. However, banana production is increasingly threatened by severe foliar diseases, particularly Moko and Black Sigatoka, which lead to substantial economic losses and compromise crop sustainability.
Moko disease, caused by Ralstonia solanacearum Race 2, is one of the most devastating bacterial infections affecting banana plantations. This pathogen rapidly colonizes the vascular system, causing leaf yellowing, fruit rot, and eventual plant death, resulting in complete plantation losses if not controlled promptly [2]. On the other hand, Black Sigatoka, caused by the fungus Pseudocercospora fijiensis, significantly reduces photosynthetic capacity through necrotic lesions on the leaves, shortens their lifecycle, and directly impacts fruit yield and quality [3]. Both diseases require early and precise detection to prevent widespread epidemics and minimize the dependence on chemical control measures, which are often costly and environmentally detrimental.
Traditional disease surveillance relies heavily on manual field inspections performed by trained agronomists. While these methods provide valuable on-site insights, they are labor-intensive, time-consuming, and subjective, leading to delays in detection and ineffective disease management [4]. This limitation is critical in Ecuador, where large-scale plantations demand rapid and scalable monitoring solutions.
Recent advances in precision agriculture have demonstrated that integrating unmanned aerial vehicles (UAVs) with deep learning-based computer vision offers a powerful alternative for rapid and accurate crop disease detection. UAVs enable high-resolution image acquisition over large areas with minimal disruption, while deep learning models, such as YOLO-based architectures, provide real-time instance segmentation and classification of symptomatic regions [5]. These technological innovations facilitate early intervention, optimize resource allocation, and support sustainable production practices.
The urgency to develop automatic and scalable monitoring systems is underscored by recent alarming outbreaks of Moko disease across Ecuador. Official reports indicate that over 36,000 field inspections were conducted in 2024, revealing widespread infections in key banana-producing provinces such as Los Ríos, Manabí, and Santo Domingo de los Tsáchilas [6]. The disease has affected more than 500 hectares across 205 farms and is estimated to threaten over 10,000 hectares nationwide [7]. Economic losses have reached approximately USD 700,000 per week due to compromised fruit quality and reduced exports, with up to 70,000 boxes impacted weekly [8]. In Los Ríos province alone, infection rates have risen dramatically to 8%, leading to potential losses estimated between 15,000 and 20,000 hectares of banana plantations [9]. These figures highlight the critical need for rapid, precise, and large-scale detection solutions, as traditional manual surveys are proving insufficient to mitigate the aggressive spread of this bacterial pathogen.
Motivated by the urgent need for effective disease management tools in banana plantations, this study proposes an improved YOLOv8-Segmentation model designed to automatically detect and segment Moko and Black Sigatoka infections using UAV imagery. Our contributions include the optimization of model configurations and rigorous evaluation on a custom high-resolution dataset collected in Ecuadorian banana farms. The ultimate goal is to provide a scalable, precise, and cost-effective solution to support field monitoring and decision-making, thereby enhancing the resilience and profitability of banana production systems.
In the remainder of this paper, Section 2 presents a comprehensive review of related works, emphasizing recent advances in UAV-based plant disease detection and highlighting the lack of integrated segmentation. Section 3 describes in detail the experimental setup used in this study, including the UAV-based image acquisition protocol, manual annotation and dataset preparation, the YOLOv8 segmentation architectures and their respective configurations, as well as the training strategies and computational environment. Section 4 presents the experimental results obtained from the comparative analysis of different YOLOv8 configurations, including global and per-class segmentation performance, training loss dynamics and hyperparameter impacts. Section 5 discusses the broader implications of these results, compares our model with recent state-of-the-art approaches, and highlights the practical advantages of deploying the improved YOLOv8-segmentation framework for UAV-based banana disease monitoring and precision agriculture. Finally, Section 6 summarizes the main findings, outlines future research directions to enhance model robustness and generalizability, and highlights the broader impact of the proposed framework on sustainable, data-driven banana disease management.
2. Related Work
Deep learning (DL) approaches combined with UAV-based remote sensing have shown promising potential in the early detection and monitoring of plant diseases, particularly in crops of high economic importance such as Banana. Lin et al. proposed BFWSD, a lightweight model for banana fusarium wilt severity detection using UAV imagery. By optimizing YOLOv8n with Ghost bottleneck and mixed local channel attention modules, their approach significantly reduced computational complexity while enhancing detection precision and recall, ultimately enabling deployment on mobile platforms for real-time field monitoring [10].
Sujatha et al. integrated DL and machine learning (ML) techniques for plant leaf disease detection, evaluating multiple datasets including banana leaves. Their method, which combined Inception v3 with SVM, achieved an accuracy of 91.9% for the banana leaf dataset, demonstrating the effectiveness of hybrid ML-DL frameworks for specific crop diseases [11].
Mora et al. introduced a georeferenced surveillance system for banana wilt diseases, integrating multiple YOLO foundation models and human-in-the-loop AI strategies. Their system achieved high precision and recall across diverse geographic regions, highlighting the importance of explainable AI for trustworthy and scalable disease monitoring [12].
Batool et al. developed a lightweight DL architecture incorporating depthwise separable convolutions and spatial attention mechanisms for plant disease classification. Their model achieved 98.7% accuracy on the PlantVillage dataset, showcasing high efficiency and suitability for resource-constrained agricultural settings [13].
Lastly, Bagheri and Kafashan conducted a comprehensive review of vegetation indices and data analysis methods for orchard monitoring using UAV-based remote sensing. Their study provides valuable insights into selecting appropriate indices and data processing strategies, facilitating improved decision-making and disease assessment in orchard crops, including banana plantations [14].
Based on the state-of-the-art approaches reviewed, it is evident that lightweight architectures (e.g., BFWSD with Ghost bottlenecks), hybrid DL-ML frameworks, and georeferenced surveillance systems have demonstrated high accuracy and real-time feasibility for plant disease detection. However, most prior works focused primarily on general leaf classification or severity scoring without precise leaf-level segmentation or explicit integration of anchor-free instance segmentation for fine-grained lesion delineation. Our proposed model builds upon these advances by adopting a customized YOLOv8m-seg backbone, specifically tailored to segment and classify Moko and Black Sigatoka in UAV imagery of banana crops.
3. Materials and Methods
To identify the optimal YOLOv8 segmentation configuration for accurately detecting Moko and Black Sigatoka in banana crops, a comprehensive comparative analysis of multiple architectures and hyperparameter settings was conducted. The primary objective was to develop a robust and efficient deep learning model capable of performing instance-level segmentation under real field conditions using UAV imagery. This section details the study area and data acquisition process, the image annotation and dataset preparation methodology, and the different YOLOv8 segmentation architectures and configurations evaluated during the study. Furthermore, the training strategies, evaluation metrics, and system resources employed are presented to provide full reproducibility and clarity regarding model development and performance assessment.
3.1. UAV Imagery Acquisition
The image dataset used for training and evaluating the segmentation models was collected at Hacienda La Lorena, located in Quinsaloma, Los Ríos Province, Ecuador (coordinates: 1°9’25.20"S, 79°22’28.92"W). This plantation area is one of Ecuador’s primary banana production zones and is characterized by a tropical climate with high humidity, favoring the spread of foliar diseases such as Moko and Black Sigatoka.
A DJI Mini 3 UAV equipped with a 20 MP RGB camera was employed to acquire high-resolution aerial imagery. The drone operated at altitudes ranging from 3 to 5 meters above ground level, allowing for an optimal balance between field coverage and leaf-level detail. The flights were performed under diverse lighting and environmental conditions to ensure variability in the dataset, which is crucial for developing models robust to field heterogeneity.
In total, 900 images with a resolution of 1024 × 1024 pixels were collected, capturing a variety of canopy structures and disease manifestations. The images included regions confirmed to have Moko, areas with Black Sigatoka symptoms, and sections of healthy foliage. All collected images underwent a rigorous verification process by experienced agronomists to confirm the presence and type of foliar symptoms, ensuring high-quality and reliable ground truth data.
The dataset was annotated into three main categories:
- Moko
- Black Sigatoka
- Healthy leaves
Figure 1 illustrates representative examples from each disease class collected during UAV field campaigns. Each row corresponds to one of the defined categories: healthy leaves, Moko, and Black Sigatoka. The images demonstrate the variability in appearance, lighting conditions, and foliar symptom expression encountered in real plantation environments. This diversity, combined with high spatial resolution and expert agronomic validation, ensures the creation of a robust and reliable dataset. Such high-quality annotated data is fundamental for training and evaluating the YOLOv8 segmentation model, ultimately supporting precise disease identification and contributing to the advancement of UAV-based plant health monitoring systems.
3.2. Image Annotation and Dataset Preparation
After acquisition, all UAV images were manually annotated to create high-quality and precise segmentation masks. The dataset was organized following a structured folder hierarchy to facilitate data management and model training. Specifically, the directory structure included two main subsets: images/train and images/val for images, and labels/train and labels/val for their corresponding annotation files. This clear separation ensured an appropriate split for training (70%) and validation (30%), maintaining a proportional distribution of all classes in each subset.
Each UAV image was manually labeled using Label Studio [15], an open-source data annotation platform that supports polygon-based segmentation. Rather than using rectangular bounding boxes, each object (leaf region) was delineated using detailed polygon masks. This choice is essential for representing the irregular and non-uniform shapes of foliar lesions and leaf edges, particularly in the context of Moko and Black Sigatoka. Bounding boxes would not capture fine morphological boundaries and could include significant portions of healthy tissue, potentially reducing segmentation accuracy.
The annotation process defined three main classes: Healthy, Moko, and Black Sigatoka. To ensure consistency and accuracy, all polygon masks were validated by experienced agronomists specializing in banana crop diseases.
Figure 2 shows three representative examples of annotated UAV images with detailed polygon-based segmentation and class labels overlaid.
The first example, Figure 2a depicts a group of fully healthy leaves. All leaf regions are delineated with red polygons labeled “Healthy,” emphasizing the model’s capacity to differentiate and segment multiple healthy instances in dense foliage. The polygon masks closely follow the edges of each individual leaf, allowing for a fine-grained representation even in cases where leaves overlap or appear in complex arrangements.
In the second example, Figure 2b illustrates multiple banana leaves infected with Moko. The polygons capture the irregular, necrotic regions typical of Moko infection, which often present heterogeneous shapes and edges that cannot be accurately described using simple rectangular bounding boxes.
The third example, Figure 2c presents a mixed scenario containing both healthy leaves and leaves affected by Black Sigatoka. In this image, the healthy leaf regions are labeled as “Healthy,” while the infected areas are labeled as “Black Sigatoka.” The polygons precisely follow the natural contours of the leaves, highlighting specific necrotic lesions in the case of Sigatoka, and accurately separating them from the surrounding healthy tissue. This dual labeling within a single image underscores the necessity for multi-class segmentation capabilities in field conditions.
Alongside the segmentation masks, each annotated image included a corresponding label.txt file. These text files follow a simplified YOLO format and contain a line for each object instance in the image. Each line is composed of five normalized values:
- Class ID: An integer representing the object’s class. In this study: 0 for Healthy leaves, 1 for Moko, and 2 for Black Sigatoka.
- X center: Normalized horizontal coordinate of the bounding box center, ranging from 0 to 1.
- Y center: Normalized vertical coordinate of the bounding box center, ranging from 0 to 1.
- Width: Normalized width of the bounding box.
- Height: Normalized height of the bounding box.
Although the YOLO label files store bounding box information for compatibility, the actual segmentation is based on polygon masks, which are stored separately as part of the YOLOv8 segmentation pipeline. This dual representation ensures both efficient object localization and precise shape delineation.
3.3. YOLOv8 Baseline Architecture
For the segmentation task, multiple YOLOv8 segmentation variants were explored to identify the best configuration for banana foliar disease detection. The models were based on different backbone scales (nano, small, medium) to balance accuracy and computational efficiency in UAV imagery.
In this study, we adopted a segmentation model based on the YOLOv8 architecture, designed specifically for UAV-based banana disease monitoring. YOLOv8 is an advanced single-stage detection and segmentation model known for its efficient feature extraction capabilities and rapid inference speed [16], as illustrated in Figure 3. To further improve segmentation performance on complex foliar structures and heterogeneous backgrounds, we explored variations in backbone complexity, resolution, and optimizer configurations. The architecture integrates multi-scale feature fusion and refined bottleneck modules, enabling precise delineation of disease lesions even under challenging field conditions. This robust design allows accurate real-time detection and segmentation of banana leaf diseases, supporting precision agriculture applications.
3.4. YOLOv8 Experimental Configurations
To systematically identify the most effective YOLOv8 configuration for UAV-based segmentation of banana foliar diseases, a series of seven experimental setups were designed and evaluated. These configurations were defined to explore the impact of image resolution, backbone architecture (nano, small, medium), training epochs, batch size, initial learning rate, and optimizer strategy on segmentation accuracy and computational efficiency.
Table 1 summarizes the configurations assessed in this study. The experiments included both baseline and advanced setups to examine the trade-offs between model complexity, precision, and resource requirements. Higher resolutions (768 and 1024 pixels) were hypothesized to improve fine-grained segmentation of disease lesions, while backbone variations allowed analysis of the balance between model capacity and inference speed. Additionally, the adoption of advanced optimizers such as SGD with momentum and AdamW with weight decay aimed to enhance model convergence and mitigate overfitting in challenging field conditions.
Table 2 provides detailed descriptions of each configuration, outlining their specific design rationale and expected advantages. The baseline configuration (YOLOv8_Baseline) served as a reference point with standard parameters. In contrast, configurations like YOLOv8_s768_AdamW and YOLOv8_m1024_AdamW combined higher resolutions with regularization strategies to promote generalization and improve segmentation accuracy of disease-affected leaf regions. Together, these descriptions provide critical context for interpreting the comparative results presented in the subsequent sections.
This systematic configuration analysis establishes a robust experimental framework to interpret and compare model performance in real UAV imagery scenarios, ultimately guiding the selection of the most suitable YOLOv8 variant for precision agriculture applications in banana plantations.
3.5. Training and Testing Environment
The training process was conducted using Google Colab, leveraging a Tesla T4 GPU provided by the Google Compute Engine backend with Python 3. The system resources included 12.7 GB of system RAM, 15 GB of GPU memory, and 112 GB of disk space, of which approximately 38 GB were used during experiments. GPU acceleration was explicitly enabled in the YOLOv8 training configuration by setting device=0, ensuring that the model utilized the available GPU for all iterations.
All models were trained for up to 100 epochs, with batch sizes ranging from 2 to 8 depending on the image resolution and GPU memory constraints. The initial learning rate () was set between 0.002 and 0.01, with different optimizers explored, including Stochastic Gradient Descent (SGD) with momentum and AdamW. Specific configurations also tested variations in batch size (e.g., 4, 8, 12, and 16) and learning rates (e.g., 0.1 and 0.001) to assess their impact on convergence and generalization.
3.6. Evaluation Metrics
To evaluate model performance, standard segmentation metrics were employed, including mean Precision (P), Recall (R), and mean Average Precision (mAP). The Precision (Equation 1) represents the proportion of true positive detections among all positive predictions. Recall (Equation 2) measures the proportion of correctly identified objects relative to the total number of ground truth instances. The mean Average Precision (Equation 3) is calculated as the mean of average precision values across all target classes, quantifying overall detection and segmentation accuracy.
Here, denotes true positives (correctly detected and classified regions), refers to false positives, and represents false negatives. These metrics provide a comprehensive assessment of the model’s ability to accurately segment and detect banana foliar diseases under realistic UAV imaging conditions.
4. Results
4.1. Comparative Analysis of the Different Models
Table 3 presents the global performance metrics, model size, and inference time for each YOLOv8 configuration. These results provide a comprehensive overview of each configuration’s trade-off between accuracy, model complexity, and computational efficiency, forming a solid foundation for further analysis of hyperparameter impacts.
Among the evaluated configurations, YOLOv8_m512 and YOLOv8_m1024_AdamW stand out due to their high mAP@0.5 and mAP@0.5:0.95 values, indicating superior overall segmentation accuracy and robustness. The YOLOv8_m512 model, which combines a medium backbone with momentum-enhanced SGD, achieved the highest mAP@0.5:0.95 (0.629), reflecting its ability to handle fine disease boundary delineation. Meanwhile, YOLOv8_m1024_AdamW achieved the highest mAP@0.5 (0.852), suggesting strong global detection performance while maintaining a reasonable inference time of 54.78 ms per image. Additionally, YOLOv8_s768 demonstrated the highest precision (0.820), indicating a strong capacity to reduce false positives. These results highlight the benefits of integrating medium backbones, higher resolutions, and advanced optimization strategies to enhance segmentation performance in UAV-based plant disease detection scenarios.
4.2. Per-Class Segmentation Performance
Figure 4 illustrates the per-class segmentation performance across different YOLOv8 configurations. The radar plots highlight key evaluation metrics (precision, recall, mAP@0.5, and mAP@0.5:0.95) for Healthy Leaves, Moko, and Black Sigatoka, respectively. By visualizing the metrics side by side, it is possible to observe the strengths and weaknesses of each configuration when targeting specific disease patterns.
Figure 4a illustrates the per-class metrics for Healthy Leaves. Precision values are generally high across all configurations, indicating strong ability to correctly identify non-infected regions. mAP@0.5 and mAP@0.5:0.95 scores remain consistently robust, suggesting stable segmentation performance for healthy foliage under varying conditions.
Figure 4b shows the metrics for Moko. The configurations achieve high recall values, reflecting the models’ capacity to detect severe disease symptoms effectively. Slight variations in mAP@0.5:0.95 scores indicate differences in fine boundary delineation accuracy among methods.
Figure 4c presents the metrics for Black Sigatoka. This class exhibits slightly lower mAP@0.5:0.95 scores compared to the other classes, highlighting the complexity of segmenting necrotic and partially affected regions. Nevertheless, certain configurations, such as YOLOv8_m512, maintain high precision and recall, demonstrating promising segmentation performance.
4.3. Training Loss and Convergence Analysis
Figure 5 shows the evolution of mAP@0.5 and mAP@0.5:0.95 (Mean) scores across all YOLOv8 configurations during training. All configurations exhibit a rapid increase in mAP values during the initial epochs, indicating effective learning of object localization and segmentation boundaries. The curves progressively stabilize as the models converge, with minor oscillations observed in certain configurations due to batch size and optimizer variations. The mAP@0.5 curves (Figure 5a) generally plateau at higher values, while mAP@0.5:0.95 curves (Figure 5b) exhibit a smoother and more gradual rise, reflecting stricter intersection-over-union (IoU) thresholds.
Among all configurations, the YOLOv8_m5122 model stands out, achieving the highest final mAP@0.5:0.95 (0.629), indicating superior capability to segment fine disease boundaries and maintain robust generalization under challenging UAV field conditions. This performance highlights its suitability as the optimal configuration for UAV-based banana foliar disease detection in this study. These plots provide a clear visualization of the convergence dynamics and support the selection of YOLOv8_m5122 as the most reliable and accurate model for real-world deployment.
Figure 6 presents the evolution of box loss and segmentation loss during training for all YOLOv8 configurations. Both loss curves show a rapid decrease in the initial epochs, reflecting effective early-stage optimization and strong convergence of the models. The box loss curves progressively stabilize at lower values, indicating improved accuracy in bounding box regression. Similarly, segmentation loss curves show consistent downward trends, confirming enhanced pixel-level mask generation throughout training. Minor fluctuations observed in some configurations are attributed to optimizer dynamics and learning rate schedules.
Among all models, the YOLOv8_m5122 configuration demonstrates the lowest final box loss and segmentation loss values, suggesting superior localization accuracy and fine-grained mask prediction capabilities. This behavior further validates YOLOv8_m5122 as the most robust and accurate architecture for UAV-based banana disease segmentation and supports its selection as the optimal model for real-world field deployment.
4.4. Impact of Hyperparameters
Figure 7 illustrates the trade-off between segmentation accuracy and inference speed for each YOLOv8 configuration. The horizontal axis represents inference time per image, while the vertical axis shows the mAP@0.5:0.95 values. Circle sizes correspond to model sizes in MB, providing additional insight into the computational cost of each variant. This plot clearly highlights the balance that must be considered when selecting a configuration for UAV-based plant disease detection, depending on operational constraints and accuracy requirements.
As shown in Figure 7, the YOLOv8 configurations exhibit a clear trade-off between segmentation accuracy, inference speed, and model complexity. The YOLOv8_m512 model achieves the highest mAP@0.5:0.95 (0.629), but it comes with a larger model size (52.27 MB) and moderate inference time (58.0 ms), indicating its suitability for scenarios where accuracy is prioritized over speed. Meanwhile, YOLOv8_n512 and YOLOv8_n1024SGD configurations demonstrate faster inference times (33.13 ms and 34.92 ms, respectively) with relatively smaller model sizes (around 6.5 MB), making them more appropriate for real-time or resource-constrained UAV deployments, albeit with slightly lower mAP@0.5:0.95 values. The YOLOv8_s768 variant shows a favorable balance, achieving a higher precision (0.820) and maintaining a competitive mAP@0.5:0.95 (0.601), with moderate model size (22.77 MB) and inference time (44.36 ms). These observations emphasize the necessity of selecting a model configuration that aligns with the specific operational constraints and performance requirements of UAV-based plant disease monitoring missions.
4.5. Architecture Adjustments for Banana Disease Detection
After analyzing the results from seven different YOLOv8 segmentation configurations, the banano_seg_v8_m5122 variant was selected as the optimal model for UAV-based detection of Moko and Black Sigatoka in banana crops. The chosen model is based on the YOLOv8m-seg architecture, comprising 191 layers and 27,241,385 parameters, with approximately 110.4 GFLOPs. This model achieved a precision of 0.796, recall of 0.803, mAP@0.5 of 0.849, and the highest mAP@0.5:0.95 of 0.629 among all tested configurations. These metrics reflect a robust ability to delineate disease boundaries precisely while minimizing false positives and false negatives.
The modifications aim to enhance fine lesion delineation, improve robustness under variable field conditions, and reduce false positives in overlapping foliage regions.
4.5.1. Input Resolution and Multi-Scale Context Enhancement
The input resolution was set to pixels to balance fine detail capture and inference speed, crucial for real-time UAV monitoring of banana crops. This resolution ensures sufficient granularity to detect small necrotic lesions characteristic of Black Sigatoka and the diffuse wilting patterns of Moko, while keeping computational demands practical for field deployment.
To further improve context awareness, the Spatial Pyramid Pooling Fast (SPPF) module was emphasized. This allows the model to integrate multi-scale contextual information, capturing both large-scale foliar patterns and fine-scale symptomatic areas.
Each with different kernel sizes enables detection of varying lesion sizes and shapes across different disease stages.
4.5.2. Custom Class Head for Banana Diseases
The head layer was reconfigured to explicitly predict three relevant classes: healthy leaves, Moko, and Black Sigatoka. This custom class design directly reflects the agronomic reality of banana plantations and supports targeted interventions.
where . Additionally, adopting an anchor-free segmentation approach improves fine-edge delineation of irregular and overlapping symptoms, which is essential for distinguishing complex disease zones often present in banana canopies.
4.5.3. Loss Function Weight Adjustments
The loss function was reweighted to emphasize accurate segmentation over pure detection, reflecting the agronomic need for precise spatial mapping of infected leaf regions rather than just bounding box localization.
with empirically defined weights:
By increasing , the model prioritizes high-quality mask prediction, which is crucial for guiding selective pruning, targeted fungicide application, and other precision agriculture actions.
4.5.4. Feature Reuse with Cross Stage Partial Blocks
Cross Stage Partial (C2f) blocks were strategically retained and extended to enhance feature reuse and preserve fine structural details. This is critical for accurately segmenting thin necrotic streaks and heterogeneous lesion edges, typical in Black Sigatoka progression.
Mathematically expressed as:
Here, denotes transformed features and the shortcut, supporting robust gradient propagation and fine-grained texture preservation.
4.5.5. Upsampling and Multi-Level Fusion in Neck
Additional upsampling and multi-level concatenations were introduced in the neck to integrate deep semantic features with high-resolution spatial information. This multi-scale fusion is vital for segmenting irregular leaf patterns and mixed infection zones that often co-occur in banana fields.
where represents features from early backbone stages. This configuration enhances localization precision, even when leaves overlap or show partial symptom development.
4.5.6. Adjusted Depth and Width Multipliers
Depth and width multipliers were fine-tuned to achieve a trade-off between model complexity and field deployment efficiency.
with and . This adjustment reduces over-parameterization, improving generalization on banana foliage while maintaining sufficient capacity to capture complex lesion morphology in diverse environmental conditions.
4.6. Inference and Visual Results
Figure 8 showcases representative qualitative results obtained from the best-performing configuration, YOLOv8_m512 (detailed in Section 4.5). These examples illustrate segmentation predictions across different classes, including Healthy leaves, Moko, and Black Sigatoka. Each subfigure displays clear leaf boundaries delineated in red, with the class label and corresponding confidence score centrally annotated. The high confidence values reflect robust disease detection and precise leaf contour delineation, demonstrating the practical applicability of the model for UAV-based monitoring in banana crops.
Figure 8 provides a detailed qualitative evaluation of the YOLOv8_m512 model’s performance across different banana leaf conditions. The first row (Figure 8a,b) displays examples of healthy leaves, where the model accurately identifies clean and intact leaf structures with high confidence scores, demonstrating its capability to minimize false positives in disease-free areas. The second row (Figure 8c,d) showcases Moko symptoms, characterized by yellowing and necrotic patches; here, the model successfully segments affected regions, even under complex backgrounds, with robust confidence levels. The third row (Figure 8e,f) highlights Black Sigatoka cases, capturing early and advanced necrotic streaks with precise contour delineation and confident class predictions. These qualitative results reinforce the model’s robustness and generalization ability for UAV-based disease monitoring in real-world plantation scenarios.
5. Discussion
The proposed improved YOLOv8-segmentation model for detecting Moko and Black Sigatoka in banana crops demonstrated notable advancements compared to previous approaches. By leveraging UAV-based high-resolution imagery and an optimized instance segmentation framework, our model achieved a mean precision of 79.6%, recall of 80.3%, mAP@0.5 of 84.9%, and mAP@0.5:0.95 of 62.9%. These results highlight the model’s robust capability to accurately delineate diseased and healthy leaf regions even under field variability.
In recent literature, Lin et al. [10] introduced the BFWSD model, which leverages YOLOv8n architecture optimized with Ghost bottlenecks and local channel attention modules to monitor banana fusarium wilt severity. While their model achieved remarkable improvements in parameter reduction and real-time field deployment (including Android integration), it primarily focused on severity indexing rather than precise instance-level segmentation. Our model instead emphasizes detailed pixel-wise segmentation and spatial mapping, providing more actionable insights for precise intervention planning.
Furthermore, Mora et al. [12] presented a digital georeferenced framework integrating YOLO foundation models (YOLO-NAS, YOLOv8, YOLOv9) with explainable AI and human-in-the-loop correction, achieving excellent performance on both aerial and ground-level imagery. However, their work was primarily designed for multiplatform surveillance and general disease categorization. By contrast, our model focuses specifically on UAV-based high-resolution imagery for banana foliar diseases and incorporates real-time geospatial visualization tailored for plantation-level decision support.
Sujatha et al. [11] and Batool et al. [13] explored hybrid machine learning and deep learning strategies to improve disease classification in various plant species, achieving strong classification accuracies on several leaf datasets. While these works underline the potential of combining CNNs with traditional ML classifiers or incorporating attention mechanisms, they primarily address leaf-level image classification tasks under controlled settings, lacking UAV-based large-scale field applications and instance segmentation capabilities.
In addition, Bagheri and Kafashan [14] extensively reviewed data analysis methods and vegetation indices for UAV-based orchard monitoring, emphasizing the need for robust, scalable approaches tailored to diverse canopy structures and spectral responses. Our model contributes to this discourse by providing a practical segmentation solution using standard RGB imagery without reliance on complex vegetation indices or multi-spectral data, thus enhancing accessibility for banana growers.
The integration of geospatial mapping in our system further strengthens its practical applicability. By embedding GPS metadata and visualizing disease distributions on interactive maps, our framework enables plantation managers to localize infection hotspots accurately and prioritize field interventions efficiently. This functionality aligns with the direction highlighted by Mora et al. [12], who emphasize georeferenced surveillance as a critical feature in future agricultural disease management frameworks.
Overall, the improved YOLOv8 segmentation model presented in this study closes critical gaps identified in recent research, offering detailed, high-precision disease delineation, robust field applicability, and an intuitive geospatial interface. These contributions support a transition from manual, reactive disease management toward proactive, data-driven precision agriculture in banana production systems.
6. Conclusions and Future Work
This study presented an improved YOLOv8-based segmentation model specifically designed for the detection and mapping of Moko and Black Sigatoka in banana plantations using UAV imagery. By integrating instance-level segmentation and geospatial visualization capabilities, the proposed system enables accurate, real-time identification of diseased and healthy leaf regions, thus supporting informed decision-making for precision agriculture.
The model achieved a mean precision of 79.6%, recall of 80.3%, mAP@0.5 of 84.9%, and mAP@0.5:0.95 of 62.9%, demonstrating strong performance under field conditions. Compared to traditional manual inspections and earlier classification-focused models, our approach offers a robust, scalable, and accessible solution using only standard RGB UAV imagery.
Future work will focus on enhancing the robustness and generalizability of the model under diverse environmental and lighting conditions by expanding the dataset to include images captured across different seasons and plantation contexts. Additional studies will investigate the integration of multi-spectral and hyperspectral data to improve early-stage disease detection and severity assessment.
In summary, the proposed model lays a strong foundation for advancing UAV-based disease monitoring systems in banana production, contributing to more sustainable, efficient, and precise plant health management practices.
Acknowledgments
The authors would like to express their gratitude to the State Technical University of Quevedo for the support provided throughout this research. Their continuous encouragement and resources have been invaluable in the development of this study.
Conflicts of Interest
Declare conflicts of interest or state “The authors declare no conflicts of interest.”
References
- Ministerio de Agricultura y Ganadería, Ecuador. Agricultural Export Report 2023, 2023. Accessed: 2025-06-28.
- Marín, J.; Botero Fernández, V.; Zapata-Henao, S.; Hoyos-Carvajal, L. Early detection of bacterial wilt in bananas caused by Ralstonia solanacearum. Journal of Plant Pathology 2023, 105, 587–598. [Google Scholar] [CrossRef]
- Henao-Ochoa, D.; Rey-Valenzuela, V.; Zapata-Henao, S.; Arango-Isaza, R.; Rodríguez-Cabal, H.; Morales, J. Application of defense inducers reduces the severity of Black Sigatoka (Pseudocercospora fijiensis) in Musa acuminata AAA Cavendish. European Journal of Plant Pathology 2025, 172, 241–259. [Google Scholar] [CrossRef]
- Selvaraj, M.; Vergara, A.; Montenegro, F.; Ruiz, H.; Safari, N.; Raymaekers, D.; Ocimati, W.; Ntamwira, J.; Tits, L.; Omondi, A.; et al. Detection of banana plants and their major diseases through aerial images and machine learning methods: A case study in DR Congo and Republic of Benin. ISPRS Journal of Photogrammetry and Remote Sensing 2020, 169, 110–124. [Google Scholar] [CrossRef]
- Linero-Ramos, R.; Parra-Rodríguez, C.; Espinosa-Valdez, A.; Gómez-Rojas, J.; Gongora, M. Assessment of Dataset Scalability for Classification of Black Sigatoka in Banana Crops Using UAV-Based Multispectral Images and Deep Learning Techniques. Drones 2024, 8. [Google Scholar] [CrossRef]
- Agrocalidad. Agrocalidad impulsa acciones para el control del moko con respaldo técnico, 2024. Accessed: 2025-07-11.
- FreshPlaza. El moko amenaza la producción de plátano verde en Ecuador y dispara los precios, 2025. Accessed: 2025-07-11.
- Agroinsurance. Banana producers lose $700,000 a week due to Moko, 2024. Accessed: 2025-07-11.
- Sopisconews. Moko Severely Affects Banana Plantations in Los Ríos, 2024. Accessed: 2025-07-11.
- Lin, S.; Ji, T.; Wang, J.; Li, K.; Lu, F.; Ma, C.; Gao, Z. BFWSD: A lightweight algorithm for banana fusarium wilt severity detection via UAV-Based Large-Scale Monitoring. Smart Agricultural Technology 2025, 11. [Google Scholar] [CrossRef]
- Sujatha, R.; Krishnan, S.; Chatterjee, J.M.; Gandomi, A.H. Advancing plant leaf disease detection integrating machine learning and deep learning. Scientific Reports 2025, 15. [Google Scholar] [CrossRef] [PubMed]
- Mora, J.J.; Blomme, G.; Safari, N.; Elayabalan, S.; Selvarajan, R.; Selvaraj, M.G. Digital framework for georeferenced multiplatform surveillance of banana wilt using human in the loop AI and YOLO foundation models. Scientific Reports 2025, 15. [Google Scholar] [CrossRef] [PubMed]
- Batool, A.; Kim, J.; Byun, Y.C. A compact deep learning approach integrating depthwise convolutions and spatial attention for plant disease classification. Plant Methods 2025, 21. [Google Scholar] [CrossRef] [PubMed]
- Bagheri, N.; Kafashan, J. Appropriate vegetation indices and data analysis methods for orchards monitoring using UAV-based remote sensing: A comprehensive research. Computers and Electronics in Agriculture 2025, 235. [Google Scholar] [CrossRef]
- Label Studio: Open-source data labeling tool. https://labelstud.io. Accessed: 2025-07-09.
- Jocher, G.; Chaurasia, A.; Qiu, J.; Stoken, J. YOLOv8: Ultralytics official implementation. https://github.com/ultralytics/ultralytics, 2023. Accessed: 2025-07-09.
Figure 1.
Examples of UAV images for each disease class: (a) healthy leaves, (b) Moko, and (c) Black Sigatoka. Each row represents one class, shown in a single horizontal line for consistency.
Figure 1.
Examples of UAV images for each disease class: (a) healthy leaves, (b) Moko, and (c) Black Sigatoka. Each row represents one class, shown in a single horizontal line for consistency.
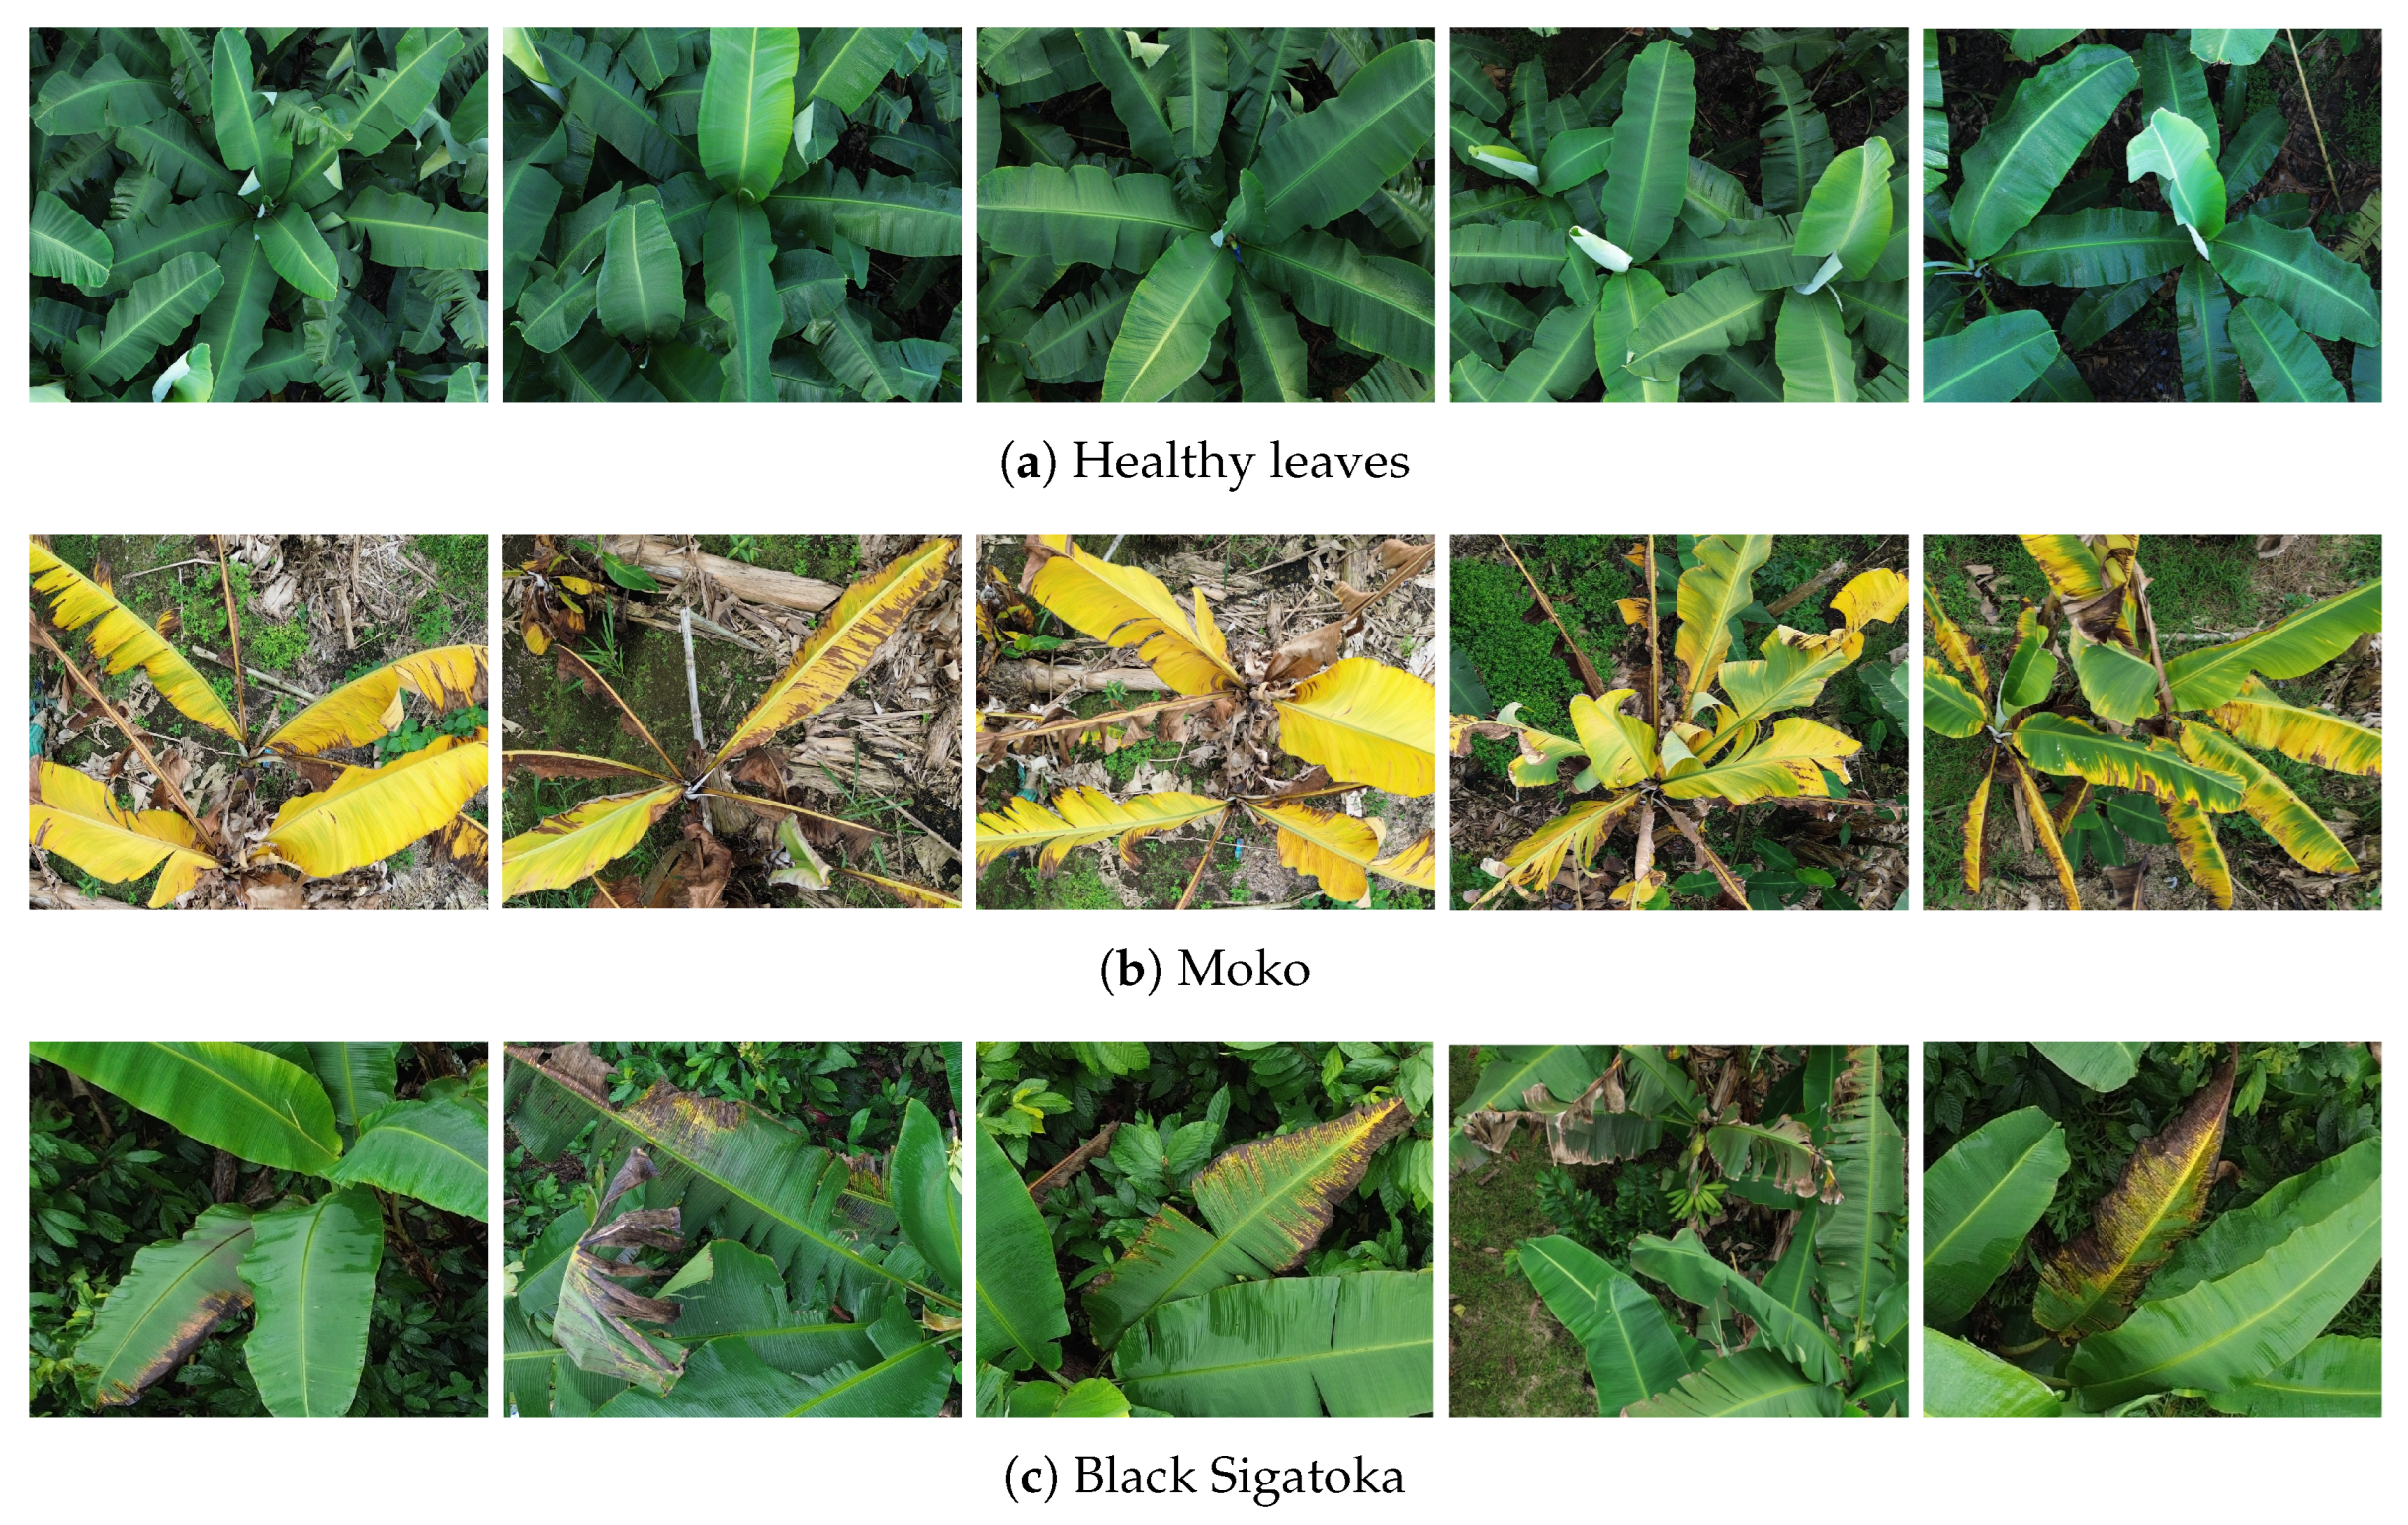
Figure 2.
Examples of segmented UAV images from different classes: (a) Healthy leaves, (b) Moko, and (c) Black Sigatoka. The class label is shown below each image for clarity.
Figure 2.
Examples of segmented UAV images from different classes: (a) Healthy leaves, (b) Moko, and (c) Black Sigatoka. The class label is shown below each image for clarity.
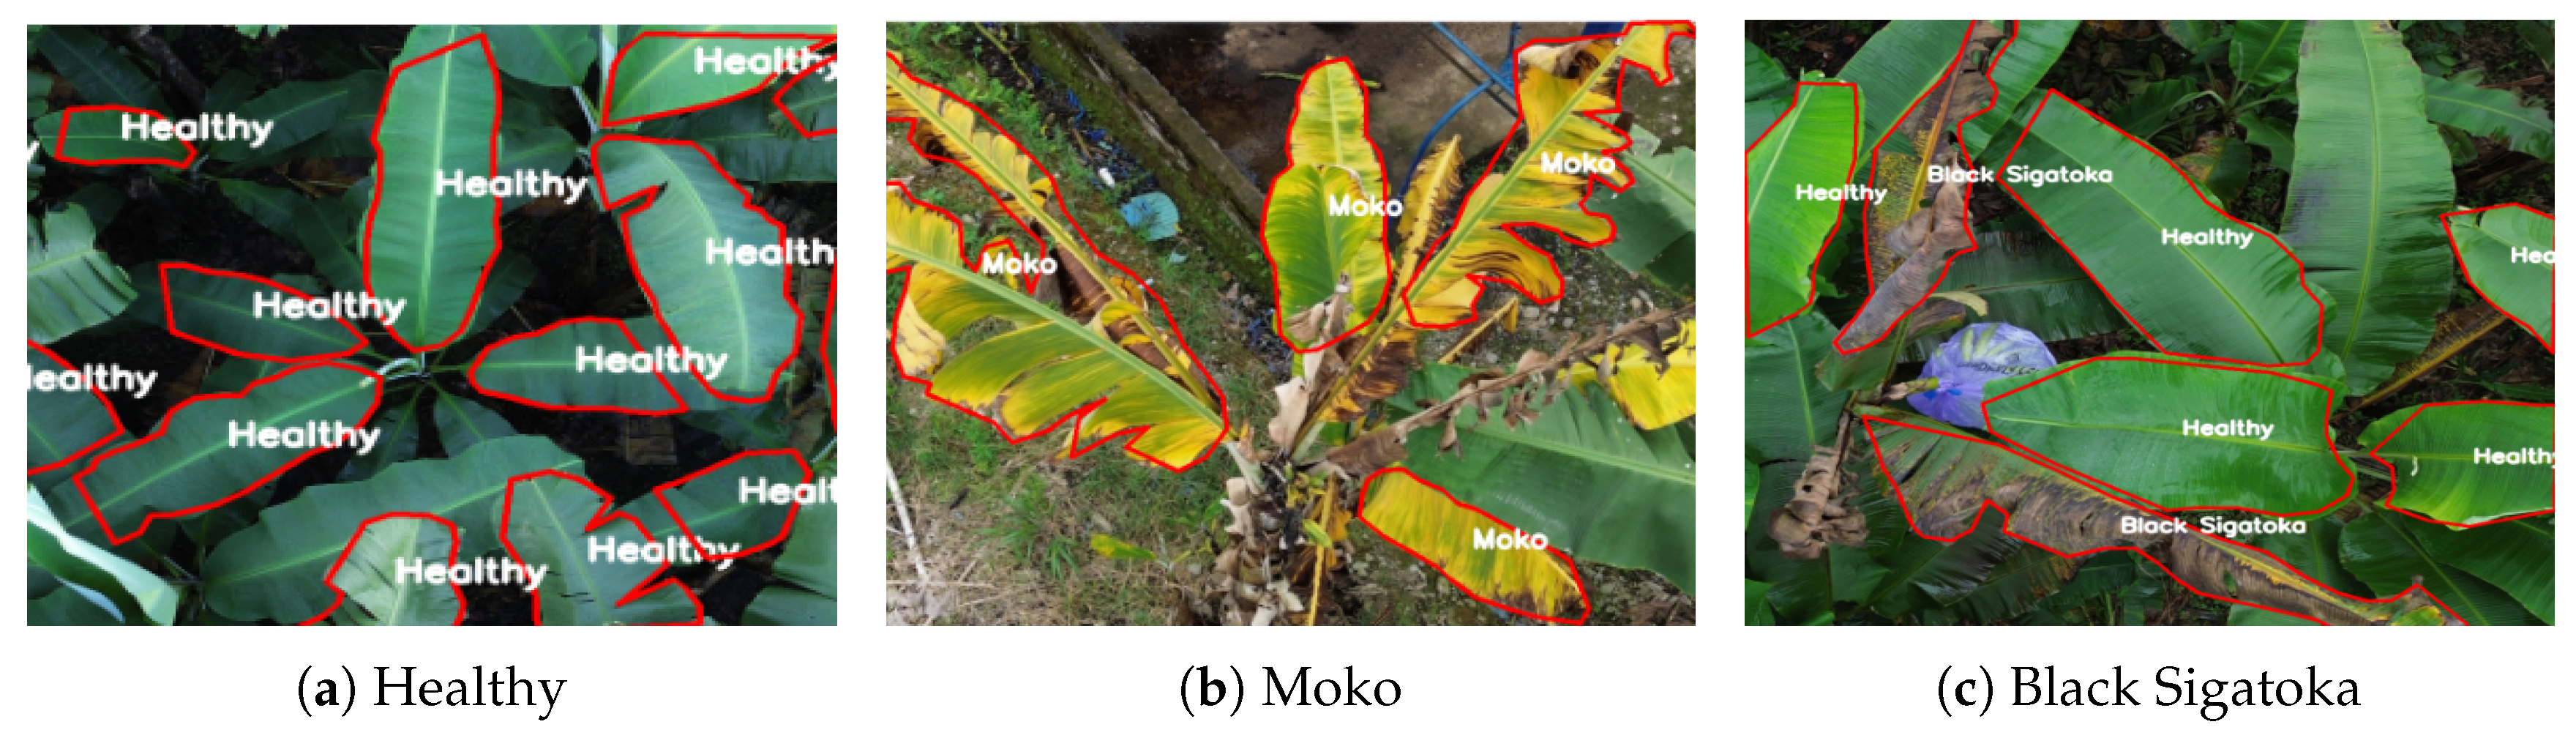
Figure 3.
Schematic representation of the YOLOv8-based segmentation architecture [16] adapted for UAV-based banana disease detection. The model comprises a backbone for feature extraction, a neck for multi-scale feature aggregation, and a head for segmentation and detection outputs.
Figure 3.
Schematic representation of the YOLOv8-based segmentation architecture [16] adapted for UAV-based banana disease detection. The model comprises a backbone for feature extraction, a neck for multi-scale feature aggregation, and a head for segmentation and detection outputs.
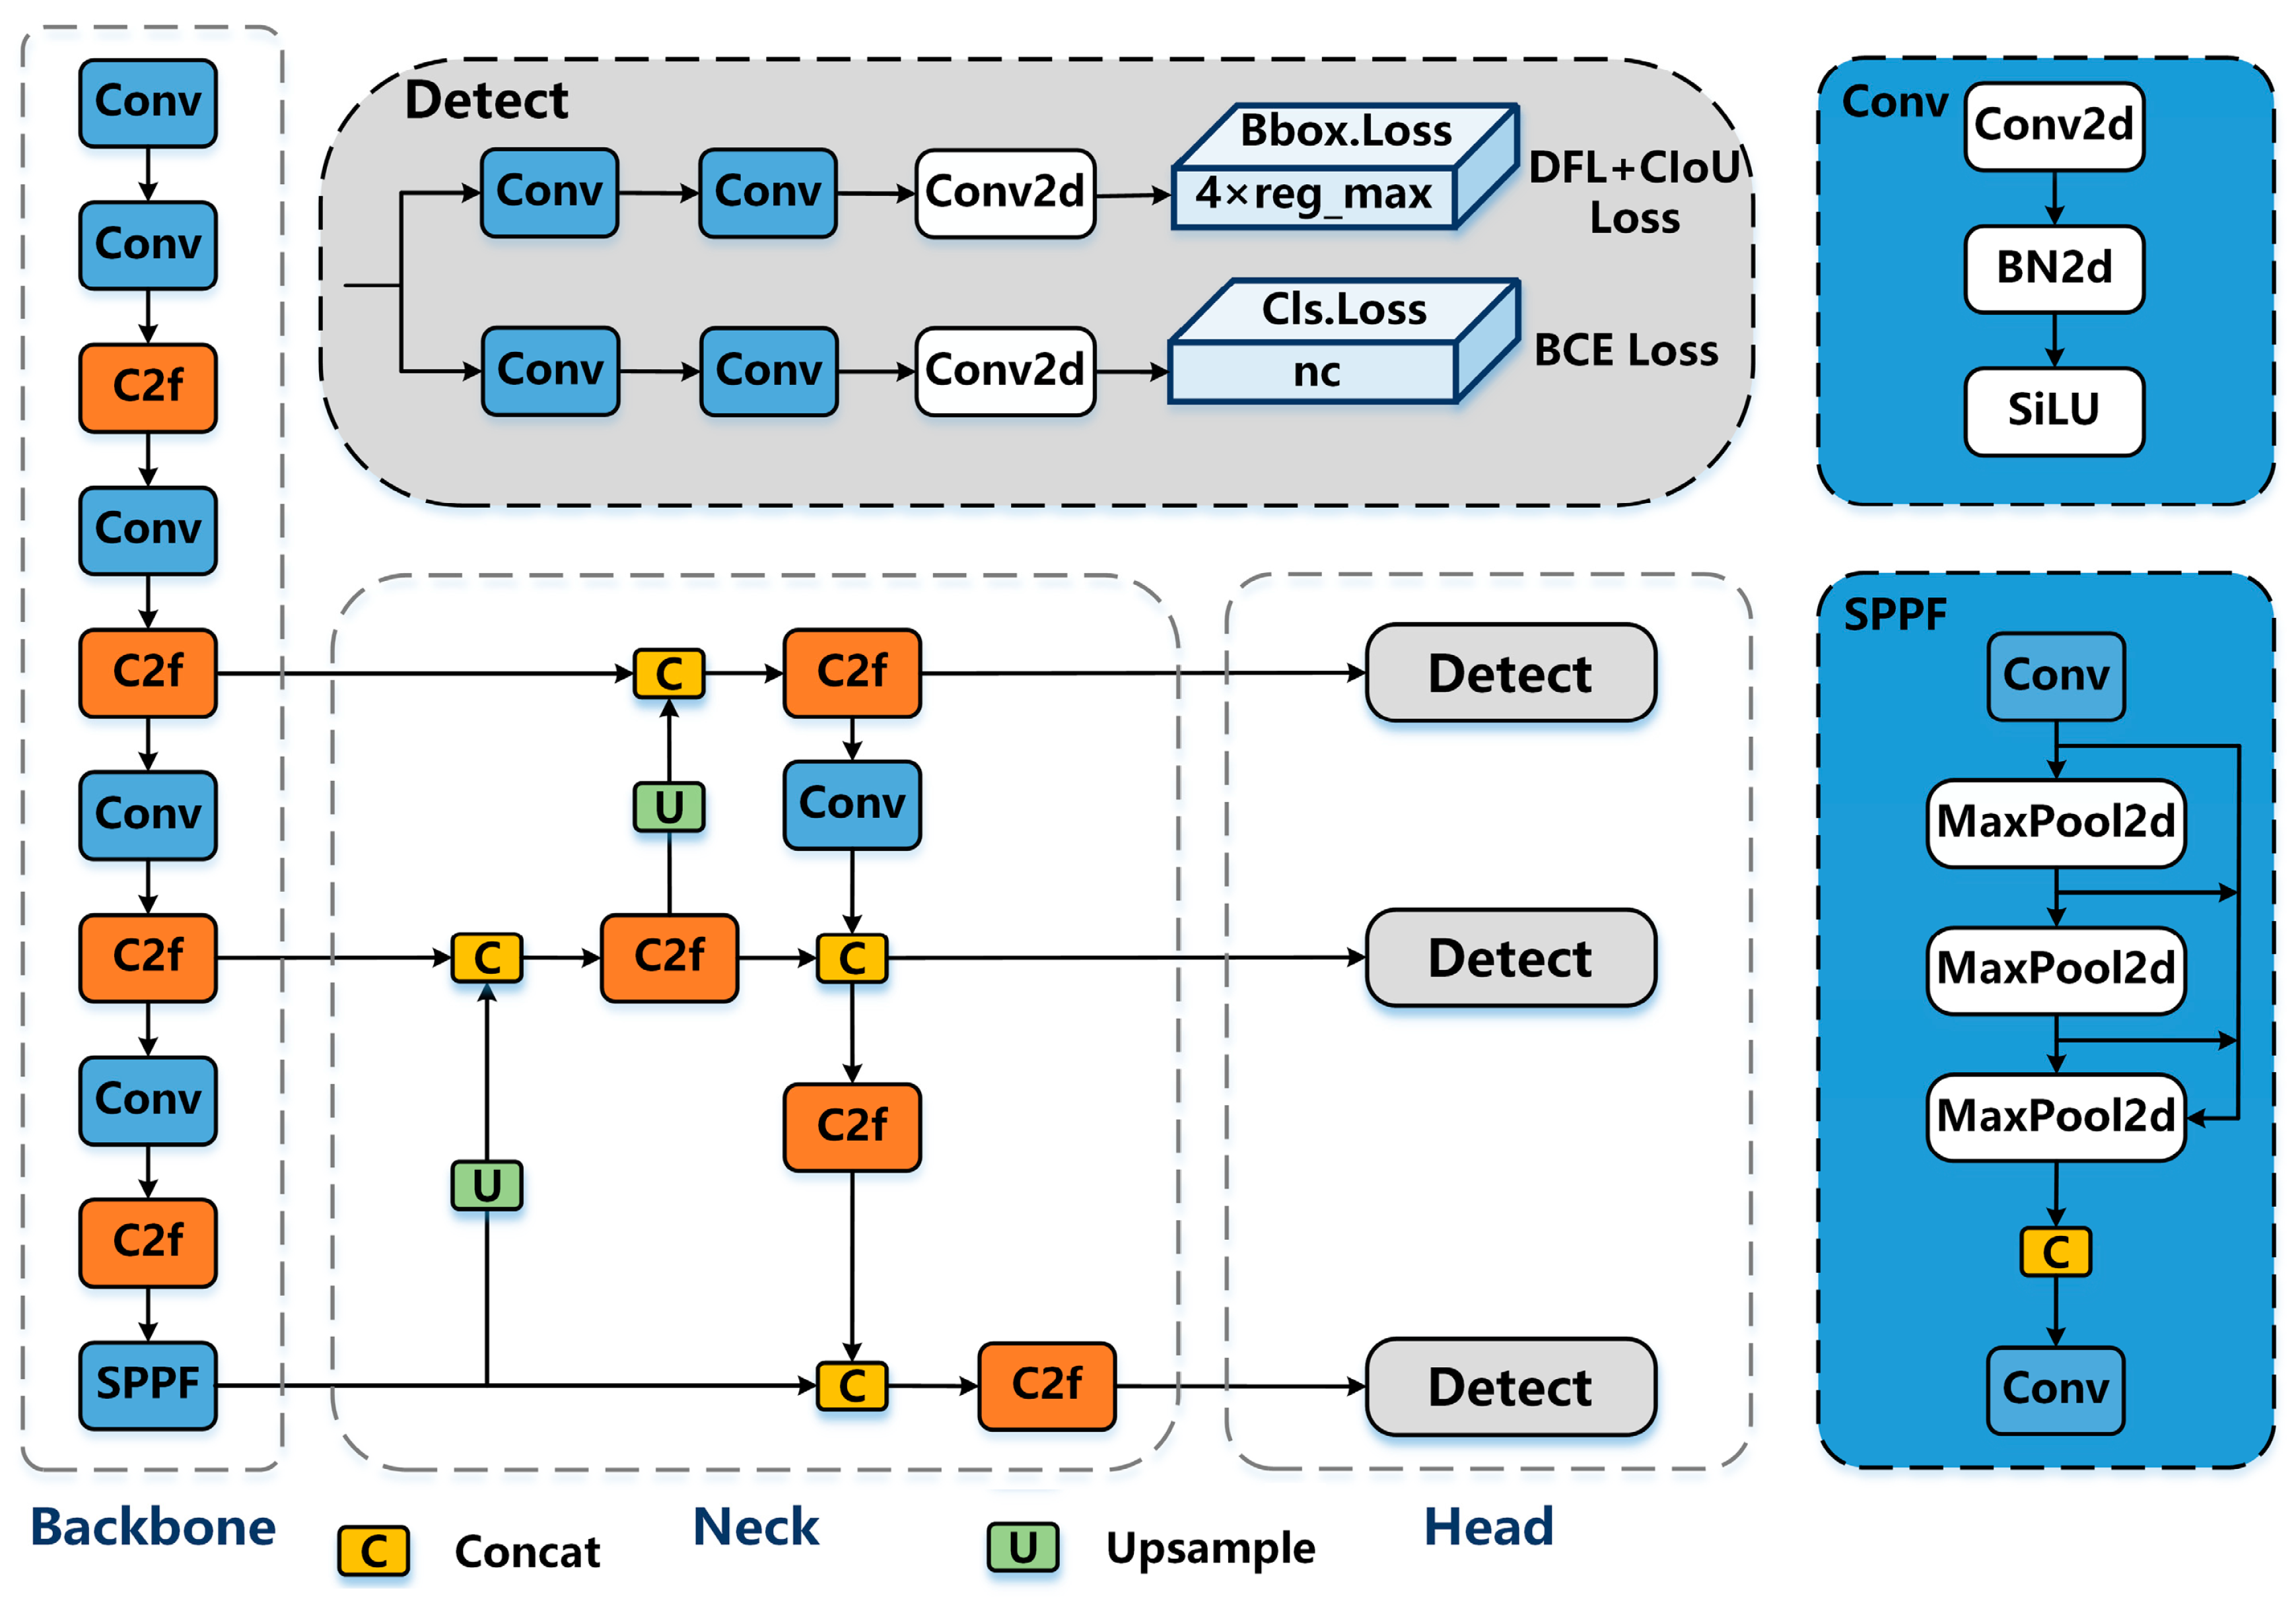
Figure 4.
Per-class radar plots showing segmentation performance for (a) Healthy leaves, (b) Moko, and (c) Black Sigatoka. Metrics include precision, recall, mAP@0.5, and mAP@0.5:0.95, facilitating a comparative analysis of different YOLOv8 configurations for each disease class.
Figure 4.
Per-class radar plots showing segmentation performance for (a) Healthy leaves, (b) Moko, and (c) Black Sigatoka. Metrics include precision, recall, mAP@0.5, and mAP@0.5:0.95, facilitating a comparative analysis of different YOLOv8 configurations for each disease class.
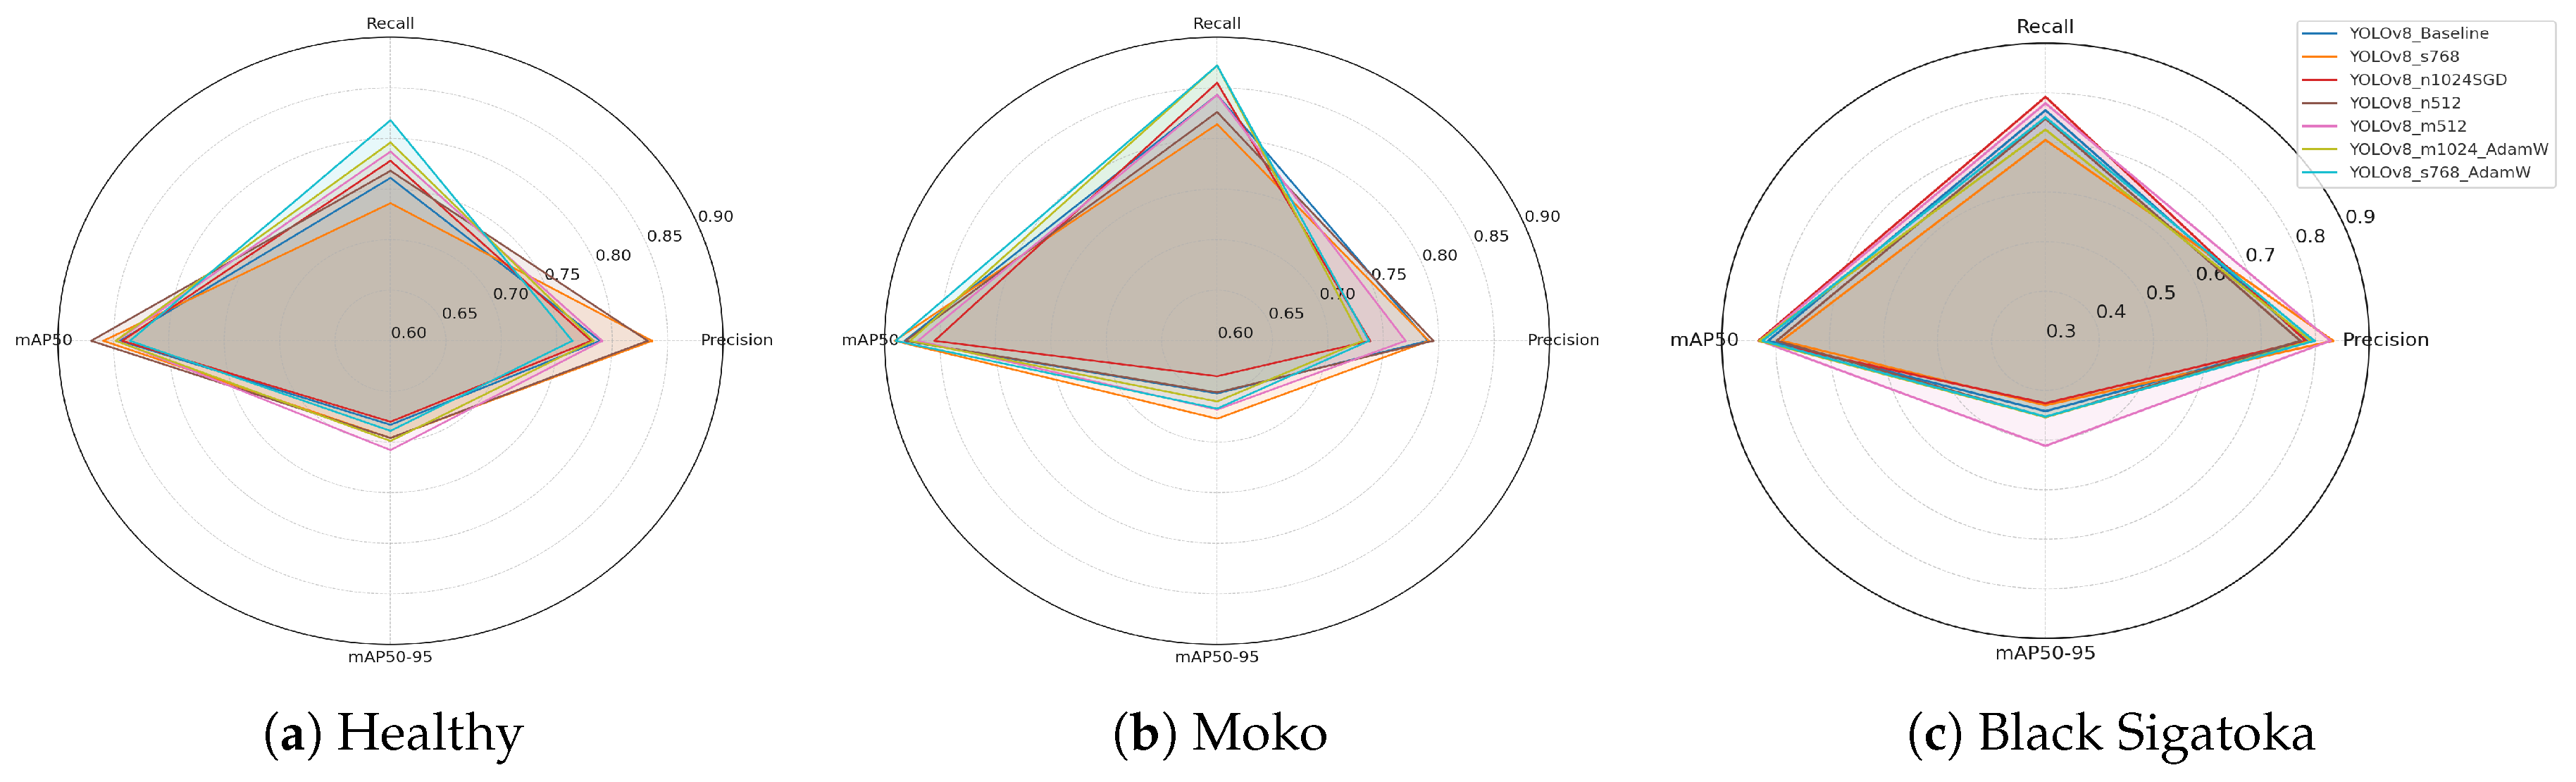
Figure 5.
Training mAP progression curves for all YOLOv8 configurations. (a) Mean mAP@0.5 curve illustrating general object detection accuracy across epochs. (b) Mean mAP@0.5:0.95 curve highlighting stricter detection performance evaluation with varying IoU thresholds.
Figure 5.
Training mAP progression curves for all YOLOv8 configurations. (a) Mean mAP@0.5 curve illustrating general object detection accuracy across epochs. (b) Mean mAP@0.5:0.95 curve highlighting stricter detection performance evaluation with varying IoU thresholds.
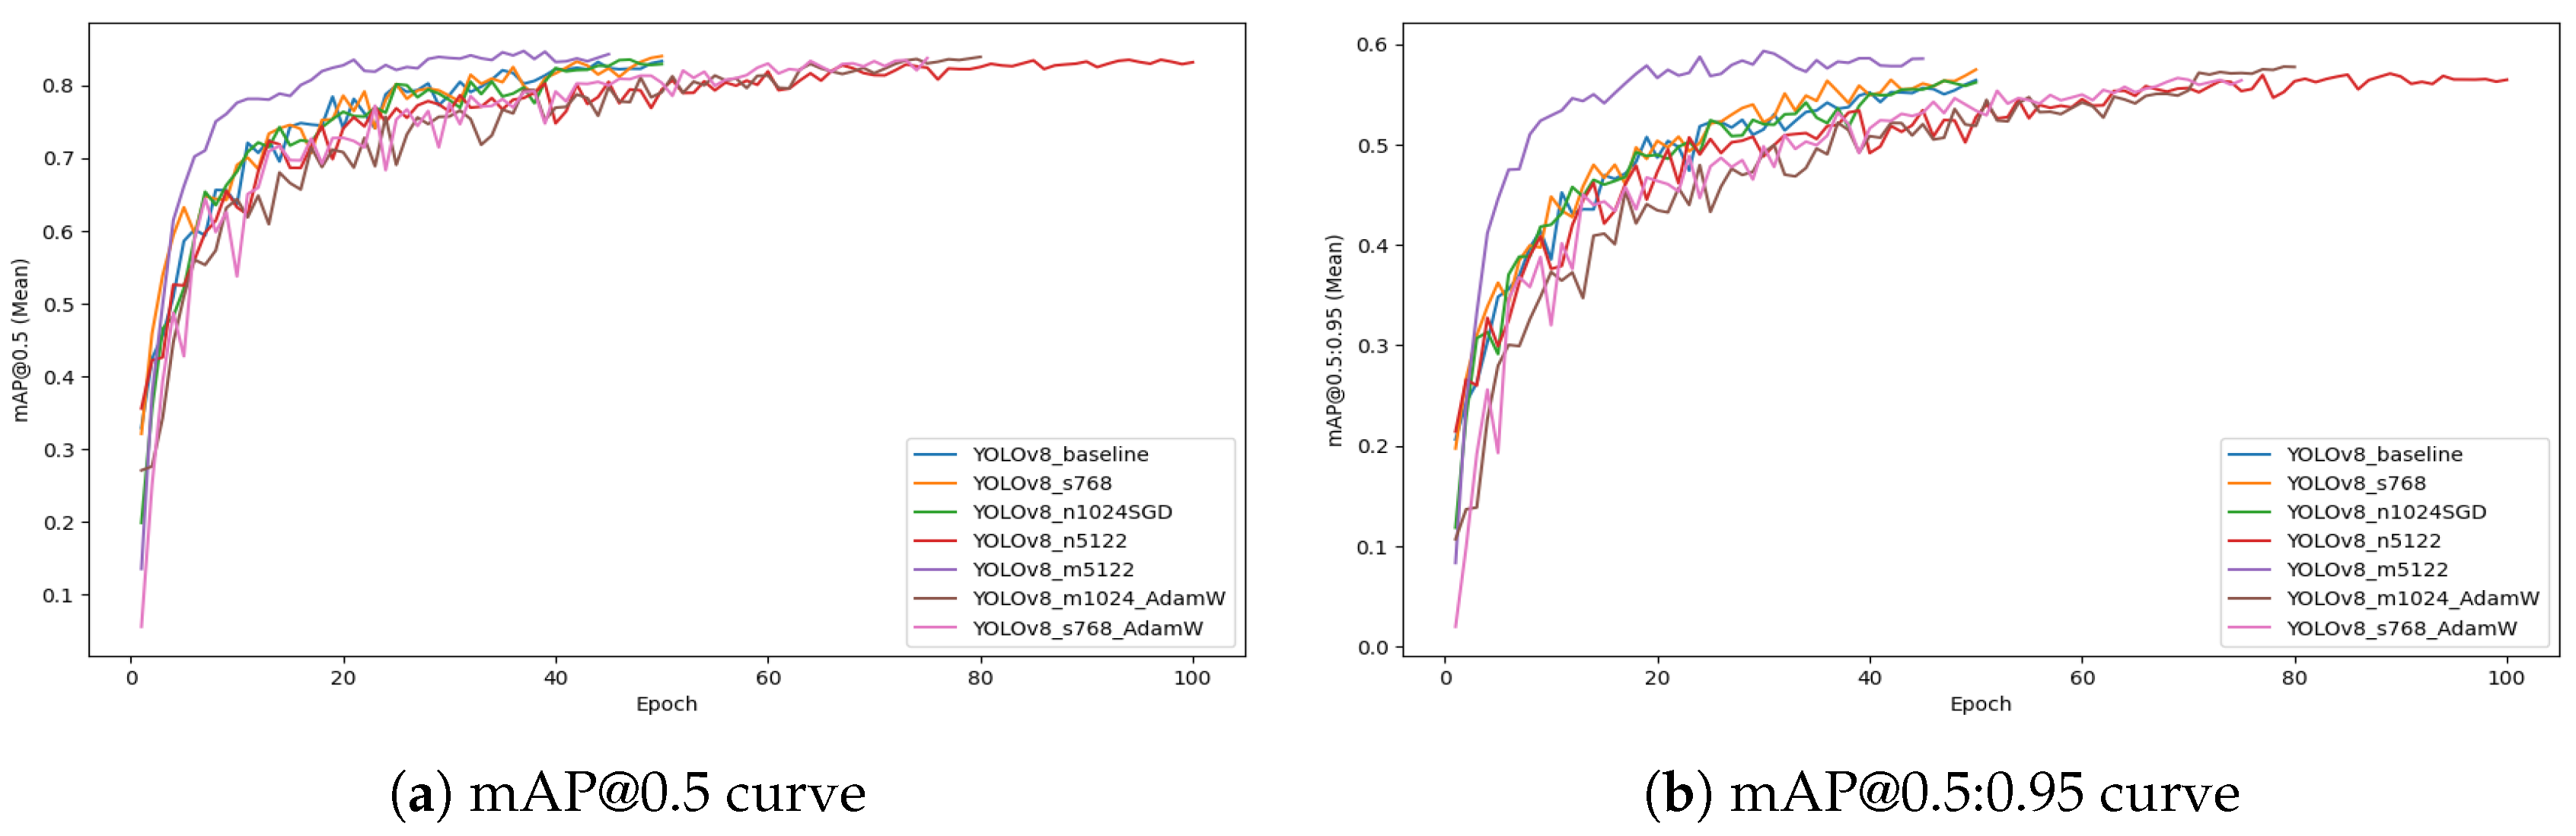
Figure 6.
Training loss curves for all YOLOv8 configurations. (a) Box loss curves showing bounding box regression convergence. (b) Segmentation loss curves illustrating improvement in mask generation accuracy throughout training.
Figure 6.
Training loss curves for all YOLOv8 configurations. (a) Box loss curves showing bounding box regression convergence. (b) Segmentation loss curves illustrating improvement in mask generation accuracy throughout training.
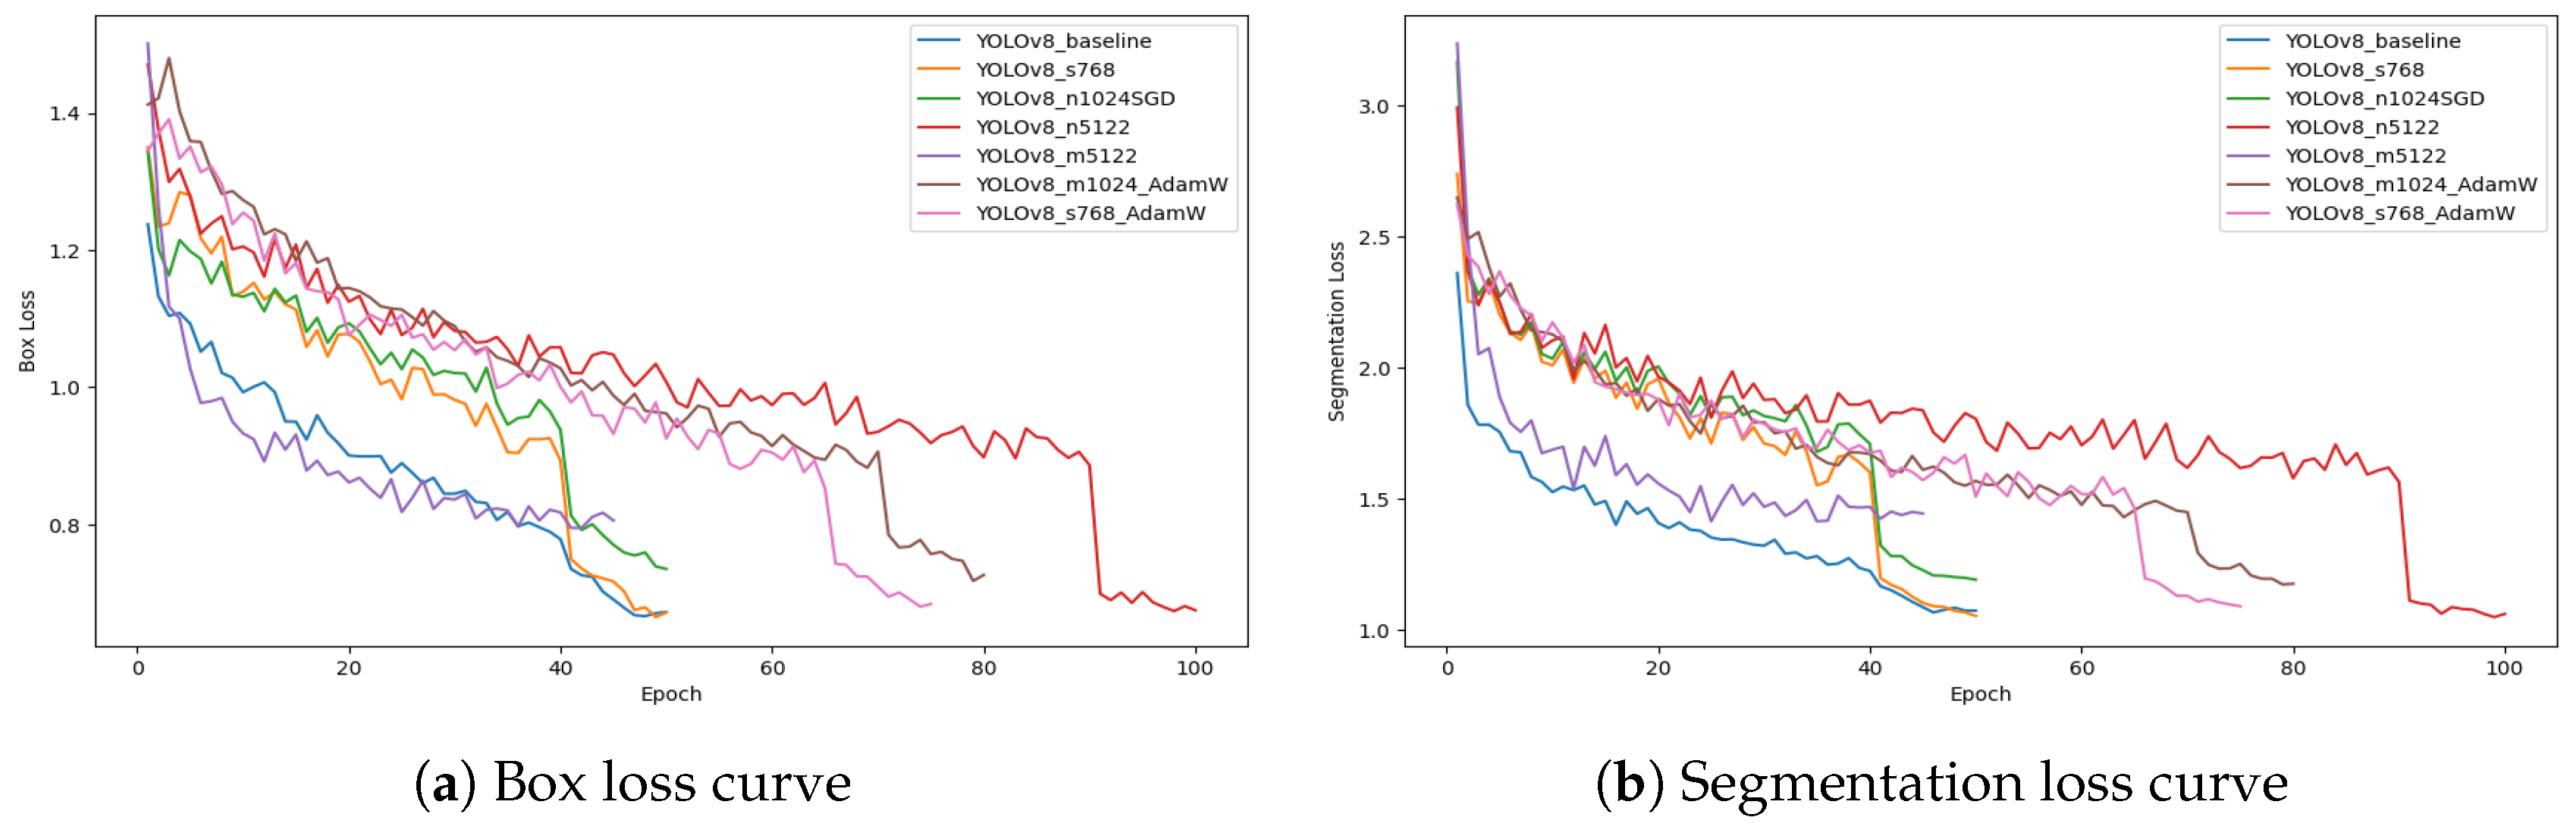
Figure 7.
Trade-off between segmentation accuracy and inference speed for different YOLOv8 configurations. The horizontal axis shows inference time per image (ms), and the vertical axis shows mAP@0.5:0.95. Circle sizes represent model sizes (MB), highlighting computational and performance trade-offs among configurations.
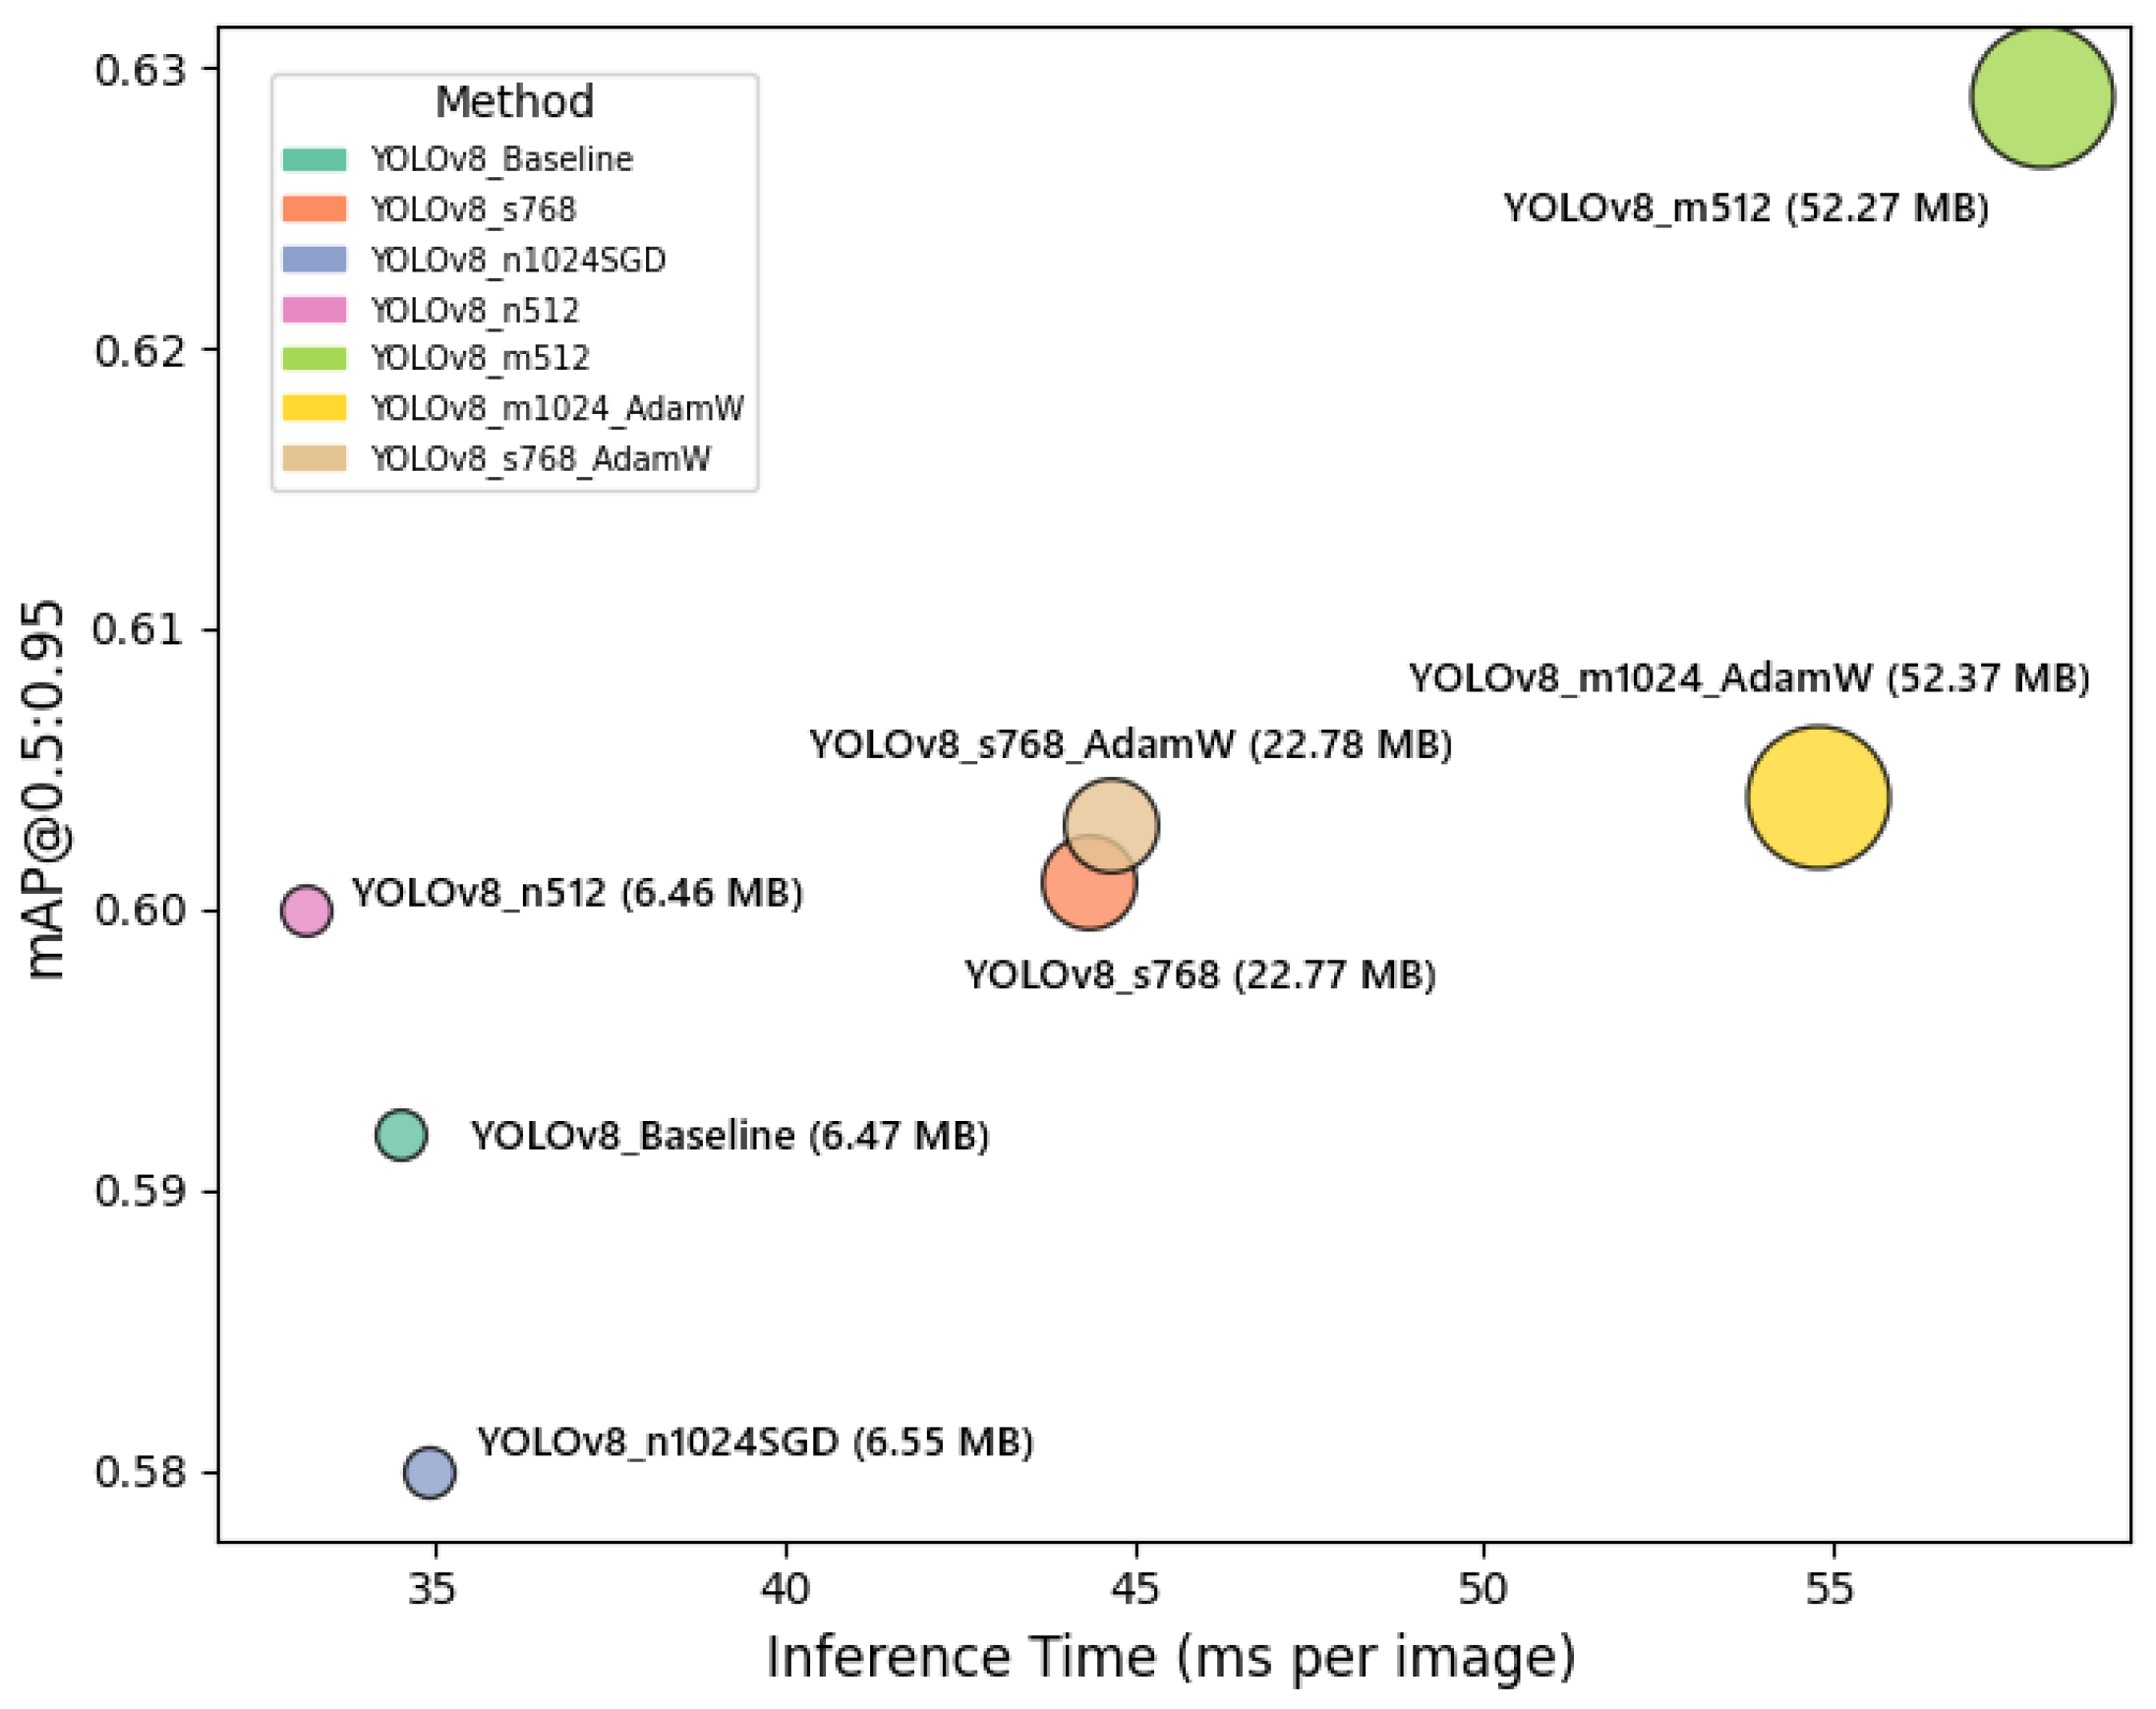
Figure 8.
Qualitative segmentation results from the YOLOv8_m512 configuration on UAV images. Red contours delineate leaf boundaries, with class names and confidence scores annotated. Examples include healthy leaves, Moko, and Black Sigatoka symptoms.
Figure 8.
Qualitative segmentation results from the YOLOv8_m512 configuration on UAV images. Red contours delineate leaf boundaries, with class names and confidence scores annotated. Examples include healthy leaves, Moko, and Black Sigatoka symptoms.
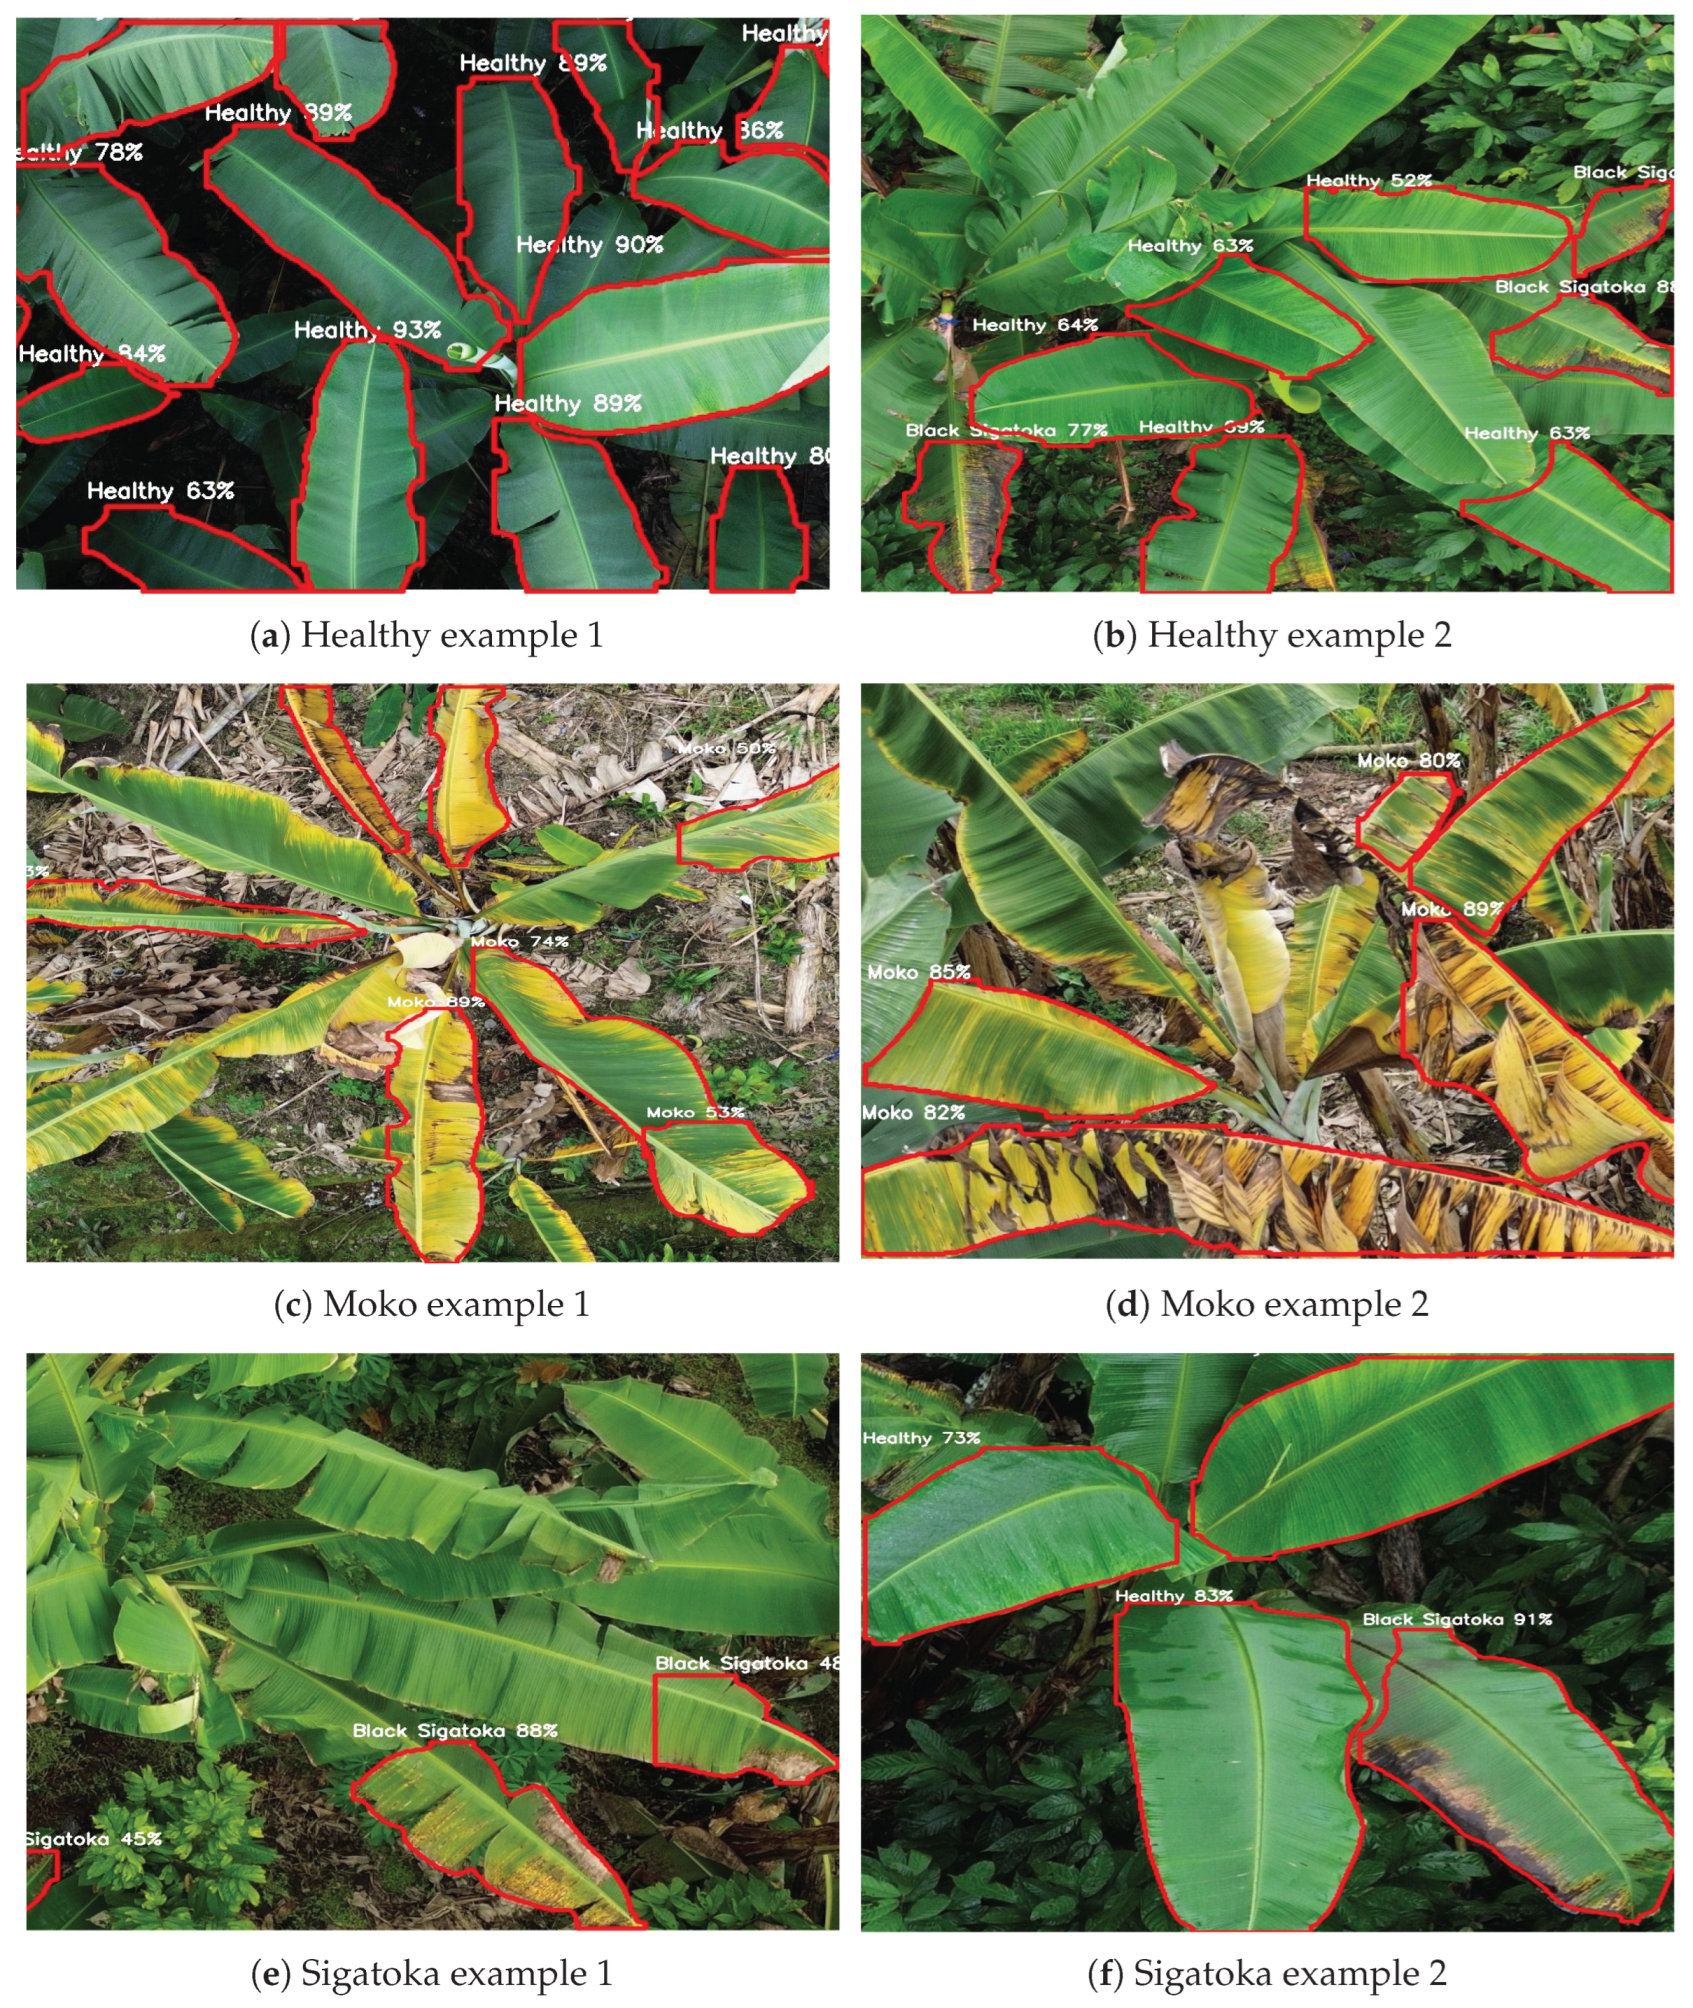

Table 1.
Summary of YOLOv8 configurations.
| Method | Img Size | Epochs | Batch | lr0 | Optimizer |
|---|---|---|---|---|---|
| YOLOv8_Baseline | 640 | 50 | 8 | – | Default |
| YOLOv8_s768 | 768 | 50 | 4 | 0.005 | Default |
| YOLOv8_n1024SGD | 1024 | 50 | 4 | 0.01 | SGD |
| YOLOv8_n512 | 512 | 100 | 8 | 0.005 | Default |
| YOLOv8_m512 | 512 | 75 | 8 | 0.002 | SGD + Momentum 0.937 |
| YOLOv8_s768_AdamW | 768 | 75 | 4 | 0.003 | AdamW + WD=0.0002 |
| YOLOv8_m1024_AdamW | 1024 | 80 | 2 | 0.002 | AdamW + WD=0.0001 |
Table 2.
Detailed description of each YOLOv8 configuration.
| Method | Description |
|---|---|
| YOLOv8_Baseline | Baseline configuration using default YOLOv8 parameters with medium resolution (640×640), 50 epochs, and standard optimizer. Serves as reference for performance comparison. |
| YOLOv8_s768 | Small model variant with higher resolution (768×768), reduced batch size, and increased learning rate to improve fine leaf detail detection. |
| YOLOv8_n1024SGD | Nano backbone at very high resolution (1024×1024), optimized with SGD to evaluate the impact of aggressive learning on disease boundary refinement. |
| YOLOv8_n512 | Nano backbone with extended training epochs (100), medium resolution (512×512), designed to assess long training impact on convergence stability. |
| YOLOv8_m512 | Medium backbone with momentum-enhanced SGD optimization and medium resolution, intended to improve balance between segmentation accuracy and training efficiency. |
| YOLOv8_s768_AdamW | Small backbone model at high resolution (768×768), using AdamW optimizer with weight decay regularization to enhance generalization and reduce overfitting. |
| YOLOv8_m1024_AdamW | Medium backbone architecture with very high resolution (1024×1024), fine-tuned using AdamW optimizer and reduced batch size, designed to maximize segmentation precision in complex field conditions. |
Table 3.
Global performance metrics, model size, and inference time for each YOLOv8 configuration.
| Method | Precision | mAP@0.5 | mAP@0.5:0.95 | Size (MB) | Inf. Time (ms) |
|---|---|---|---|---|---|
| YOLOv8_Baseline | 0.788 | 0.847 | 0.592 | 6.47 | 34.49 |
| YOLOv8_s768 | 0.820 | 0.846 | 0.601 | 22.77 | 44.36 |
| YOLOv8_n1024SGD | 0.767 | 0.843 | 0.580 | 6.55 | 34.92 |
| YOLOv8_n512 | 0.800 | 0.850 | 0.600 | 6.46 | 33.13 |
| YOLOv8_m512 | 0.796 | 0.849 | 0.629 | 52.27 | 58.00 |
| YOLOv8_m1024_AdamW | 0.768 | 0.852 | 0.604 | 52.37 | 54.78 |
| YOLOv8_s768_AdamW | 0.766 | 0.850 | 0.603 | 22.78 | 44.65 |
Disclaimer/Publisher’s Note: The statements, opinions and data contained in all publications are solely those of the individual author(s) and contributor(s) and not of MDPI and/or the editor(s). MDPI and/or the editor(s) disclaim responsibility for any injury to people or property resulting from any ideas, methods, instructions or products referred to in the content. |
© 2025 by the authors. Licensee MDPI, Basel, Switzerland. This article is an open access article distributed under the terms and conditions of the Creative Commons Attribution (CC BY) license (http://creativecommons.org/licenses/by/4.0/).
Copyright: This open access article is published under a Creative Commons CC BY 4.0 license, which permit the free download, distribution, and reuse, provided that the author and preprint are cited in any reuse.


