
Submitted:
04 June 2025
Posted:
05 June 2025
Read the latest preprint version here
Abstract
Green hydrogen is increasingly viewed as a cornerstone of global decarbonization, yet its economic viability varies widely across national contexts. This study presents an integrated modeling framework that combines high-resolution spatial resource mapping, deterministic techno-economic forecasting, Monte Carlo simulation, and interpretable machine learning to assess green hydrogen development prospects in Costa Rica and the United Kingdom. The framework synthesizes established tools—Random Forest, XGBoost, and LightGBM—to forecast Levelized Cost of Hydrogen (LCOH) and Net Present Value (NPV) under policy and resource uncertainty.Model results show that in Costa Rica, 3 MW pilot-scale systems using Solid Oxide Electrolysis Cells (SOEC) reach LCOH values of $8.81/kg in 2025 and NPVs of up to +$3 million over 20 years. In contrast, 50 MW UK projects achieve LCOH as low as $2.07/kg by 2050, with SOEC configurations yielding NPVs exceeding +$895 million. SHAP-based sensitivity analysis highlights electricity price, CAPEX, and capacity factor as dominant cost drivers in both contexts.By providing a transferable, explainable scenario analysis tool, this study supports strategic planning and policy design in countries with divergent infrastructure maturity and development goals. It also identifies opportunities for bilateral cooperation, such as UK-supported offshore wind–hydrogen hubs in Costa Rica. The integrated framework offers a replicable pathway for evaluating green hydrogen investments and informing context-sensitive policy instruments under deep uncertainty.
Keywords:
Green Hydrogen
; Techno-Economic Modeling
; Machine Learning
; Policy Forecasting
; Costa Rica
; United Kingdom
1. Introduction
Green hydrogen is increasingly recognized as a cornerstone of global decarbonization efforts, with the potential to mitigate up to 80 gigatons of CO2 emissions by mid-century while supporting energy demand in sectors that are difficult to electrify, such as heavy industry, aviation, and long-duration storage (Hydrogen Council & McKinsey, 2021). Forecasts indicate that the global hydrogen market could exceed 660 million metric tons annually by 2050, driven by ambitious policy initiatives and the expansion of renewable energy systems. However, this momentum brings considerable uncertainties, including volatile cost projections, substantial infrastructure requirements, and the challenge of equitable deployment across diverse geopolitical contexts. While industrialized nations such as China, Germany, and Japan are advancing rapidly in hydrogen development, countries in the Global South face systemic barriers to aligning hydrogen deployment with broader goals of socio-economic growth and climate equity (NewClimate Institute, 2023). Despite a growing body of techno-economic research, very few studies integrate machine learning, stochastic simulation, and high-resolution spatial resource mapping to forecast hydrogen production costs under future policy and infrastructure uncertainty. Even fewer do so comparatively across countries with highly divergent grid systems, project scales, and development priorities. This study addresses that gap by linking three modeling domains—deterministic finance, Monte Carlo simulation, and machine learning—in a two-country analysis of Costa Rica and the United Kingdom.
The UK, for instance, considers hydrogen as a versatile tool to realize its decarbonization agenda, with aspirations of attaining up to 10 GW of low-carbon hydrogen production capacity by 2030 and up to 460 TWh demand by 2050, supported by mechanisms like the Hydrogen Business Model and the Low Carbon Hydrogen Standard (Royal Academy of Engineering, 2022). Costa Rica, by contrast, leverages nearly 100% renewable electricity and focuses on hydrogen deployment in transportation and agriculture, with cost estimates between $3.4–5.1/kg depending on the power source (Stamm et al., 2024). These contrasting national contexts—policy-driven industrial scaling versus sustainability-centered pilot deployment—offer an ideal platform to explore how technology performance, cost trajectories, and policy frameworks interact under different constraints.
Recent developments highlight Costa Rica’s emerging role in global green hydrogen investment. In April 2025, a €25 million initiative supported by the Mitigation Action Facility and GIZ was approved to finance hydrogen infrastructure, regulatory reform, and industrial pilots (GIZ-MAF, 2025). Simultaneously, the UK Embassy in San José announced strategic partnerships positioning Costa Rica as a regional hub for UK-led renewable energy and infrastructure projects (UK Embassy San José, 2024). This study provides timely spatial and economic modeling that can inform such initiatives by identifying viable production zones, technology trade-offs, and investment conditions.
The issues which are related to the technical, policy and economic feasibility of implementing hydrogen systems have been discussed in several theories. Deloitte (2023) and Taghizadeh-Hesary et al. (2022) also apply LCOH and NPV to analyze the costs of hydrogen production depending on the conditions, the impact of changing CAPEX, electricity prices, and financing options. Similarly, research in the field of machine learning is useful for proving the effectiveness in the field of forecasting and operations. For example, Mukelabai et al. (2024) use ML for boosting the performance forecasts and the component model for renewable hydrogen systems, also, Ukwuoma et al. (2024) explicate the advantage and use of the hybrid ensemble models for biomass-based hydrogen production to advance the prediction and explicability. These contributions show the capabilities of using ML to increase the key system parameters, whereby the system is better suited to complement variable renewable sources and decrease the LCOH through the fine-tuning of the system parameters. However, there is a lack of comparable research on ML-based models of projecting LCOH and NPV in countries with different resource potential and the level of infrastructure development. However, most of the hydrogeographical datasets for hydrogen economics are limited and confined to certain regions thus restricting the applicability of the existing stylized frameworks. For instance, some models of solar irradiance have been developed and applied in specific areas such as the case in India but none have been implemented in larger production of hydrogen to tackle the problem of intermittency (Sareen et al., 2024). Yet most of these models remain isolated by country, scale, or method, limiting their generalizability to different deployment environments.
This paper contributes to the literature by combining well-established modeling techniques into a unified framework for comparative hydrogen policy analysis across highly divergent national contexts. While prior work explores techno-economic modeling or ML-based hydrogen forecasting, few studies bridge both, and fewer still assess cross-country dynamics with implications for equitable energy planning. The integrated framework enables region-specific scenario planning while preserving transparency in cost and policy sensitivities, particularly relevant for emerging markets like Costa Rica.
Machine learning remarkably improves various green hydrogen production processes, especially those involving Solid Oxide Electrolysis Cells (SOECs). Decision trees, gradient boosting algorithms like XGBoost, Random forest and deep neural network (DNN) are used to forecast KPIs such as hydrogen production rates, current density and Ohmic resistance. Surprisingly, the XGBoost model has been proved to be accurate with the R2 values greater than 0.95 for hydrogen production rates along with other important outputs. GA is then incorporated to improve input features so that higher hydrogen yields coupled with lower energy demands can be achieved. Moreover, the enhancement of machine learning algorithms increases cost-effectiveness since it optimizes parameters that define the Levelized Cost of Hydrogen (LCOH). This makes it possible to control factors like temperature, voltage, and the rate of gas flow that are very important when dealing with renewable energy sources like solar and wind power as indicated by Yang et al. (2025). These contributions illustrate the role of ML in individual systems, but do not compare its accuracy or policy relevance across nations with fundamentally different grid economics and infrastructure maturity.
The potential for renewable power generation, particularly wind, solar, and hydropower in Latin America provides a favorable factor for green hydrogen production. Chile, Argentina, and Uruguay are some of the countries most likely to assume the role of exporters because those countries provide cheap clean power to produce hydrogen through electrolysis. However, they face a number of challenges such as limited infrastructure, high costs of production, and fragmented regulatory frameworks that inhibit green hydrogen development in these countries. In this regard, specialists recommend increasing the level of cooperation with foreign partners, increasing investments in infrastructure and establishing effective certification systems that would help the market to develop (Torma et al., 2024). Furthermore, the established hydrogen policies within the region must embrace social equity and fairness on environmental impacts so that the generated development impacts will be accessible and support a just transition (Dorn, 2022). In the view of Gischler et al. (2023) regional cooperation, and the public–private sector partnership will be critical for the region in achieving sustainable and socially responsible green hydrogen development to enhance its chance of emerging as a global player in this innovative and important sector.
This study applies a cross-national decision-support framework that integrates established methods—spatial resource mapping, deterministic forecasting, Monte Carlo simulation, and supervised learning—to evaluate green hydrogen feasibility in Costa Rica and the United Kingdom. The contribution is not in core model innovation, but in synthesizing these techniques within a comparative energy policy framework. The analysis explores how techno-economic uncertainty and policy instruments interact across two development contexts with divergent infrastructure maturity and governance models. The analysis focuses on long-term investment feasibility rather than short-term operational dispatch, leveraging high-resolution wind and solar data to inform region-specific cost ranges. A deterministic LCOH and NPV model—augmented with 1,000-draw Monte Carlo simulations—supports scenario-based projections through 2050. Latin Hypercube Sampling feeds supervised learning models (Random Forest, XGBoost, LightGBM) to accelerate scenario analysis, interpret cost drivers, and benchmark predictability across regions. The framework identifies trade-offs and convergence points across deterministic, stochastic, and surrogate modeling domains.
By addressing the interplay between resource quality, policy incentives, and capital cost uncertainty, the study contributes to strategic hydrogen planning under deep uncertainty. While it does not simulate real-time dynamics or introduce physical modeling innovations, it offers a replicable template for policy-centric techno-economic evaluation, especially useful in Global South contexts.
By answering these questions, the study positions green hydrogen not only as a climate mitigation tool, but also as a pathway for equitable, economically resilient energy transitions. While the framework does not model dynamic plant operations or real-time dispatch, it provides a robust basis for long-term cost forecasting, scenario analysis, and policy design across countries with contrasting development priorities. The remainder of the paper is organized as follows: Section 2 reviews relevant literature; Section 3 details the methodological framework; Section 4 presents LCOH and NPV findings; Section 5 introduces machine learning models and sensitivity testing; and Section 6 offers a comparative discussion, identifies limitations, and outlines future directions.
2. Literature Review
2.1. The Role of Green Hydrogen in Global Decarbonization
Green hydrogen is essential for decarbonizing sectors like heavy industry, transport, and flexible power. In Thailand, it could meet 12.2% of energy demand by 2050 with sufficient investment in electrolysers and renewables (Pradhan et al., 2024). Globally, demand is expected to grow fifteenfold, with the EU alone requiring 1,300 GW of electrolyser capacity (Tarvydas, 2022). It also supports long-duration storage and grid stabilization in renewable-heavy systems.
However, deployment is constrained by high costs and infrastructure gaps. Criticism of blue hydrogen’s climate impact has increased interest in rigorous life-cycle standards such as ISO 19870 and independent verification (Tatarenko et al., 2024). Public acceptance is also vital—trust-based communication outperforms consultation alone (Buchner et al., 2025).
Despite a growing global pipeline, especially in China, many low-emission projects remain unrealized. Progress requires integrated action across policy, infrastructure, and demand—particularly in Latin America (IEA, 2024a). Advanced economies are advancing: the EU’s hydrogen auctions, the U.S. Inflation Reduction Act, and national strategies in the UK, Australia, and Argentina help close the cost gap with fossil fuels (Bird & Bird LLP et al., 2024). The UK focuses on industrial clusters, while Costa Rica is piloting decentralized systems adapted to local renewables.
High-resolution solar and wind mapping now underpins regional hydrogen planning by identifying cost-effective electrolysis zones and guiding system design (Tatarewicz et al., 2023). This spatial data is crucial for tailoring strategies in countries like Costa Rica and the UK, where renewable potential is unevenly distributed.
These trends underscore the need for comparative, techno-economic evidence to guide hydrogen investment across diverse national contexts—a gap this study aims to fill.
2.2. Overview of Electrolysis Technologies (PEM, Alkaline, SOEC)
Green-hydrogen economics hinges on four main electrolysis routes, each balancing efficiency, capital cost, and grid flexibility. Alkaline electrolysis (AEC) is the work-horse option—60–80% efficient at 65–100 °C and the lowest CAPEX (≈ US $1,080–1,296 kW−1) but slow to track variable renewables (El-Shafie 2023). Proton-exchange-membrane (PEM) stacks deliver 99.999%-pure H2 and rapid ramping, ideal for wind- or hydro-linked systems, yet rely on scarce Ir/Pt catalysts that push CAPEX to $2,009–2,506 kW−1.Solid-oxide electrolysis (SOEC) operates at 700–1,000 °C, exploiting waste-heat streams to hit up to 97.6% (HHV) and just 2.5–3.5 kWh Nm−3 electricity use, yet thermal-cycling degradation still curbs commercial rollout (Norman et al. 2024). Off-grid trials of PEM in Europe and Australia—including unitised regenerative fuel cells—underscore their field readiness for flexible renewables (Borm & Harrison 2021).
2.3. Techno-Economic Landscape of Green Hydrogen
Green hydrogen costs depend on electrolyzer type, renewable inputs, and local conditions. This section synthesizes global case studies to assess production pathways and their context-sensitive feasibility.
High-efficiency solid oxide electrolysis (SOEC) systems can reach 97.6% efficiency but are limited by high CAPEX and thermal instability. In South Korea, scaling SOEC from 20 kW to 2 MW cut LCOH to $5.87/kg (Bui et al., 2023). In contrast, proton exchange membrane (PEM) and alkaline electrolysis (AEC) are more modular and affordable. PEM excels in variable-grid settings, with LCOH as low as $2.94/kg and CAPEX near $600/kW (Naqvi et al., 2024).
Costs vary widely by location and scale. Brazil’s 100 MW hybrid system achieved LCOH of $5.29/kg (AEC) and $5.92/kg (PEM), with AEC yielding an IRR close to 29% under $7/kg pricing (Pinheiro et al., 2025). In Finland, flexible PEM systems switching to grid exports reached LCOH of $0.65–$2.16/kg, emphasizing operational adaptability (Javanshir et al., 2024). Colombia’s renewable-powered systems showed LCOH of $7.02–$9.69/kg, with offshore wind deemed unviable due to poor load factors (Velasquez-Jaramillo et al., 2024).
Solar systems tend to be costlier. In Australia, a PEM system had an LCOH of $6.36/kg, with 80% of costs from CAPEX and heavy reliance on subsidies (Rezaei et al., 2024). In Spain, electricity comprised 70%+ of LCOH ($3.47–$4.43/kg), and public grants >30% improved viability (Matute et al., 2023b). A European review reported average costs of $5.02/kg and best-case $2.50/kg, with every 1% system scale-up reducing LCOH by 0.20% (Weißensteiner, 2025).
Hybrid and off-grid setups show both promise and challenges. In Brazil, AEC for public transport yielded LCOH of $25–56/MWh and NPV of $21.8 million, aided by co-product revenues (Alcantara et al., 2025). In South Africa, solar-based hydrogen cost $2.12/kg, but storage reached 918 ZAR/kg (Lebepe et al., 2025). Chilean hydrogen exports to Europe ranged from $3.37–$4.77/kg, while isolated storage added $0.25/kg (Aldren et al., 2025). In Indonesia, LCOH spanned $0.48–$82/kg due to geographic and infrastructure differences. A 20% rise in component costs could raise LCOH by 30% (Prasetyo et al., 2025).
A sensitivity analysis by Baral & Šebo (2024) showed hybrid solar–wind–ORC systems reaching $3.1/kg, potentially falling to $1.46/kg by 2050. CAPEX and capacity factor were the dominant variables, with OPEX having minimal impact.
Overall, these cases affirm the need to match technology with local conditions and support the use of flexible, ML-enhanced modeling frameworks—such as the one in this study—for better forecasting, risk reduction, and policy design.
2.4. Comparative Context: UK and Costa Rica
2.4.1. Renewable Energy Profiles of the UK and Costa Rica
Costa Rica generates approximately 99% of its electricity from renewable sources—primarily hydroelectric (74%), followed by geothermal (13%), wind (11%), and solar (1%). This energy mix ensures a stable, year-round supply from flexible and dispatchable resources. From 2016 to 2021, renewable integration increased significantly, raising the country’s energy self-sufficiency to 54%. Such conditions position Costa Rica favorably for green hydrogen production, particularly through off-peak hydro and wind utilization, although regional grid balancing and demand-matching remain key challenges (IRENA, 2024).
In contrast, the United Kingdom achieved 50.5% renewable electricity generation in Q3 2024, driven largely by wind (especially offshore and in Scotland), along with solar and biomass. The UK’s decarbonizing grid—supported by expanded interconnector capacity and declining fossil-based generation—offers considerable promise for hydrogen production from renewable surpluses. Nonetheless, scaling hydrogen output will depend on reinforcing offshore wind infrastructure, enhancing storage capacity, and deploying more agile grid management systems (DESNZ, 2024a).
2.5. National Hydrogen Strategies and Targets
Costa Rica’s 2023 National Green Hydrogen Strategy targets 18–20 kilotonnes of hydrogen demand by 2030 and 420 kilotonnes by 2050, supported by 0.2–1 GW of electrolysis capacity and LCOH projections as low as $1.24/kg, especially from wind energy (Stamm et al., 2024). The focus is on domestic use due to high electricity costs and limited export infrastructure. Key partnerships include Ad Astra Rocket and Cavendish S.A., with backing from GIZ and IADB. Political instability, however, threatens long-term planning. The Ad Astra Hydrogen Transportation Ecosystem pilot integrates solar and wind with PEM electrolysis to test leasing and off-take models in Guanacaste (Ad Astra, 2024).
The UK Hydrogen Strategy, launched in 2021 and updated in 2024, aims to deliver 10 GW of low-carbon hydrogen by 2030, producing up to 64 TWh annually via green and blue projects. Policy tools include the Net Zero Hydrogen Fund and Low Carbon Hydrogen Standard, supporting deployment in transport, industry, and power (UK Government, 2021; DESNZ, 2024b). Regional pilots like Orkney’s BIG HIT project aid early adoption. The hydrogen sector is expected to add £7 billion in GVA and 64,000 jobs by 2030, though challenges in coordination, storage, and distribution persist.
2.6. Modeling and Simulation in Green Hydrogen Project Analysis
Green hydrogen development increasingly relies on advanced modeling, simulation, and AI to optimize system design and forecast metrics like LCOH and NPV under uncertainty—core goals of this study. Tools such as CFD, thermodynamic models, and machine learning are essential for integrating renewables.
Computational Fluid Dynamics (CFD) achieves prediction accuracies up to 95% for flow distribution and polarization curves in electrolyzers (Shash et al., 2025). Machine learning (ML), especially tree-based algorithms like Random Forests and Gradient Boosting, outperform traditional regressions in estimating LCOH and NPV, handling complex techno-economic data and enabling real-time optimization across the hydrogen value chain (Allal et al., 2025).
High-fidelity models are also being replaced by reduced-order techniques like neural networks and curve-fitting, reducing computational costs while preserving accuracy. In one microgrid case, these models yielded an LCOH of $10.81/kg with energy use of 64 kWh/kg, aligning with international benchmarks (Criollo et al., 2024).
Together, these simulation and AI tools represent a major shift in hydrogen planning—enhancing precision, scalability, and sustainability (Motiramani et al., 2025).
2.7. Machine Learning and Regression-Based Forecasting in Hydrogen Economics
Machine learning (ML) plays an increasingly critical role in modeling green hydrogen costs. Building on IRENA (2021), which identified CAPEX, electricity price, efficiency, and scale as key LCOH drivers, recent studies apply diverse algorithms to improve forecasting and policy planning.
Kabir et al. (2023) used K-Nearest Neighbors and Random Forest to model hydrogen production, highlighting temperature and voltage as key variables. Kim et al. (2022) applied CART® to nuclear-powered hydrogen, yielding LCOH estimates around $2.77/kg. Bassey and Ibegbulam (2023) emphasized data preprocessing and model explainability, while Devasahayam (2023) showed ML’s utility in hybrid systems. Kwon et al. (2024) developed a deep neural network (R2 = 0.9936) to predict hydrogen demand. Allal et al. (2025) found Random Forest effective in ranking cost drivers, and Alhussan et al. (2023) introduced a hybrid RNN model for solar hydrogen forecasting.
However, comparative benchmarking across ML models in unified techno-economic frameworks remains rare. Most studies test individual models on isolated datasets, limiting generalizability. Our study addresses this by benchmarking Random Forest, XGBoost, and LightGBM on a custom dataset encoding renewable potential, policy incentives, and CAPEX learning for Costa Rica and the UK—offering region-specific insights not previously modeled.
3. Methodology
3.1. Spatial Resource Assessment
This study conducts a spatial analysis of wind and solar energy resources in Costa Rica and the United Kingdom by leveraging geospatial raster datasets and administrative boundary shapefiles. Python (v3.11) was used as the primary analytical platform, employing libraries such as rasterio, geopandas, shapely, and numpy. For each country, high-resolution raster layers representing wind speed or global horizontal irradiance (GHI) were clipped using province- or country-specific polygons to isolate regional resource characteristics.
3.1.1. Zonal Statistics Extraction
To assess solar and wind potential, raster datasets were spatially masked and clipped. The threshold for identifying high-performance zones is set as the 90th percentile value of the dataset (Equation (1)):
- T90: The 90th percentile threshold of the data values.
- X: The vector of valid raster values (e.g., wind speed or solar irradiance) for a given region.
Raster cells with values equal to or exceeding this threshold are defined as part of the top 10% high-performance zone (Equation (2)):
- Xtop10%: Subset of data values representing the top 10%.
- xi: Individual raster values within the dataset X
3.2. Offshore Potential Mapping
To delineate offshore resource zones, a 20 km buffer was generated around each administrative unit (province or national region). The offshore area is defined as the difference between the buffered and the original landmass geometries (Equation (3)):

- Aoffshore: The resulting offshore area geometry.
- Aregion: The original land-based administrative area.
- Buffer(Aregion,20km): Geometric expansion by 20 kilometers.
These areas were rasterized and used to isolate marine wind or solar data for offshore analysis.
3.3. Wind Power Density Estimation
Wind energy potential was quantified by converting wind speed into wind power density using the kinetic energy formula (Equation (4)):
- P: Wind power density (W/m2).
- ρ: Air density (assumed 1.225 kg/m3 at sea level).
- v: Wind speed (m/s).
This equation reflects the theoretical amount of kinetic energy available per square meter and assumes ideal conditions with no turbine losses.
3.4. Solar Irradiance Analysis
Solar resource potential was assessed using GHI datasets. High-performance solar zones were identified by calculating the 90th percentile of GHI values for each region (Equation (5)):
- T90solar: The 90th percentile of GHI values in a given region.
- GHI: Global Horizontal Irradiance values (in kWh/m2/day).
Pixels meeting or exceeding this threshold were classified as part of the top 10% solar performance zone (Equation (6)):
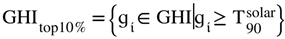
- GHItop10%: Set of high-performing solar pixels.
- gi: Individual irradiance values in the dataset.
3.6. Hydrogen LCOH Modeling
LCOH is estimated dynamically from 2025 to 2050 using 5-year intervals. For each interval t∈ {2025,2030,2035,2040,2045,2050}, the model computes annualized hydrogen production costs incorporating electrolyzer degradation, evolving electricity prices, regional resource quality, and financial assumptions. The analysis is structured as a planning-level techno-economic evaluation and does not simulate operational dispatch or intra-day dynamics.
The model assumes fixed average capacity factors by region, derived from high-resolution wind and solar quality scores. Annualized capacity factors are used to align with the planning-level scope of this analysis; hourly dispatch modeling is beyond the focus of this study. This simplification improves interpretability across policy scenarios, though it omits short-term variability and transient effects, which are more relevant for operational dispatch studies. These limitations are discussed further in Section 6. Dynamic operational control is abstracted to focus on long-term investment feasibility and policy planning.
LCOH is calculated for each year, region, and technology using the following formulation (Equation (7))
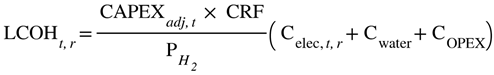 Where:
- CAPEXadj, t: Total system capital expenditure adjusted for policy subsidies
- CRF=
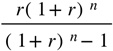 : Capital Recovery Factor, where r is the discount rate and n is the plant lifetime
 - PH2 = Annual hydrogen production [kg/year]
- Celec,t,r=Et⋅Pelec,r: Electricity cost per kg H2, where Et is the electricity consumption [kWh/kg] at time t, and Pelec,r is the electricity price in region r.
- Cwater = Water cost per kg H2
- COPEX = Fixed OPEX per kg H2
Here, t represents each year in the planning horizon (2025–2050), and rrr indexes spatial regions. Et captures electricity demand per kg H2 over time, accounting for voltage degradation. Regional resource quality scores are applied to electricity prices to reflect spatial heterogeneity.
Although Equation 7 presents CAPEX as a single term, it is modeled dynamically as a function of time using technology-specific learning rates: 3% per year for PEM and Alkaline, and 4% for SOEC. This time-dependence is implemented directly in the deterministic codebase and carried through into the surrogate modeling workflow in Section 3.9.
Electricity consumption per kg H2 increases over time due to electrolyzer stack degradation. The degraded voltage and the resulting adjusted energy consumption are calculated as (Equation (8)):
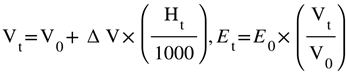 Where:
- V0 is the initial voltage,
- ΔV is the voltage degradation rate in mV per 1000 hours (i.e, mV/kh)
- Ht is cumulative operating hours at time t.
- Vt=Degraded voltage at the time t.
- E0=Initial specific energy use (kWh/kg)
- Et= Adjusted specific energy use of time t as voltage degrades
Annual profit is computed as the difference between hydrogen and oxygen revenue and the production cost at each year t (Equation (9)):

The Net Present Value (NPV) is then calculated by discounting the annual profits over the project period from 2025 to 2050 (Equation (10)):
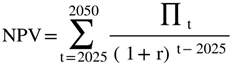
Country-specific economic assumptions—including cost structures, renewable availability, and investment mechanisms—are documented in Supplementary Table S1 for the UK and Supplementary Table S2 for Costa Rica. The model’s technical fidelity is supported by degradation-adjusted efficiency projections for each electrolyzer type, as detailed in Supplementary Table S3.
3.7. Regional Adjustments for Costa Rica and the UK
To reflect spatial variability in renewable energy potential, the LCOH models for both the United Kingdom and Costa Rica apply dynamic electricity cost adjustments based on normalized renewable resource scores. Each region’s Renewable Potential Score is computed by combining Global Horizontal Irradiance (GHI) and the average of onshore and offshore wind speeds (Equation (11)):
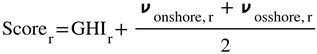
This score is then normalized against the best-performing region to generate an Adjustment Factor, reflecting relative resource quality (Equation (12)):
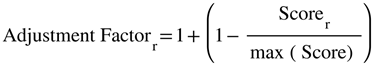
The baseline electricity price in each region is then scaled accordingly (Equation (13)):

3.8. Economic Calculations
The economic viability of hydrogen production in Costa Rica and the United Kingdom is assessed using two complementary indicators: LCOH and NPV. The LCOH represents the discounted cost to produce 1 kilogram of hydrogen, considering electrolyzer degradation, regionalized electricity prices linked to renewable resource availability, and investment incentives. In parallel, the NPV captures the present value of annual cash flows over a 20-year operational life, accounting for interactions between hydrogen production costs, stochastic price variations, and market mechanisms such as carbon credits and oxygen co-product revenues. Both metrics are evaluated for PEM, alkaline, and SOEC technologies across five-year intervals from 2025 to 2050. Key economic parameters and assumptions underpinning the NPV calculations are summarized in Table 1 for the United Kingdom and Table 2 for Costa Rica, including wholesale hydrogen price ranges, capital expenditure grants, electricity tariff distributions, operational subsidies, and fiscal incentives. This structured approach ensures that regional differences in cost drivers and support mechanisms are transparently incorporated into the comparative techno-economic analysis.
3.8.1. Net-Present-Value Formulation
For each year t:
- QH2 – annual hydrogen output.
- PH2 – wholesale H2 price draw; PO2P_{\text O_2}PO2 – O2 credit.
- Et – electricity consumption (rises with stack degradation).
- Pe – electricity price draw.
- Discount rate r: 6% (UK) and 5% (CR).
- CAPEX is annuitized with the country-specific grant (UK & CR: 15%).
- A 1 000-iteration Monte-Carlo varies PH2, Pe, O2 and CO2 credits, and plant load-factor (±5%).
3.9. Simulation-Augmented Machine Learning Framework for LCOH Forecasting
The simulation–machine learning hybrid framework was developed to efficiently simulate thousands of plausible techno-economic futures without excessive computational burden. It couples the deterministic LCOH models with supervised tree-based surrogates (Random Forest, XGBoost, and LightGBM). The workflow consists of three sequential stages: (i) synthetic data generation via Latin Hypercube Sampling (LHS), (ii) high-fidelity LCOH estimation using physics-based models, and (iii) surrogate training and validation.
3.9.1. Synthetic Data Generation
For Costa Rica, a four-dimensional Latin Hypercube Sample (LHS) comprising N=300 strata was generated. Key uncertain inputs included subsidy-adjusted CAPEX, wholesale electricity price, fixed OPEX, and system capacity factor. For the United Kingdom, a six-dimensional LHS with N=500 strata was created to reflect a wider policy and technical variability, adding degradation rate and a subsidy-flag dimension.
Each sample was evaluated using the respective deterministic LCOH model, which dynamically adjusts specific energy consumption Espec(t) over the 20-year project horizon based on technology-specific voltage degradation. Full parameter ranges, central values, and code implementations are detailed in Supplementary Table S5.
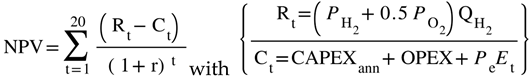
Annual LCOH was computed for each sample based on: (Equation (15)):
 Where:
- CAPEXadj: Capital expenditure per kilowatt, adjusted for subsidy incentives.
- CRF: Capital recovery factor, calculated as
 with discount rate rrr and project lifetime n.
 - mH2: Annual hydrogen output (kg), based on system size, efficiency, and capacity factor.
- OPEX: Fixed operating costs ($/kg).
- pe: Electricity price ($/kWh).
- Espec(t): Specific energy use per kg H2, defined as a function of 0, ΔV, and cumulative degradation time
3.9.2. Model Architecture and Training
The datasets were split 80/20 into training and test sets, with all features standardized via z-scoring. A five-fold grid search optimized Random Forest hyperparameters, while XGBoost and LightGBM used standard defaults suited for tabular regression. Model accuracy was assessed using cross-validated CV-MSE, MAE, RMSE, and R2, with performance uplift measured against a naïve mean-prediction baseline (ΔMAE). The best-performing Random Forest models were serialized and analyzed using SHAP (SHapley Additive exPlanations) to interpret feature contributions on the test set. Summary and dependence plots for each technology and country highlighted electricity price, CAPEX, and capacity factor as key drivers, enhancing transparency and trust in the surrogate models.
4. Sensitivity Analysis for Green Hydrogen Economic Models
Building upon the techno-economic formulations outlined in Section 3.6, Section 3.7 and Section 3.8, a grid-based sensitivity analysis was performed to assess how the Levelized Cost of Hydrogen (LCOH) and Net Present Value (NPV) respond to variations in capital expenditure (CAPEX) and electricity price. Deterministic simulations were conducted for three electrolyzer technologies—PEM, Alkaline, and SOEC—each characterized by specific voltage profiles and degradation rates (see Supplementary Table S3).
Simulations were performed separately for the United Kingdom and Costa Rica, using region-specific ranges for CAPEX and electricity prices based on projected 2025 conditions (detailed in Supplementary Tables S1 and S2). At each grid point, LCOH was calculated by annualizing CAPEX over a 20-year project life and summing fixed operational costs, water consumption, and electricity expenses adjusted for efficiency degradation. NPV was computed as the discounted sum of annual net cash flows, considering revenues from hydrogen and oxygen sales and all relevant costs.
This framework enables a structured and comparative evaluation of green hydrogen economic viability across different technological and regional contexts, while detailed modeling assumptions and data sources are provided in the Supplementary Information.
5. Results
5.1. Wind and Solar Energy Potential in Costa Rica
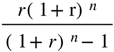
A spatial analysis of Costa Rica’s wind and solar resources reveals substantial regional variation, underscoring the country’s strong renewable energy potential. As shown in Figure 1, Guanacaste stands out as the most promising region, with a mean onshore wind speed of 6.59 m/s, peak speeds up to 19.17 m/s, and a top 10% wind zone average of 11.21 m/s. In contrast, Limón exhibits the lowest wind potential, with a mean onshore speed of 2.40 m/s. Offshore wind speeds are relatively consistent across coastal provinces, averaging 4.57 m/s.
For solar energy, Guanacaste again leads with a mean GHI of 5.50 kWh/m2/day (equivalent to 2005.27 kWh/m2/year), and a top 10% zone average of 5.79 kWh/m2/day. Puntarenas follows with 5.16 kWh/m2/day, while Cartago and San José have lower irradiance levels at 4.42 and 4.79 kWh/m2/day, respectively.
Caption: This figure illustrates the spatial distribution of wind speed (panel a) and solar irradiance (GHI) (panel b) across Costa Rica. Panel (a) shows wind speeds ranging from 2–12 m/s, with Guanacaste exhibiting the strongest values. Panel (b) presents solar irradiance from 1200–2200 kWh/m2/day, again with Guanacaste recording the highest GHI. Both maps include provincial boundaries to support geographical context and aid in identifying priority areas for renewable energy development.
5.2. Solar and Wind Energy Potential Across the United Kingdom and Northern Ireland
Solar and wind resources vary significantly across the UK. As seen in Figure 2, England and Wales exhibit the highest mean GHI values (2.73 and 2.67 kWh/m2/day, respectively), followed by Northern Ireland (2.44 kWh/m2/day) and Scotland (2.35 kWh/m2/day).
Caption: This figure displays the Global Horizontal Irradiance (GHI) for four regions of the United Kingdom: England, Wales, Scotland, and Northern Ireland. Each region’s solar potential is shown in a separate subplot, labeled (a) for England, (b) for Wales, (c) for Scotland, and (d) for Northern Ireland, with individual colorbars representing the average daily solar irradiance (kWh/m2/day). The plasma colormap is used to visualize varying levels of solar energy intensity, with brighter regions indicating higher irradiance levels. These maps provide valuable insights for assessing the regional solar potential essential for renewable energy planning.
Wind resources are mapped in Figure 3, with all regions showing strong onshore wind speeds above 8.5 m/s. Offshore zones in Scotland, Wales, and Northern Ireland exceed 9.9 m/s, with peaks above 16 m/s. England features high wind power density, reaching over 2700 W/m2 in coastal zones.
Caption: Figure 3 presents the wind speed data at 100 meters height across England, Wales, Scotland, and Northern Ireland. Each subplot, labeled (a) for England, (b) for Wales, (c) for Scotland, and (d) for Northern Ireland, shows the wind speed distribution with individual colorbars. The viridis colormap is used to visualize wind speed variations, where brighter areas indicate stronger wind speeds. These maps are essential for evaluating the feasibility of onshore wind energy generation, highlighting regions with higher wind potential.
Together, these results underscore Guanacaste’s dominance in Costa Rica for both wind and solar development, while also highlighting the UK’s offshore wind advantage and moderate solar potential. Detailed regional statistics for both countries—including wind speed ranges, GHI levels, and top-performing zones—are provided in Supplementary Table S4.
5.3. LCOH Estimations for Costa Rica and the United Kingdom
The hydrogen production cost projections reveal clear contrasts between Costa Rica and the United Kingdom, driven by differences in renewable energy availability, electricity market structures, and technology learning curves. These trends are visualized in Figure 4, which maps the regional variations in Levelized Cost of Hydrogen (LCOH) for the year 2030 across both countries.
In Costa Rica, the lowest LCOH in 2025 is achieved in Guanacaste using SOEC technology at approximately 8.81 $/kg, benefitting from the region’s favorable combination of wind and solar resources. PEM electrolyzers in Guanacaste show a 2025 LCOH of around 13.95 $/kg, gradually declining to 10.57 $/kg by 2050 as capital and operational costs fall due to learning effects. In contrast, regions with less optimal renewable profiles, such as San José and Cartago, consistently report higher LCOH values across all technologies, underlining the central role of renewable quality in hydrogen competitiveness.
In the United Kingdom, starting LCOH values are significantly lower than in Costa Rica, primarily due to lower modeled electricity prices and aggressive CAPEX reduction assumptions. In 2025, the LCOH for PEM electrolysis in England is estimated at 4.68 $/kg, decreasing steadily to 3.34 $/kg by 2050. SOEC emerges as the most cost-effective technology option across the UK regions, reaching an LCOH of 2.07 $/kg by 2050. Although regional variations within the UK exist—driven mainly by wind resource differences between Scotland, Wales, and England—the disparities are relatively modest compared to those observed in Costa Rica.
Caption: Heatmap visualization of the Levelized Cost of Hydrogen (LCOH) across regions in (a) Costa Rica and (b) the United Kingdom for the year 2030, across three electrolyzer technologies (PEM, Alkaline, SOEC). Darker shades indicate lower LCOH ($/kg H2), while lighter tones represent higher production costs, following a Viridis color scale. Spatial disparities are shaped by renewable resource availability, electricity pricing, and infrastructure factors, providing a comparative basis for investment strategies and policy formulation in the green hydrogen sector.
Overall, Costa Rica’s LCOH trajectory remains higher across the modeling horizon, even though it benefits from excellent renewable resources, due to inherently higher industrial electricity tariffs. Conversely, the UK benefits from lower baseline electricity prices and substantial offshore wind deployment, facilitating faster convergence to internationally competitive LCOH targets by mid-century. These results emphasize the critical interplay between regional resource availability, technology selection, and policy support in shaping the emerging hydrogen economy.
5.4. NPV Comparison for Hydrogen Production in Costa Rica and the United Kingdom
The harmonized 1,000-draw Monte Carlo analysis over a 20-year project horizon reveals pronounced regional contrasts in the investment feasibility of green hydrogen production, as visualized in Figure 5. In Costa Rica, based on a 3 MW plant (approximately 300 kg H2 per day), only Solid Oxide Electrolysis Cell (SOEC) technology achieves consistently positive returns, posting a mean Net Present Value (NPV) of approximately +3 million $, with a P10–P90 confidence interval ranging from +2 million to +4 million $. Proton Exchange Membrane (PEM) technology remains balanced at the break-even line, with a mean NPV near 0 million $ and variability between –1 million and +1 million $, while Alkaline electrolysis also remains around the break-even point, averaging near 0 million $, with variability between –1 million and +1 million $. These modest NPVs are largely attributable to the pilot-scale deployment, the modest impact of Costa Rica’s 15% CAPEX grant, and the relatively narrow margin realizable even under the country’s favourable industrial electricity tariffs (0.04–0.06 $/kWh).
Conversely, the United Kingdom’s 50 MW green-hydrogen projects (approximately 30 tonnes H2 per day) demonstrate substantially higher investment returns across all technologies. SOEC again leads, achieving a mean NPV of around +895 million $ (P10–P90: +784 million to +1.01 billion $), while PEM and Alkaline configurations also deliver strong profitability, with mean NPVs of +767 million $ and +741 million $, respectively. Notably, even the lower bounds of the UK NPV distributions remain above +630 million $, highlighting robust resilience to market variability. These superior outcomes are primarily driven by the Hydrogen Production Business Model (HPBM) strike-price top-up (mode at 6 $/kg, triangular distribution 5–7 $/kg ) combined with revenue inflows from the UK Emissions Trading Scheme (UK-ETS) carbon credits (~0.5 $/kg ), which together offset higher wholesale electricity costs (0.0516–0.0774 $/kWh).
Caption: This figure presents a comparative bar plot of Net Present Value (NPV) outcomes for hydrogen production in Costa Rica (a) and the United Kingdom (b) using a harmonized Monte Carlo simulation framework. Each subplot shows the mean NPV (in million $, 20-year real terms) for three electrolyzer technologies—PEM, Alkaline, and SOEC. Color intensity encodes the relative NPV magnitude within each country, mapped through the Viridis colormap. The dual-panel format highlights national differences in economic feasibility across technology options, with dedicated colorbars facilitating scale interpretation.
Overall, the findings depicted underline the pivotal role of both policy design and scale effects in shaping the economic viability of hydrogen investments. While Costa Rica’s renewable-rich environment and incentive structures support modest profitability at smaller scales—especially via high-efficiency SOEC pathways—the United Kingdom’s combination of market support mechanisms and large-scale plant deployment unlocks order-of-magnitude higher NPVs across all electrolyzer technologies. This comparative analysis highlights that market architecture, subsidy frameworks, and project size are decisive levers in the emerging global hydrogen economy.
5.5. Machine Learning Model Performance Comparison
To assess the predictive capacity of machine learning models in estimating the Levelized Cost of Hydrogen (LCOH) for Costa Rica and the United Kingdom, three core metrics were evaluated: Mean Absolute Error (MAE), Root Mean Squared Error (RMSE), and the Coefficient of Determination (R2). As shown in Figure 6, these metrics were compared across three electrolyzer technologies—PEM, Alkaline, and SOEC—highlighting both national and technological differences in model performance.
In Costa Rica, LightGBM consistently outperformed other models across all electrolyzer types. For PEM systems, it achieved a MAE of 0.115, RMSE of 0.145, and an R2 of 0.990. Alkaline electrolyzers yielded a MAE of 0.116, RMSE of 0.150, and an R2 of 0.988, while SOEC predictions reached a MAE of 0.106, RMSE of 0.143, and an R2 of 0.992. These results confirm LightGBM’s superior generalization performance despite the country’s smaller, pilot-scale datasets. SHAP analysis further revealed that electricity price, CAPEX, and capacity factor were the most influential predictors of LCOH, enhancing the transparency and trustworthiness of the surrogate modeling framework.
Similarly, in the United Kingdom, LightGBM delivered the strongest predictive performance across all technologies. For PEM, it achieved a MAE of 0.166, RMSE of 0.214, and an R2 of 0.990. Alkaline electrolyzers recorded a MAE of 0.221, RMSE of 0.290, and an R2 of 0.981, while SOEC systems yielded a MAE of 0.205, RMSE of 0.263, and an R2 of 0.988. These results reflect high model generalization enabled by large-scale, policy-supported datasets and more stable operational conditions. SHAP-based analysis confirmed the dominant influence of electricity price, CAPEX, and capacity factor, reinforcing the model’s interpretability and relevance for decision-making in well-developed hydrogen markets.
Caption: This figure presents the performance of the best machine learning models in predicting the Levelized Cost of Hydrogen (LCOH) for Costa Rica and the United Kingdom, across three electrolyzer technologies: PEM, Alkaline, and SOEC. Each heatmap displays three evaluation metrics—Mean Absolute Error (MAE), Root Mean Squared Error (RMSE), and Coefficient of Determination (R2)—with values annotated in each cell. Color intensities, based on the Viridis colormap, indicate relative metric magnitudes, using a consistent scale across both subplots. A shared vertical colorbar reflects the value gradient, enabling direct visual comparison between countries and technologies.
Overall, these findings affirm that ensemble learning methods—particularly LightGBM—are highly effective for capturing the complex techno-economic dynamics of green hydrogen production across diverse regional contexts.
5.6. Sensitivity Analysis of Hydrogen Economics in Costa Rica and the United Kingdom
To quantify how project economics react to simultaneous shifts in capital cost and power-purchase tariff, two-dimensional sensitivity surfaces were generated for Levelized Cost of Hydrogen (LCOH) and Net Present Value (NPV). Each surface was computed separately for the three electrolyzer technologies—PEM, Alkaline, and SOEC—using consistent degradation parameters and operational assumptions established in Section 3.6, Section 3.7 and Section 3.8.
In Costa Rica, the analysis models a 3 MW installation operating at 4,000 full-load hours annually (capacity factor ≈ 0.456) under a 5% real discount rate (CRF = 0.0802). Despite favorable electricity prices and CAPEX reductions through a 15% free-trade-zone grant, the small project scale constrains profitability. The sensitivity surfaces reveal that while PEM and Alkaline electrolyzers can achieve positive NPVs under ideal cost conditions, SOEC systems remain challenged by their higher energy consumption and capital requirements. These dynamics emphasize that at smaller scales, even aggressive cost and efficiency improvements may not fully overcome investment barriers without targeted incentives.
Conversely, the United Kingdom scenario models a 50 MW plant operating 6,000 full-load hours annually (capacity factor ≈ 0.685) with a 6% discount rate (CRF = 0.0872). Here, a combination of larger project scale, power-price support mechanisms, and layered revenue streams—including Hydrogen Production Business Model (HPBM) strike-price top-ups, oxygen credits, and carbon credit revenues—significantly enhances financial viability. Both PEM and Alkaline technologies exhibit strong profitability across broad portions of the cost-space, while SOEC configurations, although less robust, still maintain positive returns under favorable conditions.
These trends are visualized in Figure 7, which illustrates NPV sensitivity surfaces for Costa Rica and the United Kingdom across variations in subsidy-adjusted CAPEX and electricity price. Full supporting parameters and selected output values are summarized in Supplementary Table S6.
Caption: Figure 7 presents a comparative sensitivity analysis of Net Present Value (NPV) outcomes for green hydrogen projects in Costa Rica and the United Kingdom, across variations in subsidy-adjusted CAPEX and electricity price. Panels (a)–(c) display the sensitivity surfaces for Costa Rica, while panels (d)–(f) correspond to the United Kingdom. Each subplot shows contour maps colored by NPV magnitude (in real 2025 $), with overlaid contour lines denoting regions of equal NPV for clearer visualization. Results are organized by electrolyzer technology—PEM, Alkaline, and SOEC—illustrating how economic feasibility responds to key cost drivers in different national contexts. This analysis highlights the critical interplay between CAPEX, energy pricing, and technology choice in shaping hydrogen investment viability.
Taken together, the comparative sensitivity analysis highlights that while Costa Rica’s renewable energy advantages are notable, achieving profitable hydrogen production at small scale requires additional financial instruments or scale-up strategies. In contrast, the UK’s strong policy-driven revenue stacking and larger project sizes create more resilient investment landscapes, allowing green hydrogen projects to remain bankable even under moderately adverse cost scenarios.
6. Discussion
This comparative modeling study highlights how national conditions, project scale, and policy frameworks shape the viability of green hydrogen development in Costa Rica and the United Kingdom. While both countries pursue hydrogen strategies, their trajectories diverge due to differences in subsidy design, renewable resource availability, and market incentives. Costa Rica, despite abundant low-cost renewables, faces financial constraints for small-scale (3 MW) deployments—even under optimistic scenarios—as shown in our Monte Carlo NPV analysis and supported by prior findings on small-system cost barriers (Henry et al., 2023). Conversely, the UK utilizes structured subsidy stacking—via the Hydrogen Production Business Model (HPBM), Net Zero Hydrogen Fund, and UK-ETS credits—to support large-scale (50 MW) projects with NPVs exceeding +800 million $ across all technologies, even under cost fluctuations.
These results support Costa Rica’s decentralized vision outlined in the Estrategia Nacional de Hidrógeno Verde 2022–2050 (MINAE, 2022) but underscore the need for targeted incentives. In the UK, rapid offshore wind expansion and public–private financing mechanisms—such as the Net Zero Hydrogen Fund (Department for Business, Energy & Industrial Strategy, 2021; DESNZ, 2024b)—enable scalable hydrogen investments despite higher infrastructure costs. This contrast illustrates how national policy design, scale, and technology choice—especially the shared preference for SOEC systems—will critically shape the future competitiveness of hydrogen economies.
Machine learning techniques—particularly ensemble models like Random Forest, XGBoost, and LightGBM—substantially improved the accuracy and efficiency of hydrogen cost modeling in both Costa Rica and the United Kingdom. As detailed in Section 3.9, ML acted as a surrogate modeling tool to explore complex, uncertain scenarios beyond traditional deterministic methods. LightGBM achieved the best performance, with R2 values of 0.990 (UK) and 0.992 (Costa Rica), and corresponding MAEs of 0.166 and 0.106, despite Costa Rica’s smaller dataset.
All models significantly outperformed naïve-mean baselines (Costa Rica MAE: 1.585; UK: 1.606), confirming the advantage of simulation-augmented ML. SHAP-based feature importance consistently identified electricity price, CAPEX, and capacity factor as key drivers of LCOH variation. Additionally, Monte Carlo–based NPV simulations revealed how scale, subsidies, and market dynamics shape financial viability under uncertainty.
These results reinforce the importance of hybrid simulation–machine learning approaches not only for accurate forecasting but also for guiding technology design, risk-informed investment, and policy development in green hydrogen systems. This is consistent with findings by Chen et al. (2023), who highlight ML’s role in uncovering policy-relevant energy dynamics, and Shash et al. (2025), who show that integrating CFD, thermodynamic models, and AI can achieve predictive accuracies above 95% and reduce operational costs by up to 24%. Together, these studies confirm that ML-augmented frameworks are becoming essential for scaling efficient, competitive hydrogen infrastructure.
This work builds on Navarro Jiménez and Zheng (2024), who applied Monte Carlo simulations to Costa Rica but were limited by deterministic methods and single-country scope. By adopting a comparative, cross-national approach and integrating model explainability and ML forecasting, this study provides deeper analytic insight and practical guidance for decision-makers navigating uncertain hydrogen markets.
This study also reflects broader systemic concerns raised by Jayachandran et al. (2024), who identified persistent barriers to green hydrogen deployment—including electrolyzer inefficiencies, storage safety, and immature infrastructure—that vary across national contexts. In Costa Rica, decentralized systems and limited grid capacity hinder centralized hydrogen production, requiring modular, localized solutions. In contrast, the UK faces the financial and regulatory complexity of large-scale offshore infrastructure, contributing to heightened cost sensitivity. This was evident in our CAPEX–electricity price sensitivity surfaces, where UK projects showed greater LCOH and NPV variability.
These challenges underscore the need to pair advanced modeling—such as simulation-enhanced machine learning—with strategic infrastructure planning. The U.S. National Clean Hydrogen Strategy and Roadmap (DOE, 2023) supports this view, promoting $9.5 billion in investments for Regional Hydrogen Hubs. Similarly, Mullanu et al. (2024) highlight the role of AI in optimizing hydrogen system coordination, reinforcing the value of integrated digital–physical infrastructure—a principle embedded in this study’s hybrid framework.
Further perspective comes from Müller et al. (2023), who used a GIS-based least-cost framework to assess hydrogen viability in Kenya, emphasizing the importance of geospatial planning—especially in LMICs—to align production, transport, and end-use zones. This directly supports Costa Rica’s decentralized hydrogen strategy, where spatial hubs could reduce transmission costs and navigate mountainous terrain and fragmented infrastructure.
Beyond national strategies, Costa Rica and the United Kingdom offer complementary strengths for bilateral cooperation. Costa Rica’s renewable decentralization and environmental leadership, combined with the UK’s financial tools and regulatory expertise, create fertile ground for joint pilot projects, electrolyzer strategy exchange, and co-development of ML-based forecasting tools. Offshore wind collaboration in Guanacaste also holds promise, where UK infrastructure experience could accelerate hybrid wind–hydrogen hubs. Institutions such as GIZ, IADB, and the UK Infrastructure Bank could support inclusive innovation, blended finance, and knowledge transfer across development contexts.
While this study integrates high-resolution spatial data, techno-economic simulation, and machine learning, it does not incorporate empirical calibration using real plant data such as SCADA records or electrolyzer performance logs. This reflects the pre-commercial status of green hydrogen pilot projects in Costa Rica, where no operational datasets currently exist. Future studies may incorporate such validation as infrastructure matures. Additionally, the machine learning models used in this study serve as surrogate tools for scenario interpretation and cost driver analysis. They are not intended for generalization across geographies or as physical performance simulators. Moreover, the model also does not simulate hourly dispatch, dynamic control systems, or intra-day variability. This abstraction reflects a deliberate focus on long-term investment feasibility and policy planning rather than operational optimization. Instead of developing novel physical models, the contribution lies in integrating geospatial-economic scaling, stochastic policy forecasting, and interpretable machine learning (via SHAP) to inform infrastructure planning. This approach complements, rather than replaces, dynamic system-level models by offering policy-relevant insights into technology and infrastructure interactions under uncertainty.
Beyond bilateral models, this study identifies several global priorities for advancing hydrogen strategies, aligned with the Costa Rica–UK comparison. Chief among them is the creation of open-access, interoperable datasets to improve transparency, comparability, and reproducibility in hydrogen cost modeling—reflecting the data-driven approach used here. The lack of standardized datasets remains a major barrier to model validation. Integrating demand-side forecasting, especially for decentralized contexts like Costa Rica, is also essential for effective project planning.
Benchmarking machine learning models across diverse geographic and economic contexts is critical to ensure transferability. For example, Colombia’s national hydrogen roadmap (Rodríguez-Fontalvo et al., 2024) targets 9 Mt/a by 2050 and a 1.2% global market share through a $244 billion investment—leveraging tropical renewables similar to Costa Rica. In contrast, the UK emphasizes offshore energy, carbon pricing, and blended finance to scale its hydrogen sector. These divergent strategies underscore the need for context-specific approaches tailored to national capabilities and constraints. This study demonstrates that integrating techno-economic analysis with machine learning provides a scalable framework to guide investment, policy, and deployment across varied global settings.
7. Conclusion
This study developed an integrated, machine learning–augmented techno-economic framework to evaluate the viability of green hydrogen production in diverse national contexts, using Costa Rica and the United Kingdom as comparative case studies. By combining spatial resource mapping, deterministic cost modeling, Monte Carlo simulation, and ensemble learning, the framework captures region-specific cost dynamics and investment risks under policy and resource uncertainty.
Results show that while Costa Rica’s decentralized, renewables-rich model supports modest feasibility—achieving SOEC-based NPVs around +$3 million—UK projects benefit from large-scale infrastructure and layered incentives, reaching SOEC NPVs exceeding +$895 million and LCOH as low as $2.07/kg by 2050. These findings underscore the pivotal role of scale, subsidy design, and electricity pricing in shaping green hydrogen competitiveness.
Rather than proposing new physical models, this study demonstrates the strategic value of integrating spatial techno-economics, stochastic policy forecasting, and interpretable machine learning to support long-term hydrogen investment planning. The approach enables rapid, policy-relevant scenario analysis across countries with contrasting infrastructure maturity and development priorities.
Opportunities for bilateral cooperation—such as joint wind–hydrogen hubs and co-developed ML tools—can leverage Costa Rica’s renewable potential and the UK’s regulatory and financial expertise. Future work should focus on open-access data, cross-national ML benchmarking, and dynamic demand modeling to improve transferability and real-world applicability.
This study offers a scalable framework to guide equitable, evidence-based hydrogen transitions in both emerging and advanced energy markets.
Supplementary Materials
The following supporting information can be downloaded at the website of this paper posted on Preprints.org.
Author Contributions
Andrea Navarro Jiménez developed the research idea, designed the study, gathered and analyzed the data, and prepared the manuscript.
Funding
This study did not receive any particular funding from government, corporate, or charitable sources.
Data Availability Statement
The dataset supporting the findings of this study is publicly available via Mendeley Data at: NAVARRO, ANDREA (2025), “Comparative Modeling of Green Hydrogen Development in Costa Rica and the UK: A Machine Learning-Driven Policy and Investment Forecasting Approach”, Mendeley Data, V1, doi: 10.17632/hw4g4xnd32.1. Not yet published
Conflicts of Interest
The author confirms that no conflicts of interest are associated with the publication of this manuscript.
Ethics Statement
This study did not involve any research on human subjects, human data, human tissue, or animals. Therefore, no ethical approval was required.
Declaration of Generative AI and AI-assisted Technologies in the Writing Process
During the preparation of this work, the author(s) used ChatGPT in order to improve grammar and readability.
References
- Ad Astra Rocket Company. Green hydrogen pilot plant feasibility study (Phase 3). Unpublished internal report. 2018. [Google Scholar]
- Ad Astra. Costa Rica Hydrogen Transportation Ecosystem – Case Study Update. 2024. Available online: https://www.adastrarocket.com/cr/.
- Alcantara, M.L.; Santana, J.C.C.; Nascimento, C.A.O.; Ribeiro, C.O. Application of levelized and environmental cost accounting techniques to demonstrate the feasibility of green hydrogen-powered buses in Brazil. Hydrogen 2025, 6, 10. [Google Scholar] [CrossRef]
- Aldren, C.; Shah, N.; Hawkes, A. Quantifying key economic uncertainties in the cost of trading green hydrogen. Cell Reports Sustainability 2025, 2, 100342. [Google Scholar] [CrossRef]
- Alhussan, A.A.; El-Kenawy, E.M.; Saeed, M.A.; Ibrahim, A.; Abdelhamid, A.A. Green hydrogen production ensemble forecasting based on hybrid dynamic optimization algorithm. Frontiers in Energy Research 2023, 11, 1221006. [Google Scholar] [CrossRef]
- Allal, Z.; Noura, H.N.; Salman, O.; Vernier, F.; Chahine, K. A review on machine learning applications in hydrogen energy systems. International Journal of Thermofluids 2025, 26, 101119. [Google Scholar] [CrossRef]
- Baral, S.; Šebo, J. Techno-economic assessment of green hydrogen production integrated with hybrid and organic Rankine cycle (ORC) systems. Heliyon 2024, 10, e25742. [Google Scholar] [CrossRef]
- Bassey, K.E.; Ibegbulam, C. Machine learning for green hydrogen production. Computer Science & IT Research Journal 2023, 4, 368–385. [Google Scholar] [CrossRef]
- Bird & Bird LLP; Allende & Brea; Various Contributors. International Green Hydrogen Report. 2024. Available online: https://allende.com/en/.
- BLP Legal. Costa Rica: A strategic destination for green hydrogen development. 18 November 2024. Available online: https://blplegal.com/.
- Borm, O.; Harrison, S.B. Reliable off-grid power supply utilizing green hydrogen. Clean Energy 2021, 5, 441–446. [Google Scholar] [CrossRef]
- Buchner, J.; Menrad, K.; Decker, T. Public acceptance of green hydrogen production in Germany. Renewable and Sustainable Energy Reviews 2025, 208, 115057. [Google Scholar] [CrossRef]
- Bui, T.; Lee, D.; Ahn, K.Y.; Kim, Y.S. Techno-economic analysis of high-power solid oxide electrolysis cell system. Energy Conversion and Management 2023, 286, 116704. [Google Scholar] [CrossRef]
- Chen, W.; Zou, W.; Zhong, K.; Aliyeva, A. Machine learning assessment under the development of green technology innovation: A perspective of energy transition. Renewable Energy 2023, 214, 65–73. [Google Scholar] [CrossRef]
- Clean Hydrogen Joint Undertaking. Strategic Research and Innovation Agenda (SRIA) 2021–2027 Update 2023. Brussels, Belgium. Available online: https://www.clean-hydrogen.europa.eu/system/files/2023-03/SRIA_2023_update.pdf.
- Criollo, A.; Minchala-Avila, L.I.; Benavides, D.; Ochoa-Correa, D.; Tostado-Véliz, M.; Meteab, W.K.; Jurado, F. Green Hydrogen Production—Fidelity in Simulation Models for Technical–Economic Analysis. Applied Sciences 2024, 14, 10720. [Google Scholar] [CrossRef]
- Devasahayam, S. Deep learning models in Python for predicting hydrogen production: A comparative study. Energy 2023, 280, 128088. [Google Scholar] [CrossRef]
- Department for Business and Trade (DBT). UK Infrastructure Bank: Financial support for hydrogen projects; 2024. Available online: https://www.gov.uk/government/publications/uk-infrastructure-bank-hydrogen-investment.
- Department for Business, Energy & Industrial Strategy. UK Hydrogen Strategy. GOV.UK. 2021. Available online: https://www.gov.uk/government/publications/uk-hydrogen-strategy.
- Department for Business, Energy & Industrial Strategy. Hydrogen production costs 2021 (Annex: Cost breakdowns and sensitivities). UK Government. 2021. Available online: https://www.gov.uk/government/publications/hydrogen-production-costs-2021.
- Department for Energy Security and Net Zero. Contracts for Difference Allocation Round 4: Results. UK Government. 2022. Available online: https://www.gov.uk/government/publications/contracts-for-difference-cfd-allocation-round-4-results.
- Department for Energy Security and Net Zero. Hydrogen Production Business Model: Impact Assessment (IA No. 11854). GOV.UK. 2023. Available online: https://www.gov.uk/government/publications/hydrogen-production-business-model-impact-assessment.
- Department for Energy Security and Net Zero. Energy Trends December 2024 – Statistical release. UK Government. 2024. Available online: https://www.gov.uk/government/collections/energy-trends.
- Department for Energy Security and Net Zero. Economic impact assessment for the hydrogen sector to 2030. UK Government. 2024. Available online: https://www.gov.uk/government/publications/economic-impactassessment-for-the-hydrogen-sector-to-2030.
- Department for Energy Security and Net Zero. Net Zero Hydrogen Fund guidance. GOV.UK. 2024. Available online: https://www.gov.uk/government/publications/net-zero-hydrogen-fund.
- Deloitte. Green hydrogen: Energizing the path to net zero. Deloitte Economics Institute. 2023. Available online: https://www.deloitte.com/global/en/issues/climate/green-hydrogen.html.
- Dorn, F.M. Green colonialism in Latin America? Towards a new research agenda for the global energy transition. European Review of Latin American and Caribbean Studies 2022, 114, 137–146. [Google Scholar] [CrossRef]
- Environment + Energy Leader. Costa Rica: A strategic hub for UK infrastructure and renewable energy ventures. 22 October 2024. Available online: https://www.environmentenergyleader.com/stories/costa-rica-a-strategic-hub-for-uk-infrastructure,55033.
- Frontier Economics. Business models for low-carbon hydrogen production. Frontier Economics. 2024. Available online: https://www.frontier-economics.com/media/2zkga3k1/business-models-for-low-carbon-hydrogen-production.pdf.
- GasWorld. UK industrial-gas price index: Bulk oxygen cylinders. GasWorld. 2023. Available online: https://www.gasworld.com/price-index.
- Gischler, C.; Daza, E.; Galeano, P.; Ramirez, M.; Gonzalez, J.; Cubillos, F.; Hartmann, N.; Pradelli, V.; Márquez, J.S.; Gutiérrez, J.A.; et al. Green hydrogen in Latin America and the Caribbean: Towards a just and sustainable energy transition. Inter-American Development Bank. 2023. Available online: https://publications.iadb.org/en.
- GIZ. Costa Rica – Green hydrogen. Mitigation Action Facility. 25 March 2025. Available online: https://mitigation-action.org/.
- Hauch, A.; Küngas, R.; Blennow, P.; Hansen, A.B.; Hansen, J.B.; Mathiesen, B.V.; Mogensen, M.B. Recent advances in solid oxide cell technology for electrolysis. Science 2020, 370. [Google Scholar] [CrossRef] [PubMed]
- H2LAC. Costa Rica: 25 million Euro green hydrogen project approved. 21 April 2025. Available online: https://h2lac.org/en/news/costa-rica-25-million-euro-green-hydrogen-project-approved/.
- Henry, A.; McStay, D.; Rooney, D.; Robertson, P.; Foley, A. Techno-economic analysis to identify the optimal conditions for green hydrogen production. Energy Conversion and Management 2023, 291, 117230. [Google Scholar] [CrossRef]
- HM Treasury. The Green Book: Central government guidance on appraisal and evaluation (2022 update). GOV.UK. 2022. Available online: https://www.gov.uk/government/publications/the-green-book-appraisal-and-evaluation-in-central-government.
- Hydrogen Council; McKinsey & Company. Hydrogen for net-zero: A critical cost-competitive energy vector. Hydrogen Council. 2021. Available online: https://www.hydrogencouncil.com/en/hydrogen-for-net-zero/.
- Hydrogen Optimized. Clean hydrogen at scale. 2025. Available online: https://www.hydrogenoptimized.com/.
- Instituto Costarricense de Electricidad. Tarifas eléctricas: Docket DE-2022-001 – Tarifa Industrial B-T. 2022. Available online: https://www.grupoice.com.
- International Civil Aviation Organization. CORSIA eligible emission-unit prices: Q1-2024 snapshot. 2024. Available online: https://www.icao.int.
- International Renewable Energy Agency. Making the breakthrough: Green hydrogen policies and technology costs. IRENA. 2021. Available online: https://www.irena.org/publications.
- International Renewable Energy Agency. Costa Rica country profile 2024. IRENA. Available online: https://www.irena.org.
- International Energy Agency. Global Hydrogen Review 2024. International Energy Agency. Available online: https://www.iea.org/reports/global-hydrogen-review-2024.
- International Energy Agency. Electrolysis technology brief: SOEC cost outlook 2024–2030. International Energy Agency. 2024. Available online: https://www.iea.org/reports/electrolysis-technology-briefsoec-cost-outlook-2024-2030.
- Javanshir, N.; Pekkinen, S.; Santasalo-Aarnio, A.; Syri, S. Green hydrogen and wind synergy: Assessing economic benefits and optimal operational strategies. International Journal of Hydrogen Energy 2024, 83, 811–825. [Google Scholar] [CrossRef]
- Kabir, M.M.; Roy, S.K.; Alam, F.; Nam, S.Y.; Im, K.S.; Tijing, L.; Shon, H.K. Machine learning-based prediction and optimization of green hydrogen production technologies from water industries for a circular economy. Desalination 2023. Advance online publication. [Google Scholar] [CrossRef]
- Kim, J.; Rweyemamu, M.; Purevsuren, B. Machine learning-based approach for hydrogen economic evaluation of small modular reactors. Science and Technology of Nuclear Installations 2022, 2022, 9297122. [Google Scholar] [CrossRef]
- Kwon, H.; Park, J.; Shin, J.E.; Koo, B. Optimal investment strategy analysis of on-site hydrogen production based on the hydrogen demand prediction using machine learning. International. Journal of Energy Research 2024, 2024, 6313421. [Google Scholar] [CrossRef]
- Jayachandran, M.; Gatla, R.K.; Flah, A.; Milyani, A.H.; Milyani, H.M.; Blazek, V.; Prokop, L.; Kraiém, H. Challenges and opportunities in green hydrogen adoption for decarbonizing hard-to-abate industries: A comprehensive review. IEEE Access 2024, 12, 23363–23379. [Google Scholar] [CrossRef]
- Lebepe, M.C.; Oviroh, P.O.; Jen, T.-C. Techno-economic optimisation modelling of a solar-powered hydrogen production system for green hydrogen generation. Sustainable Energy Research 2025, 12. [Google Scholar] [CrossRef]
- Lichner, C. Electrolyzer prices—what to expect. pv magazine International. 2024. Available online: https://www.pv-magazine.com/2024/03/06/electrolyzer-prices-what-to-expect/.
- Matute, G.; Yusta, J.M.; Naval, N. Techno-economic model and feasibility assessment of green hydrogen projects based on electrolysis supplied by photovoltaic PPAs. International Journal of Hydrogen Energy 2023, 48, 5053–5068. [Google Scholar] [CrossRef]
- Matute, M.; Velasquez-Jaramillo, M.; Gallego, C.A.; Pérez, J.M.; Matute, P. Techno-economic assessment of green hydrogen production from renewable sources: A case study. International Journal of Hydrogen Energy 2023, 48, 5053–5068. [Google Scholar] [CrossRef]
- Ministerio de Ambiente y Energía. Borrador de Estrategia Nacional de Hidrógeno Verde de Costa Rica 2022–2050. 2022. Available online: https://www.minae.go.cr.
- Ministerio de Ambiente y Energía. Reglamento de incentivos fiscales para la producción de hidrógeno verde. Gaceta Oficial 57. 2025. Available online: https://www.minae.go.cr.
- Motiramani, M.; Solanki, P.; Patel, V.; Talreja, T.; Patel, N.; Chauhan, D.; Singh, A.K. AI-ML techniques for green hydrogen: A comprehensive review. Next Energy 2025, 1, 100252. [Google Scholar] [CrossRef]
- Mukelabai, M.D.; Barbour, E.R.; Blanchard, R.E. Modeling and optimization of renewable hydrogen systems: A systematic methodological review and machine learning integration. Energy and AI 2024, 18, 100455. [Google Scholar] [CrossRef]
- Mullanu, S.; Chua, C.; Molnar, A.; Yavari, A. Artificial intelligence for hydrogen-enabled integrated energy systems: A systematic review. International Journal of Hydrogen Energy 2024. [Google Scholar] [CrossRef]
- Müller, L.A.; Leonard, A.; Trotter, P.A.; Hirmer, S. Green hydrogen production and use in low- and middle-income countries: A least-cost geospatial modelling approach applied to Kenya. Applied Energy 2023, 343, 121219. [Google Scholar] [CrossRef]
- National Grid Electricity System Operator. Draft TNUoS tariffs 2024/25 [PDF]. National Grid ESO. 2024. Available online: https://www.neso.energy/document/294586/download.
- Naqvi, S.R.; Kazmi, B.; Taqvi, S.A.A.; Chen, W.-H.; Juchelková, D. Techno-economic analysis for advanced methods of green hydrogen production. Current Opinion in Green and Sustainable Chemistry 2024, 48, 100939. [Google Scholar] [CrossRef]
- Navarro Jiménez, A.; Zheng, H. Fueling Costa Rica’s green hydrogen future: A financial roadmap for global leadership. Renewable Energy Focus 2024, 51, 100651. [Google Scholar] [CrossRef]
- National Engineering Policy Centre. The role of hydrogen in a net zero energy system. Royal Academy of Engineering. 2022. Available online: https://raeng.org.uk.
- NewClimate Institute. The role of green hydrogen in a just, Paris-compatible transition. 2023. Available online: https://newclimate.org/resources/publications/the-role-of-green-hydrogen-in-a-just-paris-compatible-transition.
- Norman, E.A.; Maestre, V.M.; Ortiz, A.; Ortiz, I. Steam electrolysis for green hydrogen generation. State of the art and research perspective. Renewable and Sustainable Energy Reviews 2024, 202, 114725. [Google Scholar] [CrossRef]
- El-Shafie, M. Hydrogen production by water electrolysis technologies: A review. Results in Engineering 2023, 20, 101426. [Google Scholar] [CrossRef]
- Pinheiro, F.P.; Gomes, D.M.; Tofoli, F.L.; Sampaio, R.F.; Melo, L.S.; Gregory, R.C.F.; Sgrò, D.; Leão, R.P.S. Techno-economic analysis of green hydrogen generation from combined wind and photovoltaic systems based on hourly temporal correlation. International Journal of Hydrogen Energy 2024, 97, 690–707. [Google Scholar] [CrossRef]
- Pradhan, B.B.; Limmeechokchai, B.; Chaichaloempreecha, A.; Rajbhandari, S. Role of green hydrogen in the decarbonization of the energy system in Thailand. Energy Strategy Reviews 2024, 51, 101311. [Google Scholar] [CrossRef]
- Prasetyo, S.D.; Trisnoaji, Y.; Arifin, Z.; Mahadi, A.A. Harnessing unconventional resources for large-scale green hydrogen production: An economic and technological analysis in Indonesia. Unconventional Resources 2025, 6, 100174. [Google Scholar] [CrossRef]
- Rezaei, M.; Akimov, A.; Gray, E.M. Cost-competitiveness of green hydrogen and its sensitivity to major financial and technical variables. International Journal of Hydrogen Energy 2024, 90, 1365–1377. [Google Scholar] [CrossRef]
- Rodríguez-Fontalvo, D.; Quiroga, E.; Cantillo, N.M.; Sánchez, N.; Figueredo, M.; Cobo, M. Green hydrogen potential in tropical countries: The Colombian case. International Journal of Hydrogen Energy 2024, 54, 344–360. [Google Scholar] [CrossRef]
- Sareen, K.; Panigrahi, B.K.; Shikhola, T.; Nagdeve, R. Deep learning solar forecasting for green hydrogen production in India: A case study. International Journal of Hydrogen Energy 2023, 48, 3300–3312. [Google Scholar] [CrossRef]
- Shash, A.Y.; Abdeltawab, N.M.; Hassan, D.M.; Darweesh, M.; Hegazy, Y.G. Computational methods, artificial intelligence, modeling, and simulation applications in green hydrogen production through water electrolysis: A review. Hydrogen 2025, 6, 21. [Google Scholar] [CrossRef]
- Stamm, A.; Kantel, A.; Sagner, L.; Dütschke, E.; Scherrer, A.; Boie, I.; Müller, V.; et al. Towards a green H2 economy: Costa Rica country report (HYPAT Working Paper 02/2024). Fraunhofer ISI. 2024. Available online: https://hypat.de/hypat-en/.
- Statista. Global average wholesale electricity prices ($/MWh). 2025. Available online: https://www.statista.com/.
- Taghizadeh-Hesary, F.; Li, Y.; Rasoulinezhad, E.; Mortha, A.; Long, Y.; Lan, Y.; Zhang, Z.; Li, N.; Zhao, X.; Wang, Y. Green finance and the economic feasibility of hydrogen projects. International Journal of Hydrogen Energy 2022, 47, 24511–24522. [Google Scholar] [CrossRef]
- Tarvydas, D. The role of hydrogen in energy decarbonisation scenarios: Views on 2030 and 2050 (EUR 31358 EN); Joint Research Centre, European Commission, 2022. [Google Scholar] [CrossRef]
- Tatarenko, O.; Janzow, N.; Essa, E. Weak emissions accounting can undermine hydrogen’s role in global decarbonization. Green Hydrogen Catapult/RMI. 2024. Available online: https://greenh2catapult.com/weak-emissions-accounting-can-undermine-hydrogens-role-global-decarbonization.
- Tatarewicz, I.; Skwierz, S.; Lewarski, M.; Jeszke, R.; Pyrka, M.; Sekuła, M. Mapping the Future of Green Hydrogen: Integrated Analysis of Poland and the EU’s Development Pathways to 2050. Energies 2023, 16, 6261. [Google Scholar] [CrossRef]
- Tico Times. Brace for impact: Costa Rica’s electricity rates to soar by up to 26.6%. 28 May 2024. Available online: https://ticotimes.net/2024/05/28/brace-for-impact-costa-ricas-electricity-rates-to-soar-by-up-to-26-6.
- Torma, A.; Németh, P.; Mendoza, S.P.M. Comparison of hydrogen related policies and achievements between Latin America and Europe. Chemical Engineering Transactions 2024, 114, 991–996. [Google Scholar] [CrossRef]
- UK Government. UK Hydrogen Strategy (CP 475). Department for Business, Energy & Industrial Strategy. 2021. Available online: https://www.gov.uk/government/publications/uk-hydrogen-strategy.
- UK Emissions Trading Scheme Authority. Quarterly carbon-price update: Q1 2024. 2024. Available online: https://uk-ets-authority.org/publications.
- UK Emissions Trading Scheme Authority. UK-ETS carbon prices for use in civil penalties 2025. GOV.UK. 29 November 2024. Available online: https://www.gov.uk/government/publications/determinations-of-the-uk-ets-carbon-price/uk-ets-carbon-prices-for-use-in-civil-penalties-2025.
- Ukwuoma, C.C.; Cai, D.; Jonathan, A.L.; Chen, N.; Sey, C.; Ntia, N.W.; Bamisile, O.; Huang, Q. Enhancing hydrogen production prediction from biomass gasification via data augmentation and explainable AI: A comparative analysis. International Journal of Hydrogen Energy 2024, 68, 755–776. [Google Scholar] [CrossRef]
- U.S. Department of Energy. U.S. National Clean Hydrogen Strategy and Roadmap; 2023. Available online: https://www.hydrogen.energy.gov/pdfs/clean-hydrogen-strategy-roadmap.pdf.
- Yang, Q.; Zhao, L.; Xiao, J.; Wen, R.; Zhang, F.; Zhang, D. Machine learning-assisted prediction and optimization of solid oxide electrolysis cell for green hydrogen production. Green Chemical Engineering 2025, 6, 154–168. [Google Scholar] [CrossRef]
Figure 1.
Wind and Solar Maps of Costa Rica.
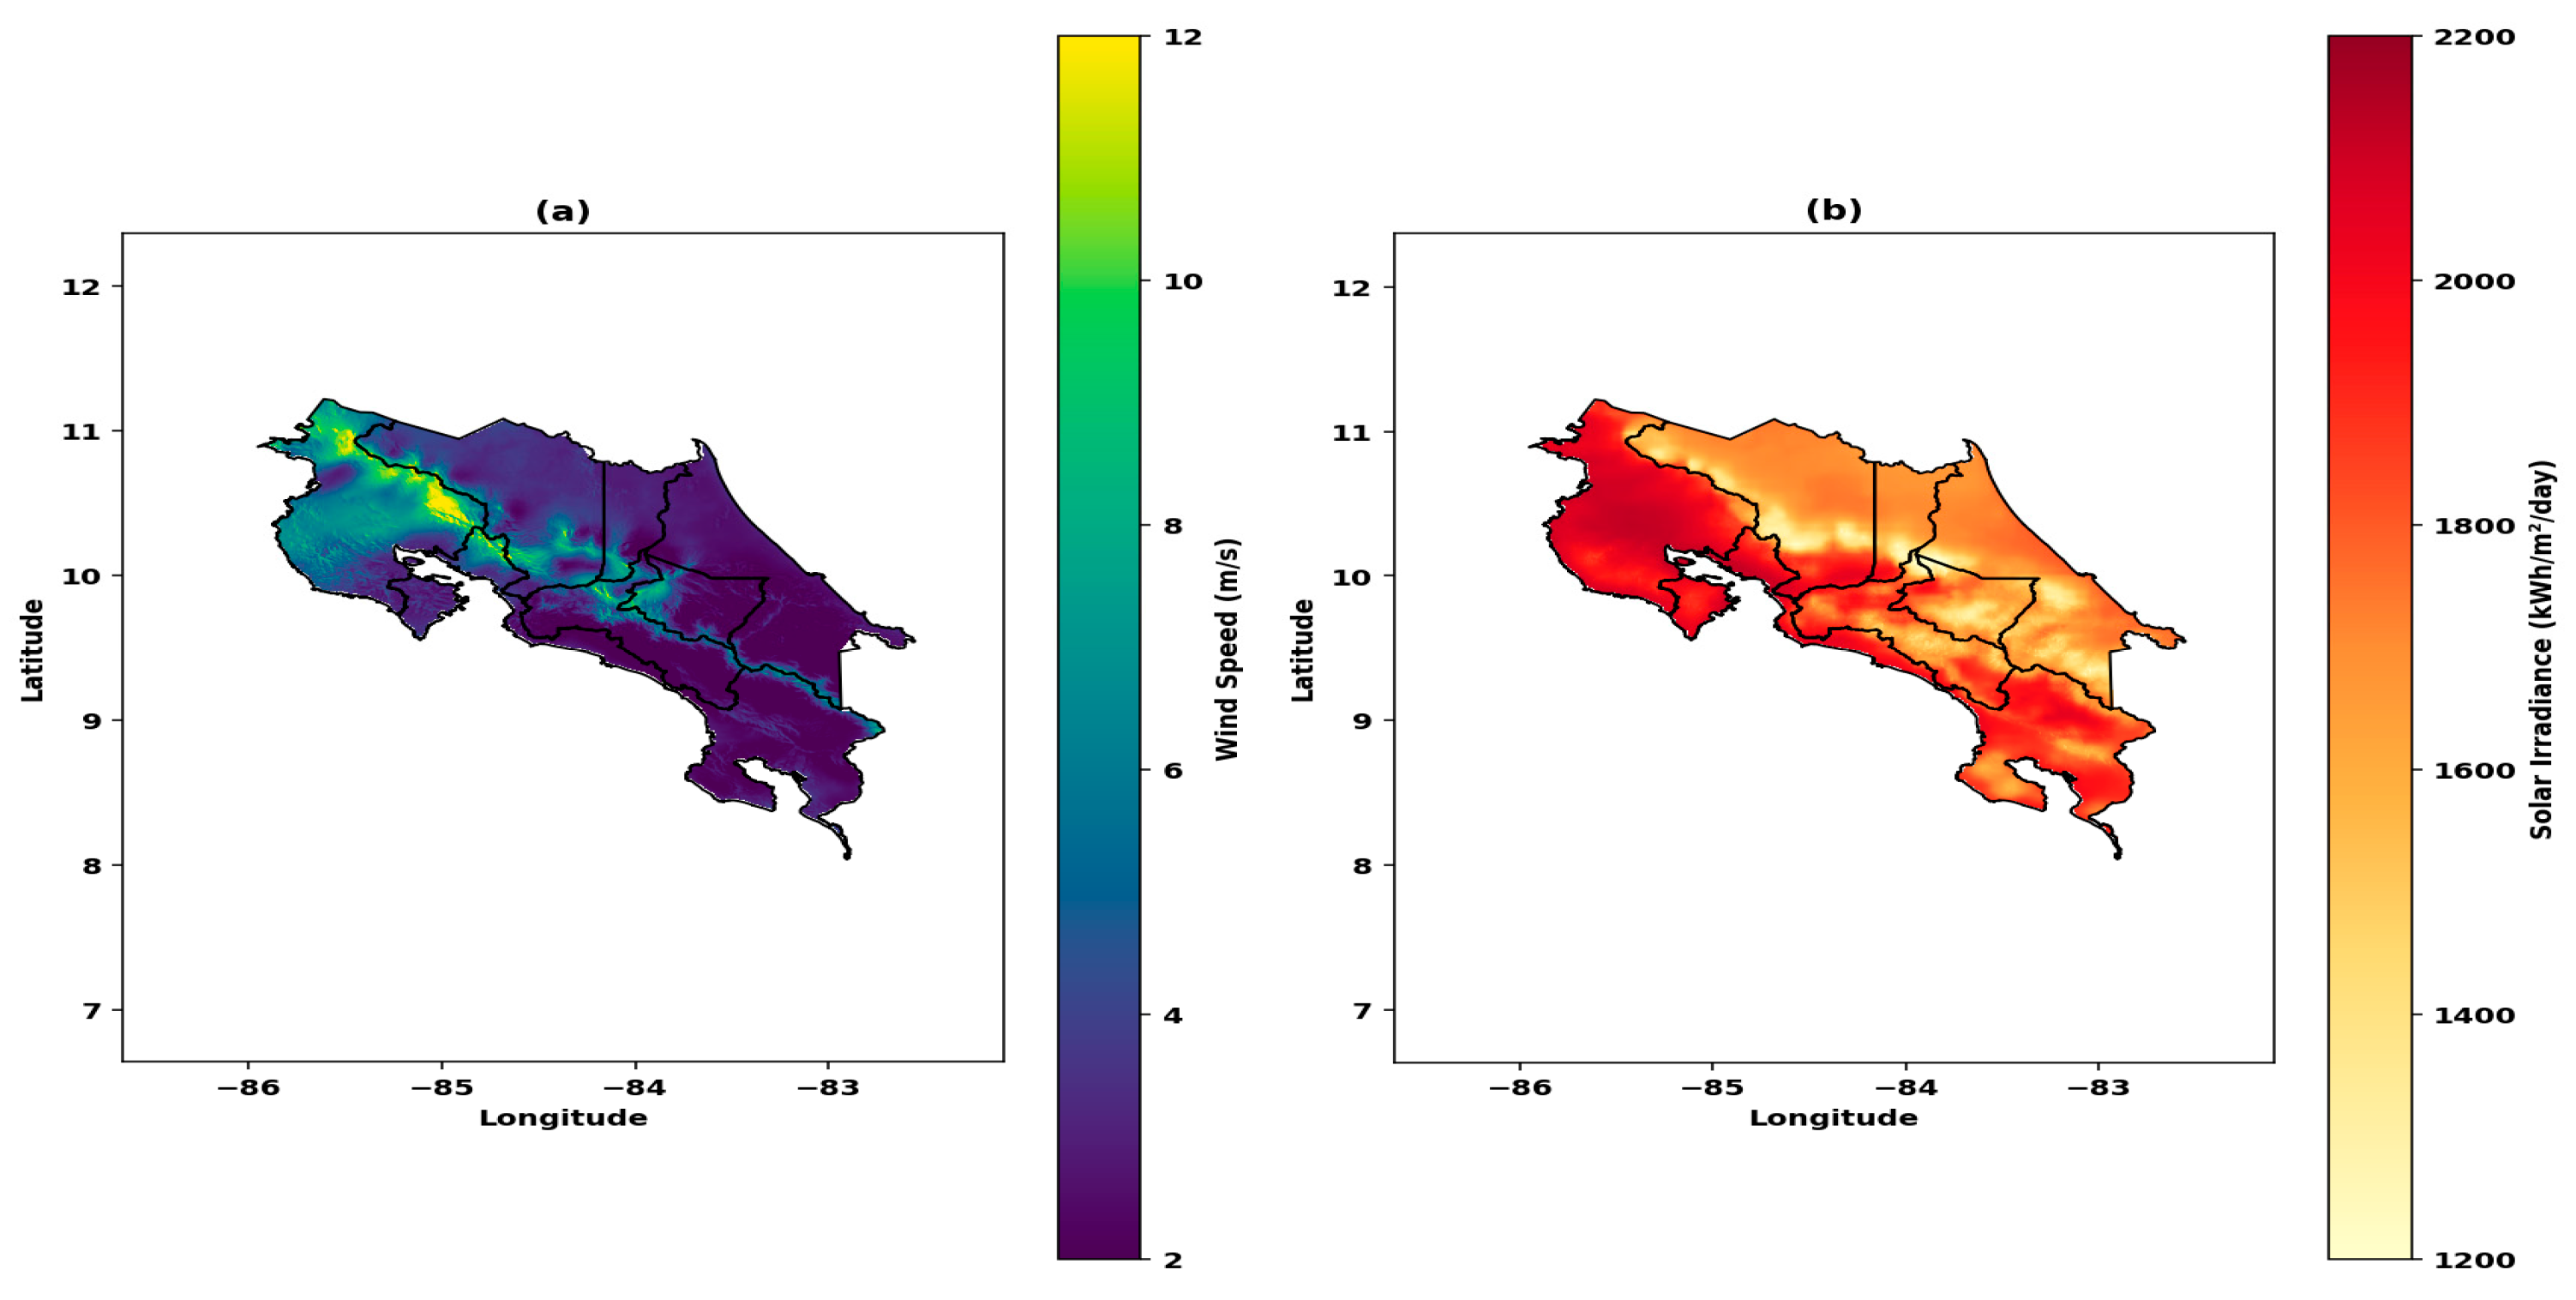
Figure 2.
Solar Potential (GHI) for England, Wales, Scotland, and Northern Ireland.
Figure 3.
Wind Speed (100m Height) for England, Wales, Scotland, and Northern Ireland.
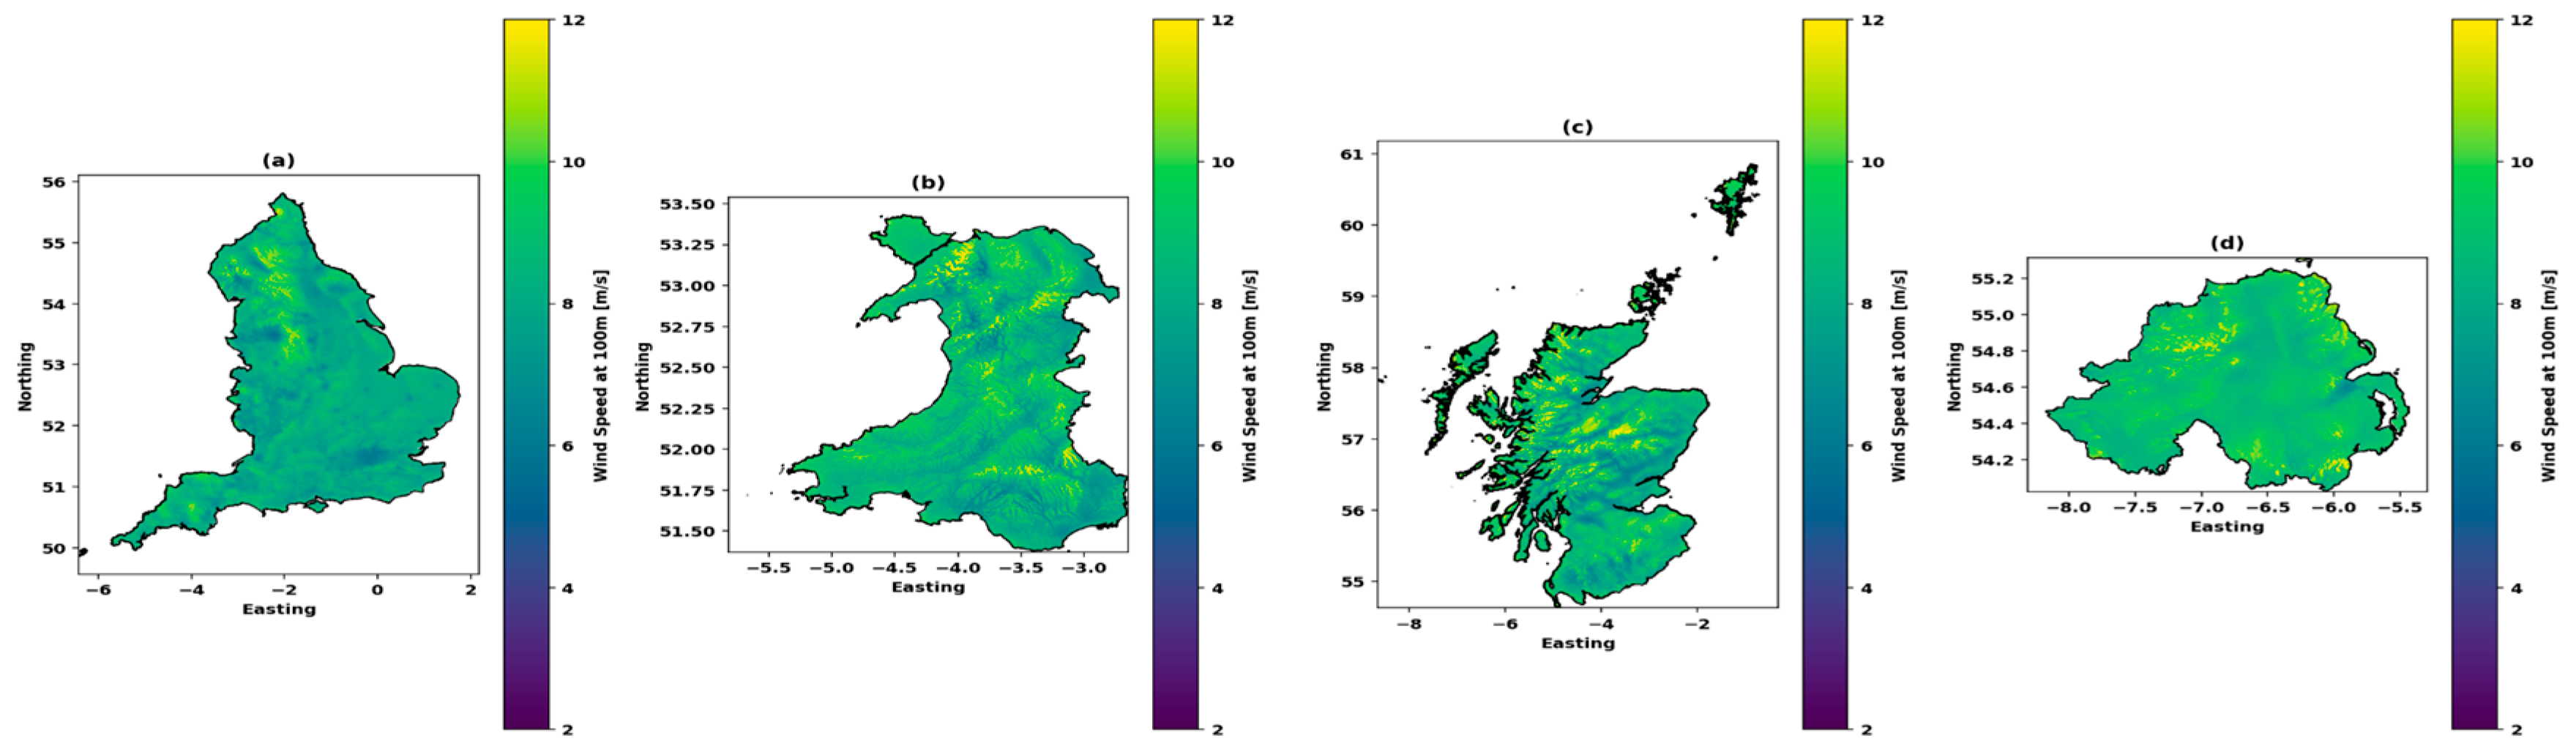
Figure 4.
LCOH Comparison for Costa Rica and the United Kingdom.
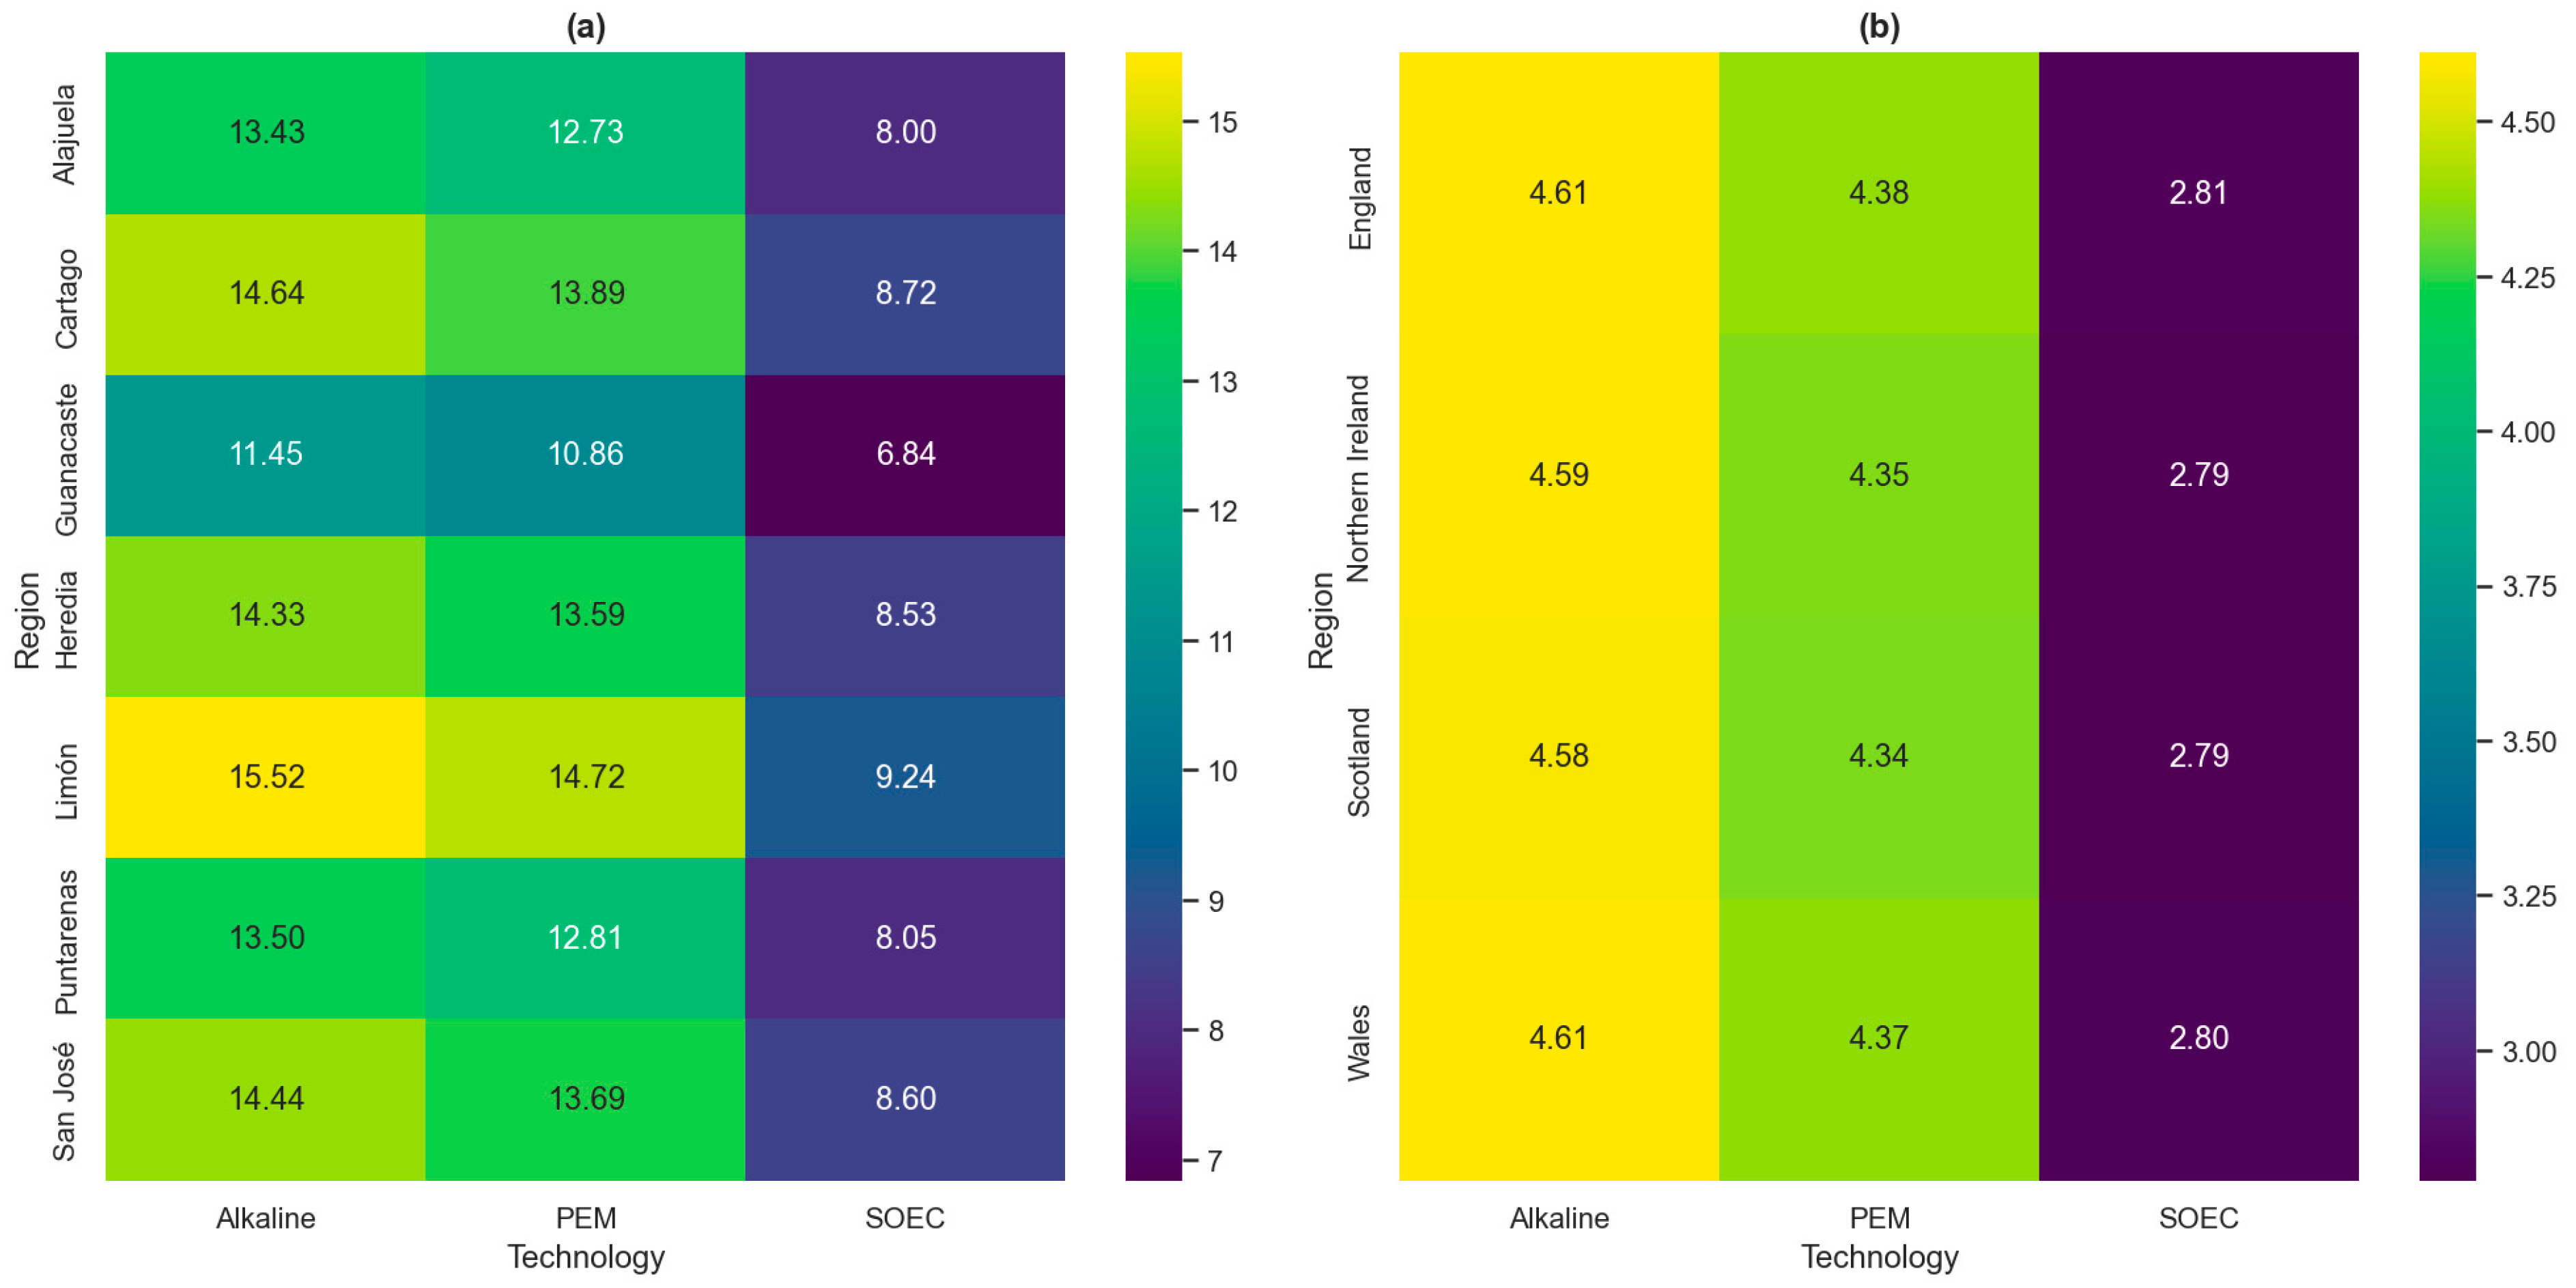
Figure 5.
Net Present Value (NPV) Comparison between Costa Rica and the United Kingdom.
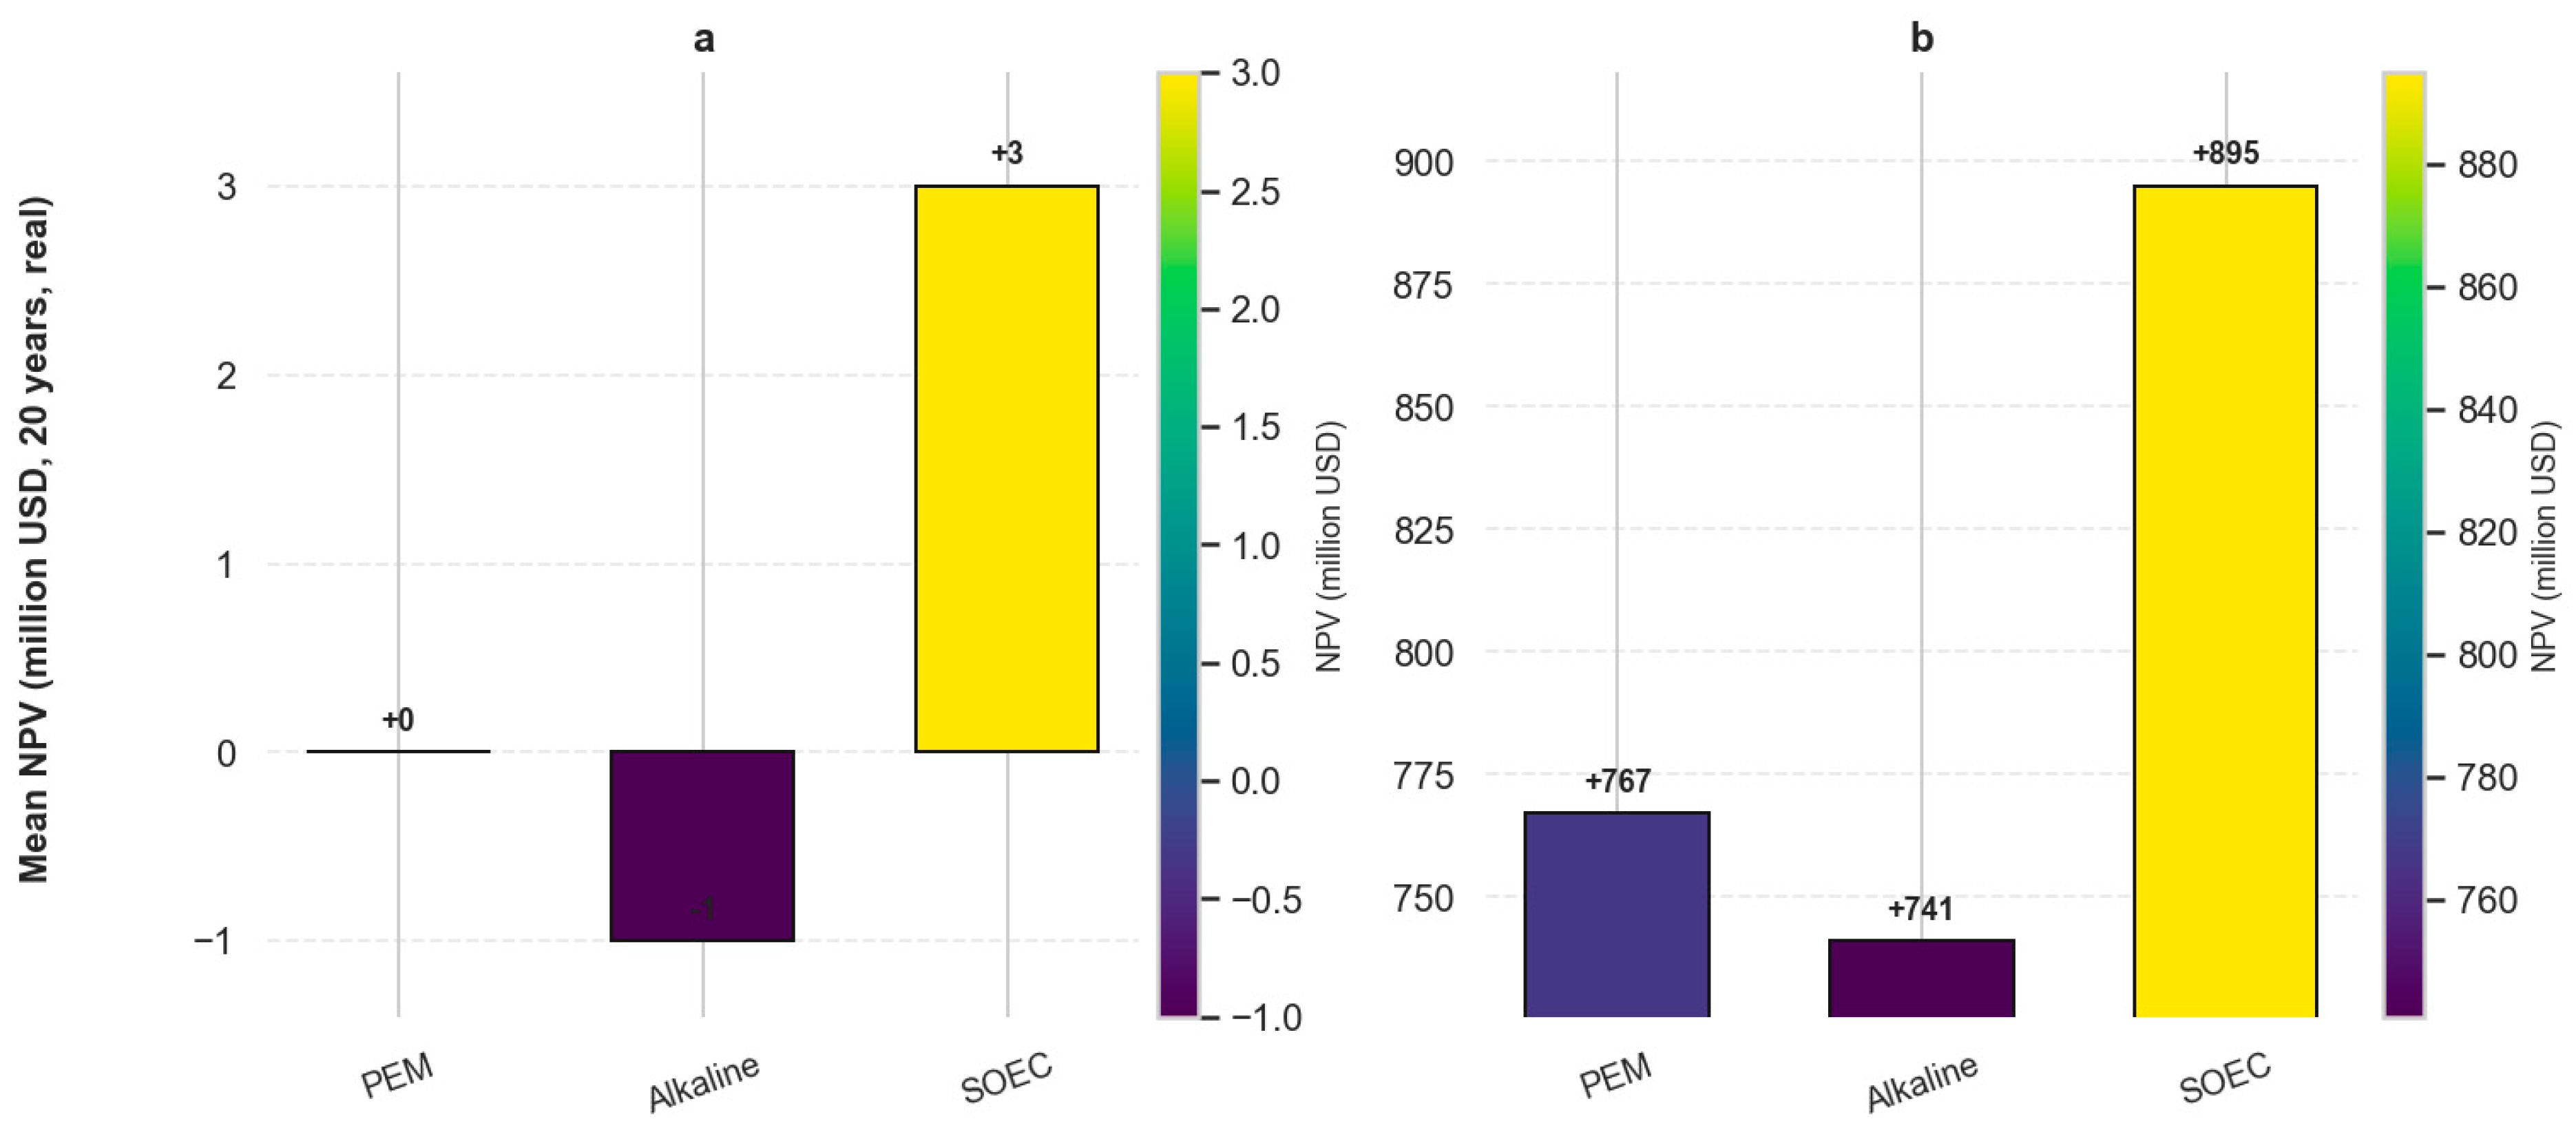
Figure 6.
Machine Learning Error Metrics Comparison for Costa Rica and the United Kingdom.
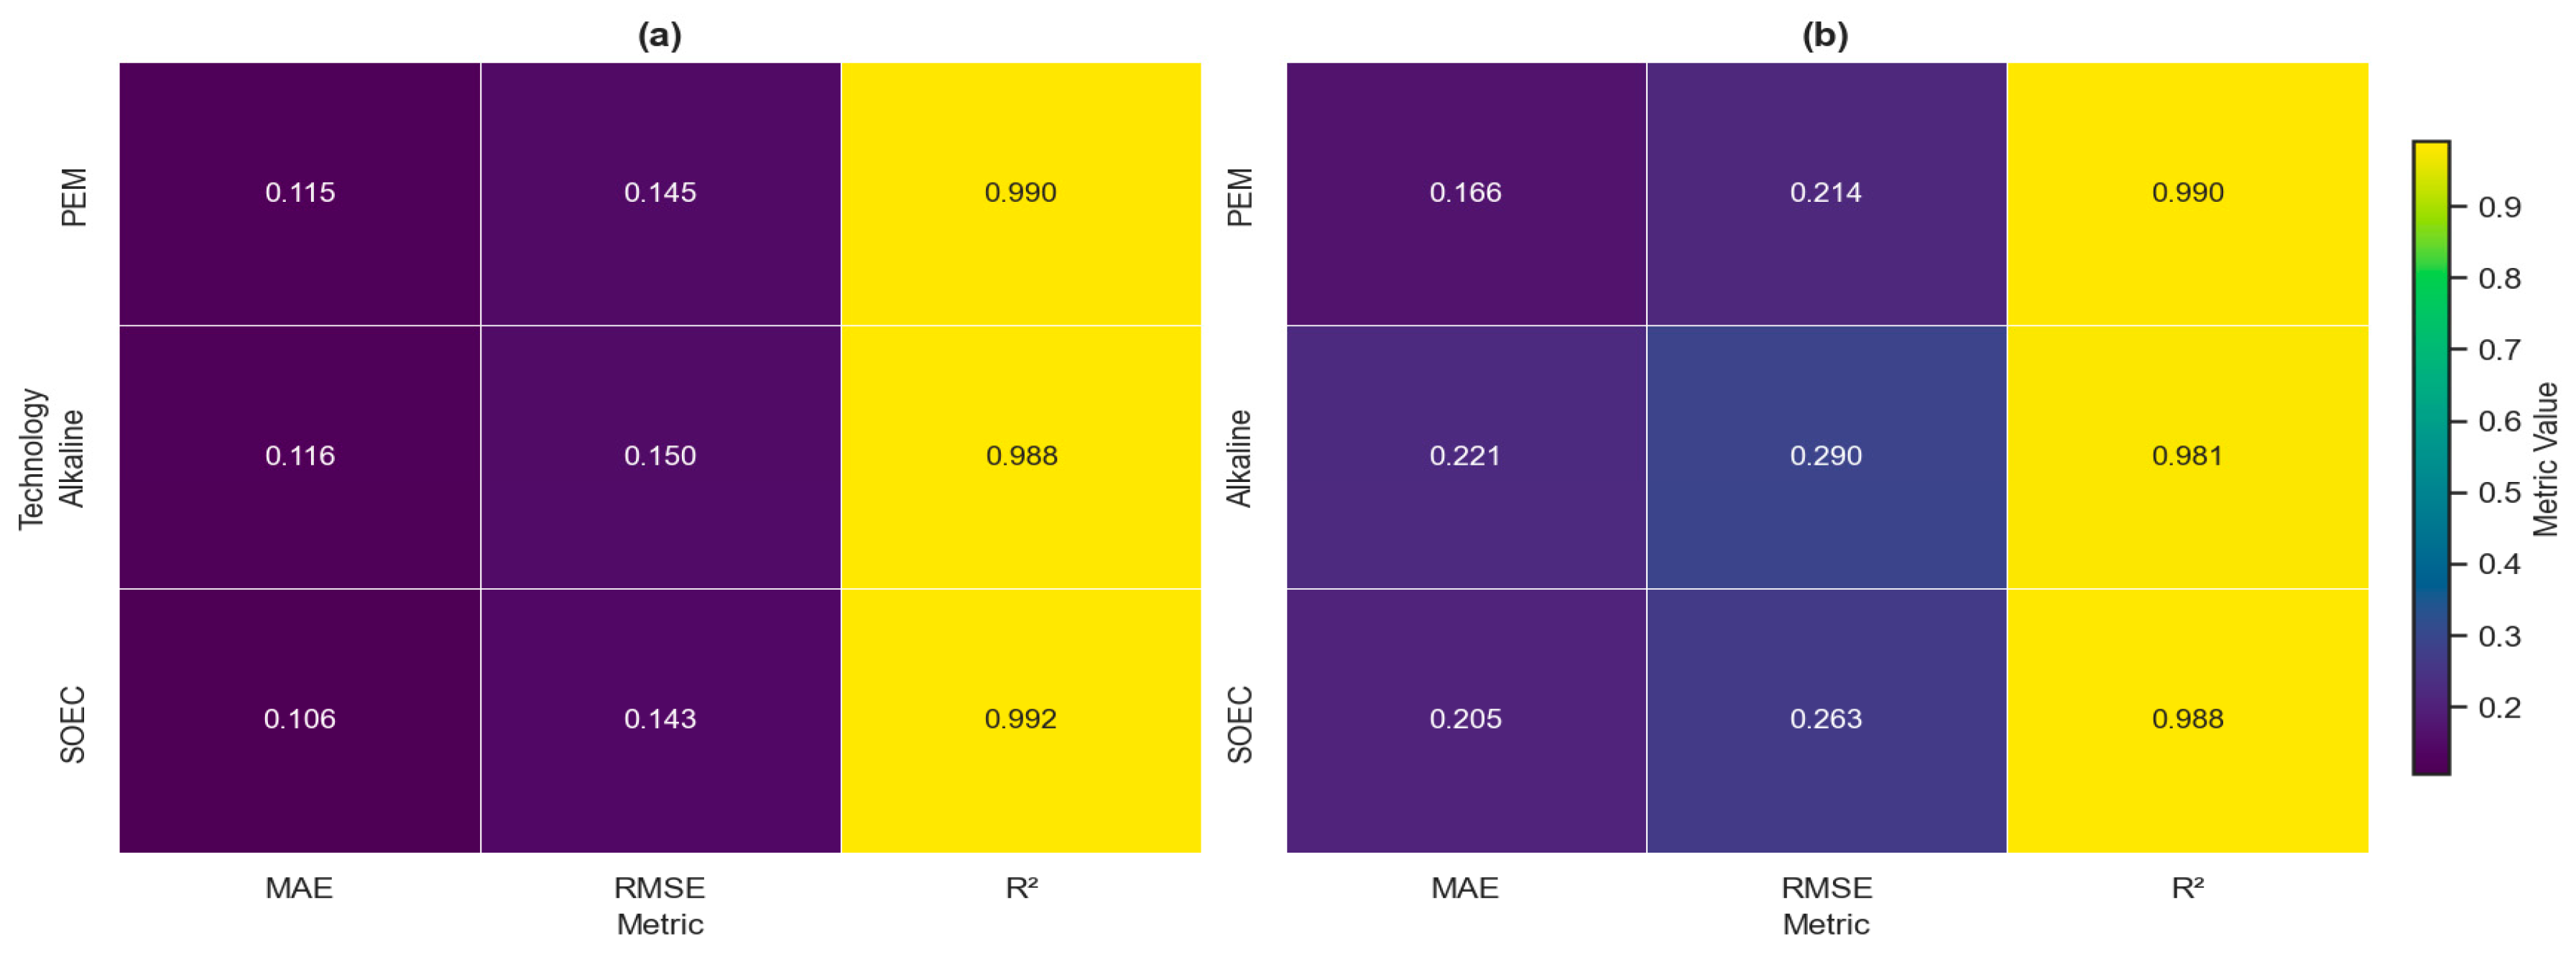
Figure 7.
Sensitivity Analysis of LCOH and NPV for Costa Rica and the United Kingdom.
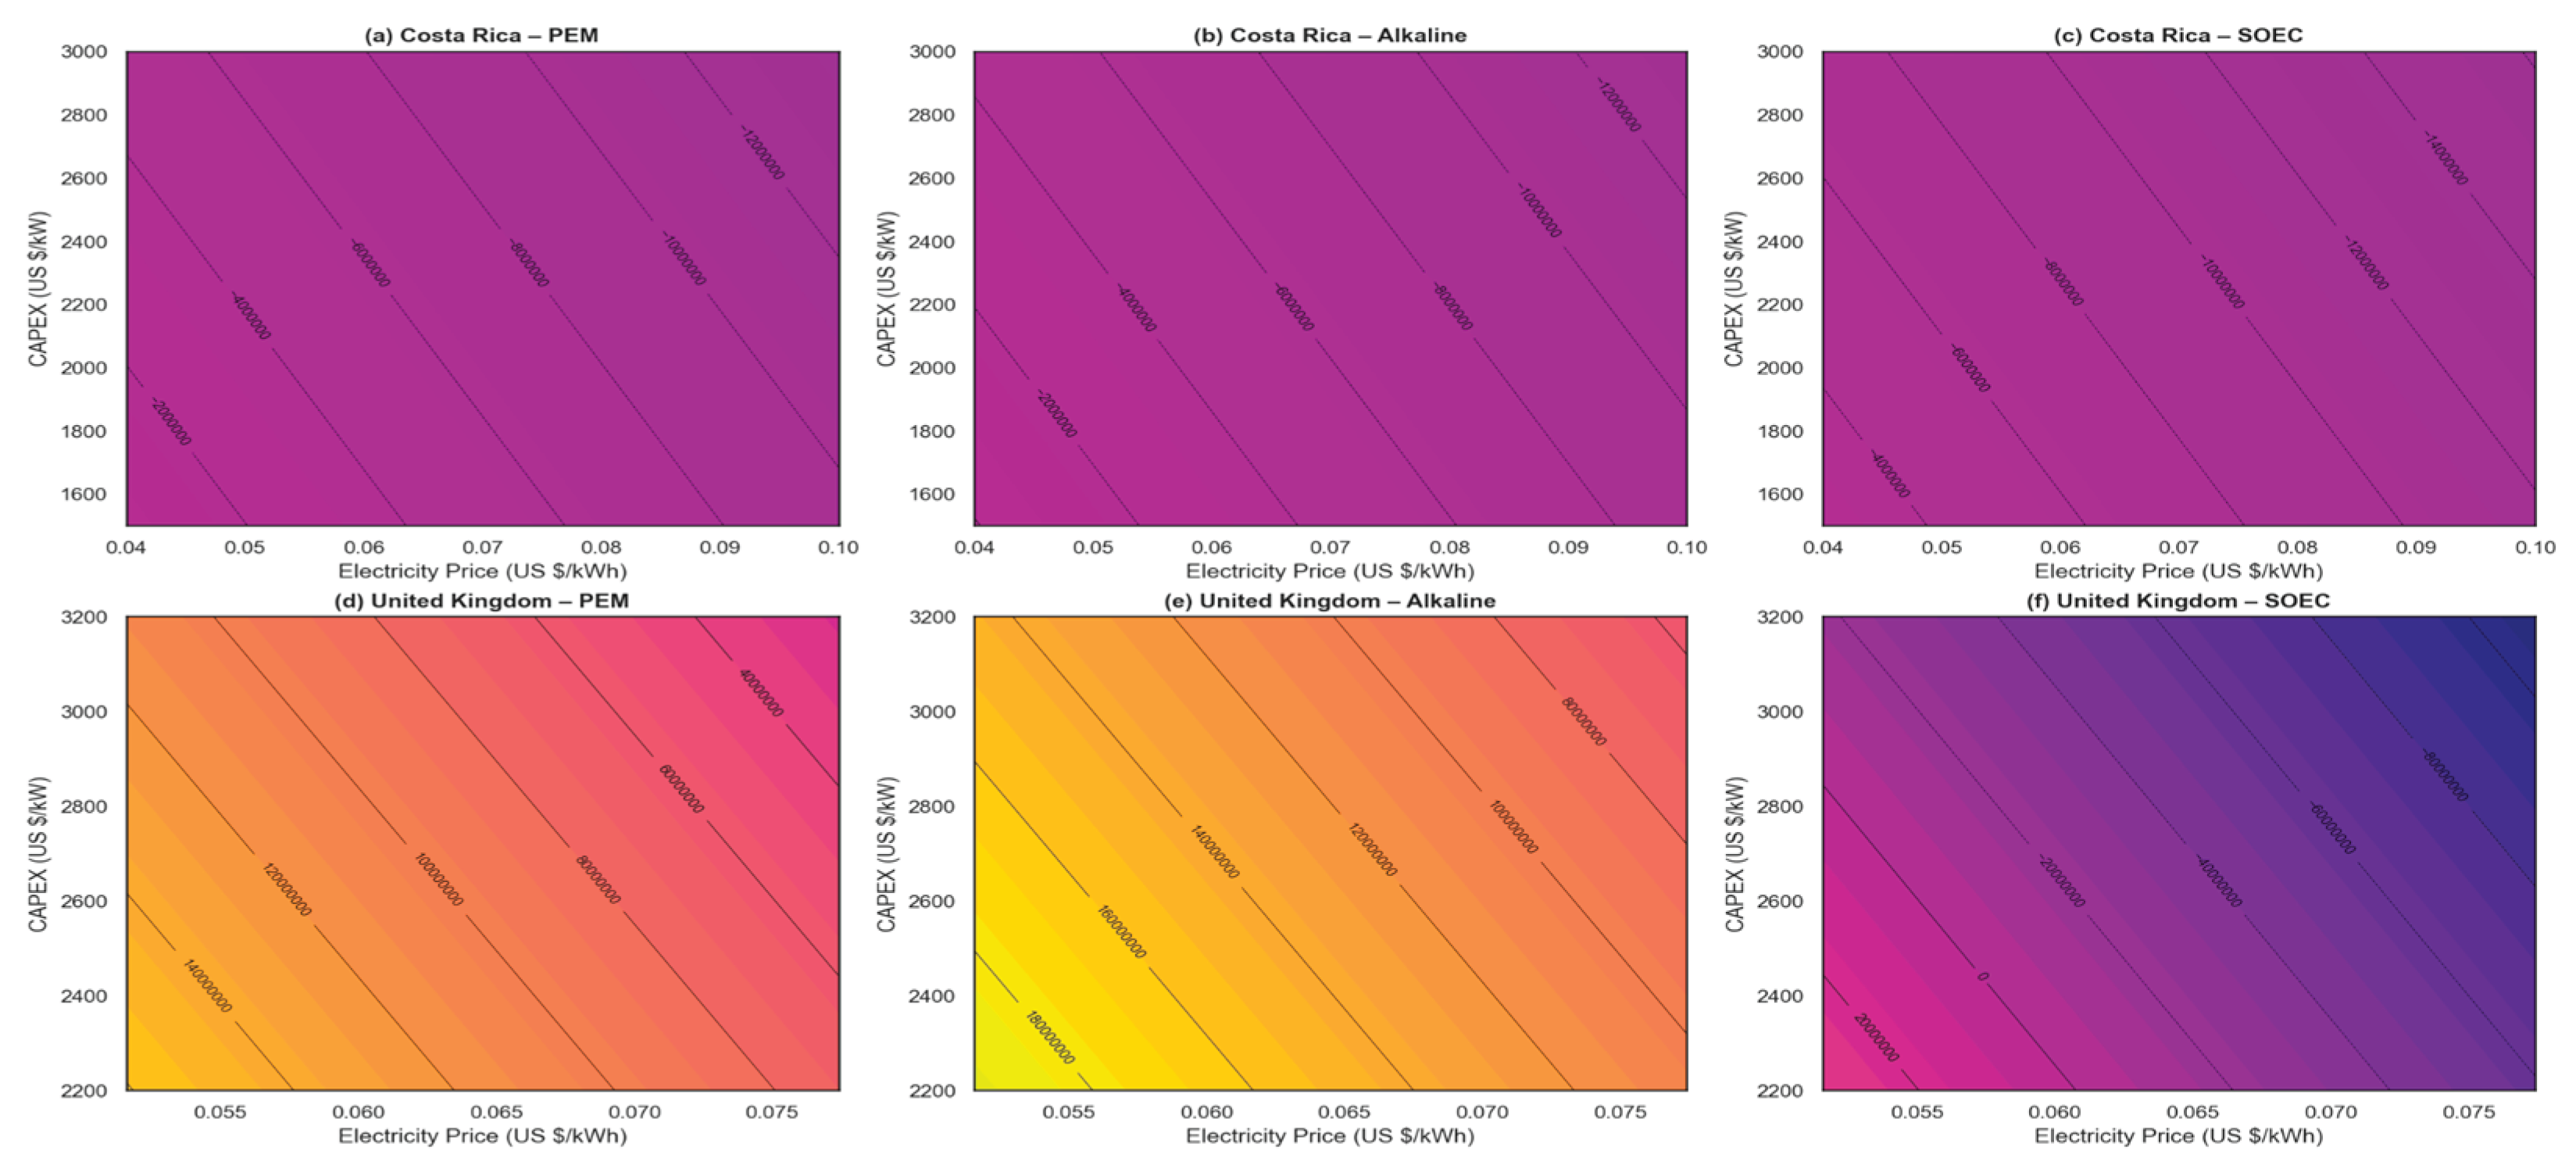

Table 1.
Key Quantitative Data for UK Hydrogen Production, Pricing, and Financial Modeling.
| Data type | Value/distribution in MC run | Reference |
|---|---|---|
| Wholesale H2 price 2025 – 2050 | 3.0 – 4.8 US $ kg−1 (≙ £112→£71 MWh−1) | UK Hydrogen Strategy (2021a) |
| CfD/HPBM strike premium | Triangular 5–7 US $ kg−1 (mode = 6) | DESNZ HPBM IA (2023) |
| Oxygen-gas credit | Log-normal μ = 2.51 US $ kg−1, σ = ±20% | GasWorld price index (2023) |
| Carbon credit (UK-ETS) | Log-normal μ = 0.50 US $ kg−1, σ = ±25% | UK-ETS Authority (2024) |
| Electricity tariff draw | 0.0516 – 0.0774 US $ kWh−1 (4–6 p/kWh) | UK Hydrogen Strategy (2021a) |
| Installed CAPEX 2025 | PEM/Alk 1 500 US $ kW−1; SOEC 1 900 US $ kW−1 | Lichner (2024); IEA (2024b) |
| CAPEX grant (Net-Zero Hydrogen Fund + GIGA) | 15% of EPC | DESNZ NZHF guidance (2024c) |
| Plant size & utilisation | 50 MW; 6 000 h y−1 (±5%) | Frontier HAR-1 data pack (2024) |
| Discount rate (real) | 6% | HM Treasury Green Book (2022) |
| Monte-Carlo runs | 1 000 | Custom Simulation |
Table 2.
Key Quantitative Data for Costa Rica Hydrogen Production, Pricing, and Financial Modeling.
| Category | Variable | Value/distribution in MC run | Reference |
|---|---|---|---|
| Fiscal incentives | Adjusted CAPEX grant | 15% write-down | MINAE (2025) |
| Revenue | H2 wholesale price | 3.0 – 4.0 US $ kg−1 | MINAE (2022) |
| Revenue | O2 credit (log-normal) | μ = 2.51 US $ kg−1, σ = 20% | Ad Astra, 2018 |
| Revenue | CO2 credit (log-normal) | μ = 0.30 US $ kg−1, σ = 30% | ICAO (2024) |
| Electricity | Tariff draw | 0.04 – 0.06 US $ kWh−1 | ICE (2022) |
| Electricity | OPEX electricity share | 70% of OPEX | Assumption |
| Electricity | Base price in deterministic LCOH | 0.15 US $ kWh−1 | Assumption |
| OPEX | OPEX subsidy | 10% reduction | MINAE (2025) |
| Technical | Plant size | 3 MWₑ; 300 kg H2 d−1 | Ad Astra, 2018 |
| Technical | Full-load hours | 4 000 h yr−1 ± 5% | Ad Astra, 2018 |
| Finance | Discount rate | 5% real | Assumption |
| Finance | Plant life | 20 years | Assumption |
| Simulation | Monte-Carlo draws | 1 000 iterations | Custom |
Disclaimer/Publisher’s Note: The statements, opinions and data contained in all publications are solely those of the individual author(s) and contributor(s) and not of MDPI and/or the editor(s). MDPI and/or the editor(s) disclaim responsibility for any injury to people or property resulting from any ideas, methods, instructions or products referred to in the content. |
© 2025 by the authors. Licensee MDPI, Basel, Switzerland. This article is an open access article distributed under the terms and conditions of the Creative Commons Attribution (CC BY) license (http://creativecommons.org/licenses/by/4.0/).
Copyright: This open access article is published under a Creative Commons CC BY 4.0 license, which permit the free download, distribution, and reuse, provided that the author and preprint are cited in any reuse.


