
Submitted:
27 March 2025
Posted:
31 March 2025
You are already at the latest version
Abstract
Background. The predominance of aerobic glycolysis over oxidative phosphorylation (the Warburg effect) is characteristic of almost all invasive forms of cancer. The specificity of cancer (especially metastatic) cell energy metabolism represents multiple targets for therapeutic intervention using glycolysis inhibitors. Although the transition of cells to the bloodstream (i.e., anchorage-independent growth) is an important step of the metastatic cascade, the question of the cytotoxic efficacy of glycolysis inhibitors against these cells remains largely open.
Methods. The cytotoxicity of 2-deoxy-D-glucose, sodium oxamate, metformin, cisplatin, and paclitaxel against high and low metastatic Lewis lung carcinoma cells during anchorage-independent growth (using polyHEMA coated plates) compared to anchorage-dependent growth was studied. The survival, proliferative activity, metabolic plasticity, and FTIR-ATR spectra of the sodium oxamate-resistant cells under different growth conditions were investigated
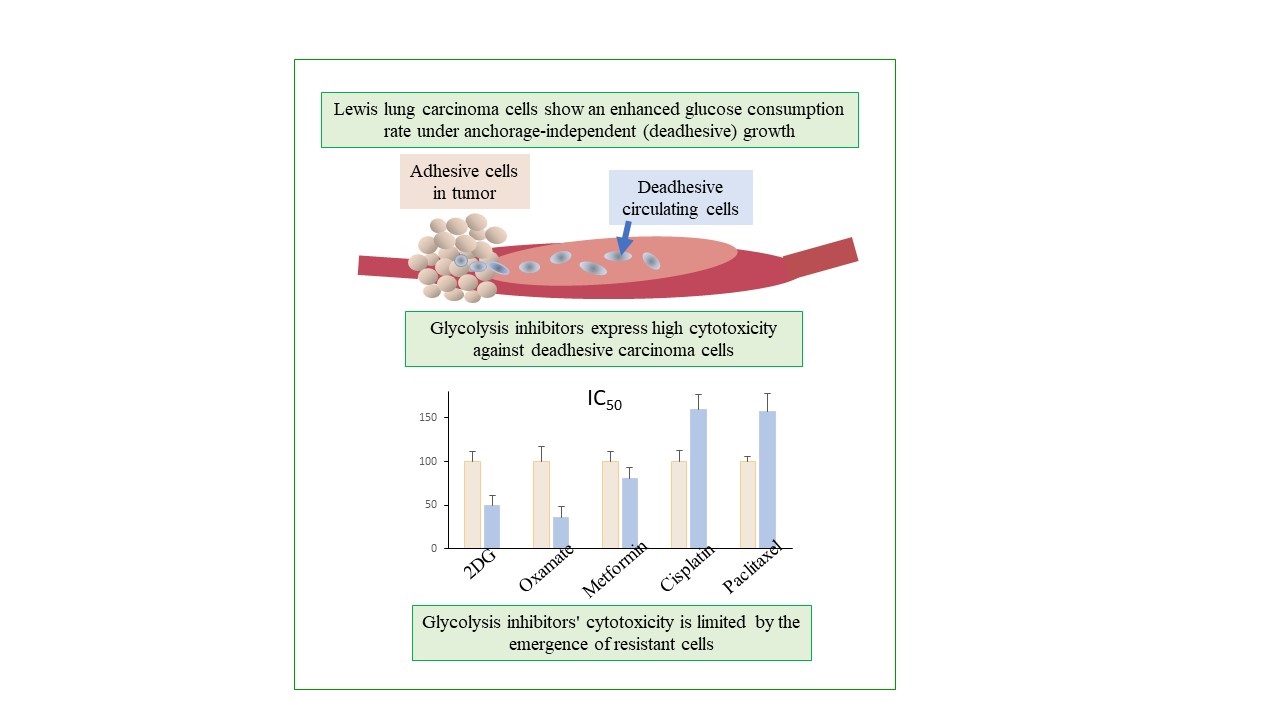
Results. Unlike cisplatin and paclitaxel (which are the basic drugs for the treatment of lung cancer) glycolysis inhibitors such as 2-deoxy-D-glucose and sodium oxamate exhibit high cytotoxicity against carcinoma cells during anchorage-independent growth (compared to anchorage-dependent growth), which correlates with an enhanced glucose consumption rate of these cells. The cytotoxicity of glycolysis inhibitors was shown to be limited by the emergence of resistant cells whose survival was maintained at low glucose consumption rates especially in cells under anchorage-independent growth, most likely due to their ability to activate glutaminolysis.
Conclusions. The enhanced cytotoxicity of glycolysis inhibitors against cells during anchorage-independent growth and the emergence of resistant cells, whose survival is presumably related to the activation of mitochondrial metabolism, indicates the potential antimetastatic efficacy of a combination of glycolysis and OXPHOS inhibitors
Keywords:
аnchorage-independent growth
; glucose consumption rate
; glycolysis inhibitors
; resistant cells
; Lewis lung carcinoma cells
1. Introduction
It is well known that high mortality among cancer patients is mainly caused by metastatic lesions in vital organs and tissues [1]. Unfortunately, the development of effective antimetastatic drugs lags significantly behind progress in creating medicinal treatments for suppressing the growth of the primary tumor. One of the reasons for this lag is the extremely complex and dynamic nature of the metastatic cascade, each stage of which depends on many factors that are often weakly interconnected (due to the constant change in the microenvironment of cancer cells during their spread in the body), which requires from a metastatic cell an exceptional metabolic and energetic plasticity, resistance to anoikis, active biosynthesis, and prevention of oxidative stress [2,3]. The latter is essential in the early stages of tumor cell dissemination, which is accompanied by the separation of cells from the extracellular matrix and a subsequent increase in intracellular ROS levels leading to irreversible damage to macromolecules in the cancer cell and its death, including apoptosis (induction of anoikis) [4].
It is known that the dominance of aerobic glycolysis over oxidative phosphorylation accompanies the development of virtually all invasive tumors, regardless of their origin (a phenomenon known as the Warburg effect) [5]. Such a specific modification of energy metabolism creates several advantages for the survival of tumor cells, providing them with the ability to produce energy and maintain a high level of anabolic processes even in the presence of a short-term or long-term deficiency of energy substrates [6]. Such reprogramming of energy metabolism manifests as cancer cell metabolic plasticity, which is a necessary (but perhaps insufficient) factor for cell survival during metastasis.
The metabolic features of cancer cells that promote their survival especially during metastasis represent multiple molecular and functional targets for therapeutic intervention aimed at their destruction using inhibitors of aerobic glycolysis [7,8]. However, the effectiveness of the cytotoxic/cytostatic action of such inhibitors may differ significantly among the cells at different stages of the metastatic cascade due to different accessibility to the main energy and metabolic substrates. Thus, the microenvironment of cells in the primary tumor significantly differs from the environment of circulating tumor cells, which may cause differences in their metabolic adaptation and, as a result, varying sensitivity to the action of the inhibitors. In addition, metastatic cells undergoing transition to the bloodstream (anchorage-independent growth) resist matrix detachment-induced apoptosis, and changes in cell metabolism can play a significant role in anoikis resistance.
In the current work, we investigated the cytotoxicity of glycolysis inhibitors 2-deoxy-D-glucose (2DG) and sodium oxamate, the OXPHOS inhibitor metformin, cisplatin, and paclitaxel (two basic drugs for the treatment of lung cancer) against high metastatic (LLC) and low metastatic (LLC/R9) cells of Lewis lung carcinoma under anchorage-independent (deadhesive growth type) and anchorage-dependent (adhesive growth type) growth and analyzed the factors affecting their effectiveness. Our research was directed toward antimetastatic therapy development based on energy metabolism inhibitors, targeting circulating metastatic cells as an important step in the metastatic cascade.
2. Results and Discussion
2.1. Cytotoxicity of 2DG, Sodium Oxamate Metformin, Cisplatin and Paclitaxel Against LLC and LLC/R9 Cells Under Adhesive and Deadhesive Growth
A progressive exponential decrease in the number of viable LLC cells (both under adhesive and deadhesive growth conditions) was recorded in a wide range of concentrations of the studied agents (Figure 1). However, significant differences between the nature of cytotoxic effects of glycolysis inhibitors compared to the oxidative phosphorylation inhibitor were noteworthy. The cytotoxicity of both 2DG and sodium oxamate against deadhesive cells was significantly higher than that against adhesive cells, which was not observed in the case of metformin. In particular, the IC50 values of 2DG in deadhesive cells were almost twice lower, and those of sodium oxamate were 3 times lower than the corresponding values in adhesive cells (Figure 1d). The higher efficiency of the cytotoxic action of glycolysis inhibitors against deadhesive cells correlated with the higher intensity of glycolysis compared to the adhesive growth type. Thus, GCR in deadhesive cells in the absence of inhibitors was 43% higher, and LPR was 53% higher compared to the corresponding indicators in adhesive cells (Figure 1e). At the same time, the cytotoxic efficiency of metformin in deadhesive and adhesive cells was the same.
The study of the cytotoxic effect of energy metabolism inhibitors on cells of the low metastatic variant of Lewis lung carcinoma (LLC/R9 cells) showed some differences compared to LLC cells. In particular, despite the 40% (p<0.05) higher level in glucose consumption by deadhesive cells compared to adhesive cells (Figure 2e), the sensitivity of both deadhesive and adhesive cells to the cytotoxic effect of 2DG was almost the same (Figure 2a,d). At the same time, the sensitivity of LLC/R9 cells to the cytotoxic effect of sodium oxamate under deadhesive growth conditions was extremely high (its IC50 was almost 3 times lower than that of adhesive cells) (Figure 2b,d). In contrast to the cytotoxic effect of metformin on LLC cells, which was the same for adhesive and deadhesive cells, the cytotoxic effect of metformin on deadhesive LLC/R9 cells was almost twice higher (based on IC50) compared to the effect on adhesive cells (Figure 2c,d). Such high effectiveness of metformin on deadhesive LLC/R9 cells is most likely associated with the deficiency of their mitochondrial system [9]. In addition, these cells under deadhesive growth conditions are characterized by more than 2 times higher intracellular ROS levels (compared to adhesive growth conditions and ROS levels in LLC cells) and a lower survival rate [9,10].
The heterogeneity of LLC and LLC/R9 cells (regardless of growth conditions) in terms of their sensitivity to the action of glycolysis inhibitors, which is manifested by the presence of sensitive (NS) and resistant (NR) cell subpopulations, is of particular interest (Figure 1d and Figure 2d). The increase in the cytotoxicity of 2DG and sodium oxamate against deadhesive LLC cells and sodium oxamate against deadhesive LLC/R9 cells was mainly due to the higher susceptibility of the sensitive subpopulation of these cells. The emergence of resistant cell subpopulations significantly limited the effectiveness of the cytotoxic action of glycolysis inhibitors. This was especially true for the cytotoxicity of sodium oxamate: the proportion of the LLC and LLC/R9 cell subpopulations resistant to its action was quite large (over 32%) and increased significantly in deadhesive cells (Figure 1d).
To assess the prospects of using energy metabolism inhibitors against cells under deadhesive growth conditions, we conducted comparative studies of the cytotoxic effect of antitumor agents cisplatin and paclitaxel (widely used in the chemotherapy of disseminated lung cancer) against LLC and LLC/R9 cells during anchorage-independent and anchorage-dependent growth. As can be seen in Figure 3 and Figure 4, the sensitivity of these cells under deadhesive growth conditions was significantly lower compared to that of adhesive cells. Thus, the IC50 values of cisplatin and paclitaxel against deadhesive cells of both variants were more than 50% higher than the corresponding values for adhesive cells. It should be noted that the paclitaxel-resistant subpopulation of LLC cells as well as LLC/R9 cells was quite large, which, in combination with the low cytotoxic efficiency of paclitaxel against deadhesive cells, may indicate the ineffectiveness of this agent against circulating metastatic non-small cell lung cancer cells [11,12].
So, the high rate of glucose consumption and the more pronounced sensitivity of deadhesive cells to the cytotoxic action of energy metabolism inhibitors (primarily glycolysis inhibitors) indicate the potential of their use as antimetastatic agents capable of suppressing the survival of circulating tumor cells. However, the presence of cells resistant to the cytotoxicity of glycolysis inhibitors could significantly limit the effectiveness of the cytotoxic action of glycolysis inhibitors and raises the question of the mechanisms that ensure the survival, proliferative activity, and metabolic plasticity of these cells under adhesive and deadhesive growth conditions. To further investigate possible mechanisms underlying the survival of cells resistant to the action of glycolysis inhibitors, we paid special attention to the oxamate-resistant subpopulation (but not the 2DG-resistant subpopulation) exclusively due to the large volume of the former.
2.2. Survival and Proliferative Activity of Sodium Oxamate-Resistant LLC Cells
To study the characteristics of sodium oxamate-resistant subpopulations, LLC cells were incubated for 1 day in a medium containing 40 mM sodium oxamate (experimental groups) and in a medium without sodium oxamate (control groups) under adhesive and deadhesive growth conditions. This sodium oxamate concentration resulted in the survival of LLC cells (during adhesive growth and especially deadhesive growth) that were sodium oxamate-resistant.
After 1 day of cell incubation with sodium oxamate at a concentration of 40 mM under adhesive growth conditions, the number of living cells was significantly reduced by almost 2 times (p < 0.002) compared to the control values, which strongly correlated with the IC50 value (Figure 5a). No significant changes in the cell cycle phase distribution of adhesive cells that survived after the action of sodium oxamate (mostly resistant to the inhibitor) were recorded (Figure 5e), which indicated the absence of a pronounced cytostatic effect of the inhibitor on resistant cells. A significant decrease in the number of viable cells under adhesive growth conditions was due to the cytotoxic effect of sodium oxamate, which was manifested as an almost 3-fold increase in the number of necrotic cells (Figure 5b) and an almost 10-fold increase in the percentage of apoptotic cells (Figure 5c).
Unlike adhesive growth conditions, the number of deadhesive cells that survived after a one-day incubation with sodium oxamate was almost 3 times lower compared to the control values (Figure 5a). This decrease in the number of viable cells was due to both the cytotoxic and cytostatic effects of sodium oxamate. At the same time, the cytotoxic effect was less pronounced than that observed under adhesive growth conditions. In particular, the number of necrotic cells under the influence of sodium oxamate increased by a factor of 2 (Figure 5b), and the percentage of apoptotic cells increased by a factor of 8 (Figure 5c). Meanwhile, a pronounced cytostatic effect of sodium oxamate on the deadhesive cells of the resistant subpopulation was recorded, which was manifested as a significant increase in the percentage of cells in the G2/M phase by 112% (p < 0.01) against the background of a slight decrease by 18% (p < 0.05) in the percentage of cells in the G1/G0 phase (Figure 5e).
2.3. The Effect of Sodium Oxamate on Intensity of Glycolysis in Sodium Oxamate-Resistant Cells
We have noted a significant difference in the effect of sodium oxamate on the level of ROS in resistant LLC cells under different growth conditions (Figure 5d). In particular, under adhesive growth conditions the level of ROS decreased by 40% (p < 0.01), while under deadhesive growth conditions, the intracellular level of ROS was significantly higher by 38.5% (p < 0.01) compared to that in cells without sodium oxamate exposure. Such differences in the effect of sodium oxamate on the level of ROS in LLC cells under different growth conditions may be partially related to its influence on the intensity of glycolysis (due to the inhibition of LDH activity, which is actively involved in the synthesis of enzymes of the antioxidant system), and its effect on the functioning of the electron transport chain of tumor cells (due to the ability of sodium oxamate to inhibit aspartate aminotransferase as well) [13].
One should pay attention to the fact that the levels of glucose and lactate in the incubation medium of cells under adhesive and deadhesive growth conditions without sodium oxamate were different (Figure 6a,b). In particular, under deadhesive growth conditions, the level of glucose in the incubation medium of cells was approximately 20% lower (p < 0.05) compared to that in the case of adhesive growth, which was due to a significantly higher GCR in deadhesive cells (by 43.4%, p < 0.05) compared to adhesive cells (Figure 6c). Interestingly, the LPR in deadhesive cells without sodium oxamate treatment did not differ from the indicator in adhesive cells (Figure 6d), although the concentration of lactate in the incubation medium of deadhesive cells was significantly lower than the corresponding indicator in adhesive cells. This may indicate a redirection of glucose to the oxidative branch of the pentose phosphate pathway, which is the main mechanism of NADPH generation [14]. The latter serves as an important cofactor for replenishing reduced glutathione - the most important antioxidant in the cell. Despite the high intracellular level of ROS that accompanied the transition to deadhesive growth, the activation of the antioxidant system ensured the high survival rate of deadhesive cells (which did not differ from the survival rate of adhesive cells).
Incubation with sodium oxamate led to an approximately 2.5-fold (p<0.05) decrease in GCR and a 13-fold decrease in LPR in adhesive cells, which could indicate the activation of the antioxidant system via redirection of consumed glucose to the PPP and the resulting decrease in the intracellular level of ROS (Figure 5d) and a higher survival rate of these cells after the action of sodium oxamate. The GCR of cells under deadhesive growth conditions after exposure to sodium oxamate was 9 times (p<0.001) lower than the control value and 2.6 times lower than the corresponding GCR in adhesive cells. The decreased GCR in the resistant subpopulation was most likely due to the ability of these cells to activate glutaminolysis in response to inhibition of glycolysis by sodium oxamate, which ensured their survival and determined their resistance to the action of the glycolysis inhibitor. Interestingly, despite of such a significant decrease in GCR under the influence of sodium oxamate in deadhesive cells, the rate of lactate production decreased 4-fold (p < 0.01) (although it remained at a fairly high level), which may be associated with the activation of LDHB, providing an additional mechanism for the survival of resistant cells. The reactivation of LDHB increases the intracellular level of pyruvate compared to that of sodium oxamate (the isosteric form of pyruvate) which is directed either to the lactate-pyruvate-lactate "minor cycle" or to the Krebs cycle [15].
2.4. FTIR-ATR Spectral Analysis of Sodium Oxamate-Resistant Cells
Due to the high specificity of vibrational spectra and their conformational sensitivity, infrared spectroscopy allows detecting differences in the secondary structure of biomolecules with an accuracy that is not available to other methods [16].
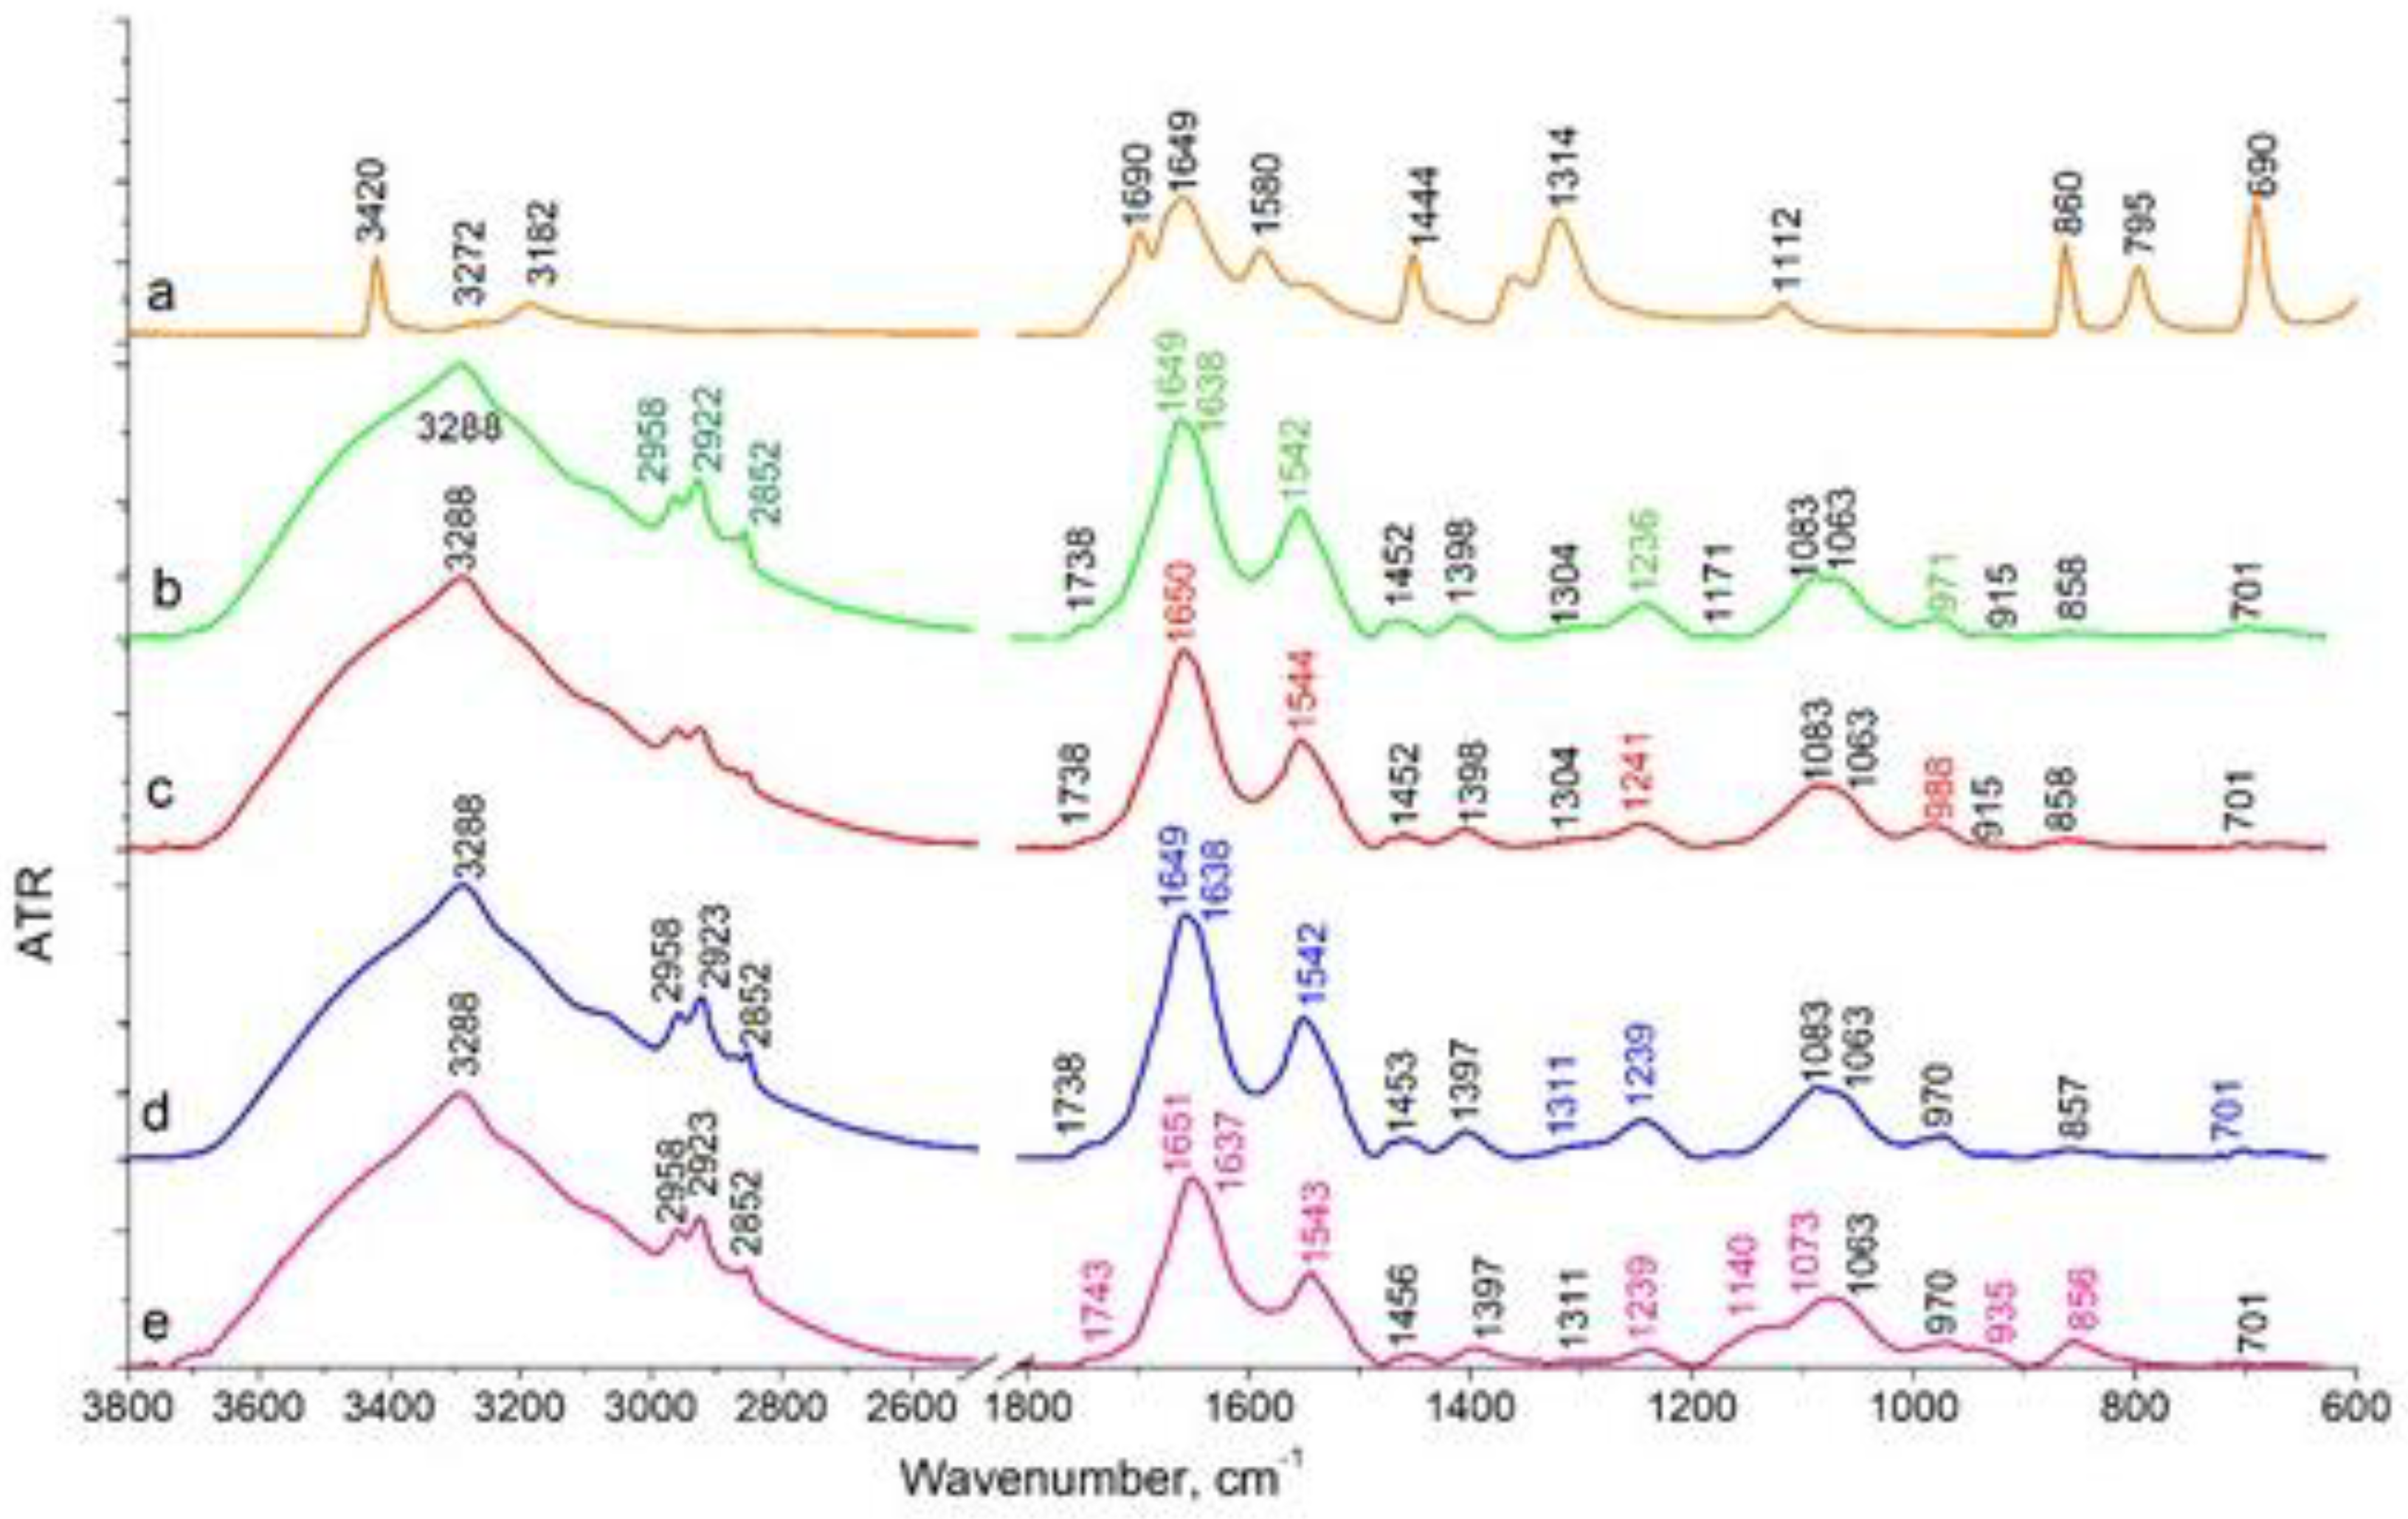
The effect of sodium oxamate on LLC cells during their adhesive growth (Figure 7b) was manifested as a decrease in the intensity of the stretching vibrations of CH3 (2958 cm-1, 2872 cm-1) and CH2 (2922 cm-1, 2852 cm-1), compared to cells not treated with sodium oxamate (Figure 7a). This spectral region is associated with the absorption of lipid components of the cell membrane. In the absorption region of the protein components, there was a decrease in the intensity of the Amides vibration maxima with their high-frequency shift (in the reference Amide I 1649 cm-1, Amide II 1542 cm-1, after sodium oxamate action Amide I 1650 см-1, Amide II 1544 cm-1). The position of the band of asymmetric stretching vibrations of the molecular group PO2- shifted to the high-frequency region from 1236 cm-1 to about 1241 cm-1 in cells after sodium oxamate action, along with a decrease in the intensity of this band. In C-O stretching vibrations region, a shoulder at 988 cm-1 was observed. Such spectral features correlated with the data on the decrease in the proliferative activity of cells under adhesive growth conditions and sodium oxamate action.
Different effects were observed in LLC cells under deadhesive growth conditions (Figure 7 c,d). No differences were observed in the stretching vibration region of hydrogen-bonded OH molecular groups (Amide A 3288 cm-1), in cells treated and not treated by sodium oxamate. In CH ring vibration region (Amide B 3069 cm-1) and stretching vibrations of CH3 (2958 cm-1, 2872 cm-1) and CH2 (2923 cm-1, 2852 cm-1) molecular groups, a slight redistribution of intensity was observed indicating the absence of changes in the cell membrane structure. In the absorption region of protein components (Amide I 1649 cm-1, Amide II 1542 cm-1), we observed a decrease in the intensity of these bands in cells after sodium oxamate action (Figure 7e). The Amide I band decreased approximately 1.3-fold, and that of the Amide II band decreased 1.5-fold compared to those in samples without sodium oxamate treatment. This allowed us to conclude on the effect of sodium oxamate on the cytoskeleton and protein components of the cells. The most significant spectral changes were observed in the region of stretching asymmetric (1239 cm-1) and symmetric (1083 cm-1) vibrations of the PO2- molecular group, which can be assigned mainly to nucleic acids and partially to phospholipids of the cell membrane. The intensity of the asymmetric vibrations of PO2- in cells treated with sodium oxamate decreased by 2.3 times. A shoulder at 1140 cm-1 appeared in the region of symmetrical vibrations of PO2-, which was not present in the reference, and the position of the maximum shifted from 1083 cm-1 in the reference to 1074 cm-1 in the sample of cells treated with sodium oxamate. This band in the 1140 cm-1 region could be attributed to C-O, C-O-P bonds indicating the possible association with the accumulation of specific metabolites in the cell, namely oligosaccharides and other sugars, which were not present in the untreated cells. It could also be assumed that inactive LDH complexes with sodium oxamate were formed and accumulated in the cell.
So, it could be concluded that the recorded spectral features and the decrease in the intensity of the bands corresponding to the protein and nucleic acid fractions reflected an inhibition of proliferative activity and survival of deadhesive cancer cells after treatment with sodium oxamate.
3. Conclusions
The study revealed (as far as we know for the first time) a higher glucose consumption rate by Lewis lung carcinoma cells with different metastatic potential under anchorage-independent growth conditions compared to anchorage-dependent growth conditions. Unlike cisplatin and paclitaxel (the basic drugs for the treatment of disseminated lung cancer), glycolysis inhibitors 2-deoxy-D-glucose and sodium oxamate exhibit a high cytotoxicity against carcinoma cells under anchorage-independent growth conditions. The cytotoxicity of the OXPHOS inhibitor metformin was independent of the glucose consumption rate but showed high efficacy against deadhesive Lewis lung carcinoma cells with a defective mitochondrial system. The cytotoxic efficacy of glucose inhibitors was limited by the emergence of a resistant subpopulation of cells whose survival was maintained at low glucose consumption rates, most likely due to their ability to transit from glycolysis to OXPHOS (however, this assumption should be experimentally verified). Since the deadhesive growth of metastatically active cells in vitro is considered an experimental model of circulating cancer cells, the results indicated the ability of 2DG and sodium oxamate to inhibit metastasis. At the same time, the survival of resistant cells, most likely due to the activation of mitochondrial metabolism, indicates the potential effectiveness of antimetastatic therapy against circulating cancer cells based on the combined use of glycolysis and OXPHOS inhibitors.
4. Materials and Methods
4.1. Cell Culture
The study used the cells of two Lewis lung carcinoma variants (LLC and LLC/R9) obtained from the Bank of Cell Lines from Human and Animal Tissues (Ukraine). Despite the fact that murine LLC and LLC/R9 cells are of the same genesis, they significantly differ in metastatic potential. Thus, the count and volume of pulmonary metastases in mice with transplanted LLC/R9 are 4 and 10 times (respectively) lower than those in animals with transplanted LLC [9]. These cells represent mouse non-small cell lung cancer models and are quite resistant to anti-cancer treatment.
LLC and LLC/R9 cells were maintained in RPMI 1640 incubation medium containing 10% fetal calf serum, 40 μg/ml gentamicin, and 2 mM L-glutamine at 37°C in a humidified atmosphere with 5% CO2.
4.2. Cytotoxicity Assay
The cytotoxicity of 2DG, sodium sodium oxamate, metformin, cisplatin and paclitaxel (Sigma-Aldrich, USA) was studied against LLC and LLC/R9 cells under anchorage-dependent (adhesive cells) and anchorage-independent (deadhesive cells) growth conditions. The cells of each cell line were seeded into the wells of a 96-well plate (1.3x10⁴ cells/well) and incubated for 18 hours under standard conditions. For deadhesive cell growth, 96-well plates coated with polyHEMA (Sigma, USA) were used [17]. After pre-incubation, a medium containing tested agents was added to the cells in progressively reduced concentrations; then the cells were incubated for 1 day. Each concentration of test agents was studied in 3 replicates. Cells incubated under the same conditions with the addition of fresh nutrient medium without inhibitors served as a control.
After 24 h of incubation with corresponding inhibitor, the number of viable cells (N) (expressed in % relative to the control) was assessed by crystal violet (Sigma-Aldrich, USA) staining using a Stat Fax 2100 plate spectrophotometer (Awareness Technology, USA) at a wavelength of 595 nm. The dependence of cancer cell survival on the concentration of inhibitor (C) was analysed using an exponential model
where NR and NS are the counts of cells (% of the total count) that are resistant and sensitive (correspondingly) to cytotoxic action of inhibitor; t is the indice of the sensitivity of sensitive cells to inhibitor cytotoxicity.
Using nonlinear regression analysis (Origin Pro, v.9.5), the model parameters of the cytotoxicity of the studied agents were determined from the best fit of the model (1) to experimental data on cell survival.
4.3. Study Design of Sodium Oxamate Resistance Cells
LLC cells were planted on 60 mm Petri dishes coated with polyHEMA solution (deadhesive growth conditions) and uncoated dishes (adhesive growth conditions) in the amount of 0.6×10⁶/dish. After 18 h of pre-incubation, the cells were incubated in a fresh medium without sodium oxamate (control) or with 40 mM sodium sodium oxamate followed by 24-hour incubation under standard conditions. The study was carried out in 4 replicates.
After 24 hours of incubation, the following cell characteristics were determined: total number of viable cells, cell cycle distribution, number of apoptotic cells, intracellular ROS level, glucose and lactate concentrations in the incubation medium, and attenuated total internal reflectance spectra.
4.4. Cell Cycle Distribution Analysis
To analyze the cell cycle distribution and to assess the number of apoptotic cells, LLC cells were resuspended in a hypotonic lysis buffer with 5 μg/ml of propidium iodide and RNAse (Sigma-Aldrich, USA) [18]. DNA content was analysed using a FACSCalibur flow cytometer (Becton Dickinson, USA) with an argon laser of 488 nm with a 582/42 nm filter. ModFit LT 3.0 program (BDIS, USA) was used for cell cycle distribution analysis.
4.5. ROS Level
To determine the intracellular ROS level, the cells were stained with 25 μM 2,7-dichlorofluorescein diacetate solution in RPMI 1640 medium without FCS at 370 C for 30 minutes and analyzed using a FACSCalibur flow cytometer (Becton Dickinson, USA) with a 488 nm argon laser and a 530/30 nm filter. At least 20,000 events per sample were analyzed [19].
4.6. Analysis of Glucose and Lactate Levels
Glucose and lactate levels in the incubation medium were measured with commercial kits (Global Biomarketing Group, Inc, USA) on ChemWell 2910 biochemical analyzer (Awareness Technology, USA) according to manufacturer's instructions.
The rate of glucose consumption (GCR) and lactate production (LPR) were calculated using the formulas shown below and expressed in 10-9 mmol/cell/day:
where concentrations of glucose and lactate at two consecutive days (ti and ti+1) of cell growth, are marked as Cgl(ti), Cgl(ti+1), CL(ti), CL(ti+1); N(ti) and N(ti+1) are the counts of LLC cells on corresponding consecutive days of growth; V is the volume of the incubation medium per well which was equal to 6×10⁻³ L.
4.7. FTIR-ATR Spectra
FTIR-ATR (attenuated total reflectance) spectra of LLC cells were recorded on a Bruker INVENIO-R spectrometer in the broad spectral range from 3800 to 600 cm-1 using the Bio-ATR attachment, which was developed by Bruker company specifically for the biological objects analyzis. In this case the achievable spectral resolution is 0.16cm-1. To record the spectra, cells under different growth conditions, both in the presence of sodium oxamate and without it, were washed from the culture medium with phosphate buffer and plated onto the working surface of the Bio-ATR attachment, then they were dried at room temperature in the cuvette chamber of the spectrometer under constant purge with nitrogen gas. Opus 8.2 software was used to process the spectra, and OriginPro 8.0 software was used to present the results.
4.8. Mathematical and Statistical Analysis
To analyze the experimental data, we have applied descriptive statistics, nonparametric Mann-Whitney test, and nonlinear regression analysis with the use of MS Excel, Microcal Origin (v. 9.5), and Statistica programs. The data are presented as M±SE, where М – mean value, SE – standard error. Statistically significant difference was considered when the adjusted p value was less than 0.05.
Author Contributions
All authors contributed to the study's conception and design. D. Kolesnik, I. Prokhorova, and Yu. Stepanov performed cell culture studies, data collection. O. Gnatyuk and G. Dovbeshko performed spectral registration and analysis. G. Solyanik performed data analysis and wrote the draft of the manuscript. All authors read and approved the final manuscript.
Funding
This study was supported by the National Research Fund of Ukraine (2021.01/0229) and by the National Academy of Sciences of Ukraine (0121U113838).
Institutional Review Board Statement
Not applicable.
Informed Consent Statement
Not applicable.
Data Availability Statement
The original contributions presented in this study are included in the article material. Further inquiries can be directed to the corresponding author.
Conflicts of Interest
The authors state no conflict of interest.
Abbreviations
| 2DG | 2-Deoxy-D-glucose |
| OXPHOS | Oxidative phosphorylation |
| LLC | High metastatic Lewis lung carcinoma cells |
| LLC/R9 | Low metastatic Lewis lung carcinoma cells |
| GCR | Glucose consumption rate |
| LPR | Lactate production rate |
| polyHEMA | Poly(2-hydroxyethyl methacrylate) |
| PPP | Pentose phosphate pathway |
References
- C.L. Chaffer, R.A. Weinberg, A perspective on cancer cell metastasis. Science 2011, 331, 1559–1564. [CrossRef] [PubMed]
- S.U. Khan, K. Fatima, F. Malik, H. Kalkavan, A. Wani, Cancer metastasis: Molecular mechanisms and clinical perspectives. Pharmacol. Ther. 2023, 250, 108522. [CrossRef]
- F. Sattari Fard, N. Jalilzadeh, A. Mehdizadeh, F. Sajjadian, K. Velaei, Understanding and targeting anoikis in metastasis for cancer therapies. Cell Biol. Int. 2023, 47 683–698. [CrossRef]
- S.U. Khan, K. Fatima, F. Malik, Understanding the cell survival mechanism of anoikis-resistant cancer cells during different steps of metastasis. Clin. Exp. Metastasis. 2022, 39, 715–726. [CrossRef] [PubMed]
- V.L. Payen, P.E. Porporato, B. Baselet, P. Sonveaux, Metabolic changes associated with tumor metastasis, part 1: tumor pH, glycolysis and the pentose phosphate pathway. Cell. Mol. Life Sci. 2016, 73, 1333–1348. [CrossRef]
- Barba, L. Carrillo-Bosch, J. Seoane, Targeting the Warburg Effect in Cancer: Where Do We Stand? Int. J. Mol. Sci. 2024, 25, 3142. [CrossRef]
- M.T.J. Halma, J.A. Tuszynski, P.E. Marik, Cancer Metabolism as a Therapeutic Target and Review of Interventions. Nutrients 2023, 15, 4245. [CrossRef] [PubMed]
- R. Bai, Y. Meng, J. Cui, Therapeutic strategies targeting metabolic characteristics of cancer cells. Crit. Rev. Oncol. Hematol. 2023, 187, 104037. [CrossRef]
- G.I. Solyanik, D.L. Kolesnik, I.V. Prokhorova, O.V. Yurchenko, O.N. Pyaskovskaya. Mitochondrial dysfunction significantly contributes to the sensitivity of tumor cells to anoikis and their metastatic potential. Heliyon 2024, 10(12), e32626. [CrossRef]
- Solomia Hnatiuk, Denys Kolesnyk, Galina Solyanik. Biochemical features of glycolysis in cancer cells with different metastatic potential. Low Temp. Phys. 2024, 50, 285–288. [CrossRef]
- Zdeněk Kejík, Robert Kaplánek, Petr Dytrych, Michal Masařík, Kateřina Veselá, Nikita Abramenko, David Hoskovec, Martina Vašáková, Jarmila Králová, Pavel Martásek, Milan Jakubek. Circulating Tumour Cells (CTCs) in NSCLC: From Prognosis to Therapy Design. Pharmaceutics 2021, 13, 1879. [CrossRef]
- Xiaoguang Yang, Dongxue Zhao, Yanfeng Li, Yanyu Li, Wei Cui, Yuxin Li, Han Li, Xinyu Li, Dun Wang. Potential monoamine oxidase A inhibitor suppressing paclitaxel-resistant non-small cell lung cancer metastasis and growth. Thorac Cancer. 2020, 11, 2858–2866. [CrossRef]
- J.M. Thornburg, K.K. Nelson, B.F. Clem, et al., Targeting aspartate aminotransferase in breast cancer. Breast Cancer Res. 2008, 10, R84. [CrossRef]
- Z.G. Movahed, M. Rastegari-Pouyani, M.H. Mohammadi, K. Mansouri, Cancer cells change their glucose metabolism to overcome increased ROS: One step from cancer cell to cancer stem cell? Biomed. Pharmacother. 2019, 112, 108690. [CrossRef]
- Ždralević M, Brand A, Di Ianni L, Dettmer K, Reinders J, Singer K, Peter K, Schnell A, Bruss C, Decking SM, Koehl G, Felipe-Abrio B, Durivault J, Bayer P, Evangelista M, O'Brien T, Oefner PJ, Renner K, Pouysségur J, Kreutz M. Double genetic disruption of lactate dehydrogenases A and B is required to ablate the "Warburg effect" restricting tumor growth to oxidative metabolism. J Biol Chem. 2018, 293, 15947-15961. [CrossRef]
- A. Poonprasartporn, K.L.A.Chan Live-cell ATR-FTIR spectroscopy as a novel bioanalytical tool for cell glucose metabolism research. Biochim Biophys Acta Mol Cell Res. 2021, 1868, 119024. [CrossRef]
- M. Lee, A. Jo, S. Lee, J.B. Kim, Y. Chang, J.Y. Nam, H. Cho, Y.Y. Cho, E.J. Cho, J.H. Lee, S.J. Yu, J.H. Yoon, Y.J. Kim, 3-bromopyruvate and buthionine sulfoximine effectively kill anoikis-resistant hepatocellular carcinoma cells. PLoS One 2017, 12, e0174271. [CrossRef]
- R.M. Babes, I.T. Tofolean, R.G. Sandu, O.E. Baran, V. Cosoreanu, M.T. Ilie, A.I. Duta, M.C. Ceausescu, P.M. Ciucur, S. Costache, C. Ganea, I. Baran, Simple discrimination of sub-cycling cells by propidium iodide flow cytometric assay. Cell Cycle. 2018, 17, 766–779. [CrossRef]
- H. Wang, J.A. Joseph, Quantifying cellular oxidative stress by dichlorofluorescein assay using microplate reader. Free Radic. Biol. Med. 1999, 27, 612–616. [CrossRef]
Figure 1.
Number of viable LLC cells (in % to the control) as a function of 2DG (a), sodium oxamate (b), and metformin (c) concentrations; lines – the best fit of mathematical model; symbols – experimental data. Model parameters of the inhibitor cytotoxicity (d). Glucose consumption rate (GCR) and lactate production rate (LPR) of LLC cells under adhesive (white columns) and deadhesive (grey columns) growth conditions (e). * - differences between corresponding values of the adhesive and deadhesive cells are significant.
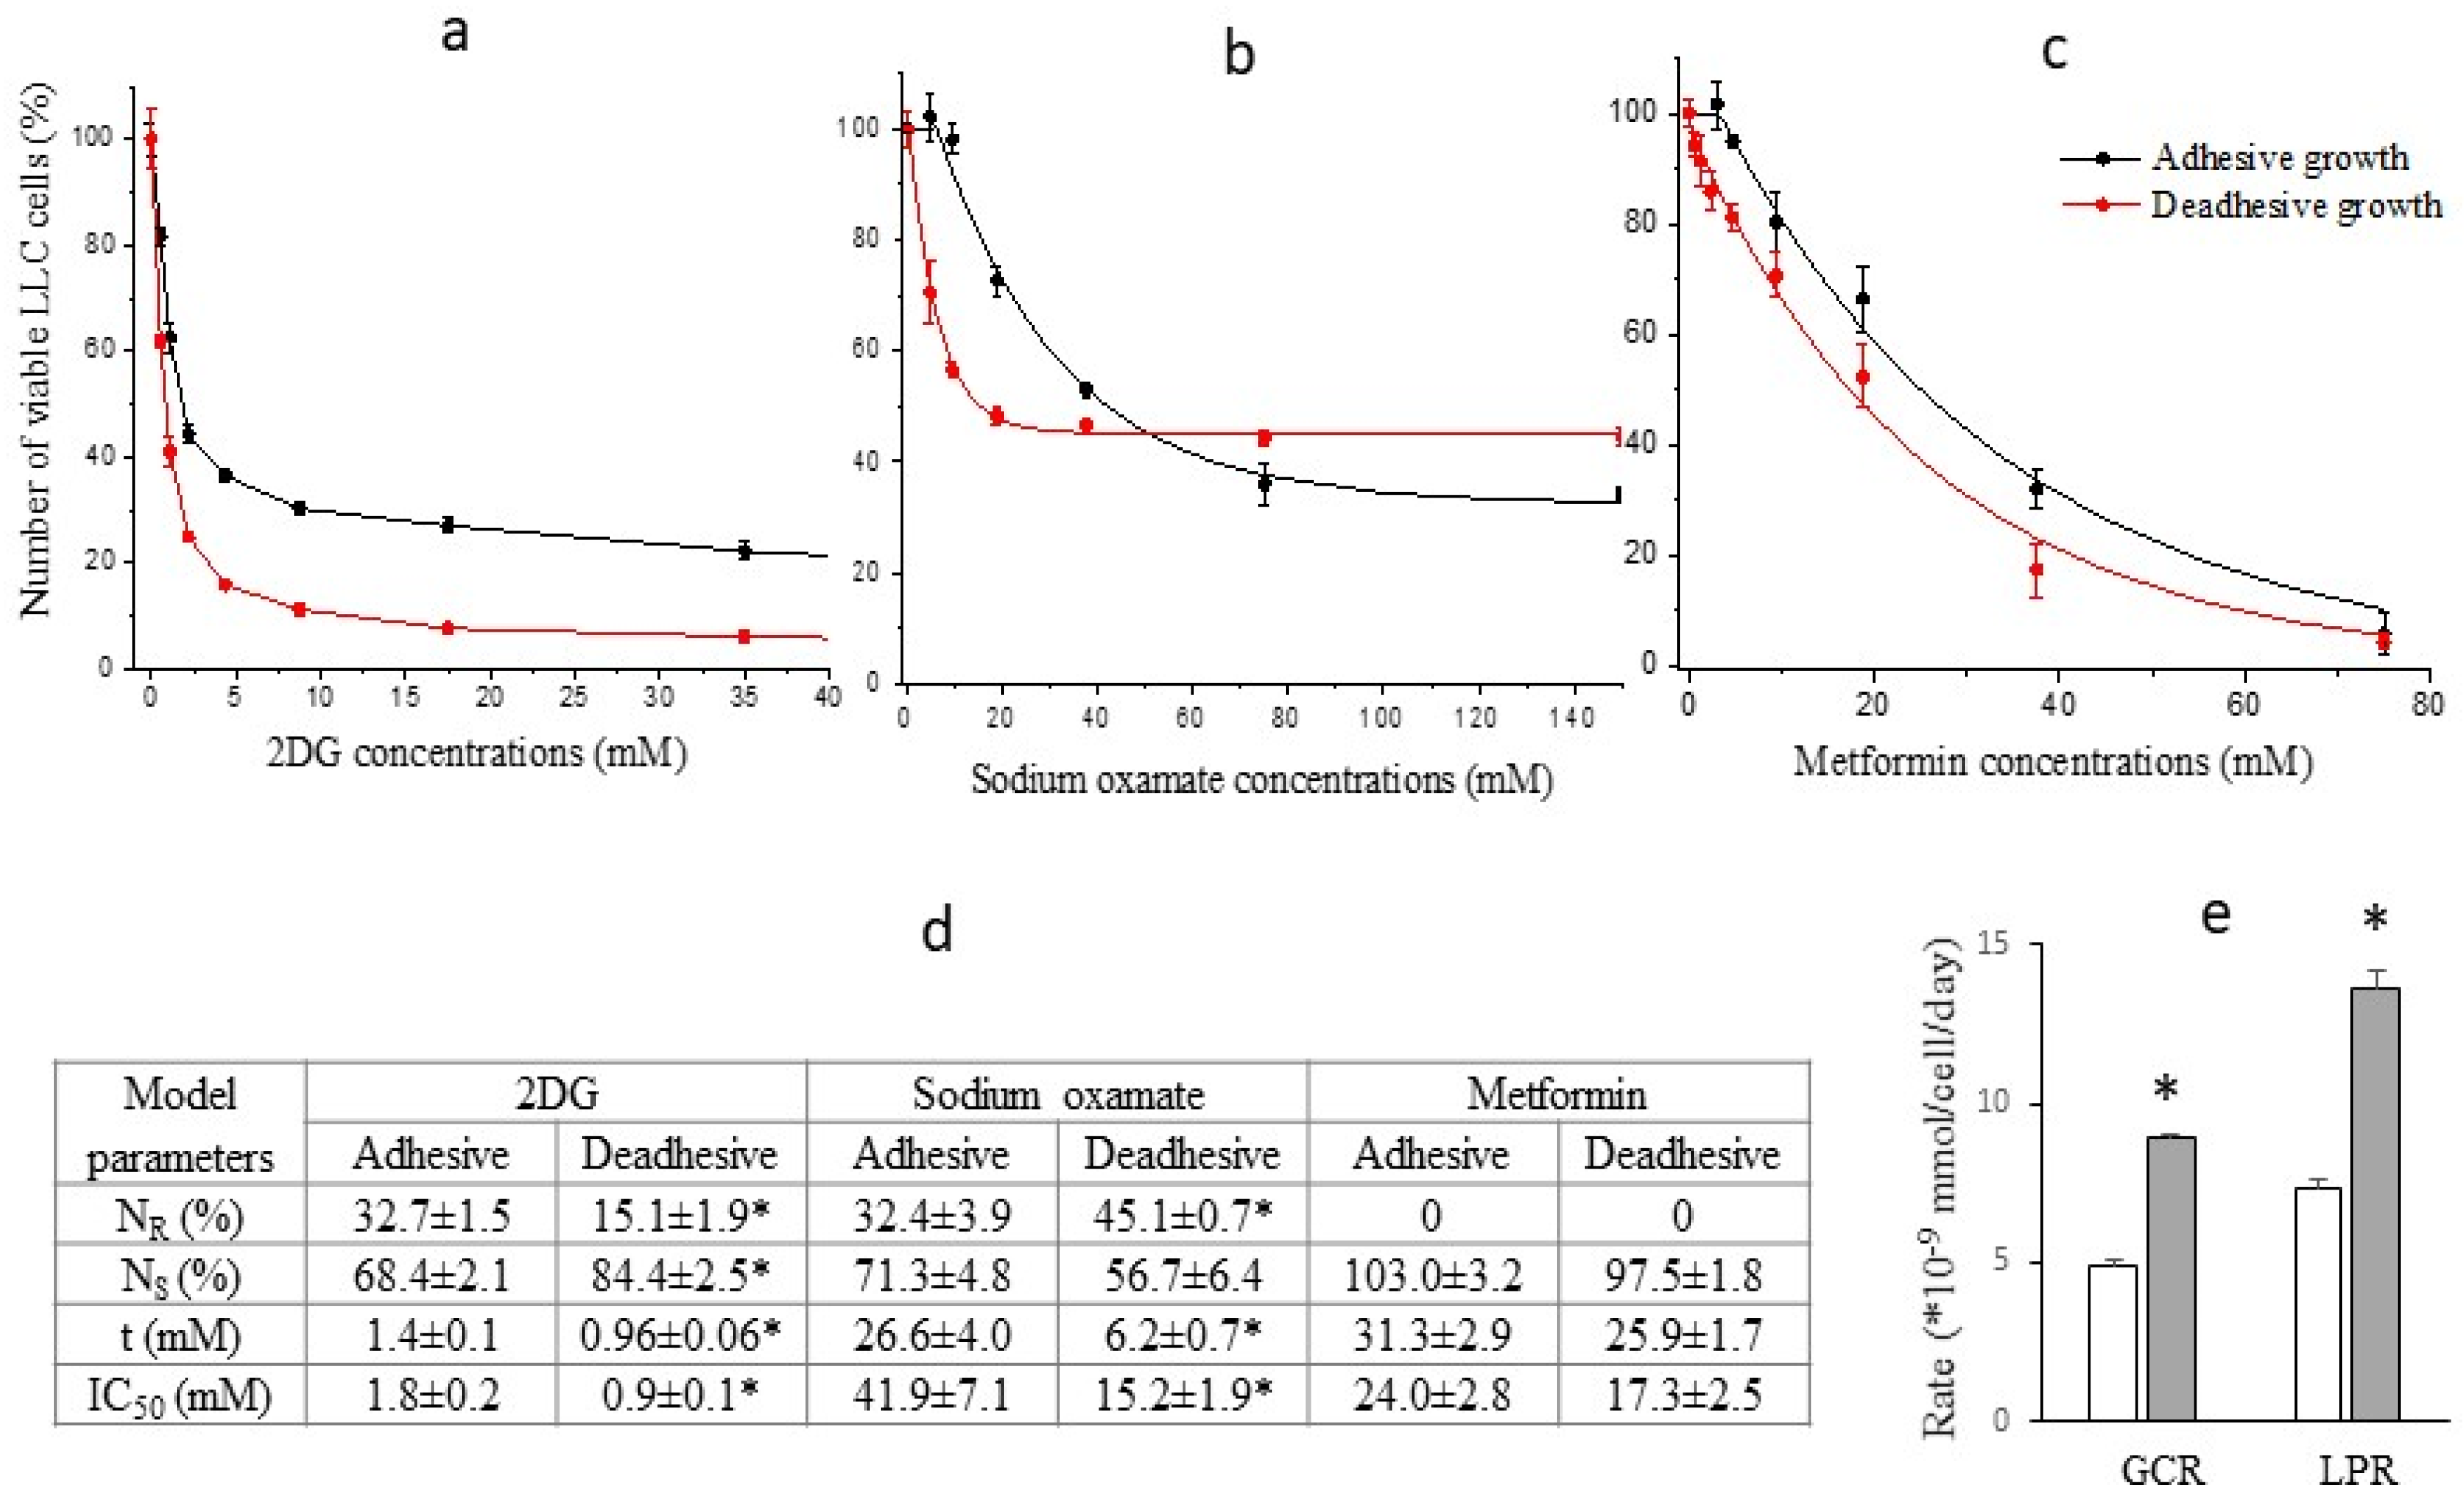
Figure 2.
Number of viable LLC/R9 cells (in % to the control) as a function of 2DG (a), sodium oxamate (b), and metformin (c) concentrations; lines – the best fit of mathematical model; symbols – experimental data. Model parameters of the inhibitor cytotoxicity (d). Glucose consumption rate (GCR) and lactate production rate (LPR) of LLC/R9 cells under adhesive (white columns) and deadhesive (grey columns) growth conditions (e). * - differences between corresponding values of the adhesive and deadhesive cells are significant.
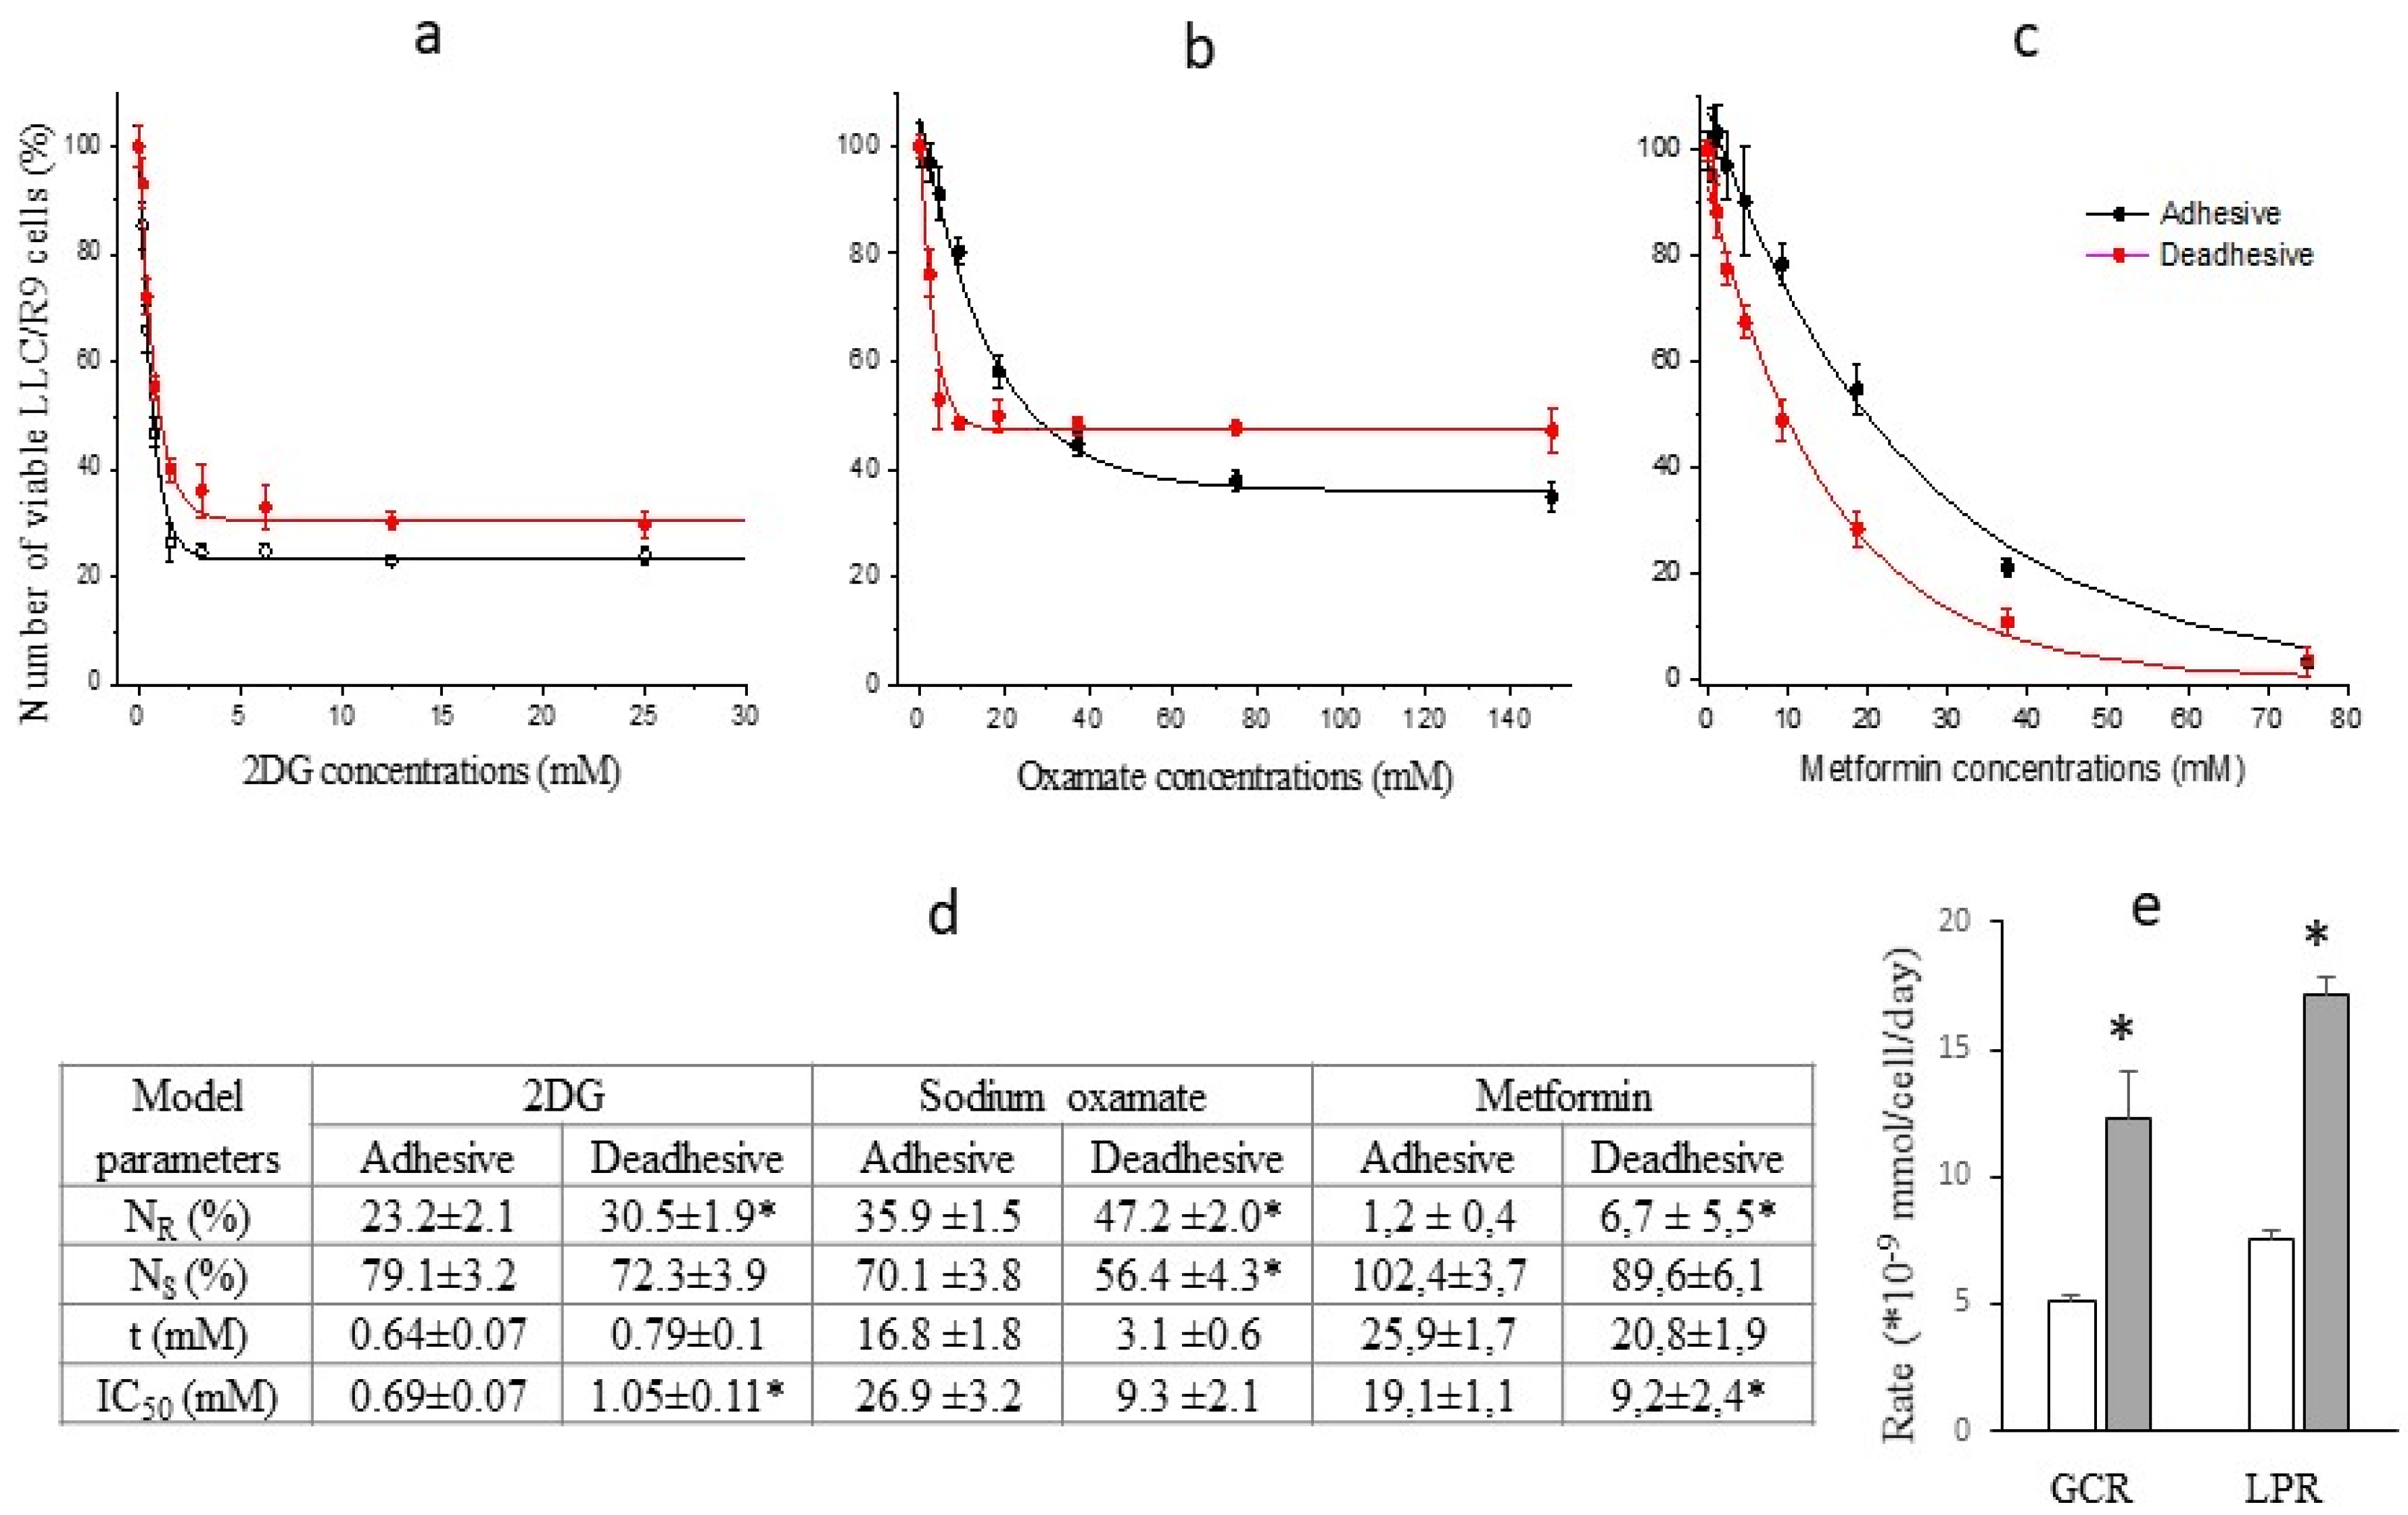
Figure 3.
Number of viable LLC (a) and LLC/R9 (b) cells (in % to the control) as a function of cisplatin concentrations; lines – the best fit of mathematical model; symbols – experimental data. Model parameters of cisplatin cytotoxicity (c). * - differences between corresponding values of the adhesive and deadhesive cells are significant.
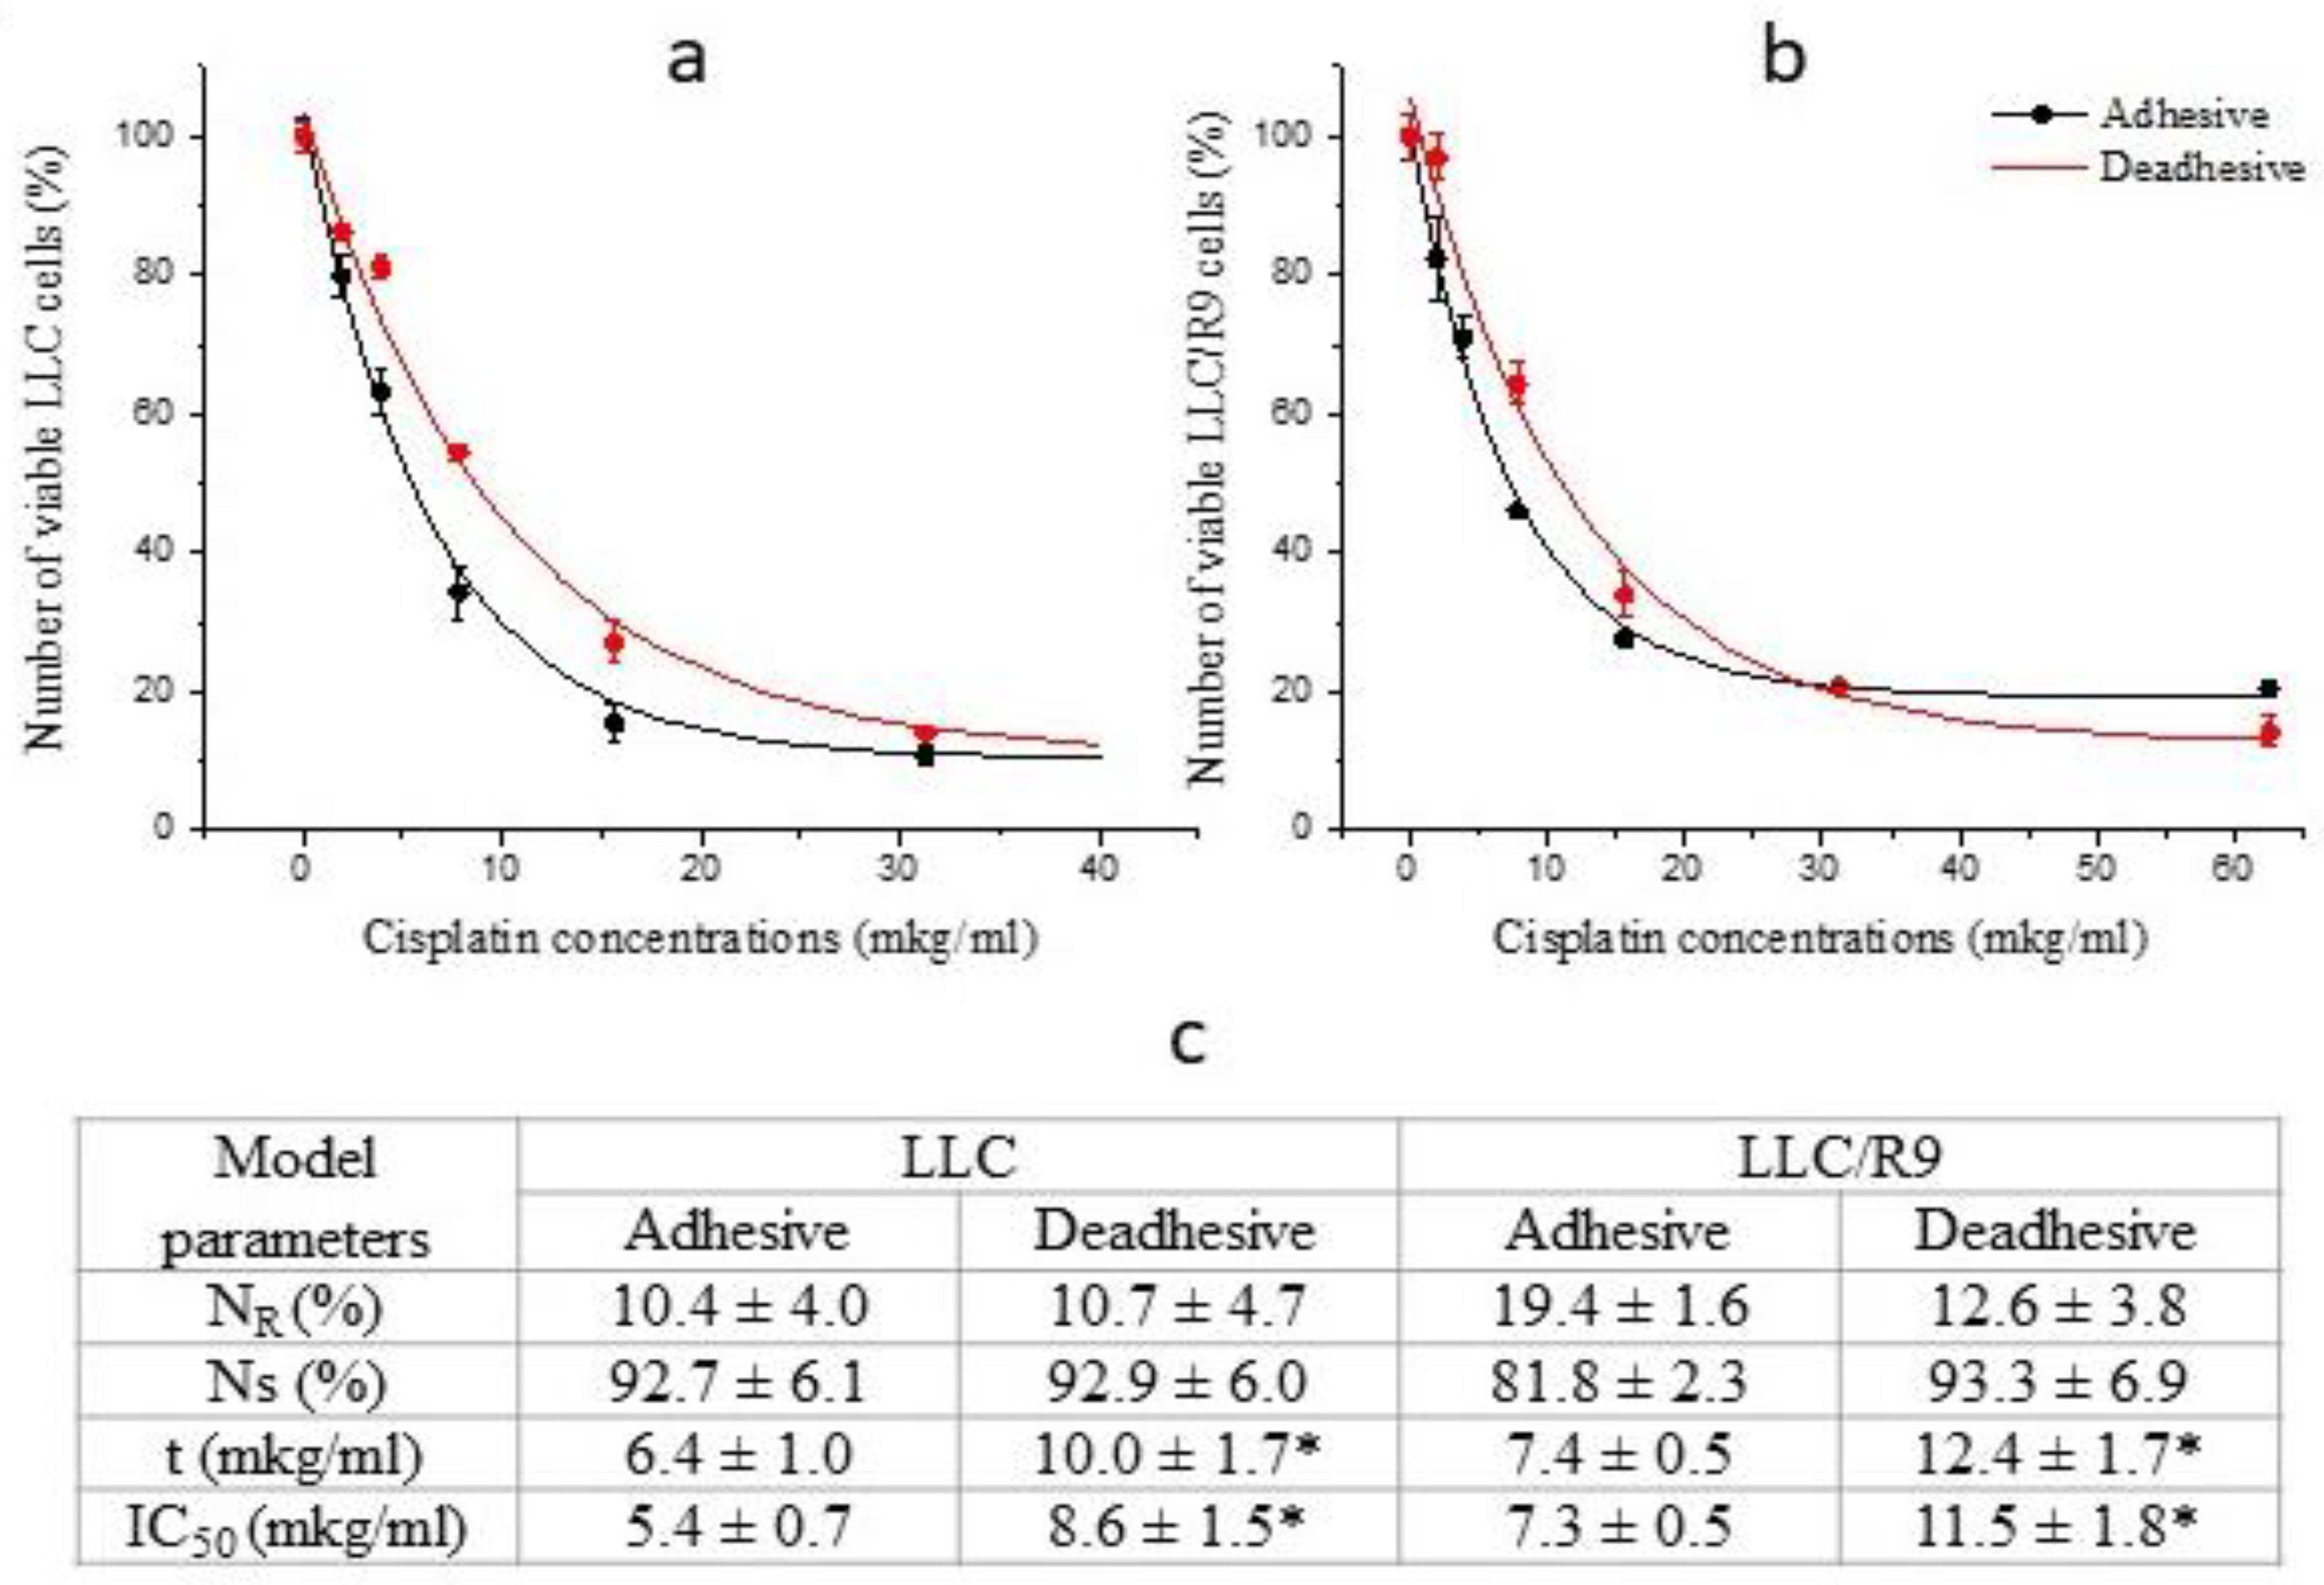
Figure 4.
Number of viable LLC (a) and LLC/R9 (b) cells (in % to the control) as a function of paclitaxel concentrations; lines – the best fit of mathematical model; symbols – experimental data. Model parameters of cisplatin cytotoxicity (c). * - differences between corresponding values of the adhesive and deadhesive cells are significant.
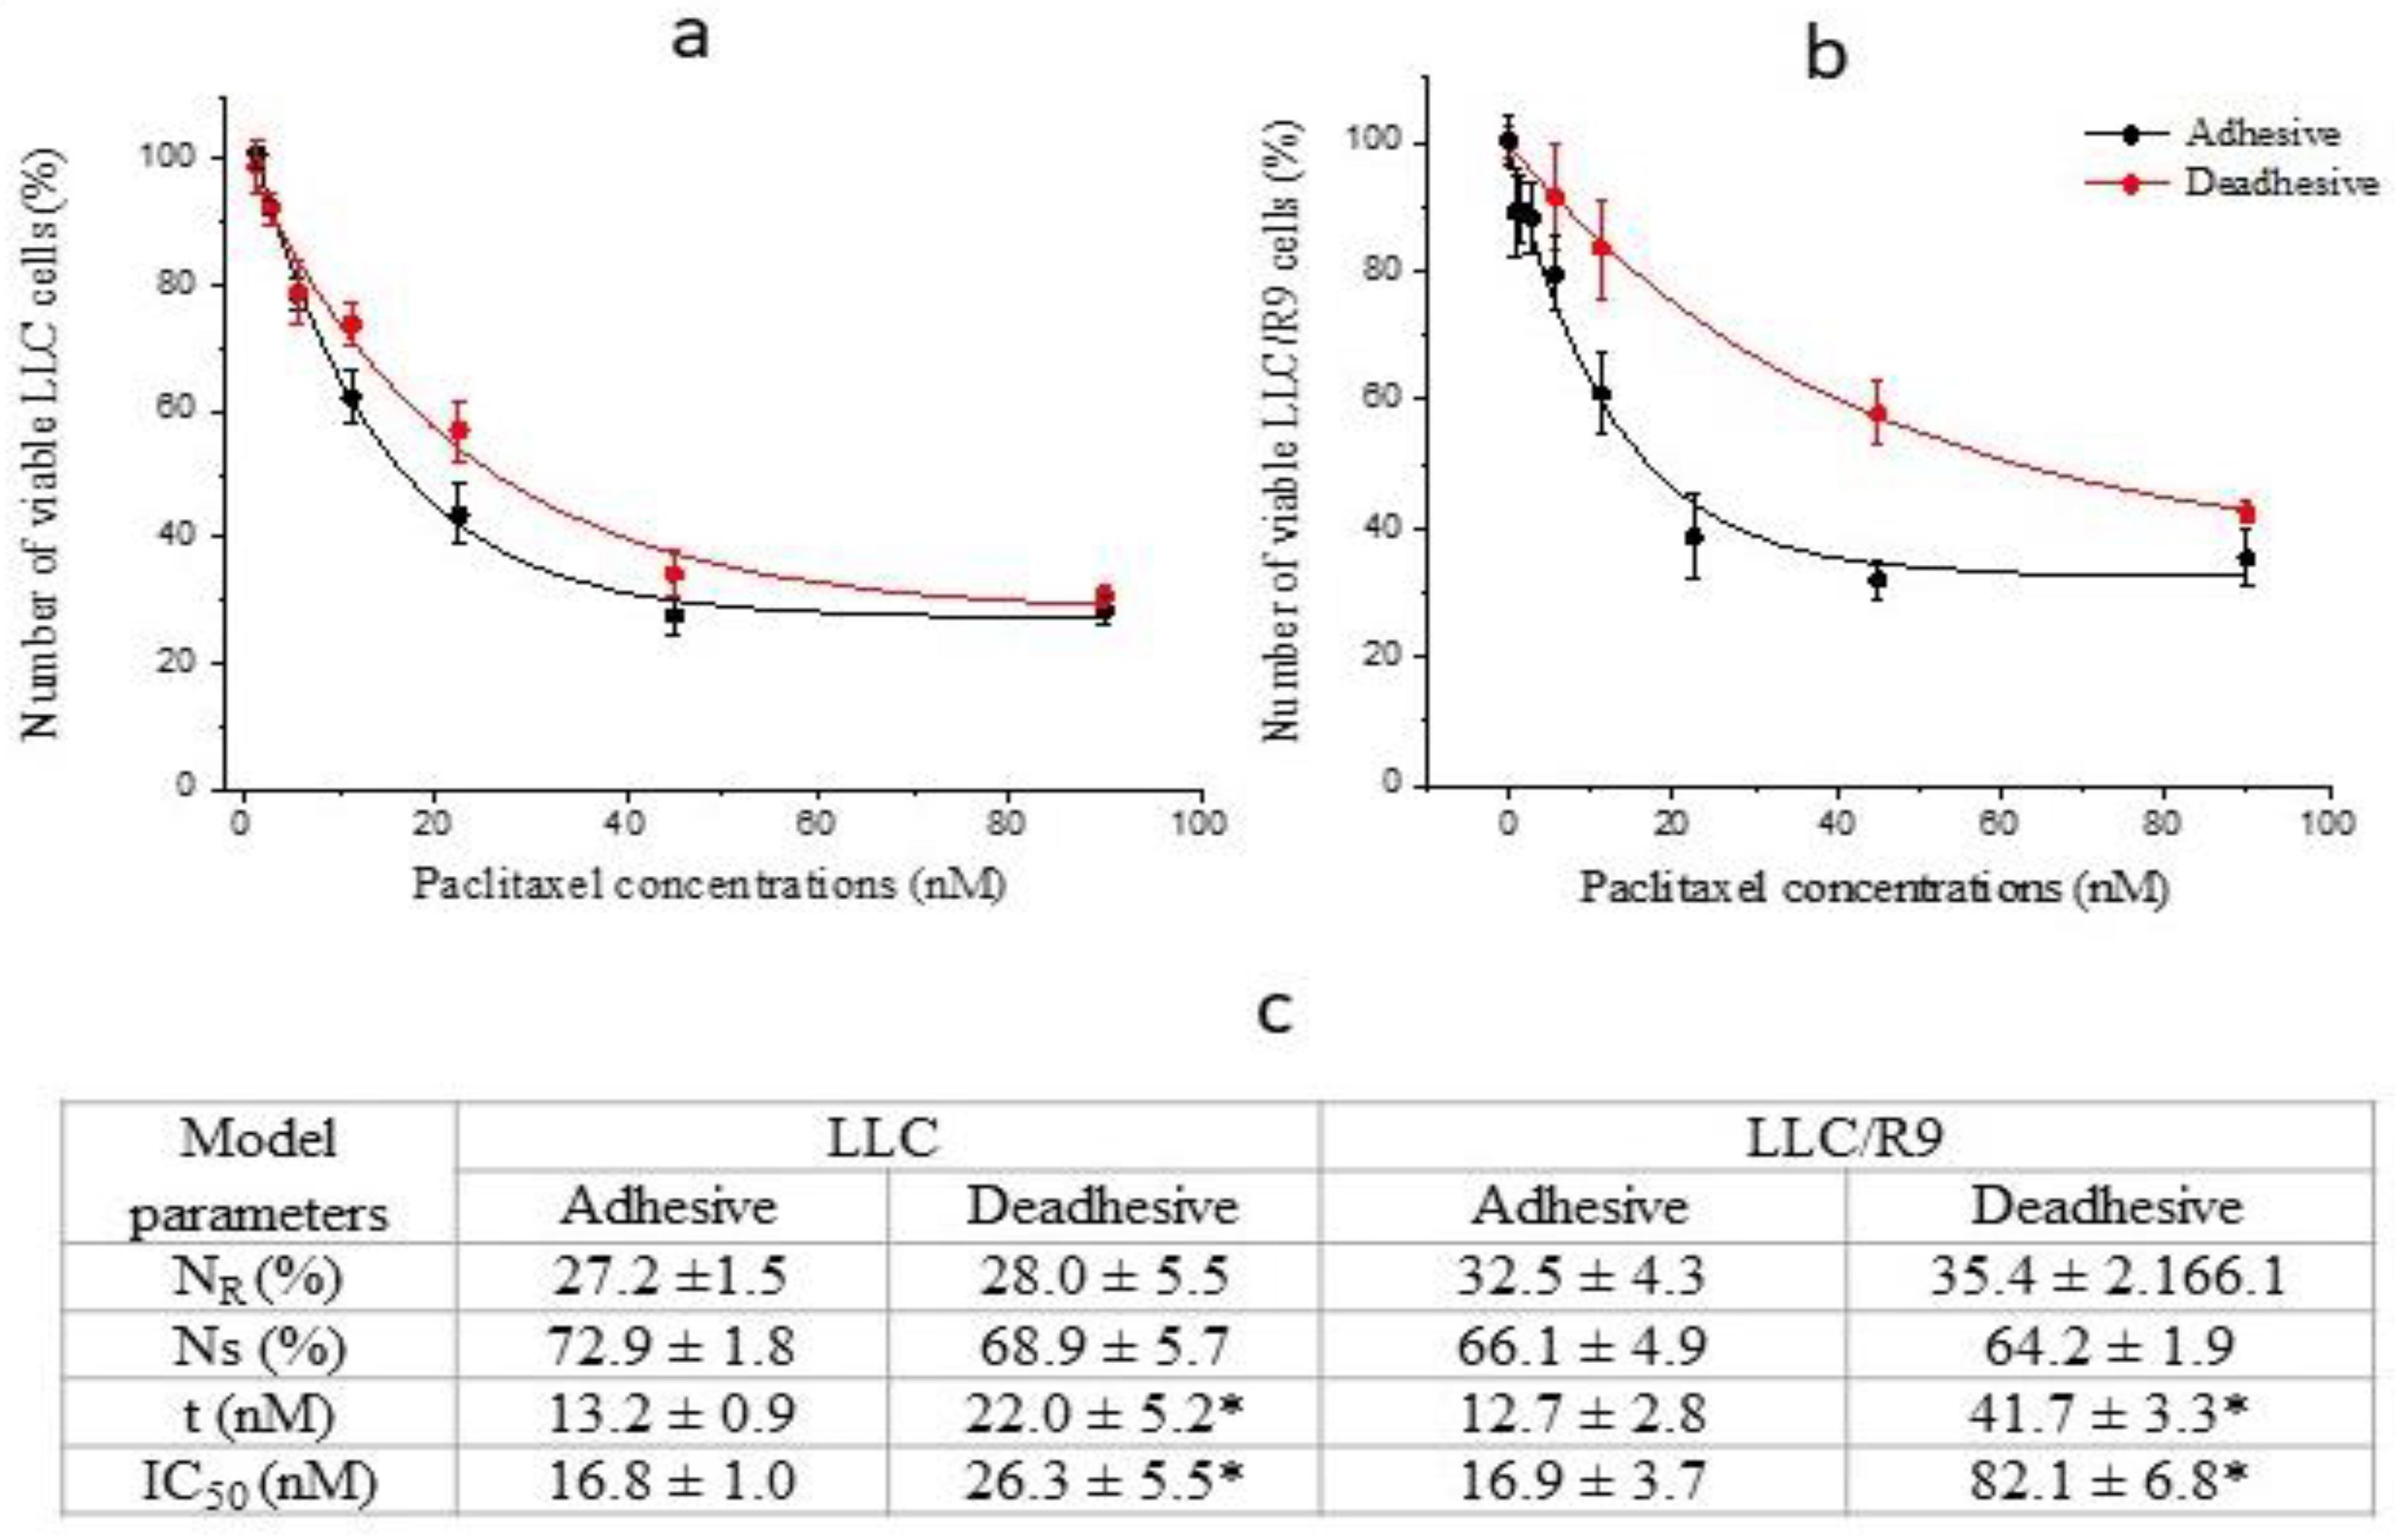
Figure 5.
The survival and proliferative activity of LLC cells under adhesive (1) and deadhesive (2) growth after 24 h incubation with sodium oxamate (grey columns) and without it (white columns). The number of viable (a), necrotic (b), apoptotic (c) cells, ROS level (d), cell cycle distribution of adhesive (e) and deadhesive (f) cells. * - differences between corresponding values of the cells treated or not treated with sodium oxamate are significant.
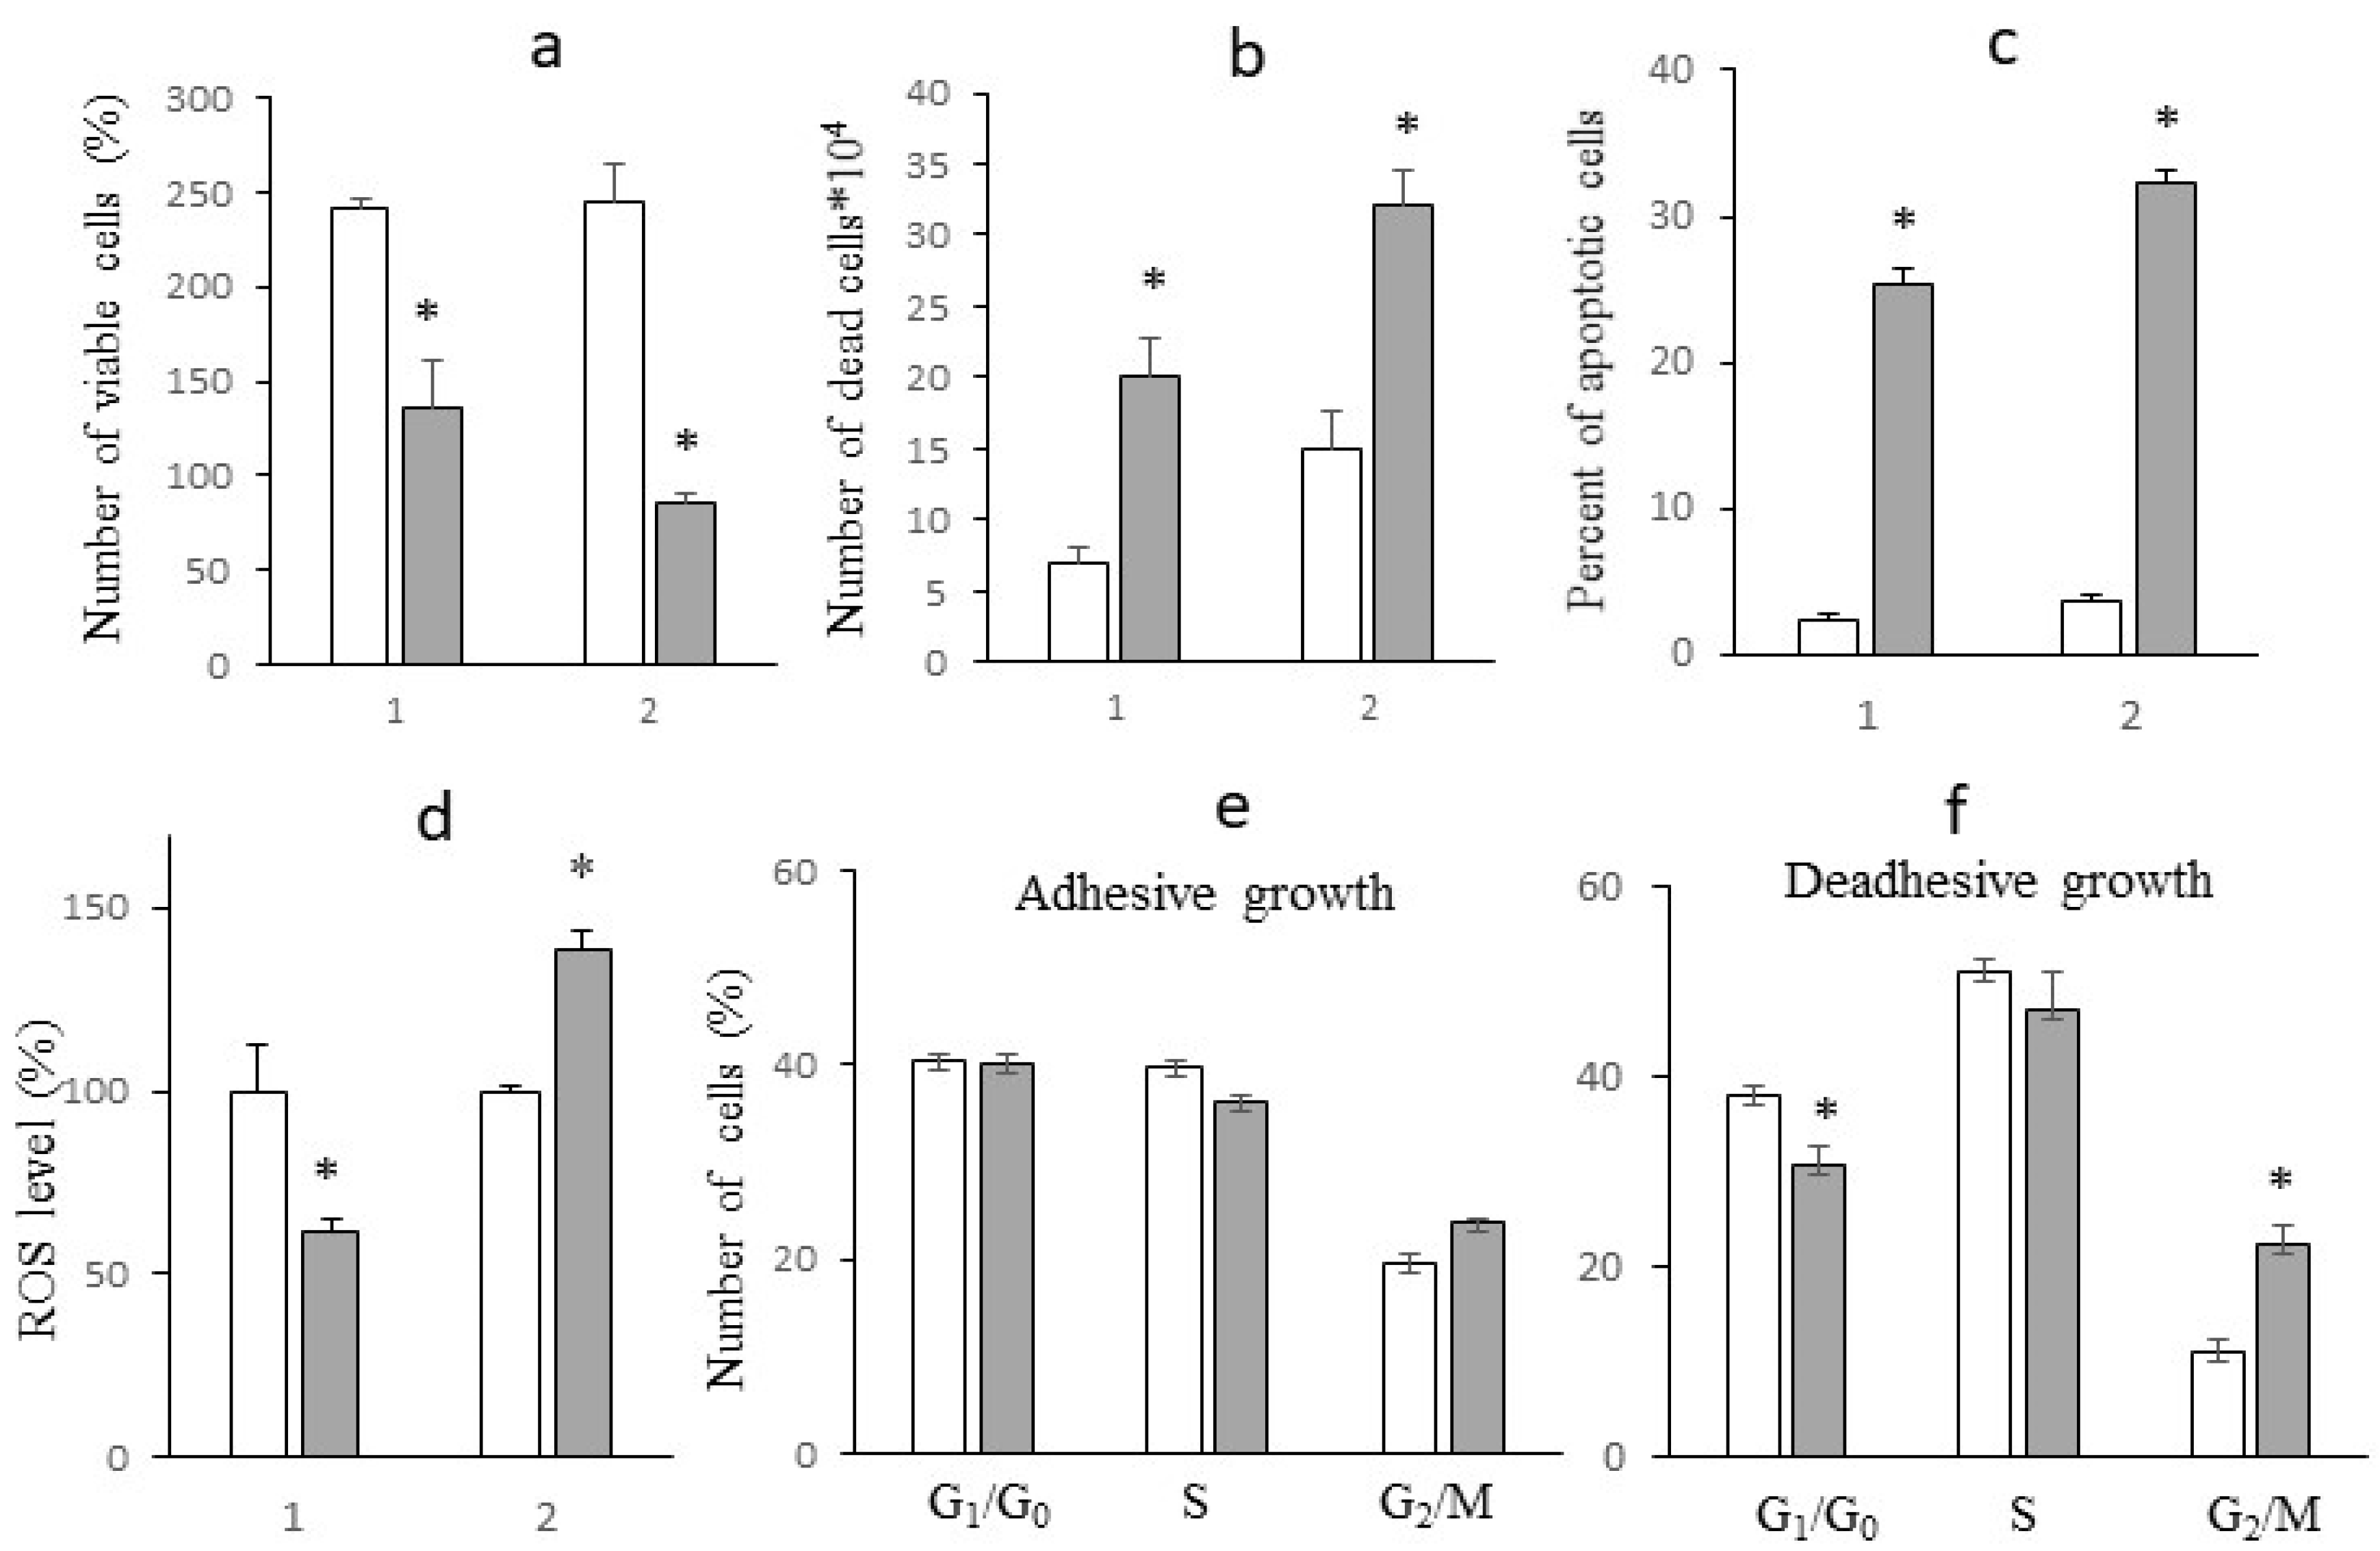
Figure 6.
Levels of glucose (a) and lactate (b) in medium expressed as % of their levels at the beginning of the study; GCR (d) and LPR (e). Cells treated with oxamate (grey columns) and not treated (white columns) under adhesive (1) and deadhesive (2) growth conditions. * - differences between corresponding values of the cells treated or not treated with sodium oxamate are significant.
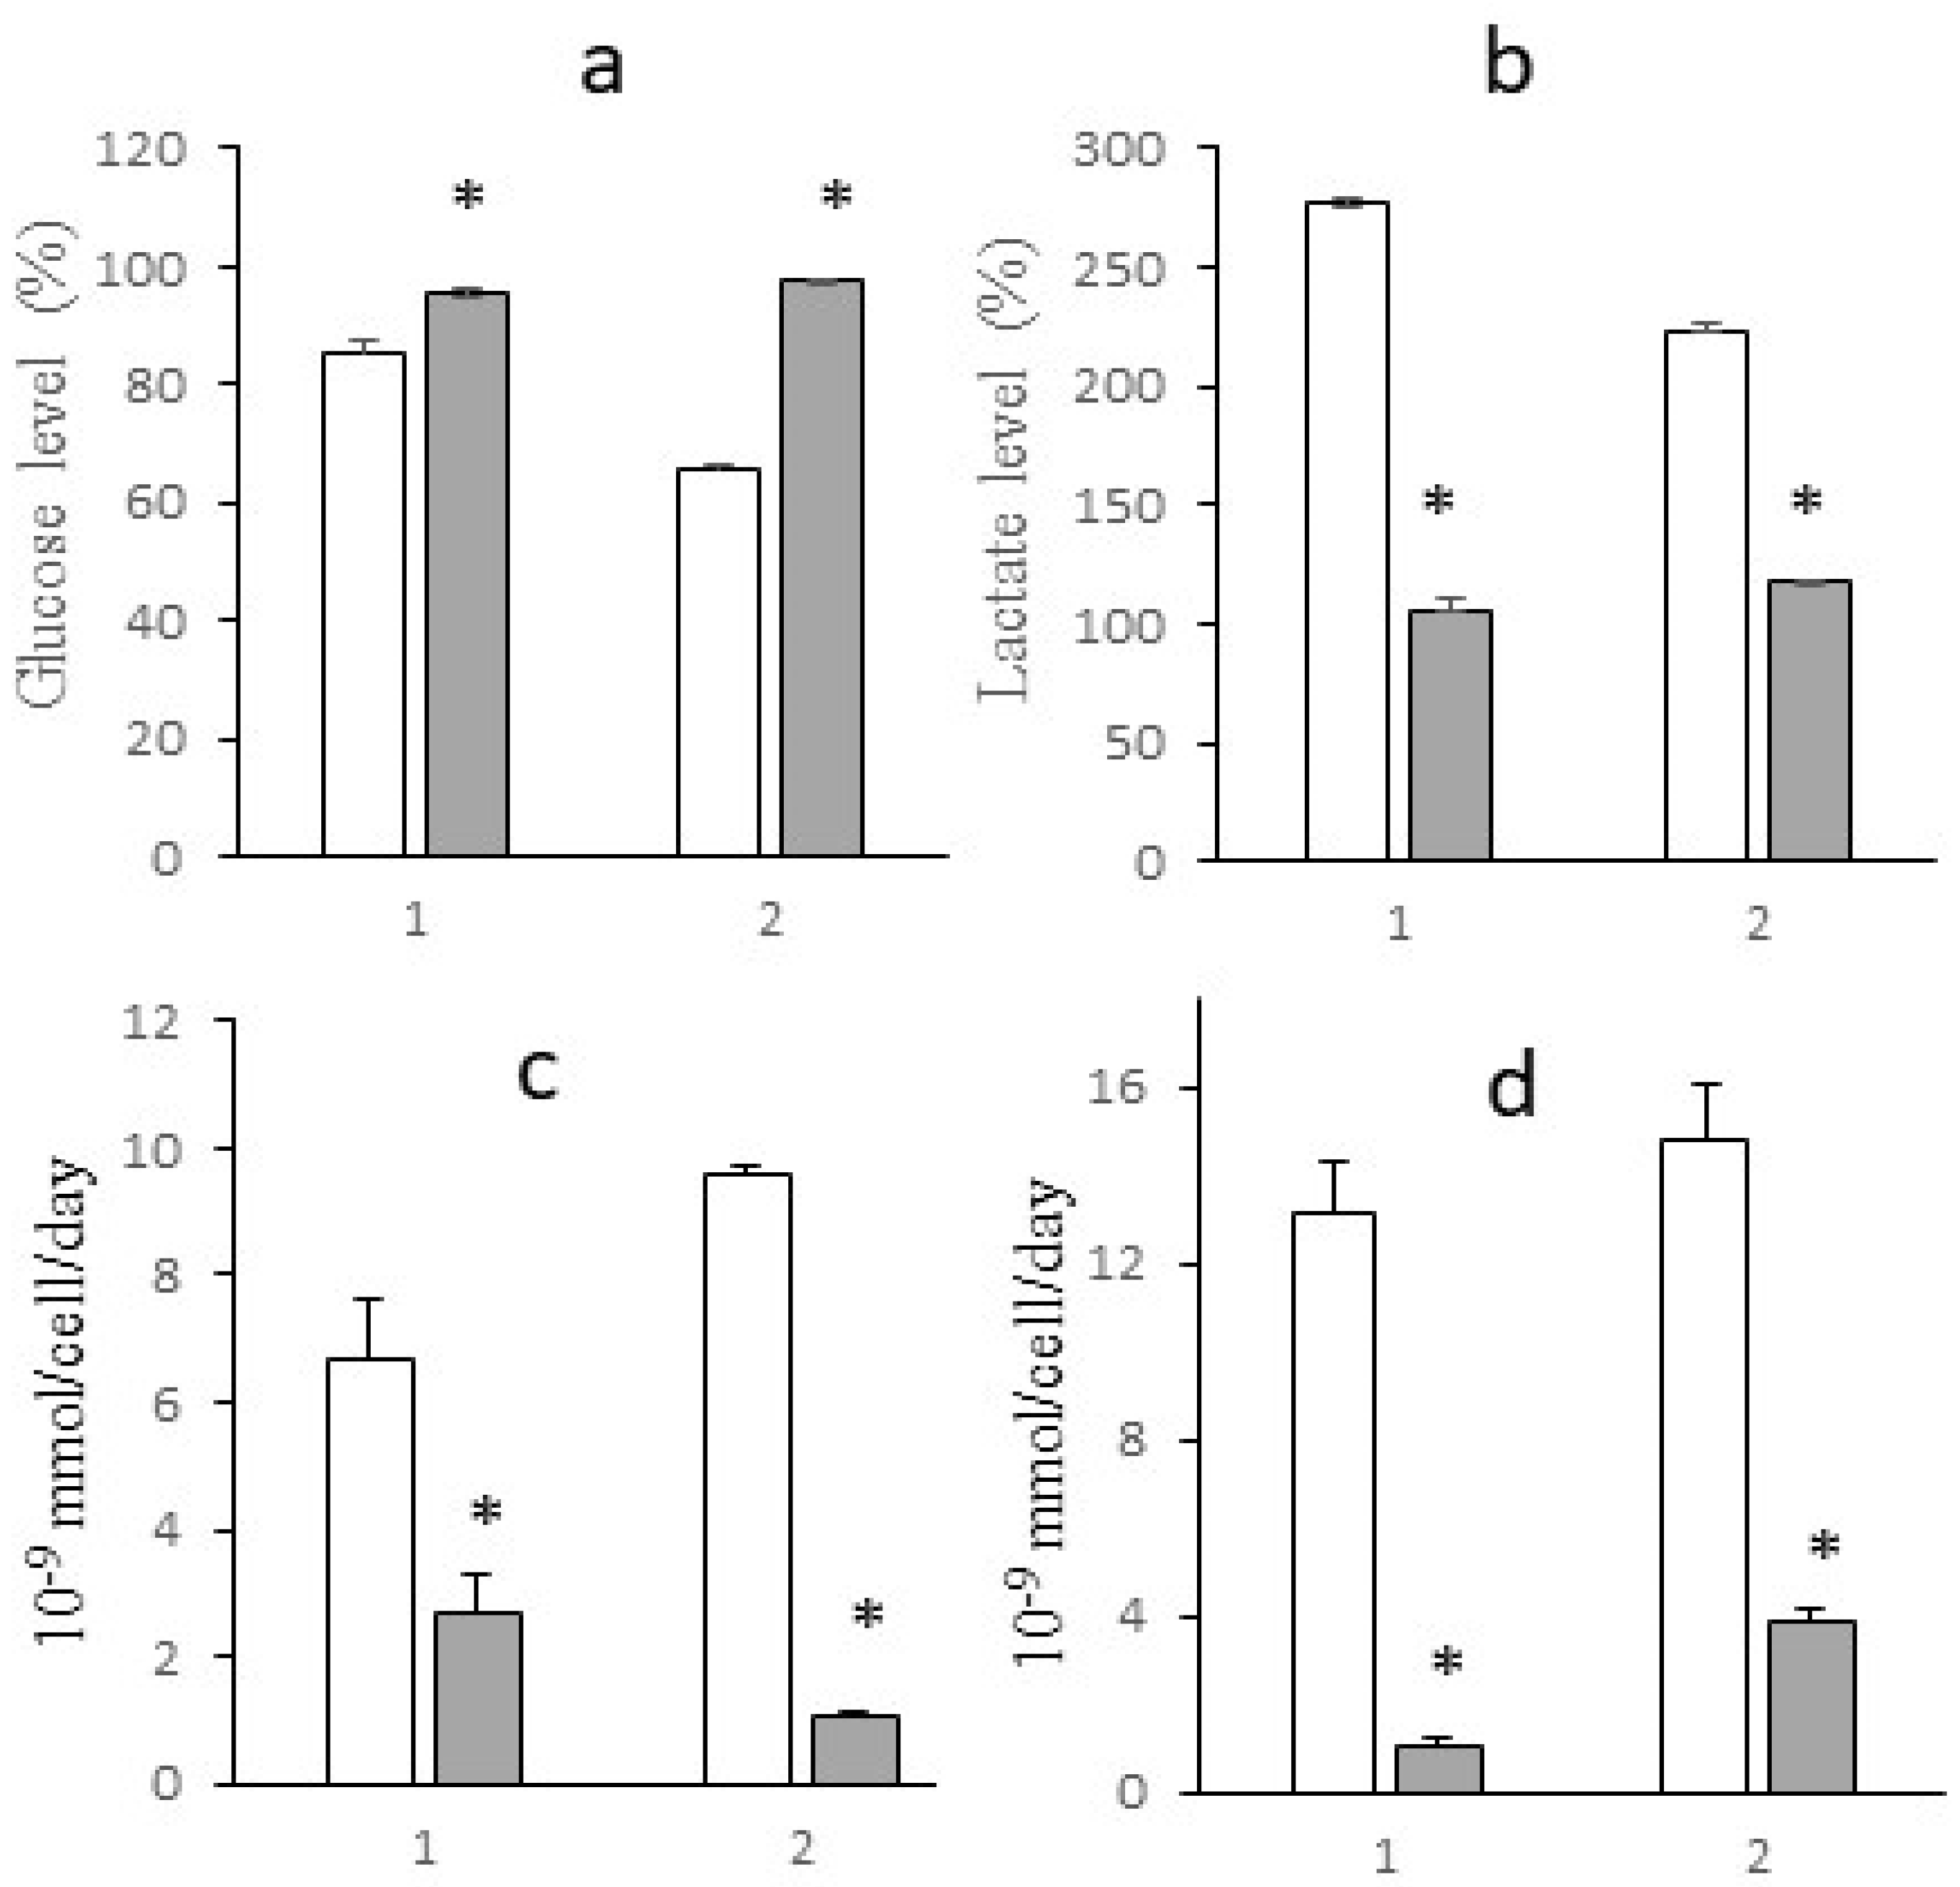
Figure 7.
ATR spectra of sodium oxamate (a), adhesive LLC cells not treated (b) and treated with sodium oxamate (c). ATR spectra of deadhesive LLC cells not treated (d) and treated with sodium oxamate (e).
Figure 7.
ATR spectra of sodium oxamate (a), adhesive LLC cells not treated (b) and treated with sodium oxamate (c). ATR spectra of deadhesive LLC cells not treated (d) and treated with sodium oxamate (e).
Disclaimer/Publisher’s Note: The statements, opinions and data contained in all publications are solely those of the individual author(s) and contributor(s) and not of MDPI and/or the editor(s). MDPI and/or the editor(s) disclaim responsibility for any injury to people or property resulting from any ideas, methods, instructions or products referred to in the content. |
© 2025 by the authors. Licensee MDPI, Basel, Switzerland. This article is an open access article distributed under the terms and conditions of the Creative Commons Attribution (CC BY) license (http://creativecommons.org/licenses/by/4.0/).
Copyright: This open access article is published under a Creative Commons CC BY 4.0 license, which permit the free download, distribution, and reuse, provided that the author and preprint are cited in any reuse.


