
Submitted:
26 March 2025
Posted:
29 March 2025
You are already at the latest version
Abstract
In this study, we model a solution surface with each point having nine components using artificial intelligence (AI) in optimising the effects of ground vibration during blasting operations in an open-pit diamond mine. This model has eight input parameters that can be adjusted by blasting engineers to arrive at a desired output value of ground vibration. It is built using the best performing artificial neural network architecture that best fits the blasting data from 100 blasting events provided by the Debswana diamond mine. Other AI algorithms used to compare the model performance were k-nearest neighbour, support vector machine, and random forest – together with more traditional statistical approach, i.e., multivariate and regression analysis. The inputs parameters were burden, spacing, stemming length, hole depth, hole diameter, distance from the blast face to the monitoring point, maximum charge per delay, and powder factor. The optimised model allows variations in the inputs values, given constraints, such that the output ground vibration will be within the minimum acceptable value. Through unconstrained optimisation, the minimum value of ground vibration is around 0.1 mm/s that is within the range caused by a passing vehicle.
Keywords:
Optimisation
; prediction
; ground vibration
; artificial neural network
; blast-induced
1. Introduction
Blasting is commonly used in mining, quarrying, and construction to break apart hard rocks and enable easier excavation and removal. Only 20 to 30 percent of the explosive energy during a blast is used for rock breaking, with the remainder contributing to negative environmental impacts, such as ground vibration, airblast, and flyrock [1,2]. The vibrations induced by blasting affect neighbouring residents and may damage structures [3]. Consequently, predicting blast-induced ground vibrations becomes imperative to manage and mitigate the undesirable effects of blasting. Ground vibrations originating from a blast are quantified in terms of peak particle velocity (PPV), measured in mm/s, at a designated ground position. Influencing factors for ground vibrations are categorised into controllable and uncontrollable parameters. The former pertains to man-made elements, such as explosive properties and blast design parameters, while the latter involves natural occurrences, such as geological conditions and rock-mass properties [4,5].
We present a method to establish the relationship of ground vibration versus input parameters as shown below
where = ground vibration, S = spacing, B = burden, T = stemming, L = hole depth, D = hole diameter, = maximum charge per delay, = powder factor, and = distance from the blast point to the monitoring point.
Equation 1 above has been the subject of many studies to define the function , that is, to establish the effects of input parameters versus the output parameter in a blasting event in the mines. Most mining companies in the world use different software in estimating the function , namely, Blast Logic, Mining Excellence, O-Pit Blast, Surpac, etc. These will help them in the blast design efforts, that is, provide values of the input parameters and be able to estimate the outputs of blasting, e.g., rock fragmentation, ground vibration, airblast, and flyrock. Most of these software use empirical methods in defining the function .
Our solution is to use machine learning to model the function and we are not the only ones who attempted to use this approach. What is unique about our approach is that we provide a solution surface, which is the problem’s solution space, to further define the function . In previous studies, they only define the function as a black box that is capable of predicting the output parameter given the input parameters, without providing a solution space. Our solution space enables us to do prediction as well as two other things:
- Perform optimisation computations to find the minimum ground vibration using random initial points
- Perform blast design by setting the desired value of ground vibration and searching in the solution space for the values of the corresponding input parameters. Or we can assign the value of ground vibration and some input parameters as constraints, and search in the solution space for the values of the remaining input parameters.
To the best of our knowledge, no other previous studies were able to do this.
1.1. Empirical Methods
Numerous empirical methodologies for predicting ground vibration due to blasting have been developed by researchers [6,7,8]. These techniques use data obtained from different blasting operations, in certain ground conditions which cannot be generalised for different rock types. There are two major shortfalls of empirical methods. First, it has a limited number of inputs, normally only two: maximum charge per delay and distance from the blast point to the monitoring point. Second, it has very low accuracy. Artificial intelligence methods provide generalisability, especially in terms of the number of inputs to the model. However, in terms of accuracy, the results may vary depending on the algorithm used. But in general machine learning methods provide much higher accuracy compared to empirical methods. From our study, accuracy comparisons are stated as follows. The empirical model United States Bureau of Mines (USBM) has an accuracy of 12.6% our artificial intelligence model accuracy ranges from 54.6% to 93.6%, and the statistical method has an accuracy of 66%.
Adding more input parameters in modelling ground vibration using empirical methods can be very difficult to achieve with high accuracy because of the complex, non-linear relationship between the input and output parameters. This could be the reason why empirical methods typically account for only two parameters and fail to incorporate the full range of factors affecting ground vibration. New approaches to estimating ground vibrations from blasting include artificial intelligence systems that consider many parameters influencing the outcomes of blasting [9,10,11,12].
1.2. Machine Learning Methods
Lawal et al. [13] utilised an ordinary artificial neural network (ANN), particle swarm optimisation (PSO), and dragonfly-optimised ANN to forecast how tunnel blasting may affect the environment. The PSO-ANN model, with an architecture of 4-15-15-1, yielded the best performance, exhibiting a coefficient of determination () of one, a mean square error (MSE) of 0.125, and a variance accounted for (VAF) of 98.29. In another study, Lawal et al. [14] used blast data from five granite quarries to predict ground vibration by employing gene expression programming (GEP), sine cosine algorithm-optimised artificial neural network (SCA-ANN), and adaptive neuro-fuzzy inference system (ANFIS) models, using a total of 100 datasets for model development. The obtained values for the SCA-ANN, GEP, and ANFIS models were 0.999, 0.989, and 0.997, respectively.
Zhang et al. [15] applied five machine learning classifiers for predicting ground vibration, namely, chi-squared automatic interaction detection (CHAID), ANN, support vector machine (SVM), random forest (RF), and classification regression tree (CART), finding RF to offer substantially superior performance over the other regression models investigated. Qiu et al. [16] applied an extreme gradient boosting (XGBoost) model to predict blast-induced ground vibration using 150 data sets with thirteen input parameters. The grey wolf optimisation (GWO), whale optimisation algorithm (WOA), and bayesian optimisation algorithm (BO) were used to fine-tune the hyperparameters of the XGBoost model. Their investigation revealed that, the suggested WOA-XGBoost model performed better in comparison to other machine learning (ML) models.
Nguyen et al. [17] utilised a novel hybrid model combining the hierarchical k-means clustering algorithm with ANN (HKM-ANN). The model was compared to the fuzzy c-means clustering support vector regression (FCM-SVR), finding that the HKM-ANN model performed better than the FCM-SVR model in forecasting ground vibration. Yang et al. [18] employed ANFIS optimised by PSO and genetic algorithm (GA) to forecast ground vibration resulting from blasting, utilising data from two Iranian quarry mines. Their model demonstrated an accuracy of 0.979, a root mean square error (RMSE) of 0.240, and a mean absolute (MAE) of 0.199 in predicting ground vibration. Other researchers have employed hybrid artificial intelligence methodologies, predominantly ANNs, to model blast-induced ground vibrations, other blast-induced impacts and rock engineering problems [19,20,21,22,23,24,25,26,27,28].
This study uses an ANN model as a solution surface in a nine-dimensional space to minimise the effects of ground vibration during blasting operations in an open-pit diamond mine. This solution surface becomes the solution space such that each point on the surface is defined by nine components, i.e., eight input parameters and one output parameter ground vibration. An ANN model is designed for predicting ground vibrations during open-pit mine blasting, using data derived from the Debswana Orapa Diamond Mine in Botswana. The ANN model was chosen as the best-performing model among three other machine learning methods. The model has eight input parameters, which include both blast design parameters and explosive properties. The model’s performance is compared against other machine learning algorithms and multivariate regression analysis. Sensitivity analysis is also conducted to determine the relative influence of input parameters on the output.
We explicitly list down our claim of contributions in this paper as follows:
- We present data from Debswana Diamond Company recorded from 100 blast events.
- We develop machine learning models, each with five different architectures, with eight input parameters and one output of ground vibration. The four models are compared against a statistical method.
- We optimise the architecture of the best performing machine learning model using Monte Carlo method.
- A solution space is created from the optimised machine learning model. Other machine learning models did not come out with a solution space, their results include only predicting the output parameter ground vibration. Our solution space is capable of inverse solution, i.e., we can search the solution space, given input parameters and the expected output to help the blast design engineers in adjusting the input parameters to arrive at an expected output of ground vibration.
- We optimise ground vibration using gradient descent method from the created solution space.
- Sensitivity analysis is performed using a statistical method and the results are confirmed from the created solution space.
The machine learning model allows us to predict the output ground vibration from the given eight input parameters by locating a unique point in the solution space. Because of this model, one can also predict not just the output parameter, but also an input parameter when seven other input parameters are given together with their corresponding output ground vibration. In this way, this model can be very useful to blast design engineers by setting a target output ground vibration and searching for the corresponding input parameters in the solution space. This is a kind of inverse solution approach and can be very useful to blast design engineers.
1.3. Mine Case Study
The Orapa Diamond Mine in Botswana was discovered in 1967 by De Beers. The kimberlite igneous rocks span an area of 1.18 square kilometres, with two merging diatremes, each with preserved crater sedimentary facies known as the southern and northern lobes. These lobes overlay Archaean granite and belong to the Karoo Supergroup, incorporating Stormberg-aged basalt lava and tracing back approximately 93 million years. The anticipated yield of the Orapa mine is around 153 million carats from a total of 205 million tonnes of mineral reserves. Figure 1 depicts the current layout of the Orapa Diamond Mine.
The mine utilises a staggered blasting pattern. The predominant explosives used are S135B emulsion and pentolite boosters.The mine has a bench height of 15 metres and makes use of blast holes with diametres of (127, 165, and 250) millimetres. Each blast comprises between 15 and 25 rows, with each row containing between 40 and 60 holes. The loading of the fragmented materials is done using shovels and hydraulic excavators, while the dump trucks are used for hauling.
2. Materials and Methods
This section explores the materials and methodologies employed in this study, focusing on the datasets collected from the mining operation, the machine learning techniques applied, and the optimisation processes implemented.
2.1. Materials
A dataset with 100 blasting events was collected from the blasting operations of the Debswana Orapa Diamond Mine. The dataset consists of eight inputs which include blast design parameters and explosive properties, and ground vibration as the output as shown in Table 1.
Ground vibration data in this study was recorded using seismographs placed at varying distances from the blast sources. These devices measured vibrations in three orthogonal components: radial, transverse, and vertical. The radial component corresponds to the direction of propagation of the vibration wave from the blast source, while the transverse and vertical components provide a complete three-dimensional representation of the vibration effects. This approach ensures that the dataset captures the full spectrum of vibrational impacts resulting from blasting activities. Starting from 1984 to the present, with around two blasts per month. However, Orapa mine is only willing to share blasting data starting from 2018, and they perform two blasts per month. One of the major problems in processing the data provided by Orapa is the integrity of information. Many entries in the blasting reports were incomplete and therefore not suitable to be included in our database. Thus, many entries were discarded resulting in only 100 complete blasting events.
2.2. Methods
Data preprocessing involved cleaning and normalising the data to prepare it for analysis; the data was divided into training (80%), validation (10%), and testing (10%) sets. The machine learning models employed are random forest, support vector machine, k-nearest neighbour (k-NN), and artificial neural network. Additionally, the statistical model multivariate regression analysis (MVRA) was utilised. These models were built using Python. The gradient descent method, coupled with the Monte Carlo method, was used for the optimisation of ground vibration based on the best-performing ANN model. The cosine amplitude approach was applied for sensitivity analysis to determine the relative impact of input parameters on the output. The metrics used for evaluating the performance of all predictive models are, RMSE and . The RMSE is calculated using the formula:
The is determined by:
In these equations, y and represent the measured and forecasted values, respectively, while and denote the mean values.
For composite score calculation is normalised. We note that higher values of indicate better performance. For RMSE, lower values indicate better performance. To normalise RMSE values, we used:
Once both metrics are normalised, we compute a composite score by adding the normalised and normalised RMSE.
The Monte Carlo technique was employed to randomly navigate the solution space and find the best ANN configuration. This optimal ANN structure comprises 34 neurons in the first hidden layer, 15 in the second layer and 50 in the third hidden layer. Upon establishing the optimal ANN model, we then use the gradient descent approach to find the minimum ground vibration and its corresponding input parameters. Gradient descent is a commonly employed iterative optimisation technique with applications spanning various computational fields [29]. The mathematical equation of the gradient descent method is shown by (5).
In this equation, represents the updated parameter, while is the current parameter value being updated. The term denotes the parameter value from the previous iteration. The learning rate is represented as . The function represents the neural network model.
3. Results and Discussion
Table 2 shows the performance indices of the models. The ANN model with an 8-10-1 architecture showed the best performance, with the lowest RMSE (0.286), the highest accuracy (0.941), and the highest composite score (1.864), establishing it as the best model. The order of performance of the models according to their composite score is ANN (1.864), RF (1.768), k-NN (1.454), SVM (1.445), and MVRA, having the lowest composite score of 0.664.
Figure 2 shows the variation in RMSE for different models with their hyper-parameters. Figure 2a illustrates the variation in RMSE with the number of neighbours for the k-NN model. As the number of neighbours decreases, the RMSE also decreases, with the optimum performance found at k = 10 (lowest RMSE). For the RF model, increasing the number of trees results in a higher RMSE. The optimum model was found at 10 trees (lowest RMSE), as shown in Figure 2b. In Figure 2c, the RMSE decreases as the number of neurons decreases, leading to an optimum ANN model with 10 neurons (lowest RMSE). For the SVM model, smaller sigma values lead to an increased RMSE, and larger sigma values do as well. Medium sigma values result in a lower RMSE, with the optimum model being the SVM polynomial kernel, with = 5.
Figure 3a–e depict the correlation between the predicted and measured ground vibrations. The solid line represents a 1:1 slope, and it can be observed that the data points for the ANN model cluster closely around this line, indicating superior prediction capability compared to other models. Furthermore, a comparison of the predicted and measured ground vibration for each algorithm is shown in Figure 4. The graph illustrates that the predictions generated by the ANN closely align with the measured values, indicating the ANN’s proficiency in predicting these parameters compared to other models.
The ANN performs the best due to its ability to capture non-linear relationships among multiple input parameters through its flexible architecture and adaptive learning capabilities. The RF, while also capable of handling non-linearities through ensemble learning, is slightly less effective than ANN in capturing very complex interactions. The k-NN, which relies on the proximity of data points, performs adequately but struggles with high-dimensional data. The SVM, though powerful in high-dimensional spaces and capable of non-linear modelling using kernel functions, often requires meticulous tuning of hyper-parameters to perform optimally. Lastly, MVRA, being a traditional statistical approach, is limited by its linear assumption and cannot adequately capture the non-linear relationships present in the data, resulting in the poorest performance among the models.
The highest-performing model in Table is the PSO-ANN by Lawal et al. [13], which achieved an of 1.00 using 56 datasets with four inputs, namely, charge per delay (Q), number of holes (N), DI and rock mass rating (RMR). This model’s superior performance can be attributed to the optimisation capabilities of the PSO technique combined with ANN, which likely captures non-linearities more effectively than other models. In contrast, the lowest-performing model is the ANN by Dindarloo [30] with an of 0.81 using only 15 datasets and five inputs (D, L, N, B, S). The limited dataset size and potentially less complex model architecture might have restricted the model’s ability to generalise and capture the variability in the data, leading to lower predictive accuracy. In the middle range, the HKM-ANN by Nguyen et al. [17] achieved an of 0.98 using 185 datasets with six inputs (S, PF, B, DI, maximum charge per delay (MC)). This model combines hierarchical k-means clustering with ANN, enabling it to handle larger and more diverse datasets effectively. Its performance is close to the highest-performing models, indicating that hybrid techniques can significantly enhance predictive capabilities.
Comparing these with our results, our ANN model achieved an of 0.941 with 100 datasets and eight inputs. It performs well and aligns closely with other high-performing models, such as the ANN by Armaghani et al. [31], which achieved an of 0.97 with 109 blasting events. This suggests that our model may attain comparable accuracy with minor adjustments, such as including more input parameters and increasing the dataset size. However, hybrid models that use advanced techniques and larger datasets, including PSO-ANN ( = 1.0, Lawal et al. [13]) and HKM-ANN ( = 0.98, Nguyen et al. [17]), perform slightly better than our model. These results imply that the accuracy and generalisability of our model can be improved by investigating hybrid models and adding more inputs, allowing it to capture more complex interactions and improve generalisability, as seen in the highest-performing models.
Table 3 highlights the significant impact of dataset size, the number of input parameters, and the type of model used on the performance of predictive models. Models using hybrid techniques and larger datasets tend to perform better, as they can capture complex patterns and interactions within the data more effectively.
3.1. Sensitivity Analysis
Sensitivity analysis was used to determine the relative influence of input parameters on the output using the cosine amplitude method [39]. The strength of the relation between the dataset, and is given by:
where and are inputs and outputs, respectively; and m is the dataset number.
In Figure 5, it can be inferred that spacing is the most influential input parameter on ground vibration. It is noted that hole diameter is the least influential parameter on ground vibration. This observation is consistent with findings from other studies, which have also demonstrated that spacing exerts a greater influence on ground vibration than hole diameter [5,16,36]. The high sensitivity of spacing suggests that even minor adjustments can lead to significant changes in vibration levels, providing a powerful lever for engineers to control blast outcomes. On the other hand, the relatively low sensitivity of hole diameter indicates that it can be considered a secondary factor, allowing engineers to focus their optimisation efforts on more influential parameters.
3.2. Analysis of the Optimisation Results
Figure 6a through Figure 7a display the results of the optimisation procedure, starting with seven initial points (depicted as red dots) chosen at random and converging towards the optimised value (illustrated as a blue dot), which is the lowest point in the surface. The optimised blast design parameters are as follows: powder factor (0.58), maximum charge per delay (454.09), burden (8.22), spacing (8.30), stemming (7.16), distance from blast point to monitoring point (2399), hole depth (18.25), and diameter (183). Therefore, the lowest point on the solution surface corresponds to the minimum value of ground vibration predicted by the model (approximately 0.1 mm/s). Every point in the solution surface has nine components, i.e., eight components of the eight input parameters plus the output component of the ground vibration.
From the sensitivity analysis, spacing is the most influential parameter. Because of this, we compare spacing versus all the other seven input parameters kept constant, to observe the variations in the values of the output parameter in a two-dimensional plot. We assign spacing to be the x-axis, while ground vibration is assigned as the y-axis.
Figure 7a shows that as spacing decreases with stemming length fixed at 7.16, ground vibration initially fluctuates and finally decreases towards an optimal spacing value for minimal vibration, after which it increases again. The solution space also confirms the results of the sensitivity analysis. As can be seen in Figure 7b, generated by varying spacing and fixing all the other parameters, and taking a slice through the lowest, optimised point in the solution space. Maximum charge per delay, Stemming, burden, and powder factor are the most influential input parameter after spacing, and have the most fluctuations in Figure 7b. This indicates a high sensitivity, as changes in these parameters significantly impact ground vibration. Hole diameter is the least influential parameter, this parameter shows least variations suggesting lower sensitivity.
The significance of these results lies in their practical application for blasting engineers seeking to minimise the environmental and structural impacts of ground vibrations during blasting operations. By providing a set of optimised parameters, the model enables engineers to design blasts that adhere to safety regulations and reduce the risk of damage to nearby structures and communities. Reducing ground vibrations not only mitigates the risk of structural damage but also enhances the efficiency of the blasting process. Minimising ground vibration may lead to a greater part of the total energy in blasting to be concentrated more towards its main goal, that is, rock fragmentation.
4. Conclusions
This study successfully demonstrates the application of machine learning techniques to predict and optimise ground vibrations induced by blasting operations at the Debswana Orapa diamond open-pit mine. Among the evaluated models, ANN, k-NN, SVM, RF, and the MVRA, the ANN model emerged as the most effective, evidenced by its highest predictive accuracy, with an value of 0.941 and a minimal RMSE of 0.286. Using the ANN algorithm, we optimise the architecture of the ANN model using the Monte Carlo method resulting in an architecture, consisting of three hidden layers with 34, 15, and 50 neurons, respectively. We then optimise the resulting ANN model using the gradient descent method to find the minimum ground vibration which is 0.1 mm/s. The solution space, therefore, is capable of predicting ground vibration given input parameters, as well as setting the desired output value of ground vibration and looking for the corresponding values of the input parameters. Thus the solution space demonstrates its efficacy in minimising, predicting, and designing ground vibrations. Sensitivity analysis confirmed the results provided by the solution space. Although the findings of this study are specific to the Orapa Diamond Mine, the methodologies employed, are designed to be scalable and adaptable to other mining operations. By incorporating site-specific data and retraining the model, the approach can be extended to mines with different geological, topographical, and operational conditions.
Author Contributions
Conceptualization, Kesalopa Gaopale, Onalethata Saubi and Rodrigo S. Jamisola, Jr; methodology, Onalethata Saubi and Rodrigo S. Jamisola Jr; software, Onalethata Saubi; validation, Onalethata Saubi and Rodrigo S. Jamisola, Jr; formal analysis, Onalethata Saubi and Rodrigo S. Jamisola, Jr; writing—original draft preparation, Onalethata Saubi; writing—review and editing, Onalethata Saubi, Raymond S. Suglo, Rodrigo S. Jamisola, Jr and Oduetse Matsebe; project; supervision, Raymond S. Suglo, Rodrigo S. Jamisola, Jr and Oduetse Matsebe; project administration, Rodrigo S. Jamisola, Jr; funding acquisition, Rodrigo S. Jamisola, Jr. All authors have read and agreed to the published version of the manuscript.
Funding
This research was funded by Debswana Diamond Company with grant number P00064. The APC was funded by Debswana.
Data Availability Statement
The datasets analysed during this study are not available to the public because of a non-disclosure agreement signed with Debswana Mining Company.
Acknowledgments
The authors would like to thank Orapa Diamond Mine for supplying the data for this research. Special appreciation is extended to Mr. Thuso Mogotsi and Mr. Chite Joe Matenga for their valuable contributions to this work.
Conflicts of Interest
The authors declare no conflicts of interest..
References
- Cheng, G.; Huang, S. Analysis of ground vibration caused by open pit production blast. Explosive and blasting technique. Balkema 2000, 63–70. [Google Scholar]
- Ak, H.; Konuk, A. The effect of discontinuity frequency on ground vibrations produced from bench blasting: a case study. Soil dynamics and earthquake engineering 2008, 28, 686–694. [Google Scholar] [CrossRef]
- Nateghi, R.; Kiany, M.; Gholipouri, O. Control negative effects of blasting waves on concrete of the structures by analyzing of parameters of ground vibration. Tunnelling and Underground Space Technology 2009, 24, 608–616. [Google Scholar] [CrossRef]
- Dumakor-Dupey, N.K.; Arya, S.; Jha, A. Advances in blast-induced impact prediction—A review of machine learning applications. Minerals 2021, 11, 601. [Google Scholar] [CrossRef]
- Zhou, J.; Asteris, P.G.; Armaghani, D.J.; Pham, B.T. Prediction of ground vibration induced by blasting operations through the use of the Bayesian Network and random forest models. Soil Dynamics and Earthquake Engineering 2020, 139, 106390. [Google Scholar] [CrossRef]
- Ambraseys, N.; Hendron, A. Dynamic Behavior of Rock Masses, Rock Mechanics in Engineering Practice (KG Stagg and OC Zienkiewicz, eds.), 1968.
- Hustrulid, W.A. Blasting Principles for Open Pit Mining, Volume 1: General Design Concepts; A.A. Balkema, 1999.
- Langefors, U.; Kihlström, B. The modern technique of rock blasting; John Wiley & Sons., 1963.
- Lawal, A.I.; Kwon, S. Application of artificial intelligence to rock mechanics: An overview. Journal of Rock Mechanics and Geotechnical Engineering 2021, 13, 248–266. [Google Scholar] [CrossRef]
- Mitchell, T.M. Does machine learning really work? AI magazine 1997, 18, 11–11. [Google Scholar]
- Samuel, A.L. Some studies in machine learning using the game of checkers. IBM Journal of research and development 2000, 44, 206–226. [Google Scholar] [CrossRef]
- Hu, J.; Niu, H.; Carrasco, J.; Lennox, B.; Arvin, F. Voronoi-based multi-robot autonomous exploration in unknown environments via deep reinforcement learning. IEEE Transactions on Vehicular Technology 2020, 69, 14413–14423. [Google Scholar] [CrossRef]
- Lawal, A.I.; Kwon, S.; Kim, G.Y. Prediction of an environmental impact of tunnel blasting using ordinary artificial neural network, particle swarm and Dragonfly optimized artificial neural networks. Applied Acoustics 2021, 181, 108122. [Google Scholar] [CrossRef]
- Lawal, A.I.; Kwon, S.; Hammed, O.S.; Idris, M.A. Blast-induced ground vibration prediction in granite quarries: An application of gene expression programming, ANFIS, and sine cosine algorithm optimized ANN. International Journal of Mining Science and Technology 2021, 31, 265–277. [Google Scholar] [CrossRef]
- Zhang, H.; Zhou, J.; Jahed Armaghani, D.; Tahir, M.; Pham, B.T.; Huynh, V.V. A combination of feature selection and random forest techniques to solve a problem related to blast-induced ground vibration. Applied Sciences 2020, 10, 869. [Google Scholar] [CrossRef]
- Qiu, Y.; Zhou, J.; Khandelwal, M.; Yang, H.; Yang, P.; Li, C. Performance evaluation of hybrid WOA-XGBoost, GWO-XGBoost and BO-XGBoost models to predict blast-induced ground vibration. Engineering with Computers 2021, 1–8. [Google Scholar] [CrossRef]
- Nguyen, H.; Drebenstedt, C.; Bui, X.N.; Bui, D.T. Prediction of blast-induced ground vibration in an open-pit mine by a novel hybrid model based on clustering and artificial neural network. Natural Resources Research 2020, 29, 691–709. [Google Scholar] [CrossRef]
- Yang, H.; Hasanipanah, M.; Tahir, M.; Bui, D.T. Intelligent prediction of blasting-induced ground vibration using ANFIS optimized by GA and PSO. Natural Resources Research 2020, 29, 739–750. [Google Scholar] [CrossRef]
- Lawal, A.I.; Olajuyi, S.I.; Kwon, S.; Onifade, M. A comparative application of the Buckingham π (pi) theorem, white-box ANN, gene expression programming, and multilinear regression approaches for blast-induced ground vibration prediction. Arabian Journal of Geosciences 2021, 14, 1073. [Google Scholar] [CrossRef]
- Toraño, J.; Ramírez-Oyanguren, P.; Rodríguez, R.; Diego, I. Analysis of the environmental effects of ground vibrations produced by blasting in quarries. International Journal of Mining, Reclamation and Environment 2006, 20, 249–266. [Google Scholar] [CrossRef]
- Kaklis, K.; Saubi, O.; Jamisola, R.; Agioutantis, Z. Machine learning prediction of the load evolution in three-point bending tests of marble. Mining, Metallurgy & Exploration 2022, 39, 2037–2045. [Google Scholar]
- Faradonbeh, R.S.; Monjezi, M.; Armaghani, D.J. Genetic programing and non-linear multiple regression techniques to predict backbreak in blasting operation. Engineering with computers 2016, 32, 123–133. [Google Scholar] [CrossRef]
- Amiri, M.; Amnieh, H.B.; Hasanipanah, M.; Khanli, L.M. A new combination of artificial neural network and K-nearest neighbors models to predict blast-induced ground vibration and air-overpressure. Engineering with Computers 2016, 32, 631–644. [Google Scholar] [CrossRef]
- Saubi, O.; Gaopale, K.; Jamisola, R.S.; Suglo, R.S.; Matsebe, O. Enhancing Blast Design Efficiency for Rock Fragmentation with Gradient Descent and Artificial Neural Networks: An Optimization Study. In Proceedings of the 2023 4th International Conference on Computers and Artificial Intelligence Technology (CAIT). IEEE; 2023; pp. 1–5. [Google Scholar]
- Xue, X.; Yang, X.; Li, P. Evaluation of ground vibration due to blasting using fuzzy logic. Geotechnical and Geological Engineering 2017, 35, 1231–1237. [Google Scholar] [CrossRef]
- Lawal, A.I.; Kwon, S.; Kim, G.Y. Prediction of the blast-induced ground vibration in tunnel blasting using ANN, moth-flame optimized ANN, and gene expression programming. Acta Geophysica 2021, 69, 161–174. [Google Scholar] [CrossRef]
- Zhou, J.; Zhang, Y.; Qiu, Y. State-of-the-art review of machine learning and optimization algorithms applications in environmental effects of blasting. Artificial Intelligence Review 2024, 57, 5. [Google Scholar] [CrossRef]
- Fattahi, H.; Hasanipanah, M. Prediction of blast-induced ground vibration in a mine using relevance vector regression optimized by metaheuristic algorithms. Natural Resources Research 2021, 30, 1849–1863. [Google Scholar] [CrossRef]
- Fitch, F.B. Warren S. McCulloch and Walter Pitts. A logical calculus of the ideas immanent in nervous activity. Bulletin of mathematical biophysics, vol. 5 (1943), pp. 115–133. The Journal of Symbolic Logic 1944, 9, 49–50. [Google Scholar] [CrossRef]
- Dindarloo, S.R. Prediction of blast-induced ground vibrations via genetic programming. International Journal of Mining Science and Technology 2015, 25, 1011–1015. [Google Scholar] [CrossRef]
- Armaghani, D.J.; Hajihassani, M.; Monjezi, M.; Mohamad, E.T.; Marto, A.; Moghaddam, M.R. Application of two intelligent systems in predicting environmental impacts of quarry blasting. Arabian Journal of Geosciences 2015, 8, 9647–9665. [Google Scholar] [CrossRef]
- Hasanipanah, M.; Naderi, R.; Kashir, J.; Noorani, S.A.; Zeynali Aaq Qaleh, A. Prediction of blast-produced ground vibration using particle swarm optimization. Engineering with Computers 2017, 33, 173–179. [Google Scholar] [CrossRef]
- Monjezi, M.; Hasanipanah, M.; Khandelwal, M. Evaluation and prediction of blast-induced ground vibration at Shur River Dam, Iran, by artificial neural network. Neural Computing and Applications 2013, 22, 1637–1643. [Google Scholar] [CrossRef]
- Khandelwal, M.; Singh, T. Prediction of blast-induced ground vibration using artificial neural network. International Journal of Rock Mechanics and Mining Sciences 2009, 46, 1214–1222. [Google Scholar] [CrossRef]
- Ragam, P.; Nimaje, D. Assessment of blast-induced ground vibration using different predictor approaches-a comparison. Chemical Engineering Transactions 2018, 66, 487–492. [Google Scholar]
- Tiile, R.N. Artificial neural network approach to predict blast-induced ground vibration, airblast and rock fragmentation; Missouri University of Science and Technology, 2016.
- Ghasemi, E.; Ataei, M.; Hashemolhosseini, H. Development of a fuzzy model for predicting ground vibration caused by rock blasting in surface mining. Journal of Vibration and Control 2013, 19, 755–770. [Google Scholar] [CrossRef]
- Khandelwal, M. Evaluation and prediction of blast-induced ground vibration using support vector machine. International Journal of Rock Mechanics and Mining Sciences 2010, 47, 509–516. [Google Scholar] [CrossRef]
- Yang, Y.; Zhang, Q. A hierarchical analysis for rock engineering using artificial neural networks. Rock mechanics and rock engineering 1997, 30, 207–222. [Google Scholar] [CrossRef]
Figure 1.
Layout of Orapa Diamond Mine.
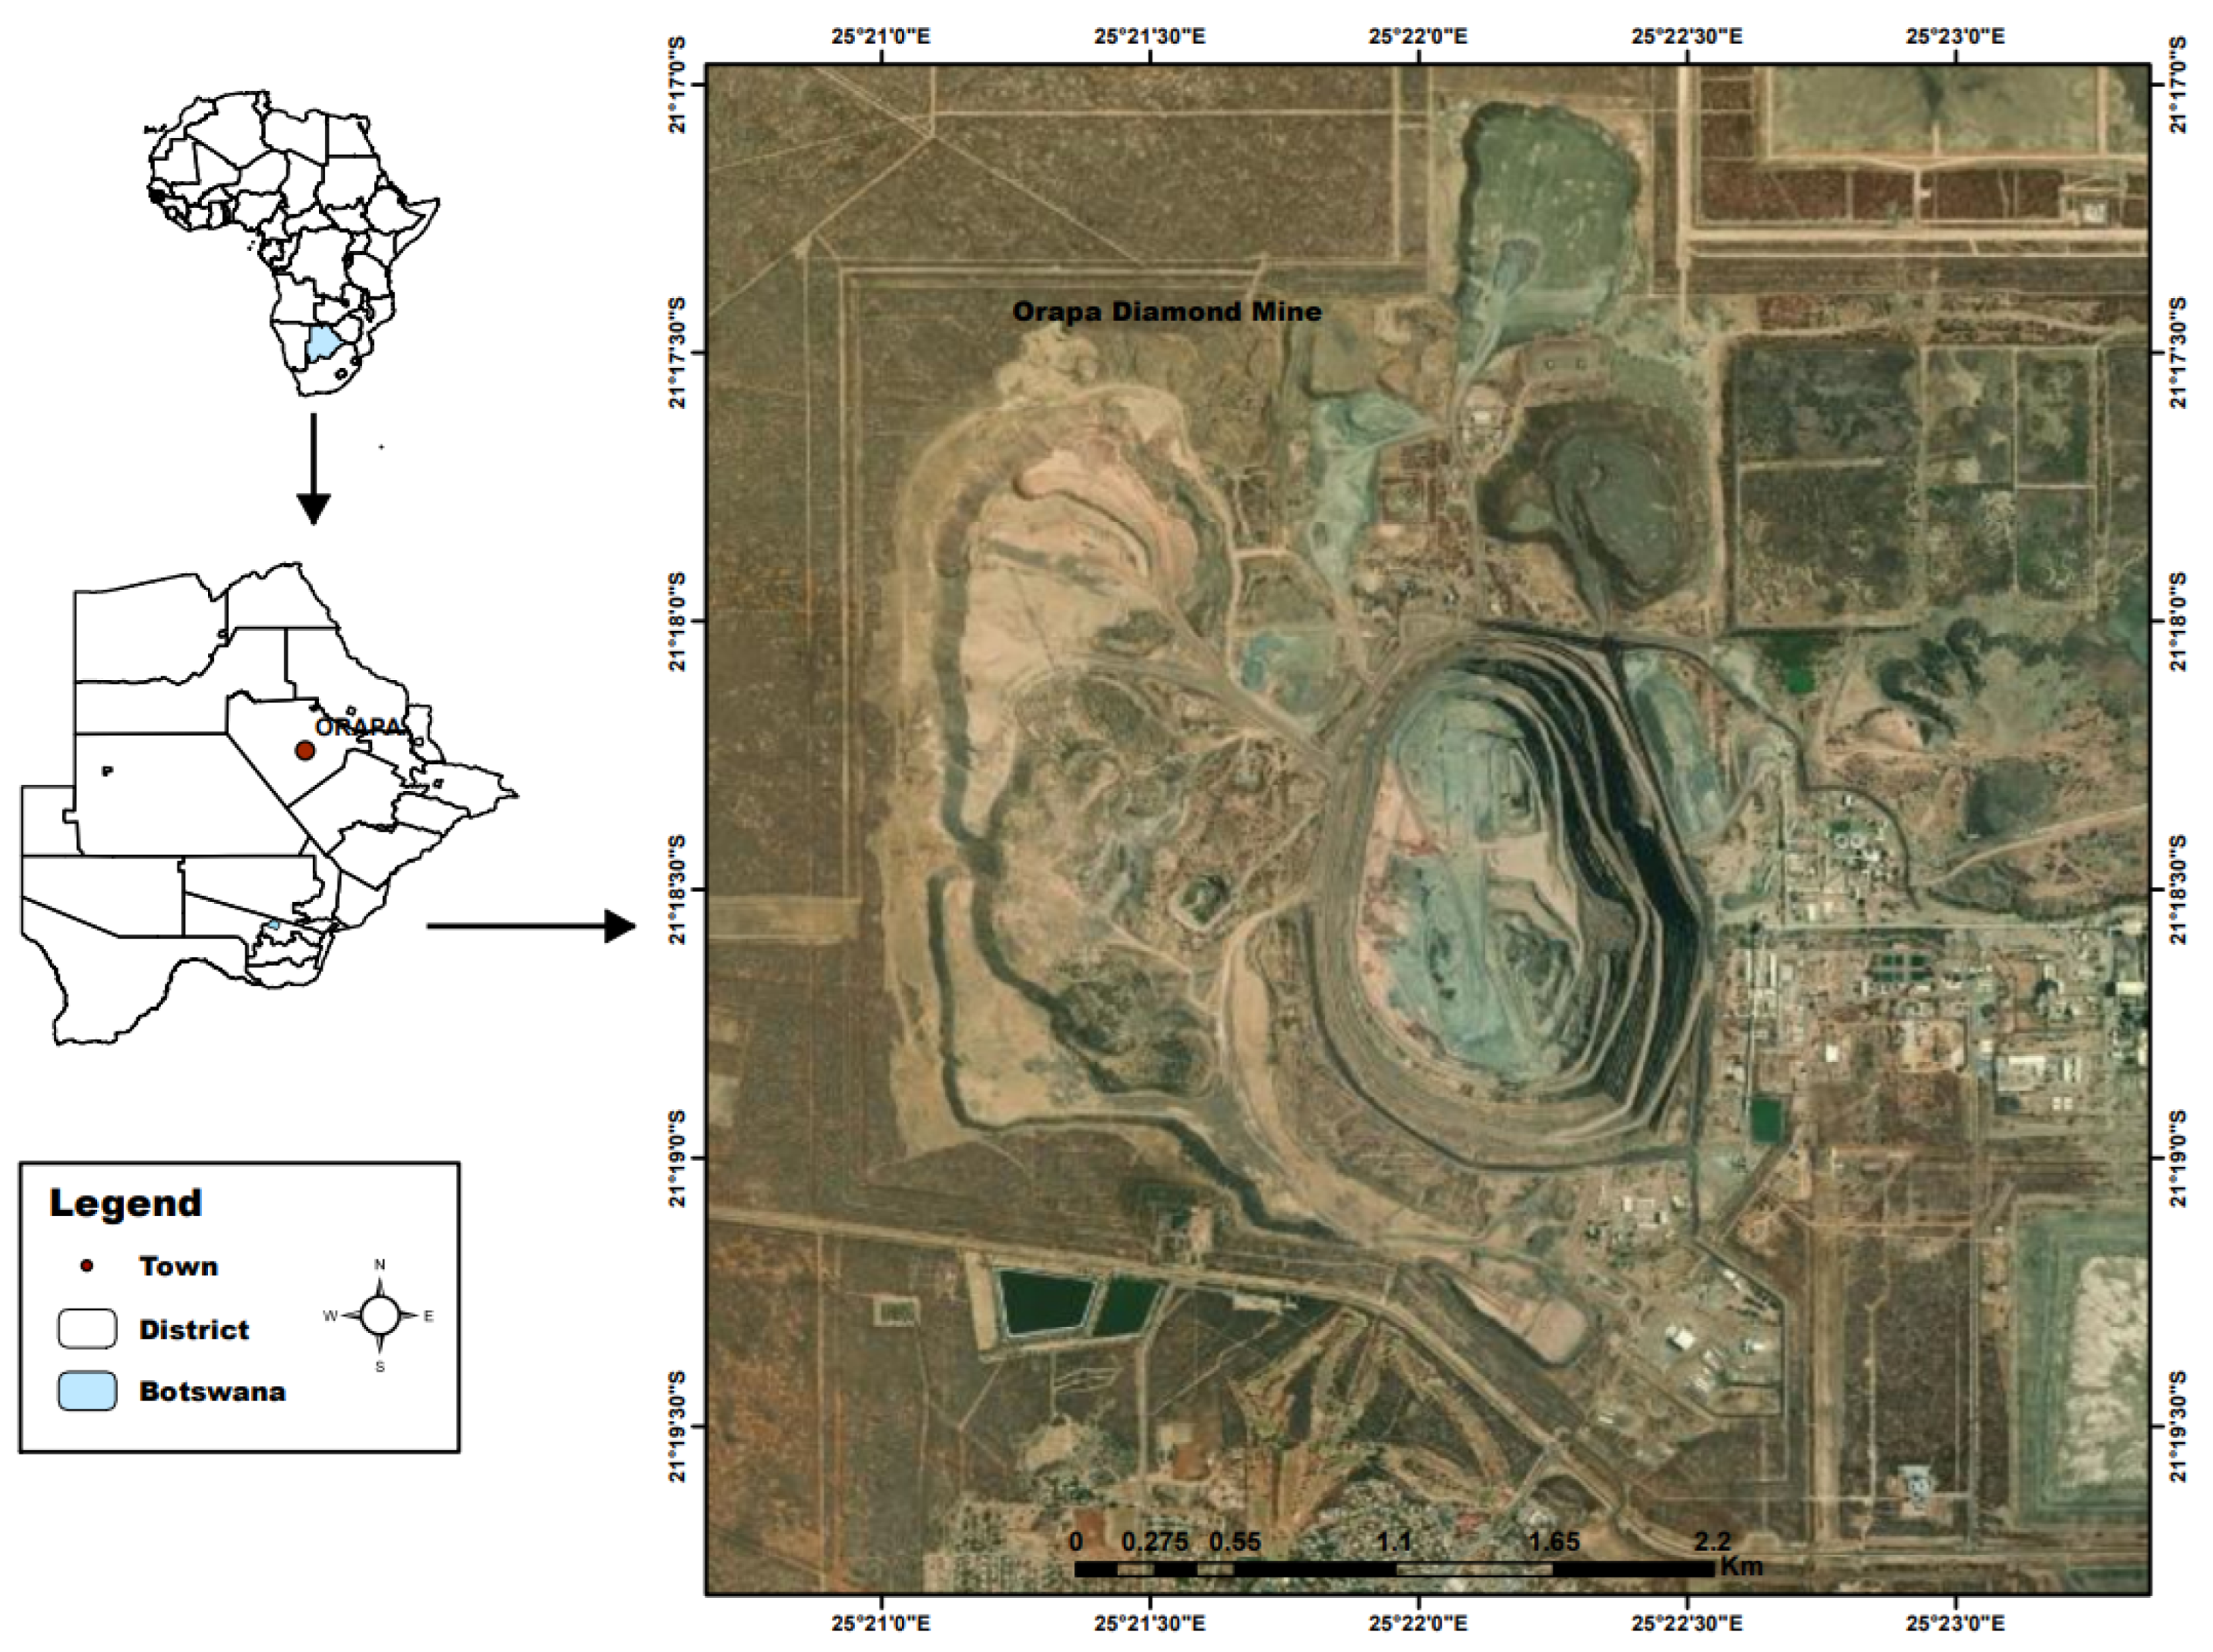
Figure 2.
The RMSE values for different models, where (a) is for KNN, (b) is for RF, (c) is for ANN, and (d) is for SVM.
Figure 2.
The RMSE values for different models, where (a) is for KNN, (b) is for RF, (c) is for ANN, and (d) is for SVM.
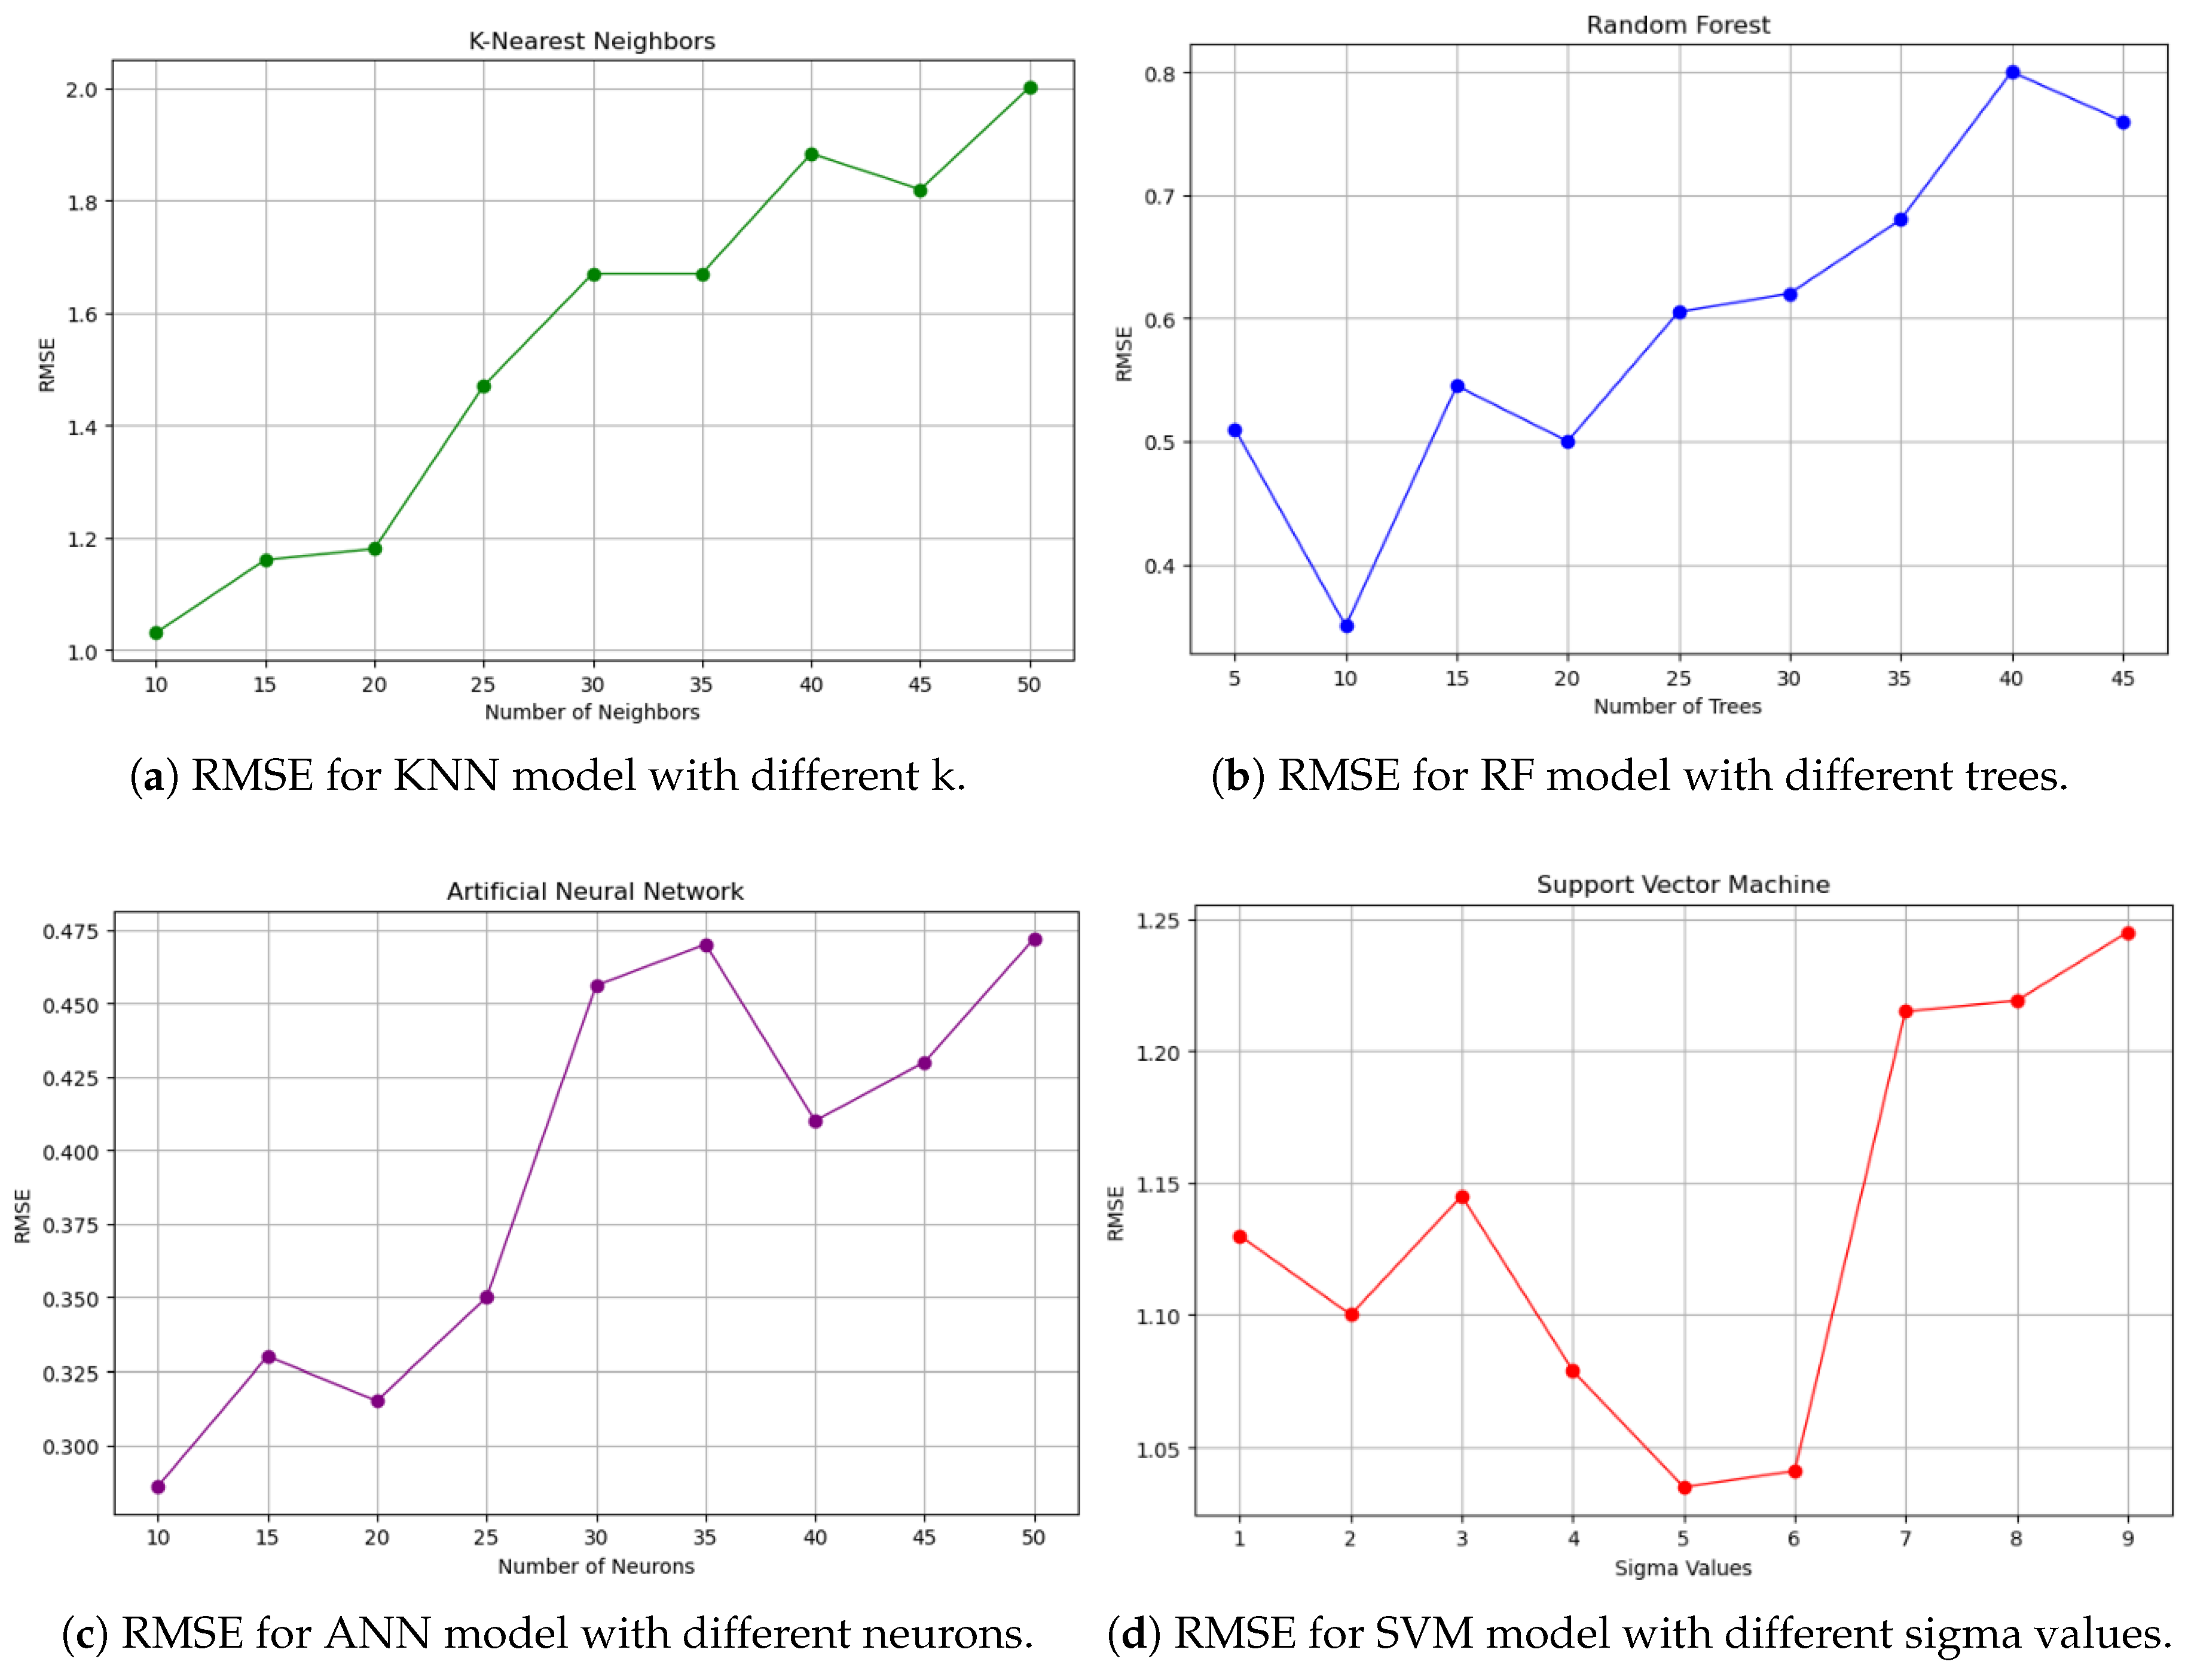
Figure 3.
Scatter plots for all the models.
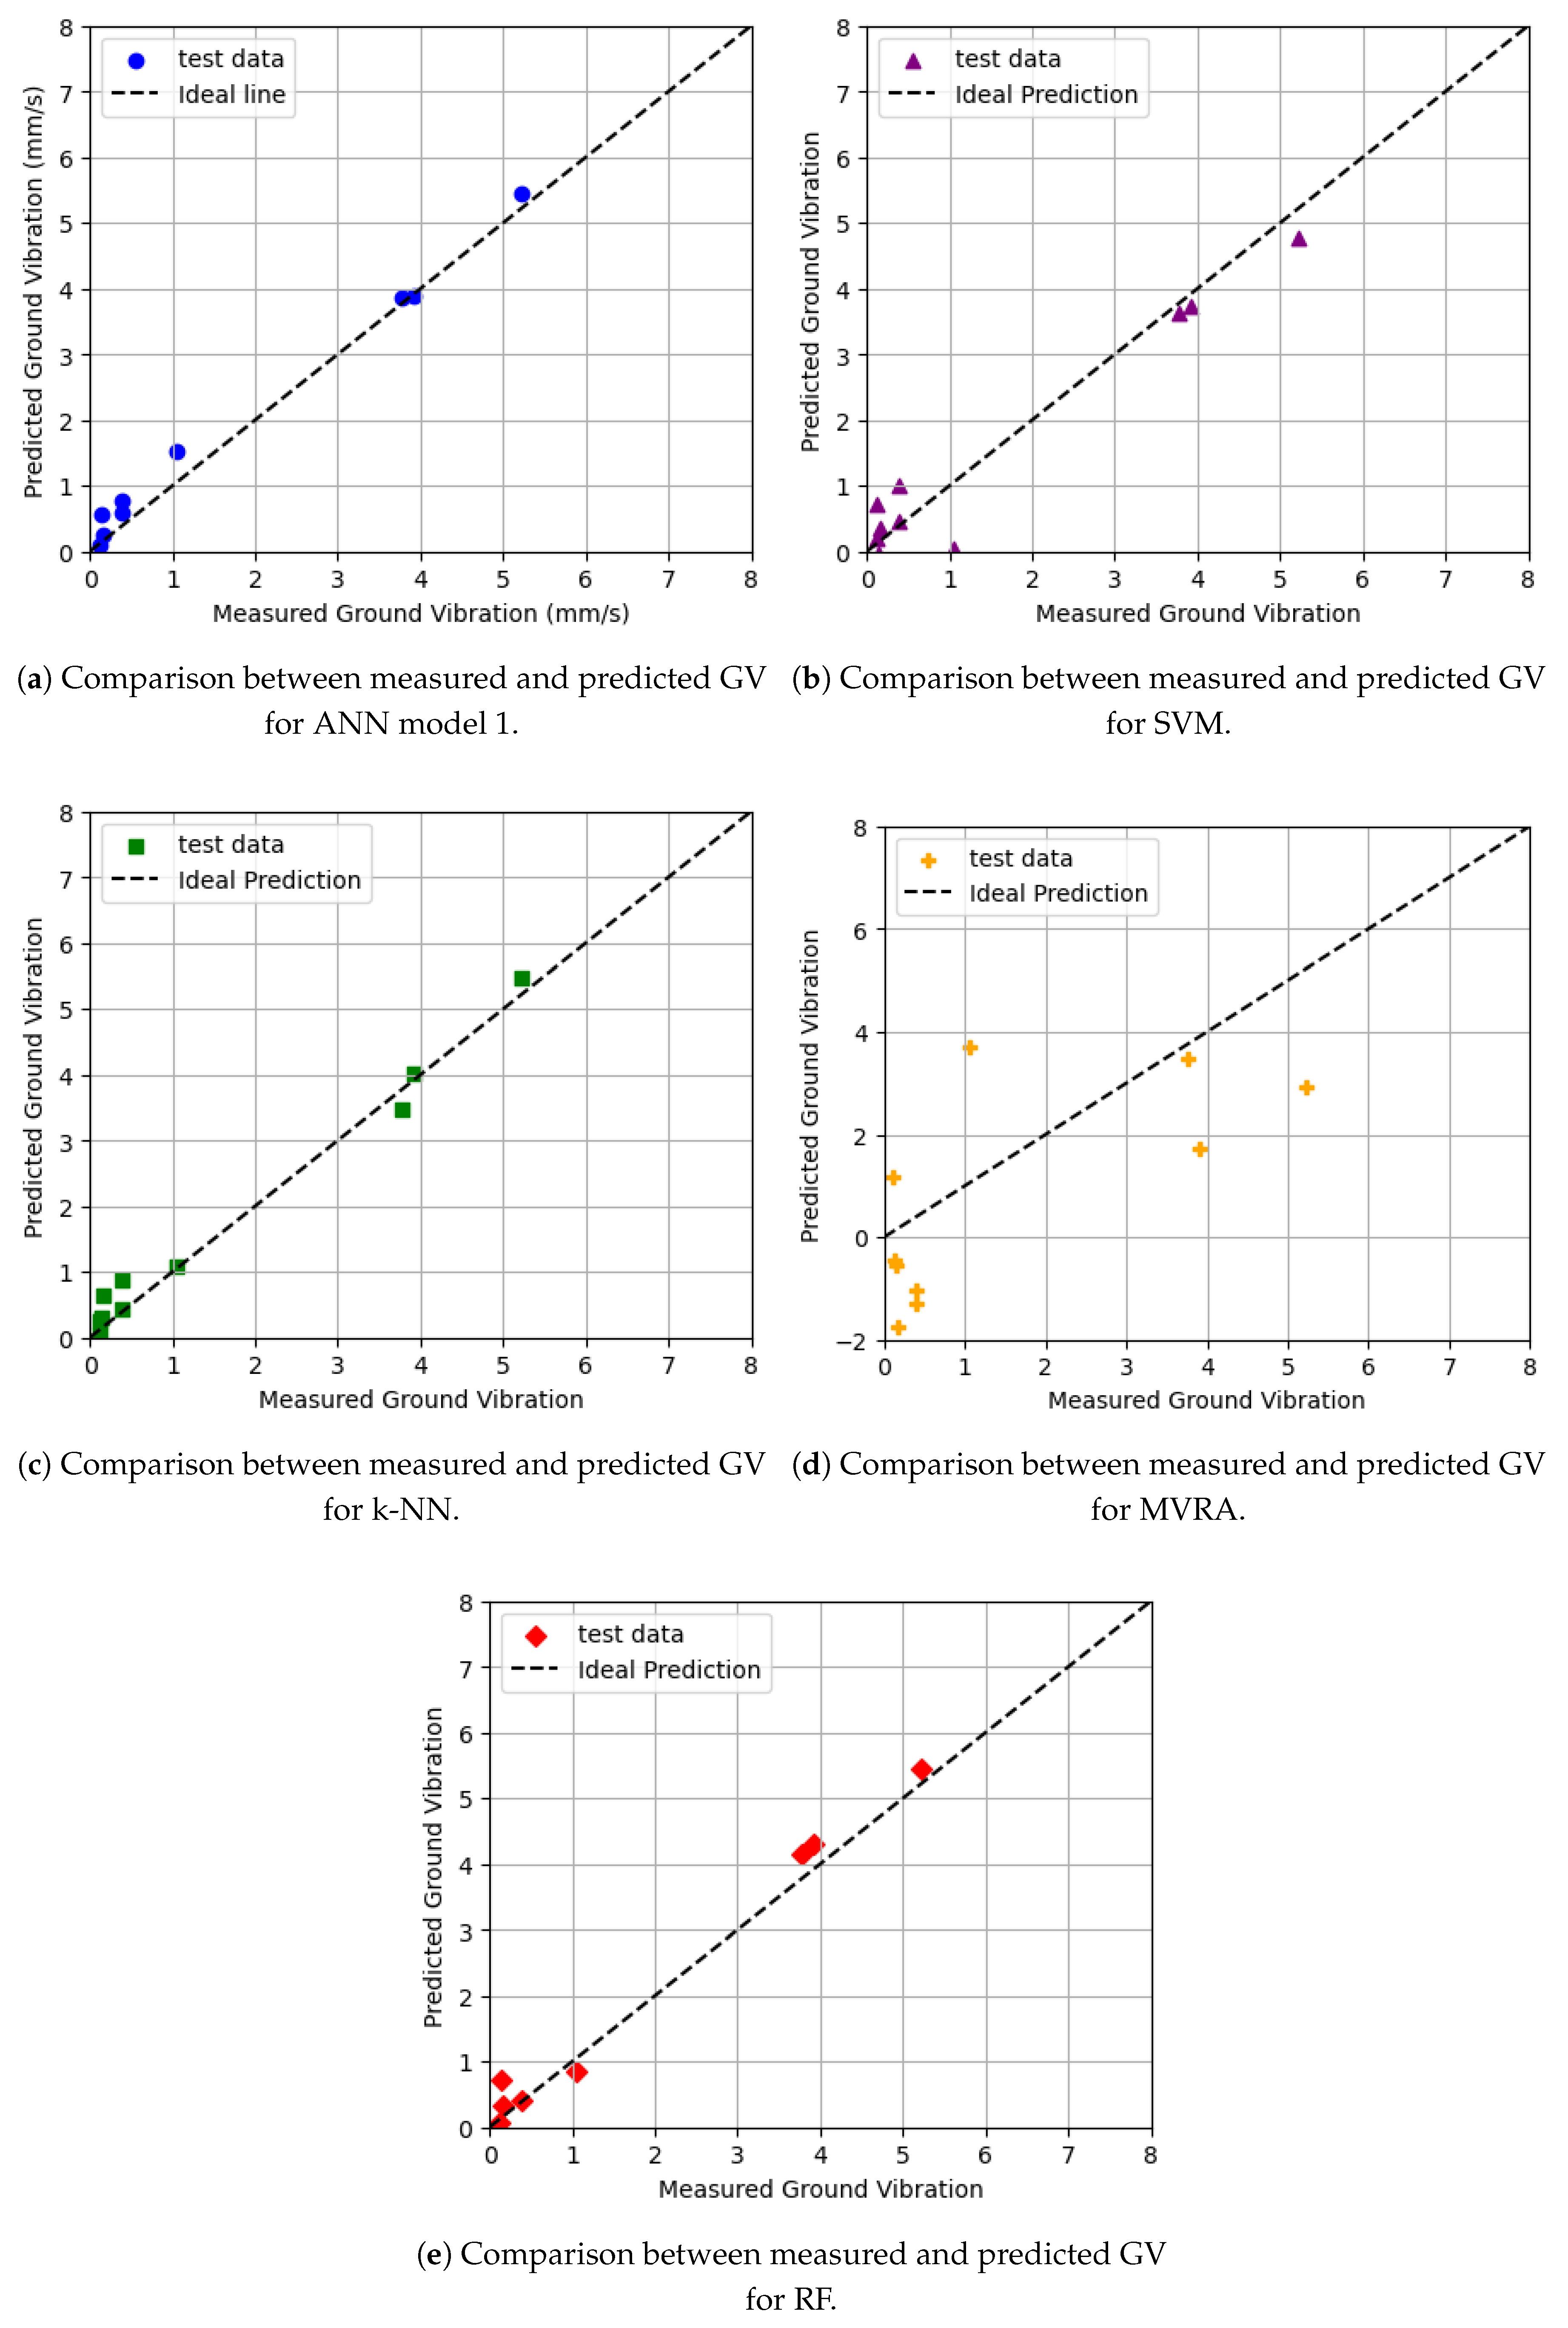
Figure 4.
Comparison between measured and predicted GV by all algorithms.
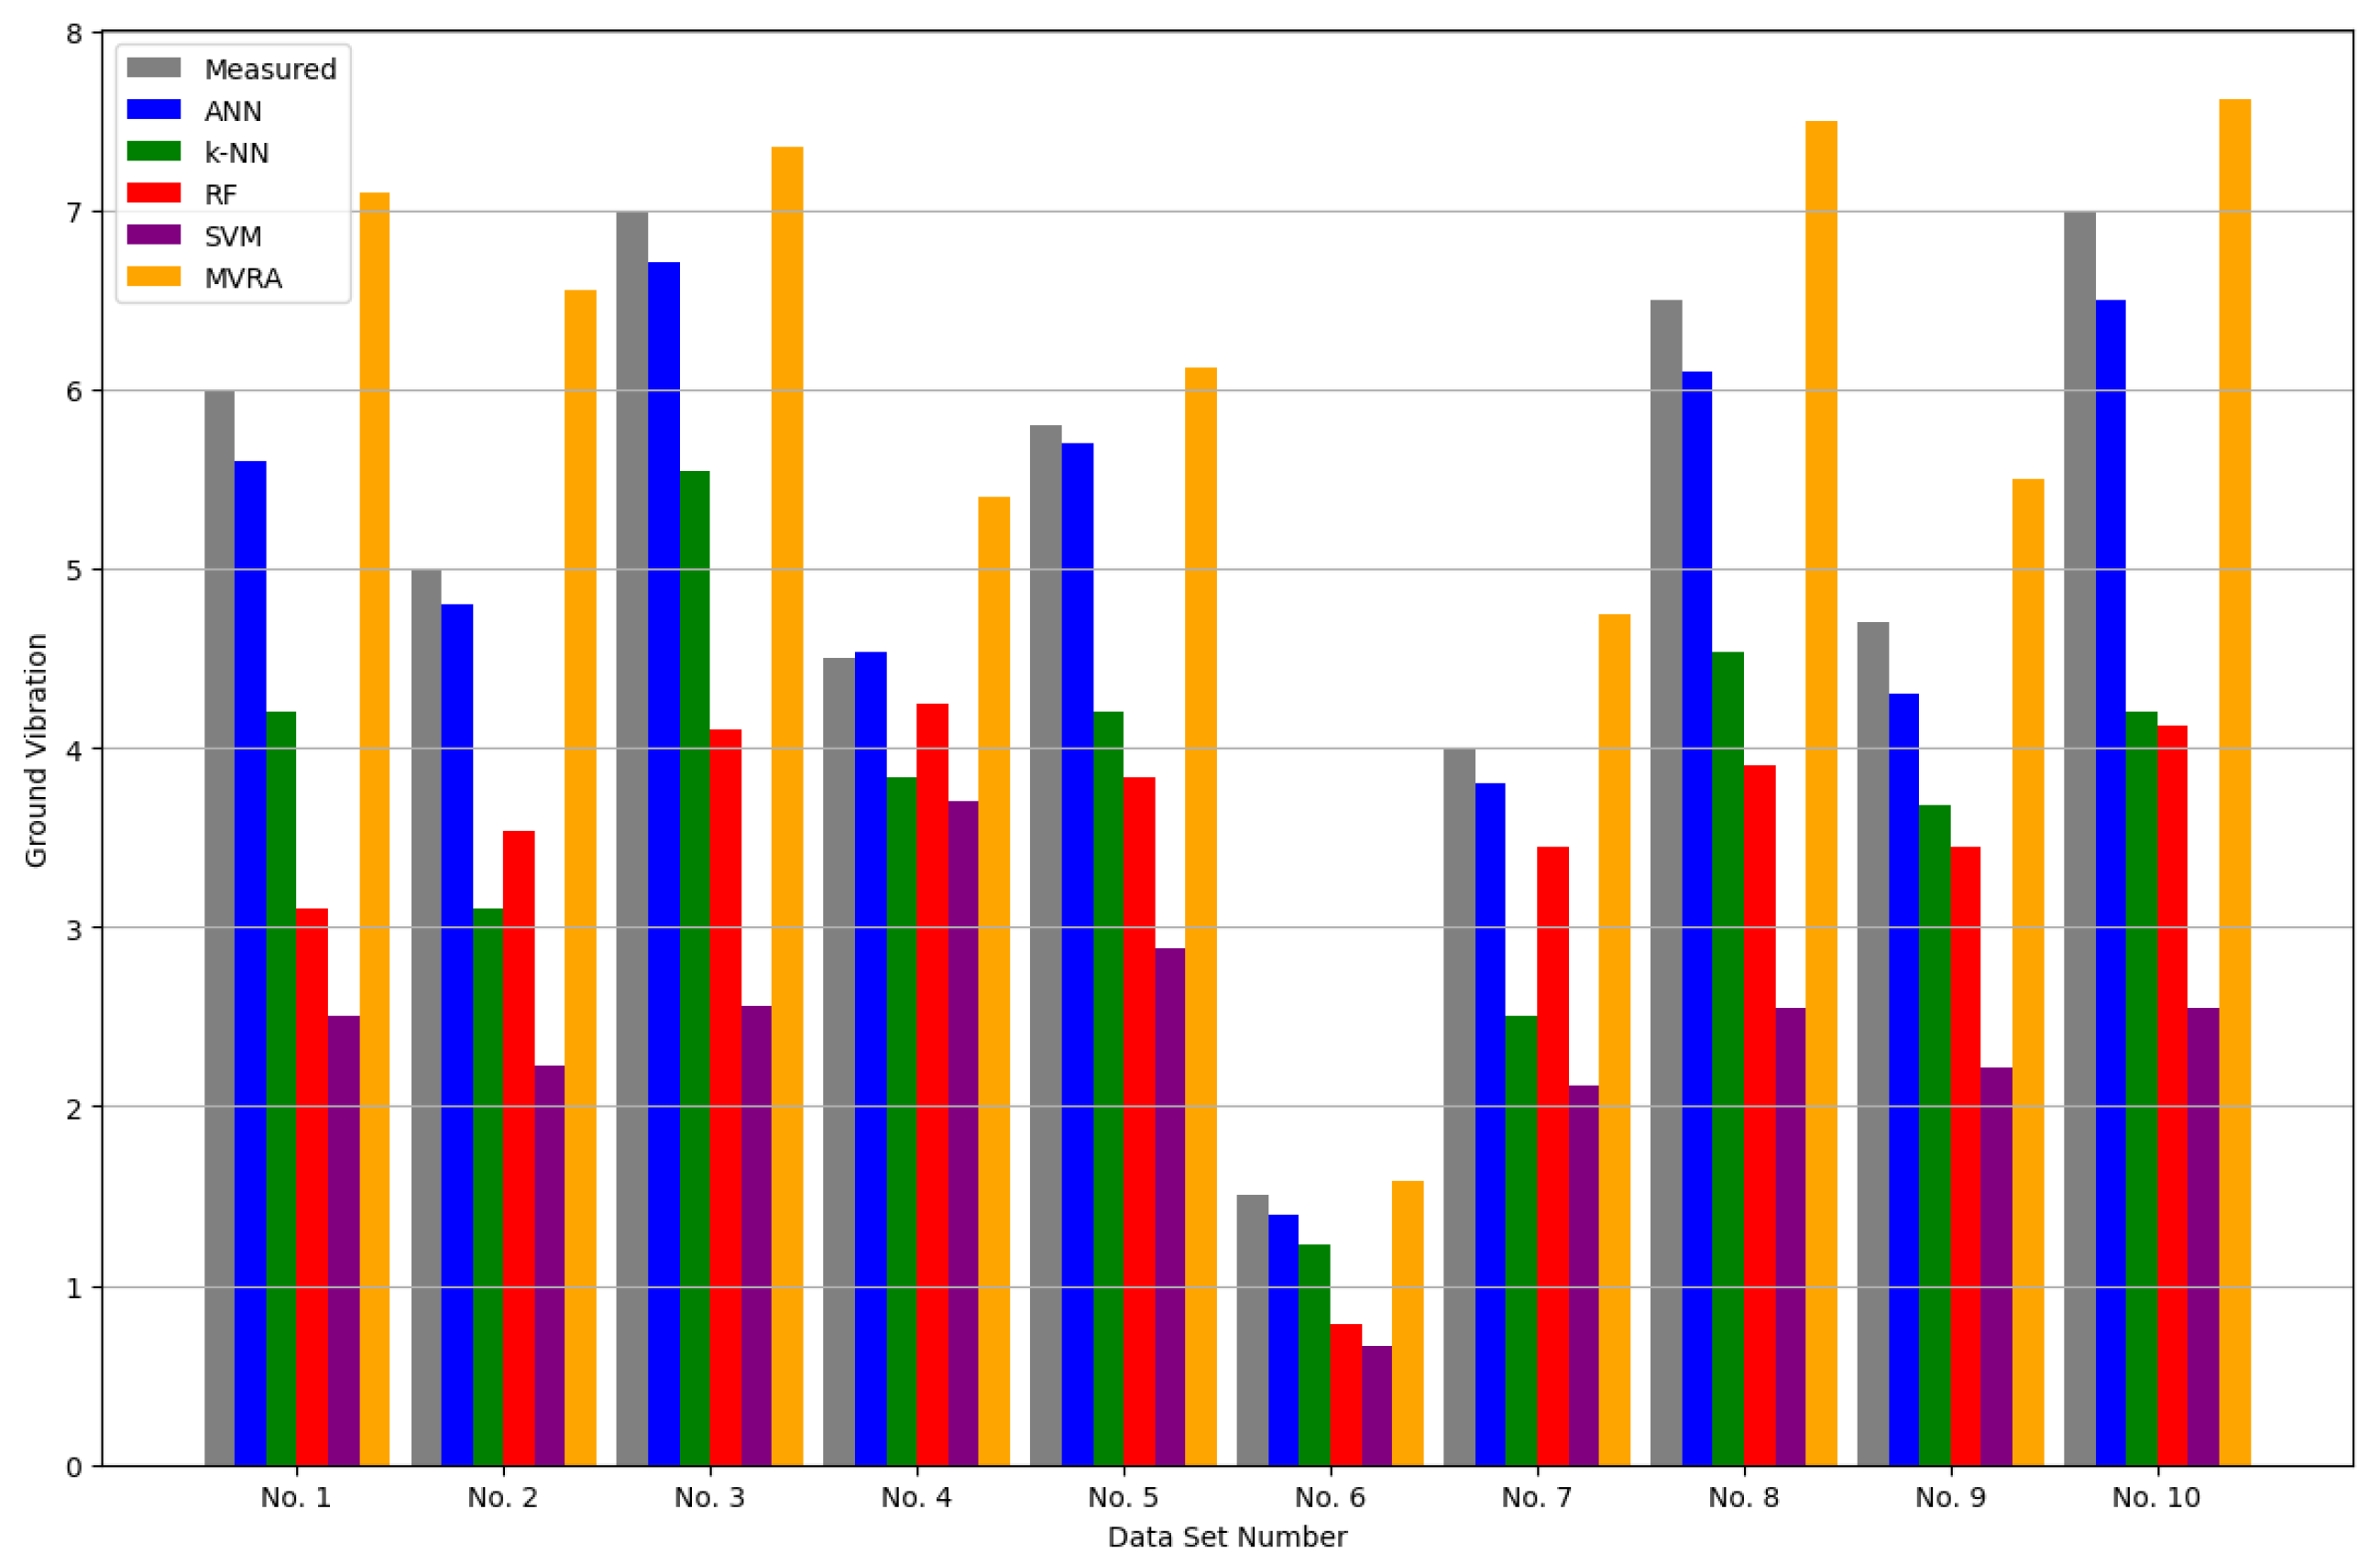
Figure 5.
Sensitivity analysis for ground vibration.
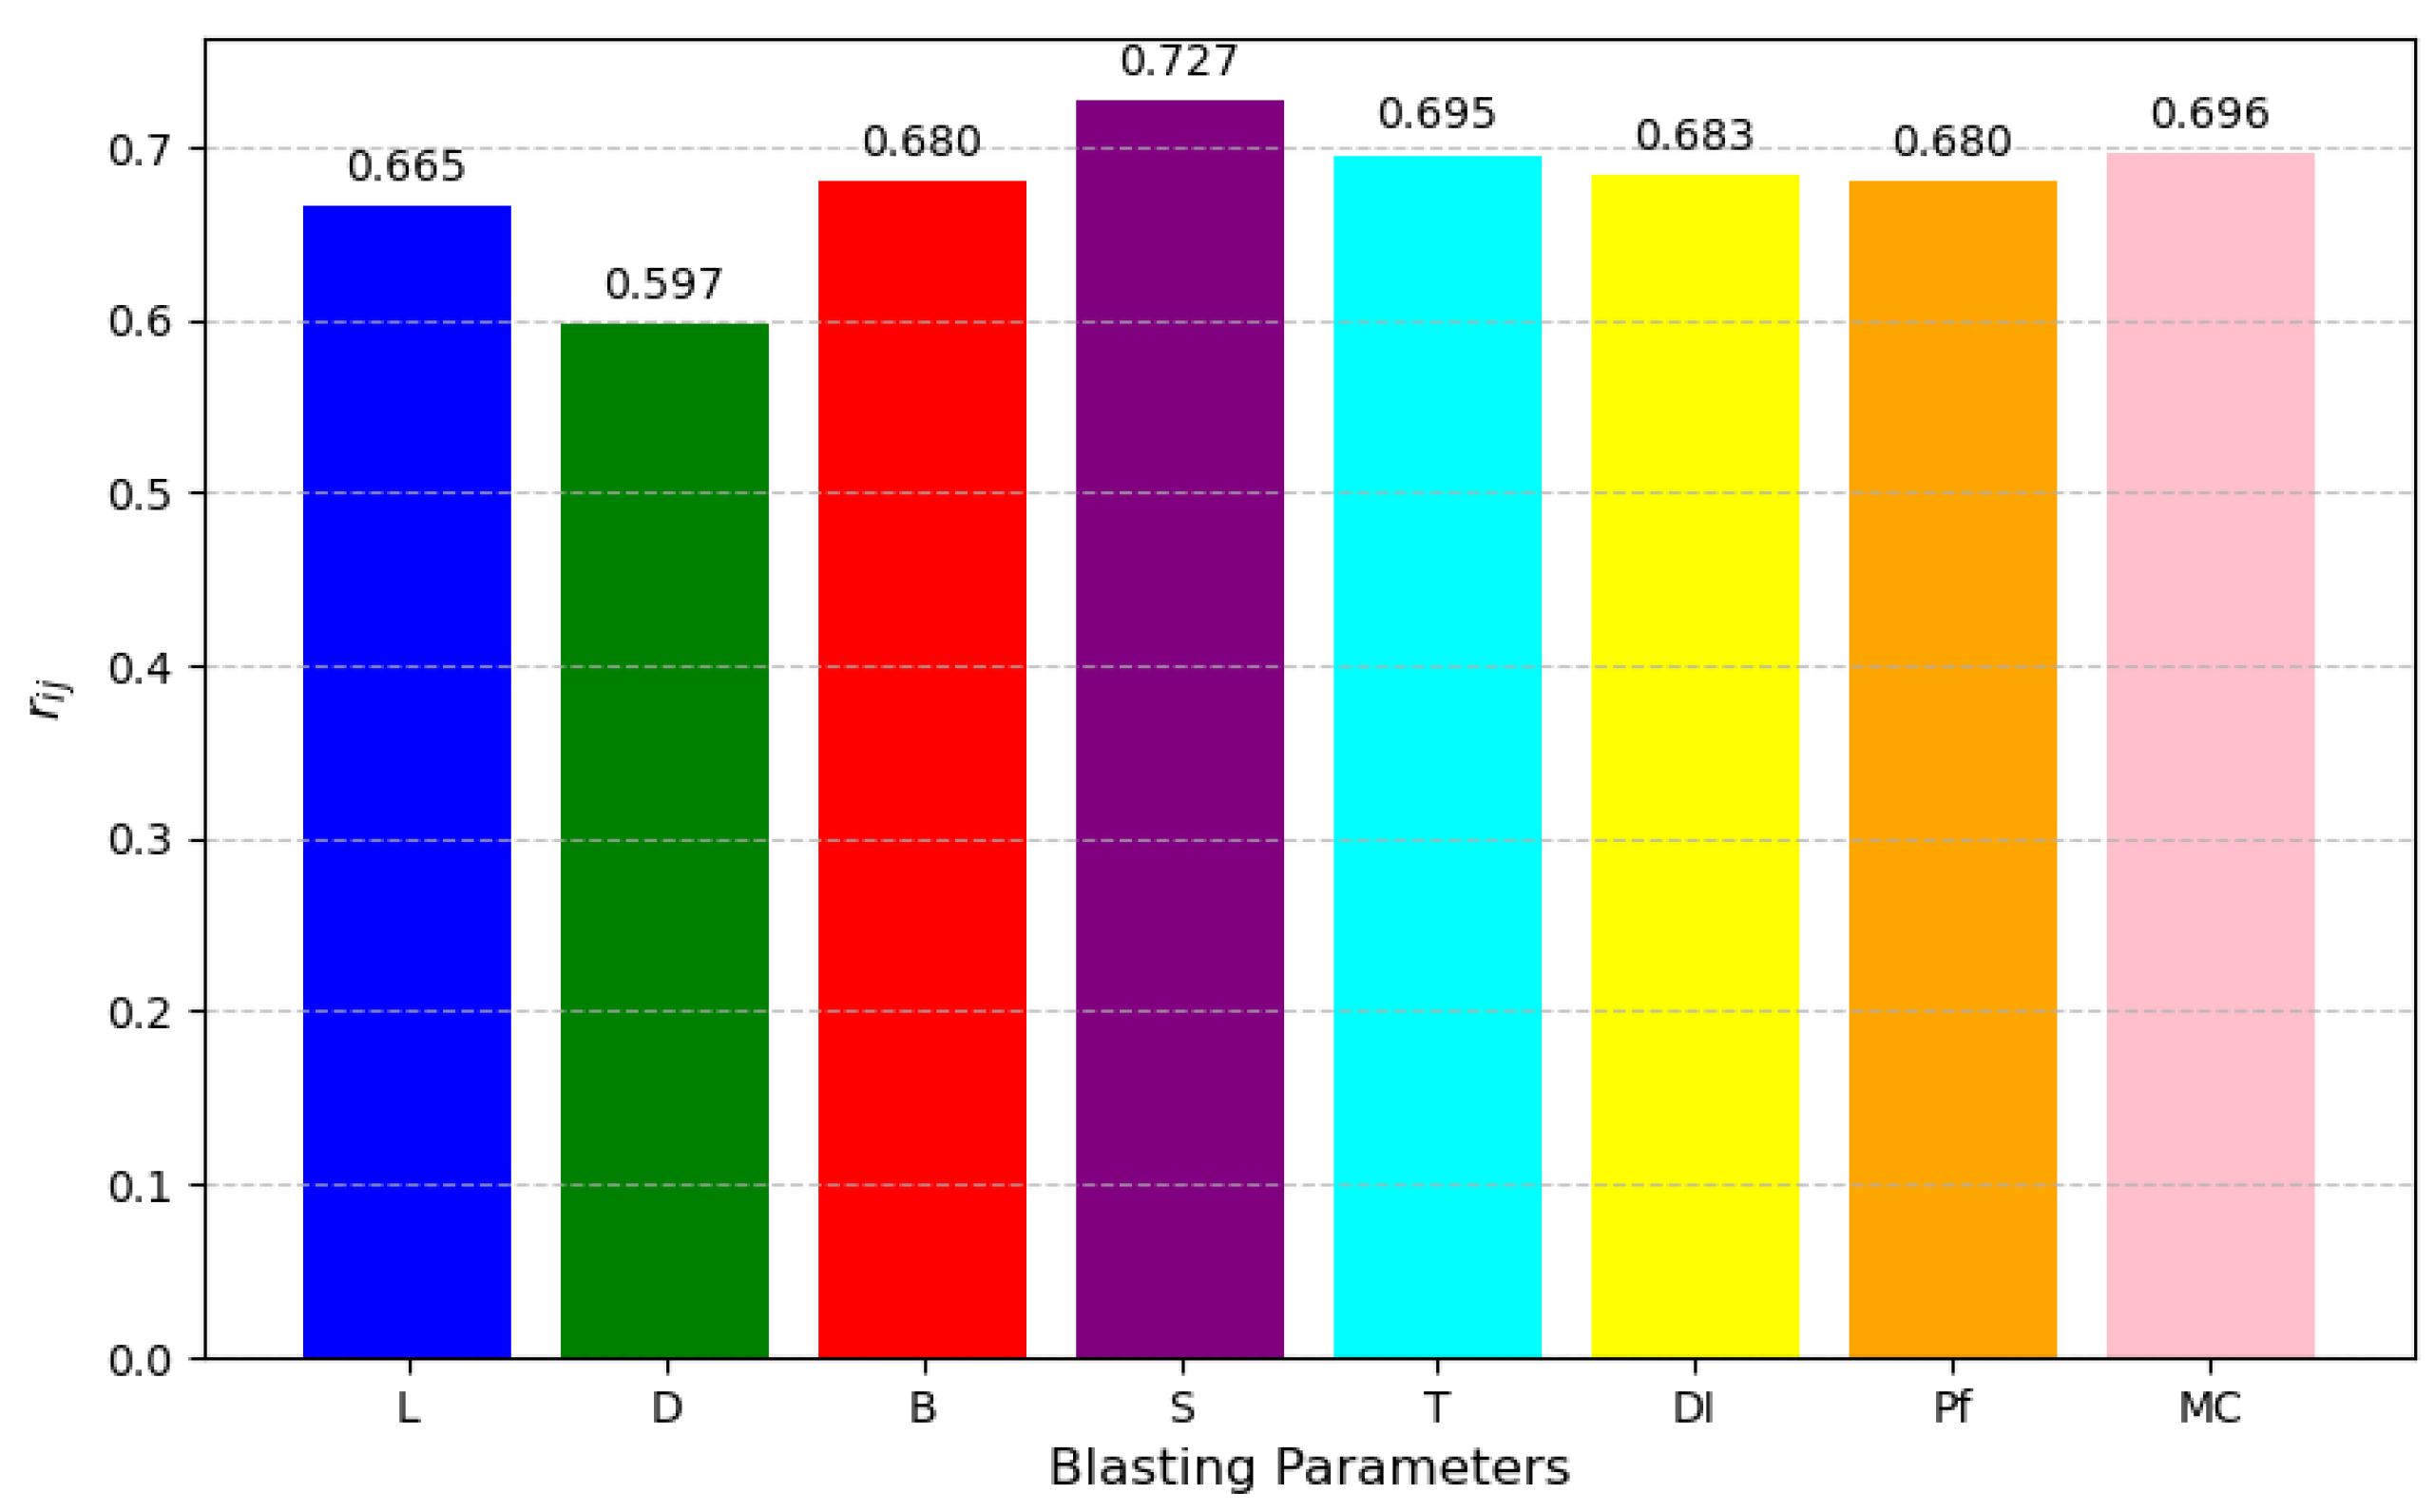
Figure 6.
Solution space for ground vibration as the output parameter with eight input parameters, taken two at a time. The red dots are random initial values that always converge to the optimal point, the blue dot, for every minimisation computation.
Figure 6.
Solution space for ground vibration as the output parameter with eight input parameters, taken two at a time. The red dots are random initial values that always converge to the optimal point, the blue dot, for every minimisation computation.
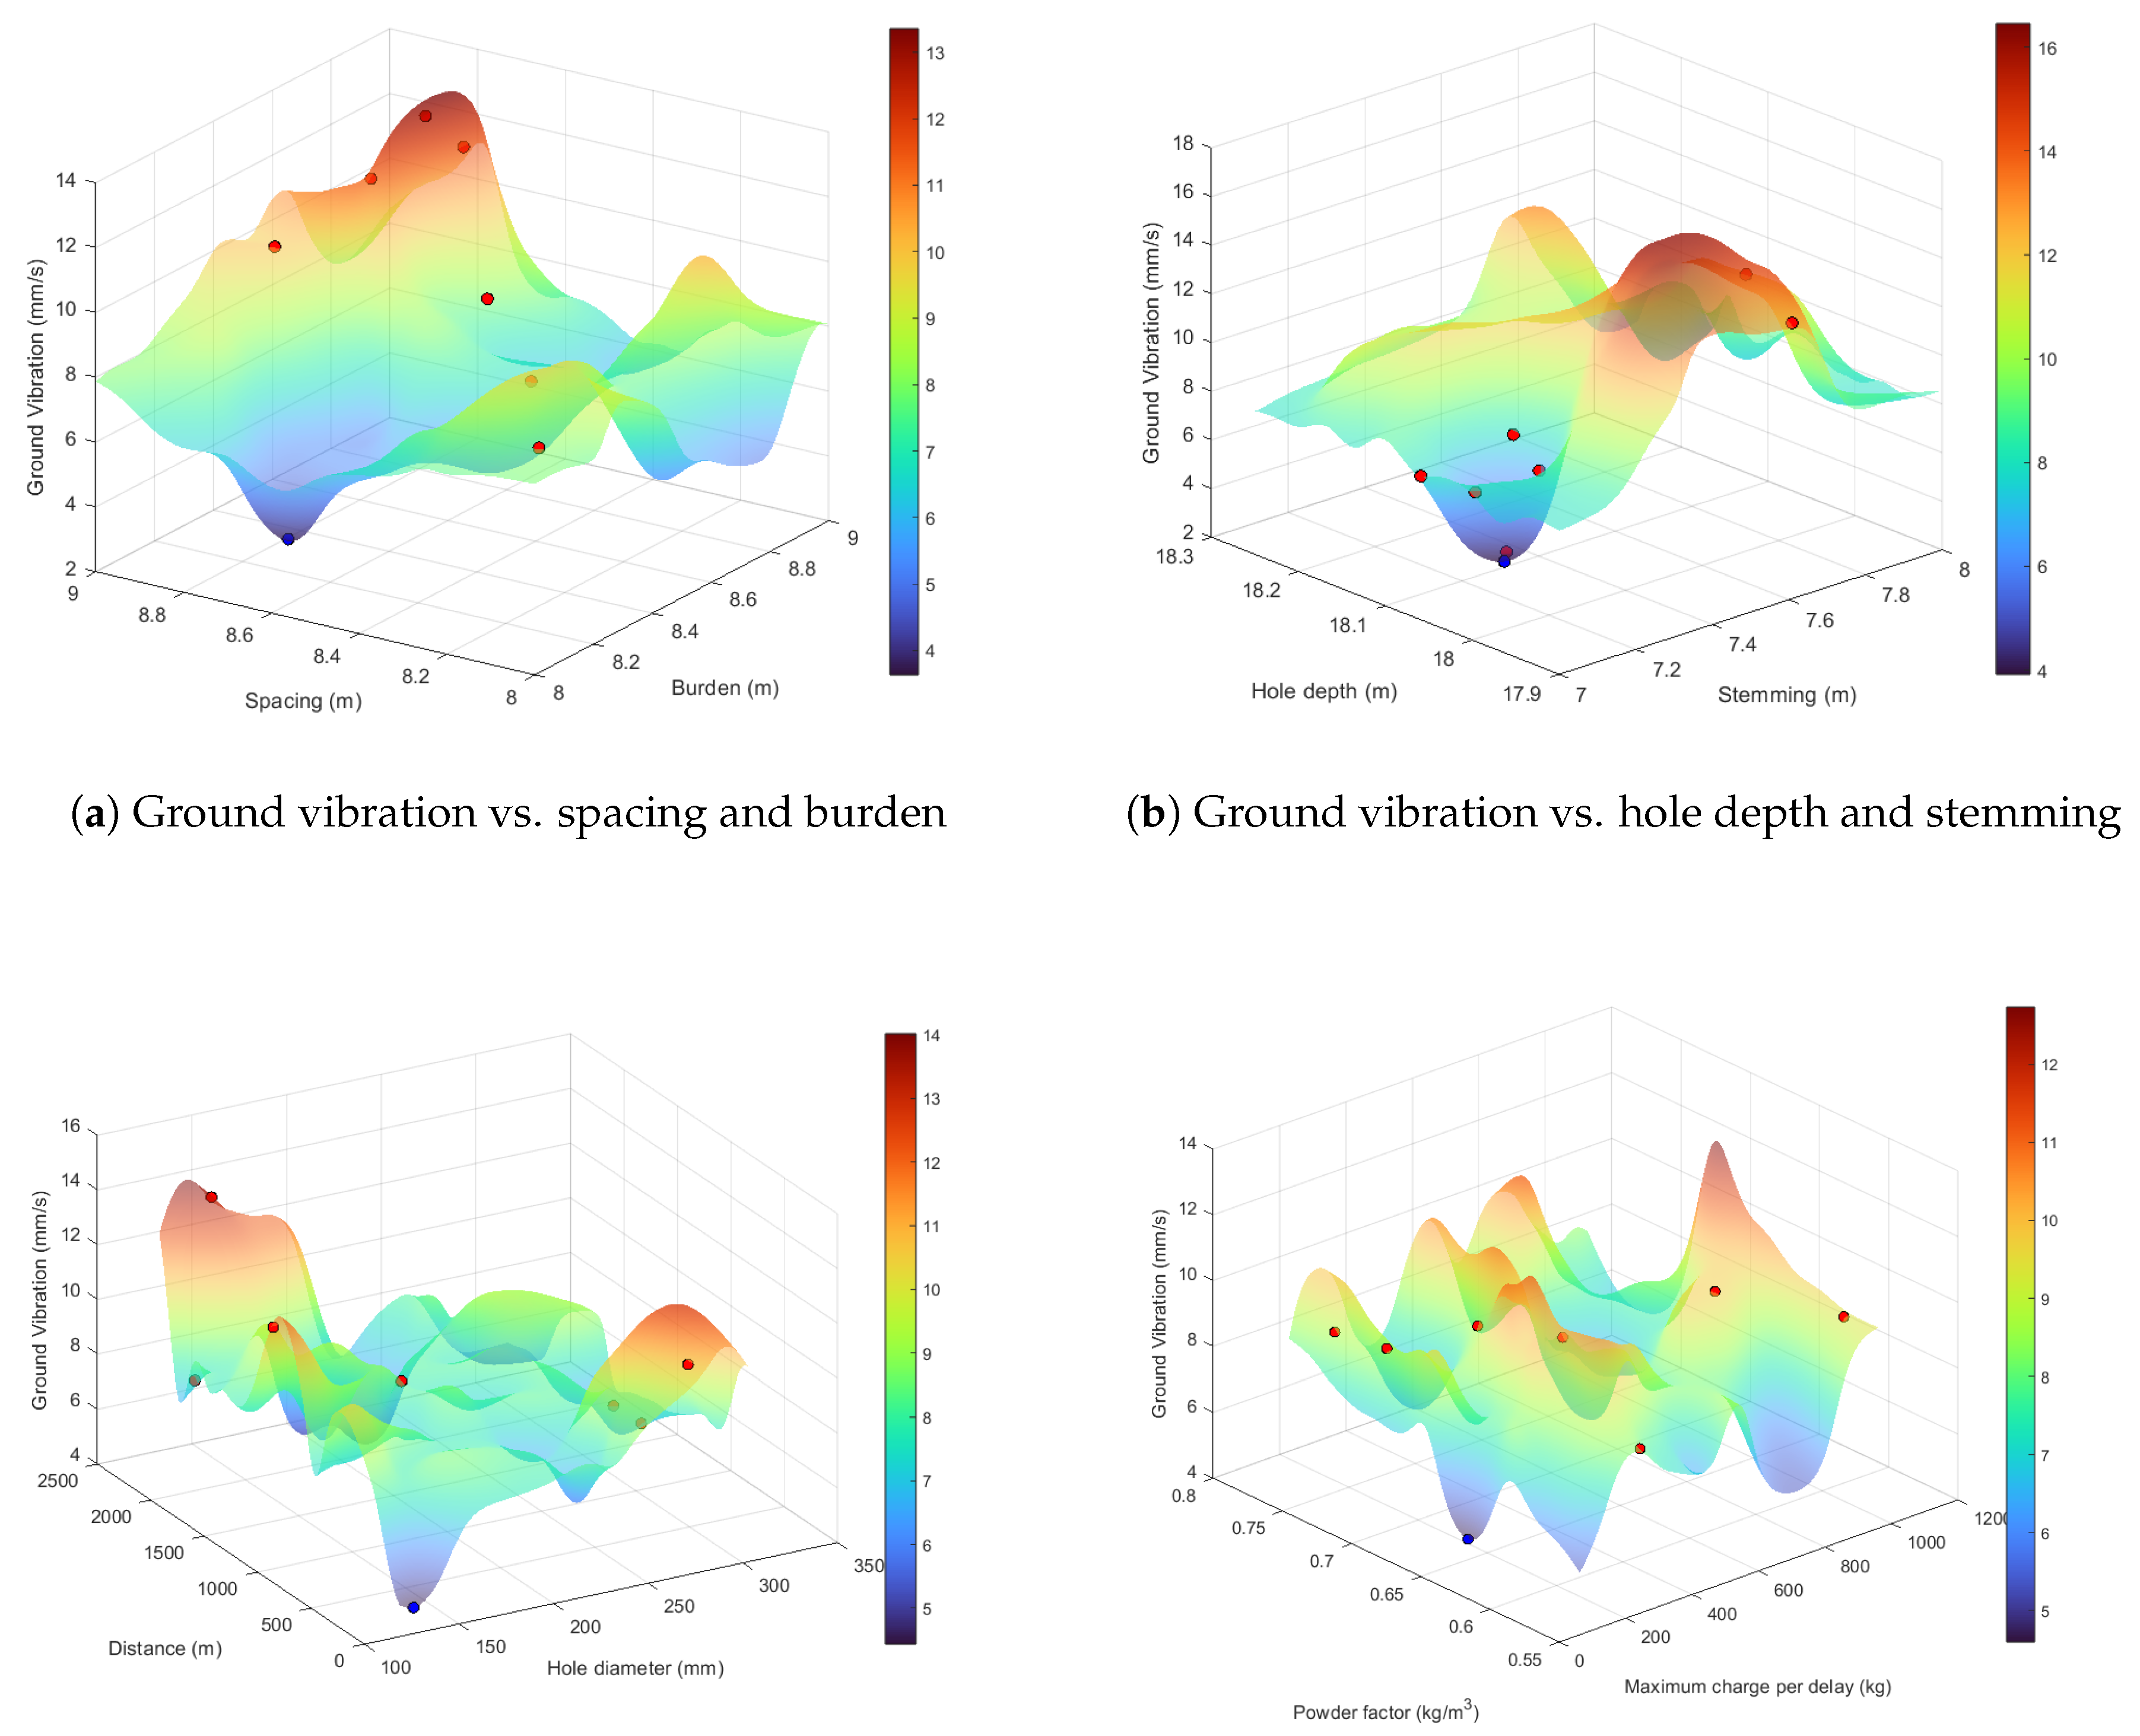
Figure 7.
Ground vibration versus spacing, the most influential input parameter, presented in a 2D plot. The values of the other seven input parameters at the optimal point are kept constant, while spacing is plotted in its entire range. Each curve plotted in subfigure (b) is one of the seven input parameters. Subfigure (a) shows a 3D plot where stemming, the second most influential parameter, is kept constant in the traced curve that includes the blue dot which is the minimum point. The red dots are random initial points converging to the blue dot at every optimisation computation.
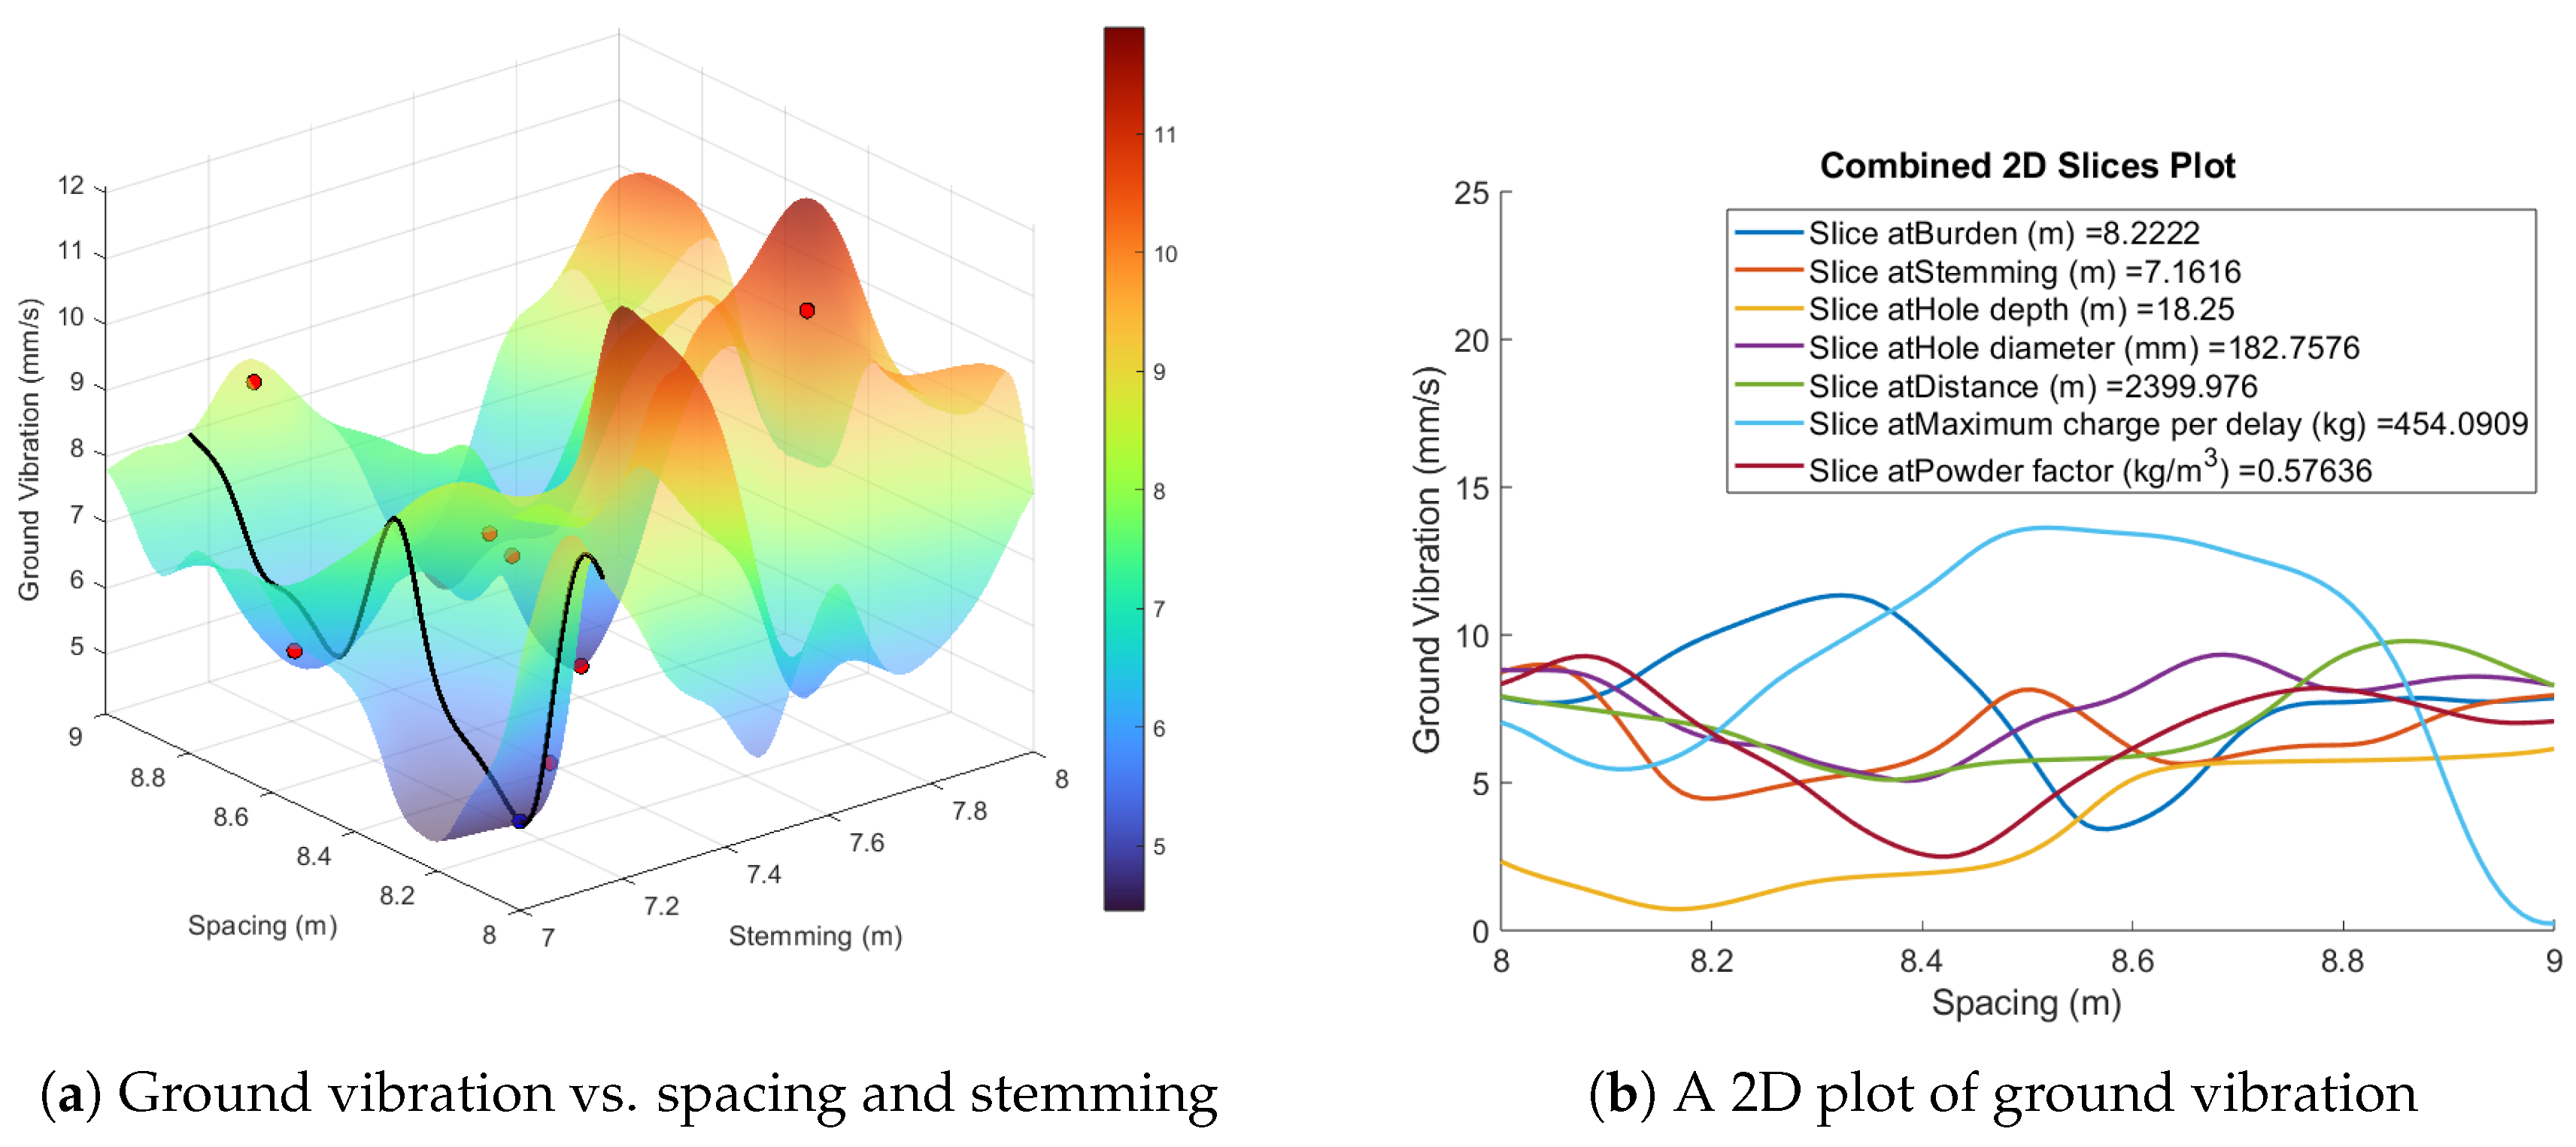

Table 1.
Description of the input and output parameters for the models.
| Parameter | Type | Unit | Symbol | Min | Max |
|---|---|---|---|---|---|
| Burden | input | m | B | 4 | 6 |
| Spacing | input | m | S | 5 | 8 |
| Stemming length | input | m | T | 4 | 6 |
| Hole depth | input | m | L | 12 | 15 |
| Hole diameter | input | mm | D | 165 | 250 |
| Distance from blast to monitoring point | input | m | DI | 438 | 1500 |
| Maximum charge per delay | input | kg | MC | 216 | 552.6 |
| Powder Factor | input | Pf | 0.3 | 1.17 | |
| Ground vibration | output | mm/s | GV | 0.163 | 6.5 |
Table 2.
The calculated performance indices for all the algorithms.
| Method | RMSE | Composite Score | |
|---|---|---|---|
| K nearest neighbor | |||
| n-neighbors = 10 | 0.728 | 1.030 | 1.454 |
| n-neighbors = 20 | 0.643 | 1.180 | 1.329 |
| n-neighbors = 30 | 0.528 | 1.670 | 1.084 |
| n-neighbors = 40 | 0.550 | 1.884 | 1.049 |
| n-neighbors = 50 | 0.582 | 2.002 | 1.050 |
| Support vector machine | |||
| sigma = 1 | 0.675 | 1.130 | 1.374 |
| sigma = 3 | 0.696 | 1.145 | 1.391 |
| sigma = 5 | 0.720 | 1.035 | 1.445 |
| sigma = 7 | 0.596 | 1.215 | 1.275 |
| sigma = 9 | 0.590 | 1.245 | 1.260 |
| Random forest | |||
| n-estimators=5 | 0.904 | 0.510 | 1.768 |
| n-estimators=15 | 0.892 | 0.545 | 1.748 |
| n-estimators=25 | 0.865 | 0.605 | 1.705 |
| n-estimators=35 | 0.856 | 0.680 | 1.676 |
| n-estimators=45 | 0.848 | 0.760 | 1.646 |
| Artificial neural network | |||
| model 1 (10 neurons) | 0.941 | 0.286 | 1.864 |
| model 2 (20 neurons) | 0.912 | 0.315 | 1.829 |
| model 3 (30 neurons) | 0.898 | 0.456 | 1.778 |
| model 4 (40 neurons) | 0.890 | 0.410 | 1.800 |
| model 5 (50 neurons) | 0.862 | 0.472 | 1.737 |
| Multivariate regression analysis | 0.664 | 3.760 | 0.664 |
Table 3.
Performance indices from other studies.
| Best Model | Other Models | Inputs | Dataset | Reference | |
|---|---|---|---|---|---|
| ANFIS | L, B, S, T, Q, DI | 25 | 0.89 | [25] | |
| RF | CART, CHAID, | BS, DI, T | 102 | 0.94 | [15] |
| ANN, SVM, RF | MC, PF, L | ||||
| HKM-ANN | ANN, SVR, FCM-ANN | S, Pf, B | 185 | 0.98 | [17] |
| HKM-SVR, FCM-SVR | DI, MC | ||||
| ANFIS-GA | ANFIS, ANFIS-PSO | B, S, T | 86 | 0.98 | [18] |
| USBM, Indian Standard | Pf, MC, DI | ||||
| GEP | BS, L, T, Pf, Q, DI | 102 | 0.88 | [22] | |
| SVM | USBM, MLR, PSO power, PSO linear | DI, MC | 80 | 0.96 | [32] |
| WOA-XGBoost | GWO-XGBoost, BO-XGBoost, | D, L, B, S, MC | 150 | 0.97 | [16] |
| CatBoost, RF, GBR | CL, DI, BI | ||||
| E, PR, Pv, VOD, DOE | |||||
| ANFIS | ANN | DI, MC | 109 | 0.97 | [31] |
| PSO-ANN | ANN, DA-ANN | Q, Nh, DI, RMR | 56 | 1.00 | [13] |
| ANN | MC, DI, TC | 20 | 0.93 | [33] | |
| ANN | MVRA, Indian Standard | L, MC | 174 | 0.99 | [34] |
| Langefors-Kihlstrom, USBM | B, S | ||||
| General predictor, Ambraseys-Hendron | DI, BI, E, PR, Pv | ||||
| GRNN | USBM, CMRI, Indian Standard | MC, DI | 14 | 0.99 | [35] |
| Langefors-Kihlstrom, Ambraseys-Hendron | |||||
| ANN | USBM, Indian Standard, MVRA | MC, DI, BS, L, T, D, Pf | 180 | 0.99 | [36] |
| Langefors-Kihlstrom, Ambraseys-Hendron | |||||
| FIS | USBM, Indian Standard | B, S | 120 | 0.94 | [37] |
| Langefors-Kihlstrom, Ambraseys-Hendron | T, N | ||||
| CMRI, Ghosh-Daemen 1, Ghosh-Daemen 2 | MC, DI | ||||
| MVRA, General predictor | |||||
| ANN | GEP | D, L, N ,B, S | 15 | 0.81 | [30] |
| RDI, HDI, T, Q | |||||
| SVM | USBM, Indian Standard, MVRA | DI, MC | 174 | 0.96 | [38] |
| Langefors-Kihlstrom, Ambraseys-Hendron | |||||
| Ghosh-Daemen, CMRI, General predictor | |||||
| FS-RF | FS-BN, Langefors-Kihlstrom | MC, DI, B, D, TC, S | 102 | 0.90 | [5] |
| Ghosh-Daemen, Roy, Indian Standard | L, T, Sd, N, Pf, Q | ||||
| ANN-KNN | ANN, USBM | MC, DI | 75 | 0.88 | [23] |
| RVR-GWO | BA-GWO | MC, BS, D, T | 95 | 0.84 | [28] |
USBM, United States Bureau of Mines; MLR, Multi-Linear Regression; GBR, Grad+i+ent Boosting Regression; GRNN, Generalised Regression Neural Network; GEP, Gene Expression Programming; CMRI, Central Mining Research Institute; FIS, Fuzzy Inference System; FS, Feature Selection; `RVR, Relevance Vector Regression; GWO, Grey Wolf Optimisation; BA, bat-inspired algorithm; BN, Bayesian Network; BS, Burden to Spacing Ratio; Q, Charge per Delay; Sd, Subdrill; Total Charge, TC; DI, Distance; Number of holes, N; MC, Maximum Charge per Delay; BI, Blastability Index; E, Young’s Modulus; PR, Poisson’s Ratio; VOD, Velocity of Detonation; DOE, Density of Explosives; Pv, P-wave Velocity.
Disclaimer/Publisher’s Note: The statements, opinions and data contained in all publications are solely those of the individual author(s) and contributor(s) and not of MDPI and/or the editor(s). MDPI and/or the editor(s) disclaim responsibility for any injury to people or property resulting from any ideas, methods, instructions or products referred to in the content. |
© 2025 by the authors. Licensee MDPI, Basel, Switzerland. This article is an open access article distributed under the terms and conditions of the Creative Commons Attribution (CC BY) license (http://creativecommons.org/licenses/by/4.0/).
Copyright: This open access article is published under a Creative Commons CC BY 4.0 license, which permit the free download, distribution, and reuse, provided that the author and preprint are cited in any reuse.


