
Submitted:
26 March 2025
Posted:
29 March 2025
You are already at the latest version
Abstract
Traditional portfolio optimization models primarily focus on two key elements: risk and return. In this study, we extend this classical framework by introducing a third critical dimension—liquidity. We propose a novel model in mean–risk–liquidity framework that incorporate second-order entropy into the Markowitz portfolio theory. Our models assign flexible weights based on the investor’s preferences regarding return and entropy, highlighting the role of diversification as a potential enhancer of liquidity. Building on this approach, we derive analytical expressions that offer concrete solutions to the portfolio optimization problem. Computational results validating our models are presented and comments in the final.
Keywords:
portfolio selection
; entropy
; risk estimation
; optimization
MSC: 91B28
1. Introduction
The financial market is a complex system, in which investors need to make a tradeoff between return and risk in an uncertain environment. The portfolio selection problem is faced by an investor who wants to allocate his wealth among different assets within a market The financial market is a complex and dynamic system in which investors must navigate uncertainty and make trade-offs between return and risk. The portfolio selection problem arises when an investor seeks to allocate their wealth among various assets in a manner that aligns with their specific preferences and investment objectives. The foundational methodology for portfolio optimization was introduced in the seminal work of Markowitz [12], whose theory remains well-documented and widely applied [3,13,25]. Markowitz’s framework focuses on constructing portfolios composed of risky assets, using historical data such as asset returns, variances, and correlations between asset returns. By leveraging first- and second-order linear statistics, the model provides an optimal strategy for combining assets into an efficient portfolio. The primary goal is to maximize expected return for a given level of risk or, conversely, to minimize risk for a given level of expected return. Over the years, various extensions to the classical Markowitz model have been proposed, aiming to improve the risk measurement component. Konno and Yamazaki [9] suggested using absolute deviation, while Speranza [18] introduced semi-absolute deviation as alternatives to variance. Other researchers, such as King and Jensen [8], King [7], and Markowitz et al. [14], advocated for semivariance as a more appropriate risk metric. Hamza and Janssen [3] developed a linear approach to solve large-scale portfolio optimization problems by employing asymmetric risk functions, which relax the assumption of normally distributed returns. Additional models have incorporated practical constraints such as transaction costs. For instance, Yoshimoto [23] proposed a portfolio optimization system that accounts for transaction costs, solved using nonlinear programming techniques. Hamza and Janssen [3] employed separable programming methods to tackle similar issues. Although these models offer more realistic frameworks, some are computationally demanding and cannot be solved using conventional quadratic programming methods, often compromising on solution accuracy. Wang and Liu [21] highlighted that the choice of risk measurement technique can significantly influence the resulting portfolio structure. One such alternative measure is entropy. Shannon [16] introduced a nonlinear framework for estimating entropy, which was later extended by Yager [22] through the maximum entropy principle. Wang and Parkan [20] developed the minimax disparity model, a linear entropy-based approach that minimizes the maximum discrepancy among asset weights. Philippatos and Wilson [15] were the first to associate Shannon entropy with portfolio risk, proposing its use as a measure of diversification. They argued that entropy offers a more general representation of risk than variance, as it does not rely on assumptions of symmetric probability distributions and can be computed from non-metric data. Simonelli [17] further demonstrated that Shannon entropy is more effective than variance and other deviation-based metrics in constructing optimal portfolios. Zhou [27] emphasized the growing application of entropy as a valid uncertainty measure in finance, supported by numerous empirical studies. The studies, such as those by Jiang et al. [5] and Zheng et al. [25], have successfully integrated Shannon entropy into portfolio models, replacing variance in the classical mean–variance framework and extending its applicability to sectors like electricity purchasing. Additionally, robust optimization methods have emerged as a response to estimation errors in expected returns and covariances. These techniques aim to enhance portfolio stability by considering worst-case scenarios. Moreover, recent models incorporate insights from behavioral finance, including Prospect Theory and Behavioral Mean-Variance Optimization, to account for investor biases and psychological factors [1,19].
Motivated by these developments, the present paper proposes an entropy-based portfolio optimization model that maximizes second-order entropy, with weights determined by the investor’s preference for return and diversification. As a case study, we apply the model to optimize a portfolio composed of two or three assets, over the period January–March 2025.
2. Materials and Methods
2.1. Mean - Second Order Entropy – Variance Model to Porfolio Optimization
In this section, we develop a portfolio optimization model that incorporates return, second-order entropy, and variance as core components. The model seeks to maximize a weighted combination of expected return and entropy, subject to a risk constraint expressed via variance. This approach enhancesdiversification and liquidity, while ensuring that the overall risk remains within an acceptable level, as defined by the investor.
Tsallis Entropy : where
(For in Tsallis entropy we obtain the informational entropy introduced by O.0nicescu, given by )
Second order entropoy (Tsallis with ):
Remarks:
1. For a given portfolio, this kind of entropy measures the correlation degree of the assets from the portfolio ()
2. A lower entropy implies greater concentration (lower diversification), whereas a higher entropy reflects greater diversification, which may contribute positively to portfolio liquidity
Optimization Problem Formulation
An optimization problem of portfolio is based on the model presented in Ke and Zhang [6], where we accord weightings, that depend on the importance given by the investor, to the return and the entropy (diversification can be useful to liquidity):
where ; is the number of time units; is average return of asset i; is average return of asset i at the period t; is the level of the risk and is assumed of investor;
Solving the portfolio optimization problem
Using the Lagrange multiplier method, we obtain:
Conditions of order 1 are given by:
Assembly of n relations we have
We obtain
Using the relationship (*) we get
, or
where the multiplier γ verify relation:
2.2. Case studies
Case n=2: Portfolio Optimization with Two Cryptocurrencies
In this section, we consider a simple two-asset portfolio composed of Bitcoin (BTC) and Ethereum (ETH), observed over the period 18 January 2025 – 21 March 2025. The purpose of this case study is to demonstrate the implementation of the mean–second-order entropy model described previously.
We choose the investor preference weights a = 0.75 for expected return and b = 0.25 for entropy, and we obtain the model:
max 0.75 (x₁⋅0.0565 + x₂⋅0.0133) - 0.25(x₁²+x₂²)
Using the formulas presented above we obtain
x₁ = 1.5 (0.0565 - 0.0698/2)+ γ/0.5 (0.033 - 0.8/2) + 0.5 = 0.53 - 0.74γ
= 1.5 (0.0133 - 0.0698/2)+ γ/0.5 (0.77 - 0.8/2) + 0.5 = 0.47 + 0.74γ
where the multiplier γ verify relations:
or (0.53 - 0.74γ)⋅0.033 + (0.47+0.74γ)⋅0.775 = 0.1,
We have 0.55γ + 0.38 = 0.1 or γ = - 0.51 and substituting back, the optimal portfolio allocation becomes: x₁ = 0.9074 and x₂ = 0.0926. This result indicates that, under the given preferences and market conditions, the optimal portfolio heavily favors Bitcoin (BTC), allocating approximately 90.74% of the capital to BTC and only 9.26% to ETH.
Case n=3 Portfolio Optimization with Three Cryptocurrencies
In this section, we consider a portfolio composed of three major cryptocurrencies: Bitcoin (BTC), Ethereum (ETH), and Solana (SOL), observed over the period 18 January 2025 – 21 March 2025. We apply the mean–second-order entropy model as described in the previous sections
We are going to use the mean - second order entropy model.
We choice a = 0.75 and b = 0.25 and we obtain the model:
max 0.75(x₁⋅0.0565+x₂⋅0.0133+x3⋅0.0755) - 0.25(x₁²+x22+x32)
Using the formulas presented above we obtain
x₁ = 1.5 (0.0565 - 0.048) + γ/0.5 (0.033-0.3) + 0.33 = 0.35 - 0.55γ
x₂ = 1.5 (0.0133 - 0.048) + γ/0.5 (0.77-0.3) + 0.33 = 0.28 + 0.94γ
x₃ = 1.5 (0.0755 - 0.048) + γ/0.5 (0.105-0.3) + 0.33 = 0.37 - 0.39γ
where the multiplier γ verify relations: x₁⋅0.033+x₂⋅0.775+x₃⋅0.105 = 0.1
or (0.35 - 0.55γ)⋅0.033 + (0.28 + 0.94γ)⋅0.775 + (0.37 - 0.39γ)⋅0.105 = 0.1.
We have 0.67γ + 0.26 = 0.1 i.e γ = - 0.24
We obtain x₁ = 0.462, x₂ = 0.0344 and x₃ = 0.5036
3. Results and Discussions
The empirical implementation of the mean–second-order entropy–variance optimization model was carried out on two different portfolio configurations involving major cryptocurrencies. The objective was to evaluate how the entropy component influences the allocation structure and risk-return balance under increasing asset dimensionality.
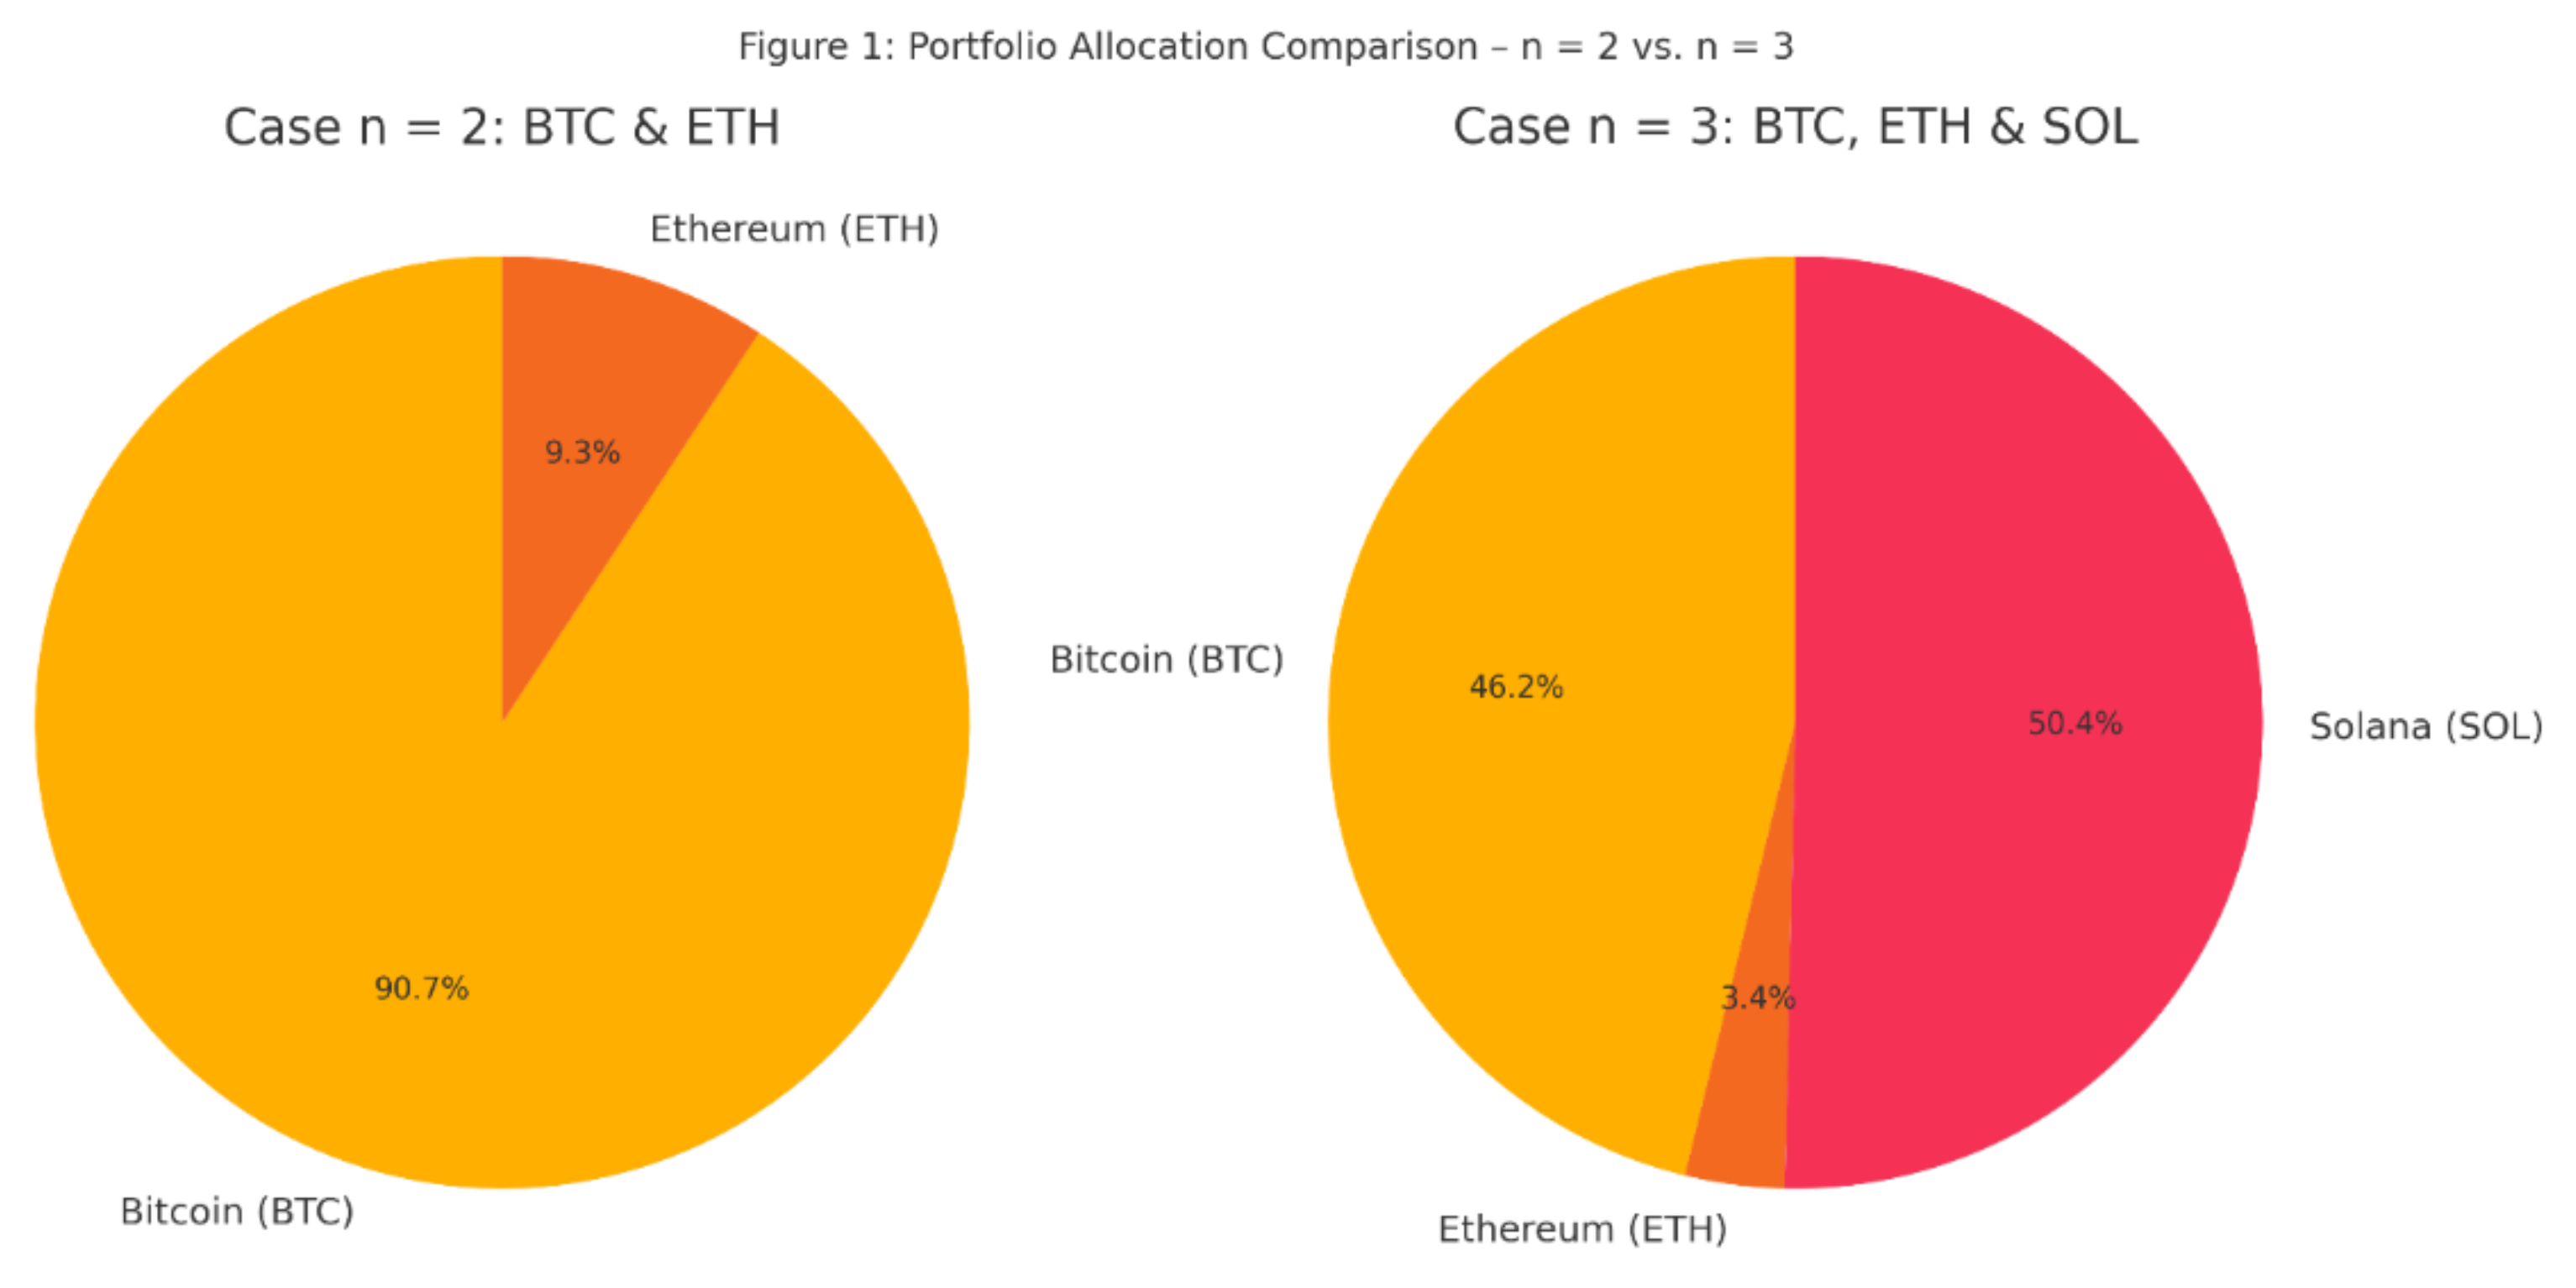
In the first case (n = 2), involving Bitcoin (BTC) and Ethereum (ETH), the results indicate a highly concentrated portfolio. Approximately 90.74% of the capital was allocated to BTC and only 9.26% to ETH. This behavior can be attributed to BTC’s superior return-to-risk ratio during the observation period. However, the low entropy value in this case suggests a poor diversification level, which may result in higher liquidity risk or vulnerability to idiosyncratic shocks.
The second case (n = 3), which introduced Solana (SOL) as an additional asset, generated a significantly different allocation structure. The model yielded a much more balanced distribution: 46.2% to BTC, 50.36% to SOL, and 3.44% to ETH. While BTC maintained a strong position due to its performance, SOL gained a substantial share because of its high expected return relative to risk. Meanwhile, ETH received a minimal allocation, reflecting its less favorable volatility-adjusted return profile.
The numerical results corresponding to both scenarios (n = 2 and n = 3) are summarized in Table 1, which presents the expected returns, variances, and optimal portfolio weights for each asset
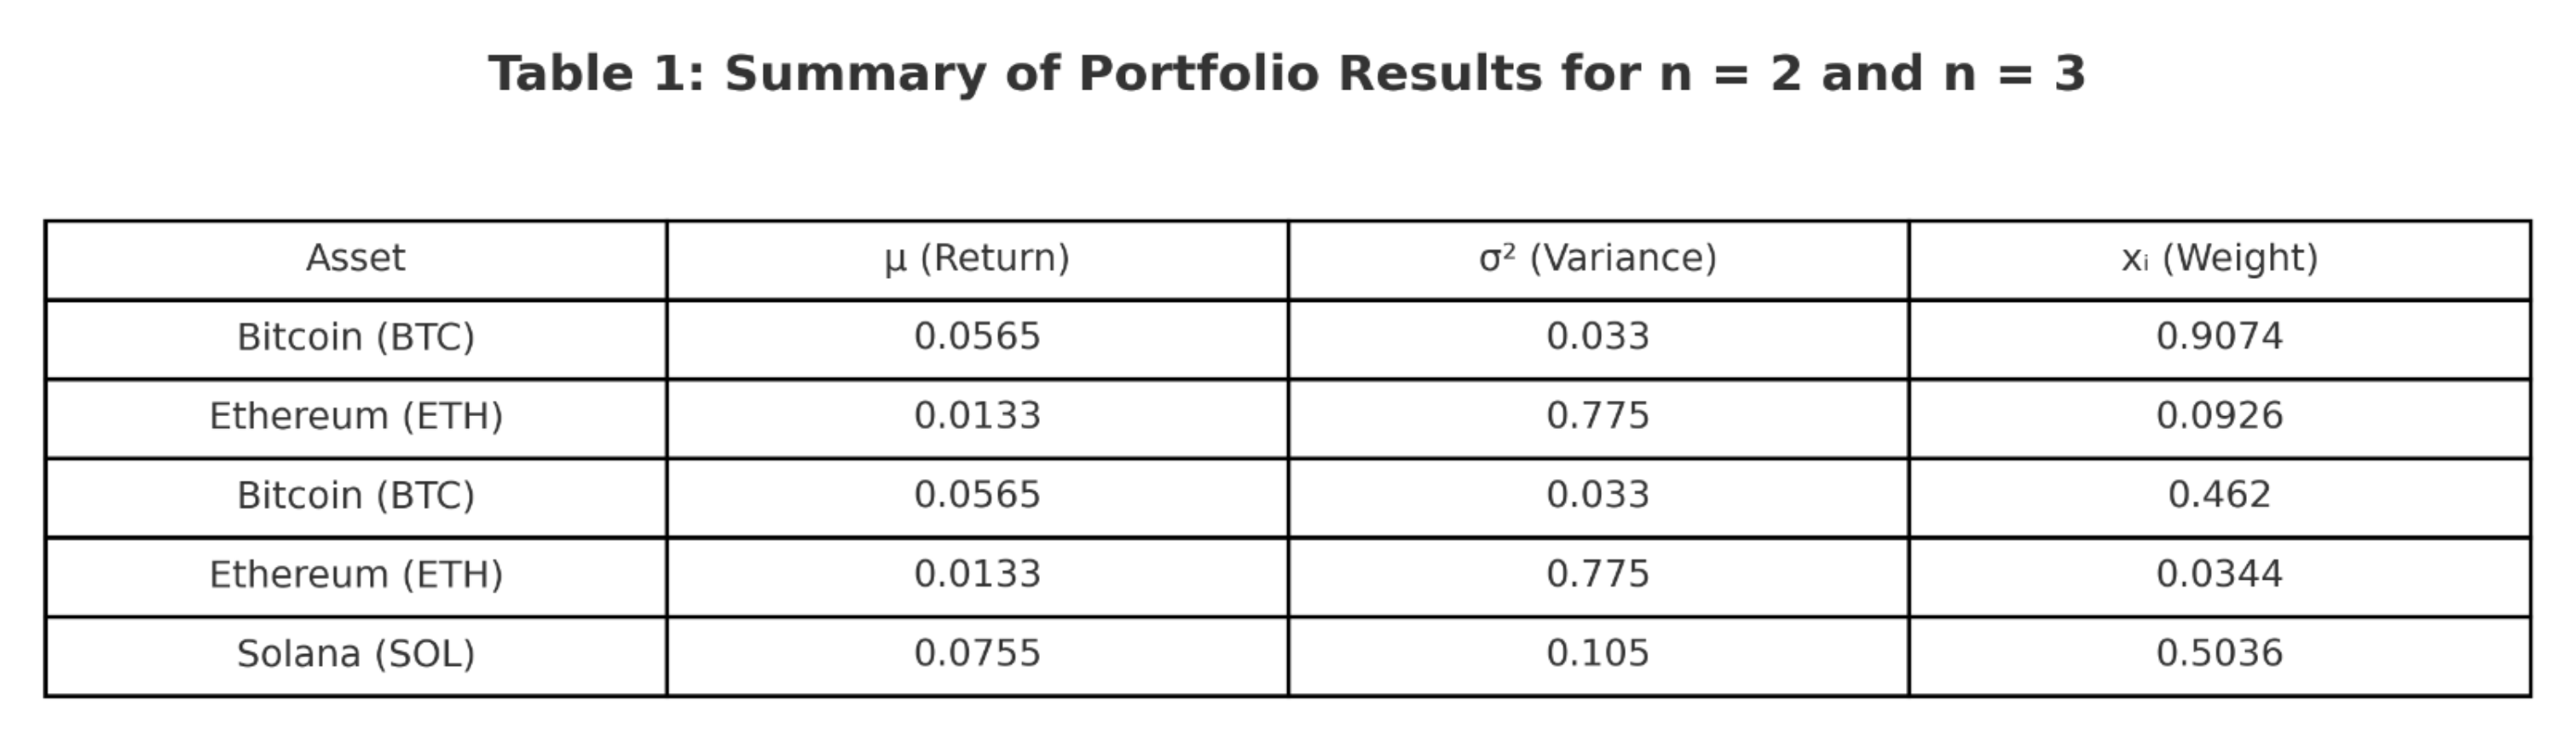
Figure 1 illustrates the final portfolio allocations in both scenarios. The increase in entropy, clearly visible in the transition from Case 1 to Case 2, confirms the model’s ability to promote diversification as more viable assets are included
This comparative outcome illustrates how entropy acts as more than a passive term in the objective function. It serves as a structural force that modulates the optimizer’s tendency to overweight high-return assets at the expense of robustness. In effect, entropy introduces a “soft constraint” on concentration, guiding the portfolio toward a configuration that balances return, risk, and liquidity potential.
From a practical standpoint, this mechanism may be especially valuable in crypto-asset environments, where correlations between coins can shift rapidly and price movements are often nonlinear and asymmetric. Entropy serves here not only as a statistical measure, but also as a strategic hedge against overexposure and poor adaptability.
Additionally, this approach holds potential for institutional applications, such as crypto index construction or risk-managed digital asset funds. Its ability to integrate return optimization with structural diversification may help mitigate tail risk in volatile markets, a concern often voiced by fund managers and regulators alike.
Limitations
While the proposed mean–second-order entropy–variance model offers a valuable contribution to portfolio optimization—particularly in the context of cryptocurrency markets—it is not without limitations.
First, the model relies on historical return and covariance estimates, which may not always be reliable in highly volatile and non-stationary environments such as digital asset markets. Entropy, while useful as a diversification metric, does not capture tail risk or extreme events, which are frequent in crypto ecosystems.
Second, the optimization procedure, although computationally feasible in small- and medium-scale cases, may face scalability issues as the asset universe expands significantly. Moreover, the use of second-order entropy assumes symmetric information distribution across portfolio components, which may not always reflect real-world behavior in emerging or illiquid assets.
Third, the model assumes investor preferences are static and encoded via fixed weights (a, b), which may oversimplify real behavioral dynamics or strategic shifts in portfolio goals over time.
Future research could address these limitations by:
- Incorporating dynamic, forward-looking estimators for return and volatility using machine learning or regime-switching models;
- Extending the entropy component to higher-order measures or adaptive entropy estimators that reflect changing market structures;
- Embedding behavioral preferences and adaptive risk-aversion mechanisms into the objective function;
- Exploring integration with decentralized finance (DeFi) instruments, NFT-backed assets, or hybrid portfolios combining digital and traditional securities;
- Testing the model over longer time horizons or across multiple regimes to assess robustness under varying market conditions.
By tackling these aspects, the entropy-based portfolio optimization framework can be further refined and extended toward practical deployment in real-world investment strategies, especially within the rapidly evolving domain of digital finance.
4. Conclusions
The present study proposed an extension of the classical portfolio optimization framework by incorporating second-order entropy alongside expected return and variance. This enriched formulation offers a more holistic approach to portfolio construction, balancing performance with diversification and liquidity.
Through two case studies involving cryptocurrencies, we observed how entropy affects portfolio composition as the number of assets increases. In the two-asset configuration (BTC and ETH), the portfolio was highly concentrated, favoring the asset with the best return-to-risk profile. However, in the three-asset case (BTC, ETH, and SOL), entropy contributed to a more balanced distribution, enabling the inclusion of an additional high-performing asset (SOL) while respecting the risk constraint.
The results support the hypothesis that entropy acts as a structural diversification mechanism, encouraging broader allocation without the need for additional explicit constraints. Moreover, the model remained computationally tractable, allowing for symbolic or semi-analytical solutions in low-dimensional cases and reliable numerical outputs in larger settings.
These findings confirm that entropy-based optimization may be particularly useful in volatile markets, such as the cryptocurrency space, where return distributions deviate from classical assumptions and correlations shift rapidly. This framework can serve as a foundation for future institutional-level crypto asset management solutions, particularly for portfolios requiring a balance between performance and resilience.
As a next step, the model can be extended to incorporate time-varying correlation structures, real-time entropy estimators, or even entropy-based rebalancing rules that dynamically adjust portfolios in response to market regime changes. Such developments could enhance the model’s adaptability in complex, fast-evolving financial environments.
We believe this model can bridge academic theory and practical portfolio management in digital markets, offering both theoretical insight and actionable value for forward-looking investment strategies.
References
- Barberis, N. C. (2013). Thirty Years of Prospect Theory in Economics: A Review and Assessment. Journal of Economic Perspectives, 27(1), 173-196. [CrossRef]
- Cheridito, P., Delbaen, F., & Kupper, M. (2004). Coherent and convex monetary risk measures for bounded càdlàg processes. Stochastic Processes and their Applications, 112(1), 1–22. [CrossRef]
- Hamza, F., & Janssen, J. (1996). Linear approach for solving large-scale portfolio optimization problems in a lognormal market. Proc. 6th AFIR, Nuremberg, Germany.
- He, X., & Jiang, H. (2020). A Maximum Entropy Model for Large-Scale Portfolio Optimization. Proceedings of the 2020 International Conference on Financial Engineering, 45-52.
- Jiang, Y., He, S., & Li, X. (2008). A maximum entropy model for large-scale portfolio optimization. International Conference on Risk Management & Engineering Management (ICRMEM ’08), 610-615.
- Ke, J., Zhang, C. (2008). Study on the optimization of portfolio based on entropy theory and mean-variance model, in: IEEE International Conference on Service Operations and Logistics, and Informatics, IEEE/SOLI 2008., pp. 2668--2672, https://www.researchgate.net/publication/240643459_Study_on_the_optimization_of_portfolio_based_on_entropy_theory_and_mean-variance_model.
- King, A. J. (1993). Asymmetric risk measures and tracking models for portfolio optimization under uncertainty. Annals of Operations Research, 45, 165-178. [CrossRef]
- King, A. J., & Jensen, D. L. (1992). Linear-quadratic efficient frontiers for portfolio optimization model. Applied Stochastic Models and Data Analysis, 8, 195-207. [CrossRef]
- Konno, H., & Yamazaki, H. (1991). A mean absolute deviation portfolio optimization model and its applications to Tokyo stock market. Management Science, 37, 519-531. [CrossRef]
- Liu, P., & Li, X. (2023). A novel approach to fuzzy multi-objective programming with Pareto optimality. Fuzzy Sets and Systems, 467, 45–60.
- Lutgens, F., & Schotman, P. (2010). Robust portfolio optimisation with multiple experts. Rev. Finance, 14, 343-383, https://academic.oup.com/rof/article/14/2/343/1569756. [CrossRef]
- Markowitz, H. (1952). Portfolio selection. The Journal of Finance, 7, 77-91. [CrossRef]
- Markowitz, H. (1991). Foundations of portfolio optimizations. The Journal of Finance, 2, 469-471. [CrossRef]
- Markowitz, H., Todd, P., Xu, G., & Yamane, Y. (1993). Computation of mean-semi-variance efficient sets by the critical line algorithm. Annals of Operations Research, 45, 307-318.
- Philippatos, G. C., & Wilson, C. J. (1972). Entropy, market risk, and the selection of efficient portfolios. Appl. Econ., 4, 209-220. [CrossRef]
- Shannon, C. E. (1948). A mathematical theory of communication. Bell Syst. Tech. J., 27, 379-423.
- Simonelli, M. R. (2005). Indeterminacy in portfolio selection. Eur. J. Oper. Res., 163, 170-176. [CrossRef]
- Speranza, M. G. (1993). Linear programming models for portfolio optimization. Finance, 14, 107-123. https://iris.unibs.it/handle/11379/4732.
- Shefrin, H., & Statman, M. (2000). Behavioral Portfolio Theory. Journal of Financial and Quantitative Analysis, 35(2), 127-151. https://www.cambridge.org/core/journals/journal-of-financial-and-quantitative-analysis/article/abs/behavioral-portfolio-theory/87E1D1AE8C8A8365B38CEA952EC28DF6.
- Wu, Z., & Xu, J. (2023). A method for determining maximin OWA operator weights. Information Sciences, 625, 142–158.
- Wang, X., & Liu, Y. (2021). A novel approach for determining OWA operator weights based on maximum entropy and linear programming. Information Sciences, 580, 620–635.22.
- Yager, R. R. (1995). Measures of entropy and fuzziness related to aggregation operators. Inf. Sci. Intell. Syst., 82, 147-166. [CrossRef]
- Yoshimoto, A. (1996). The mean variance approach to portfolio optimization subject to transaction costs. Journal of Operations Research Society of Japan, 39(1), 99-117. [CrossRef]
- Yu, J. R., & Lee, W. Y. (2011). Portfolio rebalancing model using multiple criteria. Eur. J. Oper. Res., 209, 166-175. [CrossRef]
- Zheng, Y., Zhou, M., & Li, G. (2009). Information entropy-based fuzzy optimization model of electricity purchasing portfolio. Power & Energy Society General Meeting (PES ’09), IEEE, 1-6.
- Zopounidis, C., & Doumpos, M. (2020). Multi-criteria decision aid in financial decision making: Methodologies and literature review. Journal of Multi-Criteria Decision Analysis, 27(1–2), 1–24. [CrossRef]
- Zhou, R. X., Cai, R., & Tong, G. Q. (2013). Applications of entropy in finance: A review. Entropy, 15, 4909-4931. https://www.mdpi.com/1099-4300/15/11/4909. [CrossRef]
Disclaimer/Publisher’s Note: The statements, opinions and data contained in all publications are solely those of the individual author(s) and contributor(s) and not of MDPI and/or the editor(s). MDPI and/or the editor(s) disclaim responsibility for any injury to people or property resulting from any ideas, methods, instructions or products referred to in the content. |
© 2025 by the authors. Licensee MDPI, Basel, Switzerland. This article is an open access article distributed under the terms and conditions of the Creative Commons Attribution (CC BY) license (http://creativecommons.org/licenses/by/4.0/).
Copyright: This open access article is published under a Creative Commons CC BY 4.0 license, which permit the free download, distribution, and reuse, provided that the author and preprint are cited in any reuse.


