
Submitted:
25 March 2025
Posted:
27 March 2025
You are already at the latest version
Abstract
This paper addresses the challenges in the supply process of a manufacturing system within an automotive company. In this production process, assembly lines are supplied using a Kanban system, and material transportation is carried out multiple times per shift by two tugger trains. To analyze bottlenecks in the process, in addition to direct observation and time studies, an RTLS (Real-Time Locating System) was utilized. This system maps, records, and provides various reports based on collected data. Using both physical observations and data from the RTLS, simulation models of the manufacturing process were developed. These digital models were then used to verify possible design proposals aimed at improving efficiency and optimizing production pro-cesses within the company. The proposed solution for the selected production process effectively eliminates bottlenecks in material transportation for final product manufacturing. A methodo-logical approach for data collection and the simulation of the supply process for production lines is also presented. The paper concludes with a methodology for the continuous improvement of the supply process through system integration and outlines future research directions in this field.
Keywords:
simulation
; bottleneck
; supply process
1. Introduction
In the paper Dynamic Prediction Method of Production Logistics Bottleneck Based on Bottleneck Index, the authors focused on the management, detection, and prediction of bottlenecks within the logistics chain, leading to an improvement in production efficiency [1].
In another study, authors Kasemset, C., and Kachitvichyanukul, V. similarly utilized simulation to map bottlenecks and subsequently eliminate them, as in our case [2]. This paper builds upon and expands on several previously published studies. In 2023, Trebuňa et al. published a case study in which a simulation software was used to optimize a blood plasma processing line [3]. Pekarčíková et al. also applied simulation tools in their paper Solution of Bottlenecks in the Logistics Flow by Applying the Kanban Module in the Tecnomatix Plant Simulation Software, similar to this study, to eliminate bottlenecks within the logistics chain [4].
A similar topic—the elimination of bottlenecks using simulation—was also addressed by Thürer, M., and Stevenson, M. in their 2018 publication [5].
This paper presents a case study on the supply process for production using tugger trains, which consist of a tractor and several wagons, depending on the volume of supply items. These trains are operated by workers who unload the necessary material items at designated stations for final product assembly and return empty containers to the warehouse [6,7,8].
A common issue in this process was frequent collisions and encounters of tugger trains at certain production lines. Due to the insufficient space for parallel movement of two trains, resolving such collisions took excessive time, leading to delays in material delivery to some lines. The supply process operates using the Kanban system, where production lines request the required material items from the warehouse based on consumption. These materials are then loaded onto the two tugger train sets [8,9,10].
To map and eliminate these bottlenecks, several data collection methods were employed. The first method followed a conventional industrial engineering approach, mapping the movement of individual tugger trains and measuring the time required for each operation performed by the train and its operator. This included the journey from the warehouse to the production hall, movement around the production lines, unloading items, scanning them, and registering them in storage areas near the lines [11,12].
The second data collection method involved the application of RTLS (Real-Time Locating System) technology to track the movement of both the tugger train and its operator. The operator not only moves with the train but also performs unloading, scanning material items from train wagons into racks near the lines, and loading empty containers with consumed materials. RTLS is a modern localization technology with high precision in determining the position of tracked elements. Depending on the number of localization anchors, which capture the movement of tracked elements via so-called tags, RTLS can cover a relatively large area. A single localization anchor can detect the position of a tag within approximately 25 square meters with an accuracy of 30 cm.
For complete and accurate measurement, multiple anchors are required, communicating with each other to verify location data. One of these anchors must be detected by the system as the primary anchor, while the others function as secondary anchors, creating a closed tracking area.
2. Materials and Methods
The production process in this case study consists of four lines and focuses on manufacturing auxiliary dampers with electronic control. These parts are produced in multiple variants for different models of passenger and commercial vehicles. The production lines include Kanban storage bins, pressing machines, compression machines, milling machines, calibration machines, and inspection machines [13,14,15].
Each production line contains four high-capacity storage bins utilizing the Kanban method, which is one of the most widely used supply methods in the engineering industry. The applied Kanban method is supplied by two tugger train sets responsible for regularly delivering the necessary materials to individual Kanban storage bins. Each tugger train pulls 2–3 cages containing all required materials. The regularity of the delivery cycle is crucial, and the company aims to increase efficiency and design an optimized logistics route for individual high-capacity storage bins to ensure the continuity of the production process and eliminate downtime.
Unloading time, loading time, scanning time, transport time, and the weight of individual deliveries served as input data for our study and implementation. Through measurement and observation methods, we regularly collected input data, where the average values showed minimal differences [15,16]. These values were then used in both the analytical and design phases.
As illustrated in Figure 1, the layout of the production hall incorporates a monitoring method called the spaghetti spot. A spaghetti diagram is a visual representation that uses a continuous line to depict the movement of an item or activity through a process. This tool helps identify bottlenecks and critical points in the workflow, as well as opportunities to streamline the process. The spaghetti diagram highlights overlapping areas where multiple pathways intersect, causing delays. It is particularly useful in optimizing the movement of people, products, and tugger trains within the production unit.
The spaghetti diagram is one of the outputs of the RTLS monitoring technology. The layout in Figure 1 shows the arrangement of the four production lines, labeled as CSD Line A, B, C, and D.
Figure 1.
Spaghetti Diagram with Factory Layout and Bottleneck Highlights.
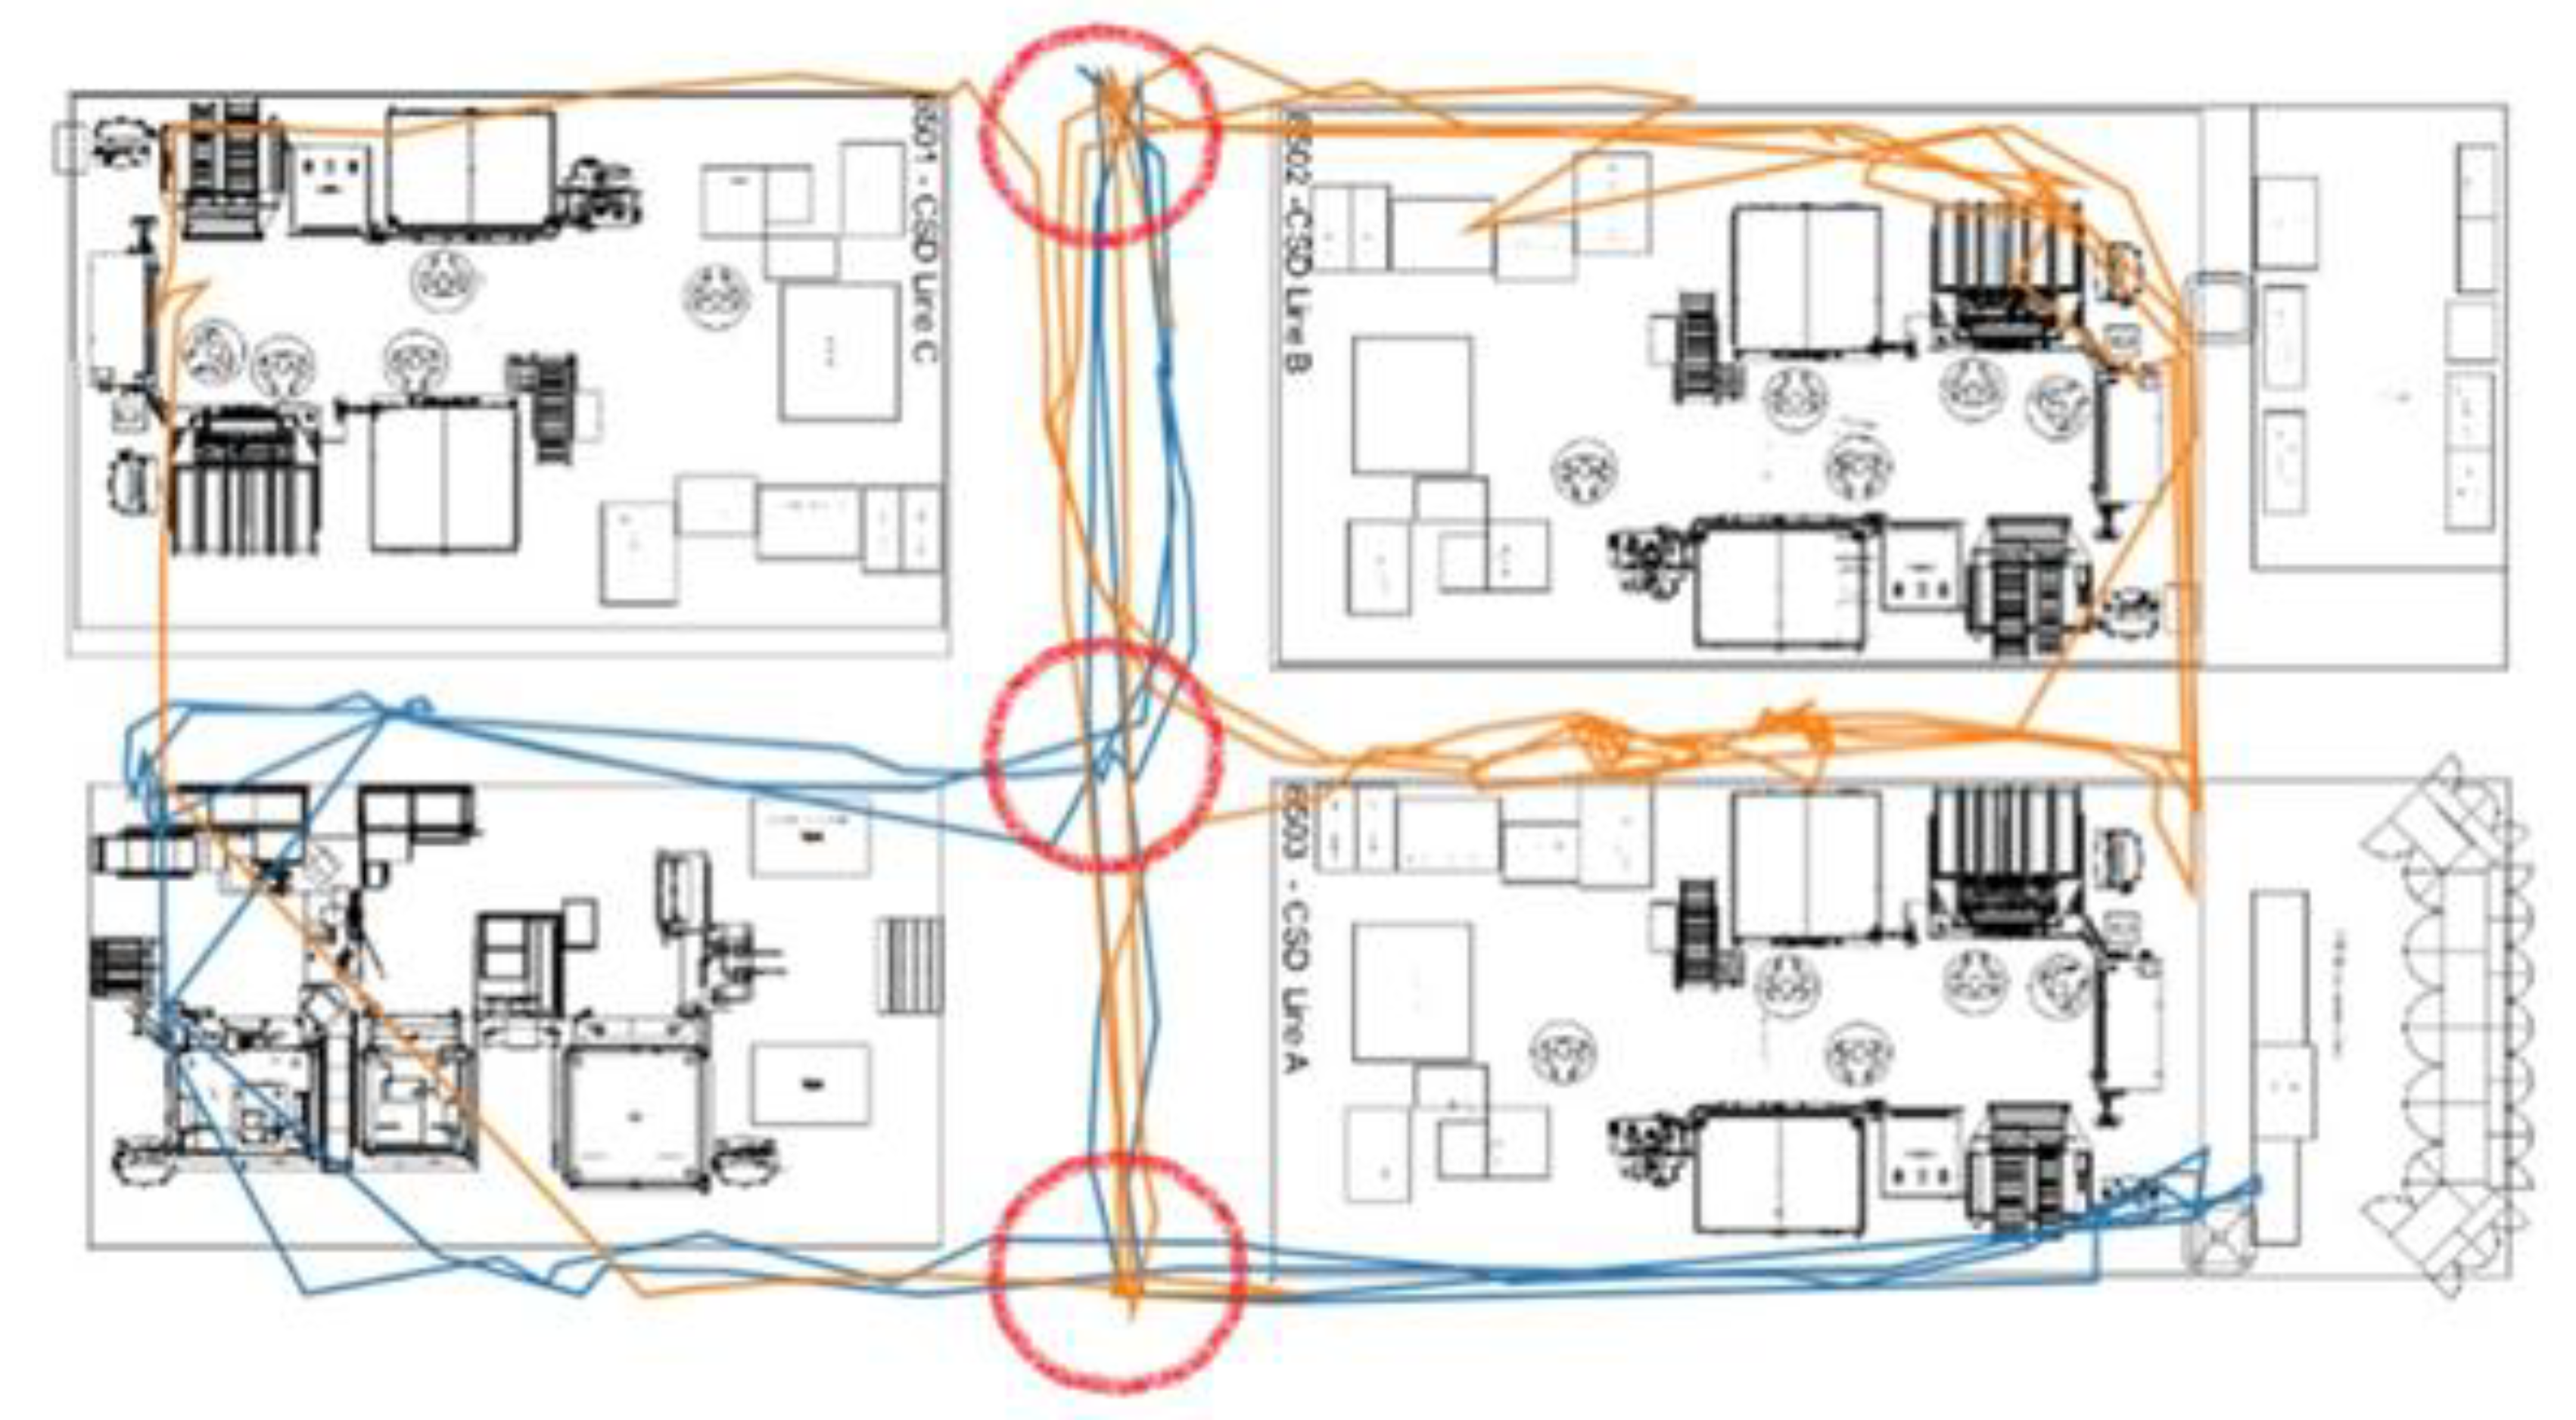
The orange color represents the supplier operating the cart (designated as JFG 77381), which is supposed to serve as the main supplier for CSD Line A and CSD Line B in terms of the logistics route. However, during the measurement and data collection period, we often observed that this supplier frequently appeared in locations where they were not supposed to be, such as CSD Line C and CSD Line D.
The blue color represents the supplier and cart 2 (designated as JFG 77382), responsible for supplying CSD Line C and CSD Line D. As seen in the diagram, the actual situation during the measurements was entirely different. The tugger train did not follow its designated route and made stops in areas where it was not supposed to operate. This often occurred due to incorrect scanning by production workers handling Kanban cards. As a result, essential materials were not delivered on time, impacting the production cycle due to a shortage of input materials.
Due to these issues, we frequently observed employees retrieving the required input materials themselves, leading to another problem: incorrect scanning of input materials. Ideally, only tugger train operators should have scanners for material deliveries, while production line workers should only scan materials from storage bins, not directly from warehouses.
Additionally, we observed that the supplier operating the tugger train often entered the production line area with either full or empty material containers. These unplanned movements caused collisions and disruptions in the workflow, leading to timing inconsistencies in various operations.
The primary issue was the frequent collisions of supply tugger trains, which lacked strictly defined supply routes and designated delivery paths based on critical points. The absence of well-planned logistics routes led to several potential problems affecting not only the specified lines but also subsequent operations relying on these production stages.
The key risks include:
- Production downtime
- Material shortages
- Time constraints
- Production stoppages
- Disruptions in meeting daily production plans
- Failure to fulfill customer orders
- Low machine efficiency
- Process blockages
- Increased movement between production lines
- Other operational inefficiencies
The data collected through time studies and RTLS monitoring methods were analyzed and compared. Based on this data, we developed a simulation model of the supply chain within production. This simulation first confirmed the presence of bottlenecks and subsequently enabled us to explore various process improvement strategies in a digital environment.
The methodology for analyzing the supply process is illustrated in Figure 2.
This methodology is universal and can be applied to any operation—not only within the supply process, but generally to any production process, regardless of the industrial sector or type of manufacturing.
According to the proposed methodology, data was collected using both observational and detection-based methods. The observational techniques were implemented over several daily shifts within the operation, during which the RTLS (Real-Time Location System) detection method was also active. The results obtained from time studies were compared with the output of the detection technology, which operated continuously over several days, including during shifts where no observational time-motion measurements were performed.
Based on the comparison of the datasets obtained through both methods, the results derived solely from the detection technology can be considered reliable. Therefore, these results were also used as input for the simulation model.
The significance of these data can be immediately observed in Figure 1, where the routes of two tugger train operators are visualized—Operator 1 in blue and Operator 2 in orange. The figure clearly illustrates multiple overlapping paths between the two operators, which ideally should not occur. Although both operators start from the same point, they are expected to follow predefined routes; however, our investigation revealed that no such predefined routes were established by the company.
Thus, the figure also highlights the different paths taken and identifies bottlenecks within the supply workstation. These bottlenecks are defined as areas where a given operator must pass at least twice. Since the tugger train requires a minimum turning radius of three meters, it is not capable of turning on the spot. Consequently, in the event of incorrect unloading or a missed stop, the tugger train must loop around the entire line to correct the mistake.
Figure 3.
Real operation of the production hall a) indication of areas where tugger train collisions occur b) supply tugger train system.
Figure 3.
Real operation of the production hall a) indication of areas where tugger train collisions occur b) supply tugger train system.
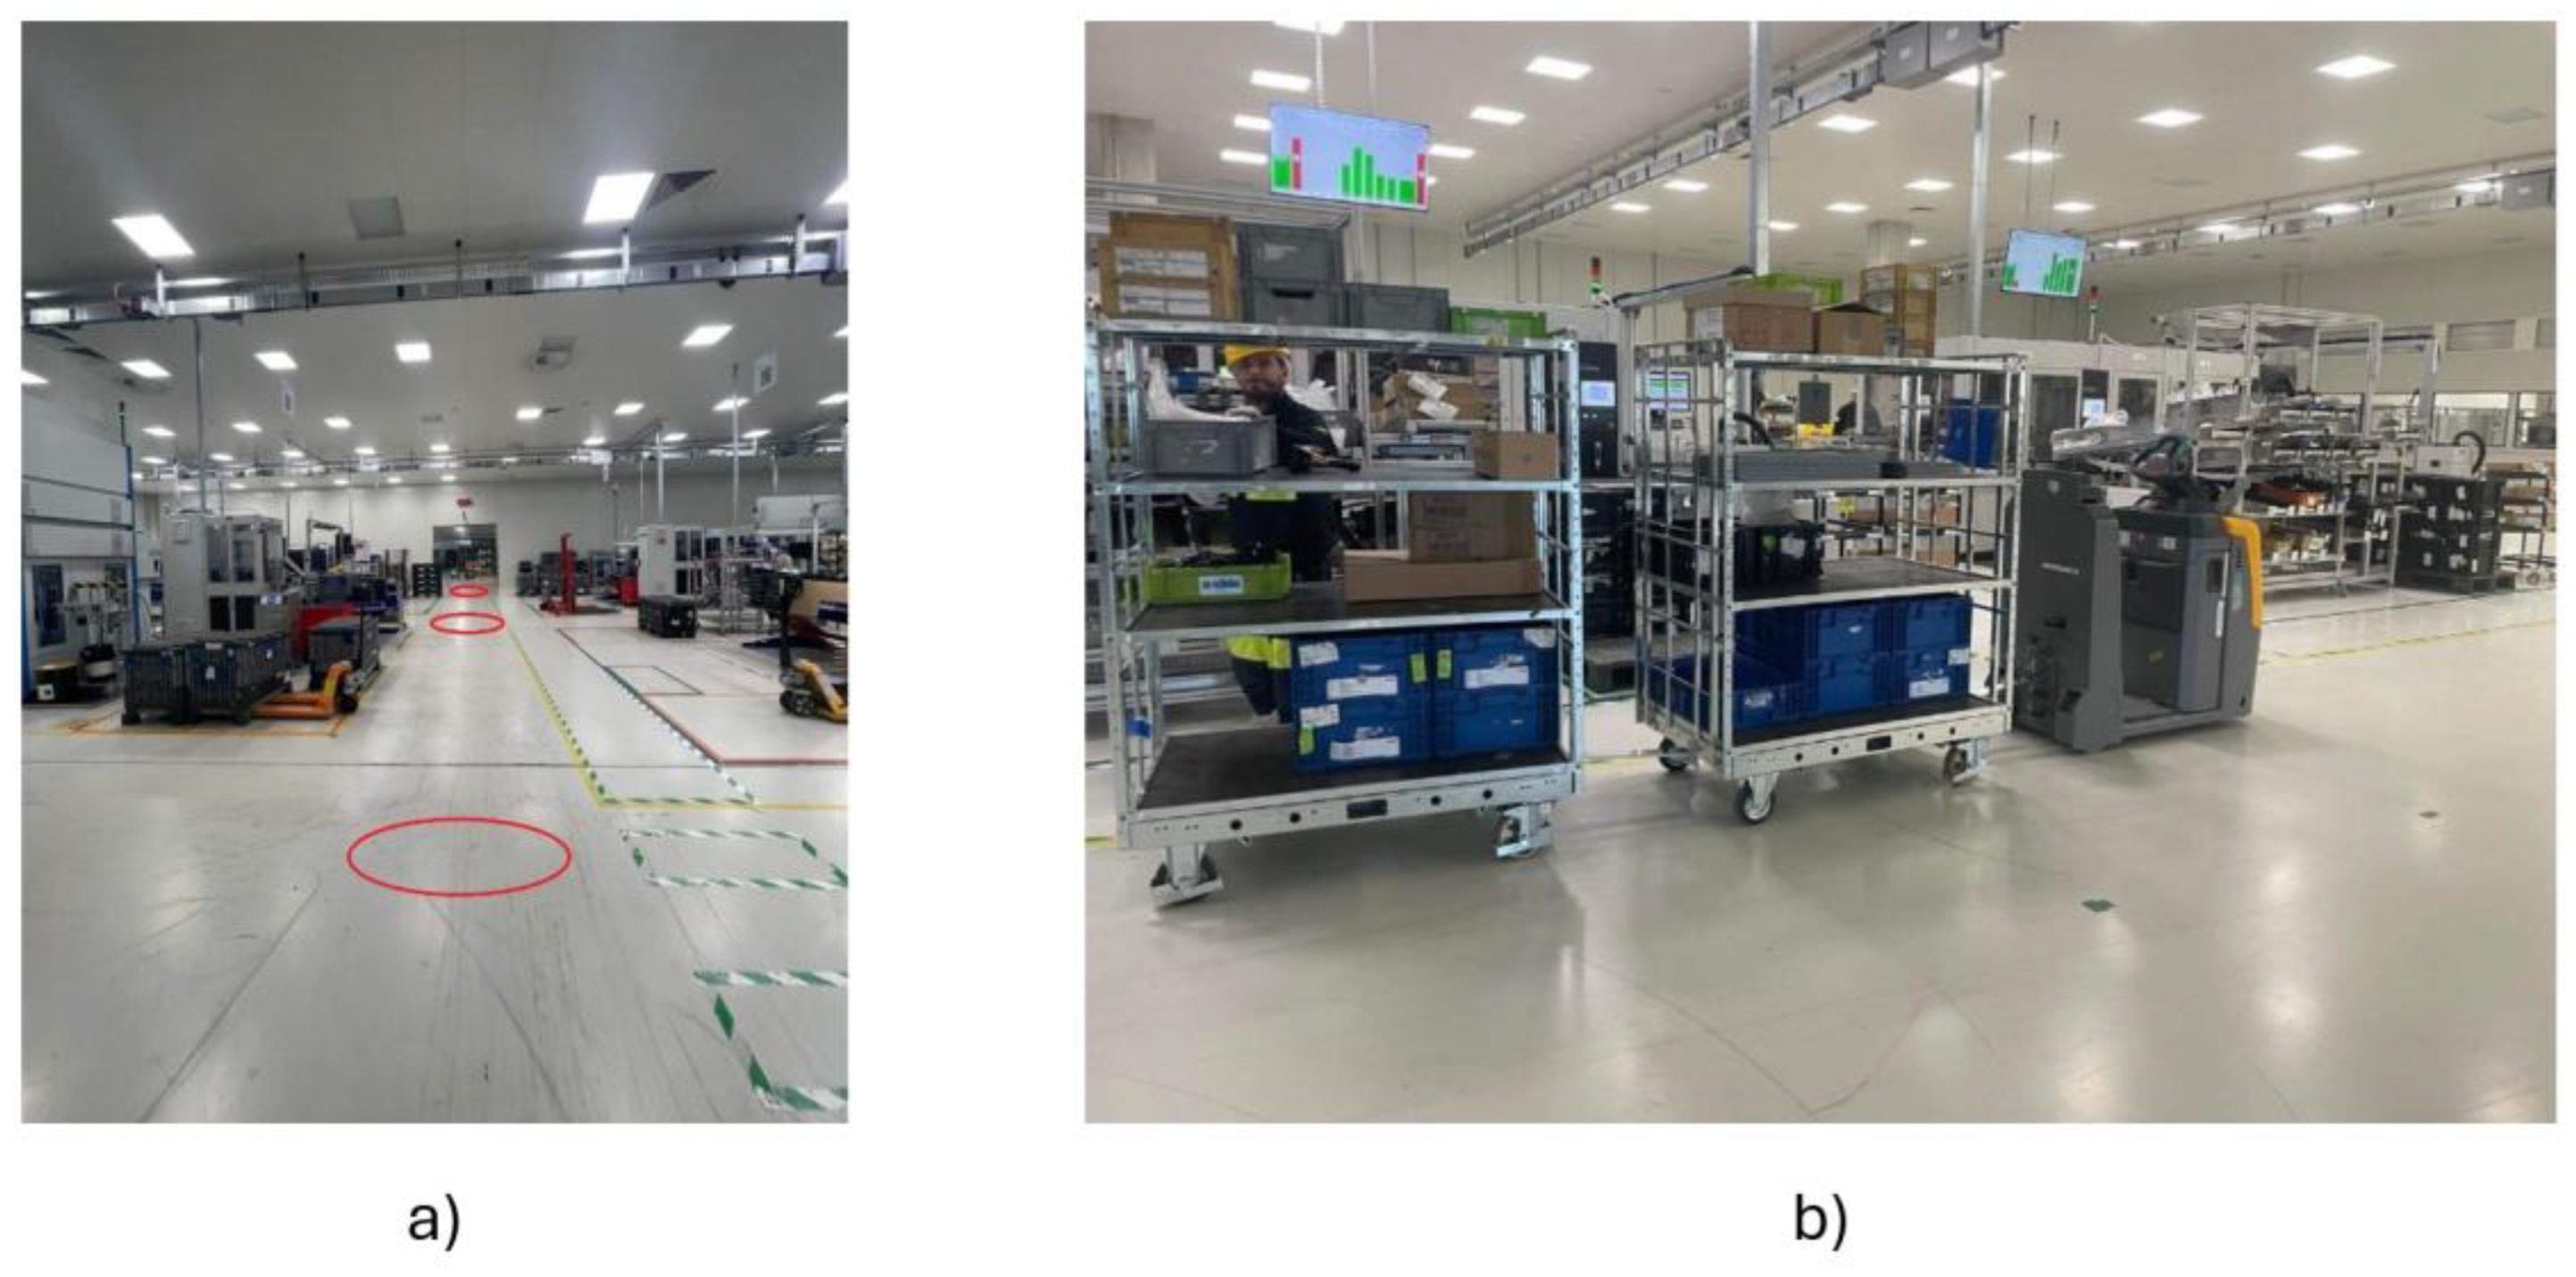
In Figure 3a, we can observe a photograph taken within the company’s production hall, illustrating the actual locations where collisions occur during the material supply process. These are points at which two supply tugger train systems encounter undesired overlap, resulting in operational conflicts. This issue must be addressed in order to improve both the efficiency of the material supply process and the overall flow of all production lines being supplied.
Figure 3b depicts the specific tugger train system responsible for performing the supply operations. Depending on the volume of material being transported, the train consists of two or three trailer cages. As can be seen in Figure 3a, the available space for tugger movement, in relation to the system’s dimensions, is sufficient for the passage of only one such train—and only in a single direction. The area does not allow for bidirectional movement, nor does it provide space for two supply tugger trains to bypass or avoid each other.
A simulation of the original supply process was developed based on data collected during the production process analysis. Even within the simulation, collisions between tugger trains occurred, as illustrated in Figure 4.
Figure 4.
Tugger train collision in the simulation model.
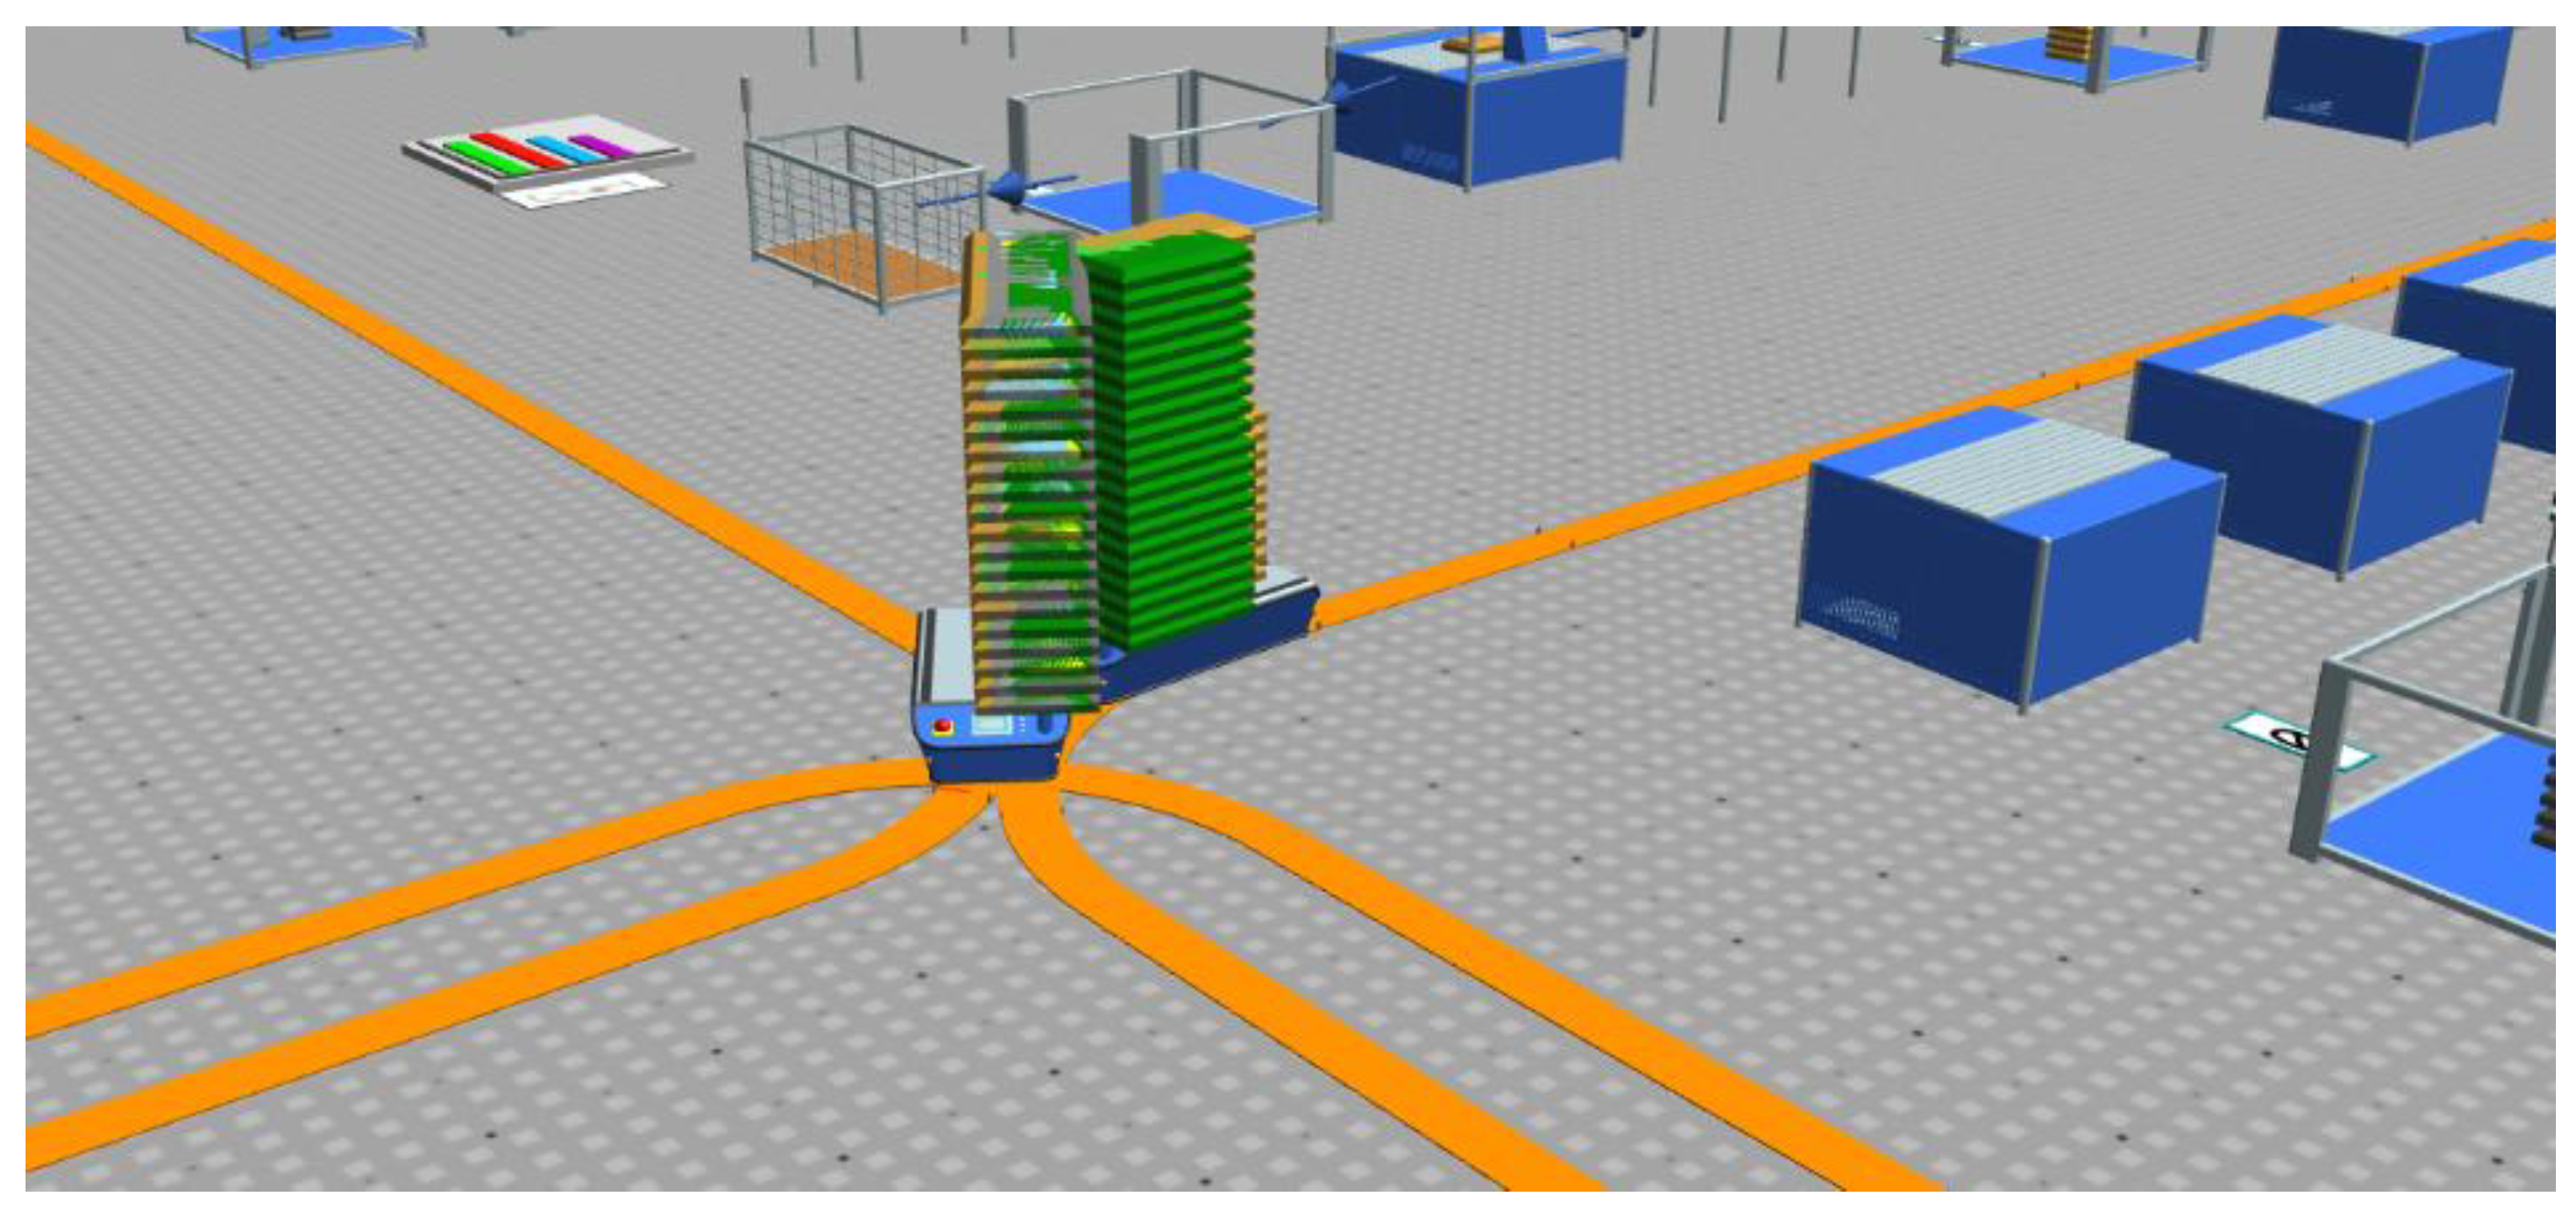
Within the digital production model, various proposals were implemented and tested with the aim of minimizing the occurrence of potential collisions between the identified tugger trains. This approach focused on eliminating as many bottlenecks as possible in order to enhance the efficiency of both the supply process and the overall production workflow within the manufacturing hall.
Although simplified tugger train models are used in the simulation, the operational conditions are accurately defined based on real-world parameters. The model attributes include realistic travel speeds and actual capacity, even though the digital representation does not visually display the cages for transporting components. The simulation portrays an ideal environment in which workers do not obstruct the tugger paths; however, a collision still occurs in one of the hall's predefined bottleneck areas. Therefore, it is necessary to propose corrective measures, including the design of optimized logistical routes for each tugger train, in order to avoid such undesired events.
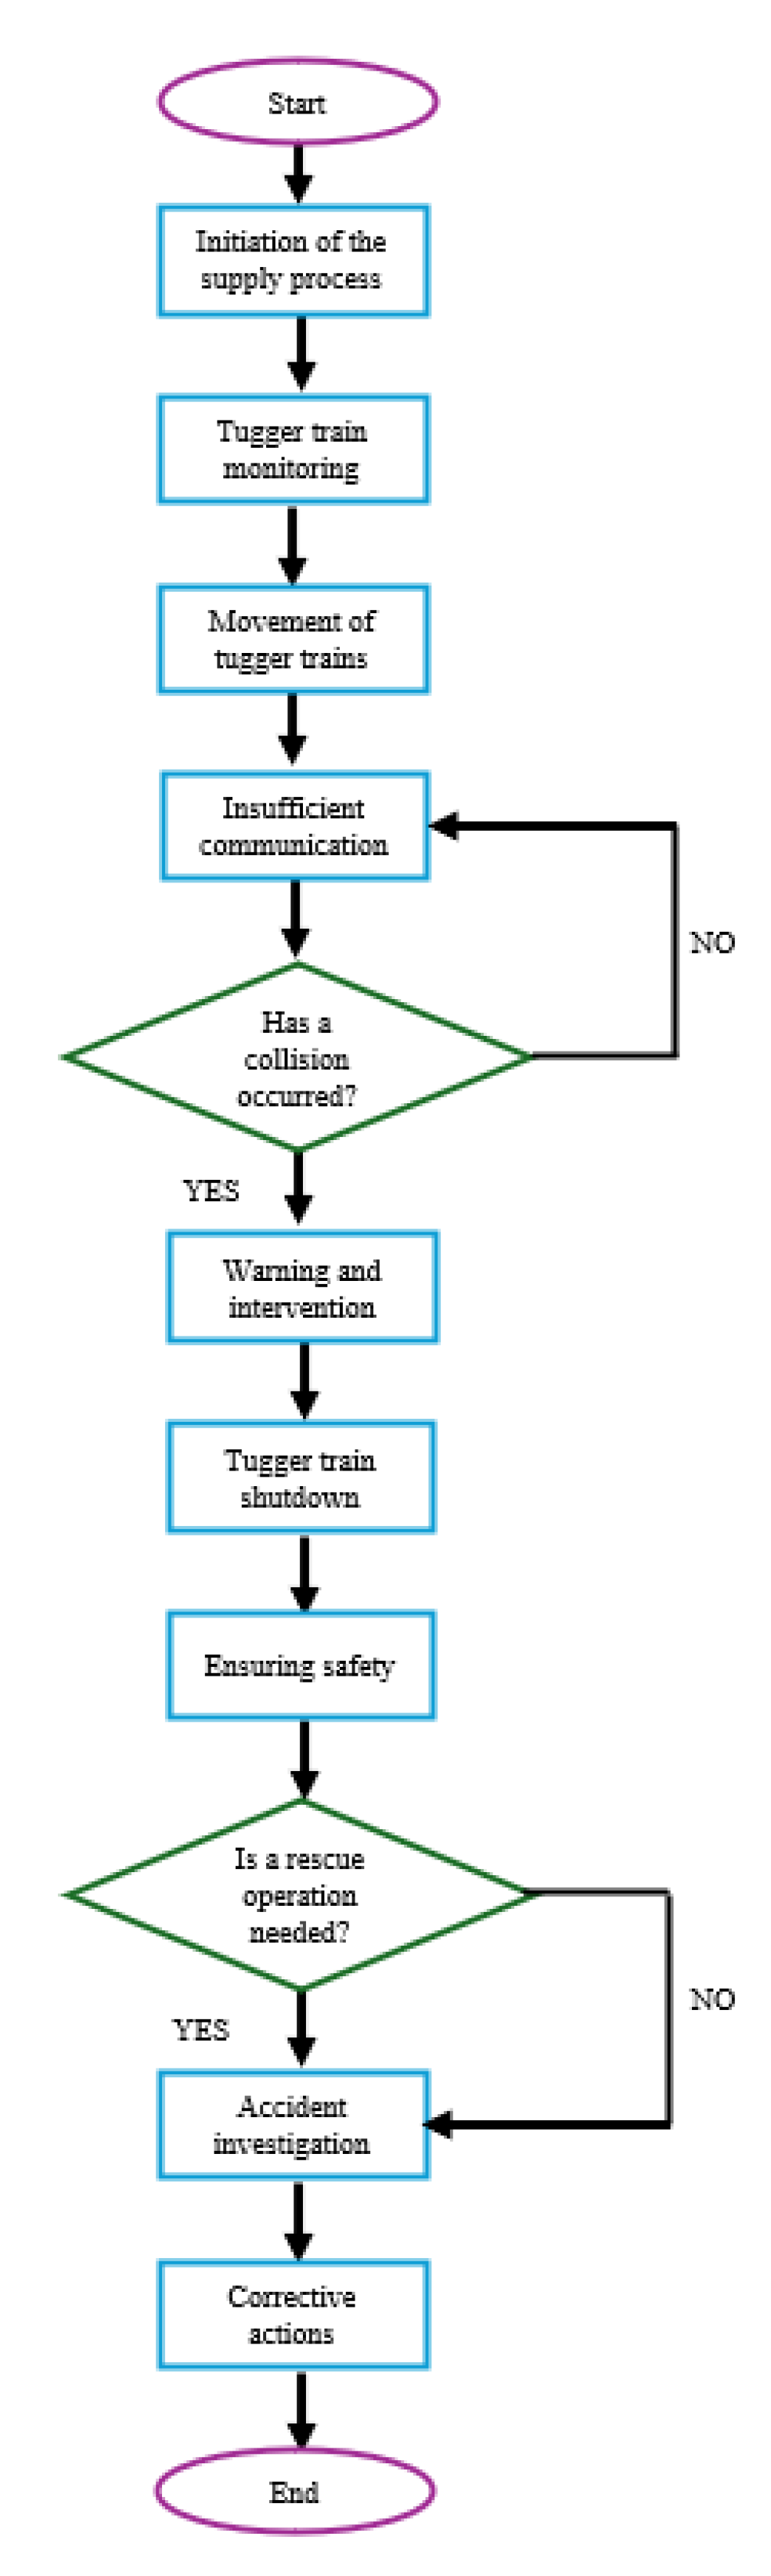
The entire process—from the initiation of material supply to a potential collision—can be visualized using a flowchart of the current state in the enterprise. Figure 5 presents this flowchart, illustrating the sequence of events. The process begins with initiation and is monitored using selected observation methods. Special attention is paid to worker communication as well as their field of vision at pathway intersections.
The next step involves evaluating the potential for a collision, which is most likely to occur in the previously identified bottleneck zones. If no collision occurs, this represents the ideal scenario. In the event of a collision, a warning and response protocol is triggered. An acoustic signal indicates the collision, prompting immediate stoppage of the vehicles to ensure safety in the surrounding area.
Following this, a decision is made regarding whether a rescue operation is required, after which the process transitions into an investigation phase. Corrective measures are then proposed and implemented to improve both the production and supply processes.
Figure 5.
Supply process in the company.
3. Proposed Solutions for the Elimination of Bottlenecks
To implement changes to the current state, it was necessary to gather all relevant input data from the individual CSD lines, including the capacities of the Kanban storage bins, the capacities of the tugger trains, as well as the time required for the trains to be ready to deliver material to the Kanban containers. It was also essential to identify unloading times and locations that represent a high risk of negatively impacting the overall process.
For the development of simulation models, the software module Tecnomatix Plant Simulation was utilized. This tool enables the gradual design of the complete simulation environment, including the positioning of individual machines according to the real-world layout. The model can then be adjusted and optimized to ensure that the final configuration eliminates tugger train collisions within the production hall and improves overall operational efficiency.
The primary goal of the simulation is to resolve the supply chain issue by ensuring uninterrupted material delivery to each production line without collisions. The proposed approach is illustrated in the flowchart in Figure 6.
Based on the collected data, it was necessary to gradually model the production unit, which—besides the pathways used by the tugger trains that represent the main focus of this case study—also includes the individual production and assembly workstations. Furthermore, the simulation must account for the staff operating each workstation.
The company operates a continuous two-shift system, which means production runs 24 hours a day, 7 days a week. During each 12-hour shift, the following personnel are present:
- Tugger train operators – 2 employees
- Production operators – 20 employees
- Line supervisors – 4 employees
- Maintenance service – 2 employees
- Security personnel – 1 employee
- Production and technical staff – 3 employees
- Data analysts – 2 employees
- Process engineers – 3 employees
- Shift supervisor – 1 employee
In total, 38 employees are involved in ensuring the smooth operation of production. For the purpose of our simulation, the focus is placed on the tugger train operators and the production operators. Figure 7 shows one of the production lines along with its corresponding personnel.
As previously mentioned, the production unit in question includes four production lines, which are very similar—or in some cases identical—in their operation, depending on the type of product that constitutes their final output. Within the simulation module, the entire production unit was gradually modeled, including both the production lines and the newly proposed routes for the movement of the material supply tugger trains.
The pathways for the tugger trains were designed in such a way that, in the event both supply trains are operating in the production hall at the same time, the likelihood of their paths overlapping—particularly in areas previously identified as collision zones—would be minimized as much as possible.
The proposed routing of the material handling tugger trains can be seen in Figure 8, shown in both 2D and 3D simulation models.
With the proposed method of tugger train operation and its strict adherence, it is not possible to bypass any production line multiple times. It is essential to eliminate errors during the unloading of delivered materials, as well as the loading of empty containers after the consumed materials. When unloading and loading the delivered materials, it is crucial that the barcode readers signal to the operator the exact number of containers to be unloaded at a given location to avoid the risk of a container being unloaded in the wrong place, which would result in the need to repeat the movement around the line. A similar process is necessary for the collection of empty containers after the consumed material [17,18].
A future vision for the optimal operation of such a system is the implementation of localization systems that would be integrated and networked with smart barcode readers. Operators would use these readers during loading and unloading processes. In this manner, the localization system would monitor the movement not only of operators and tugger trains but also of the containers holding the material. By tracking their precise locations, the barcode reader would automatically signal and validate the correct volume and location of the goods for the operator. By preventing errors during the loading and unloading processes, time losses on the production lines caused by supply errors would be significantly reduced.
Another proposal for maximizing the elimination of collisions between supply units in the production process is to ensure different initial material quantities for each production line, depending on which tugger train is assigned to supply them. This means the sizes of the Kanban bins would vary based on the route of the supplying tugger train. This approach would result in the supply trains arriving at the production site at different times, further reducing the likelihood of collisions between them.
Both of these alternatives support the necessity of permanently implementing a localization system. This system would, in addition to continuous localization, enable the monitoring of material flows, workers, and logistical resources throughout the process. With ongoing data collection, it would be possible to conduct retrospective validations of certain processes when necessary, and the collected data could be used for implementing innovations or for building new production units, whether of a similar or different nature [19,20].
The simulation models implemented, the initially collected data, and the information provided by the company gave us the following comparison of data for the relevant processes (Table 1).
From a time perspective, every minute is valuable for the company, with each minute of downtime being estimated at a cost of €48. This value includes: machine downtime, employee downtime, and incidents. Based on our measurements, findings, and average data derived from Table 1, it is evident that the downtime caused by the mutual collision of tugger train sets is, on average, calculated at 25 minutes. This, over the course of a month with 9 collisions, results in an average cost of €10,800 per month.
As shown in Table 1, the implementation of the proposed solution significantly increases the number of products produced at the output, by 125 units. The average price of products produced at this particular production unit, as established by the company, is €67.55. This is an average value, as multiple types of finished products are produced on the individual lines. By simple multiplication, the financial increase in value at the output of the production unit can be calculated at €8,443.75.
By eliminating downtime in the identified bottlenecks, with an average value of €10,800, and with an average increase in the financial evaluation of production by €8,443.75, the benefit of this proposal can be quantified at nearly €20,000 per month.
With the implementation of a continuous improvement system based on further analyses, it is possible to shift the output parameters to the planned value, or even higher. As evident from the table, when addressing the specific problem, some planned values have significantly improved compared to the original plan. The planned kanban replenishment time has improved by an average of 1 minute, and the planned time for the movement of tugger trains within the production hall has been reduced by an average of 10 minutes based on the proposed solution .
5. Conclusions
Based on the analysis results using simulation, which were carried out and created based on data collected through observation and detection methods, possible improvement proposals for the efficiency and optimization of the process have been developed and verified. The presented proposals indicate clear improvements in the parameters of the supply and logistics processes, which also reflected in the increase in the final output. Based on the described methodologies or their slight modification depending on the type of process in which we would like to apply them, it can be stated that they are universally applicable regardless of the type of process or industry sector. The results of such analyses can be compared in both homogeneous and heterogeneous processes.
Based on the statistical comparison of the results of the implemented proposals, the combination of multiple methods during data collection and their subsequent use demonstrates significant research potential, which should be further deepened. The proper combination of technologies in synergy with suitable industrial engineering methods needs to be utilized. Subsequently, it is crucial to correctly integrate the collected data in order to achieve the desired goals.
Figure 9.
Cycle of Utilizing Simulations and Data Collection for Optimizing the Supply Process.
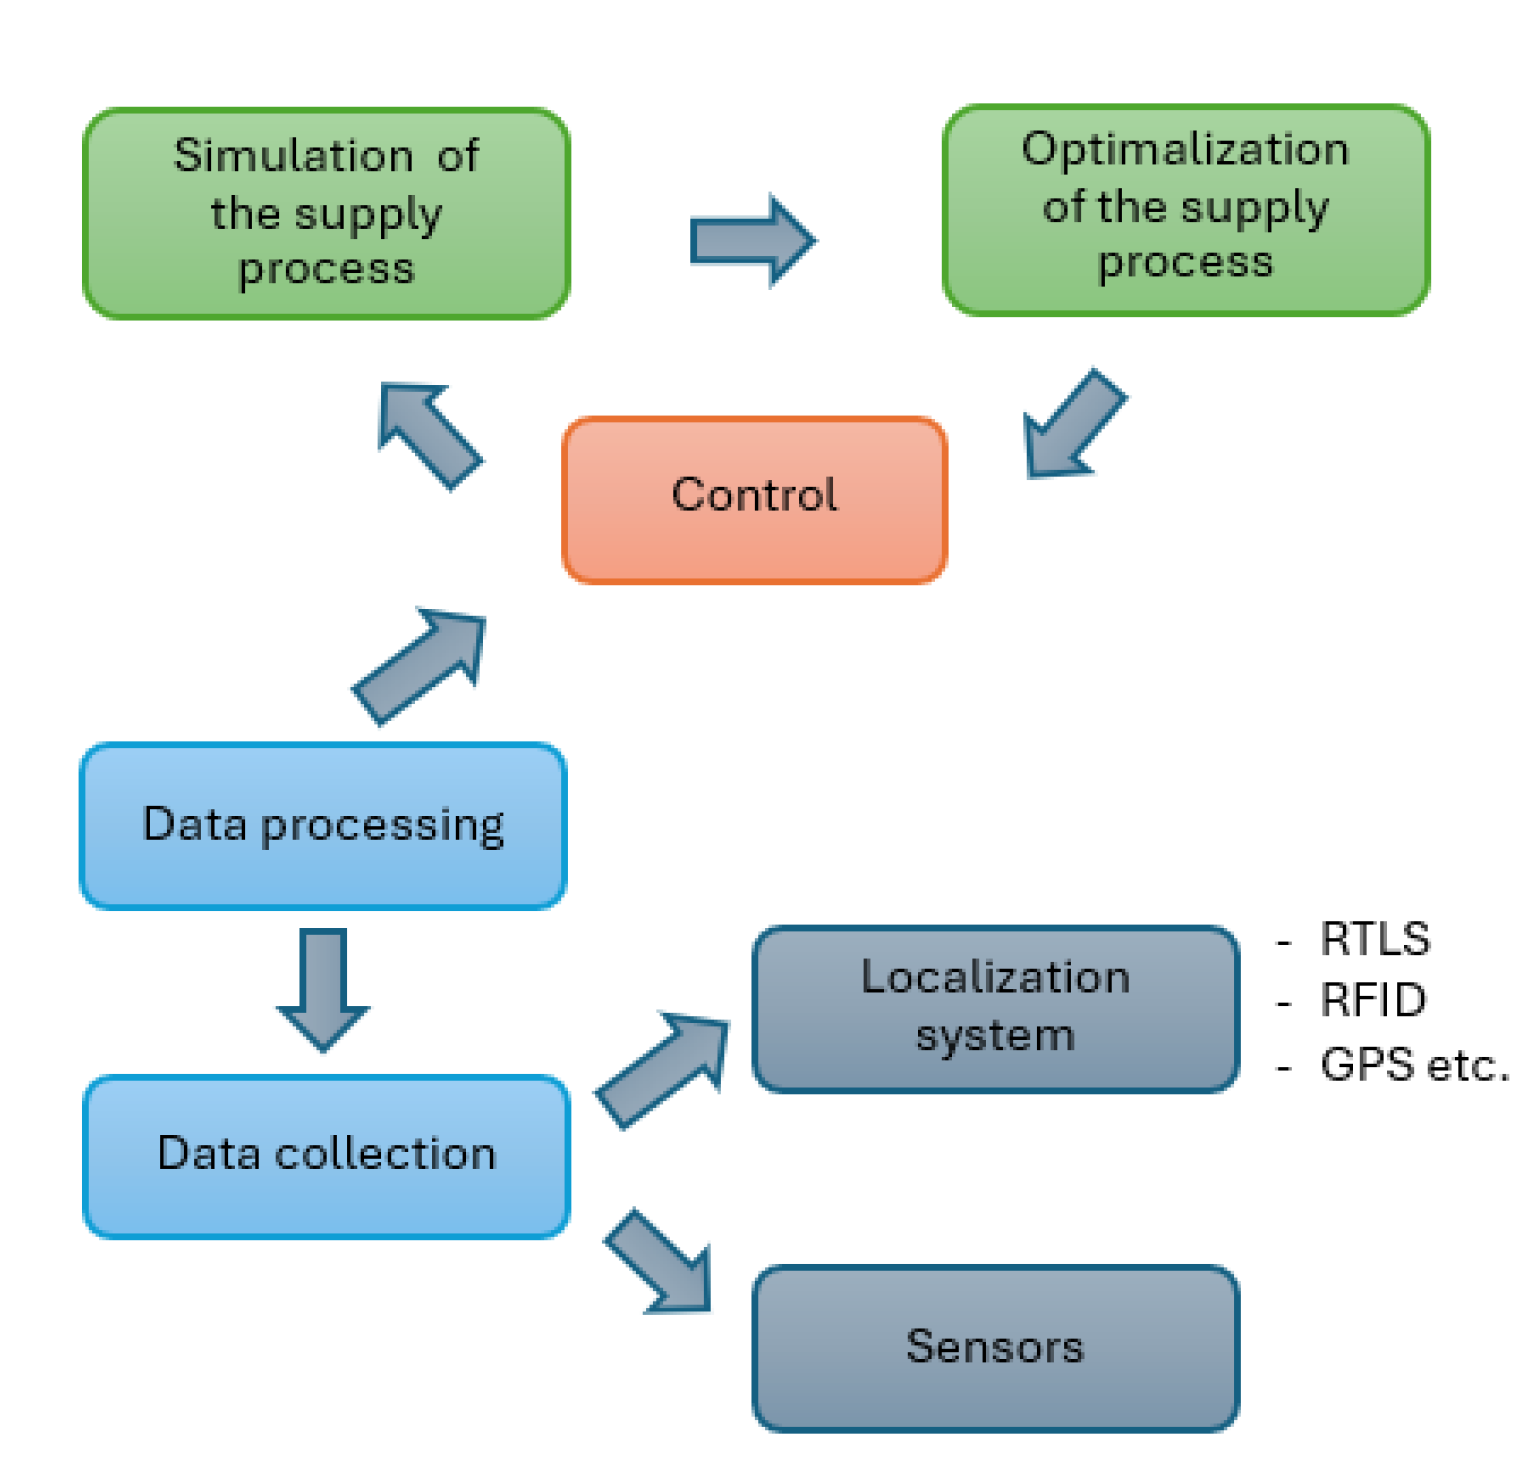
In relation to the focus of this paper and the results of the case study presented, the author collective sees several visions that could be supported through deepening technological advancements and research in this field. These visions are schematically illustrated in Figure 9. The vision for the future will be described using an example of the potential future functioning of the process presented in this paper. The integration and networking of certain technologies and research in this area could have the following impact, demonstrated through the example of the operational facility:
The localization system would primarily track the location of the material stored on a specific supply unit. When the supply unit halts near the location where the material should be properly unloaded, the scanner used by the operator during material loading would dynamically process data about the material already in the correct location and that which is still in the cart. If the operator fails to unload a container and tries to proceed to the next workstation, the scanner would alert the operator about the mistake. The system could be further enhanced; in the event of an error during loading and unloading, the supply train itself, which would also be systemically localized as a mobile entity in the process, could be automatically blocked until the operator correctly performs the task. The movement of the train would be unblocked only after each material container is properly localized.
Through the localization of materials, supply trains, and possibly even operators, a multi-stage system control would ensure the accuracy of the supply process. This system would need to be wirelessly networked and operate smoothly in real time. Moreover, it would need to receive and send signals in real time regarding the correctness of the location and signal the operator whether the task has been performed correctly, as well as inform the supply train when it can proceed to the next station.
Such a system would implement not only the principles of Industry 4.0 but also, considering the preservation of operator positions, it would align with the principles of Industry 5.0, which integrates the human factor into the manufacturing process, while alleviating the physical and mental workload as much as possible. In case the elimination of the human factor is required, AGV (Automated Guided Vehicle) technology could be integrated into the process, utilizing machine learning techniques to autonomously perform certain operations. However, the goal of improving and implementing technological advancements should not be to eliminate human resources from manufacturing processes at all costs.
The implementation of digital twin technology into this data-processing process would allow real-time verification of improvement possibilities for different states that may arise in the process, based on simulation procedures [21]. Using a digital framework and the results of these simulations, continuous measures could be taken to improve the efficiency of the manufacturing process, maintaining it at an optimal level. The sensor technology within the context of the digital twin would be complemented by localization devices, which would smoothly send collected data in real time for editing into a format suitable for simulation software. This editing could be performed with the help of artificial intelligence. The implementation of multi-stage analyses would accelerate continuous process improvement, as well as planning and modeling new processes based on data from existing operations.
Author Contributions
Conceptualization, M.K., J.K., M.P, A.H.; methodology, M.K., J.K., M.P, A.H.; software, M.K.; validation, M.K., J.K., M.P, A.H.; formal analysis, J.K. and M.K.; investigation, M.K., J.K., M.P, A.H. ; resources, M.P. and J.K.; data curation, M.K., J.K., M.P, A.H.; writing—original draft preparation, M.K., J.K., M.P, A.H..; writing—review and editing, M.K., J.K. and A.H.; project administration, M.K. All authors have read and agreed to the published version of the manuscript.
Funding
This research received no external funding.
Data Availability Statement
No applicable.
Acknowledgments
This article was created by the implementation of the grant project APVV-17-0258 Digital engineering elements application in innovation and optimization of production flows, APVV-19-0418 Intelligent solutions to enhance business innovation capability in the process of transforming them into smart businesses, KEGA 020TUKE-4/2023 Systematic development of the competence profile of students of industrial and digital engineering in the process of higher education, VEGA 1/0508/22 Innovative and digital technologies in manufacturing and logistics processes and system and VEGA 1/0383/25 Optimizing the activities of manufacturing enterprises and their digitization using advanced virtual means and tools.
Conflicts of Interest
The authors declare no conflict of interest.
References
- Liu, M.; Tang, J.; Ge, M.; Jiang, Z.; Hu, J.; Ling, L. Dynamic Prediction Method of Production Logistics Bottleneck Based on Bottleneck Index, In CHINESE JOURNAL OF MECHANICAL ENGINEERING. [CrossRef]
- Kasemset, C., Kachitvichyanukul, V. Simulation-based procedure for bottleneck identification, In ASIASIM 2007, OCT, 2007, Seoul, SOUTH KOREA, ISSN 1865-0929.
- Trebuňa, P., Kliment, M., Pekarčíková, M.: Application of simulation in the optimization of the blood plasma storage process, 2023. In: Applied sciences. – Bazilej. [CrossRef]
- Pekarčíková, M., Trebuňa, P., Kliment, M., Dic, M.: Solution of Bottlenecks in the Logistics Flow by Applying the Kanban Module in the Tecnomatix Plant Simulation Software, 2021. In: Sustainability. – Bazilej. [CrossRef]
- Thürer, M.; Stevenson, M.: Bottleneck-oriented order release with shifting bottlenecks: An assessment by simulation, 2018 In. International Journal Of Production Economics. [CrossRef]
- Gola, A.; Plinta, D.; Grznar, P. Modelling and simulation of reconfigurable manufacturing system for machining of casing-class parts. In Proceedings of the 20th International Scientific Conference Engineering for Rural Development, Jelgava, Latvia, 26–28 May 2021; pp. 1563–1568. [Google Scholar]
- Wicher, P.; Stas, D.; Karkula, M.; Lenort, R.; Besta, P. A Computer Simulation-Based Analysis of Supply Chains Resilience in Industrial Environment. Metalurgija 2015, 54, 703–706.Author 1, A.; Author 2, B. Book Title, 3rd ed.; Publisher: Publisher Location, Country, 2008; pp. 154–196.
- Kábele, P.; Edl, M. Increasing the Efficiency of the Production Process Due to Using Methods of Industrial Engineering. In Advances in Design, Simulation and Manufacturing II: Proceedings of the 2nd International Conference on Design, Simulation, Manufacturing: The Innovation Exchange, DSMIE-2019, Lutsk, Ukraine, 11–14 June 2019; Springer: Berlin/Heidelberg, Germany, 2019; pp. 126–137. [Google Scholar]
- Saderova, J.; Poplawski, L.M.B., Jr.; Michalkova, S.; Cvoliga, M. Layout Design Options for Warehouse Management. Pol. J. Manag. Stud. 2020, 22, 443–455. [Google Scholar] [CrossRef]
- Sasiadek, M.; Kielec, R.; Wozniak, W. The Application of the Dependency Structure Matrix in the Planning of Production Processes, Vision 2025: Education Excellence and Management of Innovations Through Sustainable Economic Competitive Advantage. In Proceedings of the 36th IBIMA Conference, Madrid, Spain, 13–14 November 2019; pp. 6148–6155. [Google Scholar]
- Matisková, D.; Balog, M.; Husár, J. Criteria for the Optimization of Production Processes in Machining of Metallic Materials. Manag. Syst. Prod. Eng. 2018, 26, 227–230. [Google Scholar] [CrossRef]
- Saniuk, S.; Grabowska, S.; Straka, M. Identification of Social and Economic Expectations: Contextual Reasons for the Transformation Process of Industry 4. 0 into the Industry 5.0 Concept. Sustainability 2022, 14, 1391. [Google Scholar]
- Balzer, R.; Užík, M.; Glova, J. Managing Growth Opportunities in The Digital Era—An Empiric Perspective of Value Creation. Pol.J. Manag. Stud. 2020, 21, 87–100. [Google Scholar] [CrossRef]
- Krajcovic, M.; Gabajová, G.; Matys, M.; Grznár, P. ; Dulina, L’. ; Kohár, R. 3D Interactive Learning Environment as a Tool for Knowledge Transfer and Retention. Sustainability 2021, 13, 7916. [Google Scholar]
- Sarjono, H.; Kusuma, V., Hamali, S.; Mulyono, Planning Production Capacity Optimisation with Rough Cut Capacity Planning, PERTANIKA JOURNAL OF SOCIAL SCIENCE AND HUMANITIES (2016), Volume 24, Page 33-45, ISSN 0128-7702.
- Ojstersek, R.; Javernik, A.; Buchmeister, B. The impact of the collaborative workplace on the production system capacity: Simulation modelling vs. real-world application approach. Adv. Prod. Eng. Manag. 2021, 16, 431–442.Author 1, A.B. (University, City, State, Country); Author 2, C. (Institute, City, State, Country). Personal communication, 2012.
- Min, Z.; Nie, GH.; Ming, Z.; Lihm, H. Capacity improvement of an LCM production line, Proceedings of the 3rd International Conference on Innovation & Management, Vols 1 and 2 (2006), Page 1028-1031, ISBN 978-7-5629-2471-5.
- Straka, M., Hricko, M.: Software system design for solution of effective material layout for the needs of production and logistics, 2022. In: Wireless networks : the journal of mobile communication, computation and information. [CrossRef]
- Glova, J.; Sabol, T.; Vajda, V. Business Models for the Internet of Things Environment: Emerging Markets Queries in Finance And Business (Emq 2013). Procedia Econ. Financ. 2014, 15, 1122–1129. [Google Scholar] [CrossRef]
- Sujova, A.; Marcinekova, K.; Hittmar, S. Sustainable Optimization of Manufacturing Process Effectiveness in Furniture Production. Sustainability 2017, 9, 923. [Google Scholar] [CrossRef]
- Ragazzini, L.; Negri, E.; Fumagalli, L.; Macchi, M.: Digital Twin-based bottleneck prediction for improved production control, 2024, In. COMPUTERS & INDUSTRIAL ENGINEERING, Volume 192. [CrossRef]
Figure 2.
Algorithm for Supply Process Simulation Using tools for identifying bottlenecks.
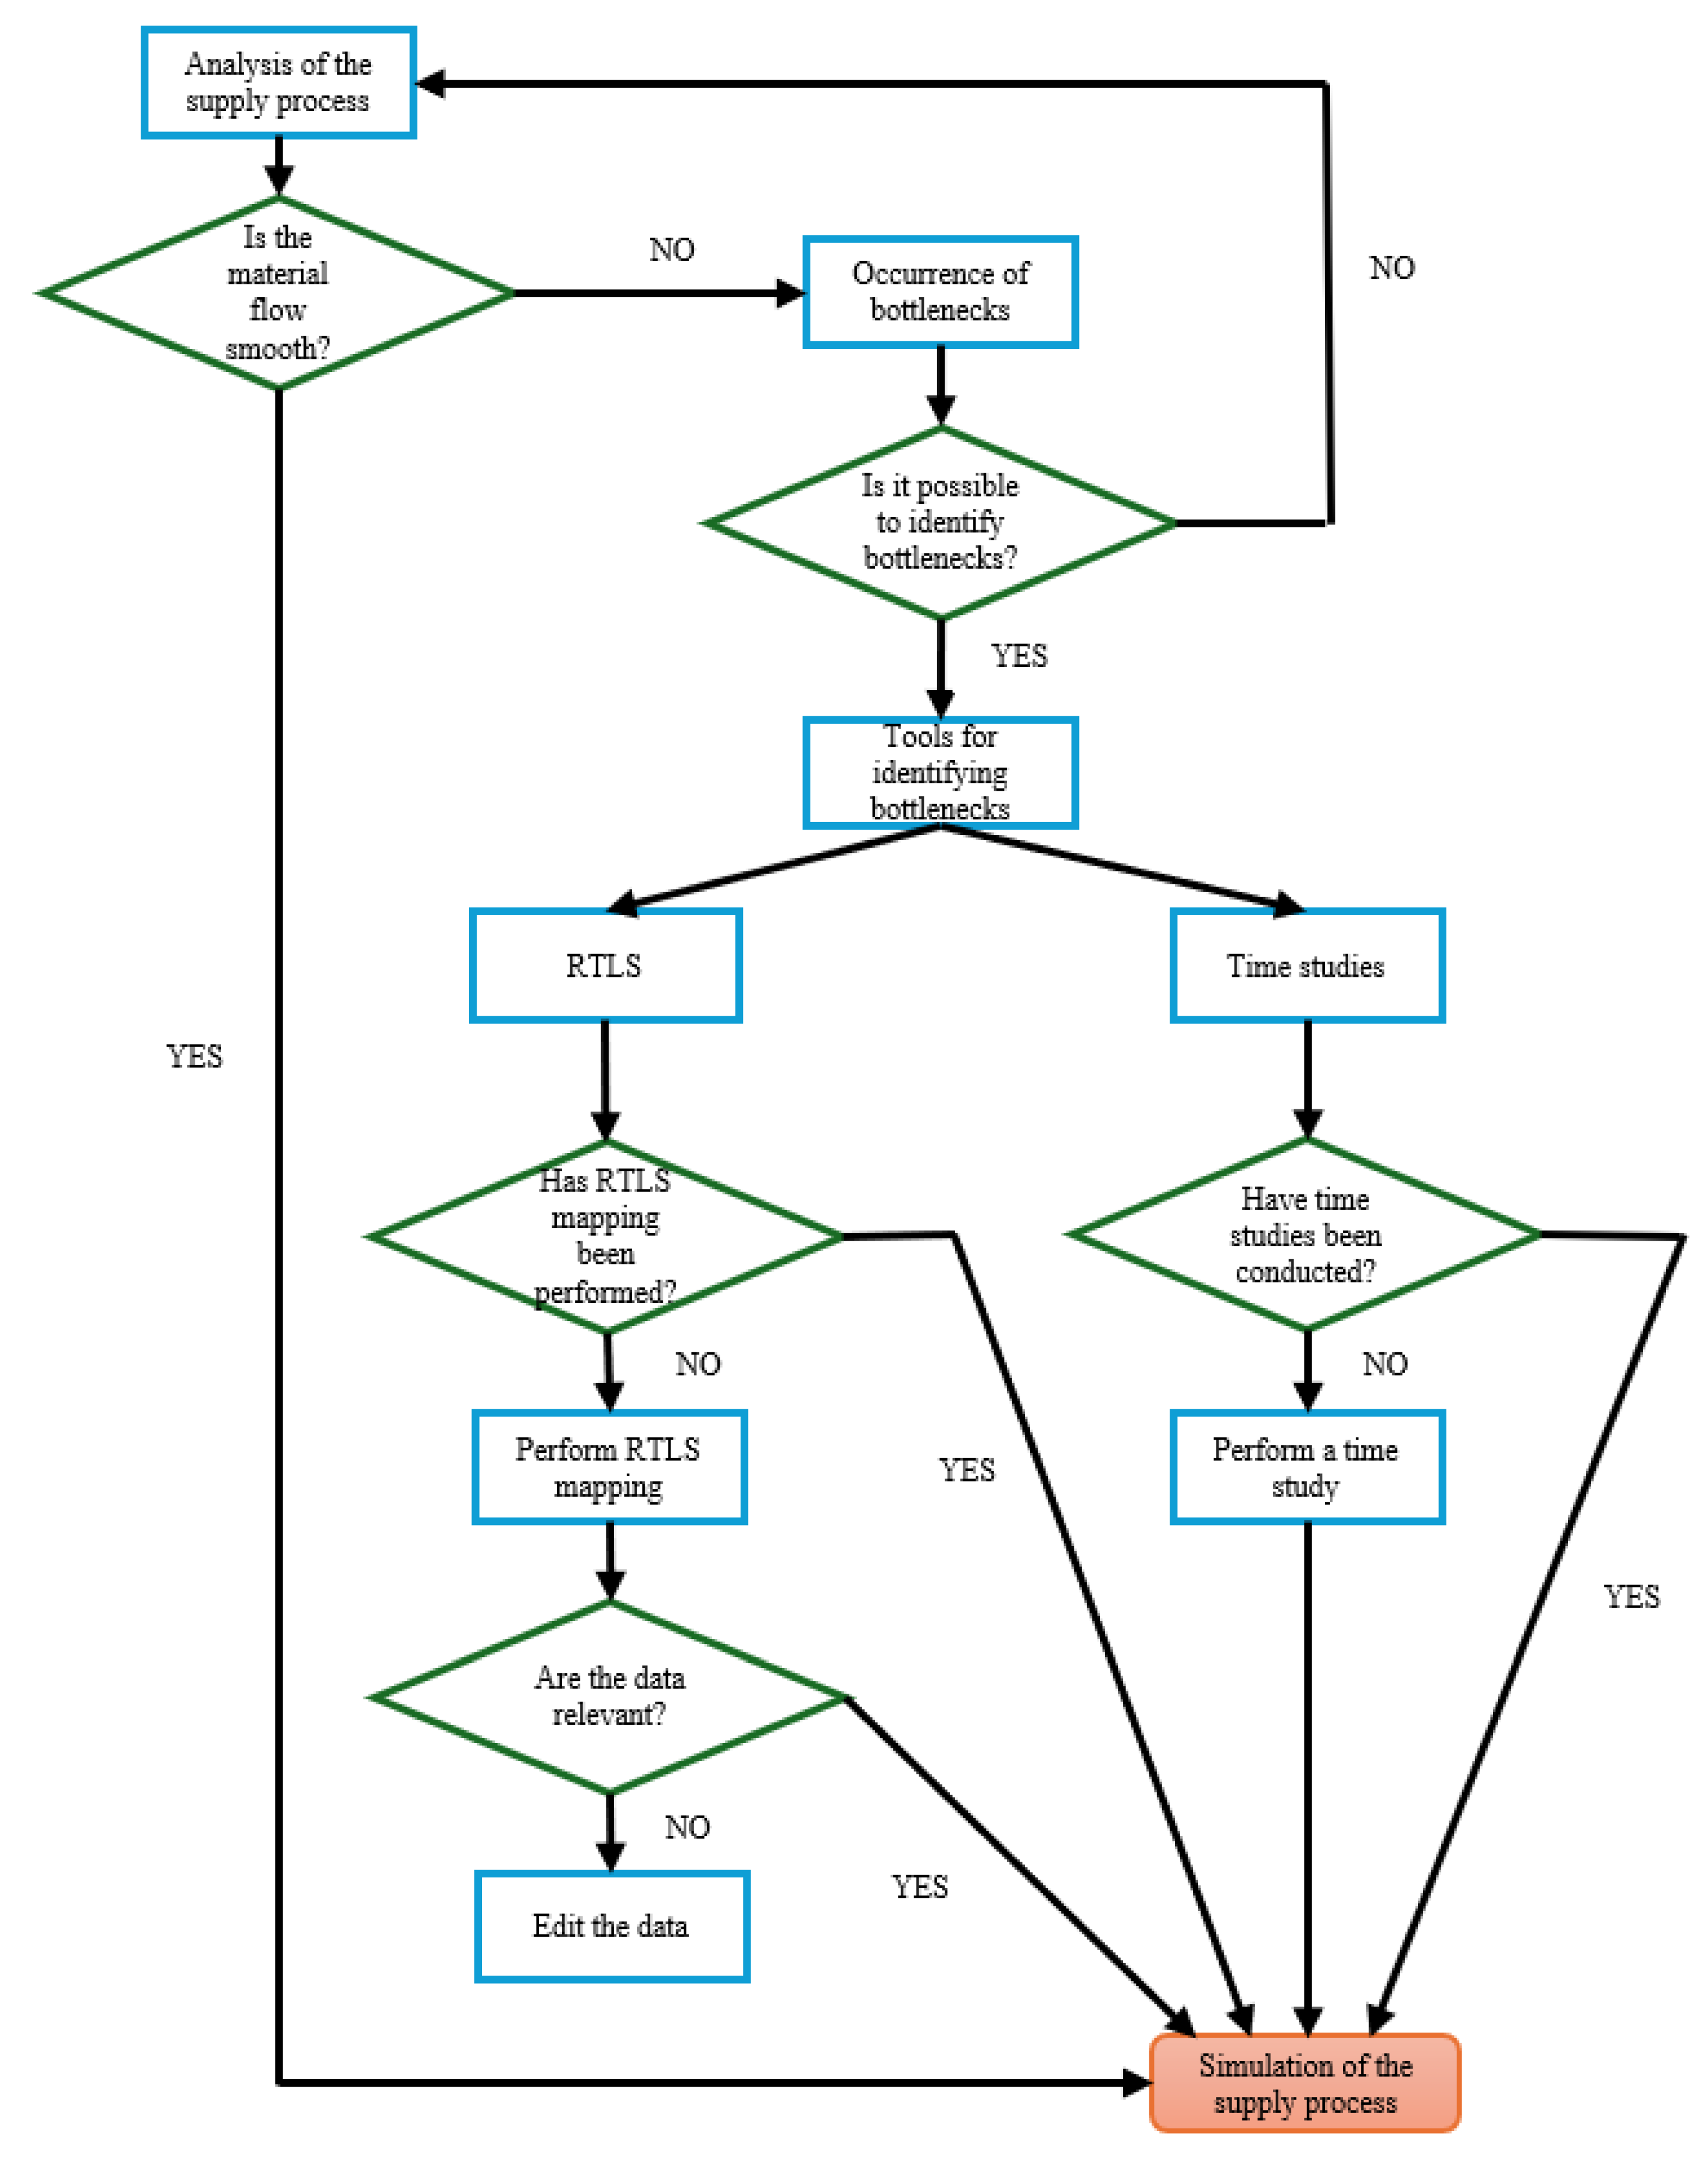
Figure 6.
Collision resolution process.
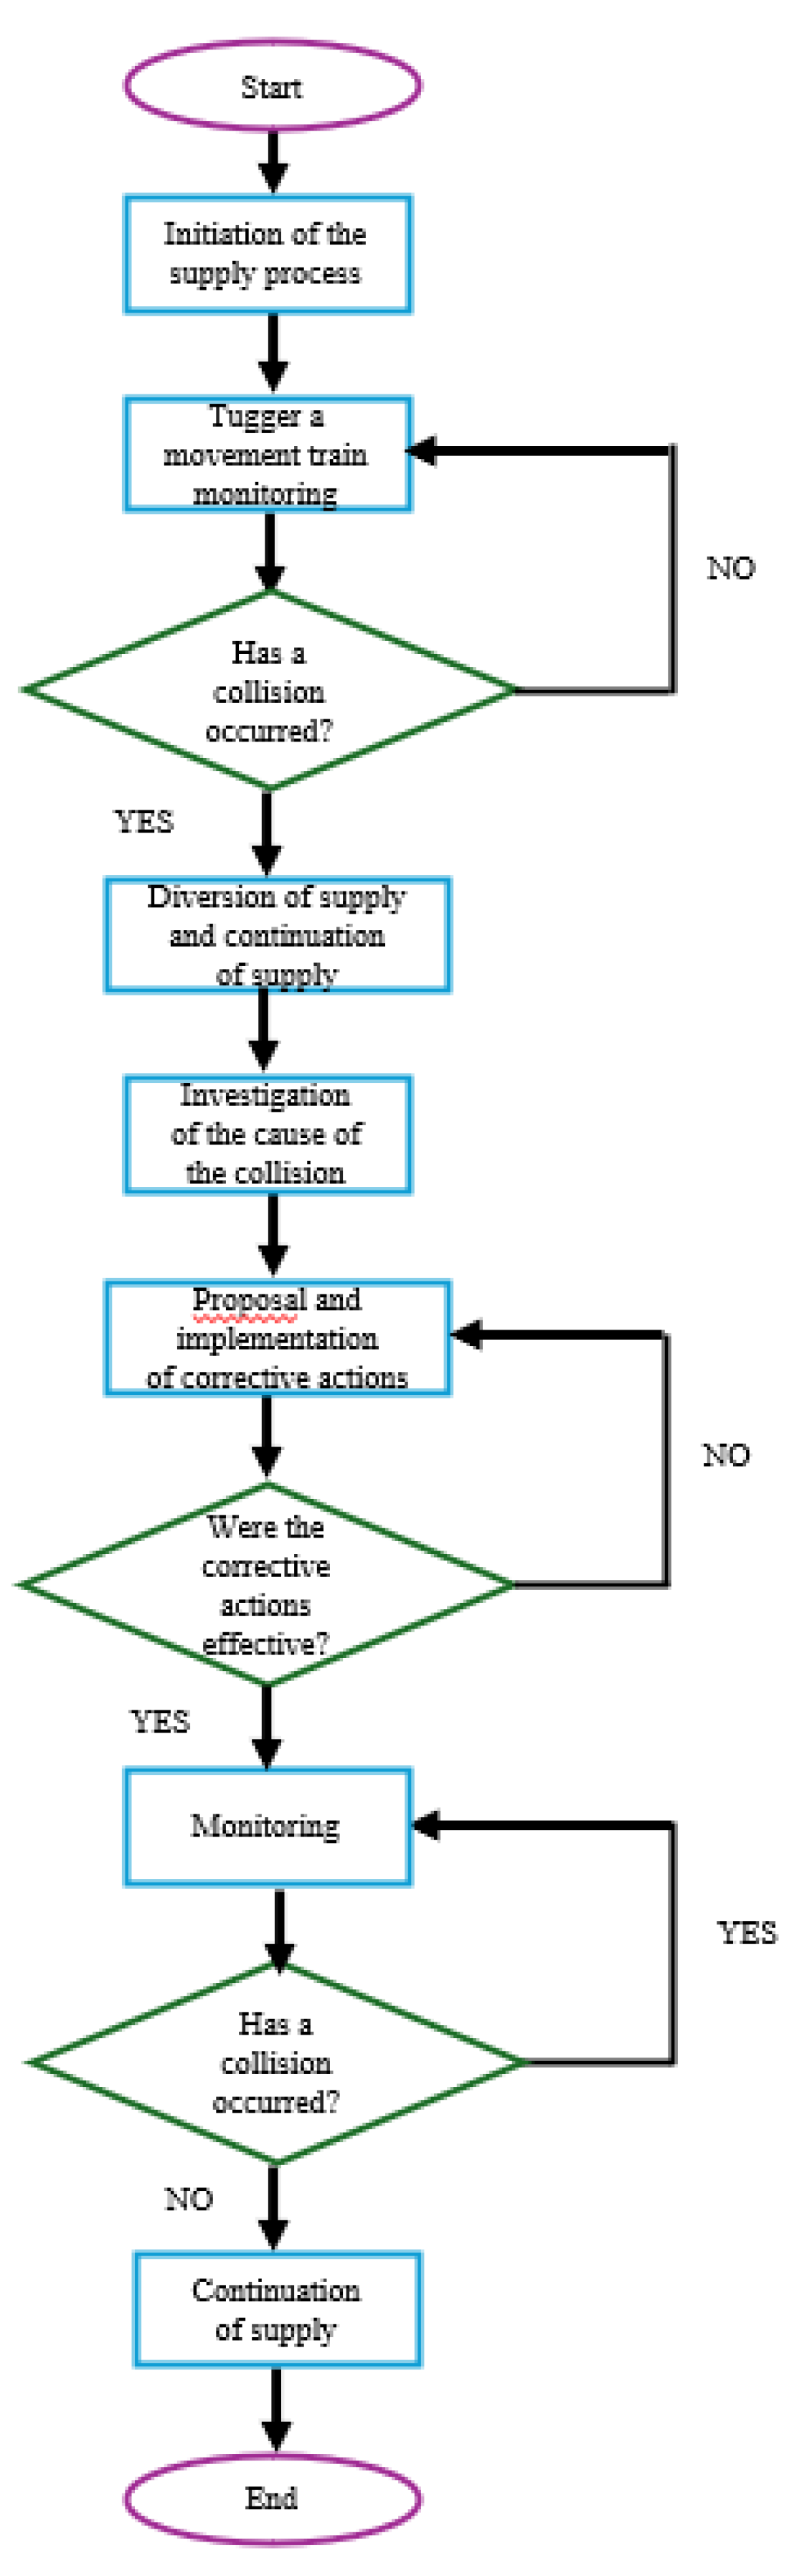
Figure 7.
Simulation of production line.
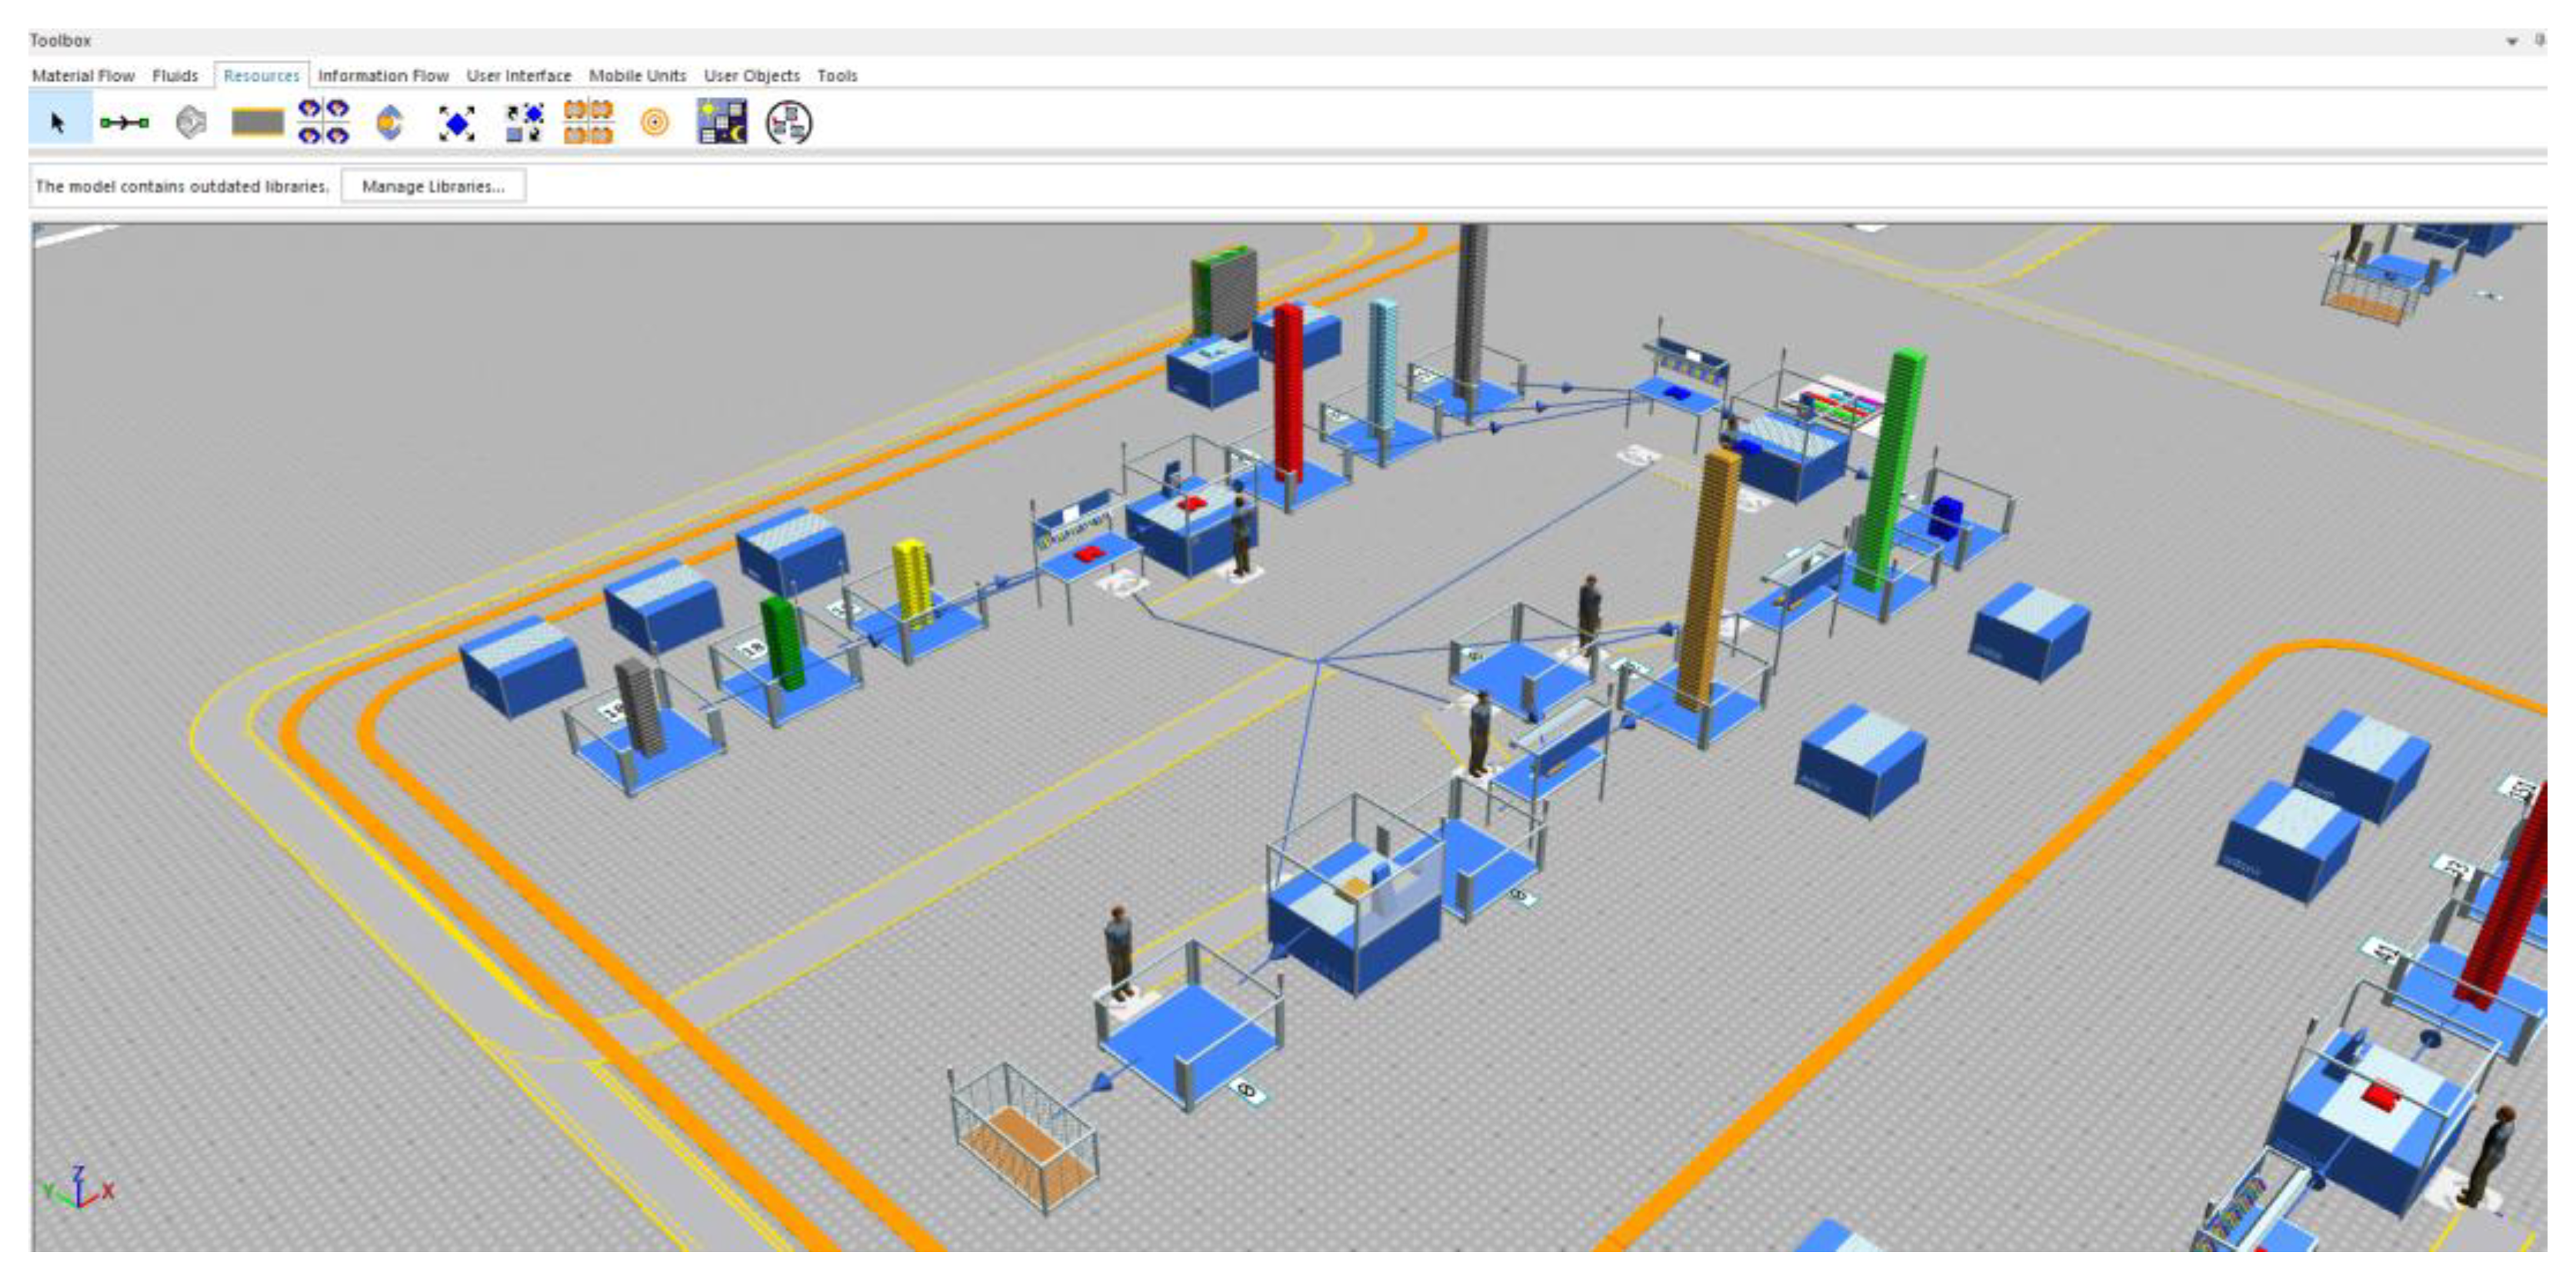
Figure 8.
2D and 3D model of the production unit with a tugger train sets.
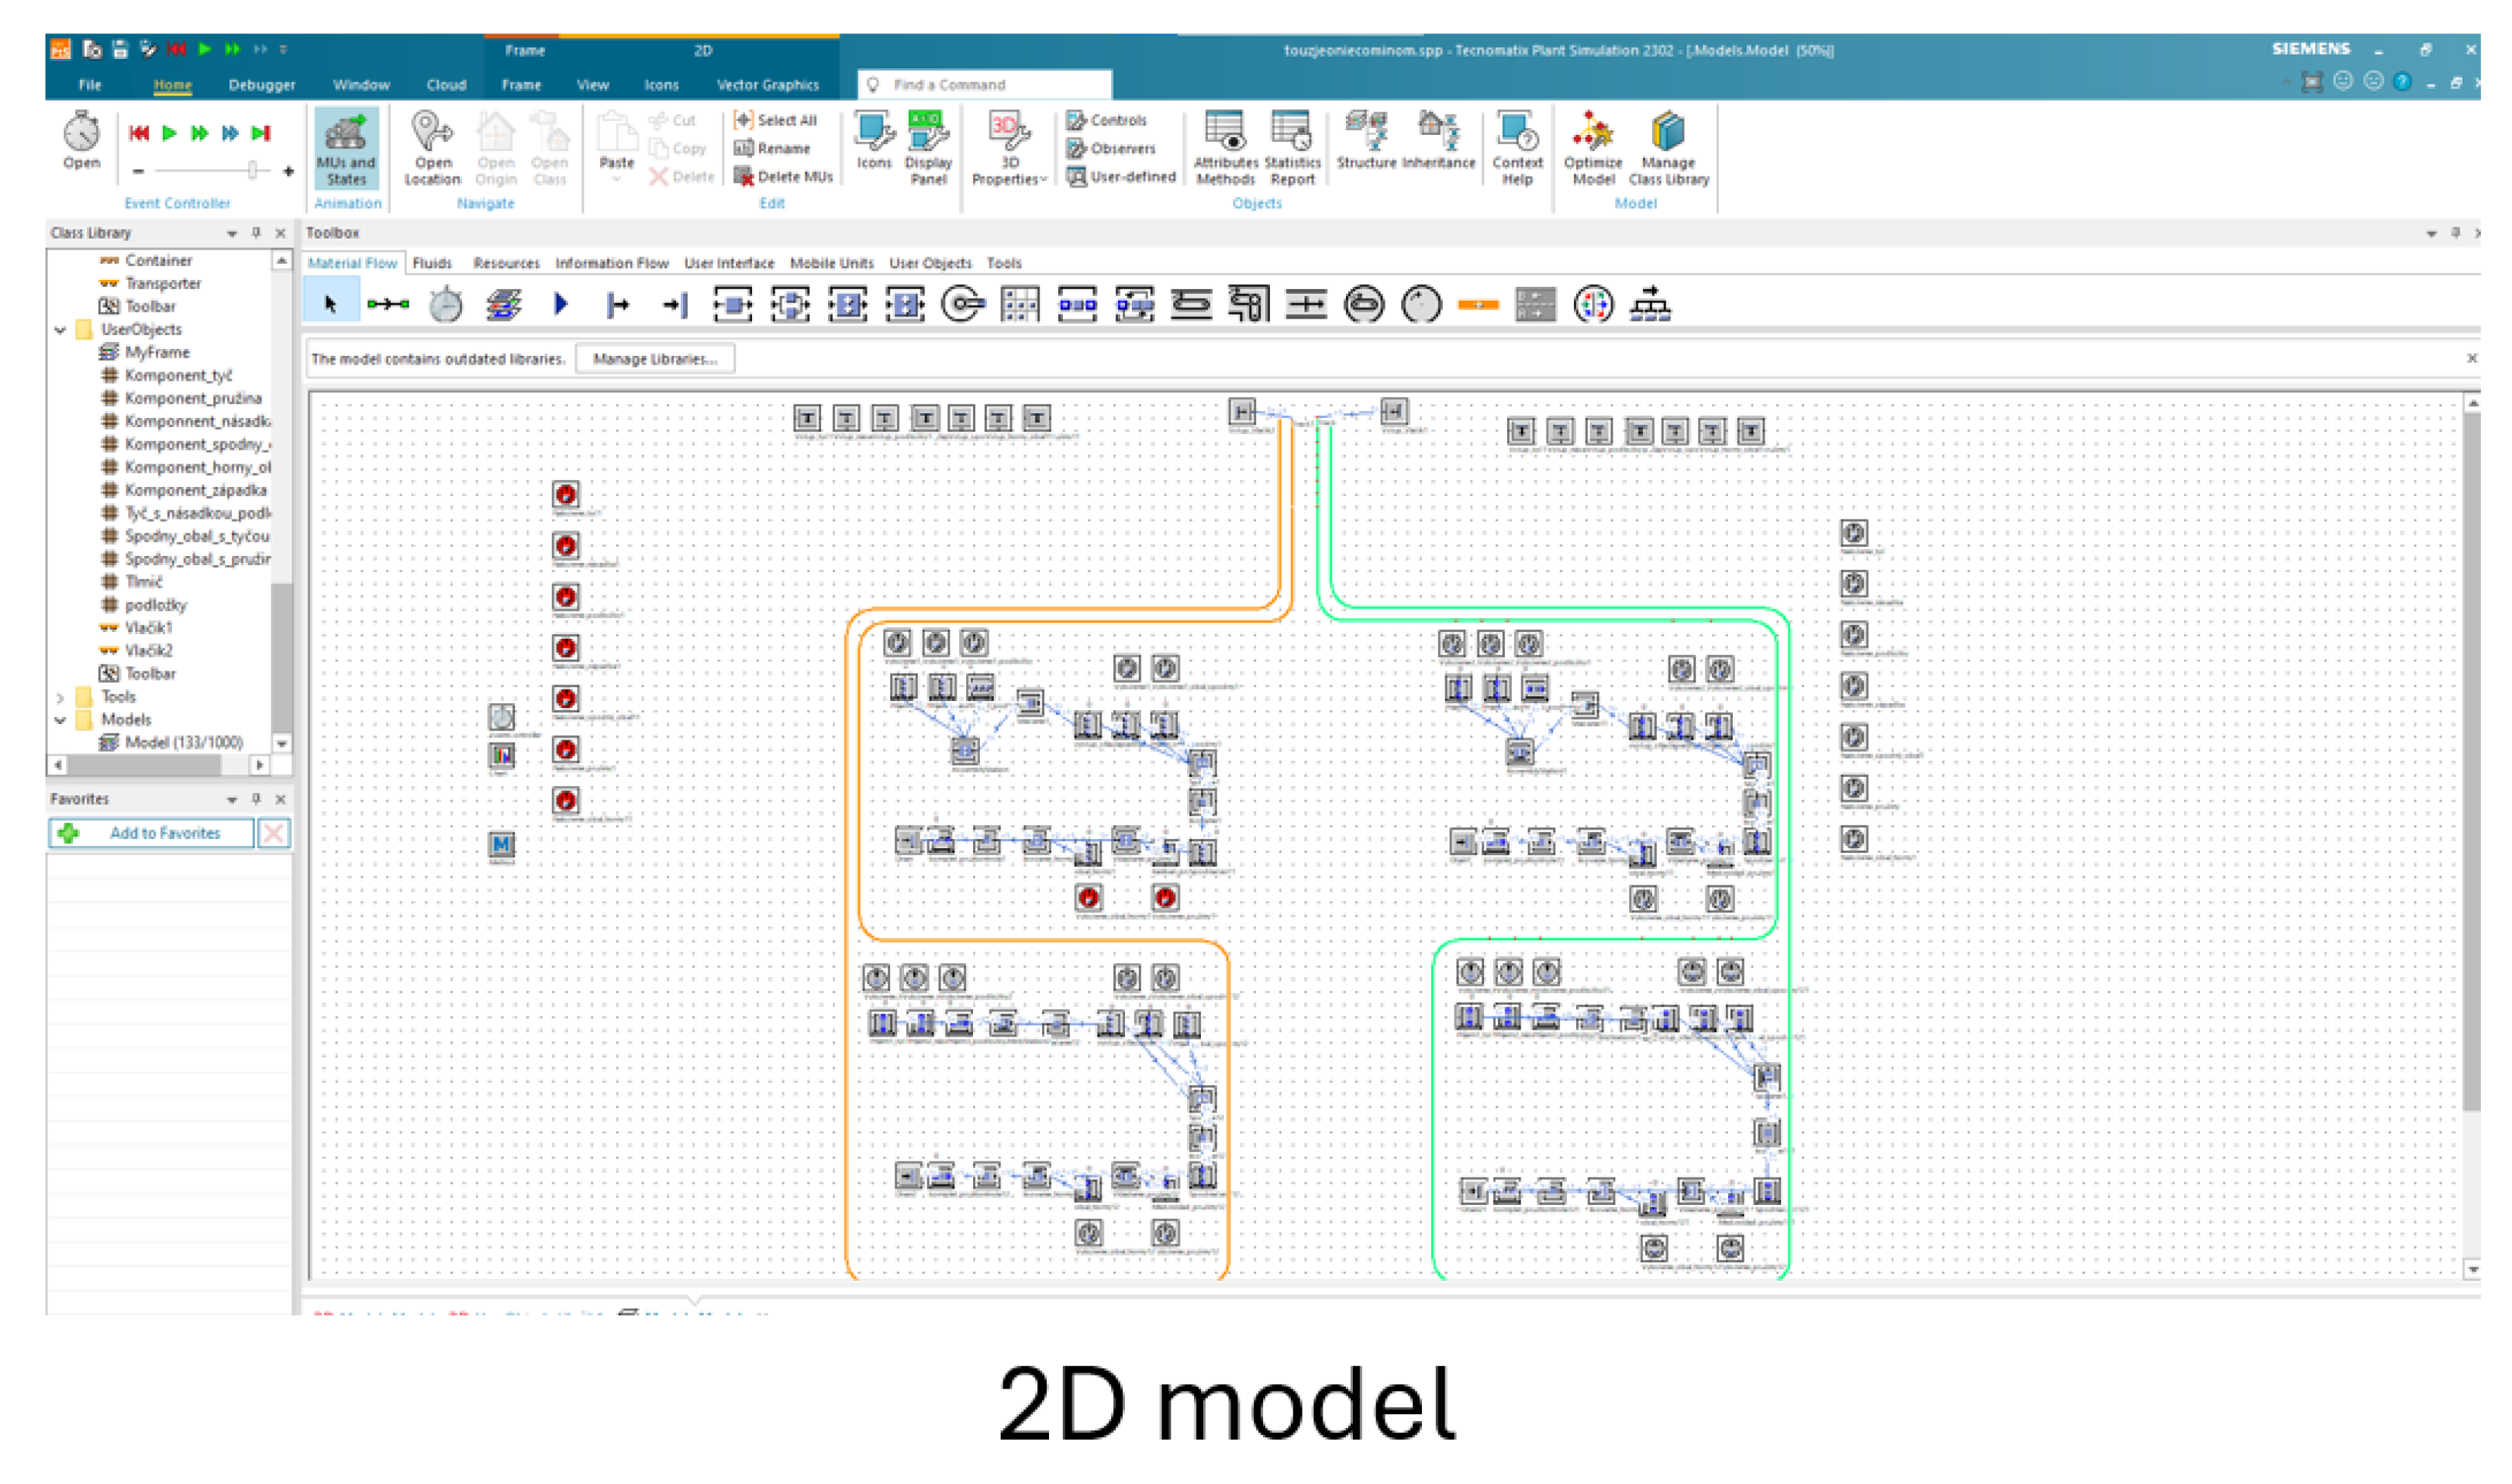
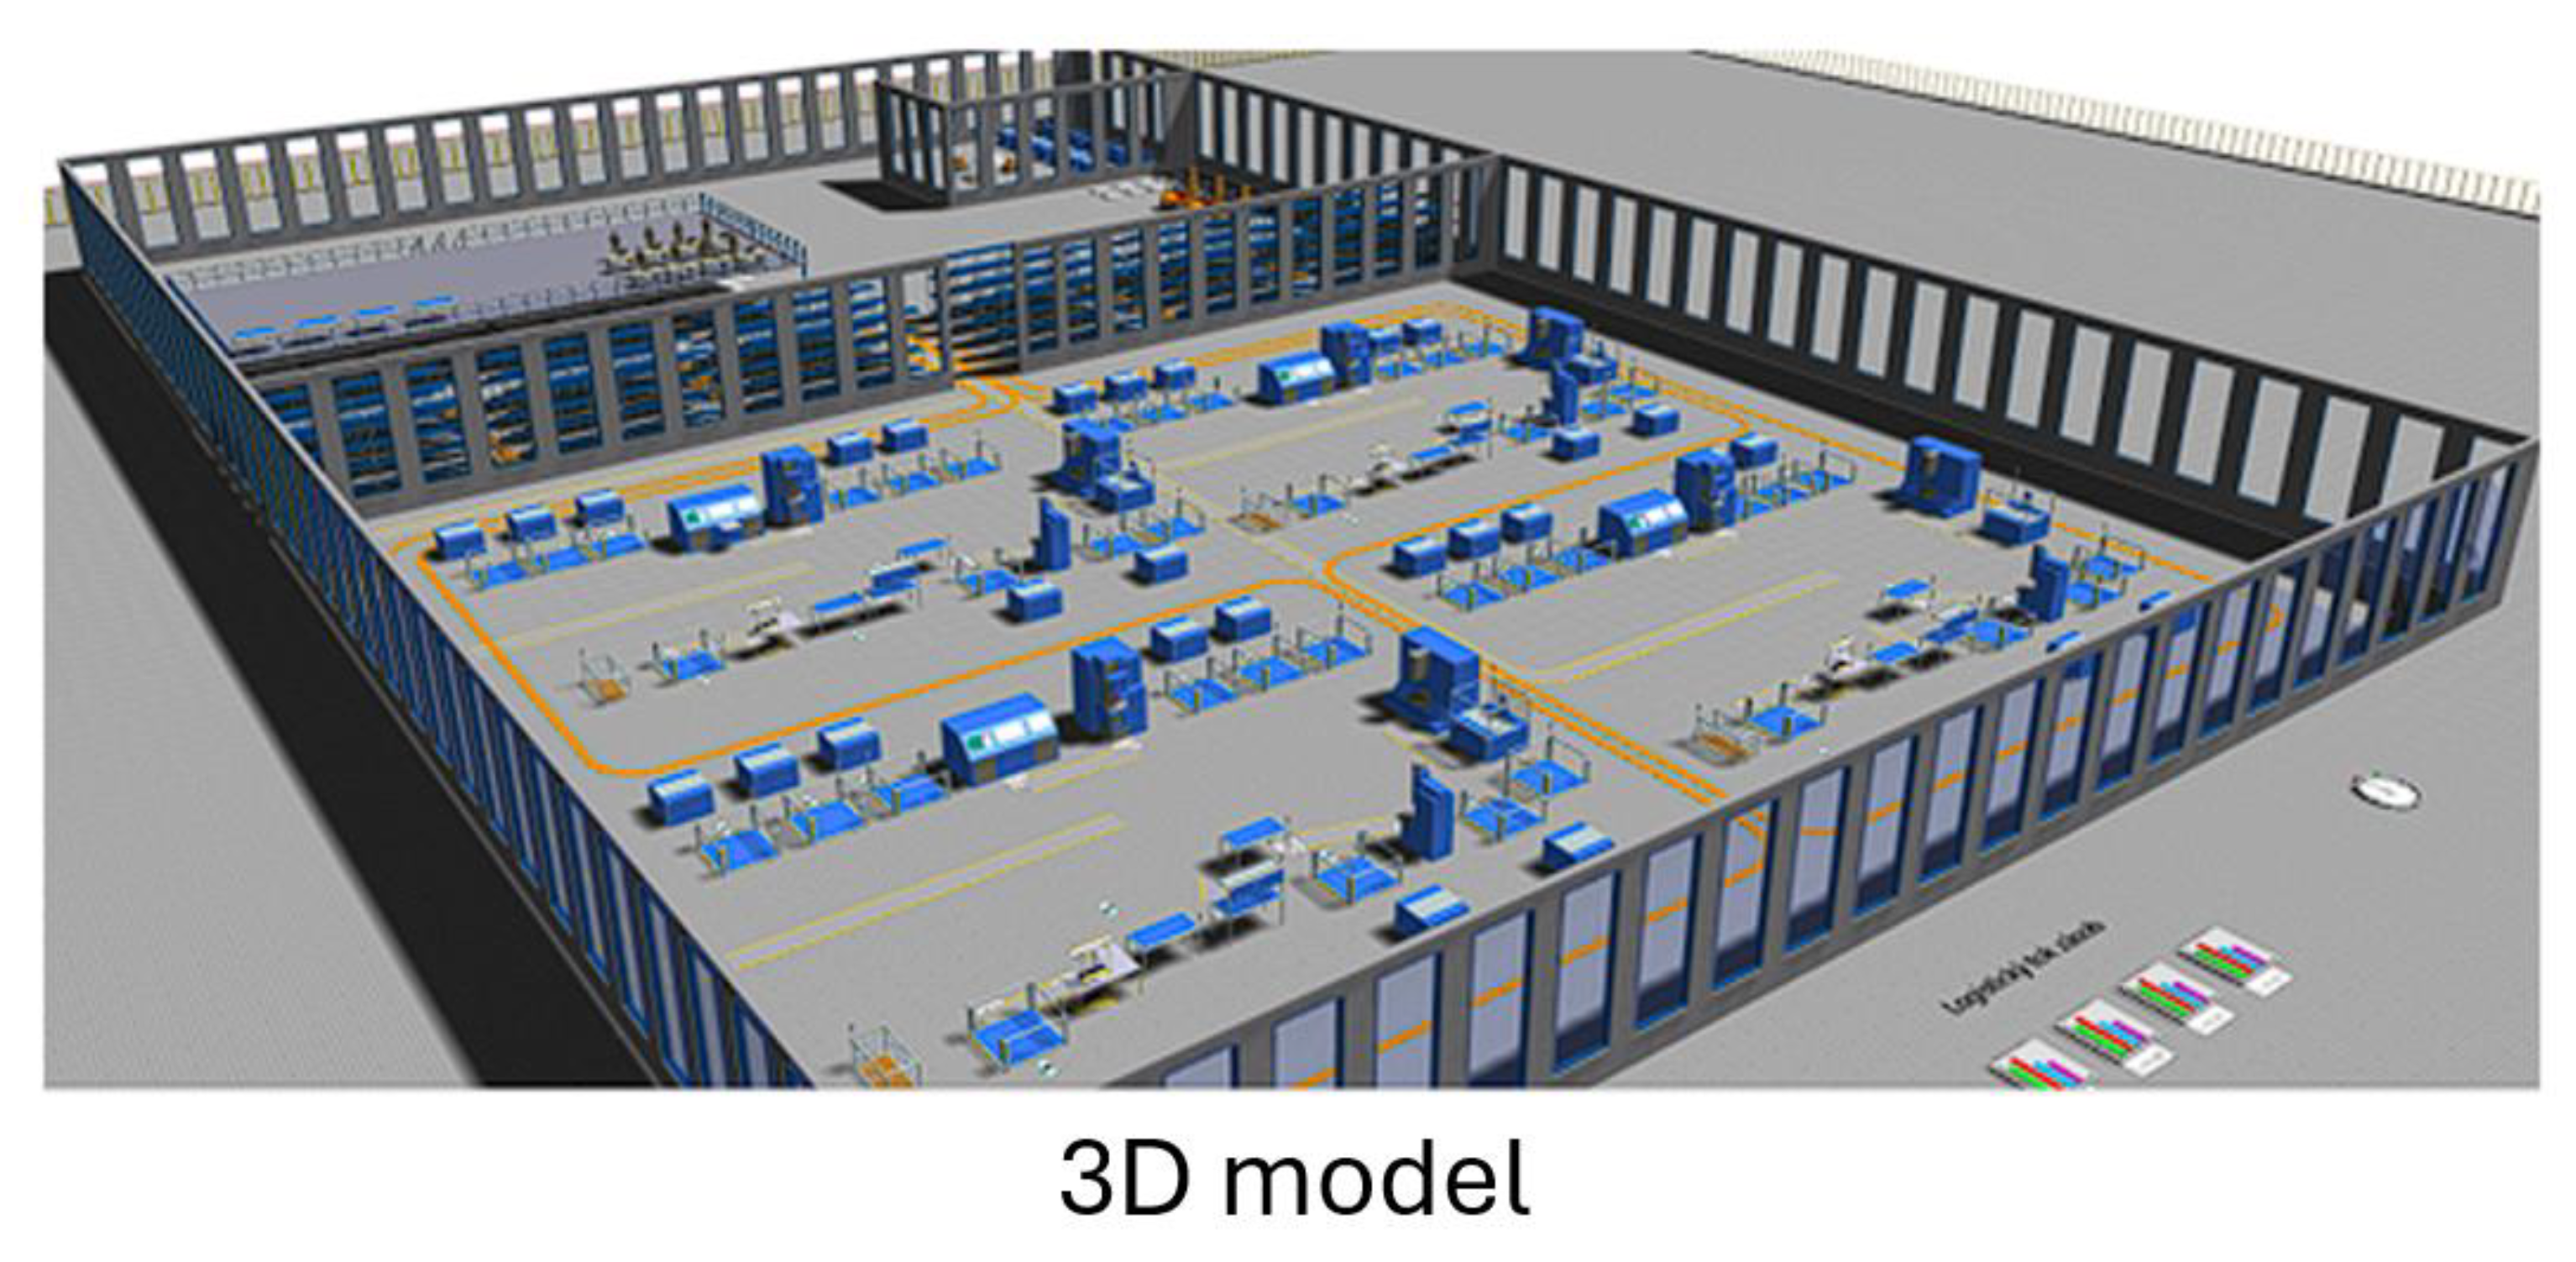

Table 1.
Comparison of processes.
| Planned ideal state | State proposed and verified through simulation | Actual state during data collection | |
| Number of collisions per month | 0 | 0 | 9 |
| Production capacity (units/production line) | 1200 | 950 | 825 |
| Loading time of the tugger trains | 90 minutes | <105 minutes | <120 minutes |
| Tugger train time in the production hall | < 30 minutes | < 20 minutes | < 44 minutes |
| Kanban replenishment time | < 3 minutes | < 2 minutes | < 1,32 minutes |
Disclaimer/Publisher’s Note: The statements, opinions and data contained in all publications are solely those of the individual author(s) and contributor(s) and not of MDPI and/or the editor(s). MDPI and/or the editor(s) disclaim responsibility for any injury to people or property resulting from any ideas, methods, instructions or products referred to in the content. |
© 2025 by the authors. Licensee MDPI, Basel, Switzerland. This article is an open access article distributed under the terms and conditions of the Creative Commons Attribution (CC BY) license (https://creativecommons.org/licenses/by/4.0/).
Copyright: This open access article is published under a Creative Commons CC BY 4.0 license, which permit the free download, distribution, and reuse, provided that the author and preprint are cited in any reuse.


