Submitted:
27 March 2025
Posted:
27 March 2025
You are already at the latest version
Abstract
The nickel phosphide catalysts (Ni2P) were prepared using mesoporous molecular sieves as supports by isobaric co-impregnation. The Ni2P catalysts with different loading were characterized, which showed that the active phase on the surface of the catalysts was mainly Ni2P and the catalysts still retained the mesoporous structural characteristics of the supports. The catalysts were evaluated using a 10 mL fixed bed hydrogenation unit. The results showed that the nickel phosphide catalysts had a higher hydrogenation capacity than the sulphide catalysts and were able to preferentially hydrogenate and saturate most of the quinolines to decahydroquinolines, reduce the conversion of 1,2,3,4-tetrahydroquinoline to o-propylaniline and reduce the inhibition of reactivity due to competitive adsorption. The effect of catalyst on the path selectivity of quinoline hydrogenation was investigated, and the products of quinoline hydrogenation and denitrogenation consisted mainly of propylbenzene and propylcyclohexane, and propylcyclohexane accounted for 91.7% and propylbenzene for 4.8% under the conditions of nickel phosphide catalysts.
Keywords:
hydrodenitrogenation
; quinoline
; nickel phosphide
; decahydroquinoline
1. Introduction
The removal of nitrogen compounds from oil is more demanding than the removal of sulphur from sulphides. As alkaline nitrogen compounds increase the production of soluble gums, especially aniline and quinoline, they have a significant effect on the colour stability of petrol and paraffin [1,2,3] and alkaline nitrogen compounds inhibit the hydrodesulphurization of liquefied oils [4]. Quinoline, quinoline system and its derivatives account for a large proportion of the alkaline nitrogen compounds in oils, and they are difficult to remove, so it is difficult to meet the requirements of nitrogen removal in coal liquefaction oil hydrofinishing by traditional sulfide state of hydrofinishing catalysts.
In recent years, transition metal phosphides represented by Ni2P have attracted attention for their excellent hydrodenitrogenation (HDN) and hydrodesulfurization (HDS) properties as well as high stability. The structure of the triangular prismatic unit of phosphide is similar to that of sulphide, but unlike sulphide, phosphide is not a layered structure but is more spherical. This spherical-like structure of phosphide can expose more number of coordinated unsaturated surface atoms than sulfide, have higher surface active site density, and thus have better catalytic activity, in addition, phosphide has the advantages of no need for on-site activation, light contamination, and strong resistance to toxicity, and the relevant research is very active [5,6,7,8,9,10]. SBA-15, a type of mesoporous molecular sieve similar to SBA-3, stands out due to its larger pore size compared to SBA-3 and MCM-41. This characteristic, along with thicker pore walls and greater pore volume, makes it ideal for treating coal-based oils with large molecules. Additionally, its enhanced hydrothermal stability supports its use in high-temperature conditions [11,12].
In this work, phosphide catalysts based on SBA-15 were prepared to investigate the conversion pathways of typical alkali nitride quinoline (Q) in the hydrorefining process. The results showed that the nickel phosphide catalyst had significantly better hydrogenation ability than the sulphide state catalyst. It was able to preferentially hydrogenate and saturate most of the quinoline to decahydroquinoline while reducing the ratio of 1,2,3,4-tetrahydroquinoline (THQ1) to o-propylaniline (OPA). This property indirectly avoided the problem of reaction inhibition due to competitive adsorption in the OPA pathway, and effectively improved the quinoline denitrogenation reaction activity and accelerated the reaction process. The HDN performance of the catalyst was further investigated. Under the effect of Ni2P, the final HDN product of quinoline was mainly saturated propylcyclohexane, which accounted for 91.6%, while propylbenzene accounted for only 4.9%.
2. Materials and Methods
2.1. Catalyst Preparation
SBA-15 was synthesized by many methods, and the present experiment was carried out with reference to the methods described in the literature. An appropriate amount of P123 surfactant was dissolved in deionized water, to which TEOS and 4 mol/L HCl were added. The mixture was stirred for one day before being transferred to a Teflon bottle and kept at 100 °C for crystallization for another day. The resultant product was filtered through an 8 μm membrane, washed with deionized water, dried at 110 °C for 2 h, and subjected to calcination at 550 °C for 5 h The powder of SBA-15 molecular sieve was obtained. 15 molecular sieve powder [12,13].
The catalyst precursor was prepared by the equal volume co-impregnation method. 25 oC, the appropriate amount of (Ni(NO3)2 6H2O was prepared into a solution, adding the appropriate amount of (NH4)2HPO4, adjusting the pH value of the impregnation solution with dilute nitric acid, adding the SBA-15 prepared as described above to the impregnation solution, leaving it for more than 10 h, drying at 110 oC, and putting it into a muffle furnace for 3h at 550 oC, to obtain the powder of SBA-15 molecular sieves. The oxidation state precursor of phosphide was prepared. Oyama S T, Korányi T I [14,15] et al. showed that the active phase was pure Ni2P when P/Ni≥0.75.In the present experiments, phosphide catalysts with different Ni actual loadings were prepared under the loading condition of Ni/P = 2. As a comparison, a commercial catalyst FT1 (carrier γ-Al2O3), which has a better nitrogen removal effect in practice, was chosen. The characteristics are shown in Table 1.
Nickel phosphide precursors need to be reduced to produce nickel phosphide catalysts. After roasting, the catalytic precursor samples of nickel phosphide were ground, crushed and sieved through a 50-mesh sieve; the sieved precursor particles with >50 mesh were placed in a stainless steel high-pressure reduction reactor, and hydrogen was introduced at 200 mL/min, and the system’s temperature was gradually increased to 650 °C at a rate of 10 °C/min, and then maintained at this temperature for 4 h, and then continued to introduce cold hydrogen until it cooled down to room temperature, due to the intense oxidation reaction of nickel phosphate catalysts that come into contact with the atmosphere, and in order to make the catalyst surface passivated for easy characterization, the catalyst surface was further passed through 50 mL/min. Since the phosphide catalyst is easy to undergo a violent oxidation reaction in direct contact with the atmosphere, in order to passivate the surface of the catalyst for easy characterization, the catalyst was passivated for 2 h by continuing to pass 50 mL/min of Ar gas containing 1% (v/v) pure O2, and the passivated samples were taken out for the structural characterization of the catalyst and the catalytic reaction.
2.2. HDN Activity Evaluation Device
The HDN reaction was carried out in a 10 mL stainless steel high-pressure fixed-bed reactor, and the flow is shown in Figure 1. The whole device mainly includes a gas supply system, a feed system, a reaction system, a separation system and a tail gas metering system. Hydrogen is pressurized by the hydrogen compressor and then passes through the system pressure setting valve, and then through the hydrogen mass flow meter, in the upper part of the reactor and the raw material oil pumped over the raw material oil through the check valve and the two are mixed, and together they enter the reactor from the upper part of the reactor. The temperature control of the reactor is divided into three sections, the catalyst is loaded in the middle of the thermostatic section, the upper and lower sections are protected by ceramic ball support. After the reaction products come out from the bottom of the reactor, they pass through two separators, which can be separated from each other to realize a pressure-less discharge of the system. The gas phase product from the separators is metered by a gas flow meter.
2.3. Reaction Materials and Conditions
Decahydronaphthalene (AR) solution containing 1.0 wt % quinoline (Q) was used as the reaction feedstock at a reaction pressure of 6.0 MPa, a reaction temperature of 280-360 °C, and a gravimetric space-vacuum velocity (WHSV) of 20 h-1.
2.4. Catalyst Characterization
2.4.1. X-Ray Diffractometer
The analysis was performed using a Rigaku D/MAX 2500VB 2+ /PC X-ray diffractometer, with a light source of Cu Kα radiation and a tube voltage of 40 kV, and a scanning range of 0.5°-10° in the low-angle region and 10-90° in the high-angle region. The high angle region characterizes the physical phase of the catalyst, and the low angle characterizes the mesoporous structure as well as its ordering.
2.4.2. Nitrogen Adsorption and Desorption Apparatus
The pore size was analyzed using a fully automated physical and chemical adsorption apparatus Sorptomatic 1990, the catalyst needs to be degassed at 300 °C for 4 h before testing, to determine the specific surface area, the BET method was employed, whereas the BJH method was used to calculate the pore size distribution.
2.5. Hydrogenation Product Analysis
The analysis of the quinoline hydrogenation products was performed on an Agilent 7890-II gas chromatograph with the following chromatographic conditions: 0.53 mm ×50 m capillary column, FID detector, 280 °C injector, 280 °C detector, and 100 °C - 280 °C column temperature, and the internal standard method was used to quantitatively calculate the composition of the products and the selectivity of the hydrogenation products.
The nitrogen content of the products was analyzed by Antek 9000 micro nitrogen and sulfur analyzer, and the measuring principle of nitrogen was chemiluminescence; the measuring range was 20 μg/kg ~170000 μg/kg.
The conversion rate of quinoline was calculated as per equation (1):
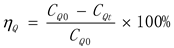 where is the conversion rate, CQ0 is the concentration of feedstock quinoline, and CQt is the concentration of product quinoline after hydrogenation.
There are a large number of intermediates in quinoline hydrogenation, so the nitrogen removal rate is not equivalent to the conversion rate. The denitrogenation rate is calculated as in equation (2):
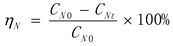
where ƞN is the nitrogen removal rate, CN0
is the concentration of feedstock nitrogen, and CNt is the
concentration of product nitrogen after hydrogenation.
3. Result
3.1. Carrier and Catalyst XRD Analysis
As shown in Figure 2a, the low-angle XRD spectra for SBA-15 and various catalysts are provided. The peaks at 0.86°, 1.55°, and 1.75° corresponding to the 100, 110, and 200 diffraction planes of the SBA-15 crystals respectively show the remarkable hexagonal pore structure feature of the sample, especially on the blank SBA-15 carrier. The observation of diffraction peaks at the (100) crystal plane on the phosphide catalysts with different Ni contents is also noted. The significant diffraction peaks of (110) and (200) crystal planes at 1.55° and 1.75° on the blank SBA-15 carrier with a 5% loading amount and their fading or disappearance as the loading amount increases indicate a higher spatial ordering of the mesoporous structure when the blank carrier and Ni content are lower. However, when the Ni content is higher, the introduction of the nickel phosphide component weakens the long-range ordering of the molecular sieve mesoporous structure.
The high-angle XRD spectra for SBA-15 and N2P/SBA-15 catalysts with varying amounts of Ni are shown in Figure 2b. As seen from the Figure 2b, without an obvious Ni2P characteristic peak on the XRD spectrum for the 5% Ni content catalyst with a blank carrier, it shows that the Ni2P component didn’t agglomerate on SBA-15 and was highly dispersed at this time. When the Ni content was 15%, weak diffraction peaks at 2θ angles of 41°, 44.7°, 47.2° and 54° indicated the formation of Ni2P crystalline phases on the mesoporous molecular sieve SBA-15. The enhanced intensity of the Ni2P characteristic diffraction peaks with the increase of Ni2P loading, and the highest intensity when the loading amount reached 40%, suggest that Ni2P particles started to agglomerate on the surface of SBA-15, which is consistent with existing studies. This clustering effect could hinder the active sites needed for catalysis, potentially compromising the catalyst’s efficiency.
3.2. Analysis of Carrier and Catalyst Pore Structure
The pore size distributions of the SBA-15 carrier and Ni2P/SBA-15 catalysts with different Ni contents are shown in Figure 3, and their surface structure parameters are shown in Table 2. This study prepared an SBA-15 carrier with a specific surface area measuring 715 m²/g, a pore volume of 1.16 cm³/g, and a pore diameter of 6.8 nm; with the increase of the stretcher amount, the stretcher component entered into the pore of the carrier SBA-15, and the rise in loading amount caused the specific surface area and pore diameter of the catalyst to decrease progressively. When the Ni content reached 40%, these values dropped to 167 m²/g for specific surface area, 0.33 cm³/g for pore volume, and 4.9 nm for pore diameter. The trends of the pore structure of the catalysts were consistent with the results of the previous XRD characterization.
3.3. Study of the Denitrogenation Reaction of Quinoline
3.3.1. Hydrogenation Pathway of Quinoline
As shown in Figure 4, the generic HDN reaction pathway of quinoline, the main intermediates in the catalytic hydrogenation of quinoline are THQ1, 5,6,7,8-tetrahydroquinoline (THQ5), OPA and decahydroquinoline (DHQ). There are two routes for the removal of nitrogen atoms from quinoline: one is via OPA and the other is via DHQ [16], and the selectivity of the reaction routes varies considerably with different catalysts. The bond energies of the C=N double bonds are much larger than those of the C-N bonds (615 KJ/mol for C=N double bonds, 305 KJ/mol for C-N bonds), and the nitride removal requires a hydrogen saturation reaction of the unsaturated bond before C-N bond cleavage can occur. Satterfield et al. [17] concluded that quinoline and THQ1 can easily reach thermodynamic equilibrium under certain reaction conditions, and that quinoline is essentially converted to THQ1.
3.3.2. Effect of Different Temperatures on Conversion and Denitrogenation Rates
The role of temperature in quinoline hydrogenation conversion, under different catalyst conditions, is shown in Figure 5a. The conversion of quinoline during hydrogenation was strongly influenced by temperature. Increasing the reaction temperature from 280 °C to 340 °C led to a substantial rise in quinoline conversion under all tested catalyst conditions. At 340 °C, all the quinoline conversions were above 93%. It can also be seen from Figure 4a that the Ni2P catalyst has a better low-temperature hydrogenation performance compared to the commercial catalyst FT1 in the sulphide state, and the higher the Ni content, the easier the reaction is at low temperatures, but in terms of final conversion, the phosphide catalysts have no advantage over the commercial catalyst FT1.
The effect of Ni loading on the catalytic activity was also very significant, and the conversion of nitride quinolines increased with the increasing of Ni loading at 280-340 °C. This is due to the fact that the number of active metal centres that can contact with the quinoline hydrotreating reactants increases with the increase in Ni2P loading. However, increasing the temperature to 360 °C and the loading level up to 40% did not significantly improve the conversion, and even tended to decrease it, because too much loading will block the active pores and reduces t the catalyst’s specific surface area, which has a negative effect on the catalytic activity. Additionally, raising the temperature to 360 °C affected the conversion of quinoline to tetrahydroquinoline due to its exothermic nature. The higher temperature accelerated the reverse reaction rate of tetrahydroquinoline hydrogenation, shifting the equilibrium away from complete conversion and thus negatively impacting quinoline conversion.
As shown in Figure 5b, the relationship between temperature and the hydrodenitrogen removal rate of quinoline is presented for various catalyst conditions. A comparison between Figure 5a and Figure 5b shows that the denitrogenation rate tends to align with the conversion rate as temperature goes up, and the phosphide catalyst has higher denitrogenation rate relative to the sulfide catalyst FT1 under different temperature conditions, and the denitrogenation rate is more than 92% at 320°C, which is much higher than that of the sulfide catalyst.
3.3.3. Selectivity Study of Quinoline Hydrogenation Products
The distribution of quinoline hydrodenitrogenation products with reaction temperature under phosphide catalyst and sulphide state commercial catalyst conditions is shown in Figure 6. From the distribution, the intermediate products were the same under both catalyst conditions: THQ1, THQ5, DHQ, OPA and the final products, PB and PCH, propylcyclohexylamine (PCHA) and propylcyclohexene (PCHE) were not detected in the product assay, which also indicates that the It also indicates that the corresponding hydrogenation and ring-opening reactions can be carried out easily under these conditions. The nitrogen removal rates of both catalysts were very low at low temperatures, and the main product was saturated DHQ on the nickel phosphide catalyst, while a large amount of THQ1 was still present on the commercial catalyst FT1 in the sulphide state, which suggests that the hydrogenation capacity of the nickel phosphide catalyst is much higher than that of the sulphide state catalysts at this temperature, and this is one of the reasons for the higher denitrification activity of the nickel phosphide catalysts. Satterfield [17] demonstrated that the quinoline addition and ring opening reaction of quinolines on the sulphide catalysts was not detected in the product assay, which also suggests that the corresponding hydrogenation reaction can be carried out easily under this condition. Satterfield [17] showed that the hydrogenation and denitrogenation of quinoline on sulphide catalysts was mainly carried out through two pathways, OPA and DHQ, with the OPA pathway accounting for about 40% of the total; Perot G et al. [18] showed that the OPA route was significantly inhibited in the presence of quinoline-type molecules (Q, THQ, DHQ) due to the competition for adsorption, which resulted in a slower rate of the reaction of this route. In contrast, the phosphide catalyst condition can hydrogenate and saturate more THQ1 to DHQ (71.4% of intermediate products at 280 °C) than the sulfide catalyst condition, which makes the HDN reaction of quinoline mainly through the pathway of DHQ, and reduces the ratio of THQ1 to OPA, thus indirectly avoiding the reaction inhibition problem of the OPA route, and increasing the denitration reactivity of quinoline which accelerated the reaction.
As shown in Figure 6b, we can also see that the content of OPA has been less during the warming process, and it can be accurately deduced that the rapid increase of PCH is not from OPA. In addition, comparing the trends of DHQ and PCH, they are in the opposite state, and from the change curve of the denitrogenation rate, the change curve of the mole fraction of PCH is very similar, which also indicates that the HDN reaction of quinoline under the conditions of the phosphine catalyst is mainly along the Q-DHN route, which is the main direction of the reaction. It can also indicate that the HDN reaction of quinoline under the phosphide catalyst is mainly along the pathway of Q-DHQ-PCHA-PCH. Since PCHA is very easy to remove the amino group, the hydrogenolysis of C-N in DHQ is the controlling step of the total HDN reaction rate.At the reaction temperature of 360 °C, the final quinoline HDN products were mainly PB and PCH, with 50.4% of PB and 31.6% of PCH under commercial catalysts in the sulphide state, and 91.6% of saturated PCH and only 4.9% of PB under nickel phosphide catalysts.
4. Conclusions
Phosphide catalysts with a Ni/P ratio of 2 were prepared and characterized using SBA-15 as the carrier. The results indicated that the active phase of the catalysts was mainly Ni2P, and the catalysts with different loadings maintained mesoporous structures, though the order of the mesoporous structures decreased with the gradual increase in loading. Additionally, as the loading increased, there was a steady decline in the specific surface area, pore volume, and pore diameter of the samples. The results of activity evaluation showed that the nickel phosphide catalyst had a higher hydrogenation capacity than that of the sulfide state catalyst, which could preferentially hydrogenate and saturate most of the quinolines into decahydroquinolines, and reduce the ratio of THQ1 to OPA, thus indirectly avoiding the problem of reactivity inhibition due to the existence of competing adsorption in the OPA route, and thus improving the denitrogenation reactivity of quinolines and accelerating the reaction. The final hydrodenitrogenation product of quinoline under nickel phosphide conditions was mainly saturated propylcyclohexane, accounting for 91.6%, and propylbenzene only accounted for 4.9%.
Author Contributions
Yuan Qiao: Writing-original draft, Visualization, Investigation, Data curation, Chunming Xu: Data curation, Writing-original draft. Zhao Lv: Supervision, Resources, Project administration. Yuan Zhao: Supervision, Resources. Peng Huang: Methodology, Project administration, Supervision, Funding acquisition.
Funding
This research was funded by National Key Research and Development Program Project 2022YFB4101300.
Data Availability Statement
The data presented in this study are available upon request from the corresponding authors.
Conflicts of Interest
The authors declare no conflicts of interest.
References
- Murti S D S, Sakanishi K, Okuma O. Detailed characterization of heteroatom-containing molecules in light distillates derived from Tanito Harum coal and its hydrotreated oil. Fuel 2002, 81, 2241–2248. [Google Scholar] [CrossRef]
- Murti S D S, Choi K H, Sakanishi K, Okuma O, Korai Y, Mochida I. Analysis and removal of heteroatom containing species in coal liquid distillate over NiMo catalysts. Fuel 2005, 84, 135–142. [Google Scholar] [CrossRef]
- Wei Y, Liu D S, Yang P, et al. Removal of Basic Nitrogen of Diesel Oil by Chemical Method. Journal of Fushun Petroleum Institute 2002, 22, 1–4. [Google Scholar]
- Xiang C, Chai Y, Liu Y; et al. Mutual Influence of Hydrodesulfurization of Dibenzothiophene and Hydrodenitrogenation of Quinoline over NiMoS/γ-Al2O3 Catalyst. Chinese Journal of Catalysis 2008, 24, 151–157. [Google Scholar]
- Qing-Jie L I, Zhao Z F, Feng-Yan L I; et al. Study on the preparation of γ-alumina-supported molybdenum phosphide hydrofining catalysts. Journal of Fuel Chemistry and Technology 2006, 34, 126–128. [Google Scholar]
- Oyama S, T. Novel catalysts for advanced hydroprocessing: Transition metal phosphides. J. Catal. 2003, 216, 343–352. [Google Scholar] [CrossRef]
- Sun F, X. Advance in the Research on Hydrodesulfurization and Hydrodenitrogenation on Transition Metal Phosphides[J]. Acta Petrolei Sinica 2005, 21, 1–11. [Google Scholar]
- Liu L H, Liu S Q, Chai Y M, et al. Preparation mechanism and hydrodenitrogenation performance of nickel phosphide catalyst. Journal of Fuel Chemistry and Technology 2013, 41, 335–340. [Google Scholar]
- Robinson W R A M, Van Gestel J N M, Koranyi T I. Phosphorus promotion of Ni (Co)-containing Mo-free catalysts in quinoline hydrodenitrogenation. J. Catal. 1996, 161, 539–550. [Google Scholar] [CrossRef]
- Li W, Dhandapani B, Oyama S T. Molybdenum phosphide: A novel catalyst for Hydrodenitrogenation. Chem. Lett. 1998, 27, 207–208. [Google Scholar] [CrossRef]
- Stinner C, Prins R, Weber T. Formation, structure, and HDN activity of unsupported molybdenum phosphides. J. Catal. 2000, 191, 438–444. [Google Scholar] [CrossRef]
- Zhai Q, Cai J, Hui Y U; et al. SYNTHESIS OF SBA-15 MOLECULAR SIEVE[J]. Journal of the Chinese Ceramic Society 2006, 34, 385–388. [Google Scholar]
- Zheng X C, Yuan C Y, Zhao W P; et al. Synthesis and Characterization of Mesoporous Molecular Sieves SBA-15[J]. Journal of Zhengzhou University 2008, 40, 101–106. [Google Scholar]
- Oyama S T, Wang X, Lee Y-K, Bando K, Requejo F G. Effect of phosphorus content in nickel phosphide catalysts studied by XAFS and other techniques. J. Catal. 2002, 210, 207–217. [Google Scholar] [CrossRef]
- Korányi T I, Vít Z, Poduval D G. SBA-15-supported nickel phosphide hydrotreating catalysts. J. Catal. 2008, 253, 119–131. [Google Scholar] [CrossRef]
- Massoth F E, Kim S C. Kinetics of the HDN of quinoline under vapor-phase conditions. Industrial & engineering chemistry research 2003, 42, 1011–1022. [Google Scholar]
- Satterfield C N, Cocchetto J F. Reaction network and kinetics of the vapor-phase catalytic hydrodenitrogenation of quinoline. Industrial & Engineering Chemistry Process Design and Development 1981, 20, 53–62. [Google Scholar]
- Perot G, Brunet S, Canaff C; et al. Transformation of Quinolines and Anilines Over NiMo-Al2O3 Catalysts. Bulletin des Sociétés Chimiques Belges 1987, 96, 865–870. [Google Scholar] [CrossRef]
Figure 1.
Flow chart of 10mL fixed bed.
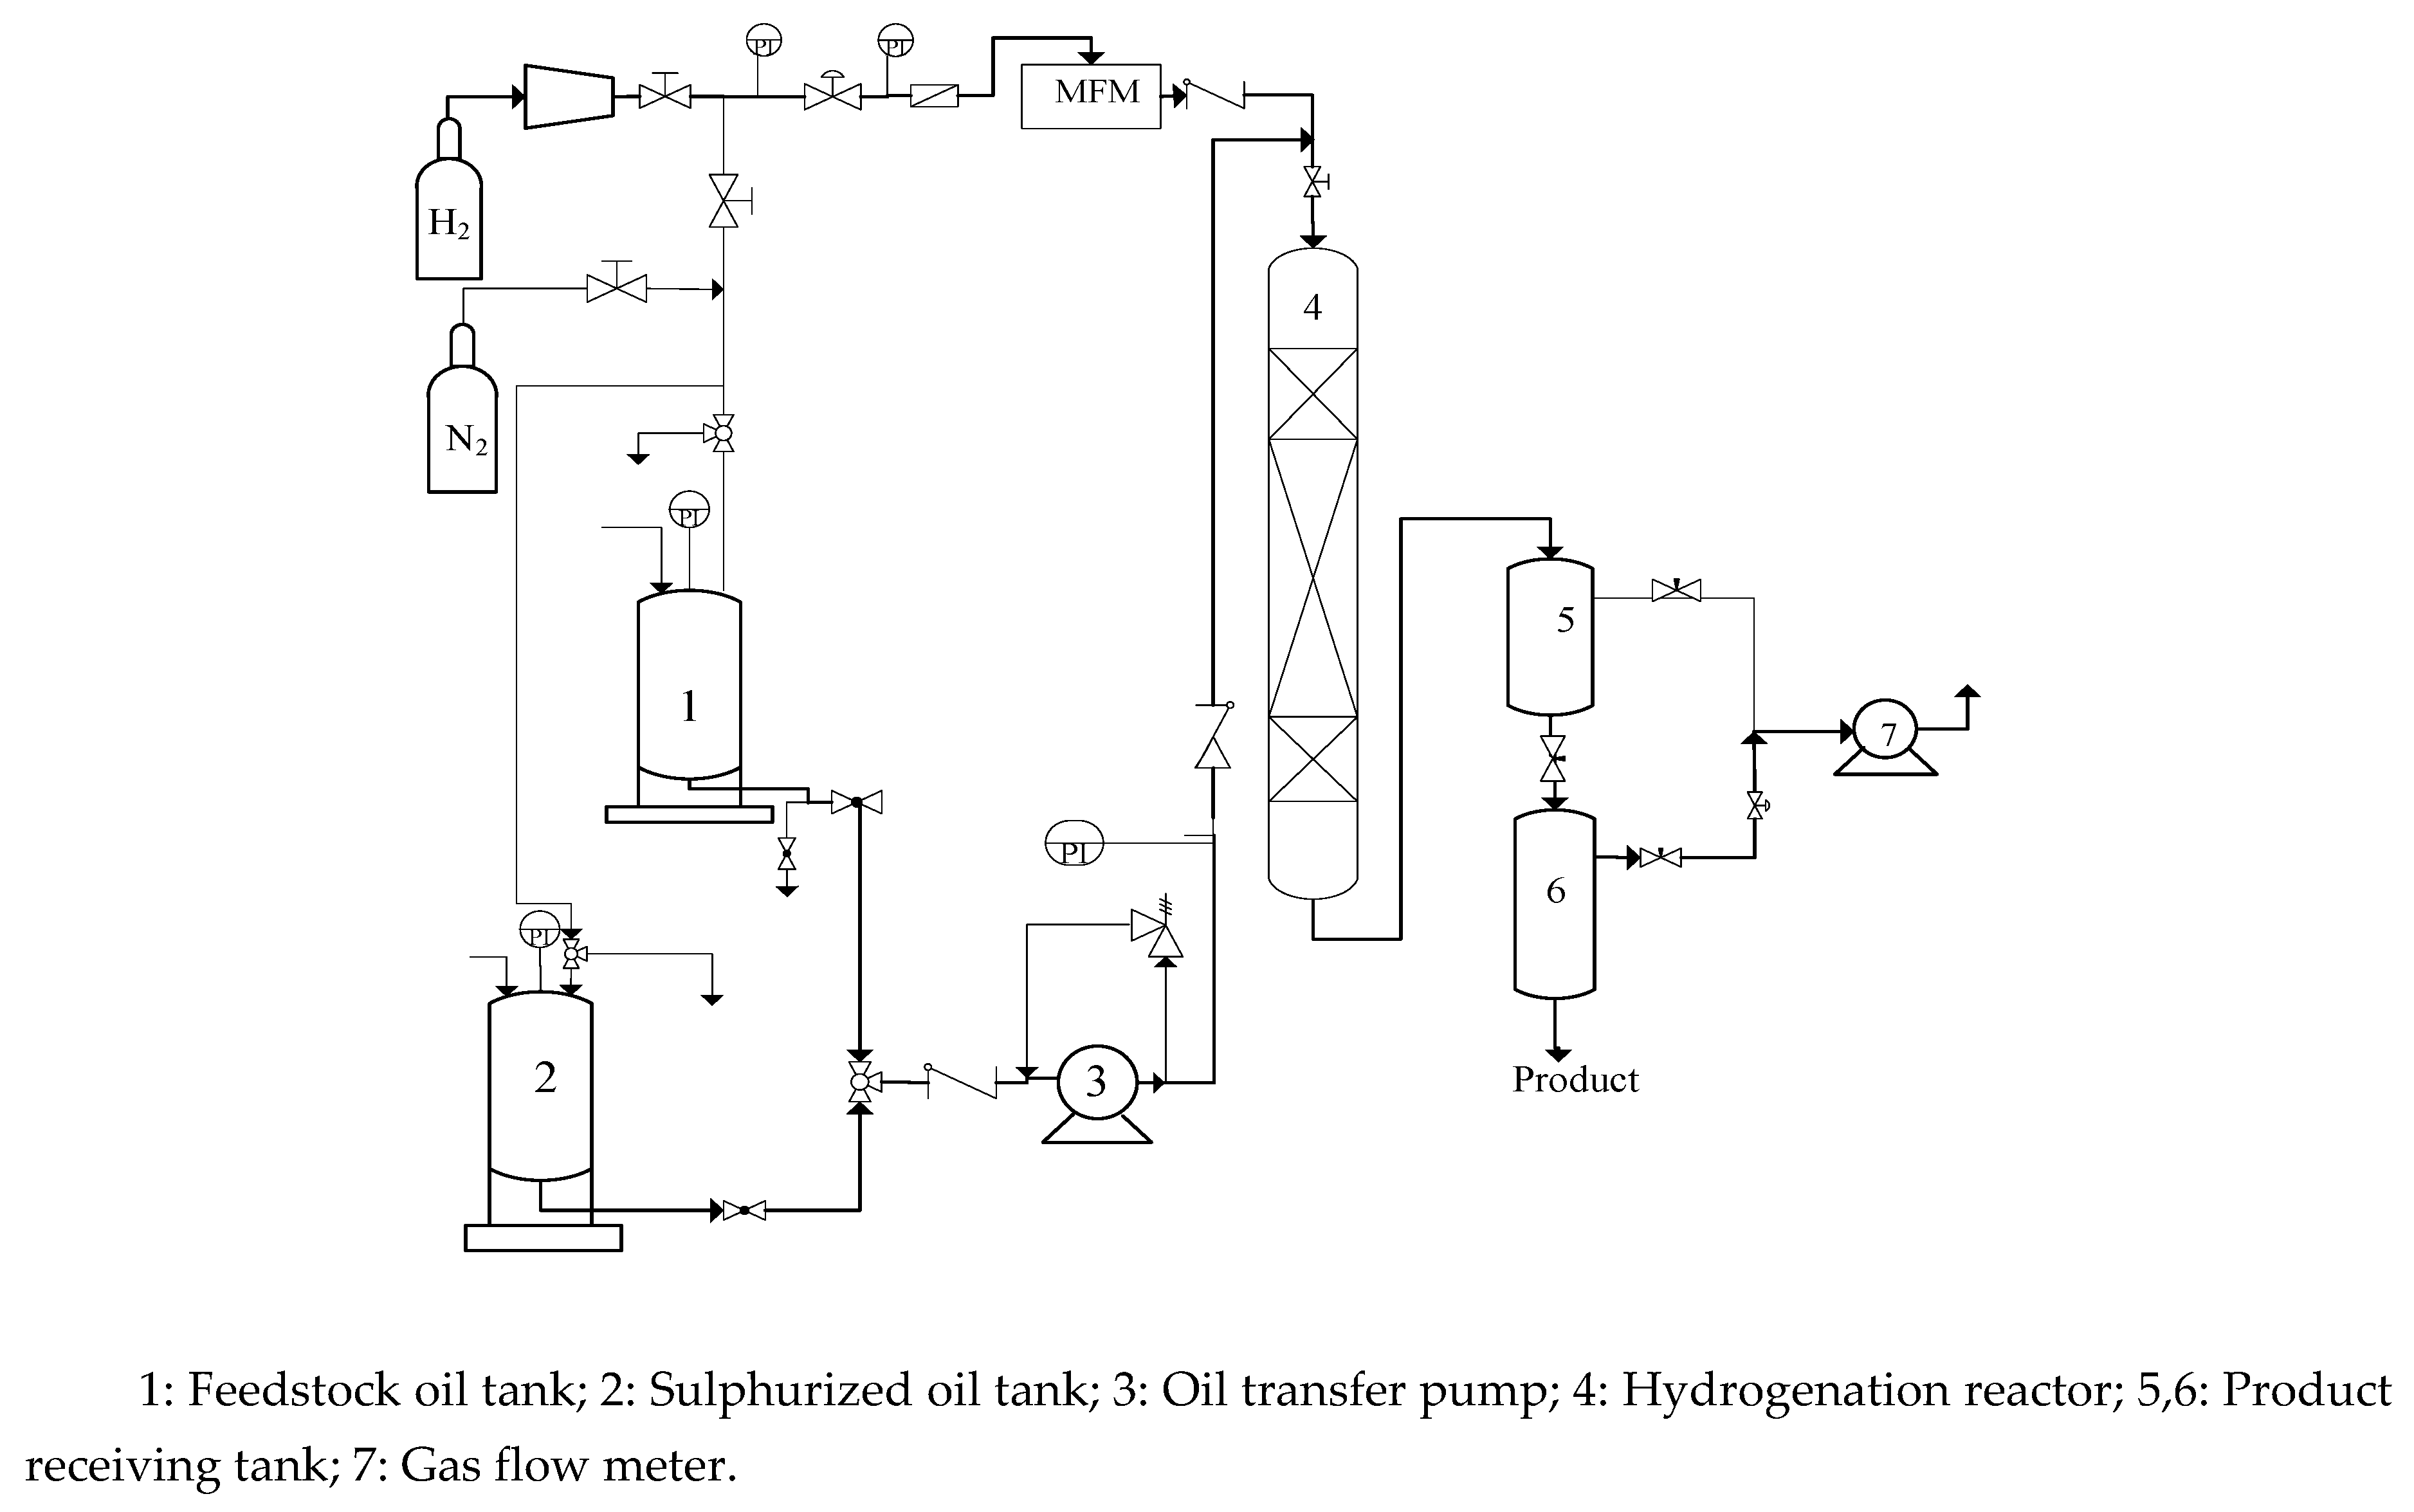
Figure 2.
(a) Low-angle XRD patterns and (b) High-angle XRD patterns of catalysts with different Ni contents.
Figure 2.
(a) Low-angle XRD patterns and (b) High-angle XRD patterns of catalysts with different Ni contents.
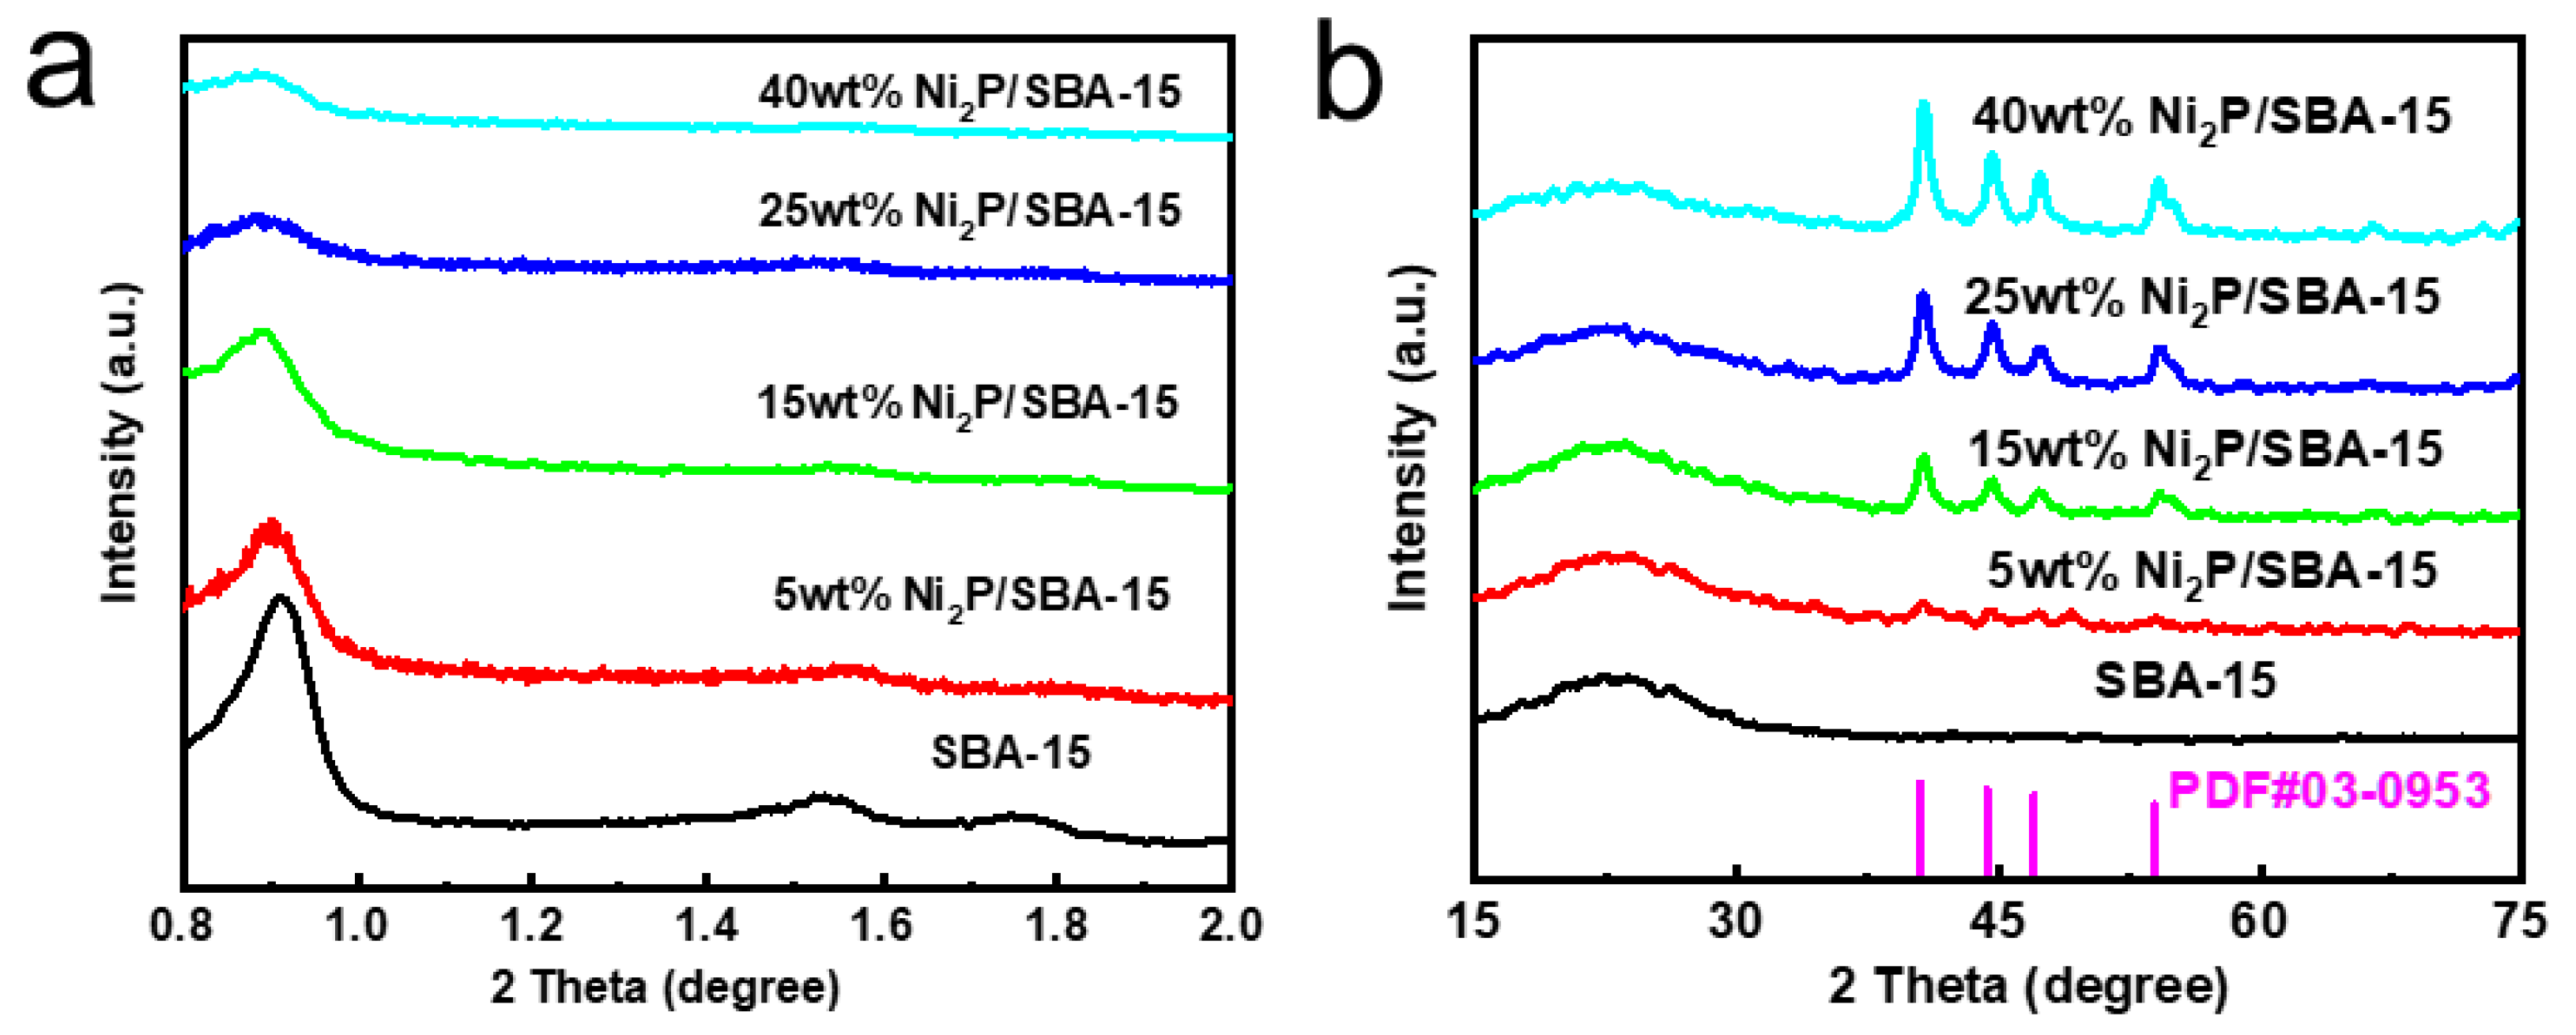
Figure 3.
Pore size distributions of catalysts with different Ni contents.
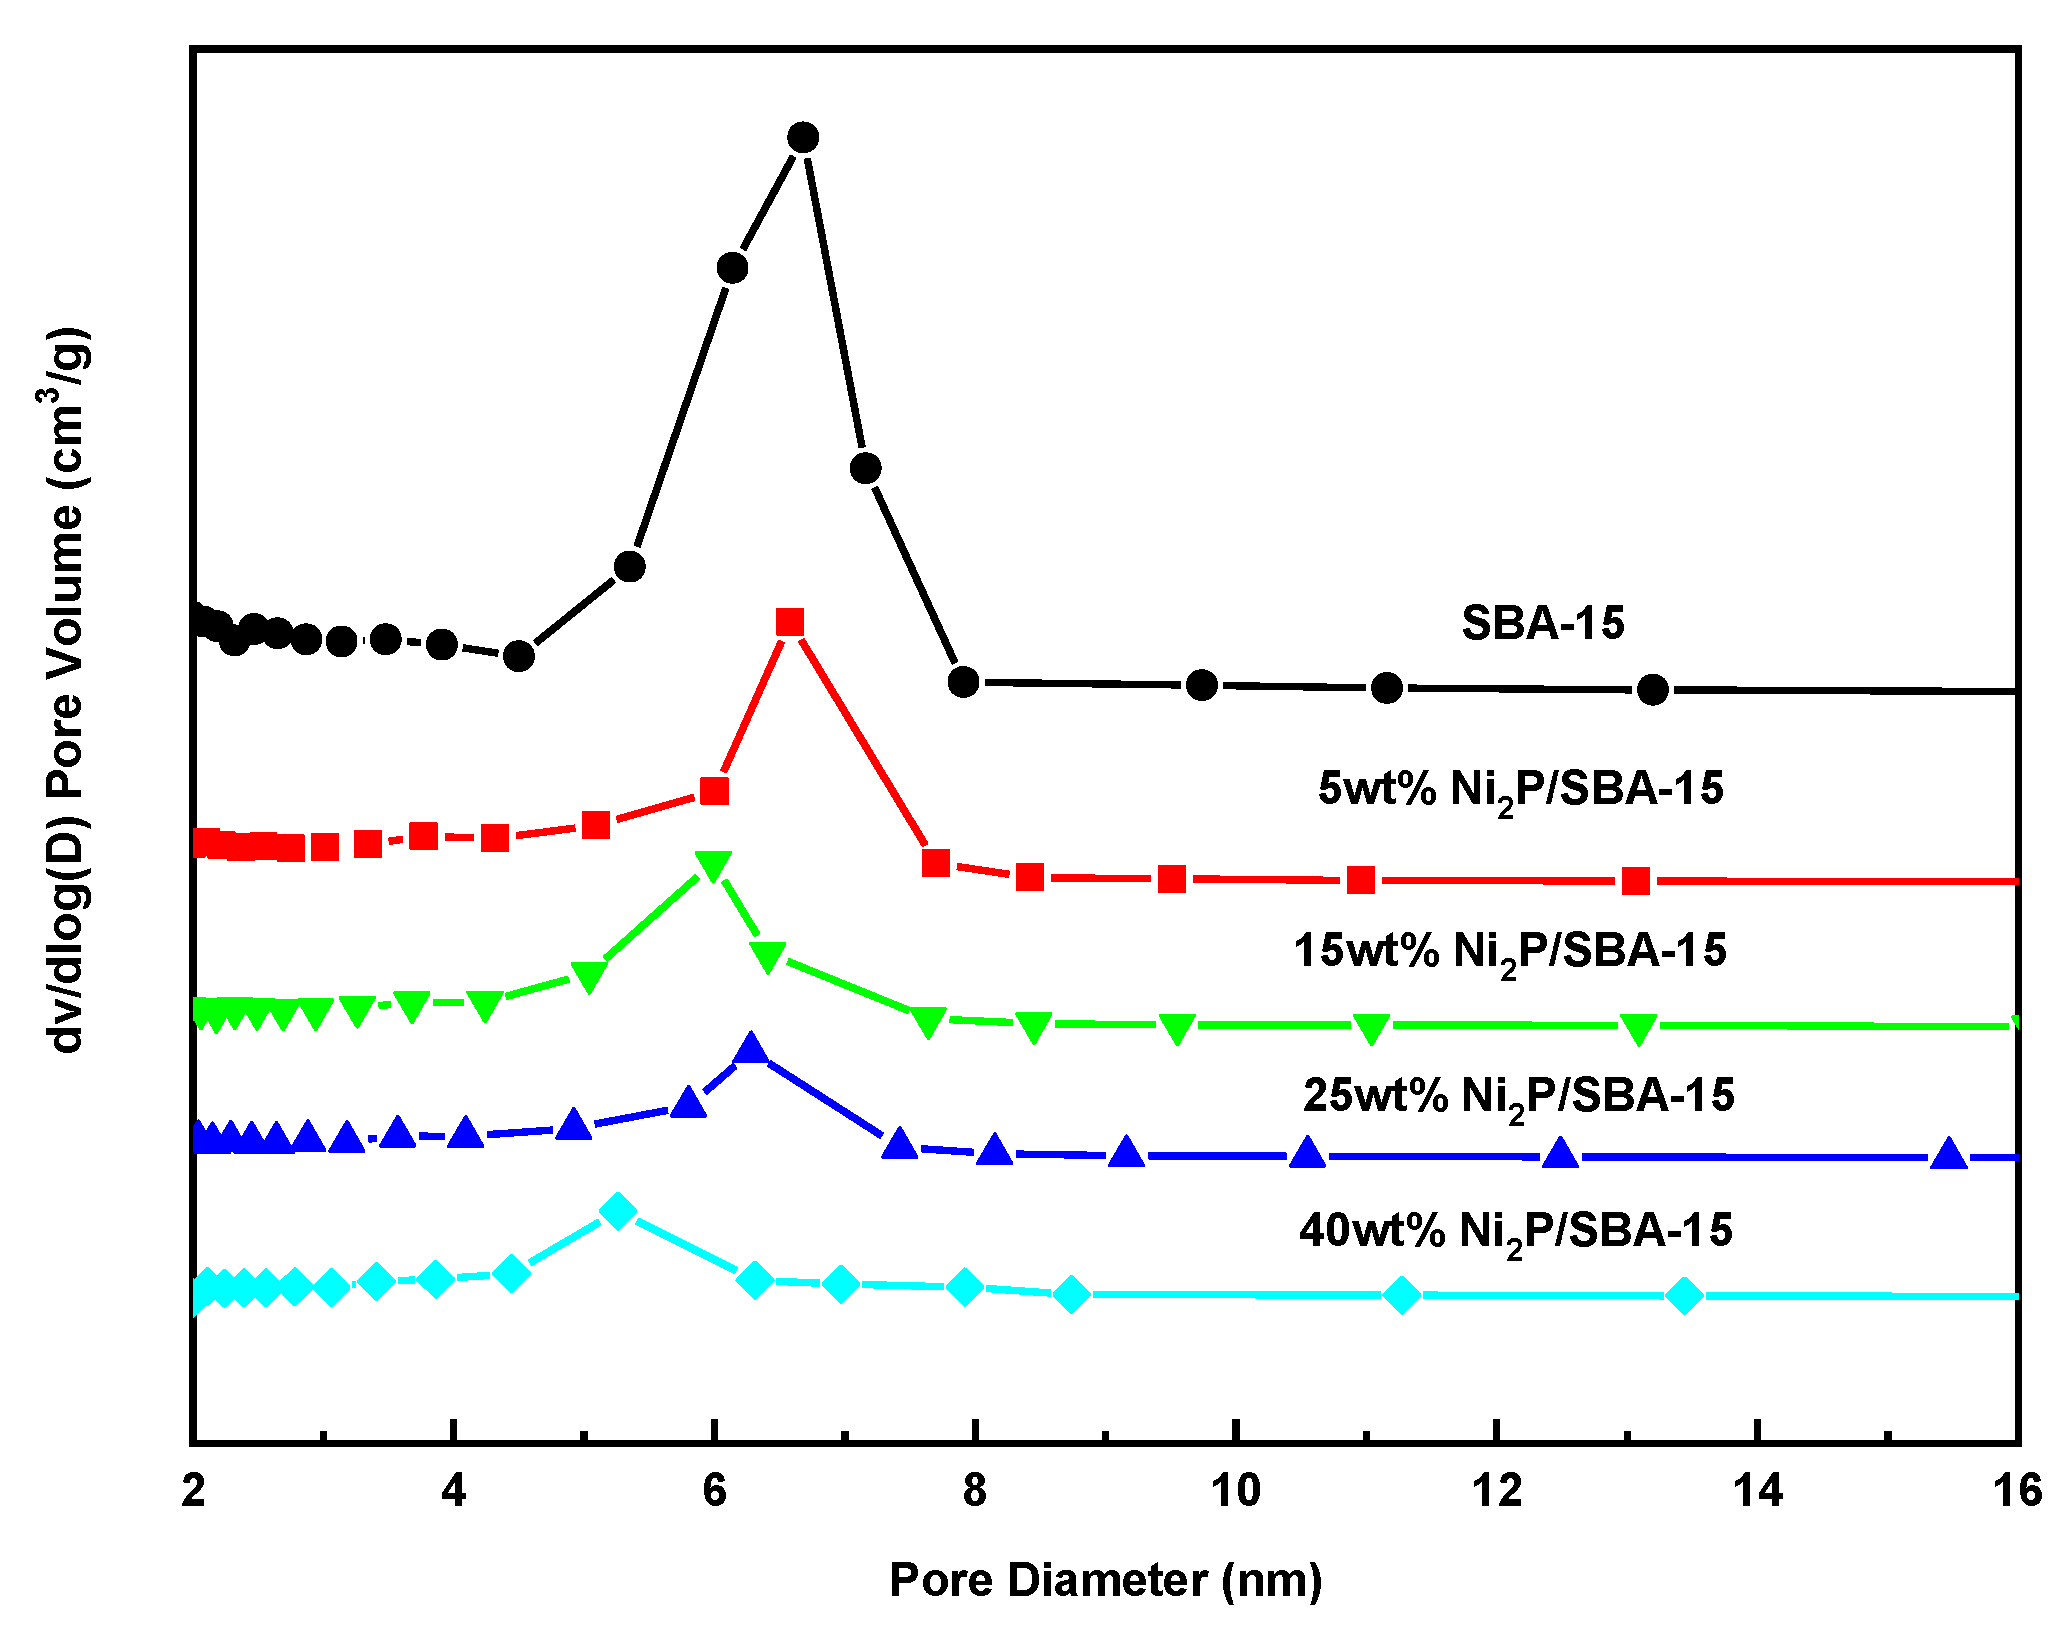
Figure 4.
Reaction network of quinoline HDN.
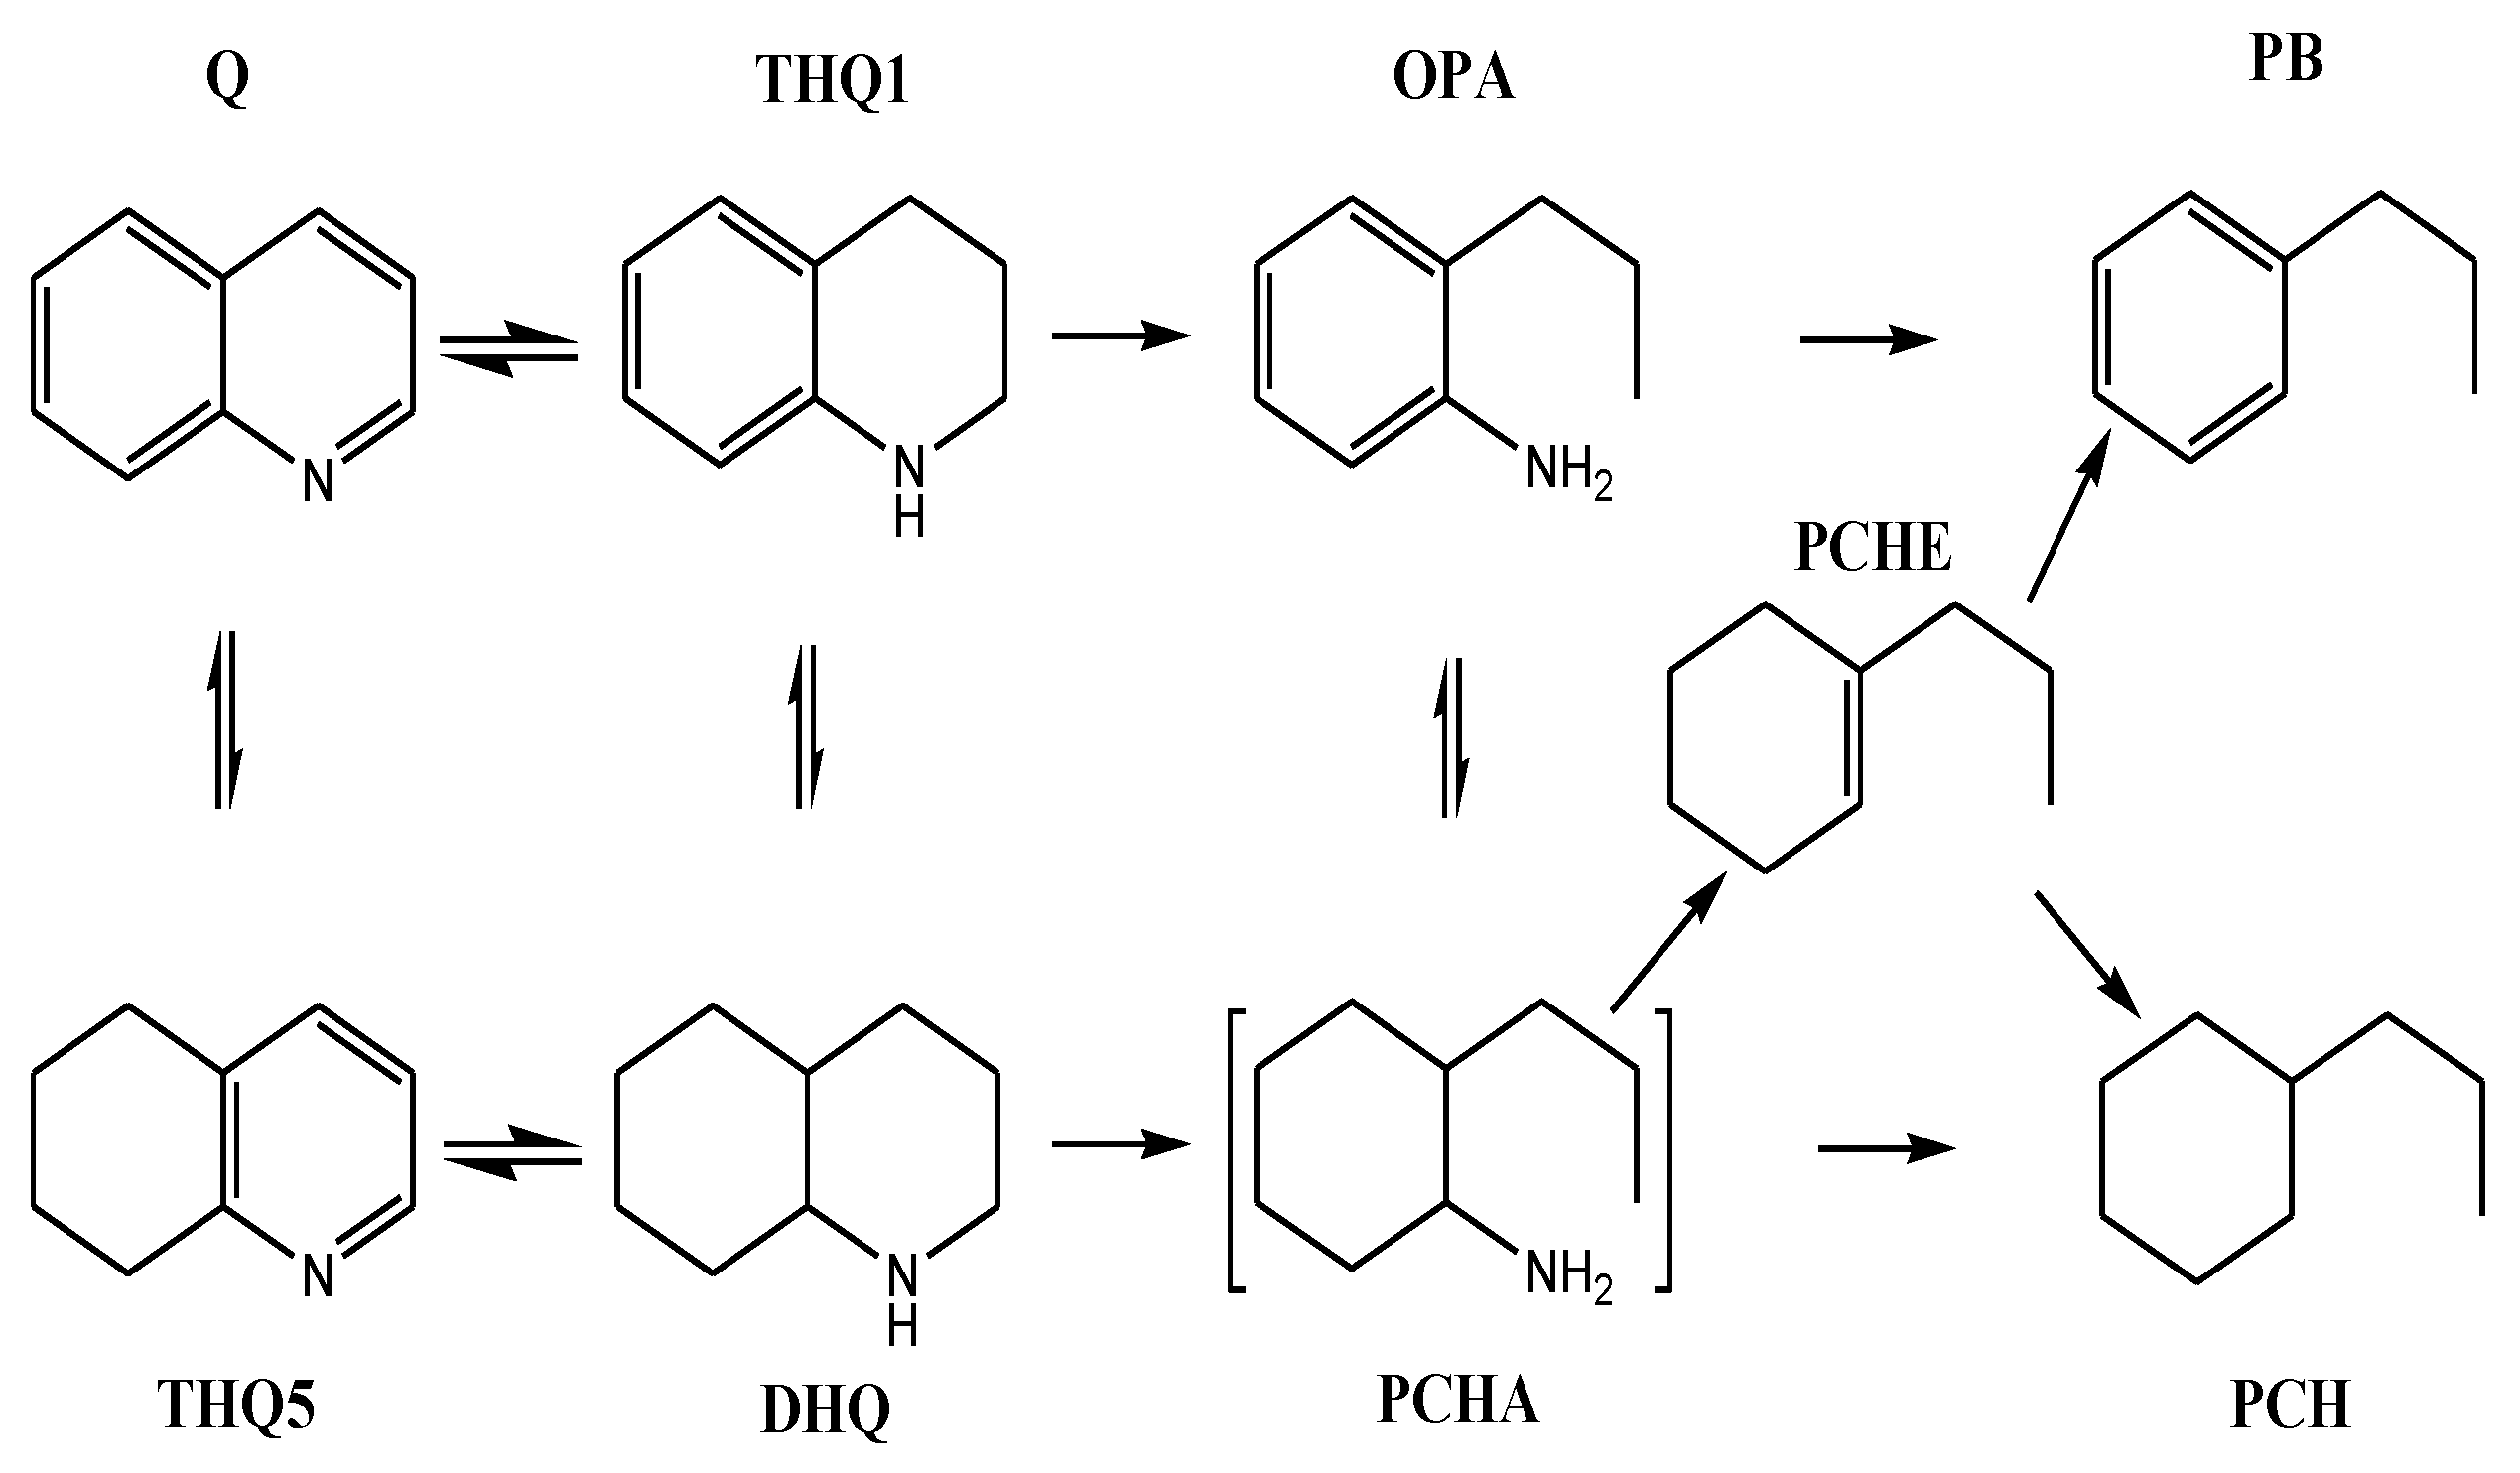
Figure 5.
(a) Influence on quinoline conversion with different;(b) Influence on quinoline denitrogenation with different catalyst.
Figure 5.
(a) Influence on quinoline conversion with different;(b) Influence on quinoline denitrogenation with different catalyst.
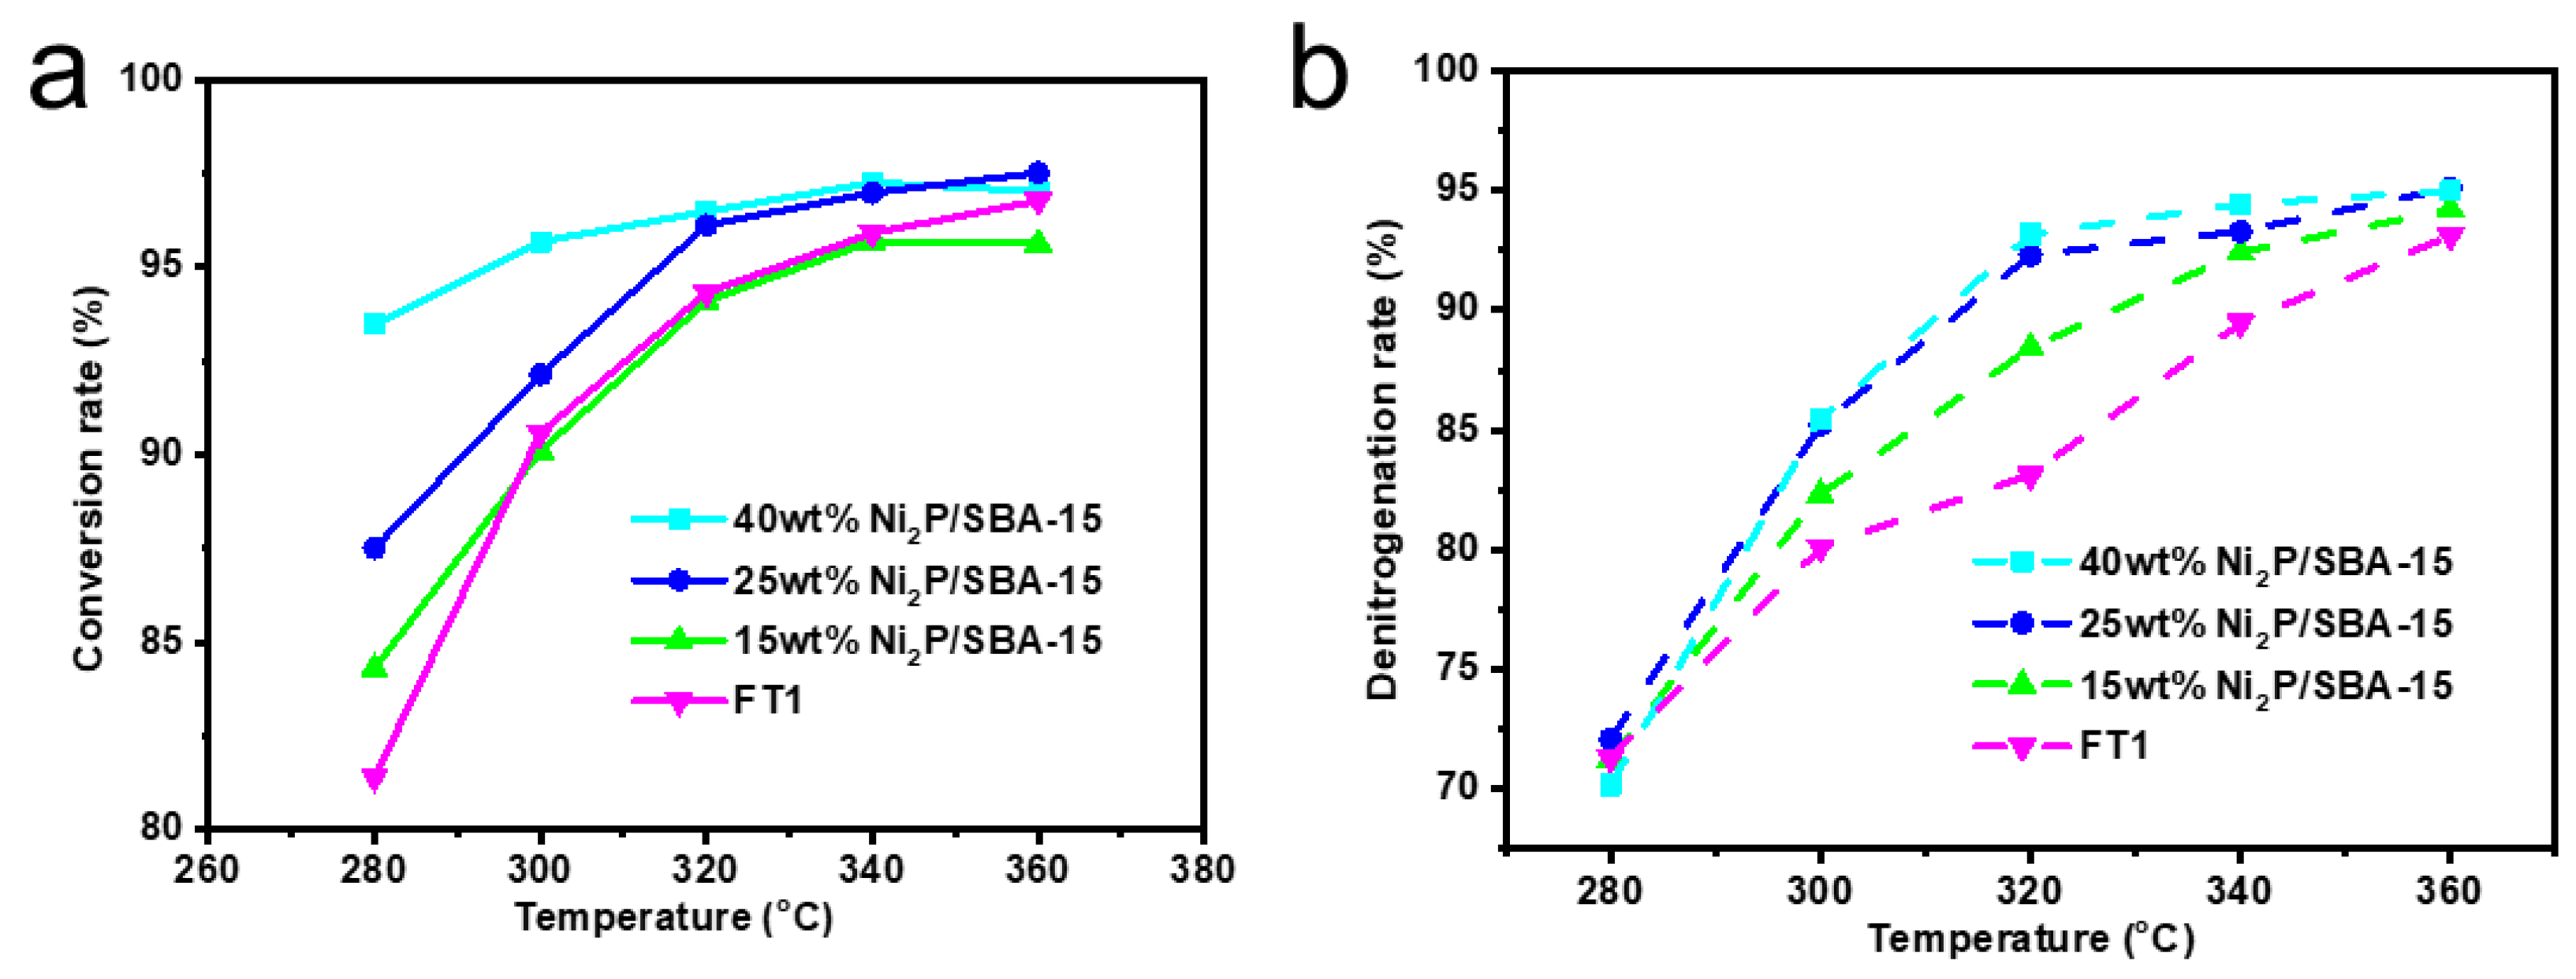
Figure 6.
The distribution of quinoline hydrodenitrogenation product under different temperature of (a) FT1 and (b) 15%wt%Ni2P/SBA-15.
Figure 6.
The distribution of quinoline hydrodenitrogenation product under different temperature of (a) FT1 and (b) 15%wt%Ni2P/SBA-15.
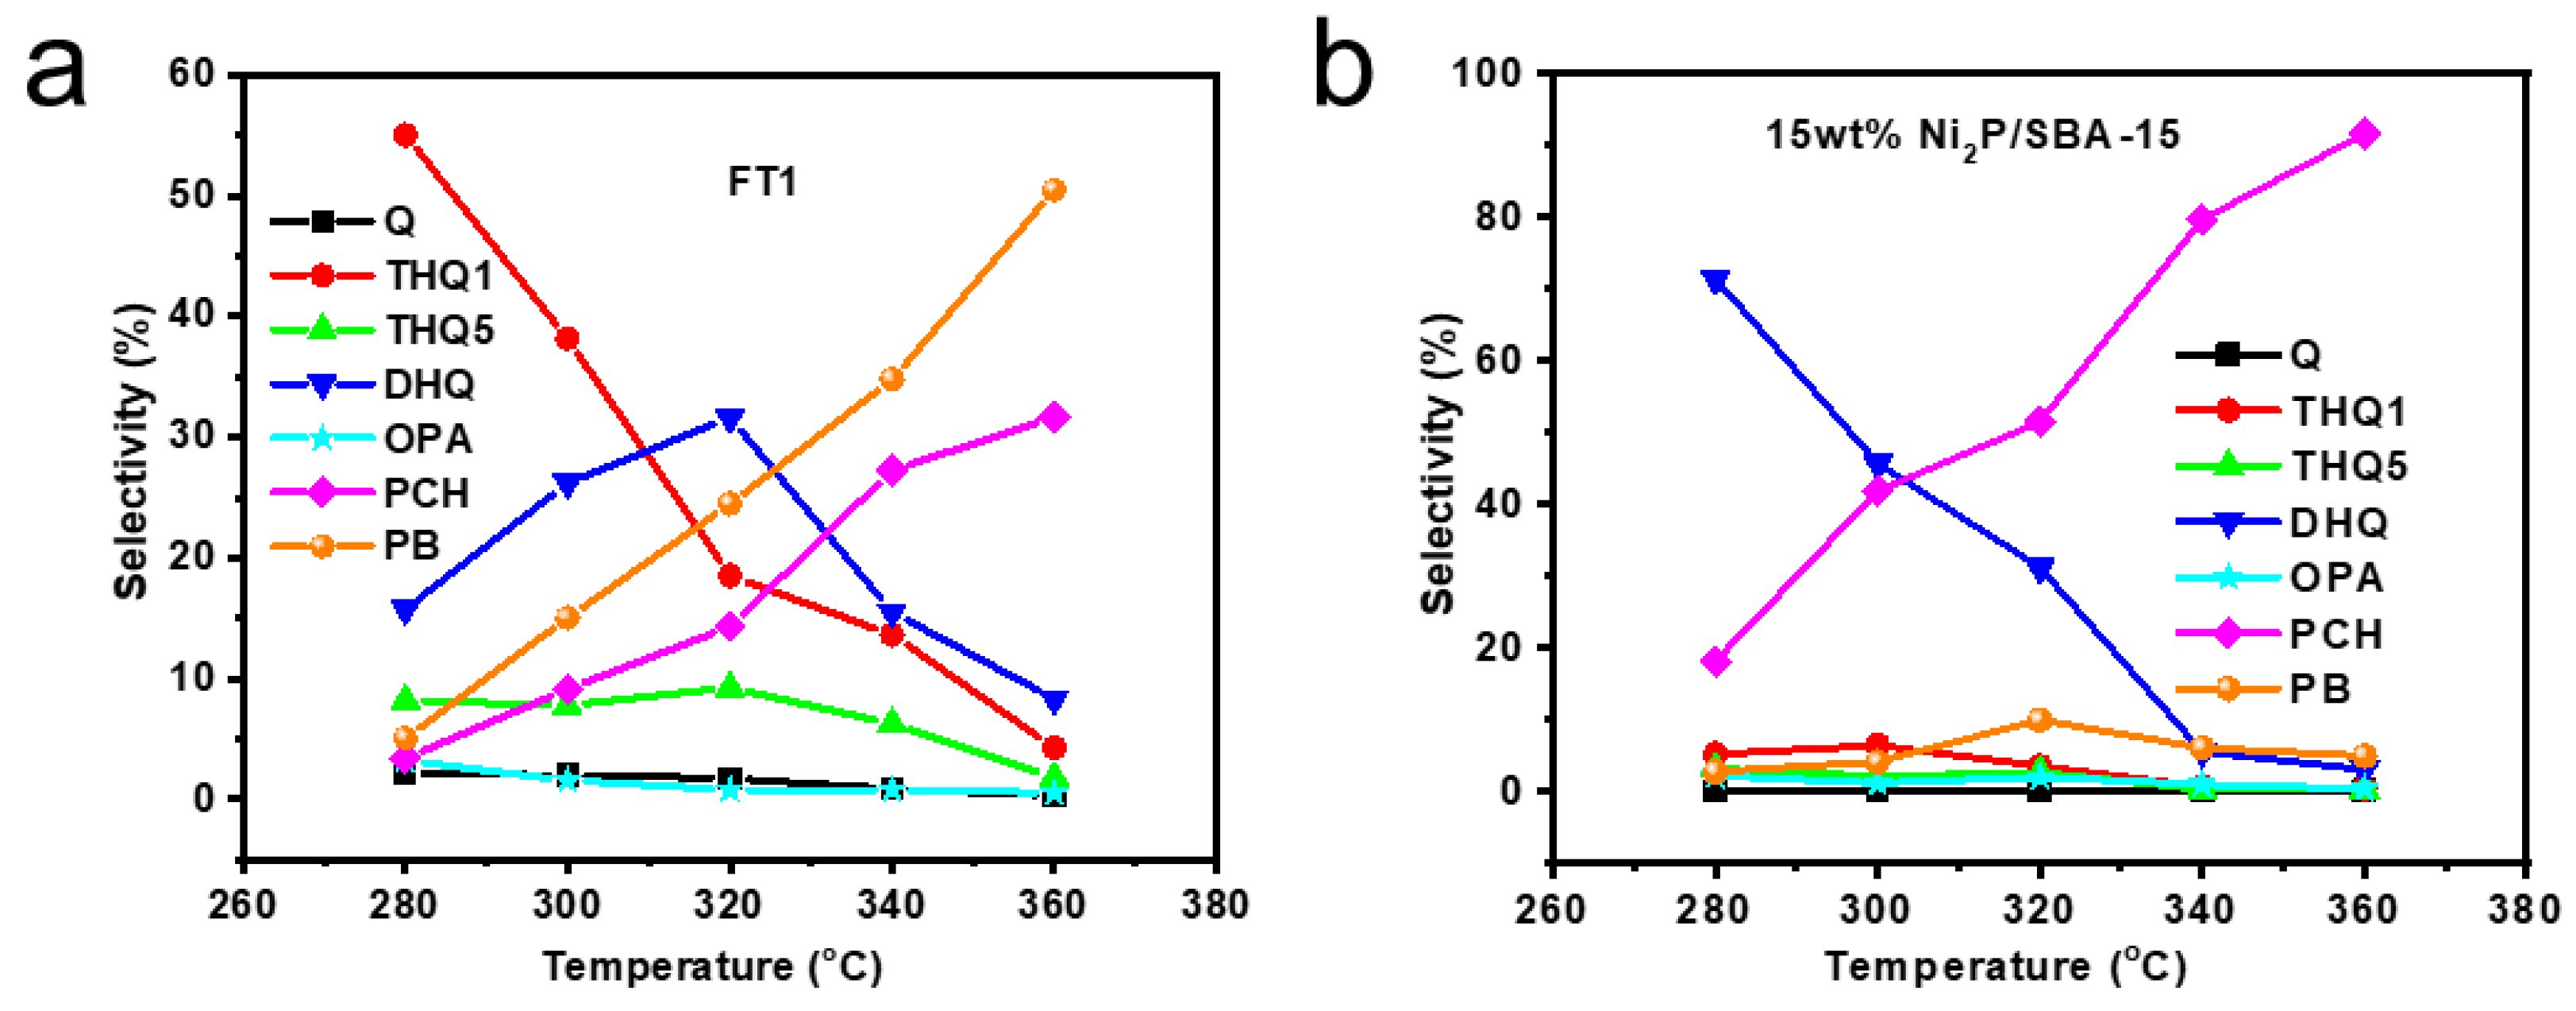

Table 1.
Properties of commercial catalyst.
| pore volume (mL/g) |
Specific surface (m2/g) | Average pore size (nm) |
intensity (N/cm) |
Effective Component/(wt/%) | |||
|---|---|---|---|---|---|---|---|
| WO3 | MoO3 | NiO | P | ||||
| ≮0.25 | ≮150 | 8.13 | ≮182 | ≮24.0 | ≮2.4 | ≮2.5 | 0.3-1.7 |
Table 2.
Physico-chemical properties of catalysts with different Ni contents.
| Catalyst | Ni (wt%) | Specific surface (m2 g-1) |
pore volume (cm3 g-1) |
pore size (nm) |
|---|---|---|---|---|
| SBA-15 | — | 715 | 1.16 | 6.8 |
| Ni2P/SBA-15 | 5 | 431 | 0.65 | 6.3 |
| 15 | 342 | 0.49 | 5.9 | |
| 25 | 255 | 0.40 | 5.4 | |
| 40 | 167 | 0.33 | 4.9 |
Disclaimer/Publisher’s Note: The statements, opinions and data contained in all publications are solely those of the individual author(s) and contributor(s) and not of MDPI and/or the editor(s). MDPI and/or the editor(s) disclaim responsibility for any injury to people or property resulting from any ideas, methods, instructions or products referred to in the content. |
© 2025 by the authors. Licensee MDPI, Basel, Switzerland. This article is an open access article distributed under the terms and conditions of the Creative Commons Attribution (CC BY) license (http://creativecommons.org/licenses/by/4.0/).
Copyright: This open access article is published under a Creative Commons CC BY 4.0 license, which permit the free download, distribution, and reuse, provided that the author and preprint are cited in any reuse.


