
Submitted:
27 March 2025
Posted:
27 March 2025
You are already at the latest version
Abstract
In the complex landscape of research, we often encounter challenges that require innovative solutions. One such challenge is dealing with multiple instruments that use different Likert scale points. Our recent study involved five instruments with varying scales: three 5-point, one 4-point, and one 7-point. Additionally, our data contained outliers that represented a positive and negative skew. These factors could significantly impact the validity of our results if not addressed properly in the preprocessing stage and prior to data analysis.
Keywords:
likert scale standardization
; data transformation in research
; ranked-based normalized Z-score
; survey data preprocessing
; quantitative research methodology
; multivariate statistical analysis
; scale bias and data consistency
; outlier management in surveys
; normalization and standardization techniques
; regression analysis with ordinal data
The Challenge of Inconsistent Scales
Multiple instruments with different Likert scales can lead to inconsistent data interpretation and analysis, introducing scale bias and potentially skewing results with inaccurate conclusions.
Standardization: A Necessary Step
To address this challenge in our quantitative study, we needed to transform all five instruments into a common scale. This standardization process is crucial for ensuring comparability across instruments and mitigating the effects of scale bias.
Finding the Right Transformation
After trial and error with various transformation techniques, we identified the Ranked-Based Normalized Z-Score Transformation (NST) as the most suitable for our specific dataset (Soloman & Sawilowsky, 2009). However, this conclusion followed a rigorous evaluation of several alternative techniques, each of which presented inherent limitations, including:
-
Z-score Standardization:
- ○
- While commonly used, this method proved sensitive to outliers and skewness in our data.
- ○
- It did not effectively address the non-normal distribution of our Likert scale responses.
-
Log Transformation:
- ○
- We encountered issues with undefined values for data points that were zero or negative. Note that some scale instructions from the author of the instrument could result in such values.
- ○
- This was particularly problematic for our 4-point and 5-point scales, where lower scores were common.
-
Square Root Transformation (SRT):
- ○
- Unlike log transformation, SRT can accommodate zero values but not negative ones.
- ○
- It also did not sufficiently address the skewness in our higher-point scales.
-
Power Transformation:
- ○
- This method exaggerated the differences between high and low scores.
- ○
- It did not effectively normalize our data and made interpreting results more challenging.
-
Box-Cox Transformation:
- ○
- We encountered convergence issues for some datasets.
- ○
- The method requires strictly positive data, incompatible with our centered Likert scales.
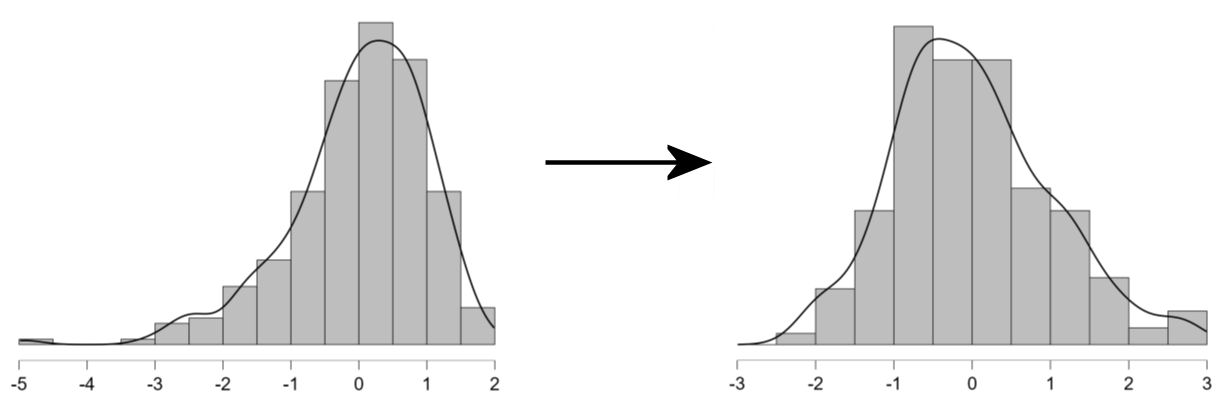
The Solution
Through exploration of various transformation techniques, we found that the Ranked-Based Normalized Z-Score Transformation (NST) was particularly effective for our dataset. While it did not completely normalize our data, as some skewness remained, it provided the best transformation compared to other techniques tried. The NST was more robust against outliers and produced more consistent results across different instruments, offering a better foundation for our subsequent analyses. This method distinguished itself by enhancing the reliability of our analyses and highlighting the necessity of selecting appropriate transformations tailored to specific research contexts (Sawilowsky, 2009). Our experience underscores the importance of thoroughly exploring various transformation techniques, when dealing with complex, multi-instrument datasets (EITCA, 2023). Each research context may require a unique approach, and what works for one dataset may not be suitable for another.
NST Is a Process That Involves Several Steps:
1. Ranking all original data points from lowest to highest.
2. Replacing each rank with its corresponding percentile rank.
3. Transforming each percentile rank to a z-score using Φ-1
(i.e., the inverse of the standard normal cumulative distribution function).
4. Replacing the original value with z-score.
This process effectively spreads out the original data to follow a standard normal
distribution while maintaining the original order of the data points.
Mathematical Representation
The key mathematical steps in NST are:
1. Calculate percentile rank:
2. Transform to z-score:
Where:
Pi is the percentile rank for the i-th data point
Ri is the rank of the i-th data point
n is the total number of data points
Φ-1 is the inverse of the standard normal cumulative distribution function
(Soloman & Sawilowsky, 2009)
Improved Statistical Properties
By normalizing our data, we converted ordinal scales into continuous scales, making them more suitable for parametric analyses like multivariable linear regression (Galli, 2023), consequently leading to more accurate and meaningful results.
The Importance of Standardization in Our Research
Standardizing our data before analysis proved to be a crucial step in our research process. Standardization not only enhanced the validity of our results but also provided deeper insights into the target population (Galli, 2023). Here is why standardization was essential for our multi-instrument study:
Comparing Apples to Apples
By standardizing our variables, we effectively put all our instruments on the same scale. This allowed us to make fair comparisons between different variables of our study, regardless of whether the original scale was 4-point, 5-point, or 7-point. For instance, we could now analyze the effect of self-directed learning (measured on a 5-point scale) combined with collaborative learning (measured on a 7-point scale) on academic achievement (measured on a 5-point scale).
Uncovering True Relationships
Standardization can also help manage multicollinearity, particularly when examining how multiple factors interact to influence a certain outcome. Reducing multicollinearity can help uncover relationships that might have otherwise been obscured (EITCA, 2023; Galli, 2023). For instance, standardization could potentially reveal how the interaction between self-directed learning and collaborative learning influences academic achievement. It might also help in understanding the complex relationship between student isolation and academic resilience. These intricate interactions and their effects on academic outcomes might be more difficult to detect or accurately measure without proper standardization of the variables.
Interpreting the Strength of Influences
In a regression analysis, for instance, the regression coefficients become more directly comparable, enabling you to rank the relative importance of different factors in your study. This comparability allows for a clearer understanding of which variables have the strongest influence on the outcome of interest, providing valuable insights into the hierarchy of effects within the research context.
Aligning with Industry Standards
Standardizing the data also ensures that the methodology adheres to established best practices in research. This not only enhances the credibility of the study but also allows for easier comparison with previous research in the field. Findings on the relationships between key variables can be readily contextualized within the broader literature when data is standardized.
Conclusion
While the process of standardization is tedious and involves trial and error and experimenting with complex statistical techniques, the real value lies in the accurate and clear picture of the key factors in the study and thus producing more robust results.
A Note of Caution
It is important to acknowledge that standardizing Likert scale instruments can be controversial. Some researchers argue that Likert scales are ordinal data and should be treated as such (Sullivan & Artino, 2013). Others contend that standardization is a useful way for cross-instrument comparisons (Bishop & Herron, 2015). The choice of whether to transform, normalize, or standardize (and in what order) depends on your specific dataset, the requirements of your analysis method, and research goals, often requiring experimentation.
Clarifying Definitions:
Data transformation, standardization, and normalization are related but distinct techniques used in data preprocessing.
Data transformation refers to various techniques used to change the scale, distribution, or nature of data. It can include methods like log transformation, square root transformation, or power transformations. The goal of transformation is often to make the data more suitable for analysis or to meet certain assumptions required by statistical models. Transformation is completed before normalization or standardization in the data preprocessing pipeline. The order can depend on the specific requirements of your analysis and the nature of your data. For example, if you're dealing with outliers, you might apply a transformation to reduce their impact before normalizing the data. In some cases, you might only need to normalize or standardize without any prior transformation, especially if your data is already roughly normally distributed or if you're using algorithms that don't assume normality.
Data standardization specifically refers to rescaling data to a mean of 0 and a standard deviation of 1. This is often called z-score normalization (EITCA, 2023).
Data normalization is a specific type of transformation that scales data to a fixed range, typically between 0 and 1, or -1 and 1. It is used to bring different variables to a common scale without distorting differences in the ranges of values (EITCA, 2023).
Ranked-based Normalized Z-Score Transformation (NST) method combines aspects of transformation (ranking), normalization (scaling to a fixed range), and standardization (producing scores with known statistical properties) (Solomon & Sawilowsky, 2009).
- It involves transformation by converting raw scores to ranks.
- It then normalizes these ranks to a standard scale (often 0 to 1 or 0 to 100).
- The resulting scores have properties similar to standardized scores, with a defined mean and standard deviation.
References
- Bishop, P.A.; Herron, R.L. Use and misuse of the Likert item responses and other ordinal measures. International Journal of Exercise Science 2015, 8, 297–302. [Google Scholar] [CrossRef] [PubMed]
- Galli, S. Unlock data’s potential: A step-by-step data transformation guide. Train in Data: Data Preprocessing, Feature Engineering, Machine Learning, 14 February 2023. https://www.blog.trainindata.com/step-by-step-guide-to-data-transformation/.
- Soloman, S.R.; Sawilowsky, S.S. Impact of rank-based normalizing transformations on the accuracy of test scores. Journal of Modern Applied Statistical Methods 2009, 8, 9. [Google Scholar] [CrossRef]
- Sullivan, G.M.; Artino, A.R., Jr. Analyzing and interpreting data from Likert-type scales. Journal of Graduate Medical Education 2013, 5, 541–542. [Google Scholar] [CrossRef] [PubMed]
- Why is data normalization important in regression problems, and how does it improve model performance? European Information Technologies Certification Academy (EITCA), 5 August 2023. https://eitca.org/artificial-intelligence/eitc-ai-tff-tensorflow-fundamentals/tensorflow-in-google-colaboratory/using-tensorflow-to-solve-regression-problems/examination-review-using-tensorflow-to-solve-regression-problems/why-is-data-normalization-important-in-regression-problems-and-how-does-it-improve-model-performance/.
Disclaimer/Publisher’s Note: The statements, opinions and data contained in all publications are solely those of the individual author(s) and contributor(s) and not of MDPI and/or the editor(s). MDPI and/or the editor(s) disclaim responsibility for any injury to people or property resulting from any ideas, methods, instructions or products referred to in the content. |
© 2025 by the authors. Licensee MDPI, Basel, Switzerland. This article is an open access article distributed under the terms and conditions of the Creative Commons Attribution (CC BY) license (http://creativecommons.org/licenses/by/4.0/).
Copyright: This open access article is published under a Creative Commons CC BY 4.0 license, which permit the free download, distribution, and reuse, provided that the author and preprint are cited in any reuse.


