
Submitted:
26 March 2025
Posted:
28 March 2025
You are already at the latest version
Abstract
Background and aims: Bariatric surgery (BS), drugs approved for type-2-diabetes (T2D), obesity, and liver fibrosis (resmetirom) announce the widespread use of fibrosis-tests in patients with metabolic liver disease (MASLD). An unmet need is to reduce the uncertainty of biomarkers for the diagnosis of the early stage of clinically significant fibrosis (eF). This can be achieved if three essential but neglected STARD methods (3M) are used—a more sensitive histological score than the standard comparator (five-tiers), the weighted area under the characteristic-curve (wAUROC) instead of the binary-AUROC, and biopsy length. We applied 3M to FibroTest-T2D to demonstrate this reduction of uncertainty, and constructed proxies predicting eF in large populations. Methods: For uncertainty, seven subsets were analyzed, four included biopsies (n=1,903), and to assess eF incidence, three MASLD-populations (n=299,098). FibroTest-T2D classification-rates after BS and in out-patients-T2D (n=402) were compared with and without 3M. In MASLD, trajectories of proxies and incidence against confounding-factors used hazard-ratios.Results: After BS (110 biopsies), reversal of eF was observed in 16/29 patients (84%) using seven-tier scores vs. 3/20 patients (47%) using five-tier scores (P=.005). When biopsy length was above the median, FibroTest-T2D wAUROC was .90 (SD=.01), and the wAUROC was .88 (SD=.1) when the length was below the median (P<.001). For the first time, obesity was associated with eF, before T2D (P<.001), and perimenopausal age with apoA1 and haptoglobin increases (P<.0001).Conclusion: Validations of circulating biomarkers need to assess their uncertainty. FibroTest-T2D predicts fibrosis regression after BS. Applying 3M and adjustments could avoid misinterpretations in MASLD surveillance.
Keywords:
Uncertainty
; Obuchowski measure
; Early liver fibrosis
; Granularity
; UK BioBank
; Biopsy length
Introduction
The prevalence of metabolic dysfunction-associated steatotic liver disease (MASLD) is increasing, making it a leading cause of liver fibrosis progression, cirrhosis, and liver cancer [1]. No treatments have yet been validated for cirrhosis, but effective treatments are available for non-cirrhotic cases: weight loss and lifestyle changes, bariatric surgery (BS), and resmetirom [2,3,4,5,6,7].Therefore, a major unmet need is the validation of circulating noninvasive tests (NITs) that can be measured through to diagnose fibrosis before cirrhosis develops [8].
In general usage, the terms ‘accuracy’ and ‘uncertainty’ refer to the degree of certainty in a given measurement or outcome. However, in the context of statistical diagnostic methods, accuracy is defined as the percentage of patients correctly classified as true-positive or true-negative and used when validating NITs for fibrosis. By contrast, the ISO-15189 international definition of accuracy is “the closeness of the agreement between the result of a measurement and a true value of the thing being measured”; this definition adds that “accuracy is a qualitative concept expressed as being high or low, but not with numbers” (Supplementary-File-1). Without a perfect comparator with appropriate granularity, even with a perfect fibrosis NIT and ideal biopsies, a 90% correct classification cannot be achieved, and this figure decreases to 80% with biopsies smaller than 20mm [9,10,11,12,13,14]
Uncertainty of measurement recognizes that no measurement is completely accurate; it is defined as a “parameter, associated with the result of a measurement, that characterizes the dispersion of values that could reasonably be attributed to the thing being measured”.
Therefore, any comparison between NITs must account for their comparator uncertainty, the risk–benefit ratio, the major confounding factors (CFs), and the context of use.
Three rarely applied but essential statistical diagnostic methods (3M) should accelerate the approval of NITs; the first method is the choice of the comparator, as recently illustrated by the resmetirom trial [7]. 3M appeared briefly and for the first time in the Standards for Reporting Diagnostic Accuracy (STARD) statement in criterion #15-2015-version: “How indeterminate index test or reference standard results [comparators] were handled” [15,16]. The uncertainty of biopsy (the comparator) is highly associated with 1) the cutoffs defining each fibrosis-stage and the number of tiers (granularity); 2) the choice of the statistical method, which is the weighted area under the curve (wAUROC or Obuchowski measure) [15,16,17,18]; and 3) the biopsy length [10-14].
It is commonly assumed that a small amount of uncertainty (less than 3%) in the comparator’s classifications negligibly affects the performance of a diagnostic test [9]. This is not true for fibrosis NITs, for which the uncertainty is above 20% [10,11,12,13,14,15]. An extension of STARD for reporting on liver-fibrosis tests (Liver-FibroSTARD) recommends methods in criterion#13.7, specifically “the methods useful for the control of the spectrum effect, such as the Obuchowski method and DANA score” [16,17,18,19]. Details and references on the definitions of uncertainty, and the 3M are given in Supplementary-File-1.
Here, we postulate that the most cited available NITs should be revisited according to the 3M. In the resmetirom landmark study, a more sensitive comparator was defined using the three substages of the F1 stage of the standard clinical research network scoring system named CRN [7,20]. The granularity of the standard CRN score becomes more sensitive when modified in a CRN-F1B score: F1B is defined as early fibrosis (eF), the other non-cirrhotic clinically significant stages being the CRN standards F2, F3. and F4. The revised stage F0 includes the biopsy without fibrosis and the substages F1A and F1C, which are considered non-clinically significant fibrosis [7].
The most cited NITs, such as the FibroSure/FibroTest and the Enhanced Liver Fibrosis score (ELF) for MASLD [8], have been recommended worldwide in viral hepatitis and alcoholic liver disease without ideal trials. A simple NIT, the fibrosis-4-index (FIB4), is less expensive than patented NITs, but it has lower performance for eF; in a prospective cohort of 5,715 patients with sustained hepatitis-C virological response, the prevalence of severe liver fibrosis decreased from only 26% to 17% after 4-years [21].
Before the approval of resmetirom, a systematic review and meta-analysis reported pharmacologic efficacy on fibrosis for five drugs based on NITs, including FibroSure/FibroTest and ELF. ELF score improved after resmetirom treatment [7], and FibroSure/FibroTest results improved after obeticholic acid treatment, both relative to placebo [22].
We present two post-hoc proofs of concept (Table 1). The first compared the NIT performance for the diagnosis of eF (the main endpoint) in patients with biopsies when 3M were applied versus when they were not. The improvement in performance allowed the construction of proxy-NITs, which were applied in large populations. This second concept allowed the construction of trajectories of eF stages, steatosis and inflammation stages, to be compared according to sex, T2D, and obesity for the first time.
Patients and Methods
ETHICS
All authors had access to the data and reviewed and approved the final manuscript. This retrospective study was performed in accordance with the Declaration of Helsinki, and the details are available in previous publications (Table 1). The pre-analytical and analytical NIT procedures were recommended by BioPredictive, including the exclusion criteria and the use of medical security control algorithms to assess non-reliable results. Details are provided in Supplementary-File-2. All data were analyzed anonymously.
PATIENTS
The following four cohorts included patients with biopsies: 1) the prospective BARiatric study of the foundation for Innovation in CArdiometabolism and Nutrition (BARICAN) cohort, including 55 patients before and after BS [5], as summarized in Supplementary-File-3 and Supplementary-Figure 1 and Figure 2) the prospective QuidNash consortium (https://rhu-quidnash.com/about-the-project/), including 402 patients with T2D [14,23], as summarized in Supplementary-File-4; 3) the Liver Injury in Diabetes and Obesity (LIDO) study, including 51 patients with MASLD who received two biopsies on the same day [13]; and 4) the retrospective Fibrosis-TAGS (Truth in the Absence of a Gold Standard) study, including 1,293 biopsies, with large surgery biopsies as a nearly perfect comparator [11].
Figure 1.
Bariatric surgery performance for reducing fibrosis. Panel-A: CRN-F1B was used as described in the resmetirom trial.8 B: Standard CRN was used.21 Panel-C: FibroTest-T2D blood test was used.15,25.The revised stage F0 includes the no-fibrosis and the very-low-fibrosis substages F1, F1A, and F1C.8 The three methods observed the absence of 100% (95% CI 91%-1; P<..001) of fibrosis progression.
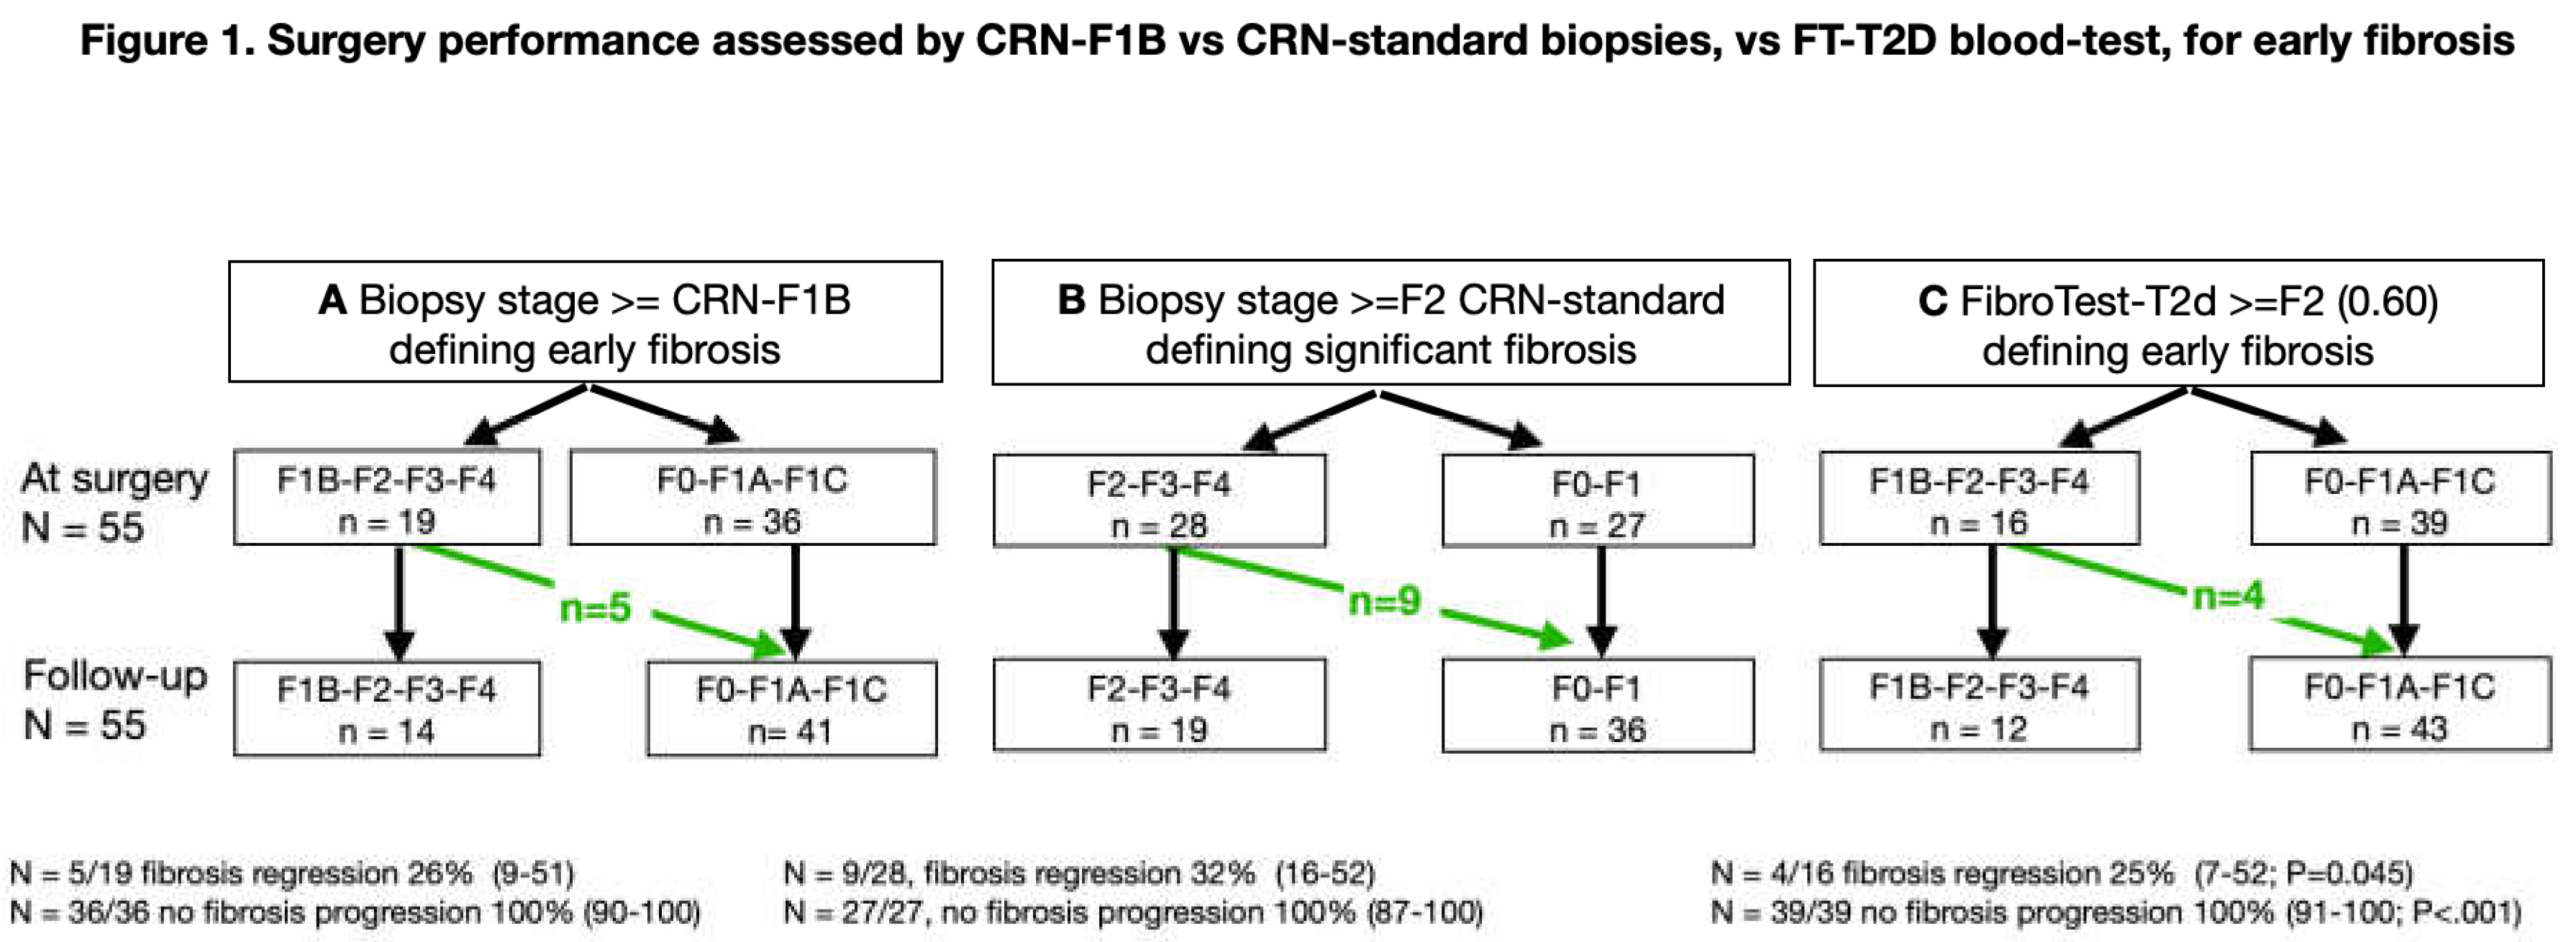
Figure 2.
CRN, FibroTest, and VCTE (y-axis) considered the proxy vs. area of fibrosis (x-axis) as the comparator reference (n= 1,726).
Figure 2.
CRN, FibroTest, and VCTE (y-axis) considered the proxy vs. area of fibrosis (x-axis) as the comparator reference (n= 1,726).
The next three cohorts included patients at risk of MASLD without biopsies, with fibrosis stages, steatosis and inflammation grades estimated using the proxies: 5) the prospective UK Biobank cohort, including 159,794 middle-aged, apparently healthy participants [24] (inclusion details provided in Supplementary-Figure-2; characteristics according to sex, BS history, and menopause are provided in Supplementary-Tables-1-3; 6) the France FibroTest database, including 67,278 patients [25]; and 7) the USA FibroTest database, including 72,026 patients [26]. The four CFs were assessed in all these patients (Table 1 and Supplementary-Table-4).
The main characteristics—specifically age (57 years old), percentage of women (53%), and body-mass-index (BMI)(31kg/m2)—were similar in the UK Biobank and USA FibroTest cohorts. The prevalence of T2D in UK Biobank was only 6%, as this cohort excluded participants not healthy during recruitment; this prevalence was much lower than that in the France FibroTest (16%) and USA FibroTest participants (22%). The France FibroTest cohort had a much lower percentage of females (41%), and participants had a lower average BMI (28kg/m2), in comparison with the other subsets.
METHODS
First aim: To compared two scoring systems, both with 5-tiers but one CRN-F1B more sensitive for eF than the standard CRN.
In the longitudinal BARICAN cohort, we assessed the post-hoc performance of FibroTest-T2D to identify patients with eF regression after BS, as summarized in Supplementary-File-3 (6), and to exclude patients (Supplementary-Table-5).
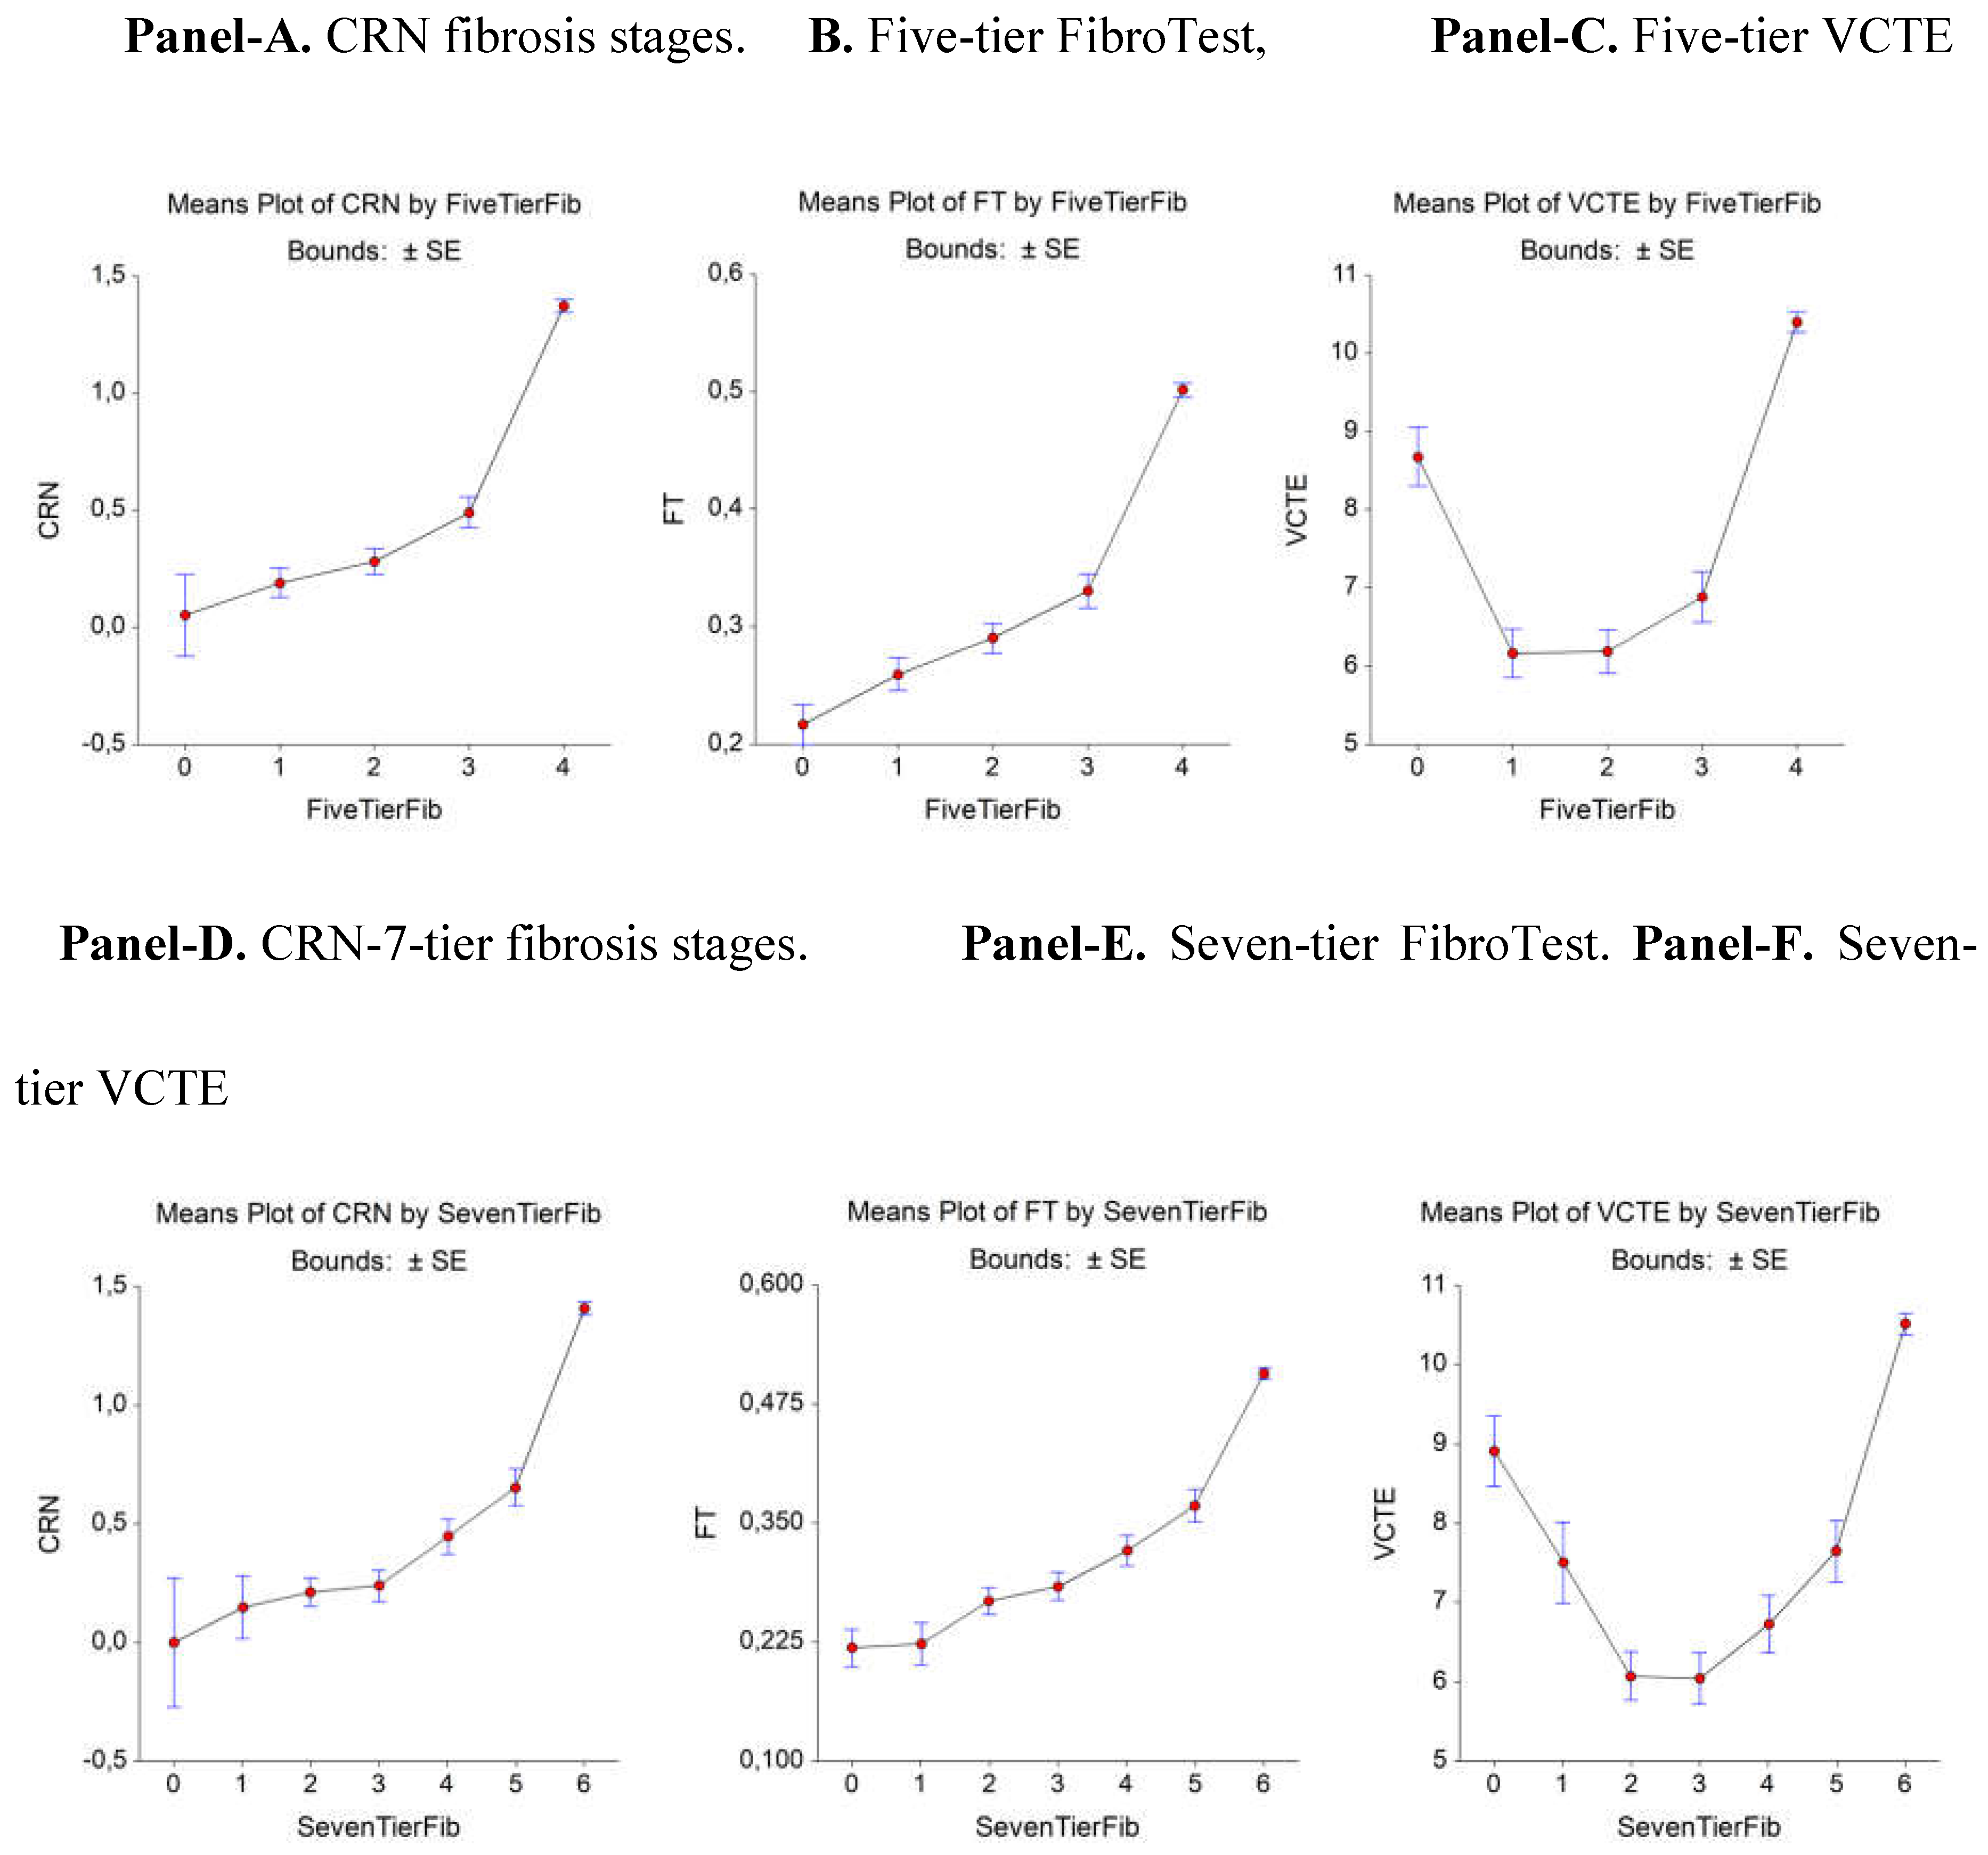
In the Fibrosis-TAGS study, using large surgical biopsies as the true reference (gold standard comparator = fibrosis area), we conducted post-hoc comparisons for the first time to determine the uncertainty of three possible proxy comparators: a biopsy proxy in MASLD using the CRN ; a circulating-proxy using a FibroTest proxy; and an imaging-proxy using a VCTE-proxy. Because the F1 substages were not assessed, we constructed a uniform scoring score (seven-tiers) that uses the normalized area of stages F0-to-F6 divided by seven (11).
Second aim: To assess the performance of FT-T2D using wAUROC or the adjusted- binary AUROC instead of the standard binary-AUROC (bAUROC).
To compare different spectra without direct comparisons, it is mandatory to use the wAUROC [11,16,17,18,19] (Supplementary-File-5). Because few studies have used the wAUROC, here, we systematically applied an index of fibrosis spectrum variability called DANA (Difference between Advanced and Non-Advanced fibrosis) in patients at risk of MASLD to predict the adjusted bAUROC for the 5-tier CRN-stages [17,19,27,28].
Third aim: To assess the impact of biopsy sample length.
Doubling the length of the median biopsy from 20mm to 40mm increased the prevalence of bridging fibrosis (stage F3) using CRN from 25% to 33%, and it reduced the misclassification rate to 8% in MASLD [13]. We previously used the published comparator of the misclassification rate, as detailed in Supplementary-File-5 [9,14] and using a true reference with large surgical biopsies, we assessed the biopsy uncertainty, as detailed in Supplementary-File-1 [11]. With a 17mm median biopsy specimen, the maximum expected bAUROC for an ideal marker decreased to .70 because of the 30% misclassification rate of the biopsy. Here, we stratified the wAUROCs using the median biopsy lengths as cutoffs (Table 2).
Fourth aim: To assess the trajectories of fibrosis, inflammation, and steatosis stratified by sex, T2D, and obesity.
We built proxies of FibroTest-T2D (FT-2tD-proxy), SteatoTest-T2D (ST-t2D-proxy), and NashTest-T2D (NT-t2D-proxy) that were independent of the age of participants and separately in women and men. This construction permitted us to avoid co-linearity and assess the fibrosis progression rate (FPR) from birth to the first occurrence of eF by sex. First, in the QuidNash cohort, we performed a multiple-logistic-regression using the components of FibroTest-(FibroSure-Plus in USA) that predict the stage F1B, the comparator endpoint in the 402 consecutive patients with T2D. Second, we used the Bland-Altman plots and limits of agreements (BA-LOA) to assess the significance of linking with the original and proxies stratified by country (USA, France) and sex. As previously described [30], the final step was to assess the FPR using the cumulative hazard ratio from birth to the first occurrence of the stage of interest, in this case CRN-F1B, in the large US and French cohorts according to CFs and the earlier features of steatosis and inflammatory grades using similar proxies constructions.
The variability of five components (alpha-2-macroglobulin [A2M], apolipoprotein A1 [apoA1], haptoglobin, gamma-glutamyl transpeptidase [GGT], and bilirubin) was assessed in large populations at risk of MASLD. In UK Biobank, we focused on the postmenopausal rise in the rate of MASLD.
SENSITIVITY ANALYSES
Patients underwent routine FibroTest-T2D assessments, which were performed before and after the BS protocol to increase the FPR assessments; specifically, tests were conducted before BS (between the preparation routine and biopsy 1), between BS and follow-up (biopsy-2) and between biopsy-2 and the latest routine FibroTest-T2D.
Results
First aim: Advantage of a more sensitive (F1B) histological comparator
In the BARICAN study, 19 of 55 patients (35%; 95%CI 22–49) were classified as stage CRN-F1B or higher at the time of surgery, and only 14 patients (25%;95%CI 15–39) were classified as such 6 years later (F0/F1A/F1C;Figure 1A), which was a significant decrease (Nam RMLE-score=9.7;P=.002).
Using CRN, 28 of 55 patients (51%;95%CI 37–65) were classified as having a significant fibrosis stage of at least F2 (F2/F3/F4;Figure 1B), which decreased to 19 patients (35%;95%CI 22–47) without significant fibrosis (F0/F1), a non-significant decrease (Nam RMLE Score =1.4;P=.24).
When the FT-T2D was used, 16 of 55 patients (25%;95%CI15–39) had score of at least .60, the cutoff chosen for CRN-F1B, which decreased to 12 patients (22%;95%CI 12–35) without significant fibrosis (FT-T2D<.60,Figure 1C), a highly significant decrease (Nam RMLE-Score=14.3;P=.0002).
In the Fibrosis-TAGS cohort, the nearly perfect comparator permitted a decrease in the uncertainty of FibroTest in comparison with VCTE for the diagnosis of early bridging. A total of 2,160 virtual biopsies were available and scored using CRN as F0 (n=1,080;50%), F1 (n=540;25%), and F2 (n=540;25%) (Figure 2 and Supplementary-Table-6). The analyses of the CRN, FibroTest, and VCTE contemporaneous values revealed a significant association between the CRN and FibroTest values, which was linear in the early bridging zone (F2–F3) when the reference used CRN (Figure 2A, Figure 2B). Two slopes were observed between F0 and F1 when the seven-tier system was used (Figure 2D) and between the F1 and F2 fibrosis categories for FibroTest (Figure 2E). For VCTE, a U-shape was formed using both the five-tier (Figure 2C) and seven-tier (Figure 2F) scores, suggesting false-positive cases.
Second aim: Performance of FT-T2D vs. FibroTest using wAUROC or bAUROC
FibroTest-T2D had a significantly higher (P<.001) wAUROC (median [SD];.86[.01]) than the regular FibroTest (.80[.01]), both in the 402 patients with T2D (QuidNash) [14, 23] and the 55 patients with BS (BARICAN) and 110 paired biopsies [6], and regardless of the fibrosis scoring system (Table 2).
Third aim: Impact of the biopsy sample length, a major factor of uncertainty
In the QUIDNASH and BARICAN cohorts, when the biopsy length was above the median, the FibroTest-T2D wAUROC were all significantly higher than when the biopsy length was above the median [SD]was .86[.01]; by comparison, when the length was below the median and whatever the comparator (Table 2).
Fourth aim: Variability of early fibrosis trajectories in large populations
The FT-T2D proxy had a significant bAUROC (.77;95%CI.72–.81;P<.001) for the diagnosis of F1B using regression analysis, similar to that of the FibroTest-T2D (bAUROC=.77;95%CI .72–.82;P=.84). BA-LOA among patients with NITs and biopsies were detailed in Supplementary-Figure-3. Correlation coefficients were highly significant (P<.001) varied from .82 to.94: NITs-T2D-proxy-women(n=159)/ men(n=243)=.94/.88/; NT-T2D =.80/.80 ; ST-T2D= .85/.82. The bias and LOA were not perfect and varied .03 for Steatosis, .25 for Fibrosis, and .27 for Nash.
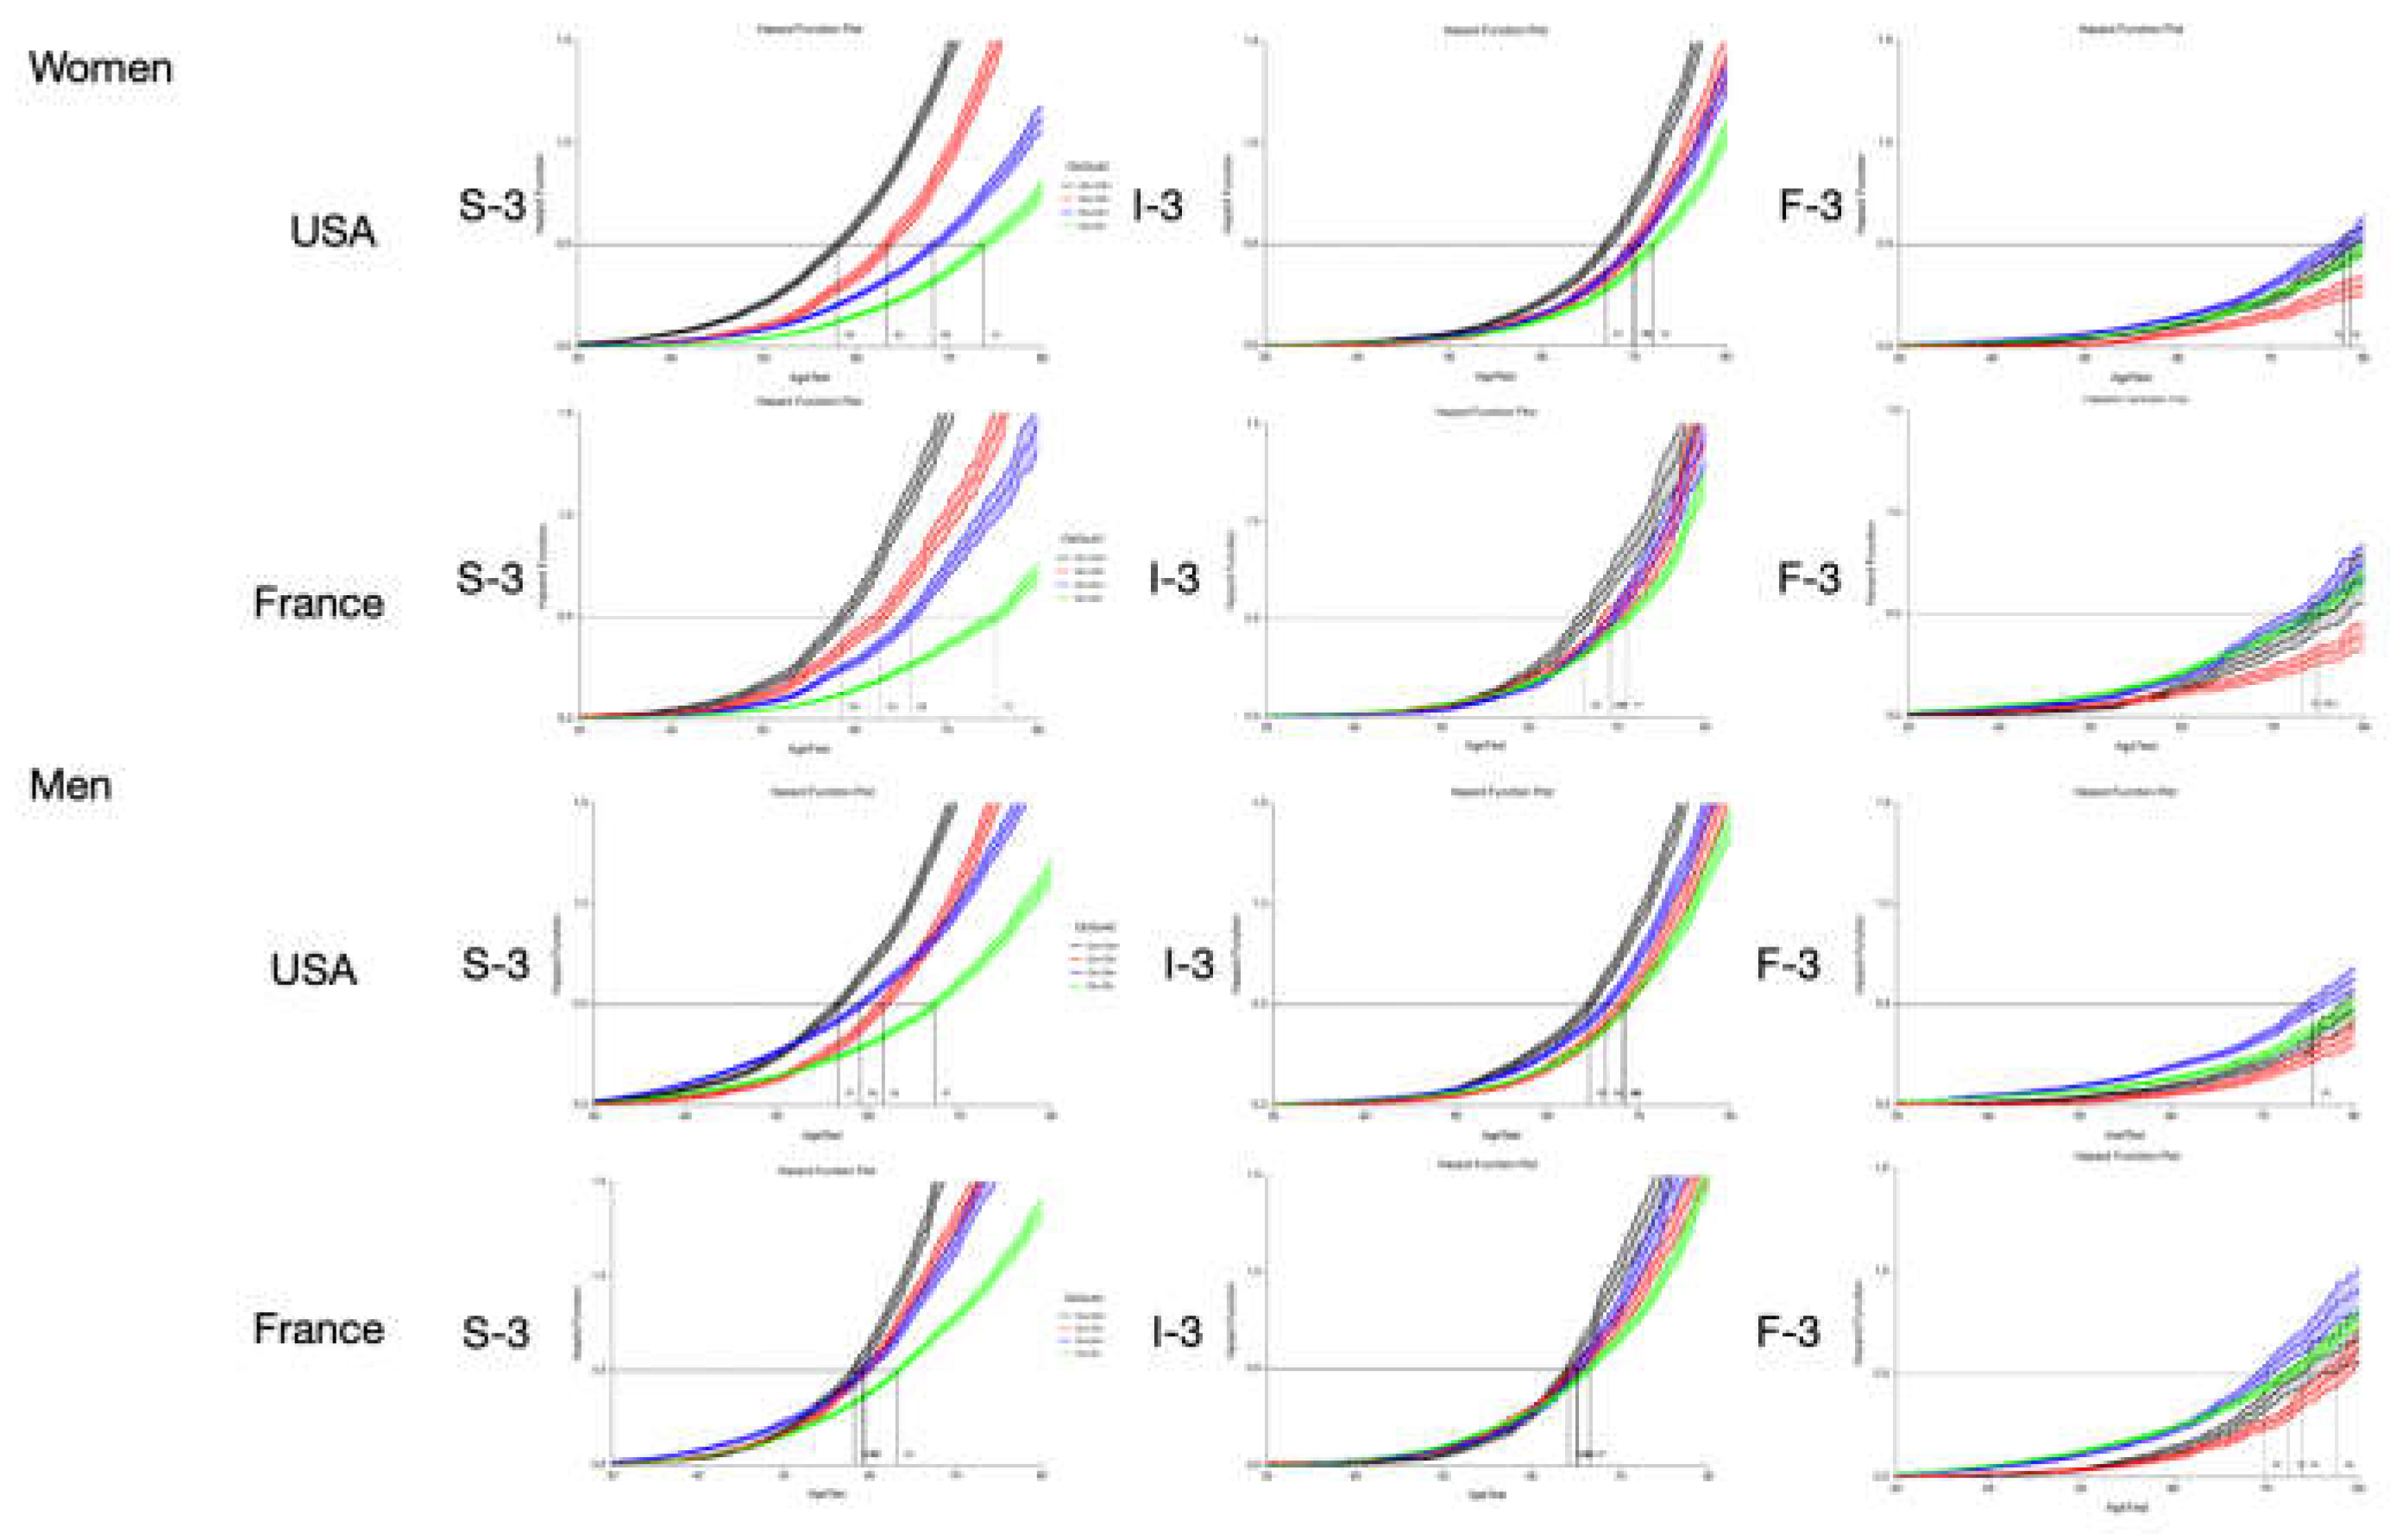
Using these proxies, the FPR of eF was assessed for the first time in French and US cohorts of patients at risk of MASLD, stratified by country, sex, T2D, and obesity, and simultaneously with the trajectories of the two earlier features: steatosis and inflammation (Figure 3).
For eF occurrence, the trajectories were similar regardless of the country and sex. Surprisingly, obesity without T2D was the preexisting risk factor associated with eF occurrence. T2D and obesity were the preexisting factors associated with the occurrence of severe steatosis and inflammation.
Regarding trajectories, In UK-Biobank-subset, apoA1 increased until 50 years of age in women regardless of BMI (Supplementary-Figure-4A). In women with T2D who were not overweight, apoA1 increased at perimenopausal age (Supplementary-Figure-4A), as confirmed in the subset with NMR (Supplementary-Figure-4C;Supplementary-Table-6. Supplementary-Table-8. ). In men with T2D and women with a BMI≥27, the apoA1 increase completely disappeared (Supplementary-Figures-4B-4C-4E-4F). More details were described in UK Biobank participants with a history of BS (n=681) (Supplementary-Table-2). In the USA and French subsets, haptoglobin (Supplementary-Figures-5), and A2M (Supplementary-Figures-6) were associated with age.
Sensitivity analyses (Supplementary-File-7)
At the surgery time, the diagnosis of MASH grades A2/A3 using NashTest-T2D was significant, with a bAUROC (IQR;P-value) =.68(.51–.80;P=.007) higher than that using AST (.52;.34–.67;P =.02) (Supplementary-Figure-7A); and at the second biopsy, with a bAUROC of .77(.61–.87;P<..001), but this did not differ from AST (.71;.51–.83;P=.35) (Supplementary-Figure-7B).
Because steatosis was present in all cases at the time of surgery, the assessment of SteatoTest-T2D performance was possible only at the time of the second biopsy. For the diagnosis of grades S2 and S3 (prevalence =.15), the difference was significant (P=.001), with an AUROC of .71(.49–.84;P=.01), and it was not significant using triglycerides (P=.95) (Supplementary-Figure-3C). The FPR decrease for FibroTest-T2D between biopsies was significant only in men (median [IQR]:−2.6%[−3.6% to 1.2%],P=.02).
Discussion
The limitations and strengths of our results were compared with recently published NIT reviews [2,8,15,22]. These reviews achieved a consensus on the higher classification rate of the most cited circulating biomarkers, such as FibroTest, ELF, Hepascore, and FibroMeter, for the diagnosis of fibrosis stages, which were more costly compared with simple liver function tests [2,8,15]. They generally underscored the need for new NITs with better sensitivity or specificity. Several suggested that a bAUROC greater than .80 could be an appropriate cutoff for future qualification methods of NITs in MASLD. However, the latest international studies on recent combinations failed to demonstrate higher accuracies [15, 34].
As stated in our introduction, it has been demonstrated since 2005 that it is mathematically impossible to validate an NIT with a true 80% classification rate between adjacent stages of MASLD using biopsies with a length under 25mm [9-11,13,17,2). Surprisingly, although all these reviews cited STARD, they did not realized that they were not applied (Supplementary-File-8). An improvement could be to promote the utility of FibroSTARD or FibroSTARD recommendations in Hepatology journals.
One review analyzed 138 studies of NITs in 46,514 cases at risk of MASLD [2). Here, we updated this analysis, adding four comparisons published from 2023 to 2024 (Table 3) [35,36]. Due to the limited number of references, details of the 22 comparisons performed in 18 studies are provided in Table 3, the 18 references being provided in Supplementary-File-9. Sixteen studies provided the median biopsy length, but only one study used it to stratify the AUROCs. No median length>30mm was identified, and only one recent study used a seven-tier score. When bAUROC≥.80 was applied as a selection criterion (milestone), 12 comparisons reached this cutoff (57%): FibroTest (n= 4), FT-T2D (n= 0), ELF (n= 2), Hepascore (n= 2), FibroMeter-NAFLD (n= 2), and FibroMeter-v2G (n= 2). However, a simple adjustment by the DANA-index reduced this milestone selection to only six markers of interest (27%): FibroTest (n= 3), FibroMeter-NAFLD (n= 1), FibroMeter-v2G (n= 1), ELF (n= 1), and Hepascore (n= 1) (Table 3).
In a road map for NITs assessment, several limitations were stated [8]. First, “FibroTest is less useful for early fibrosis”, an opposite conclusion than that of a more recent review,2 and by an evidence-based analysis using large biopsies [11]. The second limitation was that most data were from viral hepatitis, which was true in 2006 but not in 2024 (Table 3). ELF was considered less useful for eF, but it without evidence based such as our Table 3.
In a head-to-head comparison of 335 participants including ELF, the bAUROC of .83 was consistent with the results of published meta-analyses regarding the diagnosis of F3 using CRN, in line with our finding that ELF adjusted bAUROCs ranged from .72 to .80 (Table 3).
The NIMBLE study did not comment on the uncertainty of the comparator when using bAUROCs, neither discuss STARD criterion #15 regarding uncertainty, added in 2015, as they cited the old version [15]. In a recent digital pathology review, only two comments cited the biopsy length: “A 20mm core is generally considered a best practice for assessing MASLD” and “Calculations suggested that a biopsy sample that was 22mm in length was sufficient for a good estimation of collagen proportionate area, but stage classification is non-linear and required more tissue” [39]. More methodological examples are given in Supplementary-File-5.
LIMITATIONS
The authors’ conflicts of interest are declared, and the patents of FibroTest or FibroTest-T2D belong to National French Public Organizations. We acknowledge several significant limitations that warrant external validation. This study’s design applied a post-hoc analysis even though the cohorts were prospective. Proxies were highly correlated with differences in the 95%-limits, but distributions should be improved. We also did not assess the uncertainty associated with the biopsy technique or different surgical methods treatments [9,4].
We also acknowledge the cost limitations of the patented FibroTest and FibroTest-T2D when compared with simpler tests. These tests have an advantage in the cost/benefit ratio over other NITs, as they allow not only fibrosis assessment as MASH and steatosis grades were also assessed in the same blood samples [25]
Here, we found several components with unexpected variability due to the four CFs. The significant associations observed do not prove causality, and large Mendelian randomization analyses including the four CFs are needed [2].The results of the trajectories of liver fibrosis, inflammation, and steatosis in large cohorts at risk of MASLD according to CFs are original concepts using simultaneous proxies validated by biopsies, but external validation is also needed.
STRENGTHS
Our results confirm that eF should replace bridging without cirrhosis when choosing MASLD therapy [5,15]. Using CRN-F1B as a cutoff for clinically significant fibrosis permitted us to construct more sensitive NITs compared with the CRN. 3M demonstrated an increase of FibroTest-T2D performance for the diagnosis of eF in patients with severe obesity before and after BS, which was previously observed with standard FibroTest.
We analyzed the fibrosis dynamic of NITs over a median of 9.5 years (IQR=5.5) and 5.0(3.4) between biopsies. This permitted us to observe a similar FPR using FibroTest-T2D vs. histological CRN-F1B changes, as observed in a trial of obeticholic acid in comparison with placebo [22].
Applying the 3M reduced the uncertainty of the NITs associated with CFs and menopause. Using proxies of eF and simultaneous steatosis and inflammatory grades permitted us to identify various trajectories according to CFs. These results will permit us to construct better prospective surveillance strategies, including forthcoming novel treatments for eF, such as resmetirom. The identification of such unusual profiles of FibroTest components already enabled the creation of warnings for eliminating COVID-19 [26], or possible Gilbert syndrome [24] Obesity was the first CF associated with the occurrence of eF, which was significantly earlier than T2D without obesity (P<.001); eF appeared 10 years later in patients with both obesity and T2D (P<.001). These results warrant further focused research on topics such as the role of hormone profiles and chronic inflammation in the early increase in haptoglobin in obese women which is also produced by adipocytes.
In conclusion, forthcoming studies must add wAUROCs, stratification according to biopsy length and use a more sensitive score than the standard CRN for credible selection.

Table 1.
Summary of the subset characteristics included for assessing the uncertainty of FibroTest-T2D according to primary aims.
Table 1.
Summary of the subset characteristics included for assessing the uncertainty of FibroTest-T2D according to primary aims.
| Characteristics | Three STARD Methods | FT-T2D proxy3 | ||||||||
| First aim | Second aim | Third aim | Fourth aim | |||||||
| Seven Subsets Reference | Disease | Number All/biopsy/controls | Age, yearsMean (range or SD) | Female% | BMI, kg/m2 median (range) | T2D % | CRN F1B1 | w2 AUROC | Liver biopsy sample length | Confounding factors of fibrosis progression |
| BARICAN Pais6 | Bariatric surgery | 55/110/0 | 55 (SD = 8) | 62 | 44 (26–61) | 64 | Yes | Yes | Yes | Yes |
| QuidNash Poynard14,24 | Type 2 diabetes | 402/402/0 | 58 (SD =10) | 40 | 34 (19–54) | 100 | Yes | Yes | Yes | Yes |
| LIDO Ratziu13 | MASLD | 51/102/0 | 55 (31–73) | 39 | 32 (22–45) | 33 | Yes | No | Yes | Yes |
| Fibrosis-TAGS Poynard11 | MASLD | 909/1,293/4 | 46 (SD = 12) | 39 | Not available | Not available | No | Yes | Yes | Yes |
| UK BioBank Poynard25 | At risk of MASLD | 159,794/0/0 | 57 (SD = 8) | 53 | 31 (12–75) | 6 | No | No | No | Yes |
| France-FibroTest Poynard26 | At risk of MASLD | 67,278/0/0 | 53 (SD = 14) | 41 | 28 (SD = 6) | 16 | No | No | No | Yes |
| USA-FibroTest Deckmyn27 | At risk of MASLD | 72,026/0/0 | 56 (SD = 14) | 54 | 31 (10–79) | 22 | No | No | No | Yes |
1 CRN-F1B: F1B is the earliest stage of four clinically significant fibrosis stages: F1B, F2, F3, and F4. F0 includes no fibrosis, F1A, and F1C8,25.2wAUROC: weighted area under the receiver operating characteristic curve (Obuchowski measure) 3 FT-T2D proxy: Serum proxy of F1B stages constructed and validated in large population subsets
Table 2.
Performance of the new FibroTest-T2D and standard FibroTest for the diagnosis of fibrosis in QuidNash and BARICAN patients. Uncertainty is displayed according to bAUROC or wAUROC (Obuchowski method), biopsy length, and choice of granularity: CRN-F1B or CRN standard.
Table 2.
Performance of the new FibroTest-T2D and standard FibroTest for the diagnosis of fibrosis in QuidNash and BARICAN patients. Uncertainty is displayed according to bAUROC or wAUROC (Obuchowski method), biopsy length, and choice of granularity: CRN-F1B or CRN standard.
| Characteristics | CRN-F1B (cutoff >= F1B early fibrosis) |
CRN standard (cutoff >= F2 bridging fibrosis) |
||||
|---|---|---|---|---|---|---|
| QUIDNASH COHORT N=402 | ||||||
| Biopsy length | ≥Median 17 mm | <Median 17 mm | All | ≥Median 17 mm | <Median 17 mm | All |
| method = weighted AUROC (SD) | ||||||
| FibroTest-T2D* | .86 (.02) | .85 (.02) | .86 (.01) | .90 (.01) | .88 (.01) | .89 (.01) |
| FibroTest* | .84 (.02) | .80 (.02) | .82 (.01) | .87 (.01) | .85 (.02) | .86 (.01) |
| P-value FibroTest-T2D vs FibroTest | .12 | .002 | .001 | .02 | .002 | .0002 |
| P-value between biopsy length groups | FT-T2D <.001 | FT-T2D <.001 | ||||
| FT <.001 | FT <.001 | |||||
| Standard=bAUROC (95% CI) | ||||||
| N (prevalence) | n=136/211 (64%) | n=116/191 (61%) | n=156/402 (63%) | n=79/211 (37%) | n=71/211 (37%) | n=150/402 (37%) |
| FibroTest-T2D | .72 (.64–.78) | .77 (.69–.83) | .74 (.69–.79) | .80 (.73–.85) | .74 (.66-.80) | .77 (.72–.81) |
| FibroTest | .69 (.61–.76) | .67 (.58–.74) | .68 (.62–.74) | .74 (.66–.80) | .67 (.58–.74) | .70(.65–.75) |
| BARICAN COHORT N=110 | ||||||
| Biopsy length | ≥Median 20 mm | <Median 20 mm | All | ≥Median 20 mm | <Median 20 mm | All |
| method = weighted AUROC (SD) | ||||||
| FibroTest-T2D* | .93 (.03) P<.001 | .88 (.02) P<.001 | .90 (.02) P<.001 | .91 (.03) P<.001 | .84 (.03) P<.001 | .87 (.02) P<.001 |
| FibroTest* | .94 (.03) P<.001 | .86 (.03) P<.01 | .89 (.02) P<.001 | .92 (.03) P<.001 | .84 (.03) P<.01 | .87 (.02) P<.001 |
| P-value FibroTest-T2D vs FibroTest | .001 | .35 | .59 | .60 | .98 | .87 |
| P-value between biopsy length groups | FT-T2D <.001 | FT-T2D <.001 | ||||
| FT <.001 | FT <.001 | |||||
| Standard=bAUROC (95% CI), | ||||||
| N (prevalence) | n=8/73 (11%) | n=12/37 (17%) | n=18/110 (27%) | n=11/43 (26%) | n=16/67 (24%) | n=27/110 (28%) |
| FibroTest-T2D | .84 (.64–.93) | .72 (.47–.90) | .78 (.63–.87) | .84 (.65–.93) | .83 (.67–.92) | .83 (.72–.90) |
| FibroTest | .80 (.46–.94) | .49 (.25–.68) | .67 (.50–.80) | .78 (.57–.89) | .76 (.57–.88 | .77(.63–.86) |
* p-value for the bAUROC and wAUROC methods.
Table 3.
Uncertainty of the four most cited circulating fibrosis markers for the diagnosis of fibrosis stages F3/F4 vs. F0/F1/F2 in MASLD; sequential combinations not included.
Table 3.
Uncertainty of the four most cited circulating fibrosis markers for the diagnosis of fibrosis stages F3/F4 vs. F0/F1/F2 in MASLD; sequential combinations not included.
| 22 comparisons in 18 published studies Author Year |
N | CRN-F1B | CRN F0/F1/F2/F3/F4 |
DANA index |
Adjusted AUROC F3F4 vs. F0F1F2 |
Weighted AUROC |
Binary AUROC standard F3/F4 vs. F0/F1/F2 | Biopsy length median (mm) |
|---|---|---|---|---|---|---|---|---|
| Uniform spectrum model | 100 | 20/20/20/20/20 | 2.50 | .800 | .800 | >.800 | >30 | |
| FibroTest | ||||||||
| Ratziu 2006 38 first | 97 | 0 | 26/40/15/12/4 | 2.39 | .910 | .878 | .810 | 18 |
| Ratziu 200638 validation | 170 | 0 | 76/54/31/9/0 | 2.28 | .873 | .920 | .920 | 20 |
| Lassailly 201133 | 288 | 0 | 170/98/13/2/5 | 3.27 | .911 | .847 | .971 | NA |
| Adams 2011* | 242 | 0 | 87/58/44/30/23 | 2.38 | .784 | NA | .802 | 16 |
| Munteanu 201639 | 600 | 0 | 122/184/140/121/33 | 2.17 | .744 | .878 | .749 | 20 |
| Boursier 2016*^,w | 452 | 0 | 41/117/120/114/58 | 2.06 | .735 | .722 | .734 | 27 |
| Bril 2019* | 151 | 0 | 38/63/25/19/6 | 2.34 | .722 | NA | .720 | NA |
| Poynard 202324,^,i,°,b,l,r,w | 402 | 1 | 117/66/63/85/71 | 2.67 | .789 | .842 | .709 | 17 |
| FT-T2D | ||||||||
| Poynard 202324,^,i,°,b,l,r,w | 402 | 1 | 117/66/63/85/71 | 2.67 | .789 | .879 | .774 | 17 |
| ELF | ||||||||
| Miele 2017* | 82 | 0 | 6/32/29/5/10 | 2.32 | .759 | NA | .948 | >16 |
| Anstee 2019* | 3202 | 0 | 246/276/418/979/128 | 2.38 | .764 | NA | .800 | 22 |
| Guillaume 2019^,w,* | 417 | 0 | 38/98/114/135/32 | 1.89 | .720 | .764 | .793 | 29 |
| Arai 2024 36,r | 1228 | 0 | 214/411/327/237/39 | 2.02 | .803 | NA | .828 | NA |
| Hepascore | ||||||||
| Adams 2011*^ | 242 | 0 | 87/58/44/30/23 | 2.38 | 0,788 | NA | .814 | 16 |
| Bertot 202337,r | 271 | 0 | 101/67/20/36/47 | 3.00 | .842 | NA | .880 | NA |
| Boursier 2016 *^,w | 452 | 0 | 41/117/120/114/58 | 2.06 | .735 | .765 | .778 | |
| FibroMeter NAFLD | ||||||||
| Cales 2009* | 235 | 0 | 102/68/21/19/25 | 2.99 | .889 | NA | .928 | 30 |
| Aykut 2014t,* | 88 | 0 | 23/21/17/27/9 | 2.35 | .761 | NA | .937 | NA |
| Boursier 2016^,w,* | 452 | 0 | 41/117/120/114/58 | 2.06 | .735 | .886 | .759 | 27 |
| Subasi 2015t,* | 142 | 0 | 40/50/22/20/10 | 2.49 | .774 | NA | .761 | 20 |
| FibroMeter V2G | ||||||||
| Boursier 2016^,w,x, * | 452 | 0 | 41/117/120/114/58 | 2.06 | .735 | .798 | .817 | 27 |
| Guillaume 2019^,w,* | 417 | 0 | 38/98/114/135/32 | 1.89 | .720 | .763 | .804 | 29 |
DANA = Difference between Advanced and Non-Advanced fibrosis
Bold bAUROCs (n= 11) and adjusted AUROCs (n= 5) are those > .800
NA: Not available
^Head-to-head comparison (n= 8)
2Analysis in intention-to-diagnose (n= 2)
bCRN-F1B (n= 2)
lAUROC stratified according to biopsy length (n= 2)
rRecently published after 2021 (n= 4)
wwAUROC (n= 8)
tTwo studies sharing the same patients, one excluding VCTE (Aykut 2014)
* Nine references not cited in the article are listed in Supplementary-File 7 (n= 9).
Figure 1.
Bariatric surgery performance for reducing fibrosis. Panel-A: CRN-F1B was used as described in the resmetirom trial.8 B: Standard CRN was used.21 Panel-C: FibroTest-T2D blood test was used.15,25.The revised stage F0 includes the no-fibrosis and the very-low-fibrosis substages F1, F1A, and F1C.8 The three methods observed the absence of 100% (95% CI 91%-1; P<..001) of fibrosis progression.
Figure 2.
CRN, FibroTest, and VCTE (y-axis) considered the proxy vs. area of fibrosis (x-axis) as the comparator reference (n= 1,726).
Figure 2.
CRN, FibroTest, and VCTE (y-axis) considered the proxy vs. area of fibrosis (x-axis) as the comparator reference (n= 1,726).
Figure 3.
Fibrosis progression rates (FPRs) to early fibrosis in US and French populations at risk of MASLD.
Figure 3.
Fibrosis progression rates (FPRs) to early fibrosis in US and French populations at risk of MASLD.
Conflict of Interest
Thierry Poynard is the inventor of FibroTest and FibroTest-T2D and full employee and founder of BioPredictive, a spinoff of Sorbonne University that markets biomarkers. He is an emeritus professor at Sorbonne University. The tests’ patents belong to the public French organization “Assistance Publique Hôpitaux de Paris” and Sorbonne University. Olivier Deckmyn and Valentina Peta are full employees of BioPredictive.The other authors have no conflicts of interest.The RHU QUID-NASH project is funded by Agence Nationale de la Recherche Programme Investissements d’Avenir (grant ANR-17-T171105J-RHUS-0009 to D.V.). The RHU QUID NASH is implemented by Institut National de la Recherche Medicale, Paris Descartes University, Université Paris Cité, Centre National de la Recherche Scientifique, Centre de l’Energie Atomique, Servier, Biopredictive, and Assistance Publique-Hôpitaux de Paris.
References
- Younossi ZM, Golabi P, Paik JM, Henry A, Van Dongen C, Henry L. The global epidemiology of nonalcoholic fatty liver disease (NAFLD) and nonalcoholic steatohepatitis (NASH): a systematic review. Hepatology 2023, 77, 1335–47.
- López Tórrez SM, Ayala CO, Ruggiro PB, Costa CAD, Wagner MB, Padoin AV; et al. Accuracy of prognostic serological biomarkers in predicting liver fibrosis severity in people with metabolic dysfunction-associated steatotic liver disease: a meta-analysis of over 40,000 participants. Front Nutr 2024, 11, 1284509.
- Adams TD, Davidson LE, Litwin SE, Kim J, Kolotkin RL, Nanjee MN; et al. Weight and Metabolic Outcomes 12 Years after Gastric Bypass. N Engl J Med 2017, 377, 1143–55.
- Syn NL, Cummings DE, Wang LZ, Lin DJ, Zhao JJ, Loh M; et al. Association of metabolic–bariatric surgery with long-term survival in adults with and without diabetes: a one-stage meta-analysis of matched cohort and prospective controlled studies with 174 772 participants. The Lancet 2021, 397, 1830–41.
- Lassailly G, Caiazzo R, Ntandja-Wandji L-C, Gnemmi V, Baud G, Verkindt H; et al. Bariatric Surgery Provides Long-term Resolution of Nonalcoholic Steatohepatitis and Regression of Fibrosis. Gastroenterology 2020, 159, 1290–1301e5.
- Pais R, Aron-Wisnewsky J, Bedossa P, Ponnaiah M, Oppert J, Siksik J; et al. Persistence of severe liver fibrosis despite substantial weight loss with bariatric surgery. Hepatology 2022, 76, 456–68.
- Harrison SA, Bedossa P, Guy CD, Schattenberg JM, Loomba R, Taub R; et al. A Phase 3, Randomized, Controlled Trial of Resmetirom in NASH with Liver Fibrosis. N Engl J Med 2024, 390, 497–509.
- Sanyal AJ, Castera L, Wong VW-S. Noninvasive Assessment of Liver Fibrosis in NAFLD. Clinical Gastroenterology and Hepatology 2023, 21, 2026–39.
- McHugh LC, Snyder K, Yager TD. The effect of uncertainty in patient classification on diagnostic performance estimations. Sartori G, editor. PLoS ONE 2019, 14, e0217146.
- Mehta SH, Lau B, Afdhal NH, Thomas DL. Exceeding the limits of liver histology markers. Journal of Hepatology 2009, 50, 36–41.
- Poynard T, Lenaour G, Vaillant JC, Capron F, Munteanu M, Eyraud D; et al. Liver Biopsy Analysis Has a Low Level of Performance for Diagnosis of Intermediate Stages of Fibrosis. Clinical Gastroenterology and Hepatology 2012, 10, 657–663e7.
- Bedossa P, Dargere D, Paradis V. Sampling variability of liver fibrosis in chronic hepatitis C. Hepatology 2003, 38, 1449–57.
- Ratziu V, Charlotte F, Heurtier A, Gombert S, Giral P, Bruckert E; et al. Sampling Variability of Liver Biopsy in Nonalcoholic Fatty Liver Disease. Gastroenterology 2005, 128, 1898–906.
- Poynard T, Paradis V, Mullaert J, Deckmyn O, Gault N, Marcault E; et al. Prospective external validation of a new non-invasive test for the diagnosis of non-alcoholic steatohepatitis in patients with type 2 diabetes. Aliment Pharmacol Ther 2021, 54, 952–66.
- Sanyal AJ, Shankar SS, Yates KP, Bolognese J, Daly E, Dehn CA; et al. Diagnostic performance of circulating biomarkers for non-alcoholic steatohepatitis. Nat Med 2023, 29, 2656–64.
- Bossuyt PM, Reitsma JB, Bruns DE, Gatsonis CA, Glasziou PP, Irwig L; et al. STARD 2015: An Updated List of Essential Items for Reporting Diagnostic Accuracy Studies. Clinical Chemistry 2015, 61, 1446–52.
- Boursier J, De Ledinghen V, Poynard T, Guéchot J, Carrat F, Leroy V; et al. An extension of STARD statements for reporting diagnostic accuracy studies on liver fibrosis tests: The Liver-FibroSTARD standards. Journal of Hepatology 2015, 62, 807–15.
- Lambert J, Halfon P, Penaranda G, Bedossa P, Cacoub P, Carrat F. How to Measure the Diagnostic Accuracy of Noninvasive Liver Fibrosis Indices: The Area Under the ROC Curve Revisited. Clinical Chemistry 2008, 54, 1372–8.
- Poynard T, Halfon P, Castera L, Munteanu M, Imbert-Bismut F, Ratziu V; et al. Standardization of ROC Curve Areas for Diagnostic Evaluation of Liver Fibrosis Markers Based on Prevalences of Fibrosis Stages. Clinical Chemistry 2007, 53, 1615–22.
- Kleiner DE, Brunt EM, Van Natta M, Behling C, Contos MJ, Cummings OW; et al. Design and validation of a histological scoring system for nonalcoholic fatty liver disease. Hepatology 2005, 41, 1313–21.
- Carrieri P, Carrat F, Di Beo V, Bourlière M, Barré T, De Ledinghen V; et al. Severe liver fibrosis in the HCV cure era: Major effects of social vulnerability, diabetes, and unhealthy behaviors. JHEP Reports 2022, 4, 100481.
- Kovalic AJ, Gozar M, Da BL, Bernstein D, Satapathy SK. Pharmacotherapeutic efficacy on noninvasive fibrosis progression in nonalcoholic fatty liver disease: a systematic review and network meta-analysis. European Journal of Gastroenterology & Hepatology 2023, 35, 102–11.
- Poynard T, Deckmyn O, Peta V, Paradis V, Gautier J, Brzustowski A; et al. Prospective direct comparison of non-invasive liver tests in outpatients with type 2 diabetes using intention-to-diagnose analysis. Aliment Pharmacol Ther 2023, 58, 888–902.
- Poynard T, Deckmyn O, Peta V, Sakka M, Lebray P, Moussalli J; et al. Clinical and genetic definition of serum bilirubin levels for the diagnosis of Gilbert syndrome and hypobilirubinemia. Hepatol Commun 2023, 7, e0245.
- Poynard T, Deckmyn O, Munteanu M, Ngo Y, Drane F, Castille JM; et al. Awareness of the severity of liver disease re-examined using software-combined biomarkers of liver fibrosis and necroinflammatory activity. BMJ Open 2015, 5, e010017.
- Deckmyn O, Poynard T, Bedossa P, Paradis V, Peta V, Pais R; et al. Clinical Interest of Serum Alpha-2 Macroglobulin, Apolipoprotein A1, and Haptoglobin in Patients with Non-Alcoholic Fatty Liver Disease, with and without Type 2 Diabetes, before or during COVID-19. Biomedicines 2022, 10, 699.
- Sanyal AJ, Van Natta ML, Clark J, Neuschwander-Tetri BA, Diehl A, Dasarathy S; et al. Prospective Study of Outcomes in Adults with Nonalcoholic Fatty Liver Disease. N Engl J Med 2021, 385, 1559–69.
- Poynard T, Peta V, Deckmyn O, Pais R, Ngo Y, Charlotte F; et al. Performance of liver biomarkers, in patients at risk of nonalcoholic steato-hepatitis, according to presence of type-2 diabetes. European Journal of Gastroenterology & Hepatology 2020, 32, 998–1007.
- Poynard T, Munteanu M, Deckmyn O, Ngo Y, Drane F, Castille JM; et al. Validation of liver fibrosis biomarker (FibroTest) for assessing liver fibrosis progression: Proof of concept and first application in a large population. Journal of Hepatology 2012, 57, 541–8.
- Jin S, Li S, Fang P, Pan C, Huang S. Association of hysterectomy with nonalcoholic fatty liver disease among US women. Lipids Health Dis 2024, 23, 34.
- Netanel C, Goitein D, Rubin M, Kleinbaum Y, Katsherginsky S, Hermon H; et al. The impact of bariatric surgery on nonalcoholic fatty liver disease as measured using non-invasive tests. The American Journal of Surgery 2021, 222, 214–9.
- Lassailly G, Caiazzo R, Hollebecque A, Buob D, Leteurtre E, Arnalsteen L; et al. Validation of noninvasive biomarkers (FibroTest, SteatoTest, and NashTest) for prediction of liver injury in patients with morbid obesity: European Journal of Gastroenterology & Hepatology 2011, 23, 499–506.
- Codjia T, Rebibo L, François A, Lagnel C, Huet E, Bekri S; et al. Evolution of Non-alcoholic Fatty Liver Disease (NAFLD) Biomarkers in Response to Weight Loss 1 Year After Bariatric Surgery—a Post Hoc Analysis of the FibroTest Prospective Study. OBES SURG 2021, 31, 3548–56.
- Vali Y, Lee J, Boursier J, Petta S, Wonders K, Tiniakos D; et al. Biomarkers for staging fibrosis and non-alcoholic steatohepatitis in non-alcoholic fatty liver disease (the LITMUS project): a comparative diagnostic accuracy study. The Lancet Gastroenterology & Hepatology 2023, 8, 714–25.
- Arai T, Takahashi H, Seko Y, Toyoda H, Hayashi H, Yamaguchi K; et al. Accuracy of the Enhanced Liver Fibrosis Test in Patients With Type 2 Diabetes Mellitus and Its Clinical Implications. Clinical Gastroenterology and Hepatology 2024, 22, 789–797e8.
- Bertot LC, Jeffrey GP, De Boer B, Wang Z, Huang Y, Garas G; et al. Comparative Accuracy of Clinical Fibrosis Markers, Hepascore and Fibroscan® to Detect Advanced Fibrosis in Patients with Nonalcoholic Fatty Liver Disease. Dig Dis Sci 2023, 68, 2757–67.
- Ratziu V, Massard J, Charlotte F, Messous D, Imbert-Bismut F, Bonyhay L; et al. Diagnostic value of biochemical markers (FibroTest-FibroSURE) for the prediction of liver fibrosis in patients with non-alcoholic fatty liver disease. BMC Gastroenterol 2006, 6, 6.
- Munteanu M, Tiniakos D, Anstee Q, Charlotte F, Marchesini G, Bugianesi E; et al. Diagnostic performance of FibroTest, SteatoTest and ActiTest in patients with NAFLD using the SAF score as histological reference. Aliment Pharmacol Ther 2016, 44, 877–89.
- Sanyal AJ, Jha P, Kleiner DE. Digital pathology for nonalcoholic steatohepatitis assessment. Nat Rev Gastroenterol Hepatol 2024, 21, 57–69.
Disclaimer/Publisher’s Note: The statements, opinions and data contained in all publications are solely those of the individual author(s) and contributor(s) and not of MDPI and/or the editor(s). MDPI and/or the editor(s) disclaim responsibility for any injury to people or property resulting from any ideas, methods, instructions or products referred to in the content. |
© 2025 by the authors. Licensee MDPI, Basel, Switzerland. This article is an open access article distributed under the terms and conditions of the Creative Commons Attribution (CC BY) license (http://creativecommons.org/licenses/by/4.0/).
Copyright: This open access article is published under a Creative Commons CC BY 4.0 license, which permit the free download, distribution, and reuse, provided that the author and preprint are cited in any reuse.


