
Submitted:
25 March 2025
Posted:
26 March 2025
You are already at the latest version
Abstract
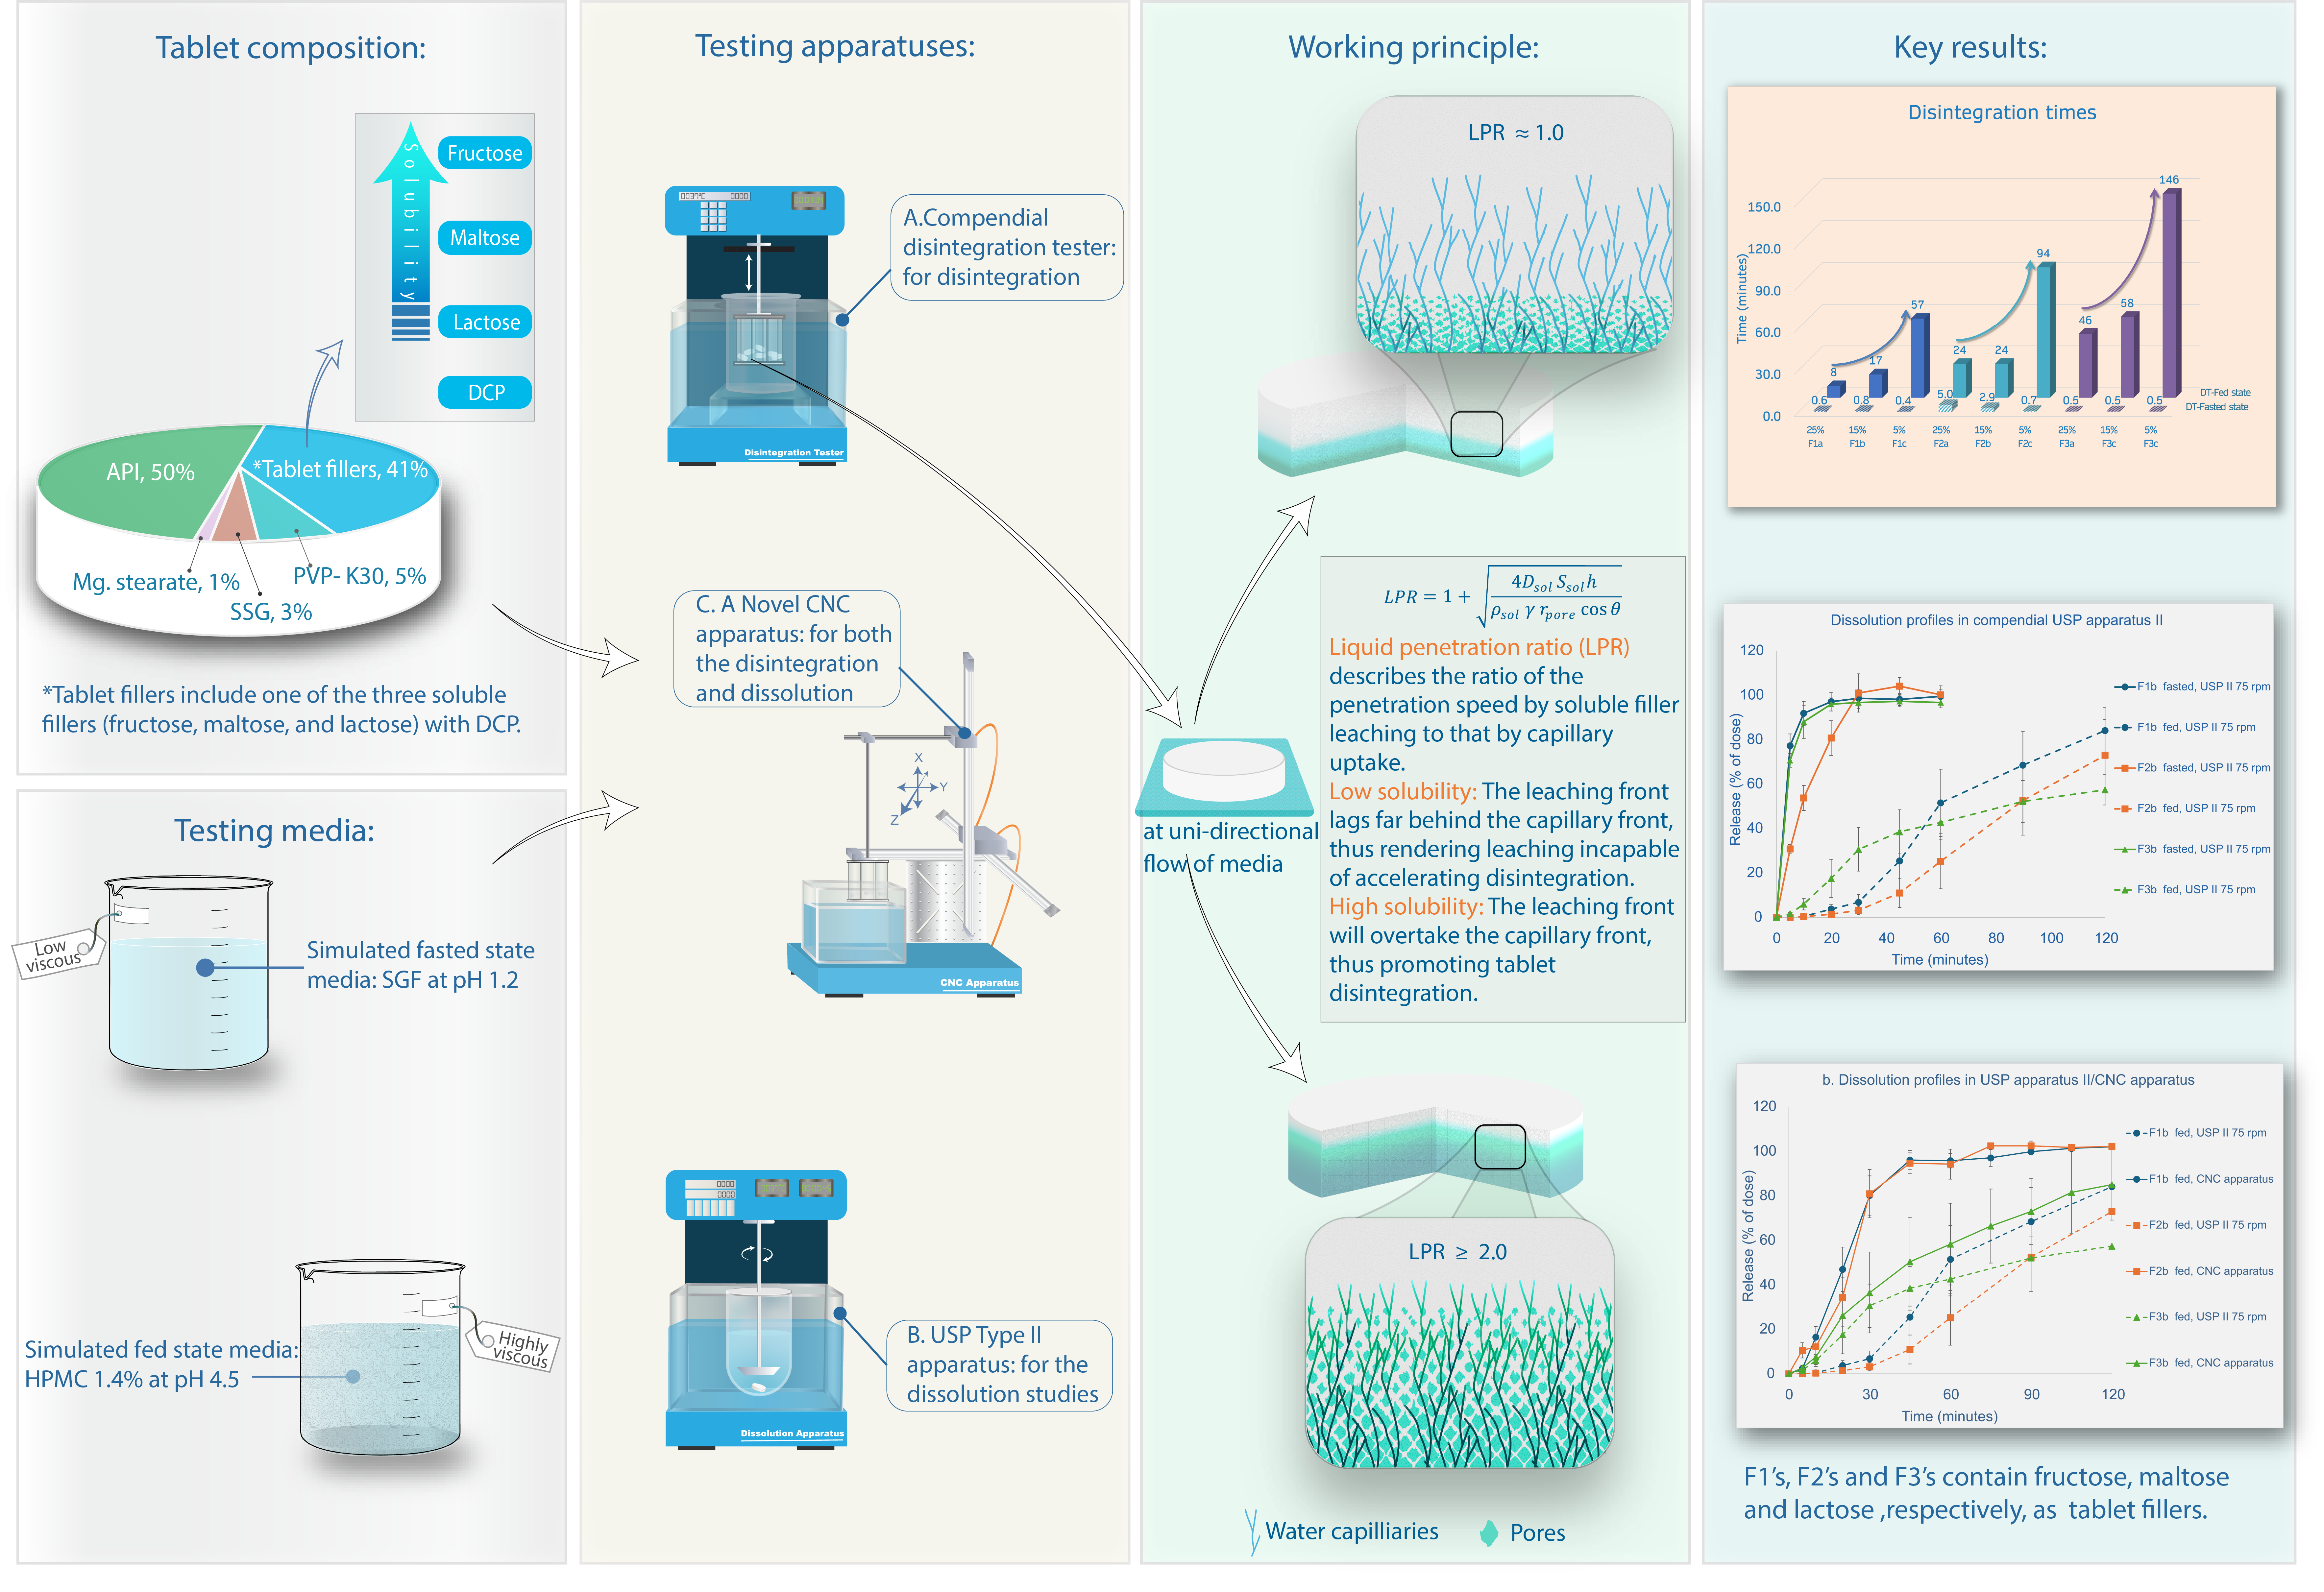
The food-induced viscosity of the media can alter tablet disintegration and eventually the release of the drug. The extent of this retardation depends on tablet formulation factors such as the solubility of excipients. Objectives: This research aimed to study the effect of filler solubility on the disintegration and dissolution performances of tablets in different testing conditions. Methods: Tablet formulations containing acetaminophen as a model compound, mixtures of different ratios of fillers, and other excipients were directly compressed using uniform manufacturing parameters. The formulations were investigated under simulated viscosity of fasted and fed state conditions inspired by a Liquid Penetration Ratio (LPR) theoretical framework. The disintegration and dissolution tests were performed in both compendial and novel testing apparatuses. Results: Soluble fillers in the tablets affected the disintegration and dissolution in simulated fed state media but only marginally under fasted conditions. The testing devices showed partially contrasting results based on the hydrodynamics of the testing media. The novel CNC (computed numerical control) apparatus offered 3D-motion and effectively exposed tablets to the viscous testing media, in contrast to the compendial paddle apparatus. Conclusions: This study explored the impact of filler solubility on tablet disintegration and dissolution performances. As envisaged by the LPR framework, higher filler solubility has positive effects on tablet disintegration and dissolution performance in viscous conditions. Additionally, soluble filler proportion is also inversely correlated with disintegration time. Further investigation of the formulation parameters as well as the testing conditions would provide additional insights into the food effects on the tablets.
Keywords:
food effect
; tablet fillers
; solubility
; media viscosity
; fed state
; water uptake
; porosity
; disintegration
; dissolution
1. Introduction
Immediate release (IR) oral solid dosage forms constitute a majority of products available on the pharmaceutical market. As of 2017, IR products held a market share of 57.9% [1]. As for product approval frequency, IR oral products accounted for about 46% [2] of all new drug applications approved by the US FDA between 1938 and 2022. This large and important group of pharmaceutical products includes many different formulations. However, a common denominator for these IR products is a desired quick effect onset. This is oftentimes governed by liberation of active pharmaceutical ingredient (API) from the dosage form by disintegration and dissolution processes. For IR formulations, disintegration and dissolution are highly correlated and distinct processes that serve as the basis for releasing the API [3]. Disintegration of a tablet can be defined as the breakup of compacts into small fragments, which undergo conformational changes upon exposure to a liquid medium [4]. This process represents the initial stage in the cascade of bioavailability, facilitating the breakdown of the tablet into fragments that enable rapid drug dissolution [5]. A faster disintegration of the tablet can shorten release time of the API by a rapid increase of its contact area with the surrounding medium. Conversely, any delay in the disintegration process can have detrimental effects on the overall drug release. Some researchers performed disintegration tests to assess such a quality of the tablets which provided information about the time it took for tablets to disintegrate in a given medium [6,7].
When formulating a tablet product, the goal is to achieve optimal disintegration and dissolution performance with satisfactory physical and chemical stability as well as process reproducibility. However, most, if not all, APIs cannot reach these objectives on their own. Consequently, multiple excipients are incorporated into the formulation to enable the fulfillment of those objectives [8]. The effective disintegration of tablets is contingent upon various factors such as composition, API characteristics, and the hydrophilic and hydrophobic nature of the incorporated excipients, which collectively govern the disintegration process and subsequent dissolution. Among the excipients, tablet fillers, which comprise a significant proportion of the tablet formulation, play a crucial role in facilitating the disintegration mechanism [9]. The efficacy of the disintegrant in tablets, and thus its ability to exert its intended effect, relies on the accessibility of water to the disintegrant within the tablet, which is influenced by the properties of the filler and disintegrant component [10]. In this study, fillers with different water solubilities are incorporated into tablet formulations to investigate their effects on the disintegration and dissolution performance.
When testing the properties of tablets in vitro, the choice of media is a crucial consideration, as numerous factors could influence the physico-chemical processes that lead to tablet breakdown. Various options exist which range from simply using hydrochloric acid (HCl) solutions to incorporating buffer systems and bile salts in complex commercial products. Regardless of the media selected, the key objective is to simulate relevant properties of physiological gastrointestinal fluids. In particular, testing in a simulated fed state may need different approaches with the consideration that physico-chemical properties (such as pH and lipophilicity) of the selected media can impact the solubility of specific substances. Previous studies utilized a blended mixture resembling a typical US-American breakfast (FDA standardized high fat meal) to mimic postprandial stomach content of highly viscous chyme [11]. To convey the desired rheological properties, a hydroxypropyl methylcellulose-based media was developed to simulate the fed state conditions. The simulated fed state media were utilized in various testing methods, including studies on compendial disintegration and dissolution devices. Furthermore, a novel apparatus, derived from the Novel Disintegration Apparatus described by Kindgen, Ruiz-Picazo et al., was optimized to accommodate highly viscous media [12,13]. In this investigation, the capabilities of the apparatus were extended to obtain dissolution profiles, providing a comprehensive characterization of tablet performance under these conditions.
The Washburn equation describes the progress of fluid in a capillary system [14]:
where L in Eq. 1 is the penetrating length at time t, r is the average pore radius, θ is the contact angle, η and γ are the viscosity and surface tension of the media, respectively. Hence its significance in the penetration of the media into the pore network of tablets becomes evident, facilitating wetting and subsequent dissolution. Viscosity is one parameter included in this equation. To anticipate the impact of soluble components in the tablet formulation under fed conditions, a theoretical framework titled the Liquid Penetration Ratio (LPR) was employed. This approach takes into account the properties of both the tablet ingredients and the testing media to predict their impact on the dissolution process.
2. Materials and Methods
Materials
The tablet formulations were prepared using acetaminophen (Quality according to European Pharmacopeia Ph. Eur. 8.0, Caesar&Loretz GmbH, Germany) as a model API. Different tablet fillers were selected based on the degree of solubility in water (Table 1). Fructose (Fagron GmbH & Co. KG, Barsbuettel Germany), lactose monohydrate (Tablettose 80 MEGGLE GmbH & Co. KG, Wasserburg am Inn Germany), maltose (Advantose 100, SPI Pharma Septemes-Les Vallons, France), microcrystalline cellulose (MCC, Vivapur® 102, JRS Pharma, Rosenberg Germany), dicalcium phosphate dihydrate (DCP, Emcompress®, JRS Pharma, Rosenberg Germany) were used in different combinations. Polyvinyl pyrrolidone K30 (PVP K30, Carl Roth GmbH + Co. KG, Germany) as a tablet binder, sodium starch glycolate (SSG, Primojel®, DFE Pharma, Goch Germany) as a superdisintegrant, and magnesium stearate (Sigma-Aldrich Chemie GmbH, Steinheim Germany) as a lubricant. Hydroxypropyl methylcellulose E4M (HPMC, Fagron GmbH & Co. KG, Germany) was used in preparation of simulated fed state media along with sodium acetate and acetic acid as a buffer. HCl, sodium chloride (NaCl) and sodium hydroxide (NaOH) of analytical grade were used in the study.

Table 1.
Formulation design and filler solubility.
| Formulation Code | Percentage content of soluble fillers and DCP, total of 30 % | |||||
|---|---|---|---|---|---|---|
| Fructose | Maltose | Lactose | Valine | Acetaminophen | DCP | |
| F1a | 25 | -- | -- | -- | -- | 5 |
| F1b | 15 | -- | -- | -- | -- | 15 |
| F1c | 5 | -- | -- | -- | -- | 25 |
| F2a | -- | 25 | -- | -- | -- | 5 |
| F2b | -- | 15 | -- | -- | -- | 15 |
| F2c | -- | 5 | -- | -- | -- | 25 |
| F3a | -- | -- | 25 | -- | -- | 5 |
| F3b | -- | -- | 15 | -- | -- | 15 |
| F3c | -- | -- | 5 | -- | -- | 25 |
| F4 | -- | -- | -- | 25 | -- | 5 |
| F5 | -- | -- | -- | -- | 25 | 5 |
| Water solubility g/L |
1080 [16] |
520 [17] |
230 [18] |
65 [19] |
24 [20] |
Considered insoluble |
All the formulations contain acetaminophen (50%), MCC (11%), PVP K30 (5%), SSG (3%), and magnesium stearate (1%).
Tablet Formulation
The model drug acetaminophen and excipients for each formulation as shown in Table 1 were weighed, sieved through mesh size of 0.8 mm, and blended in a laboratory mixer (Turbula, Willy A. Bachofen AG, Switzerland) for ten minutes at 34 rpm. Magnesium stearate as a lubricant was sieved through mesh size 0.4 mm, added to the mixture and blended further for two more minutes. Per individual formulation, fifty units of round, flat faced tablets with a constant weight of 650 mg for each formulation were directly compressed using a 13 mm die and punches in a manual hydraulic press (SPECAC GS15011 Hydraulic press, UK) with a compression force of 4 tons and a dwell time of 20 secs. The tablet weight after compression was recorded with a weight balance (Mettler PM1200 Giessen, Switzerland). The compressed tablets were given a relaxation time of at least 24 hours and kept dark in closed plastic containers at room temperature. In addition to formulation listed in Table 1, two more formulations were prepared using 25% acetaminophen and valine as “fillers” to further study the solubility effect on the disintegration time (DT).
Testing Media Composition
The tablets from each formulation were subjected to testing in simulated fasted state medium and simulated fed state medium [6,15]. The simulated fasted state medium consisted of a pH 1.2 aqueous solution (prepared by dissolving 2.92 g NaCl in deionized water and adjusting the pH to 1.2 using 1 N HCl, with a final volume of 1.0 L). For the simulated fed state medium, in order to simulate the viscosity of food in the fed state, a 1.4 % solution of HPMC E4M at pH 4.5 was prepared. This entailed dispersing 14.0 g of HPMC E4M in 400 mL preheated water (80°C) on a magnetic stirrer with a heat plate. To this solution, 50 mmol of acetate buffer was added, prepared by dissolving 1.846 g of sodium acetate and 1.651 g of acetic acid in 100.0 mL deionized water. The pH of the solution was then adjusted to 4.5 using 1 N HCl or 1 N NaOH, and the final volume was adjusted to 1000.0 mL with deionized water.
Tablet Hardness Measurements
Tablet hardness was determined in a motorized hardness tester (PharmaTest PTB-M Hainburg, Germany), which measured the force needed to disrupt the tablet by longitudinally crushing it between the two platens. The measurements were repeated in triplicates.
Disintegration Test
Compendial Disintegration Test Under Simulated Fasted State Conditions
The disintegration test in compliance with the USP was performed for all the tablet formulations in a compendial disintegration tester (SOTAX DT2, Germany) using a six tube basket without disks in 800 mL of testing media at 37 oC. Two different testing media were employed, simulated fasted state medium and simulated fed state medium. The DT for each tablet was recorded visually at a point where no residue was left on the screen. The DT were reported as mean ± standard deviation (n=6).
CNC Disintegration Test Under Simulated Fed State Conditions
A disintegration test was performed using a modified novel disintegration tester as developed and applied previously at the Johannes Gutenberg University Mainz [12,13]. By means of a CNC device, the samples were agitated in a circular, three-dimensional motion pattern with a velocity of 80 mm/s. Three tablets were tested in parallel. The testing volume was 1500 mL at a temperature range of 37 ± 1°C. The disintegration determination was performed visually, considering when no solid residue was left inside the mesh compartment. The DTs were recorded as mean ± standard deviation (n=3).
Selected formulations containing 15 % of the soluble fillers were tested in the novel CNC apparatus (F1b, F2b, F3b).
Dissolution Studies
Dissolution Testing in Compendial Device Under Simulated Fasted and Fed State Conditions
A USP apparatus II was used for the dissolution studies for all tablet formulations containing 15% of soluble fillers (F1b, F2b, F3b). A total of 500 mL of the fasted or fed state media respectively was used in each vessel at a temperature of 37 ± 0.5oC. Fasted state medium was degassed. The rotation speed for both the fasted and fed state media was set to 75 rpm. Five ml samples were taken manually at specific time points: 5, 10, 20, 30, 45, 60 minutes for both fasted and fed conditions and additionally 90 and 120 minutes for fed state conditions. Samples were filtered by syringe filters (PES, 5µm; Macherey-Nagel GmBH&Co.KG, Germany). Media loss by sampling was not replaced but taken in regard during results evaluation. Sink conditions were still maintained. Samples were analyzed by UV spectrophotometry. The results were reported as percentage release of the total nominal acetaminophen dose (325 mg) with the mean ± standard deviation (n=6).
Dissolution Testing in CNC Device Under Simulated Fed State Conditions
In the novel modified CNC apparatus, dissolution testing was performed analogously to the disintegration test. Tablet formulations containing 15 % of soluble fillers (F1b, F2b, F3b) were investigated. For dissolution studies, three tablets each were used in a pooled dissolution setup. This was performed in triplicate.
During the course of the dissolution testing, the DT was obtained simultaneously. Additionally, 5 ml samples were taken manually at specific time points: 5, 10, 20, 30, 45, 60, 75, 90, 105, and 120 minutes.
Samples were filtered by syringe filters (PES, 5µm; Macherey-Nagel GmBH&Co.KG, Germany). Media loss by sampling was not replaced but factored during results evaluation. Sink conditions were still maintained. Samples were analyzed by UV spectrophotometry. The results were reported as percentage release of the total nominal dose (3 x 325 mg), with the mean ± standard deviation (n=3).
Analytics
Acetaminophen content in dissolution experiment samples was determined by UV spectrophotometry. The samples were properly diluted for analysis with deionized water and homogenized by a vortex shaker. The solution was left to settle foam for 20 min and then measured (UV-6300PC), using UV compatible single use plastic cuvettes (Carl Roth GmbH + Co. KG, Germany) at a wavelength of 242 nm.
The analytical method was validated according to the ICH Guideline “ICH Q2(R2) Validation of analytical procedures.” Table 2 provides the method parameters. The standard solution was spiked with HPMC to account for the possible matrix effects.
Table 2.
Method validation of the acetaminophen UV quantification.
| Parameter | Value |
|---|---|
| Absorption wavelength | 242 nm |
| Linear range | 1 - 14 µg/mL |
| Calibration curve R2 Slope Intercept |
1.000 0.0634 -0.0001 |
| Limit of detection | 0.09 µg/mL |
| Limit of quantification | 0.26 µg/mL |
| Intraday precision (triplicate) 4.0 µg/mL 8.0 µg/mL 12.0 µg/mL |
± 0.68 % relative standard deviation (RSD) ± 0.23 % RSD ± 0.53 % RSD |
| Interday precision (8.0 µg/mL at three consecutive days) |
± 0.34 % RSD |
Porosimetry
Porosity and bulk density of F1b, F2b, F3b samples were investigated by Mercury Intrusion Porosimetry, using a Pascal 140/440 mercury porosimeter system (Microtrac Retsch GmbH, Germany). Mercury had a purity of >99.9995 % and was obtained from GMR Gesellschaft für Metallrecycling mbH, Germany. CD3 type dilatometers were used with a filling volume of 450 mm³. The measuring sequence was 0-400-0 MPa with both an increase and decrease speed of 6-19 MPa/min. The test was performed with an entire tablet each as a sample. The results were corrected for compressibility and evaluated using the software SOLID v.1.6.6., applying a cylindrical and plate model.
Working Principle – Liquid Penetration Ratio (LPR)
The impact of fillers based on their water solubility was evaluated under simulated fasted and fed state conditions. The hypothesis serves as a metric to elucidate the ratio between penetration rates achieved by two mechanisms: capillary and leaching fronts. It postulates that the delayed disintegration observed under fed state conditions could be attributed to the elevated viscosity of the media, thereby delaying the capillary absorption of fluid into the tablet. The principal mechanism of water penetration in fasted conditions resembled capillary uptake through the pore network, analogous to water permeation through blotting paper.
Equation (2) is a differentiated form of the Washburn equation (1), where : viscosity of the media; is media surface tension; : contact angle; : effective pore radius; : penetration length at time t.
The spatial distribution of the soluble particles can be conceptualized as a network of interconnected pores traversing the tablet (as long the soluble filler level in the tablet exceeds the percolation threshold). The infiltration of the surrounding medium through this network can be mathematically represented by employing Fick's first law of diffusion, as elucidated below.
where Msol is the mass of the solute being diffused, Asol is its surface area, Dsol is the diffusion coefficient, Ssol is solute solubility and Ldiss is the dissolution penetration length at time t.
Dividing Equation (3) by density:
where Vsol represents volume of the solute and ρsol its density.
Separating the variables of Equation (4), integrating, and applying boundary conditions at time ‘zero’ and time ‘t’ gives:
The rearrangement of the Equation (5) gives:
Now by differentiating Equation (6) it gives:
The water-filled cavities formed by the leaching of the soluble filler correspond to the respective filler particle size, which is typically much larger than the pore size. Therefore, the leaching front can be viewed as pushing the capillary front forwards, as the leaching front shortens the distance over which capillary action is drawing water (effectively drawing it from the nearer leached cavities rather than from the more distant bulk medium). Accordingly, the L in the Washburn equation can be named Lcap (capillary penetration length). Therefore, the sum of Ldiss (dissolution front length) in equation (7) and Lcap (2) together form the total penetration distance Ltotal
Equation (8) shows that medium advances by the leaching of soluble ingredients. Dividing by the differential form of Washburn’s equation to get the ratio to the medium advanced by capillary action.
In equation (9) Dsol is the diffusion coefficient of the soluble ingredient, Ssol is solubility, is the viscosity of the medium, ρsol is true density of soluble filler, γ is surface tension of the media, rpore effective pore radius of the tablet, θ represents the contact angle between penetrating media and tablet.
This theoretical framework can predict general trends in disintegration performance. Based on equation (9), the presence of a highly soluble filler will be expected to enhance the penetration of the tablet by the medium and accordingly leading to quicker disintegration. This would be particularly true under high viscosity conditions where capillary uptake is suppressed which leaves soluble component leaching as a major water uptake mechanism (more details in the discussion).
3. Results
Disintegration Times and Tablet Properties
Table 3 summarizes the DT in different apparatuses (compendial vs CNC) under different conditions (fasted and fed). The tablet weight and hardness for all the formulations were also evaluated. Tablet weight was recorded after the compression. The hardness varied among the formulations as each filler and quantity result in different properties under tablet compression.
Table 3.
General properties and DTs of the tablet formulations.
| Formulation Code | DT-fasted state compendial app., Mean ± SD (n=6) (minutes) |
DT-fed state compendial app., Mean ± SD (n=6) (minutes) |
DT-fed state CNC app., Mean ± SD (n=3) (minutes) |
Tablet weight, Mean ± SD (n=3) (mg) |
Tablet hardness, Mean ± SD (n=3) (N) |
|---|---|---|---|---|---|
| F1a | 37 ± 07 | 08 ± 01 | -* | 650 ± 05 | 64 ± 04 |
| F1b | 47 ± 05 | 17 ± 02 | 48 ± 03 | 651 ± 05 | 76 ± 02 |
| F1c | 26 ± 02 | 57 ± 04 | -* | 648 ± 03 | 92 ± 05 |
| F2a | 301 ± 19 | 24 ± 01 | -* | 653 ± 03 | 113 ± 02 |
| F2b | 172 ± 23 | 24 ± 02 | 57 ± 07 | 649 ± 05 | 87 ± 05 |
| F2c | 42 ± 03 | 94 ± 02 | -* | 649 ± 02 | 78 ± 02 |
| F3a | 31 ± 02 | 46 ± 01 | -* | 653 ± 01 | 91 ± 06 |
| F3b | 32 ± 02 | 58 ± 03 | 152 ± 06 | 650 ± 02 | 88 ± 02 |
| F3c | 32 ± 02 | 146 ± 03 | -* | 650 ± 02 | 91 ± 04 |
| F4 | 88 ± 04 | 71 ± 01 | -* | 649 ± 01 | 76.10 ± 2.3 |
| F5 | 19 ± 2 | 245 ± 09 | -* | 649 ± 01 | 40.73 ± 2.5 |
*Values were not obtained in CNC apparatus.
Fasted State Conditions
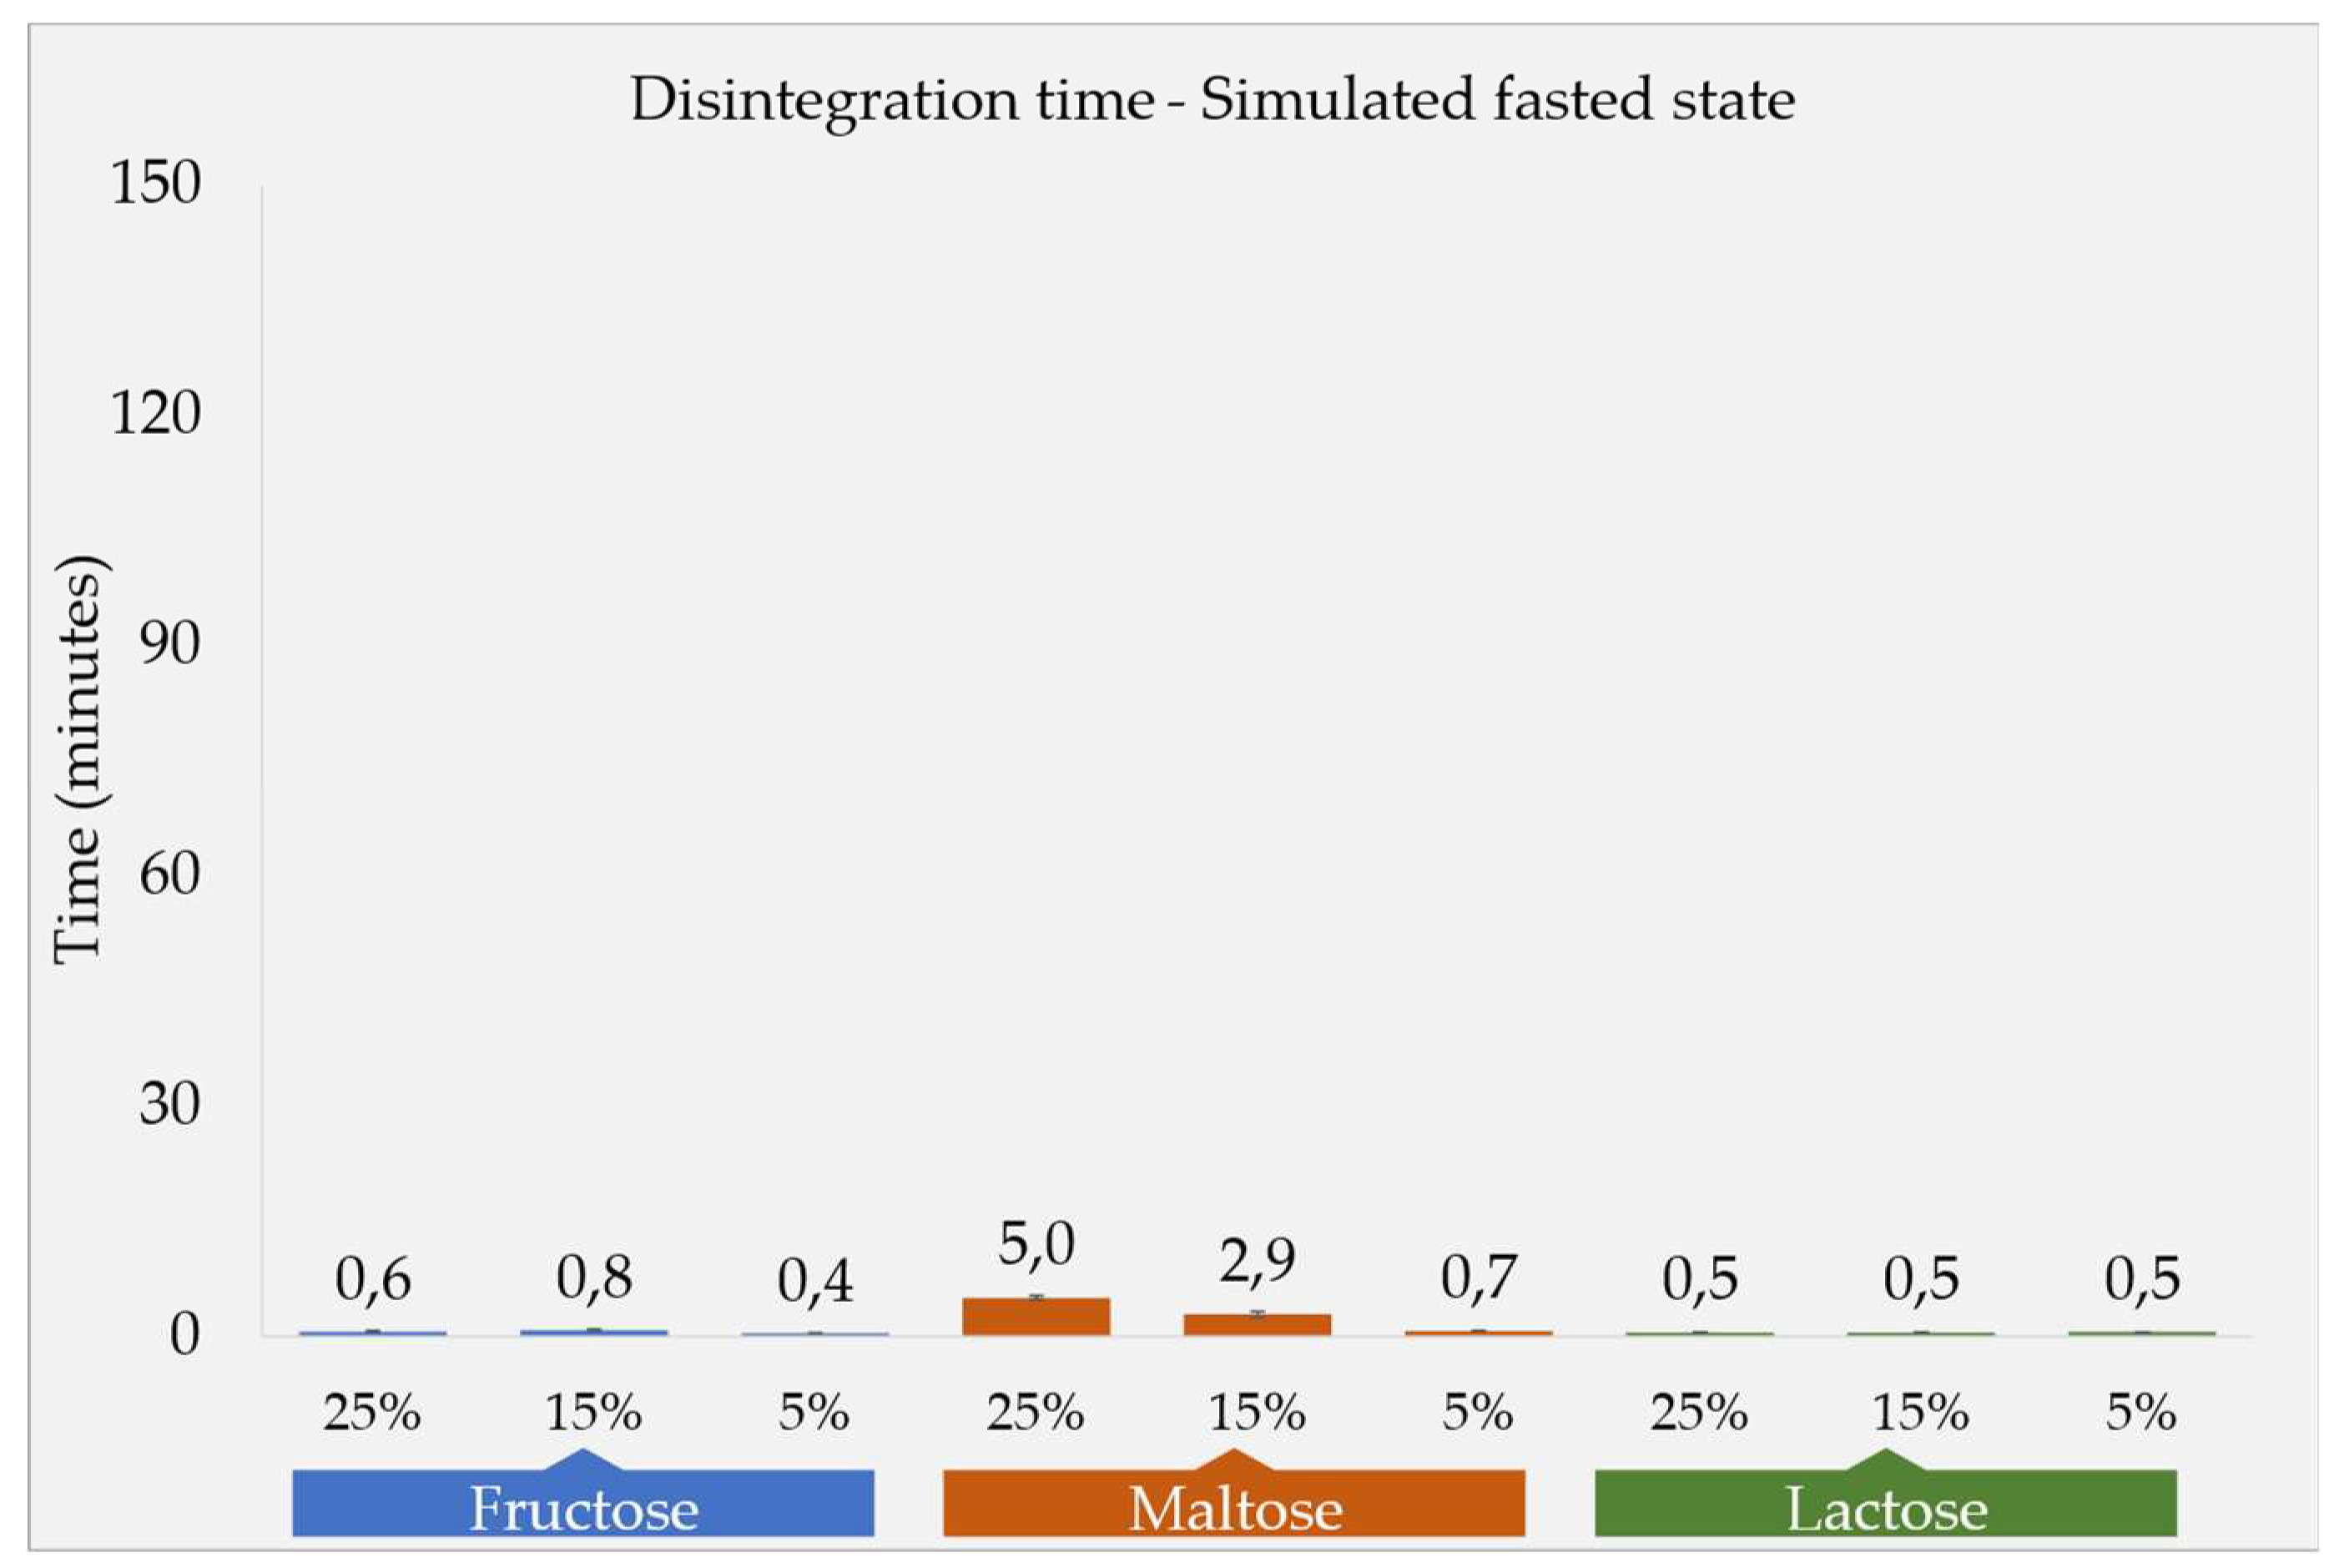
The DT results are depicted in Figure 1a. The selection of fillers in the tablet formulation was guided by their respective water solubilities. Fructose, exhibiting a high solubility of 1080 g/L in water, was followed by maltose (520 g/L) and lactose monohydrate (230 g/L). Observations under fasted state conditions (low viscous similar to water [11] revealed that all formulations showed quick DT at a maximum of five minutes. Maltose based formulations (F2a, F2b and F2c) had a relatively prolonged DT compared to the fructose- and lactose-based formulations. Moreover, an increase in the proportion of maltose in the tablets was found to correlate with an extended DT, as well as tablet hardness. In contrast, the concentration of fructose and lactose fillers in the tablets did not exhibit a significant impact on the DT. This section may be divided by subheadings. It should provide a concise and precise description of the experimental results, their interpretation, as well as the experimental conclusions that can be drawn.
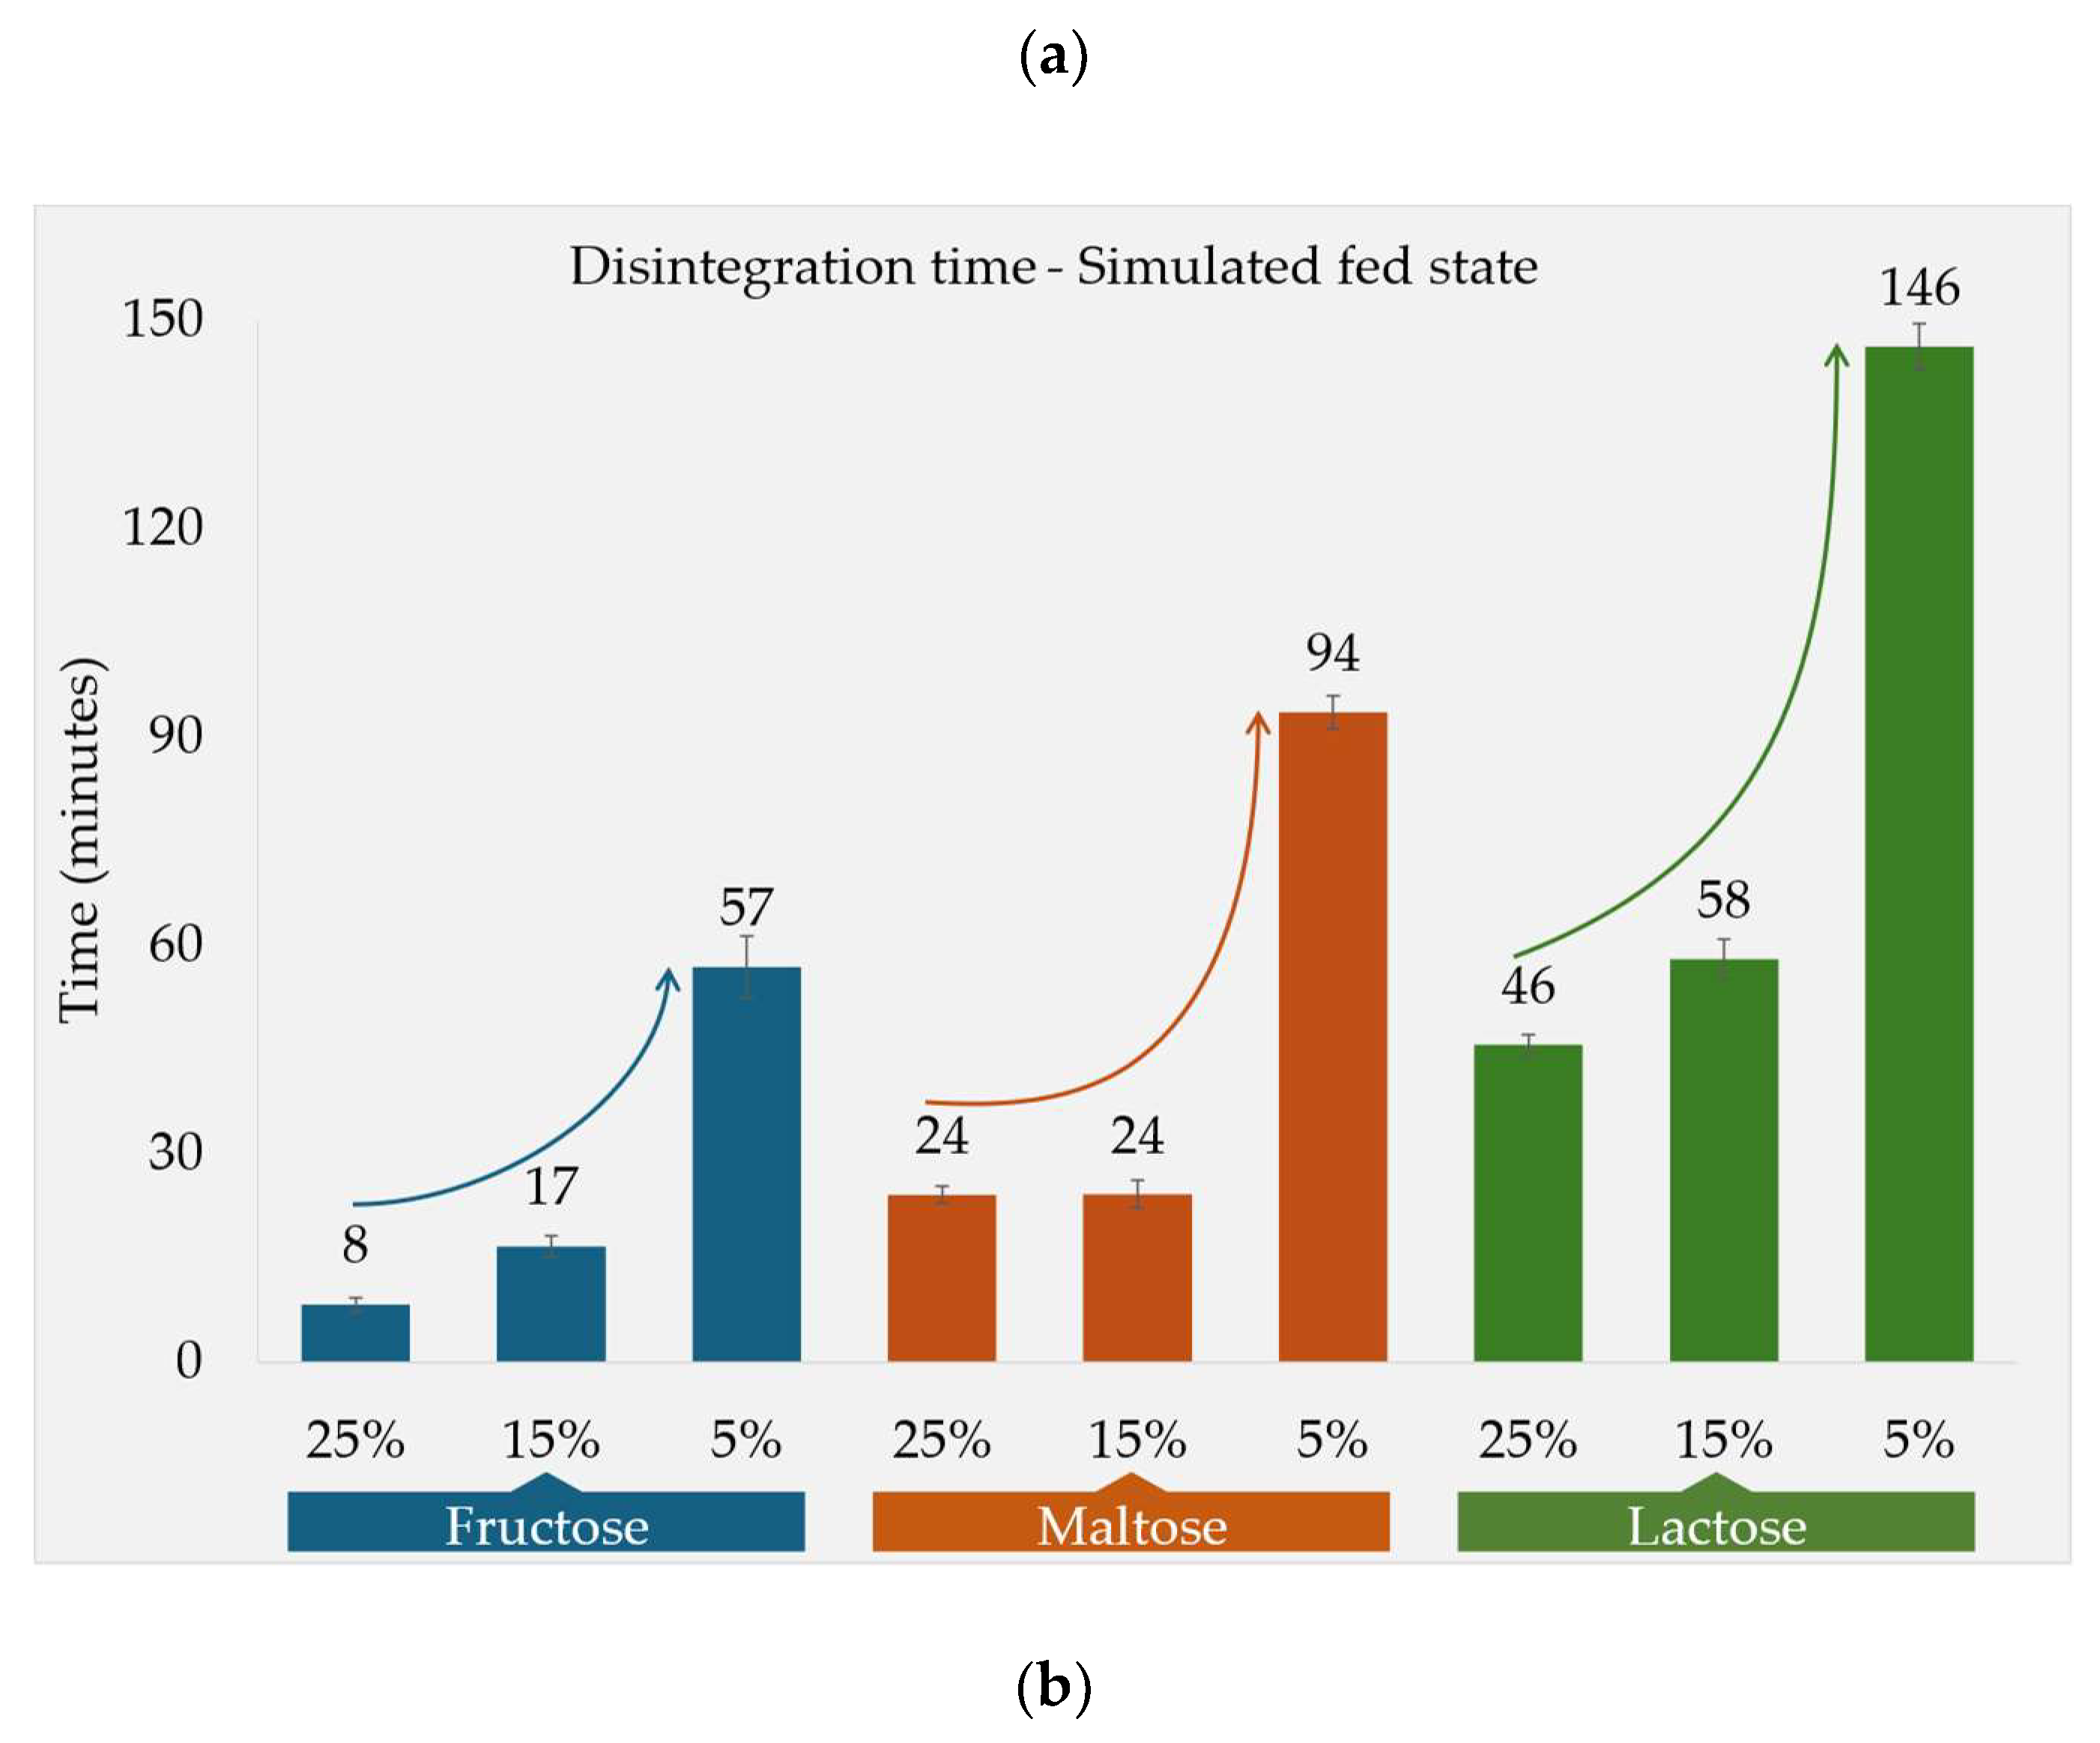
Figure 1.
DTs in compendial apparatus; a. in simulated fasted state media, b. in simulated fed state media.
Figure 1.
DTs in compendial apparatus; a. in simulated fasted state media, b. in simulated fed state media.
Fed State Conditions
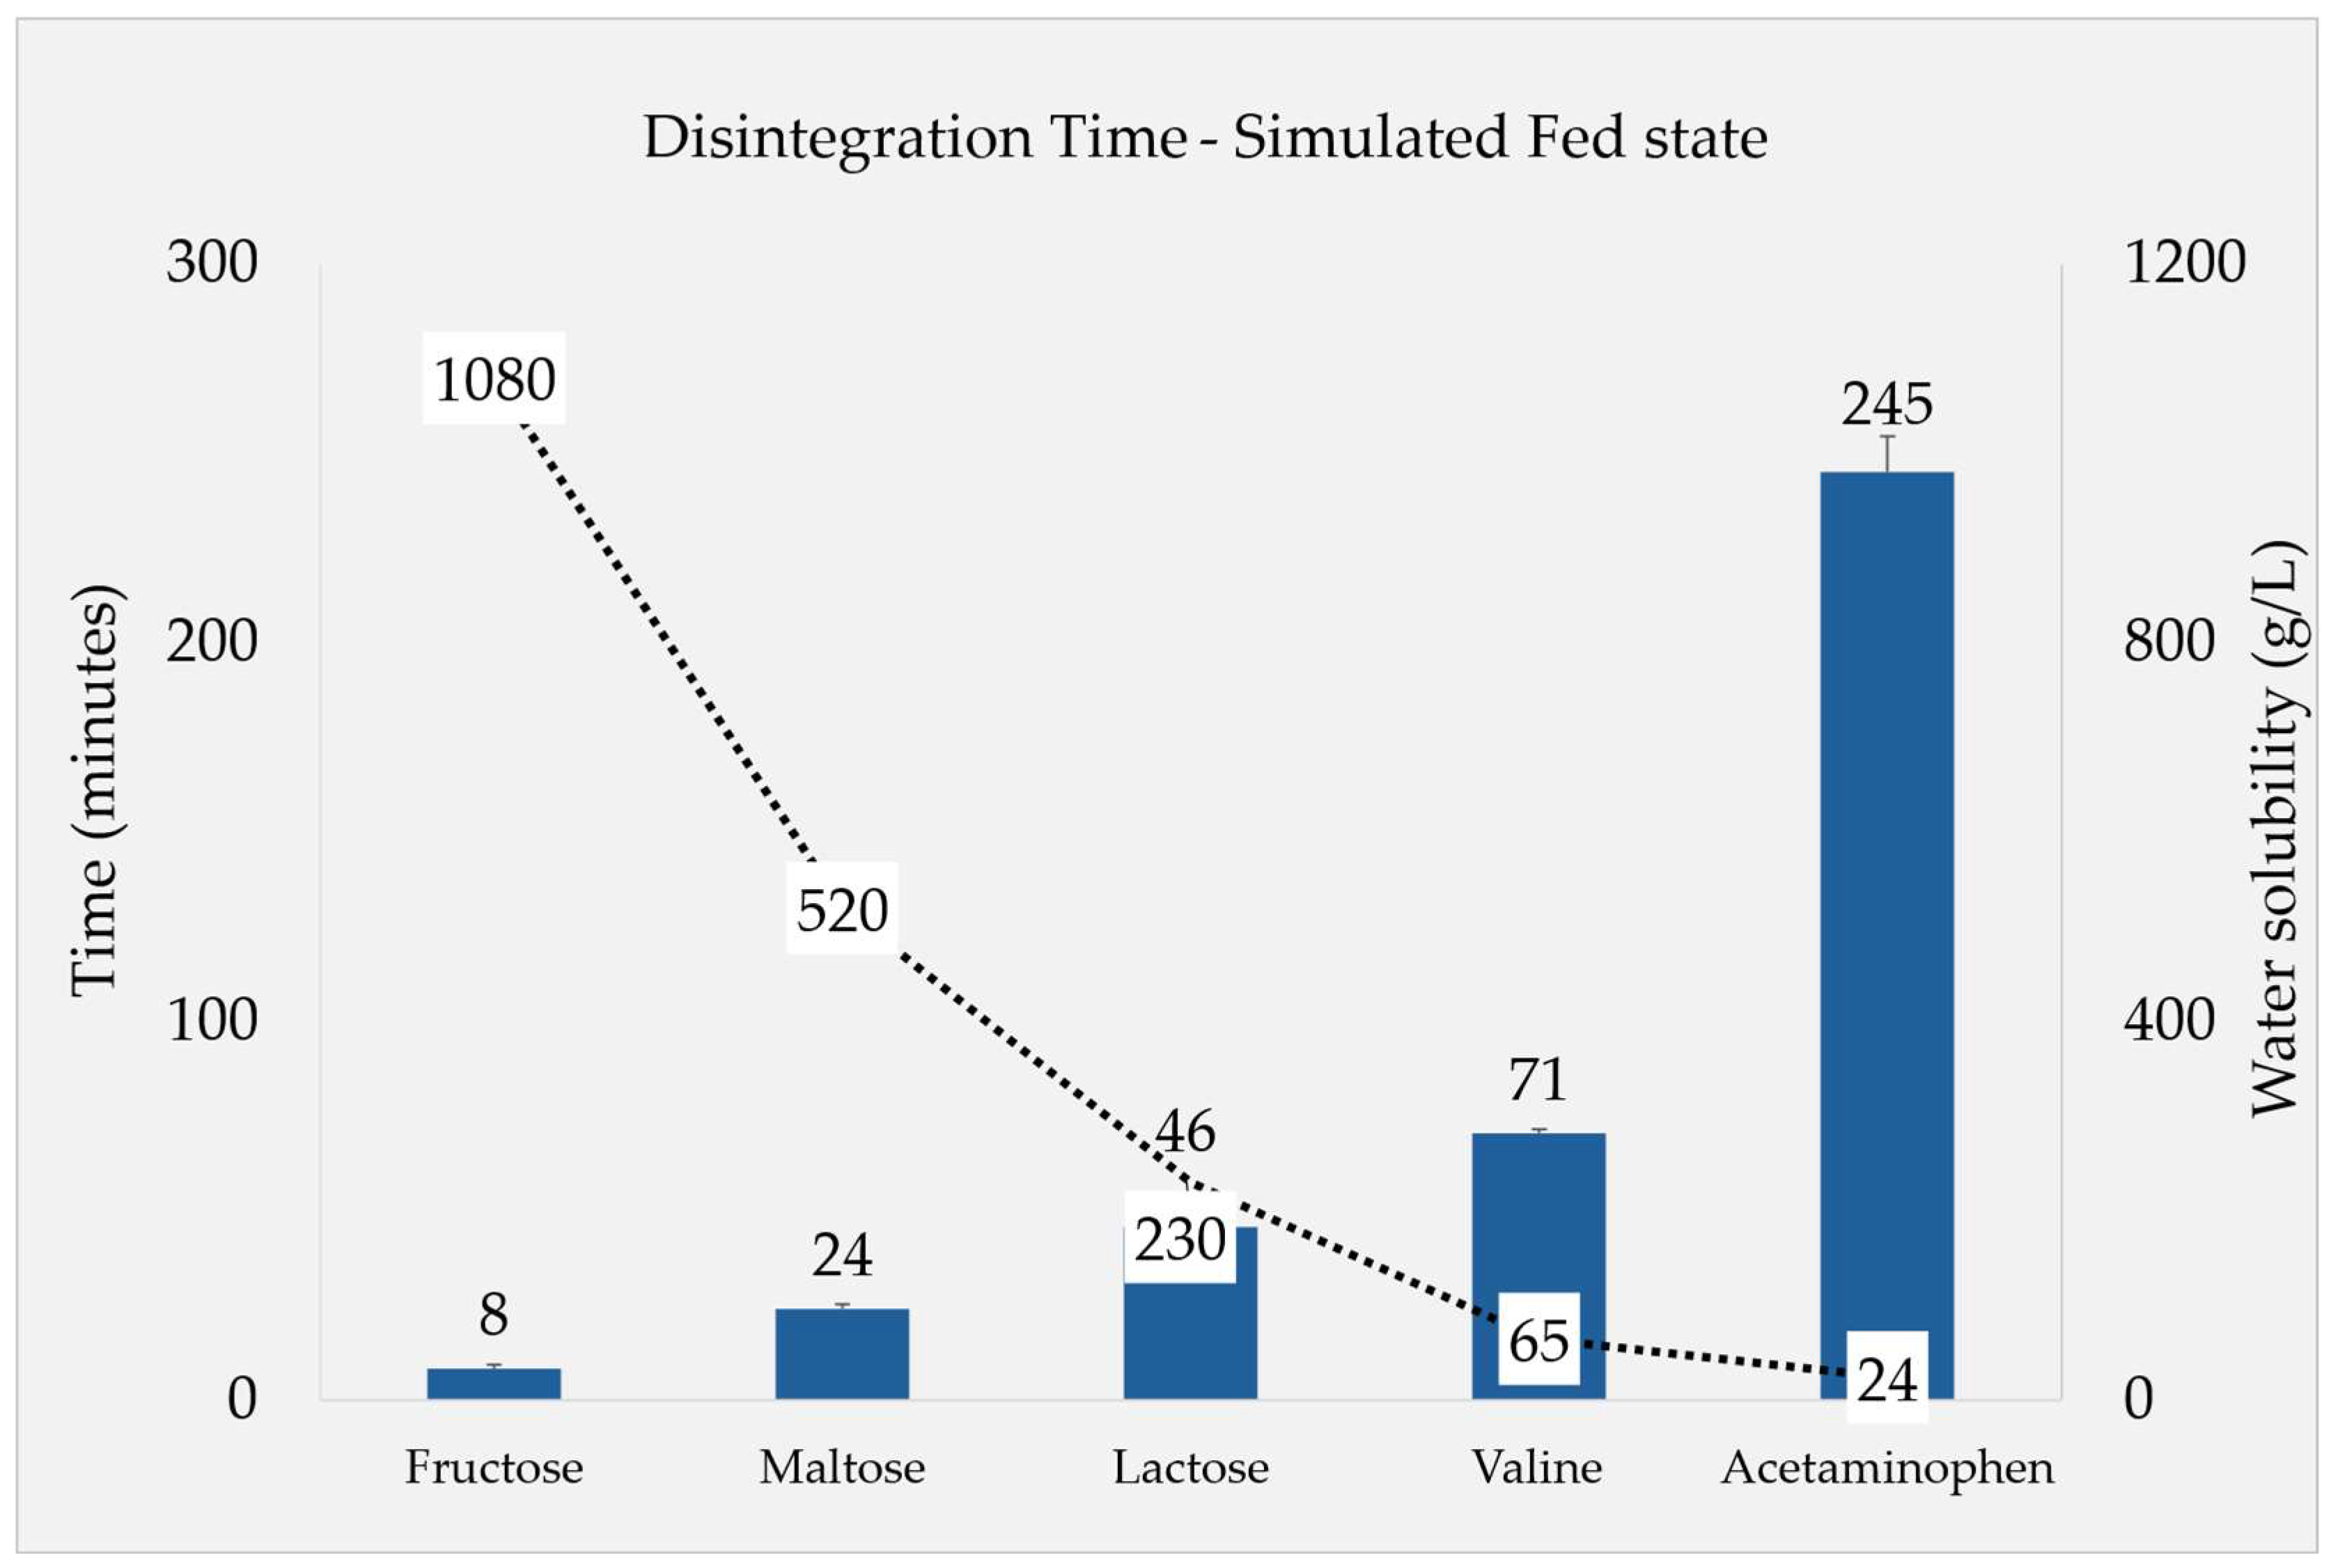
The DT under simulated fed state conditions was found to be significantly influenced by the solubility of each filler. In order to study the effect of filler solubility against DT, besides fructose, maltose and lactose, valine (65 g/L) and (additional) acetaminophen (24 g/L) were incorporated based on their solubility and regarded as filler in this experiment.
The results from compendial apparatus tests depicted in Figure 2 highlight a clear trend connecting DT reciprocally with the increasing solubility of the filler throughout the five tested substances. Since the solubility of valine and acetaminophen is less in water, the increase in the DT in these additional formulations can be observed.
Figure 2.
DTs of fillers with different aqueous solubility: all of the formulations contained fillers (25%) with an extended study using Valine and Acetaminophen (n=6, Ave ± SD).
Figure 2.
DTs of fillers with different aqueous solubility: all of the formulations contained fillers (25%) with an extended study using Valine and Acetaminophen (n=6, Ave ± SD).
Moreover, the percentage of the filler in the tablet impacted the DT, which was examined for fructose, maltose, and lactose. The higher percentage of the fillers resulted in shorter DTs for all three substances (Figure 1b). Fructose (F1), being the most soluble of the fillers, provided the shortest DT compared to other fillers at all the three respective concentration levels. In the case of formulations F2a and F2b, where maltose constituted 25% and 15%, respectively, the DT remained the same as 24 minutes. However, formulation F2c, containing only 5% maltose, demonstrated a notably longer DT of 94 minutes. Overall, the F2 DTs were between the other two fillers at the three respective concentration levels. Lactose monohydrate (F3), a tablet filler extensively employed in industry, also demonstrated a disposition of reducing the DT as its concentration in the tablet increased. In comparison to other soluble fillers, lactose exhibited lower solubility, consequently leading to the longest DT among the three fillers for all the respective concentrations. Formulation F3c, comprising 5% lactose, showed the longest DT of 146 ± 03 minutes among all formulations under fed state media. Notably, the DT also displayed an inverse relationship with both filler solubility and concentration.
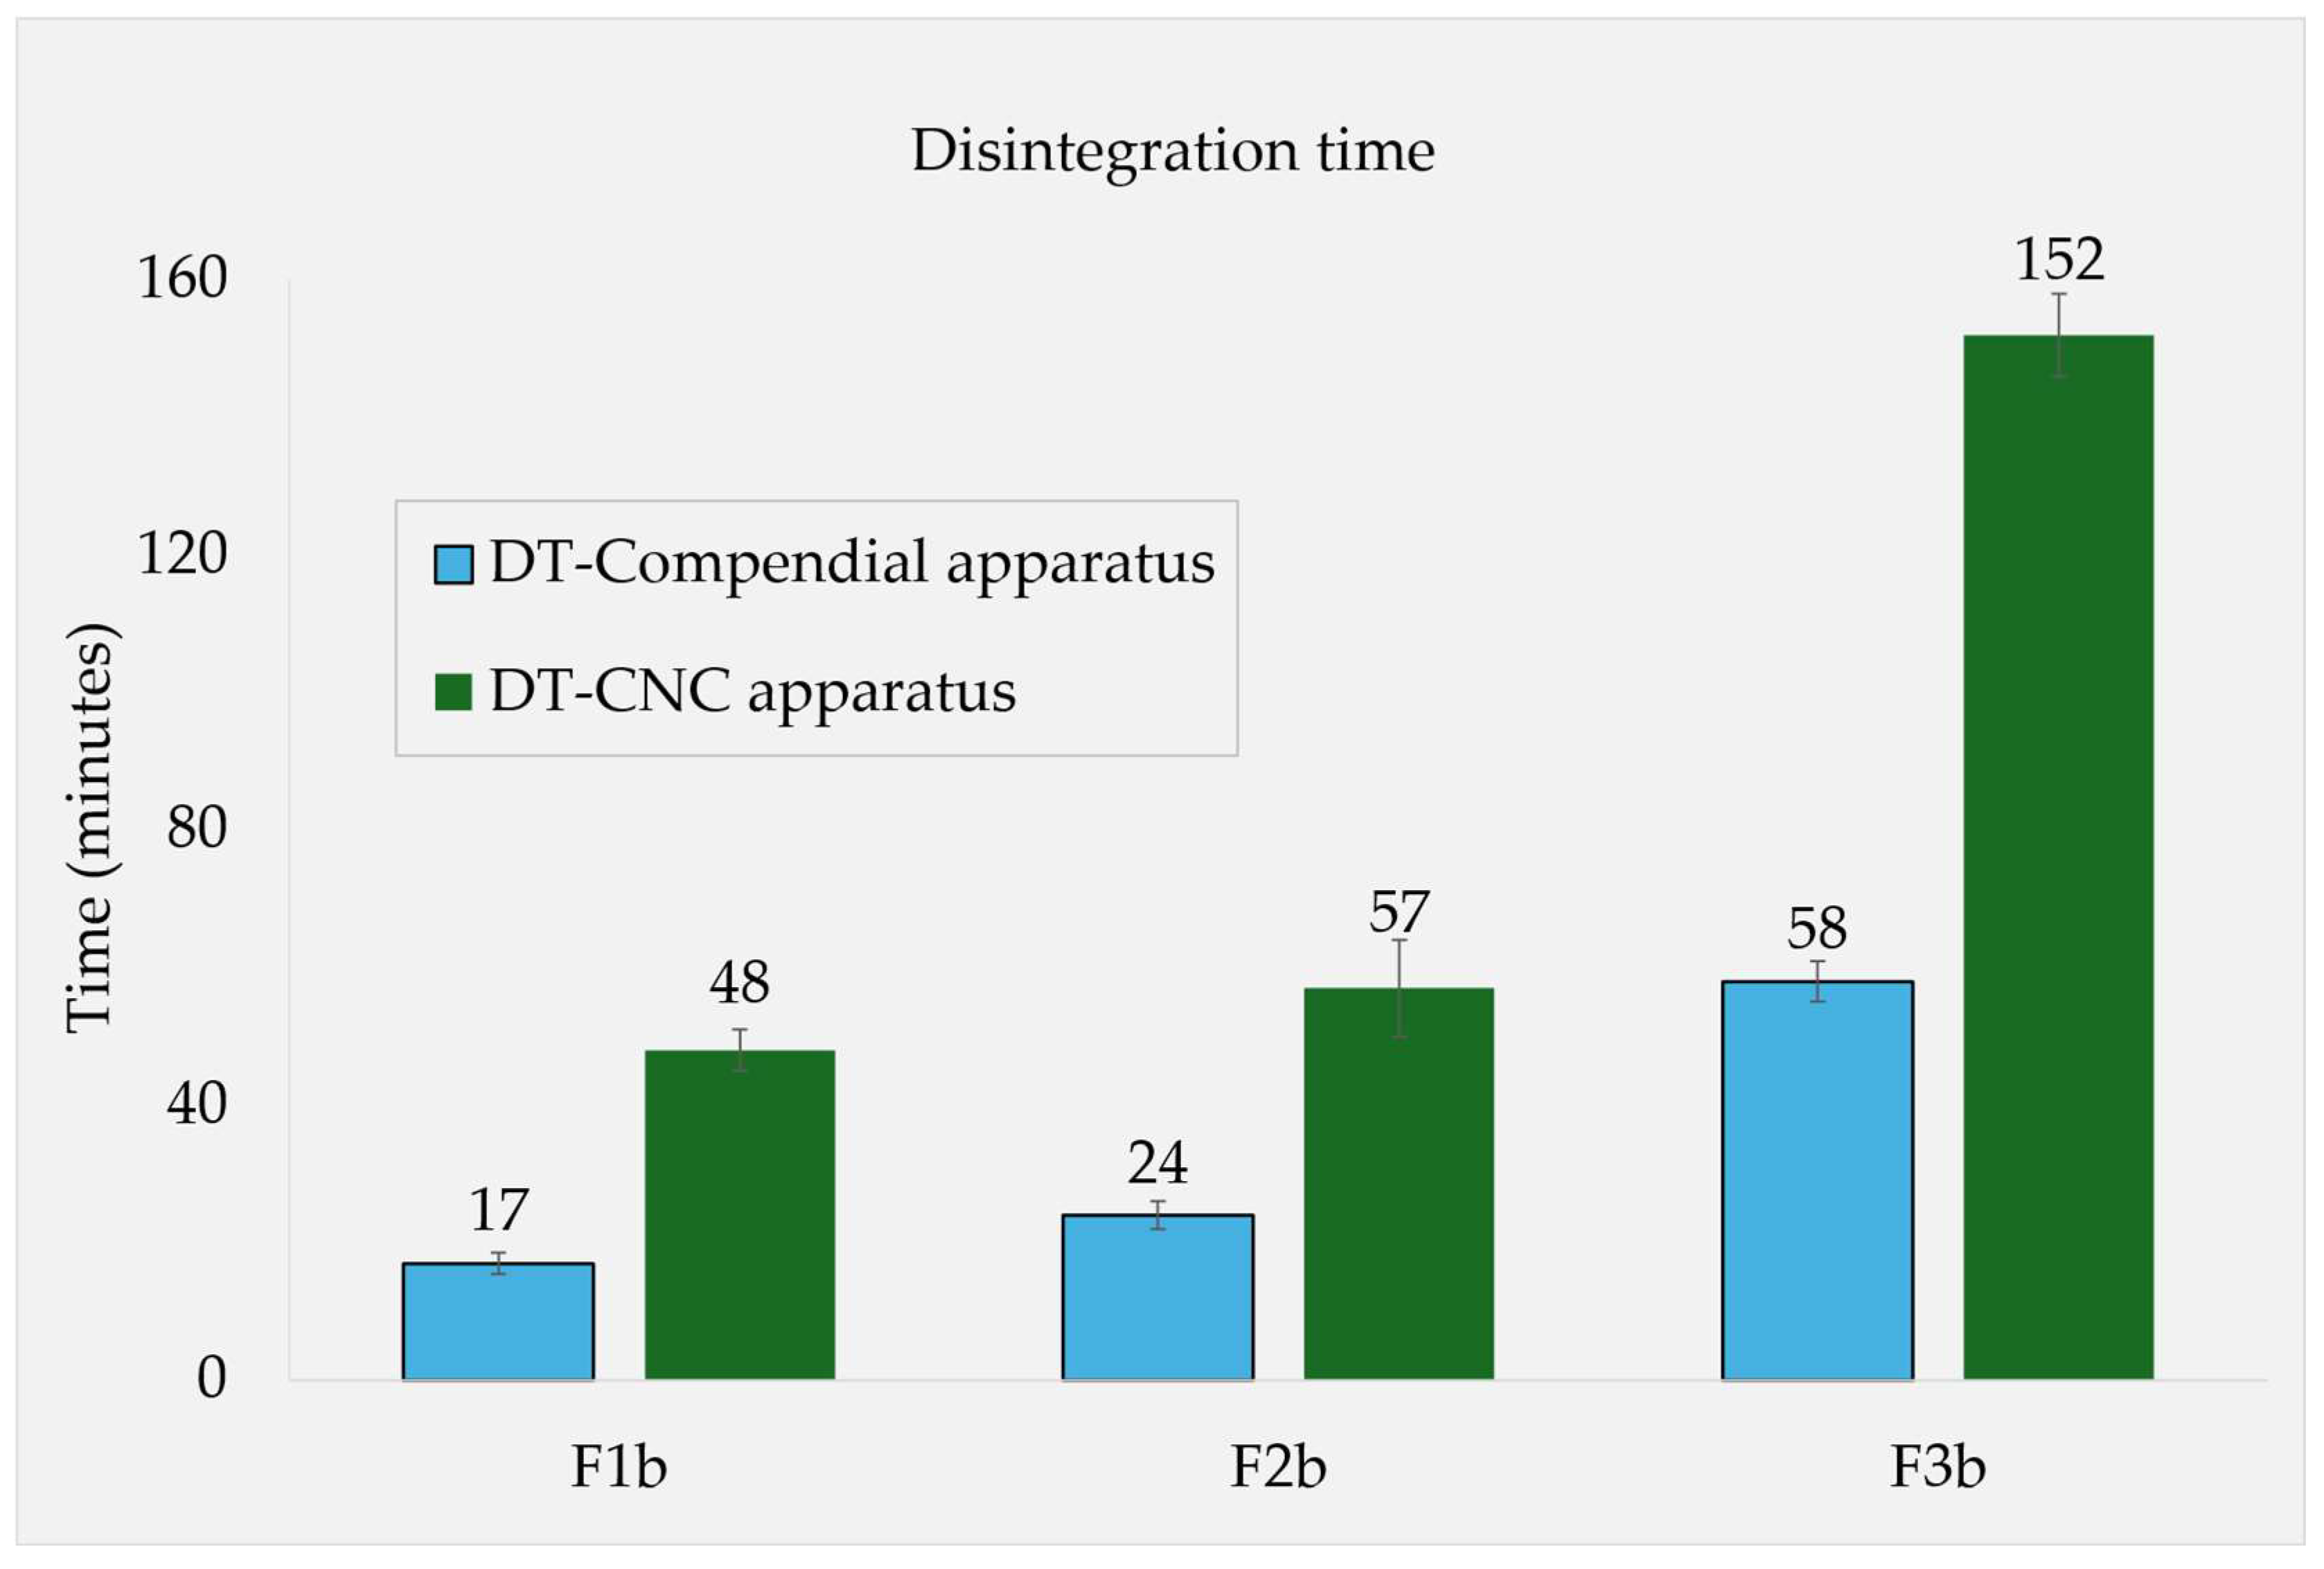
For the formulations containing 15% of soluble fillers (F1b, F2b and F3b), the DTs in simulated fed state media were also determined in the novel CNC apparatus. Comparing these to the results from the compendial apparatus, all the individual DTs were roughly 2.3-2.8x higher in CNC, however maintaining the relative rank order (Figure 3).
Figure 3.
Fed state DTs in different apparatuses, the three formulations F1b, F2b and F3b contained fructose, maltose and lactose, respectively, at 15% concentration in each formulation.
Figure 3.
Fed state DTs in different apparatuses, the three formulations F1b, F2b and F3b contained fructose, maltose and lactose, respectively, at 15% concentration in each formulation.
Porosity Determination and Physical Characterization
Table 4 lists the evaluated results obtained from mercury intrusion porosimetry measurements. During the measurement, a compression of the sample occurred which is indicated by the density increase between 0 and 400 MPa, and this was taken into account for the pore size calculations. It can be seen that the bulk densities at both 0 and 400 Mpa were the lowest for F2b, but overall, for the three formulations F1b, F2b and F3b, they were in a narrow range. The average pore diameter was largest in F2b. Regarding the total porosity (given in %), there was a rank order of F1b>F2b>F3b, while F2b and F3b were in a closer range.
Table 4.
Pore characteristics and densities of F1b, F2b, F3b tablet samples.
| Formulation | F1b | F2b | F3b |
|---|---|---|---|
| Bulk density (g/cm³) at 0 Mpa | 1.2697 | 1.2630 | 1.2919 |
| Bulk density (g/cm³) at 400 Mpa | 1.4390 | 1.3934 | 1.4069 |
| Average pore diameter (nm) | 33.34 | 41.06 | 35.32 |
| Porosity (%) | 11.67 | 9.36 | 8.17 |
Dissolution Studies
The dissolution studies were conducted on formulations containing 15% of the soluble filler. Figure 4a presents the release profiles under both simulated fasted and fed conditions using the USP apparatus II. In general, under the fasted conditions, all the formulations exhibited faster release rates. F2b, which contained maltose, showed comparatively slower release than F1b and F3b. Conversely, under fed state conditions, the release was significantly slower comparing to the fasted conditions. F3b, containing lactose, showed a rapid initial release then followed by a flattened curve, which ultimately resulted in the lowest release after two hours. At this point, the release profiles followed the trend of filler solubility, with formulation F1b>F2b>F3b. The coning effect was observed in the USP apparatus II which was exacerbated by the high viscosity of the medium [21].
Figure 4.
Dissolution profiles of F1b, F2b and F3b containing 15% of fructose, maltose, and lactose respectively in different media. a. in USP apparatus II (n=6) under simulated fasted and fed state media. b. in USP apparatus II (n=6)/CNC apparatus (n=3) under simulated fed state medium.
Figure 4.
Dissolution profiles of F1b, F2b and F3b containing 15% of fructose, maltose, and lactose respectively in different media. a. in USP apparatus II (n=6) under simulated fasted and fed state media. b. in USP apparatus II (n=6)/CNC apparatus (n=3) under simulated fed state medium.
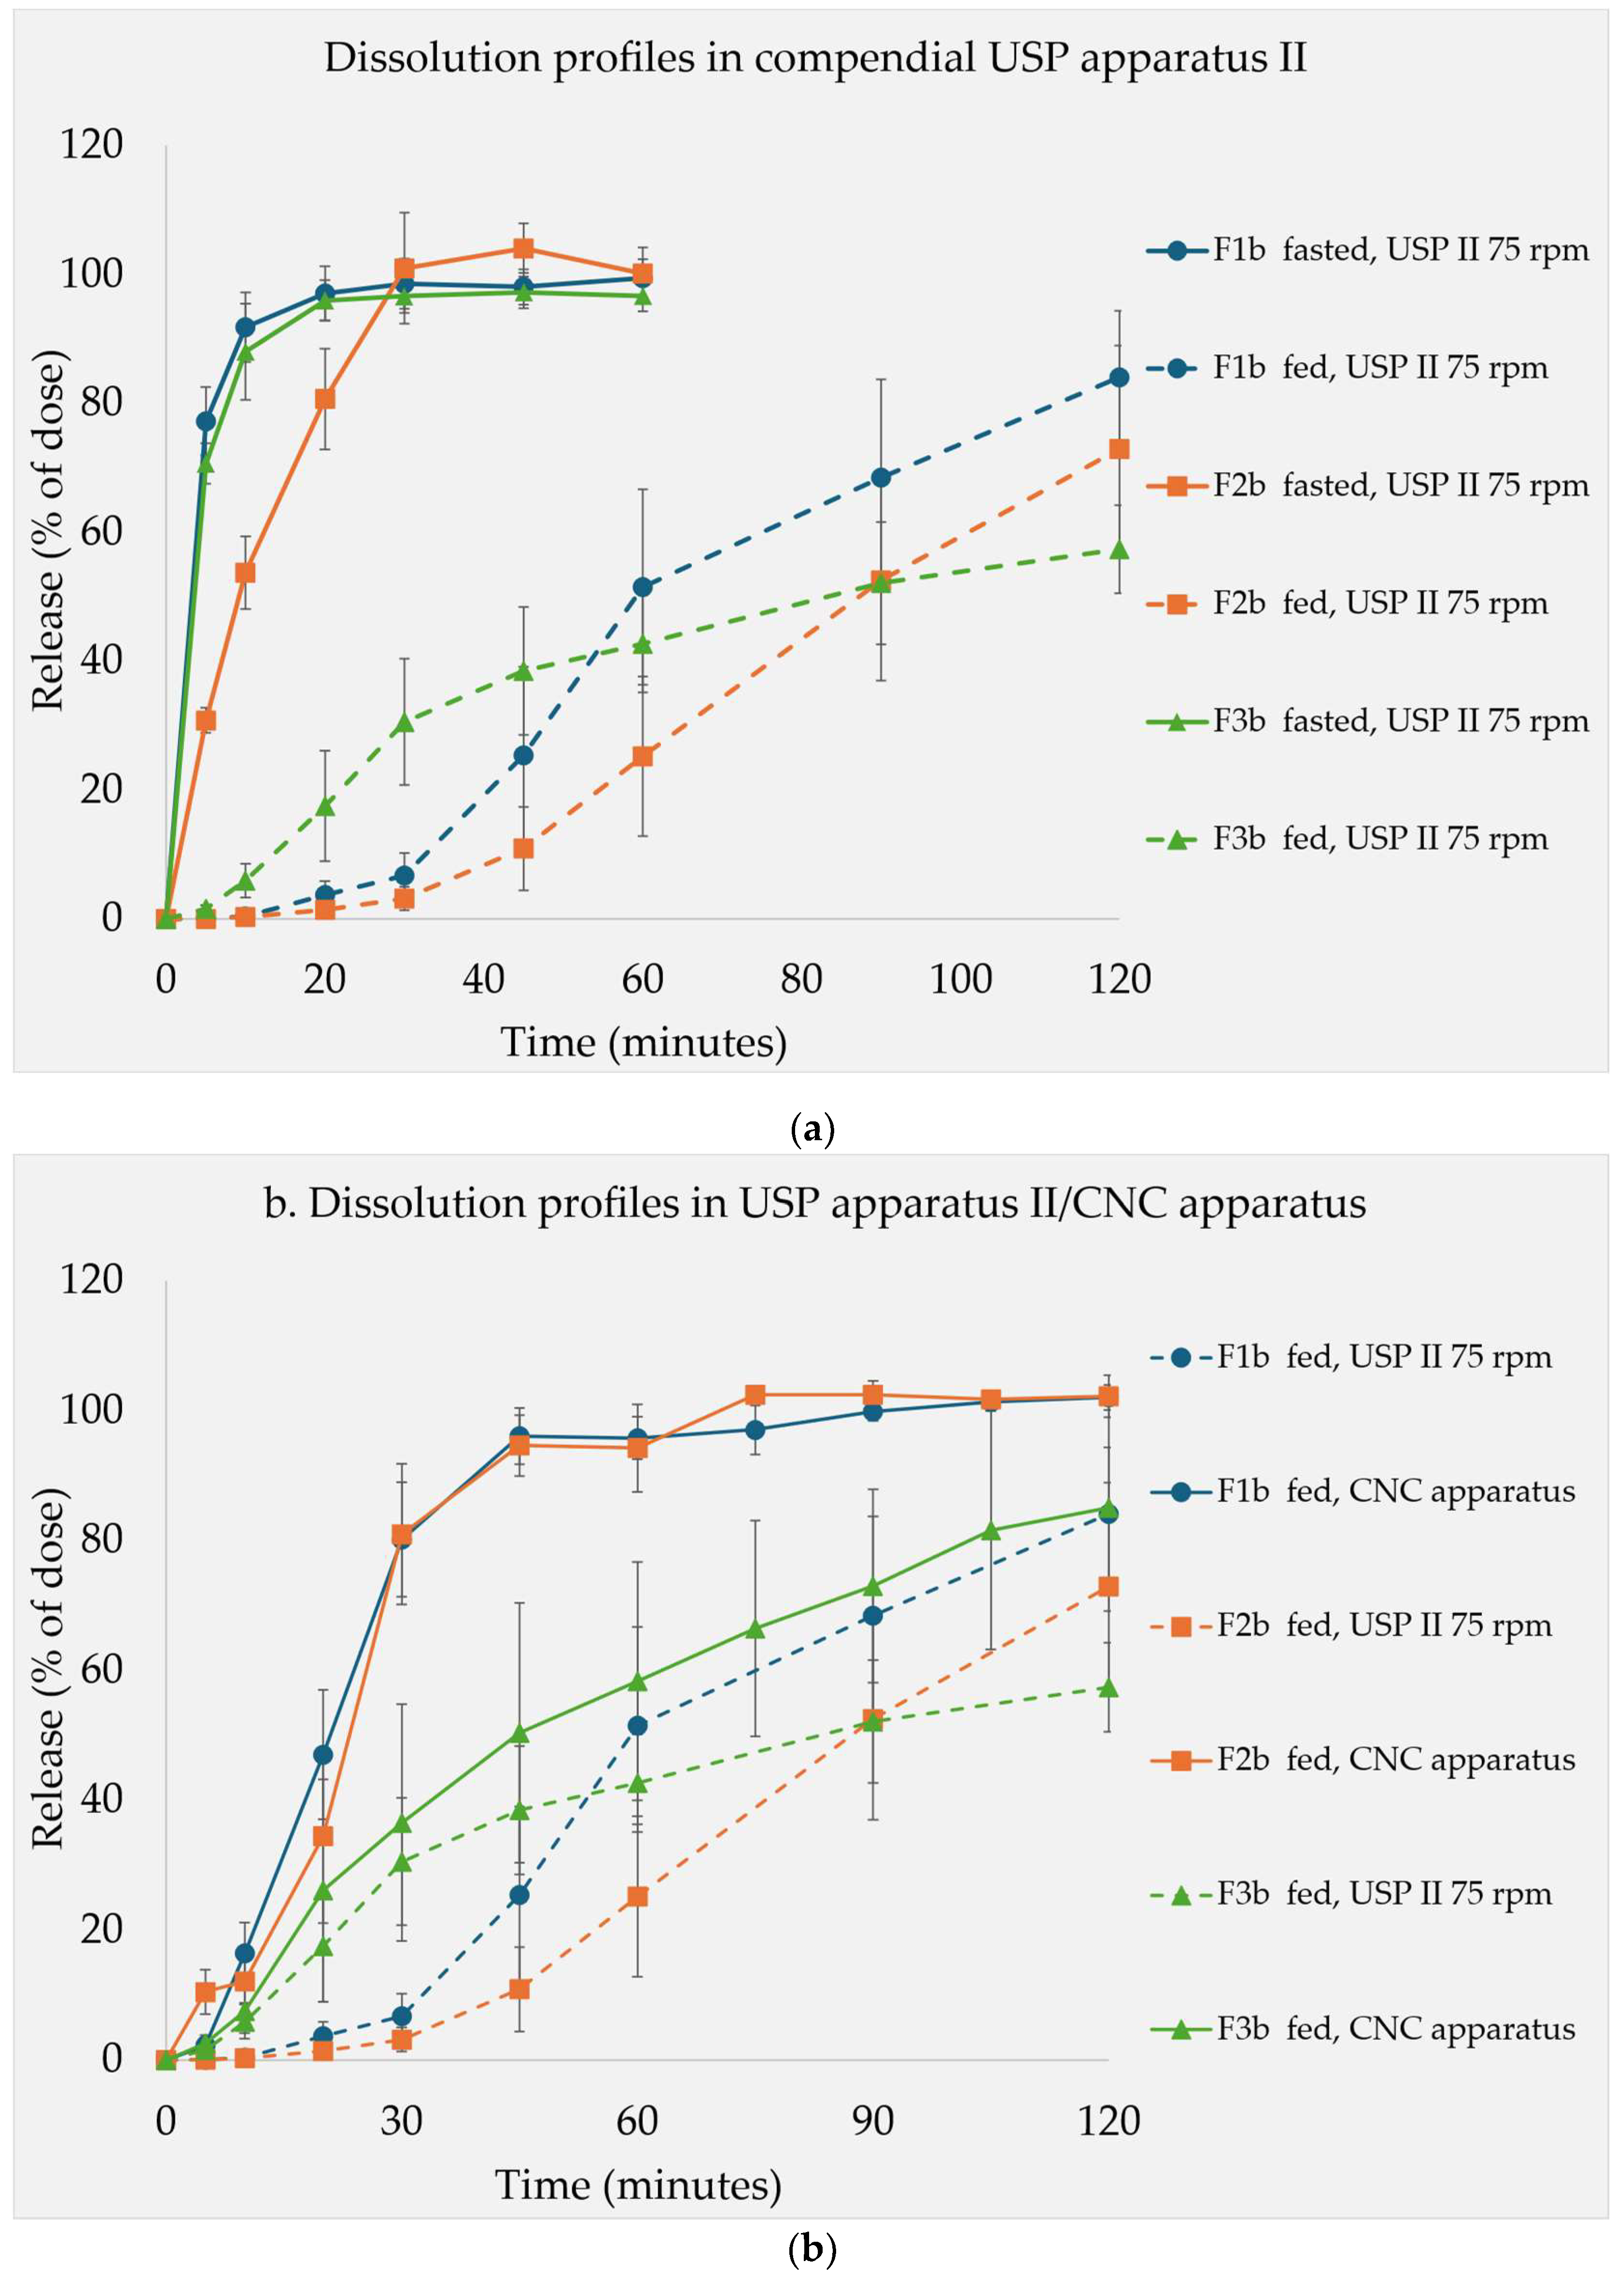
Figure 4b presents the comparison of dissolution profiles using the USP apparatus II versus the novel CNC apparatus. The rank order of the formulation dissolution rates were not the same in the two devices. In the USP II, the rank orders changed over the course of the experiment. In contrast, in the CNC apparatus, the dissolution profiles maintained the same rank order. Apparently, fructose (F1b) and maltose (F2b) based formulations were influenced more by the changed conditions than lactose based formulation (F3b). In the CNC apparatus, both fructose (F1b) and maltose (F2b) based formulations showed faster drug release, whereas the lactose based formulation (F3b) demonstrated slower onset and release, which aligned with the respective filler solubilities. This illustrated some differences between the CNC and USP apparatuses II in terms of dissolution behavior, but the overall trend was similar.
Figure 2 Dissolution profiles of F1b, F2b and F3b containing 15% of fructose, maltose, and lactose respectively in different media. a. in USP apparatus II (n=6) under simulated fasted and fed state media. b. in USP apparatus II (n=6)/CNC apparatus (n=3) under simulated fed state medium.
4. Discussion
In this study, the emphasis was on the effect of soluble fillers on DT. In that sense, from a physico-chemical point of view, the water solubility of all selected fillers is considered relatively high. In water, fructose is “very soluble,” whereas maltose and lactose are “freely soluble.” However, there are considerable differences (Table 1). The saturation concentration of fructose is about four times higher than that of lactose. These differences are impactful especially under viscous conditions, where capillary penetration and tablet breakdown processes greatly slow down, therefore the filler dissolution becomes more important as a disintegration-promoting mechanism.
In the design of the tablet sample, the total amount of filler was kept constant throughout all formulations, with the varying soluble filler content being replaced by DCP. By virtue of its lack of swellability and being practically insoluble in water, DCP can be considered as a “baseline filler”.
Disintegration and Dissolution Under Simulated Fasted State
Under the fasted conditions, generally, the tested formulations in Figure 1a disintegrated rapidly. A similar trend was observed in the corresponding dissolution profiles of the 15% filler formulations (Figure 4a). Under the fasted conditions, where low viscosity prevails, capillary penetration through the pore network significantly governs the water uptake process [6]. This is also known as the wicking effect. The tablet is effectively wetted, and the presence of MCC and superdisintegrant SSG contributes to rapid disintegration, primarily driven by the swelling nature of these excipients [22]. Consequently, no distinct relationship between the filler solubility and DT was observed (Figure 1a). Regarding the respective filler concentration, in the case of maltose formulations (F2's), there was a correlation between the decreasing DT at higher filler content level. As the filler concentration increased in the formulations, there was a corresponding trend of prolongation in the DT observed in the compendial device under the fasted conditions. Similarly, the dissolution profile (Figure 4a) of the maltose formulation demonstrated a slightly slower release despite maltose having an intermediate aqueous solubility compared to the other fillers. However, it still had a rapid release as an IR tablet. This is possibly due to maltose's high surface free energy. Thereby, maltose can be recognized as a saccharide with notable compressibility properties which produces relatively hard tablets (Table 3) with stronger particle adhesion. This further influences the disintegration behavior of formulations [23].
Tablet Disintegration and LPR
There are a number of factors responsible for prolonged DTs under the fed state conditions including tablet hardness, flow velocity and viscosity of the media [12]. The objective of this research was to study the effect of filler solubility in drug formulations. Regarding the testing method, the viscosity of the media plays a crucial role since it influences shear forces exerted on tablets as well as the penetration of liquid into the tablet. Previous studies had reported that higher viscosity of the media increased the shear forces, and thereby facilitated tablet disintegration [24]. On the other hand, viscosity can negatively affect disintegration by limiting the fluid ingress into the tablet, as it is a parameter in the Washburn equation. Thus, it reduces water availability at the target site of disintegrant and filler [13]. Hence, when capillary penetration is slower, fluid uptake via leaching of soluble fillers becomes a significant pathway. This can be theoretically explained as follows:
Each individual parameter in the LPR equation (9) has a varying impact on the LPR. Media viscosity and surface tension are obviously constant for all respective samples. Across the studied soluble fillers, the densities of fructose (1.69g/ml), maltose (1.52g/ml) and lactose (1.54g/ml) are comparable [25,26]. Because soluble fillers are usually composed of molecules that are small and hydrophilic (saccharide units in fructose, maltose and lactose), the diffusion coefficient is not expected to vary much. As for the contact angle, switching between different hydrophilic fillers in the presence of more hydrophobic components, like most lubricants and a majority of APIs, is not expected to profoundly impact wettability. As indicated in Table 4. the tablet pore properties were also found to be in a narrow range (as outlined below). Hence, the greater variations in filler solubility are the determining factor for the liquid progress by leaching.
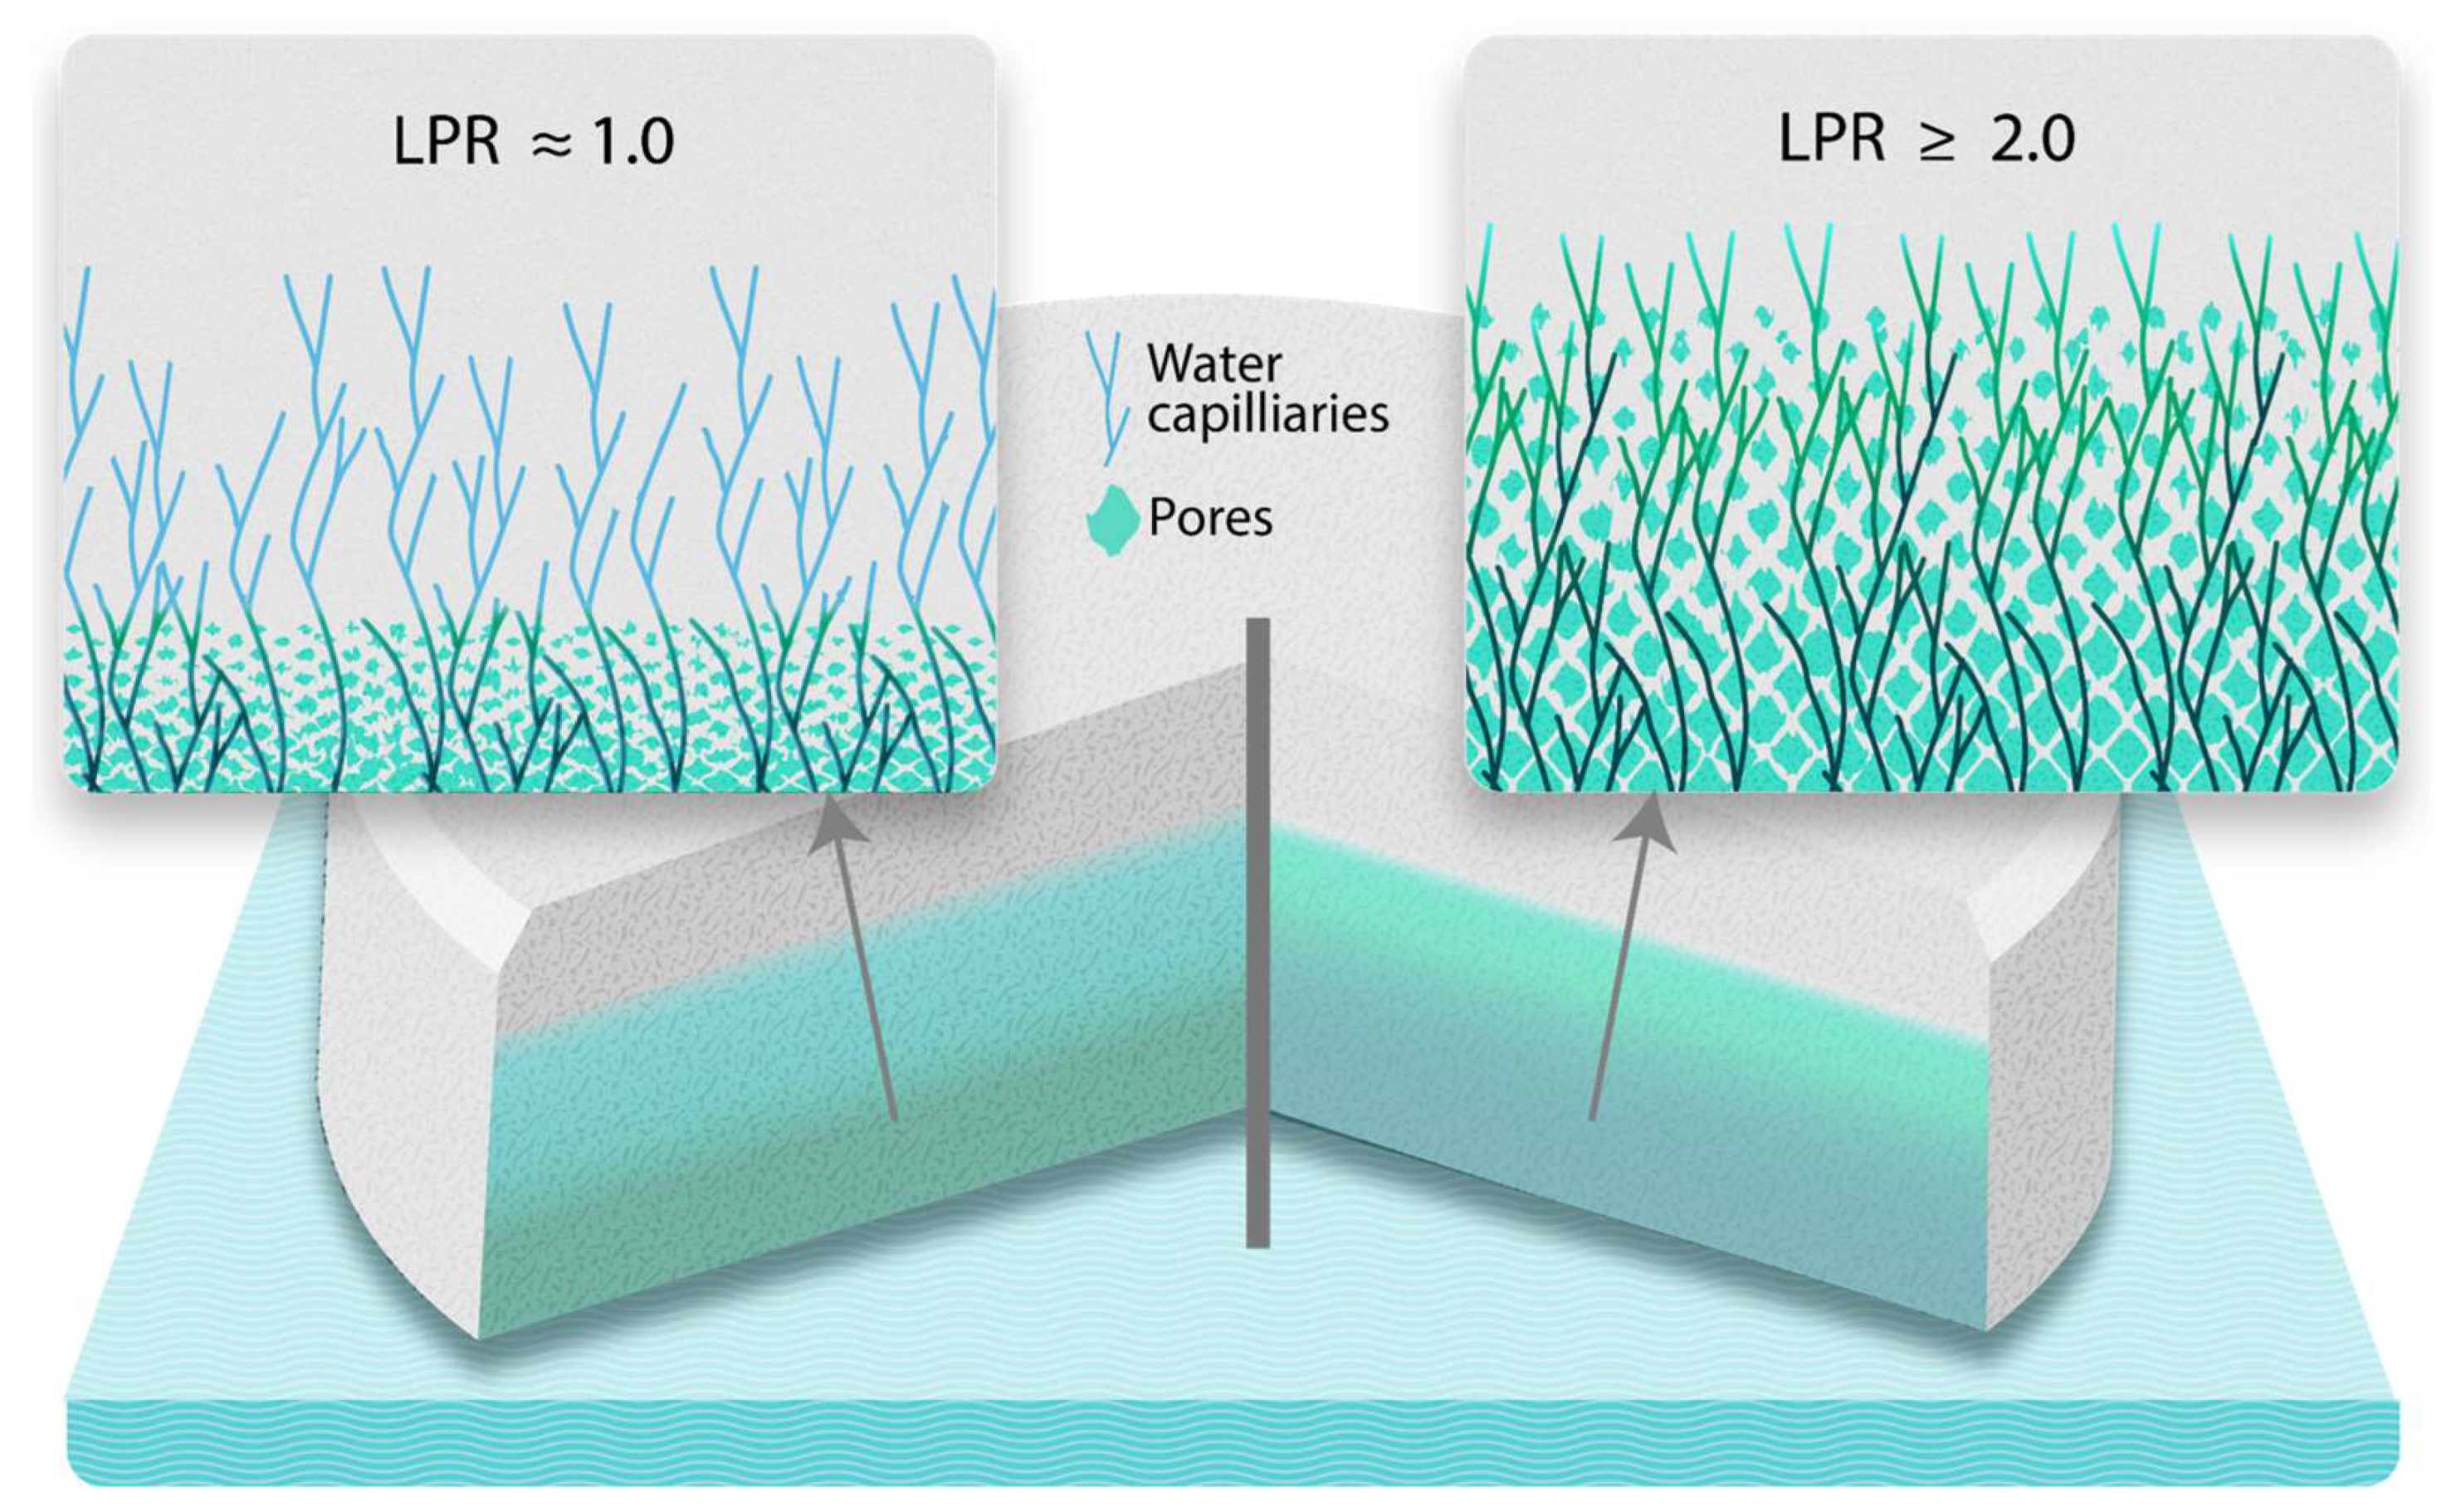
The ratio (Equation 9) provides a theoretical explanation for our findings regarding filler solubility effects, as illustrated in Figure 1. The HPMC media’s viscosity is more than 100 times higher than that in HCl media [11]. Accordingly, the low viscosity in the equation’s numerator would result in a LPR close to 1 (i.e., there is little impact on liquid penetration rate and it stays almost the same as in the case with capillary penetration alone), even with very soluble fillers which illustrates that the capillary penetration is so fast that leaching does not play any significant roles. This explains why no correlation between filler solubility and DT was observed in this study. However, under fed conditions, the high viscosity enables LPR values closer to 2 or even higher for highly soluble materials. An LPR value of 2 means doubling the penetration rate, which implies the penetration rate due to leaching is equal to that of capillarity. Therefore, LPR > 2 means that leaching dominates capillarity as penetration mechanism, signifying that it can enhance fluid uptake and partially compensate for the retarding effect of viscosity on the capillary movement. Consequently, fillers with solubilities enabling an LPR close to 2 and higher can accelerate tablet disintegration in a solubility-dependent manner (Figure 5). This explains the strong effect of filler solubility on tablet disintegration under simulated fed state in this study.
Figure 5.
An illustration of unidirectional media transport across the tablet which represents two mechanisms, i.e., sole capillary penetration when the LPR is close to 1, and leaching front accompanied strongly “pushing” the capillary front when the LPR is equal to or higher than 2.
Figure 5.
An illustration of unidirectional media transport across the tablet which represents two mechanisms, i.e., sole capillary penetration when the LPR is close to 1, and leaching front accompanied strongly “pushing” the capillary front when the LPR is equal to or higher than 2.
In addition to the leaching effect, the higher susceptibility of the leached region of the tablet to erosion by fluid movement and/or disintegrant action can further shorten the effective distance which capillary pressure (as well as leaching) would need to act for drawing water toward the tablet core.
Depicted in Figure 2 are the DTs of tablets incorporating five substances respectively as soluble “fillers” at constant content, chosen based on their solubilities. In general, most of those are not commonly used as tablet fillers in the pharmaceutical industry. Regarding tablet disintegration behavior, it does not matter if the substance is usually viewed as a sugar, an amino acid or an API. Only physico-chemical properties determine the process of disintegration. Hence, the selection gave rise to a clear trend reciprocally linking the filler solubility to DT. In order to assess the influence of the apparatus itself, DTs of the 15% soluble filler formulations (F1b, F2b and F3b) were obtained in the novel CNC apparatus. Under these altered hydrodynamic conditions, the same trend was observed: higher solubility correlated with quicker disintegration. Overall, the DTs in CNC apparatus were longer compared to the compendial apparatus, but the rank order and relative ratio stayed the same (Figure 3). Therefore, the solubility phenomenon is likely attributed to the substances' characteristics rather than being majorly governed by the design of the testing method.
Dissolution Tests Under Fed State
The filler solubility effect in simulated fed state was characterized further by dissolution experiments. The formulations containing 15% soluble filler (F1b, F2b and F3b) were studied for this purpose. In the fed state medium, the performance also followed a trend set by the filler solubility. However, it also depended on the apparatus used in the study. The in-house developed CNC apparatus was designed specifically for testing in highly viscous media. In the USP Apparatus II, the tablet was placed stationary rather facing different hydrodynamic stress. Hence, the hydrodynamic stress from the stirred media by the rotating paddle caused a distinct coning effect. In the case of CNC apparatus, the 3D movement of the basket exposed the tablets to the testing media in all directions which mimicked in-vivo conditions and avoided the coning effect [13,27,28].
Under these optimized conditions, there is a clear distinction. F1b released the quickest, closely followed by F2b, while F3b was the slowest. In contrast, the results from the USP Apparatus II did not fully express this trend, especially during the onset and at around the one-hour timepoint. When the experiment duration was extended to two hours, the F3b curve flattened, and the solubility-based trend was observed. The rank order of the dissolution rates was not consistent over the course of the entire experiment when the USP apparatus II was used. Apparently, utilization of this apparatus may discriminate the fasted and fed state release profiles, but it presented challenges in distinguishing among formulations in fed state media alone. However, throughout both the extended compendial test and the optimized CNC apparatus test, the influence of the filler solubility was clearly demonstrated to be reciprocally linked to the dissolution performance. This confirmed the findings from the disintegration tests further and underlined the role of optimized testing conditions for viscous media.
Physical Characterization
The difference in DT between F1 and F2 formulations is smaller than expected solely based on filler solubility. The overall disintegration performance naturally is a sum of different factors with the filler solubility being a major one, but not the only one. Other parameters, such as physical properties, can influence disintegration and dissolution processes. In order to assess the capabilities of different fillers further, tablet hardness was tested (Table 3). Moreover, F1b, F2b, and F3b tablet samples (containing three soluble fillers at 15% each) were compared by mercury porosimetry. As shown in Table 4, F3b had a slightly higher initial bulk density, but overall, the three samples were in a narrow range. The bulk density at 400 MPa is hypothetical regarding the use in dissolution tests or in patients, since the tablet will not be subjected to such pressures in vivo. However, the differences (between densities initially at 0 and 400 MPa) indicated the compressibility of the tablets. F1b showed a slightly higher compressed (400 MPa) bulk density, compared to F2b and F3b. This slightly lower resistance to physical stress was also reflected in the hardness results (Table 3).
As outlined above, the intra-tablet liquid transport relies on tablet porosity. For the wetting of the pore system which ultimately leads to the tablet’s dissolution, the rate limiting step must be identified. Because the average pore size calculation method apportioned the largest impact to the smallest pores that act as the bottleneck of water progression through the capillary network, this parameter should be considered for the capillary fluid penetration calculation. The average pore sizes of the three formulations were close to each other with the largest difference not exceeding 25%, while the solubility differences vary in multiples. This reinforces solubility of those fillers as the main factor impacting the disintegration performance.
Filler Quantity
Not only the extent of a filler's solubility influenced the tablet’s behavior, but also its quantity. Figure 1b illustrated a distinct correlation between soluble filler content and disintegration characteristics. Visibly, a larger amount of fillers generally lead to quicker disintegration. Notably, at a 5% level, fructose performed similarly to the less soluble lactose at a 15% level. Increasing the filler content from 5% to 15% seemed to have a larger impact than that from 15% to 25% in F1’s and F3’s. Less so for F2’s (maltose), where both samples for 15% and 25% disintegrated in 24 minutes. Analogously to the observations in fasted state, this can likely be attributed to the tableting properties (such as high hardness to tablets during compression) of maltose (Table 3). This can counteract the swelling effect of disintegrants, resulting in slower disintegration.
Filler quantity effects can be explained by the need for the filler level to exceed the percolation threshold for the leaching to be able to effectively shorten the distance over which capillary pressure draws fluid (thus enabling behavior in accordance with the previously described LPR theoretical framework). Beyond this threshold, additional positive effects can come from greater mechanical susceptibility of the leached region to erode or break up by the action of the agitated fluid and/or the disintegrant.
As outlined, the degree of solubility of the tablet filler and its concentration in the tablet play a role in the water uptake and the liquid transport inside the tablet. The leaching of the soluble fillers creates additional apparent pores in the tablets [29]. Consequently, highly soluble fructose in F1’s is extending the pore network more quickly compared to the less soluble maltose, followed by lactose. However, other characteristics such as physical properties achieved by manufacturing process parameters also influence the tablet’s disintegration and dissolution behavior. Those will be elaborated in future studies.
5. Conclusions
This study explored the impact of filler solubility on tablet disintegration and dissolution performances. There are two very different testing scenarios, simulated fasted and fed states, which mostly differ in media viscosity. In the highly viscous simulated fed state, both the extent of filler solubility and its quantity exhibit a notable effect on DTs. The role of both media viscosity and filler solubility are also outlined by the presented theoretical framework (LPR). The higher water-soluble fillers resulted in accordingly faster DT and API release in the simulated fed state. Likewise, a larger amount of the respective soluble filler accelerates tablet disintegration. Under viscous conditions, the hydrodynamic conditions of the novel CNC apparatus are preferable compared to the USP apparatus II. Physical characterization by mercury-porosimetry showed comparable pore properties, where small differences in the porosity can explain the slight variations in performance. Further investigation of the formulation parameters (e.g., different types and ratios of soluble/insoluble fillers, other excipient classes and manufacturing processes) as well as adapted testing conditions would provide additional insights to the food effects on the tablets.
Disclaimer
This study was funded through the FDA, Office of Generic Drugs; Contract 75F40121C00020. The views expressed here do not reflect official policies of the FDA or the Department of Health and Human Services, nor does any mention of trade names imply endorsement by the US Government.
Author Contributions
Conceptualization, M.U., V.S., J.A., T.N., W.S., F.W., W.J., Z.G., and P.L.; methodology, M.U., V.S., and J.A.; software, V.S.; formal analysis, M.U., V.S., and J.A.; investigation, M.U., and V.S.; resources, P.L.; data curation, M.U., V.S., and J.A.; writing—original draft preparation, M.U., and V.S.; writing—review and editing J.A., T.N., W.S., F.W., W.J., Z.G., and P.L.; validation, V.S.; visualization, M.U., and V.S.; supervision, P.L.; project administration, W.J., and P.L.; funding acquisition, W.S., F.W., W.J., and P.L. All authors have read and agreed to the published version of the manuscript.
Funding
This study was funded through the U.S. Food and Drug Administration, Office of Generic Drugs; Contract no. 75F40121C00020.
Data Availability Statement
The original contributions presented in this study are included in the article. Further inquiries can be directed to the corresponding author(s).
Conflicts of Interest
The authors declare no conflicts of interest.
Abbreviations
The following abbreviations are used in this manuscript:
| API | Active pharmaceutical ingredient |
| CNC | Computed numerical control |
| DCP | Dicalcium Phosphate |
| DT | Disintegration time |
| HCl | Hydrochloric acid |
| HPMC | Hydroxypropyl methylcellulose |
| ICH | International Council for Harmonisation of Technical Requirements for Pharmaceuticals for Human Use |
| IR | Immediate release |
| LPR | Liquid penetration ratio |
| MCC | Microcrystalline cellulose |
| MPa | Mega Pascals |
| NaCl | Sodium Chloride |
| NaOH | Sodium hydroxide |
| PVP | Polyvinyl pyrrolidone |
| RSD | Relative standard deviation |
| SD | Standard deviation |
| SSG | sodium starch glycolate |
| US FDA | US food and drug administration |
| USP | United States Pharmacopeia |
References
- Ghosh, S. Oral Solid Dosage Pharmaceutical Formulation Market Outlook: Oral Solid Dosage Pharmaceutical Formulation Market Forecast by Tablets, Capsules, and Other Dosage Forms From 2024 To 2034. Surging Demand for Innovative Oral Dosage Formulations Driven by Shift Towards Personalized Medicine and Customized Treatments. FMI Insights into Biodegradable Polymer Sustainability REP-GB-2782, 2017. Available online: https://www.futuremarketinsights.com/reports/oral-solid-dosage-pharmaceutical-formulation-market# (accessed on 12 April 2024).
- Kotsybar, J.; Hakeem, S.; Zhang, L.; Jiang, W. Global harmonization of immediate-release solid oral drug product bioequivalence recommendations and the impact on generic drug development, 2023. Clinical and translational science, 16 (12).
- Horkovics-Kovats, S. Disintegration Rate and Properties of Active Pharmaceutical Ingredient Particles as Determined from the Dissolution Time Profile of a Pharmaceutical Formulation: An Inverse Problem. J. Pharm. Sci. 2014, 103, 456–464. [Google Scholar] [CrossRef] [PubMed]
- Berardi, A.; Bisharat, L.; Quodbach, J.; Abdel Rahim, S.; Perinelli, D.R.; Cespi, M. Advancing the understanding of the tablet disintegration phenomenon – An update on recent studies. Int. J. Pharm. 2021, 598, 120390. [Google Scholar] [CrossRef] [PubMed]
- Liu, Z.; Shi, C.; Fang, Y.; Zhao, H.; Mu, Y.; Zhao, L.; Shen, L. A comprehensive understanding of disintegrants and disintegration quantification techniques: From the perspective of tablet microstructure. Journal of Drug Delivery Science and Technology 2023, 88, 104891. [Google Scholar] [CrossRef]
- Radwan, A.; Wagner, M.; Amidon, G.L.; Langguth, P. Bio-predictive tablet disintegration: effect of water diffusivity, fluid flow, food composition and test conditions. Eur. J. Pharm. Sci. 2014, 57, 273–279. [Google Scholar] [CrossRef]
- Al-Gousous, J.; Langguth, P. Oral Solid Dosage Form Disintegration Testing - The Forgotten Test. Journal of Pharmaceutical Sciences 2015, 104, 2664–2675. [Google Scholar] [CrossRef]
- Abdallah, D.B.; Charoo, N.A.; Elgorashi, A.S. Comparative binding and disintegrating property of Echinochloa colona starch (difra starch) against maize, sorghum, and cassava starch. Pharm. Biol. 2014, 52, 935–943. [Google Scholar] [CrossRef]
- Quodbach, J.; Kleinebudde, P. A critical review on tablet disintegration. Pharm. Dev. Technol. 2016, 21, 763–774. [Google Scholar] [CrossRef]
- Dvořák, J.; Tomas, J.; Lizoňová, D.; Schöngut, M.; Dammer, O.; Pekárek, T.; Beránek, J.; Štěpánek, F. Investigation of tablet disintegration pathways by the combined use of magnetic resonance imaging, texture analysis and static light scattering. International Journal of Pharmaceutics 2020, 587, 119719. [Google Scholar] [CrossRef]
- Radwan, A.; Amidon, G.L.; Langguth, P. Mechanistic investigation of food effect on disintegration and dissolution of BCS class III compound solid formulations: the importance of viscosity. Biopharm. Drug Dispos. 2012, 33, 403–416. [Google Scholar] [CrossRef]
- Kindgen, S.; Rach, R.; Nawroth, T.; Abrahamsson, B.; Langguth, P. A Novel Disintegration Tester for Solid Dosage Forms Enabling Adjustable Hydrodynamics. Journal of Pharmaceutical Sciences 2016, 105, 2402–2409. [Google Scholar] [CrossRef]
- Ruiz-Picazo, A.; Colón-Useche, S.; Gonzalez-Alvarez, M.; Gonzalez-Alvarez, I.; Bermejo, M.; Langguth, P. Effect of thickener on disintegration, dissolution and permeability of common drug products for elderly patients. Eur. J. Pharm. Biopharm. 2020, 153, 168–176. [Google Scholar] [CrossRef] [PubMed]
- Washburn, E.W. The Dynamics of Capillary Flow.
- Zaheer, K.; Langguth, P. Formulation strategy towards minimizing viscosity mediated negative food effect on disintegration and dissolution of immediate release tablets. Drug Dev. Ind. Pharm. 2018, 44, 444–451. [Google Scholar] [CrossRef]
- Crestani, C.E.; Bernardo, A.; Costa, C.B.B.; Giulietti, M. Fructose Solubility in Mixed (Ethanol + Water) Solvent: Experimental Data and Comparison among Different Thermodynamic Models. J. Chem. Eng. Data, 58 (11).
- Gong, X.; Wang, C.; Zhang, L.; Qu, H. Solubility of Xylose, Mannose, Maltose Monohydrate, and Trehalose Dihydrate in Ethanol–Water Solutions. J. Chem. Eng. Data, 57 (11).
- Fox, P.F.; Uniacke-Lowe, T.; McSweeney, P.L.H.; O’Mahony, J.A. Dairy Chemistry and Biochemistry; Springer International Publishing: Cham, 2015; ISBN 978-3-319-14892-2. [Google Scholar]
- Zhang, C.; Liu, B.; Wang, X.; Wang, H. Measurement and Correlation of the Solubilities of l -Valine in Water, Ethanol, N, N -Dimethylformamide, Acetone, and Isopropyl Alcohol between (293.15 and 343.15) K. J. Chem. Eng. Data 2014, 59, 2704–2708. [Google Scholar] [CrossRef]
- Kalantzi, L.; Reppas, C.; Dressman, J.B.; Amidon, G.L.; Junginger, H.E.; Midha, K.K.; Shah, V.P.; Stavchansky, S.A.; Barends, D.M. Biowaiver monographs for immediate release solid oral dosage forms: acetaminophen (paracetamol). Journal of Pharmaceutical Sciences 2006, 95, 4–14. [Google Scholar] [CrossRef]
- Higuchi, M.; Nishida, S.; Yoshihashi, Y.; Tarada, K.; Sugano, K. Prediction of coning phenomena for irregular particles in paddle dissolution test. Eur. J. Pharm. Sci. 2015, 76, 213–216. [Google Scholar] [CrossRef]
- Al-Sharabi, M.; Markl, D.; Mudley, T.; Bawuah, P.; Karttunen, A.-P.; Ridgway, C.; Gane, P.; Ketolainen, J.; Peiponen, K.-E.; Rades, T.; et al. Simultaneous investigation of the liquid transport and swelling performance during tablet disintegration. International Journal of Pharmaceutics 2020, 584, 119380. [Google Scholar] [CrossRef]
- Mizumoto, T.; Masuda, Y.; Yamamoto, T.; Yonemochi, E.; Terada, K. Formulation design of a novel fast-disintegrating tablet. International Journal of Pharmaceutics 2005, 306, 83–90. [Google Scholar] [CrossRef]
- Desai, P.M.; Liew, C.V.; Heng, P.W.S. Assessment of disintegration of rapidly disintegrating tablets by a visiometric liquid jet-mediated disintegration apparatus. International Journal of Pharmaceutics 2013, 442, 65–73. [Google Scholar] [CrossRef]
- Handbook of pharmaceutical excipients; Rowe, R.C.; Sheskey, P.J.; Quinn, M.E., Eds., 6. ed.; APhA (PhP) Pharmaceutical Press: London, 2009.
- Lourdin, D.; Colonna, P.; Ring, S.G. Volumetric behaviour of maltose-water, maltose-glycerol and starch-sorbitol-water systems mixtures in relation to structural relaxation. Carbohydr. Res. 2003, 338, 2883–2887. [Google Scholar] [CrossRef]
- Parojcić, J.; Vasiljević, D.; Ibrić, S.; Djurić, Z. Tablet disintegration and drug dissolution in viscous media: paracetamol IR tablets. International Journal of Pharmaceutics 2008, 355, 93–99. [Google Scholar] [CrossRef]
- Vrbanac, H.; Trontelj, J.; Kalčič, Š.; Legen, I. Mechanistic study of model drug release from HPMC matrices in fed gastric media. Journal of Drug Delivery Science and Technology 2020, 60, 102034. [Google Scholar] [CrossRef]
- Berardi, A.; Bauhuber, S.; Sawafta, O.; Warnke, G. Alginates as tablet disintegrants: Understanding disintegration mechanisms and defining ranges of applications. International Journal of Pharmaceutics 2021, 601, 120512. [Google Scholar] [CrossRef]
Disclaimer/Publisher’s Note: The statements, opinions and data contained in all publications are solely those of the individual author(s) and contributor(s) and not of MDPI and/or the editor(s). MDPI and/or the editor(s) disclaim responsibility for any injury to people or property resulting from any ideas, methods, instructions or products referred to in the content. |
© 2025 by the authors. Licensee MDPI, Basel, Switzerland. This article is an open access article distributed under the terms and conditions of the Creative Commons Attribution (CC BY) license (https://creativecommons.org/licenses/by/4.0/).
Copyright: This open access article is published under a Creative Commons CC BY 4.0 license, which permit the free download, distribution, and reuse, provided that the author and preprint are cited in any reuse.


