
Submitted:
25 March 2025
Posted:
26 March 2025
You are already at the latest version
Abstract
This study investigated phenolics, antioxidant, enzyme inhibitory, and antiviral activities against HRSV and HSV-1 in ethanol (SEE) and aqueous extracts (SEW) obtained through Soxhlet extraction and ultrasonic-assisted extraction (UAE: ethanol extract, UAW: aqueous extract) from A. bisporus. Quercetin was the most prominent phenolic among 21 standards. Total phenolic content ranged from 9.56±0.06 to 13.84±0.11 mg GAEs/g, and the total flavonoid content ranged from 0.08±0.07 to 0.73±0.03 mg REs/g. SEE extract exhibited higher antioxidant activity, except for FRAP and metal chelating activity (DPPH: 20.29±1.69 mg TEs/g, ABTS: 48.33±3.03 mg TEs/g, CUPRAC: 54.35±1.24 mg TEs/g, Phosphomolybdate: 1.44±0.06 mg TEs/g). The highest FRAP-reducing activity was in UAE extract (33.95±0.04 mg TEs/g), while SEW extract displayed the highest metal chelating activity (29.55±0.04 mg EDTAE/g). Ethanol extracts demonstrated higher enzyme inhibition activity. The highest AChE, α-glucosidase, and tyrosinase enzyme inhibitions were in SEE extract at 2.56±0.02 mg GALAEs/g extract, 1.03±0.00 mg ACEs/g extract, and 51.97±0.80 mg KAEs/g extract, respectively. The highest BChE and α-amylase inhibition activities were found in UAE extract at 6.34±0.08 mg GALAEs/g and 0.29±0.00 mmol ACEs/g, respectively. Extracts showed anti-HRSV activity, with the highest efficacy observed in the SEW extract (SI=135.90). Anti-HSV-1 activity was detected only in the UAW extract (SI=85.86).
Keywords:
antioxidant activity
; antiviral activity
; button mushroom
; cytotoxic activity
; enzyme inhibition activity
; phenolic compounds
1. Introduction
Mushrooms have been known since ancient times as a food source and a disease treatment [1]. One reason for the increase in mushroom consumption today can be attributed to their taste and flavour and research highlighting the health benefits of their bioactive components [1]. Mushrooms are becoming a significant focus of interest for the pharmaceutical industry because of the bioactive compounds they contain [2]. Most mushrooms have different bioactive compounds. These compounds have antioxidant, antitumour, anti-inflammatory, immunomodulatory, antimicrobial and anti-ageing properties. [1,3,4]. Edible mushrooms, especially those found in Basidiomycetes, are rich in proteins, organic acids (e.g. malate, ascorbate, fumarate, shikimate), carbohydrates (e.g. β-glucans), B vitamins (e.g. niacin, riboflavin, pyridoxine), monoterpenoids and diterpenoids, lipids, phenolics (e.g. tocopherols) and trace elements such as selenium [4]. The main phenolic compounds found in fungi are phenolic acids. In addition, some wild mushroom species have identified phenolics such as rutin, quercetin, vanillin, gallic acid and caffeic acid. Flavonoids have also been reported in Lactifluus piperatus (L.) Roussel [4].
Agaricus bisporus, the most widely known for its edibility in the Agaricaceae family, is also one of the most important cultivated mushroom species. It also has an important place in terms of culinary and medicinal value. The production and consumption of A. bisporus in mushroom cultivation is increasing worldwide [5]. Several studies have confirmed that bioactive compounds obtained from A. bisporus from its powders or extracts can be used to treat many serious diseases [5]. Various and valuable medicinal properties of A. bisporus have been identified, including antitumour, immunomodulatory, anti-obesity, antimicrobial, anti-aromatase, antioxidant, anti-inflammatory and antiviral activities [2,5,6]. It is also suggested to be effective in treating cancer, diabetes mellitus, coronary heart disease, and immune system disorders [5]. Bioactive compounds from mushrooms have anticancer, anti-cardiovascular disease, antidiabetic, antioxidant and antimicrobial properties [7]. Due to its various medicinal properties, A. bisporus can be used as an essential dietary component.
This study aims to analyse the phenolic contents, antioxidant capacities, enzyme inhibition properties, and antiviral characteristics of extracts obtained using two different extraction methods. The findings highlight the benefits of utilising mushrooms more effectively and emphasise their importance in our daily diet.
2. Materials and Methods
2.1. Sample Collection and Preparation of Extracts
The samples used in this study were purchased commercially from a local market. The basidiocarps of the mushroom were dried at 45°C in a drying oven and ground into powder using a mill. Soxhlet extraction, a traditional method, and ultrasonic-assisted extraction, one of the advanced extraction techniques, were employed for extraction. A 15 g powdered sample was subjected to Soxhlet extraction for 10 hours using 175 mL of solvent. For ultrasonic-assisted extraction, 15 g of powdered sample was extracted using 175 mL of solvent in an ultrasonic bath at 25-40°C for 90 minutes with three repetitions. The solvents were evaporated below 40°C in a rotary evaporator and lyophilised at -110°C. The lyophilised extracts were stored at -20°C until further testing.
2.2. Analysis of Phenolic Compounds by High-Performance Liquid Chromatography (HPLC)
For HPLC analysis (Shimadzu LC-2050C 3D), a C-18 reverse-phase column (250 mm x 4.6 µm) was used. The column temperature was maintained at 40°C, and readings were taken at a wavelength of 280 nm (maximum absorbance). The extract concentration was set at 10 mg/mL. The analysis lasted for 68 minutes with a mobile phase flow rate of 1 mL/min and an injection volume of 20 µL. Methanol (A) and 2% acetic acid (B) were used as the mobile phase. The identification of phenolics was done by comparing retention times and HPLC spectra of each peak in the sample with those of the relevant phenolic compound standards [8,9]. Peak integration and calibration were performed using LabSolution Lite software, and results were presented as mean ± standard deviation. A p-value of <0.05 was considered statistically significant.
2.3. Determination of Total Phenolic and Flavonoid Contents
Total Phenolic Content (TPC): TPC was determined using the Folin-Ciocalteu method [10]. A mixture of 50 µL extract (2 mg/mL) and 1:9 diluted Folin-Ciocalteu reagent was allowed to react for 3 minutes. Then, 75 µL of 1% Na₂CO₃ solution was added to the mixture. After incubation in the dark at room temperature for 2 hours, absorbance was measured at 760 nm. TPC was expressed as mg gallic acid equivalents (GAEs) per gram of extract.
Total Flavonoid Content (TFC): TFC was determined using the AlCl₃ method [10,11,12]. A mixture of 200 µL extract (2 mg/mL) and 100 µL of 2% AlCl₃ solution prepared in methanol was incubated at room temperature for 10 minutes. Absorbance was measured at 415 nm against a blank. TFC was expressed as mg rutin equivalents (mg REs/g extract) per gram of extract.
2.4. Determination of Antioxidant Activities
2.4.1. DPPH Radical Scavenging Activity
A 50 µL extract (2 mg/mL) was mixed with 150 µL of 0.004% methanolic DPPH solution. The mixture was incubated in the dark for 30 minutes, and absorbance was measured at 517 nm. DPPH radical scavenging capacity was expressed as mg trolox equivalents (mg TEs/g extract) per gram of extract [10].
2.4.2. ABTS Radical Scavenging Activity
ABTS radical was prepared by mixing 7.4 mM ABTS solution with 2.45 mM K₂S₂O₈ and incubating in the dark at room temperature for 12-16 hours. A 25 µL extract (2 mg/mL) was mixed with 200 µL ABTS solution and incubated at room temperature for 30 minutes. Absorbance was measured at 734 nm. ABTS radical scavenging capacity was expressed as mg trolox equivalents (mg TEs/g extract) per gram of extract [10].
2.4.3. Ferric Reducing Antioxidant Power (FRAP)
The FRAP reagent was prepared by mixing 300 mM acetate buffer (pH 3.6), 2,4,6-tris(2-pyridyl)-s-triazine (TPTZ, 10 mM) prepared in 40 mM HCl, and 20 mM ferric chloride (FeCl₃) solutions in a volume ratio of 10:1:1. A 25 µL extract (2 mg/mL) was mixed with 200 µL FRAP reagent and incubated at room temperature for 30 minutes. Absorbance was measured at 593 nm. FRAP-reducing potentials were expressed as Trolox equivalents per gram of extract (mg TEs/g extract) [10].
2.4.4. Cupric Reducing Antioxidant Capacity (CUPRAC)
The CUPRAC reagent was prepared by mixing CuCl₂·2H₂O (1 mL, 10 mM), neocuproine (1 mL, 7.5 mM), and ammonium acetate (1 mL, 1 M, pH 7.0). A 25 µL extract (2 mg/mL) was mixed with CUPRAC reagent and incubated at room temperature for 30 minutes. Absorbance was measured at 450 nm. CUPRAC-reducing potentials were expressed as Trolox equivalents per gram of extract (mg TEs/g extract) [10,13].
2.4.5. Total Antioxidant Capacity by Phosphomolybden Assay
The phosphomolybden reagent was prepared by dissolving 0.6 M sulfuric acid (H₂SO₄), 28 mM sodium phosphate (Na₂HPO₄), and mM ammonium molybdate ((NH₄)₆Mo₇O₂₄) in distilled water (dH₂O). A mixture of 100 μL of extract at a concentration of 2 mg/mL and 2 mL of the reagent solution was incubated at 95°C for 90 minutes. After the incubation period, absorbance was measured at 695 nm. Total antioxidant capacities were expressed as Trolox equivalents per gram of extract (mg TEs/g extract) [10].
2.4.6. Metal Chelating Activity
100 μL of extract at a concentration of 2 mg/mL with 50 μL of FeCl₂ solution were mixed, followed by adding 100 μL of ferrozine and the mixture was incubated at room temperature for 10 minutes. Then, the absorbance was measured at 562 nm. The metal chelation activities were expressed as EDTA equivalents (mg EDTA/g extract) per gram of extract [10].
2.5. Enzyme Inhibition Activities
2.5.1. AChE and BChE Inhibition Activities
The extracts' AChE (acetylcholinesterase) and BChE (butyrylcholinesterase) inhibition abilities were determined using a modified spectrophotometric Ellman’s method. A 50 µL extract (2 mg/mL), 25 µL AChE (or BChE) enzyme solution prepared in Tris-HCl buffer (pH=8.0), and 125 µL DTNB (5,5-dithio-bis(2-nitrobenzoic acid)) were mixed and incubated at room temperature for 15 minutes. Following this, 25 µL acetylthiocholine iodide (ATCI) or butyrylthiocholine chloride (BTCl) was added, and the mixture was further incubated at room temperature for 10 minutes. Absorbance was measured at 405 nm. The AChE/BChE inhibition capacities were expressed as mg galantamine equivalents (GALAEs) per gram of extract [10,11].
2.5.2. α-Amylase Inhibition Activity
The α-amylase inhibition activity was determined using the Caraway-Somogyi iodine/potassium iodide (IKI) method. A 25 µL extract (2 mg/mL) was mixed with 50 µL phosphate buffer (pH=6.9, 6 mM sodium chloride) containing α-amylase solution and incubated at 37ºC for 10 minutes. Then, 50 µL of a 0.05% starch solution was added and incubated at 37ºC for another 10 minutes. The reaction was stopped by adding 25 µL HCl (1 M), followed by 100 µL iodine-potassium iodide solution. Absorbance was measured at 630 nm [10,11].
2.5.3. α-Glucosidase Inhibition Activity
To determine α-glucosidase inhibition activity, 50 µL extract (2 mg/mL), 50 µL glutathione, 50 µL α-glucosidase solution (prepared in phosphate buffer), and 50 µL PNPG (4-p-nitrophenyl-α-D-glucopyranoside) were mixed and incubated at 37ºC for 10 minutes. The reaction was completed by adding 50 µL sodium carbonate (0.2 M), and absorbance was measured at 400 nm. The α-amylase and α-glucosidase inhibition capacities were expressed as mg acarbose equivalents (ACEs) per gram of extract [10,11].
2.5.4. Tyrosinase Inhibition Activity
The tyrosinase inhibition activity was determined using the dopachrome method. A 25 µL extract (2 mg/mL), 40 µL tyrosinase solution, and 100 µL phosphate buffer (pH=6.8) were mixed and incubated at 25ºC for 15 minutes. Then, 40 µL L-DOPA was added and incubated at room temperature for 10 minutes. Absorbance was measured at 492 nm. Kojic acid was used as the standard, and the tyrosinase inhibition capacities of the extracts were expressed as mg kojic acid equivalents (KAEs) per gram of extract [10,11].
2.6. Cytotoxicity and Antiviral Tests
Cell Lines and Virus Strains: The cytotoxic and antiviral activities of the extracts were tested using the human larynx epidermoid carcinoma cell line (HEp-2, ATCC-CCL-23) and African green monkey kidney cells (Vero, ATCC-CCL-81). Human respiratory syncytial virus (HRSV; ATCC-VR-26) was propagated in HEp-2 cells, while herpes simplex virus 1 (HSV-1) HF strain (ATCC-VR-260) was propagated in Vero cells. Cell lines were maintained in Minimum Essential Media (MEM, Sartorius) supplemented with fetal bovine serum (FBS, Sigma-Aldrich), antibiotic-antimycotic solution (Sigma-Aldrich), and L-glutamine solution [(200 mM) Capricorn Scientific]. Dulbecco’s Phosphate Buffered Saline (DPBS, Sartorius), trypsin (0.25% Trypsin-EDTA (1X), Gibco), MTT (3-(4,5-dimethylthiazol-2-yl)-2,5-diphenyltetrazolium bromide) (Sigma-Aldrich), DMSO (dimethyl sulfoxide) (Sigma-Aldrich), ribavirin (Sigma), and acyclovir (Sigma) were procured commercially.
2.6.1. Cytotoxicity Assay
The cytotoxic activities of the extracts on HEp-2 and Vero cell lines were evaluated using the MTT assay [14]. Serial dilutions of the extracts were prepared in a 96-well microplate, starting at a concentration of 50 mg/mL in a total volume of 100 µL. Each well added 50 µL of a cell suspension containing 2.5 × 10⁵ cells/mL. Wells without extracts were used as cell controls. After a two-day incubation at 37°C with 5% CO₂, cell viability was determined using the MTT method. MTT solution (prepared at 5 mg/mL in PBS) was added to the wells and incubated. Absorbance values were measured at 570 nm (with 630 nm as the reference wavelength). The percentage of cytotoxicity was calculated using the formula below [15]:
Where:
A = The average OD of the cell control (untreated cells)
B = The average OD of cells treated with extracts
CC50 (50% cytotoxic concentration) and MNTC (maximum non-toxic concentration) values were calculated using GraphPad Prism software (Version 8.03) [17]. The same procedure was applied to positive controls, ribavirin, and acyclovir.
2.6.2. Antiviral Activity Assay
The antiviral activities of the extracts against HRSV and HSV-1 were evaluated using the MTT method. The test was performed using serial dilutions of the extracts starting from their MNTC values in a 96-well microplate. For HEp-2 cells, the MNTC for aqueous extracts was 8333.33 µg/mL, while for ethanol extracts, it was 4166.67 µg/mL. The MNTC for all extracts was 4166.67 µg/mL for Vero cells. 100 µL of cell suspension (2.5 × 10⁵ cells/mL) was seeded in each well and incubated for 24 hours. After removing the medium, 100 µL of extract dilutions and 100 µL of HRSV/HSV-1 suspension prepared at 100 TCID50 were added to the wells. Cell controls (2.5 × 10⁵ cells/mL) and virus controls were also prepared. After a three-day incubation, when maximum syncytium formation was observed in virus control wells, cell viability was assessed using the MTT method. MTT solution (5 mg/mL in PBS) was added to the wells, and absorbance was measured at 570 nm (with 630 nm as the reference wavelength). The percentage of protection provided by the extracts against HRSV/HSV-1 was calculated using the formula below [15]:
Where:
A = The average OD of cells treated with extracts
B = The average OD of the virus control
C = The average OD of the cell control
Using the protection percentages, EC50 (the concentration providing 50% protection of infected cells) and the selective index (SI = CC50/EC50) were calculated with GraphPad Prism software (Version 8.03). Positive controls (ribavirin and acyclovir) were also tested similarly.
2.7. The Statistical Analyses
The statistical analyses for the experiments were performed using SPSS 20 software. All tests were conducted in triplicates, and the results are presented as mean ± standard deviation. A one-way analysis of variance (ANOVA) was performed to assess the differences between the groups, followed by Tukey's post hoc test and Kruskal-Wallis Test. Significance was set at p < 0.05. The cytotoxic and antiviral activity data were analysed using GraphPad Prism Version 8.03.
3. Results
3.1. HPLC Analysis Results
Twenty-one different phenolic standards were used in the study to identify potential bioactive compounds in the extracts (Table 1). The most dominant phenolic compounds determined in the extracts are given in Figure 1. A total of 20 phenolic compounds were identified in the SEE extract, with quercetin-3-O-rutinoside-7-O-glucoside (1) (1.015±0.158 mg/g extract) being the predominant phenolic compound. Among the 7 identified phenolic compounds in the SEW extract, quercetin (2) (0.447±0.056 mg/g extract) is the most abundant. The predominant phenolic compound in the UAE and UAW extracts was quercetin (2) (1.163±0.327 mg/g extract and 1.184±0.506 mg/g extract, respectively). 13 phenolic compounds were identified in the UAE extract. In comparison, 16 phenolic compounds were identified in the UAW extract.
Phenolic composition and quantities varied significantly depending on the extraction method and solvent type. The phenolic compounds and their quantities in the extracts varied depending on the extraction method and the solvent used. Quercetin was identified as the most dominant phenolic compound in the extracts, while ferulic acid was notably absent. The SEE extracts exhibited the highest diversity of phenolic compounds.
3.2. Total Phenolic and Flavonoid Content Results
The TPC and TFC of A. bisporus extracts were measured, with results summarised in Table 2. Significant differences were observed in TPC and TFC based on the extraction method and solvent used. In the study, a significant difference (P < 0.05) was observed between the total phenolic content (TPC) and total flavonoid content (TFC).
The highest total phenolic content was observed in the SEE, with 13.84±0.11 mg gallic acid equivalents (GAEs/g extract), closely followed by UAW, with 13.82±0.14 mg GAEs/g extract. The highest value for total flavonoid content was found in SEE, at 0.73±0.03 mg REs/g extract.
3.3. Antioxidant Activity Results
Antioxidant activity was assessed using six different evaluation methods. The free radical scavenging capacities of A. bisporus extracts were measured by DPPH and ABTS methods, and results are provided in Table 3. In both analyses, the SEE extract demonstrated the highest activity (20.29 ± 1.69 mg TEs/g extract for DPPH and 48.33 ± 3.03 mg TEs/g extract for ABTS). The lowest activity was observed in the UAE extract. Ethanol extract in Soxhlet extraction and aqueous extract in ultrasonic-assisted extraction exhibited higher free radical scavenging activity.
Reducing power is an important indicator of potential antioxidant activity. The reducing power activities were determined using the FRAP and CUPRAC methods. In the FRAP analysis, the highest activity was observed in the UAE extract (33.95 ± 0.04 mg TEs/g extract), while the lowest activity was recorded in the UAW extract (22.52 ± 0.20 mg TEs/g extract). In the CUPRAC analysis, the highest activity was found in the SEE extract (54.35 ± 1.24 mg TEs/g extract), whereas the lowest activity was detected in the SEW extract (29.61 ± 0.39 mg TEs/g extract).
The phosphomolybdate assay was used to measure the total antioxidant capacity. The highest total antioxidant capacity was determined in the SEE (1.44 ± 0.06 mg TEs/g extract) and UAE (1.41 ± 0.08 mg TEs/g extract) extracts. Ethanol extracts exhibited relatively higher total antioxidant activity compared to aqueous extracts.
In the metal chelating activity, unlike the results of other antioxidant assays, the aqueous extracts exhibited higher metal chelating activity compared to the ethanol extracts. The highest activity was observed in the SEW extract (29.55 ± 0.04 mg EDTAE/g extract), while the lowest activity was recorded in the SEE extract (14.02 ± 0.38 mg EDTAE/g extract).
3.4. Enzyme Inhibition Activity Results
The enzyme inhibition activities of the extracts were investigated, and the results are presented in Table 4. The highest AChE enzyme inhibition ability was determined in the SEE extract (2.56 ± 0.02 mg GALAEs/g extract), while the UAE extract showed no activity. The highest BChE enzyme inhibition activity was found in the UAE extract (6.34 ± 0.08 mg GALAEs/g extract), while the aqueous extracts showed no activity. The highest α-amylase inhibition ability was determined in the UAE extract (0.29 ± 0.00 mmol ACEs/g extract), while the highest α-glucosidase inhibition ability was found in the SEE extract (1.03 ± 0.00 mg ACEs/g extract). When the extracts' inhibition abilities against the tyrosinase enzyme were examined, it was found that the ethanol extracts exhibited higher activity. The SEE extract determined the highest activity (51.97 ± 0.80 mg KAEs/g extract). Based on the current results, it can be said that the enzyme inhibition abilities of the ethanol extracts are higher than those of the aqueous extracts.
3.5. Cytotoxicity and Antiviral Activity Results
The MNTC and CC50 values of the extracts are presented in Table 5. The cell images of the extracts at MNTC values are shown in Figure 2. In contrast, the dose-response curves plotted with the percentages of cytotoxicity on cell lines are depicted in Figure 3. In Hep-2 cells, the MNTC value of the ethanol extracts obtained by both extraction methods was determined to be 4166.67 µg/mL, while the MNTC value of the aqueous extracts was 8333.33 µg/mL. In Vero cells, the MNTC value for all extracts was determined to be 4166.67 µg/mL. Rukunga and Simons [18] classified extracts based on their CC50 values as follows: extracts with a CC50 value <2 µg/mL are considered cytotoxic, extracts with a CC50 value between 2-89 µg/mL are classified as moderately cytotoxic, and extracts with a CC50 value >90 µg/mL are classified as non-toxic. According to this classification, the CC50 values of the tested extracts and positive controls fall within the non-toxic category.
The cell control and virus control microscope images used in antiviral activity experiments are given in Figure 4. The protection percentages of the extracts against HRSV and HSV-1 were calculated, and the dose-response graphs drawn with the protection percentages are given in Figure 5. The extracts' selectivity index (SI) was calculated using the protection percentage values obtained from antiviral activity tests, along with the EC50 values and the CC50/EC50 ratio (Table 5).
When the anti-HRSV activity of the extracts was examined, the highest SI value was found in the SEW extract (SI = 135.90), and all tested extracts exhibited anti-HRSV activity. Furthermore, it was determined that the water extracts had higher anti-HRSV activity than the ethanol extracts for both extraction methods. When the anti-HSV-1 activity of the extracts was examined, the highest SI value was determined in the UAW extract (SI = 85.86). No antiviral activity was observed in the SEW and UAE extracts. Among the tested extracts, only the UAW extract showed anti-HSV-1 activity.
4. Discussion
Authors should discuss the results and how they can be interpreted from the perspective of previous studies and of the working hypotheses. The findings and their implications should be discussed in the broadest context possible. Future research directions may also be highlighted.
4.1. HPLC Analysis Results
Phenolic compounds like phenolic acids and flavonoids have been reported to possess a wide range of biological activities, including antibacterial, antiallergic, antiviral, antioxidant, anti-inflammatory, and anti-ageing effects [19]. Studies have shown that naturally occurring dietary flavonoids, including quercetin, myricetin, and gallic acid, can affect the infectivity and replication of viruses such as herpes simplex virus type 1 (HSV-1), poliovirus type 1, parainfluenza virus type 3, and respiratory syncytial virus (RSV) [20]. In recent studies, various bioactive compounds such as myricetin, gallic acid, linalool, apigenin, caffeic acid, catechin, luteolin, ferulic acid, catechin hydrate, epigallocatechin (EGC), epigallocatechin gallate (EGCG), epicatechin (EC), epicatechin gallate (ECG), naringenin, naringin, genistein, baicalin, fisetin, myricetin, quercetin, galangin, and others have been reported to exhibit antiviral activity against different viruses. These compounds target various steps of the viral life cycle, such as inhibiting viral entry, replication, and protein synthesis. For example, flavonoids like myricetin and quercetin have shown significant antiviral effects against a range of viruses, including herpes simplex virus (HSV) and influenza virus, with similar findings for catechins in green tea and other polyphenols [21,22,23].
The concentrations of various phenolic compounds found in A. bisporus extracts differ depending on the extraction method, the solvent used, and the mushroom strain. Some studies have reported the presence of several phenolic acids and flavonoids with notable biological activities. Palacios, et al. [24] identified caffeic acid (15.54±0.42 mg/g), catechin (0.51±0.01 mg/g), chlorogenic acid (63.73±0.74 mg/g), ferulic acid (16.37±1.89 mg/g), gallic acid (94.90±4.50 mg/g), homogentisic acid (3444.30±15.87 mg/g), and myricetin (22.26±1.72 mg/g) in the methanol extract of A. bisporus. Reis, et al. [25] also reported gallic acid (62.76 ± 12.55 μg/g dry weight) in their methanol extracts. Liu, et al. [26] detected several phenolics in ethanol extracts, including gallic acid (280.45 μg/g dry weight), catechin (56.74 μg/g), caffeic acid (392.51 μg/g), ferulic acid (42.83 μg/g), and myricetin (2729.46 μg/g). Gąsecka, et al. [27] reported varying concentrations of gallic acid (7.3±0.2 to 8.4±0.5 mg/100 g dry sample), caffeic acid (1.01±0.1 to 1.5±0.2 mg/100 g dry sample), and ferulic acid (1.2±0.1 to 1.05±0.1 mg/100 g dry sample) in six different A. bisporus strains using 70% ethanol. In contrast, Elhusseiny, et al. [28] found catechin (0.07 ± 0.01 µg/mL) and chlorogenic acid (0.09 ± 0.02 µg/mL) in water extracts but did not detect gallic acid, rutin, or apigenin. Kutluer [29] detected quercetin (1.163 µg/g), ferulic acid (6.064 µg/g), and 4-hydroxybenzoic acid (0.185 µg/g) in A. bisporus extracts. In our study, ferulic acid was not detected in the tested extracts despite its presence being reported in some studies on A. bisporus. These discrepancies could stem from several factors:
(1) Strain Variations: Different A. bisporus strains may naturally vary in their phenolic profiles, affecting the presence and concentration of compounds like ferulic acid.
(2) Environmental and Climatic Factors: Conditions such as temperature, humidity, and light exposure during growth can influence secondary metabolite production in mushrooms.
(3) Cultivation Methods: Factors like the type of compost, nutrient availability, and growing techniques (organic vs. conventional) can impact the phenolic composition.
(4) Harvesting Conditions: The stage of maturity at harvest and post-harvest handling methods might affect metabolite retention.
(5) Extraction Methods and Solvents: Different solvents (e.g., ethanol, methanol, water) and techniques (e.g., Soxhlet, ultrasonic extraction) can extract varying compounds depending on their solubility and stability.
(6) Analytical Methods: Differences in detection methods, such as the sensitivity and specificity of HPLC protocols, can lead to variability in the identification and quantification of phenolics.
4.2. Total Phenolic and Flavonoid Content Results
In the study, the SEW exhibited the lowest number of phenolic compounds in HPLC analysis and showed the lowest total phenolic and flavonoid content among the extracts. This correlation suggests that phenolic and flavonoid abundance directly impacts the overall bioactivity of the extracts. Interestingly, Gil-Ramírez, et al. [30]Gil-Ramírez et al. (2016) argued that mushrooms lack the necessary enzymes to synthesize flavonoids. However, they also acknowledged that mushrooms can absorb these compounds through a mycorrhizal relationship with plants or substrates. This could explain the presence of flavonoids in A. bisporus extracts despite their generally low concentrations. The current study's findings align with this perspective, as flavonoids were detected in A. bisporus extracts, but their TFC levels were relatively low. This suggests that the source of flavonoids in mushrooms might not be endogenous synthesis but absorption from their growing environment
Total phenolic and total flavonoid contents in A. bisporus water extract were reported by Elhusseiny, et al. [28] as TPC 27.45 ± 0.8 mg/g extract, TFC 11.96 ± 1.81 mg/g extract; Krishnamoorthi, et al. [31] as TPC 0.441 ± 0.01 g/100 g and TFC 0.783 ± 0.03 g/100 g. Chaudhary, et al. [32] reported the values as 14.5±0.5 mg GAE/g in TPC methanol extract, 7.16±0.44 mg GAE/g in chloroform extract, 33.83±0.25 mg QE/g in TFC chloroform extract, 21.66±0.19 mg QE/g in methanol extract. Agboola, et al. [33] examined A. bisporus samples collected from four locations, analysing the stems and caps using 50% methanol extracts. Their findings reported TPC between 2.21±0.05 and 5.56±0.08 mg GAE/g dry weight and TFC between 0.52±0.02 and 1.81±0.56 mg CE/g dry weight. It has been reported that the cap part of the mushroom has higher total phenolic and total flavonoid content than the stem part. The results are consistent with some studies in the literature, while some are different.
4.3. Antioxidant Activity Results
The O₂ molecule is essential for life but is also a source of reactive oxygen species (ROS), which are free radicals [34]. ROS formation has been implicated in various diseases, including cancer, cardiovascular diseases, Alzheimer’s and Parkinson’s diseases, immune dysfunction, muscle degeneration in the elderly, and cataracts. Evidence increasingly supports the role of ROS in these conditions [35]. Antioxidants counteract ROS by stabilising free radicals, thereby preventing cellular damage and oxidative stress, which are significant contributors to these diseases [34]. Mushrooms, rich in bioactive compounds like phenolics, polysaccharides, and flavonoids, are emerging as important sources for developing novel antioxidants.
Their diverse chemical composition makes them a valuable natural resource for exploring antioxidant potential in medical and pharmaceutical applications. Evaluating the antioxidant activity of compounds and complex mixtures, such as plant extracts, using a single method cannot fully capture all the potential mechanisms involved. Different antioxidants act through a variety of mechanisms, such as scavenging free radicals, inhibiting metal ion catalysis, or preventing lipid peroxidation, and a single assay may not be sufficient to assess these diverse actions [36]. To accurately assess antioxidant activity, employing multiple methods and oxidation conditions is essential. As Frankel and Meyer [37] suggest, using various methods helps to measure different oxidative products, thus capturing the full spectrum of an antioxidant's potential. Each assay can detect specific antioxidant mechanisms, such as free radical scavenging, metal ion chelation, or inhibition of lipid peroxidation. By applying different techniques and conditions, researchers can better understand how antioxidants function and interact under various biological environments. This approach ensures that no single mechanism is overlooked, leading to more reliable and nuanced conclusions regarding the antioxidant efficacy of compounds.
The antioxidant activity of mushroom extracts is generally associated with their high phenolic content [28]. In our study, except for metal chelating activity, the SEE exhibited higher antioxidant activity, which was in parallel with its high phenolic content in most tests. In ultrasonic-assisted extraction, although the UAW extract had a higher phenolic content, its antioxidant activity in radical scavenging tests (DPPH and ABTS) was higher. However, it showed lower antioxidant activity than the ethanol extract in other tests. A study by Matuszewska, et al. [38]Matuszewska et al. (2018) reported that despite having low phenolic content, the fractions of Cerrena unicolor (Bull.) Murrill exhibited high antioxidant activities, suggesting that phenols may not play a key role in antioxidant activity.
Gąsecka, et al. [27] determined ethanol extracts' DPPH radical scavenging activities from six different A. bisporus strains, ranging from 62.7 ± 2.5% to 71.3 ± 2.1%. Elhusseiny, et al. [28] investigated the antioxidant activity of A. bisporus water extract, reporting DPPH radical scavenging activity with an IC50 of 83.93 ± 0.62 µg/mL, ABTS radical scavenging activity with an IC50 of 29.96 ± 7.03 µg/mL, and ORAC capacity with an IC50 of 75.64 ± 4.65 µg/mL, concluding that A. bisporus extract demonstrated good antioxidant activity. Jegathchandran, et al. [39] examined the antioxidant activity of A. bisporus water extract, determining its DPPH radical scavenging ability as 130.91 mg/mL. Kutluer [29] investigated the DPPH radical scavenging activity of A. bisporus 70% ethanol extract at concentrations of 0.05 to 2 mg/mL, reporting scavenging activities of 15.6% and 75.9%, respectively, and noting that antioxidant activity increased with concentration.
4.4. Enzyme Inhibition Activity Results
A literature review revealed limited information on the enzyme inhibition activity of A. bisporus. Some studies report that A. bisporus has antidiabetic effects, increases digestive enzymes, lowers blood sugar levels, and enhances insulin production [5,40]. In a study by Öztürk, et al. [41], the AChE enzyme inhibition activity of A. bisporus was reported in ethyl acetate extract (EC50: 2.277 ± 0.01 mg/mL), while BChE enzyme inhibition activity was observed in methanol (EC50: 1.289 ± 0.01 mg/mL), ethyl acetate (EC50: 0.393 ± 0.001 mg/mL), and hexane (EC50: 0.188 ± 0.001 mg/mL) extracts. Kim, et al. [42] found that extracts obtained from five different A. bisporus strains using 80% methanol exhibited α-amylase and α-glucosidase inhibitory activity, which increased with concentration. Several studies on mushroom species have also demonstrated enzyme inhibition activities [43,44,45].
4.5. Cytotoxicity and Antiviral Activity Results
In all extracts showing antiviral activity, the highest protection percentages were determined at the MNTC values. The selectivity index (SI) is a commonly used parameter to measure how safe a compound is for use as an antiviral agent. Higher SI values indicate greater effectiveness and reliability of the drug [28]. Typically, an SI of 10 or above demonstrates antiviral activity [46].
A literature review revealed no studies on the A. bisporus activity against HRSV and HSV-1. However, some studies on its antiviral activity have been found, and the results suggest that A. bisporus exhibits antiviral activity.
del Mar Delgado-Povedano, et al. [47] reported that the crude extract and the enzymatic water extract of A. bisporus exhibited HCV protease NS3/NS4 inhibition activities of 64.85% and 75.56%, respectively. The extracts were reported to show higher inhibition activity compared to quercetin. It has been determined that tyrosinase obtained from A. bisporus exhibits high antiviral activity against the Hepatitis C virus [48]. Gallego, et al. [49] demonstrated that the water extract of A. bisporus has an in vitro inhibitory effect on NS3/4A protease and HCV replication. Additionally, Elhusseiny, et al. [50] reported that the water extract of A. bisporus exhibited moderate antiviral activity against SARS-CoV-2.Elhusseiny, et al. [28] reported that the water extract of A. bisporus obtained by maceration showed the following values: for Human Adenovirus Type 7, the CC50 value was 8.339 µg/mL, the IC50 value was 15.28 µg/mL, and the SI value was 0.54; for HSV-2, the CC50 value was 59.07 µg/mL, the IC50 value was 15.9 µg/mL, and the SI value was 3.7. These results are similar to the other extracts, except for the aqueous extract obtained by ultrasonic-assisted extraction against HSV-1. It is believed that the observed differences may be due to variations in the extraction method, extraction time, and the cultivation conditions of the samples. Anti-HRSV and anti-HSV-1 activities have also been reported in certain mushroom species, such as Morchella conica Pers., Fomes fomentarius (L.) Fr., Phellinus igniarius (L.) Quél., and Porodaedalea pini (Brot.) Murrill [51,52]. These studies indicate that extracts and mycochemicals derived from mushrooms could be important sources for the development of antiviral drugs.
5. Conclusions
Liu [53] suggested that the synergistic and additive effects of phytochemicals found in fruits and vegetables are responsible for their vigorous anticancer and antioxidant activities. The benefits of a diet rich in fruits and vegetables are attributed to the complex structure of these phytochemicals. Based on the HPLC analyses, the SEE extract was the richest in phenolic content and richness, demonstrating higher biological activity than other extracts.
Viral diseases occur when viruses enter the appropriate host body and multiply. After the virus enters the body, viral binding proteins bind with receptors on the target cell surface and enter the cell, where the viral genome is replicated using host ribosomes. Infectious virions are then scattered outside the cell, where they infect other cells or the new host, thus continuing the infection chain [54]. The extracts examined in this study were administered to the cell culture concurrently with the virus, exhibiting antiviral activity. Consequently, it is hypothesised that the extracts demonstrating antiviral activity impede the binding of viral glycoproteins to host cell surface receptors.
However, the antiviral properties of edible mushrooms have been attributed to their aqueous extracts, which are typically associated with water-soluble polysaccharides [28]. The majority of polysaccharides found in mushrooms include glucans and heteropolysaccharides, with α-D-glucan, β-D-glucan, and α/β-D-glucan being the most common. Numerous studies have reported that D-glucans contribute to human health and exhibit diverse activities depending on their chemical structure [55]. The higher antiviral activity observed in aqueous extracts in this study may be linked to the presence of glucans.
The study results highlight the phenolic components, total phenolic and flavonoid contents, antioxidant activities, enzyme inhibitory activities, and antiviral activities of various A. bisporus extracts. These findings confirm that A. bisporus is not only an excellent nutritional source but also beneficial for health. This research underscores the bioactive properties of A. bisporus extracts, including antioxidant, enzyme inhibitory, and antiviral activities. However, further research is needed to comprehensively evaluate the mechanisms underlying its biological activity and safety.
Author Contributions
H.H.D, Ü.Ü. and R.D., designed the study plan, applied for funding, and critically revised the manuscript; Z.H.K. and conducted the experiments and discussed the materials and methodology; H.H.D and Ü.Ü. analyzed all data and wrote the draft manuscript; R.D, A.D. and Z.H.K and H.Ö. worked on editing the final copy. H.H.D and Ü.Ü. contributed on paper editing. All authors have read and agreed to the published version of the manuscript.
Funding
“This research was funded by SCIENTIFIC RESEARCH PROJECTS COORDINATION OF SELÇUK UNIVERSITY, grant number BAP-22406001”.
Data Availability Statement
Data are provided within the manuscript or Supplementary Information Files.
Conflicts of Interest
No conflicts of interest are declared by the authors.
Abbreviations
The following abbreviations are used in this manuscript:
| HRSV | Human Respiratory Syncytial Virus |
| HSV-1 | Herpes simplex virus type 1 |
| SEE | Soxhlet ethanol extract |
| SEW | Soxhlet water extract |
| UAE | Ultrasonic-assisted ethanol extract |
| UAW | Ultrasonic-assisted water extract |
| HPLC | High-Performance Liquid Chromatography |
| GAEs | Gallic acid equivalent |
| REs | Routine equivalent |
| FRAP | Ferric Reducing Antioxidant Power |
| DPPH | 2,2-difenil1-pikrilhidrazil |
| ABTS | 2,2‟-azinobis (3-etil-bezotiazolin 6 sulfonat) |
| CUPRAC | CUPric Reducing Antioxidant Capacity |
| TEs | Trolox equivalent |
| EDTAE | EDTA equivalent |
| AChE | Acetylcholinesterase |
| GALAEs | Galantamine equivalent |
| ACEs | Acarbose equivalent |
| KAEs | Kojic acid equivalent |
| BChE | Butyrylcholinesterase |
| MTT | 3-(4,5-dimethylthiazol-2-yl)-2,5-diphenyltetrazolium bromide |
| TPC | Total Phenolic Content |
| TFC | Total Flavonoid Content |
| ATCC | American Type Culture Collection |
| HEp-2 | Human Larynx Epidermoid Carcinoma Cell Line |
| Vero | African Green Monkey Kidney Cell |
| MNTC | Maximum non-toxic concentration |
| CC50 | 50% Cytotoxic Concentration |
| EC50 | 50% Effective Concentration |
| SI | Selective index |
| RBV | Ribavirin |
| ACV | Acyclovir |
References
- Pinya, S.; Ferriol, P.; Tejada, S.; Sureda, A. Mushrooms reishi (Ganoderma lucidum), shiitake (Lentinela edodes), maitake (Grifola frondosa). In Nonvitamin and nonmineral nutritional supplements; Elsevier: 2019; pp. 517-526.
- Stojković, D.; Reis, F.S.; Glamočlija, J.; Ćirić, A.; Barros, L.; Van Griensven, L.J.; Ferreira, I.C.; Soković, M. Cultivated strains of Agaricus bisporus and A. brasiliensis: chemical characterization and evaluation of antioxidant and antimicrobial properties for the final healthy product–natural preservatives in yoghurt. Food & function 2014, 5, 1602-1612.
- Harikrishnan, R.; Devi, G.; Van Doan, H.; Balasundaram, C.; Thamizharasan, S.; Hoseinifar, S.H.; Abdel-Tawwab, M. Effect of diet enriched with Agaricus bisporus polysaccharides (ABPs) on antioxidant property, innate-adaptive immune response and pro-anti inflammatory genes expression in Ctenopharyngodon idella against Aeromonas hydrophila. Fish & Shellfish Immunology 2021, 114, 238-252. [CrossRef]
- Khatua, S.; Paul, S.; Acharya, K. Mushroom as the potential source of new generation of antioxidant: a review. Research Journal of Pharmacy and Technology 2013, 6, 496-505.
- Usman, M.; Murtaza, G.; Ditta, A. Nutritional, medicinal, and cosmetic value of bioactive compounds in button mushroom (Agaricus bisporus): a review. Applied Sciences 2021, 11, 5943.
- Muszyńska, B.; Kała, K.; Rojowski, J.; Grzywacz-Kisielewska, A.; Opoka, W. Composition and biological properties of Agaricus bisporus fruiting bodies: a review. 2017. [CrossRef]
- He, M.; Condict, L.; Richardson, S.J.; Brennan, C.S.; Kasapis, S. Molecular characterization of interactions between lectin-a protein from common edible mushroom (Agaricus bisporus)-and dietary carbohydrates. Food Hydrocolloids 2024, 146, 109253. [CrossRef]
- Ahmed, S.; Jubair, A.; Hossain, M.A.; Hossain, M.M.; Azam, M.S.; Biswas, M. Free radical-scavenging capacity and HPLC-DAD screening of phenolic compounds from pulp and seed of Syzygium claviflorum fruit. Journal of Agriculture and Food Research 2021, 6, 100203.
- Skendi, A.; Irakli, M.; Chatzopoulou, P. Analysis of phenolic compounds in Greek plants of Lamiaceae family by HPLC. Journal of applied research on medicinal and aromatic plants 2017, 6, 62-69. [CrossRef]
- Zengin, G.; Sarikurkcu, C.; Aktumsek, A.; Ceylan, R.; Ceylan, O. A comprehensive study on phytochemical characterization of Haplophyllum myrtifolium Boiss. endemic to Turkey and its inhibitory potential against key enzymes involved in Alzheimer, skin diseases and type II diabetes. Industrial Crops and Products 2014, 53, 244-251. [CrossRef]
- Sarikurkcu, C.; Uren, M.C.; Tepe, B.; Cengiz, M.; Kocak, M.S. Phenolic content, enzyme inhibitory and antioxidative activity potentials of Phlomis nissolii and P. pungens var. pungens. Industrial Crops and Products 2014, 62, 333-340. [CrossRef]
- Berk, S.; Tepe, B.; Arslan, S.; Sarikurkcu, C. Screening of the antioxidant, antimicrobial and DNA damage protection potentials of the aqueous extract of Asplenium ceterach DC. African Journal of Biotechnology 2011, 10, 8902-8908.
- Apak, R.; Güçlü, K.; Özyürek, M.; Esin Karademir, S.; Erçağ, E. The cupric ion reducing antioxidant capacity and polyphenolic content of some herbal teas. International journal of food sciences and nutrition 2006, 57, 292-304. [CrossRef]
- Vijayarathna, S.; Sasidharan, S. Cytotoxicity of methanol extracts of Elaeis guineensis on MCF-7 and Vero cell lines. Asian pacific journal of tropical biomedicine 2012, 2, 826-829. [CrossRef]
- Andrighetti-Fröhner, C.; Antonio, R.; Creczynski-Pasa, T.; Barardi, C.; Simões, C. Cytotoxicity and potential antiviral evaluation of violacein produced by Chromobacterium violaceum. Memórias do Instituto Oswaldo Cruz 2003, 98, 843-848. [CrossRef]
- Artun, T.; Karagoz, A.; Ozcan, G.; Melikoglu, G.; Anil, S.; Kultur, S.; Sutlupinar, N. In vitro anticancer and cytotoxic activities of some plant extracts on HeLa and Vero cell lines. Journal of BU ON.: official journal of the Balkan Union of Oncology 2016, 21, 720-725.
- Ho, W.S.; Xue, J.Y.; Sun, S.S.; Ooi, V.E.; Li, Y.L. Antiviral activity of daphnoretin isolated from Wikstroemia indica. Phytotherapy Research: An International Journal Devoted to Pharmacological and Toxicological Evaluation of Natural Product Derivatives 2010, 24, 657-661.
- Rukunga, G.; Simons, A.J. The potential of plants as a source of antimalarial agents: a review; PlantaPhile Publications Berlin, Germany: 2006.
- Čanadanović-Brunet, J.M.; Djilas, S.M.; Ćetković, G.S.; Tumbas, V.T.; Mandić, A.I.; Čanadanović, V.M. Antioxidant activities of different Teucrium montanum L. extracts. International Journal of Food Science and Technology 2006, 41, 667-673.
- Naithani, R.; Mehta, R.G.; Shukla, D.; Chandersekera, S.N.; Moriarty, R.M. Antiviral activity of phytochemicals: a current perspective. Dietary components and immune function 2010, 421-468.
- Lin, L.-T.; Hsu, W.-C.; Lin, C.-C. Antiviral natural products and herbal medicines. Journal of traditional and complementary medicine 2014, 4, 24-35.
- Loaiza-Cano, V.; Monsalve-Escudero, L.M.; Filho, C.d.S.M.B.; Martinez-Gutierrez, M.; Sousa, D.P.d. Antiviral role of phenolic compounds against dengue virus: A review. Biomolecules 2020, 11, 11. [CrossRef]
- Lyu, S.-Y.; Rhim, J.-Y.; Park, W.-B. Antiherpetic activities of flavonoids against herpes simplex virus type 1 (HSV-1) and type 2 (HSV-2) in vitro. Archives of pharmacal research 2005, 28, 1293-1301. [CrossRef]
- Palacios, I.; Lozano, M.; Moro, C.; D’Arrigo, M.; Rostagno, M.; Martínez, J.A.; García-Lafuente, A.; Guillamón, E.; Villares, A. Antioxidant properties of phenolic compounds occurring in edible mushrooms. Food chemistry 2011, 128, 674-678. [CrossRef]
- Reis, F.S.; Martins, A.; Barros, L.; Ferreira, I.C. Antioxidant properties and phenolic profile of the most widely appreciated cultivated mushrooms: A comparative study between in vivo and in vitro samples. Food and chemical toxicology 2012, 50, 1201-1207. [CrossRef]
- Liu, J.; Jia, L.; Kan, J.; Jin, C.-h. In vitro and in vivo antioxidant activity of ethanolic extract of white button mushroom (Agaricus bisporus). Food and chemical toxicology 2013, 51, 310-316. [CrossRef]
- Gąsecka, M.; Magdziak, Z.; Siwulski, M.; Mleczek, M. Profile of phenolic and organic acids, antioxidant properties and ergosterol content in cultivated and wild growing species of Agaricus. European Food Research and Technology 2018, 244, 259-268. [CrossRef]
- Elhusseiny, S.M.; El-Mahdy, T.S.; Awad, M.F.; Elleboudy, N.S.; Farag, M.M.; Aboshanab, K.M.; Yassien, M.A. Antiviral, cytotoxic, and antioxidant activities of three edible agaricomycetes mushrooms: Pleurotus columbinus, Pleurotus sajor-caju, and Agaricus bisporus. Journal of Fungi 2021, 7, 645.
- Kutluer, F. Effect of formaldehyde exposure on phytochemical content and functional activity of Agaricus bisporus (Lge.) Sing. Environmental Science and Pollution Research 2024, 31, 35581-35594. [CrossRef]
- Gil-Ramírez, A.; Pavo-Caballero, C.; Baeza, E.; Baenas, N.; Garcia-Viguera, C.; Marín, F.R.; Soler-Rivas, C. Mushrooms do not contain flavonoids. Journal of functional foods 2016, 25, 1-13. [CrossRef]
- Krishnamoorthi, R.; Srinivash, M.; Mahalingam, P.U.; Malaikozhundan, B. Dietary nutrients in edible mushroom, Agaricus bisporus and their radical scavenging, antibacterial, and antifungal effects. Process Biochemistry 2022, 121, 10-17. [CrossRef]
- Chaudhary, H.; Modi, N.; Rawal, R. Evaluation of Chemical Constituents, Antioxidant and Antimicrobial Properties of Agaricus bisporus (JE Lange). Indian Journal of Natural Sciences 2023, 14, 66958-66967.
- Agboola, O.O.; Sithole, S.; Mugivhisa, L.; Amoo, S.; Olowoyo, J. Growth, nutritional and antioxidant properties of Agaricus bisporus (crimini and white) mushrooms harvested from soils collected around mining areas in South Africa. Measurement: Food 2023, 9, 100078. [CrossRef]
- Sánchez, C. Reactive oxygen species and antioxidant properties from mushrooms. Synthetic and systems biotechnology 2017, 2, 13-22. [CrossRef]
- Kozarski, M.; Klaus, A.; Niksic, M.; Jakovljevic, D.; Helsper, J.P.; Van Griensven, L.J. Antioxidative and immunomodulating activities of polysaccharide extracts of the medicinal mushrooms Agaricus bisporus, Agaricus brasiliensis, Ganoderma lucidum and Phellinus linteus. Food chemistry 2011, 129, 1667-1675. [CrossRef]
- Dorman, H.; Peltoketo, A.; Hiltunen, R.; Tikkanen, M. Characterisation of the antioxidant properties of de-odourised aqueous extracts from selected Lamiaceae herbs. Food chemistry 2003, 83, 255-262. [CrossRef]
- Frankel, E.N.; Meyer, A.S. The problems of using one-dimensional methods to evaluate multifunctional food and biological antioxidants. Journal of the Science of Food and Agriculture 2000, 80, 1925-1941. [CrossRef]
- Matuszewska, A.; Jaszek, M.; Stefaniuk, D.; Ciszewski, T.; Matuszewski, Ł. Anticancer, antioxidant, and antibacterial activities of low molecular weight bioactive subfractions isolated from cultures of wood degrading fungus Cerrena unicolor. PloS one 2018, 13, e0197044. [CrossRef]
- Jegathchandran, H.; Madhushani, W.N.; Liyanage, G.S. Comparative study on the nutritional composition, antibacterial and antioxidant properties of four edible mushroom species: Pleurotus ostreatus, Pleurotus eous, Agaricus bisporus and Lentinula edodes. 2024.
- Ekowati, N.; Yuniati, N.I.; Hernayanti, H.; Ratnaningtyas, N.I. Antidiabetic potentials of button mushroom (Agaricus bisporus) on alloxan-induced diabetic rats. Biosaintifika: Journal of Biology & Biology Education 2018, 10, 655-662. [CrossRef]
- Öztürk, M.; Duru, M.E.; Kivrak, Ş.; Mercan-Doğan, N.; Türkoglu, A.; Özler, M.A. In vitro antioxidant, anticholinesterase and antimicrobial activity studies on three Agaricus species with fatty acid compositions and iron contents: A comparative study on the three most edible mushrooms. Food and Chemical Toxicology 2011, 49, 1353-1360. [CrossRef]
- Kim, J.H.; Jang, M.J.; Park, Y.J. In vitro α-amylase, α-glucosidase, pancreatic lipase, xanthine oxidase inhibiting activity of Agaricus bisporus extracts. Mycobiology 2023, 51, 60-66.
- Alkan, H.; Zengin, G.; Kaşık, G. Antioxidant and in vitro some enzyme inhibitory activities of methanolic extract of cultivated Lentinula edodes. J Fungus 2017, 8, 90-98.
- Özparlak, H.; Alkan, S.; Zengin, G.; Aktümsek, A. Türkiye’deki yabani ve kültüre alınmış Ganoderma lucidum’un sulu ekstraktlarının in vitro bazı enzim inhibitör özelliklerinin karşılaştırılması. Mantar Dergisi 2016, 7, 110-117.
- Wei, Q.; Zhan, Y.; Chen, B.; Xie, B.; Fang, T.; Ravishankar, S.; Jiang, Y. Assessment of antioxidant and antidiabetic properties of Agaricus blazei Murill extracts. Food science & nutrition 2020, 8, 332-339. [CrossRef]
- Chattopadhyay, D.; Chawla-Sarkar, M.; Chatterjee, T.; Dey, R.S.; Bag, P.; Chakraborti, S.; Khan, M.T.H. Recent advancements for the evaluation of anti-viral activities of natural products. New Biotechnology 2009, 25, 347-368. [CrossRef]
- del Mar Delgado-Povedano, M.; de Medina, V.S.; Bautista, J.; Priego-Capote, F.; de Castro, M.D.L. Tentative identification of the composition of Agaricus bisporus aqueous enzymatic extracts with antiviral activity against HCV: A study by liquid chromatography–tandem mass spectrometry in high resolution mode. Journal of Functional Foods 2016, 24, 403-419.
- Lopez-Tejedor, D.; Claveria-Gimeno, R.; Velazquez-Campoy, A.; Abian, O.; Palomo, J.M. In vitro antiviral activity of tyrosinase from mushroom Agaricus bisporus against hepatitis C virus. Pharmaceuticals 2021, 14, 759. [CrossRef]
- Gallego, P.; Rojas, Á.; Falcón, G.; Carbonero, P.; García-Lozano, M.R.; Gil, A.; Grande, L.; Cremades, O.; Romero-Gómez, M.; Bautista, J.D. Water-soluble extracts from edible mushrooms (Agaricus bisporus) as inhibitors of hepatitis C viral replication. Food & Function 2019, 10, 3758-3767. [CrossRef]
- Elhusseiny, S.M.; El-Mahdy, T.S.; Elleboudy, N.S.; Yahia, I.S.; Farag, M.M.; Ismail, N.S.; Yassien, M.A.; Aboshanab, K.M. In vitro anti SARS-CoV-2 activity and docking analysis of Pleurotus ostreatus, Lentinula edodes and Agaricus bisporus edible mushrooms. Infection and Drug Resistance 2022, 3459-3475. ttps://doi.org/10.2147/idr.s362823.
- Doğan, H.H.; Duman, R.; Tuncer, P. Effect of Morchella conica and Fomes Fomentarius Extracts Against The Human Respiratory Syncytial Virus In-Vitro. Int J Pharm Sci Res 2018, 9, 5240-5245.
- Doğan, H.H.; Karagöz, S.; Duman, R. In vitro evaluation of the antiviral activity of some mushrooms from Turkey. International journal of medicinal mushrooms 2018, 20. [CrossRef]
- Liu, R.H. Health benefits of fruit and vegetables are from additive and synergistic combinations of phytochemicals. The American journal of clinical nutrition 2003, 78, 517S-520S. [CrossRef]
- Louten, J. Virus replication. Essential human virology 2016, 49.
- Gong, P.; Wang, S.; Liu, M.; Chen, F.; Yang, W.; Chang, X.; Liu, N.; Zhao, Y.; Wang, J.; Chen, X. Extraction methods, chemical characterizations and biological activities of mushroom polysaccharides: A mini-review. Carbohydrate Research 2020, 494, 108037. [CrossRef]
Figure 1.
The most dominant phenolic compounds identified in the extracts; (1) Quercetin-3-O-Rutinoside 7-O-Glucoside, (2) Quercetin, (3) Luteolin, (4) (+)-Catechin, (5) 3.4 Dihidroxybenzoic Acid, (6) Apigenin.
Figure 1.
The most dominant phenolic compounds identified in the extracts; (1) Quercetin-3-O-Rutinoside 7-O-Glucoside, (2) Quercetin, (3) Luteolin, (4) (+)-Catechin, (5) 3.4 Dihidroxybenzoic Acid, (6) Apigenin.
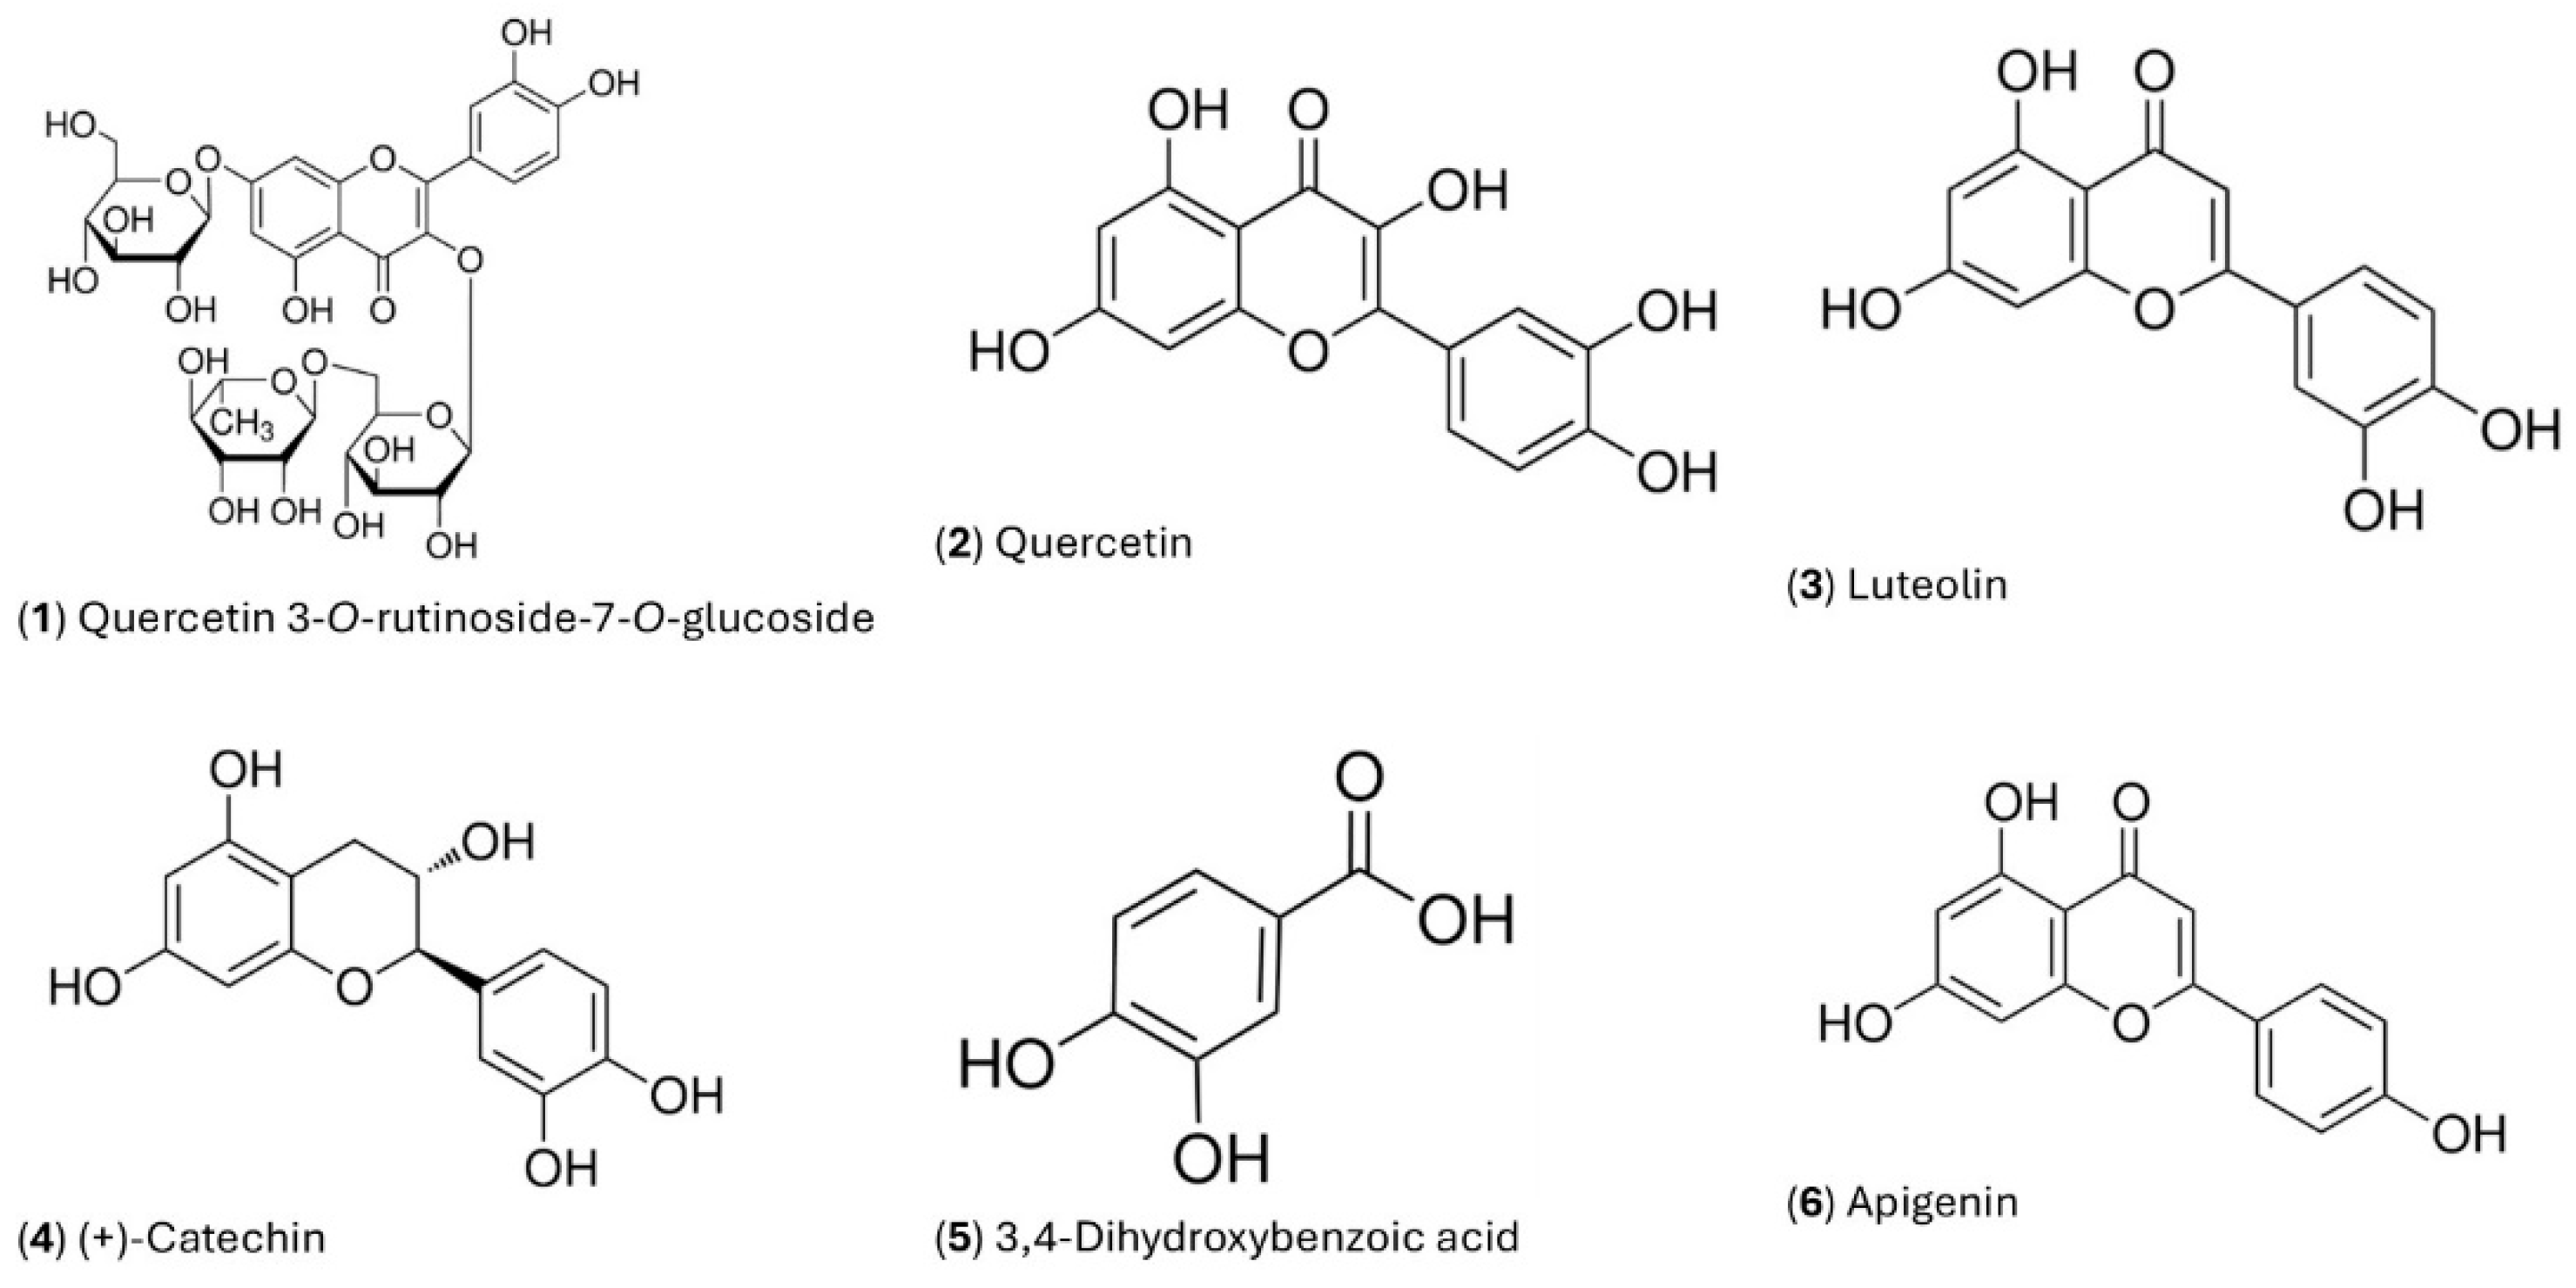
Figure 2.
Cell images at MNTC values of the tested extracts (x 4 magnification). MNTC: Maximum non-toxic concentration, SEE: Soxhlet ethanol extract, SEW: Soxhlet water extract, UAE: Ultrasonic-assisted ethanol extract, UAW: Ultrasonic-assisted water extract.
Figure 2.
Cell images at MNTC values of the tested extracts (x 4 magnification). MNTC: Maximum non-toxic concentration, SEE: Soxhlet ethanol extract, SEW: Soxhlet water extract, UAE: Ultrasonic-assisted ethanol extract, UAW: Ultrasonic-assisted water extract.
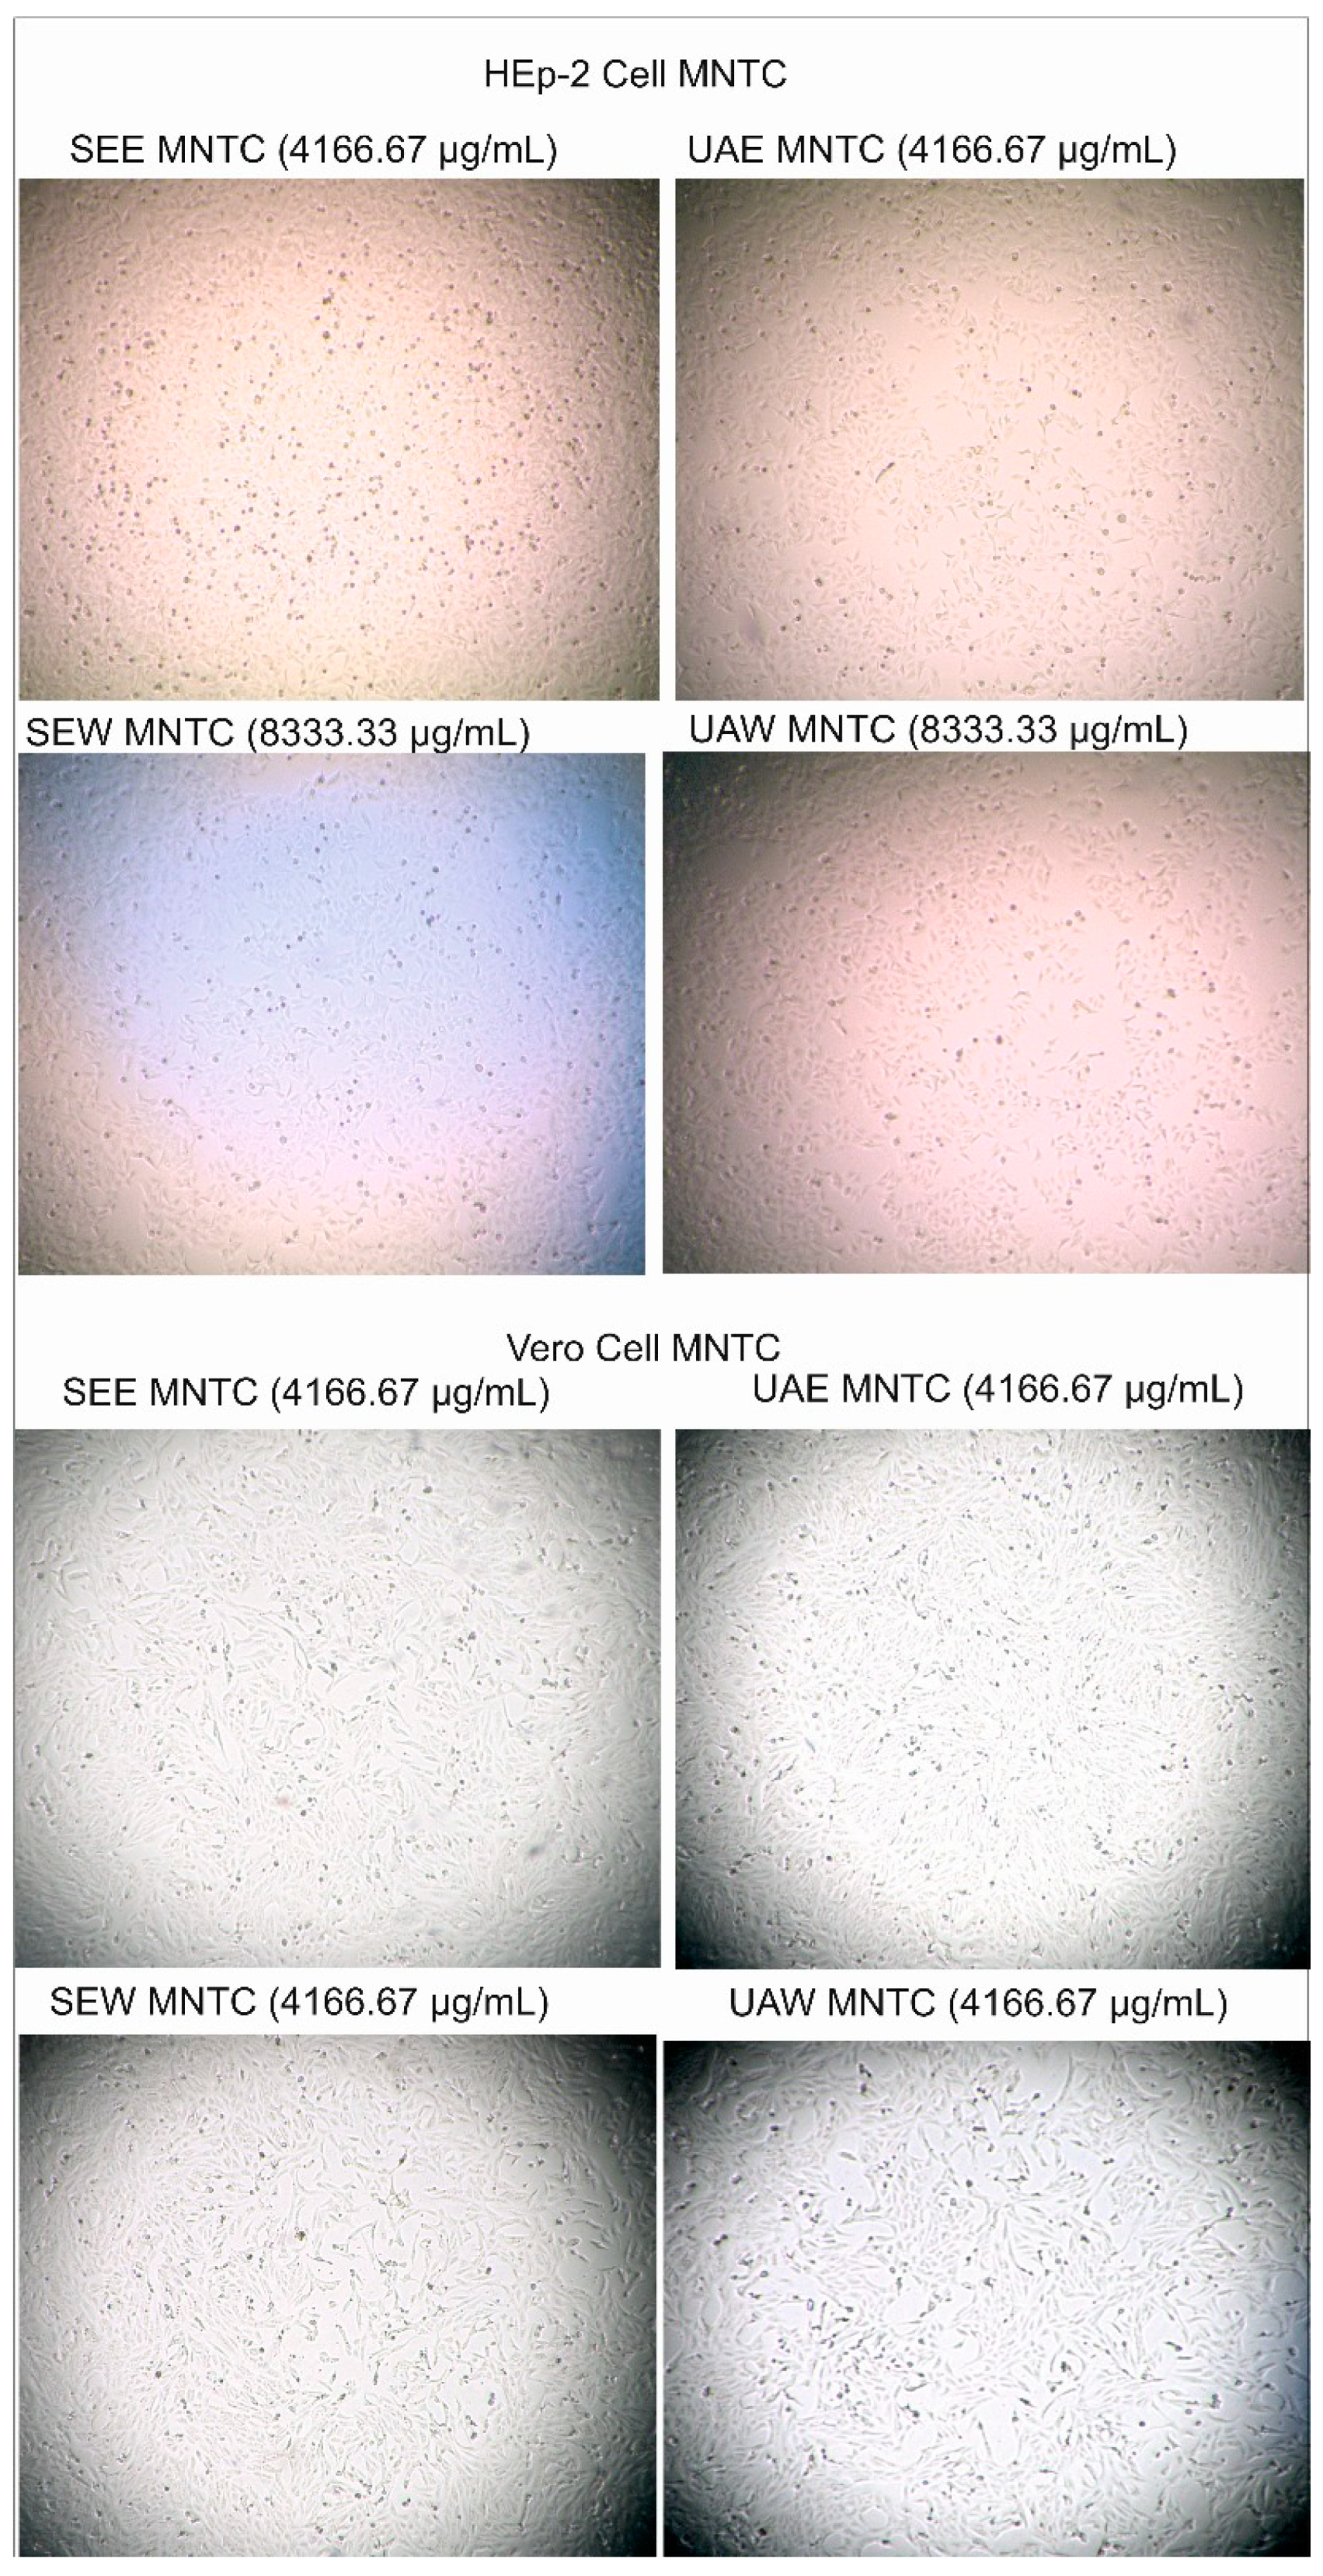
Figure 3.
The dose-response curve plotted with cytotoxicity percentages of the extracts on cell lines: a. HEp-2 cell line, b. Vero cell line. Ethanol extracts at the concentrations 260.42-4166.67 µg/mL and aqueous extracts at the concentrations 260.42-8333.33 µg/mL are not toxic on Hep-2 cells. The extracts are non-toxic on Vero cells at the concentrations 260.42-4166.67 µg/mL.
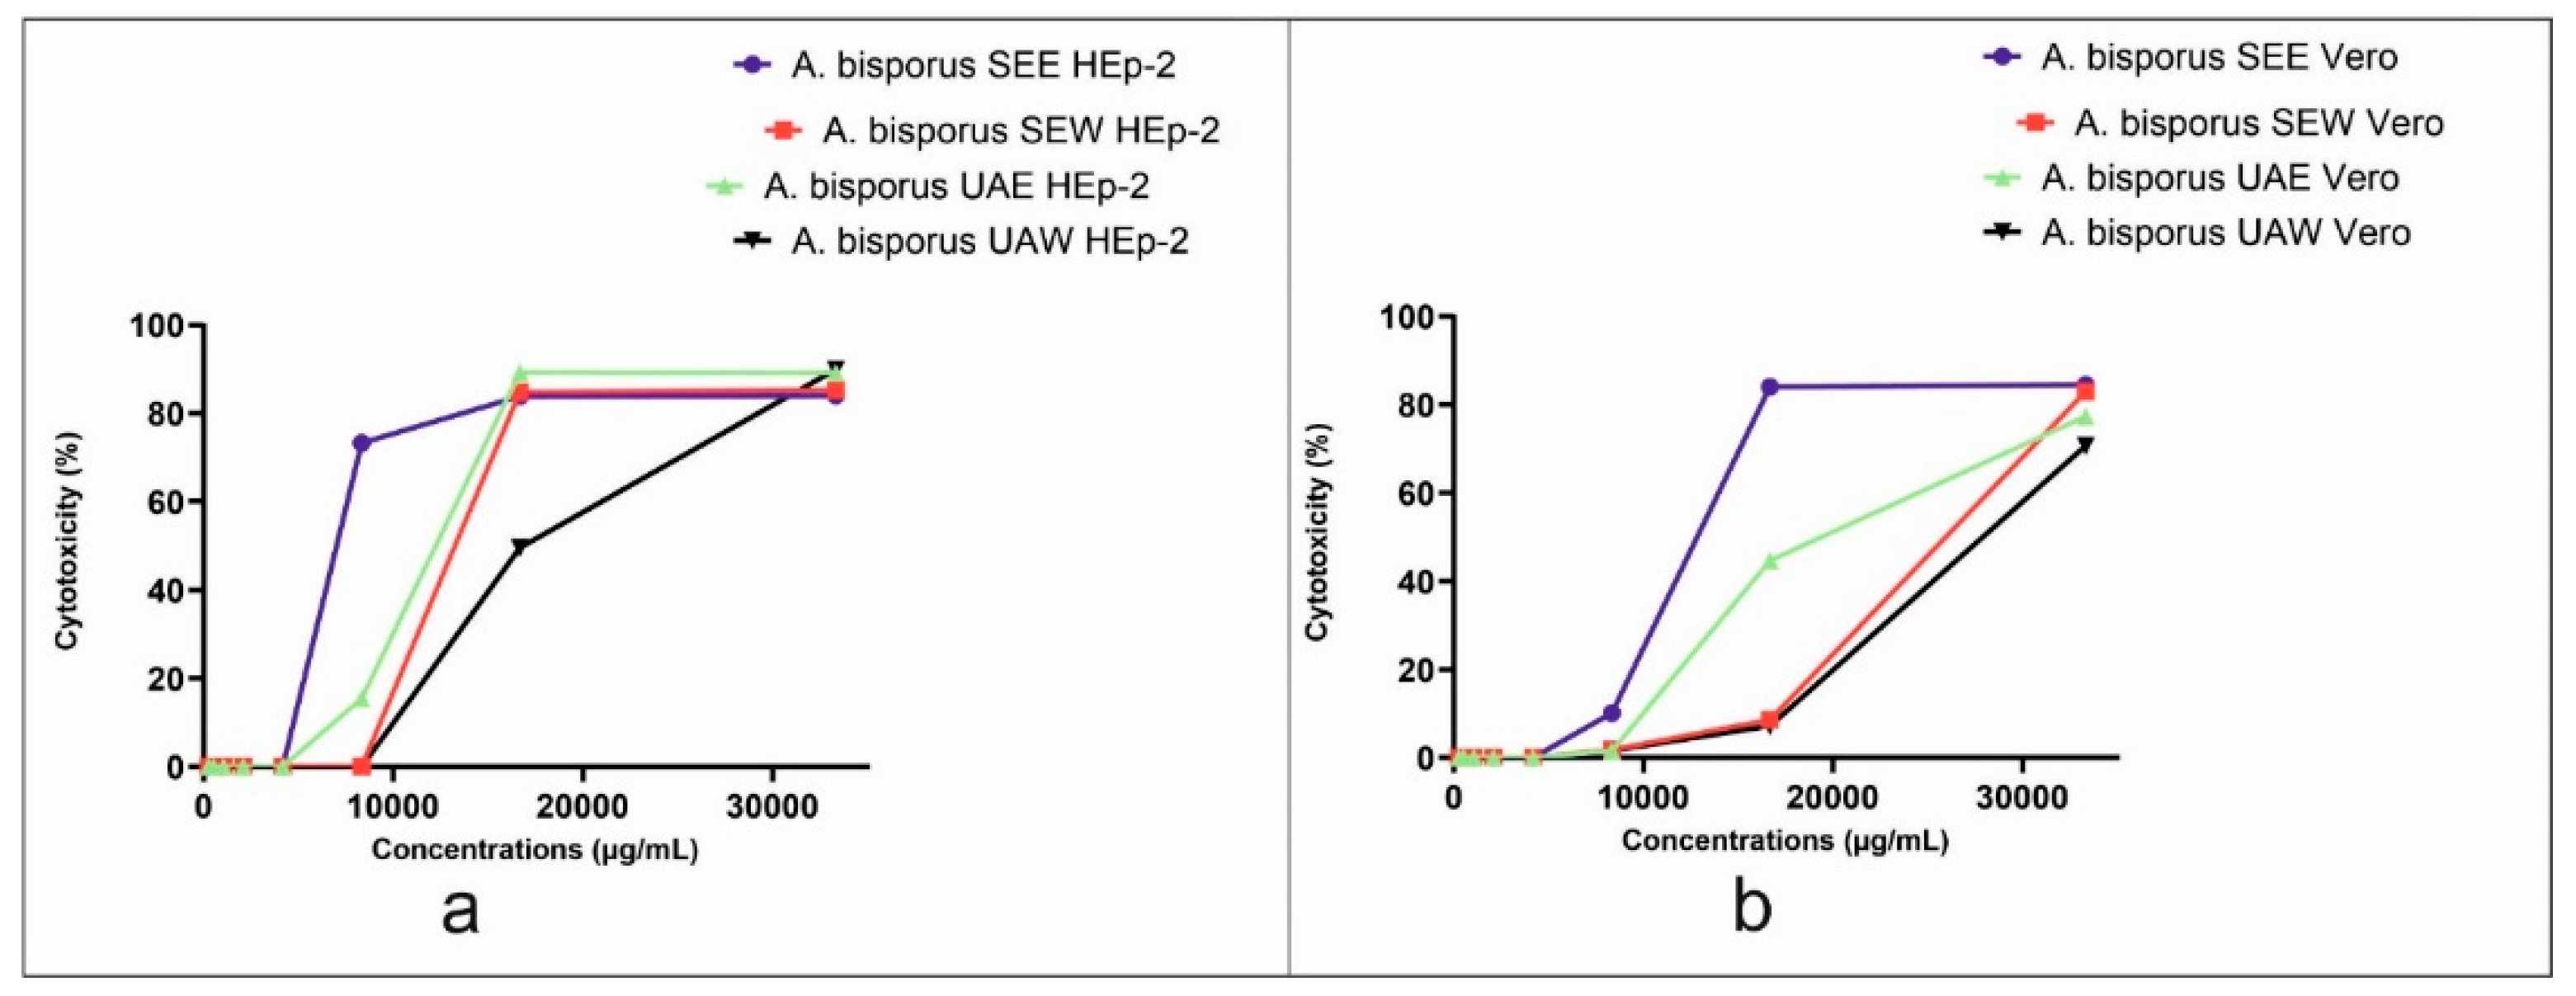
Figure 4.
Cell control and virus control microscope images used in antiviral activity experiments (x 4 magnification).
Figure 4.
Cell control and virus control microscope images used in antiviral activity experiments (x 4 magnification).
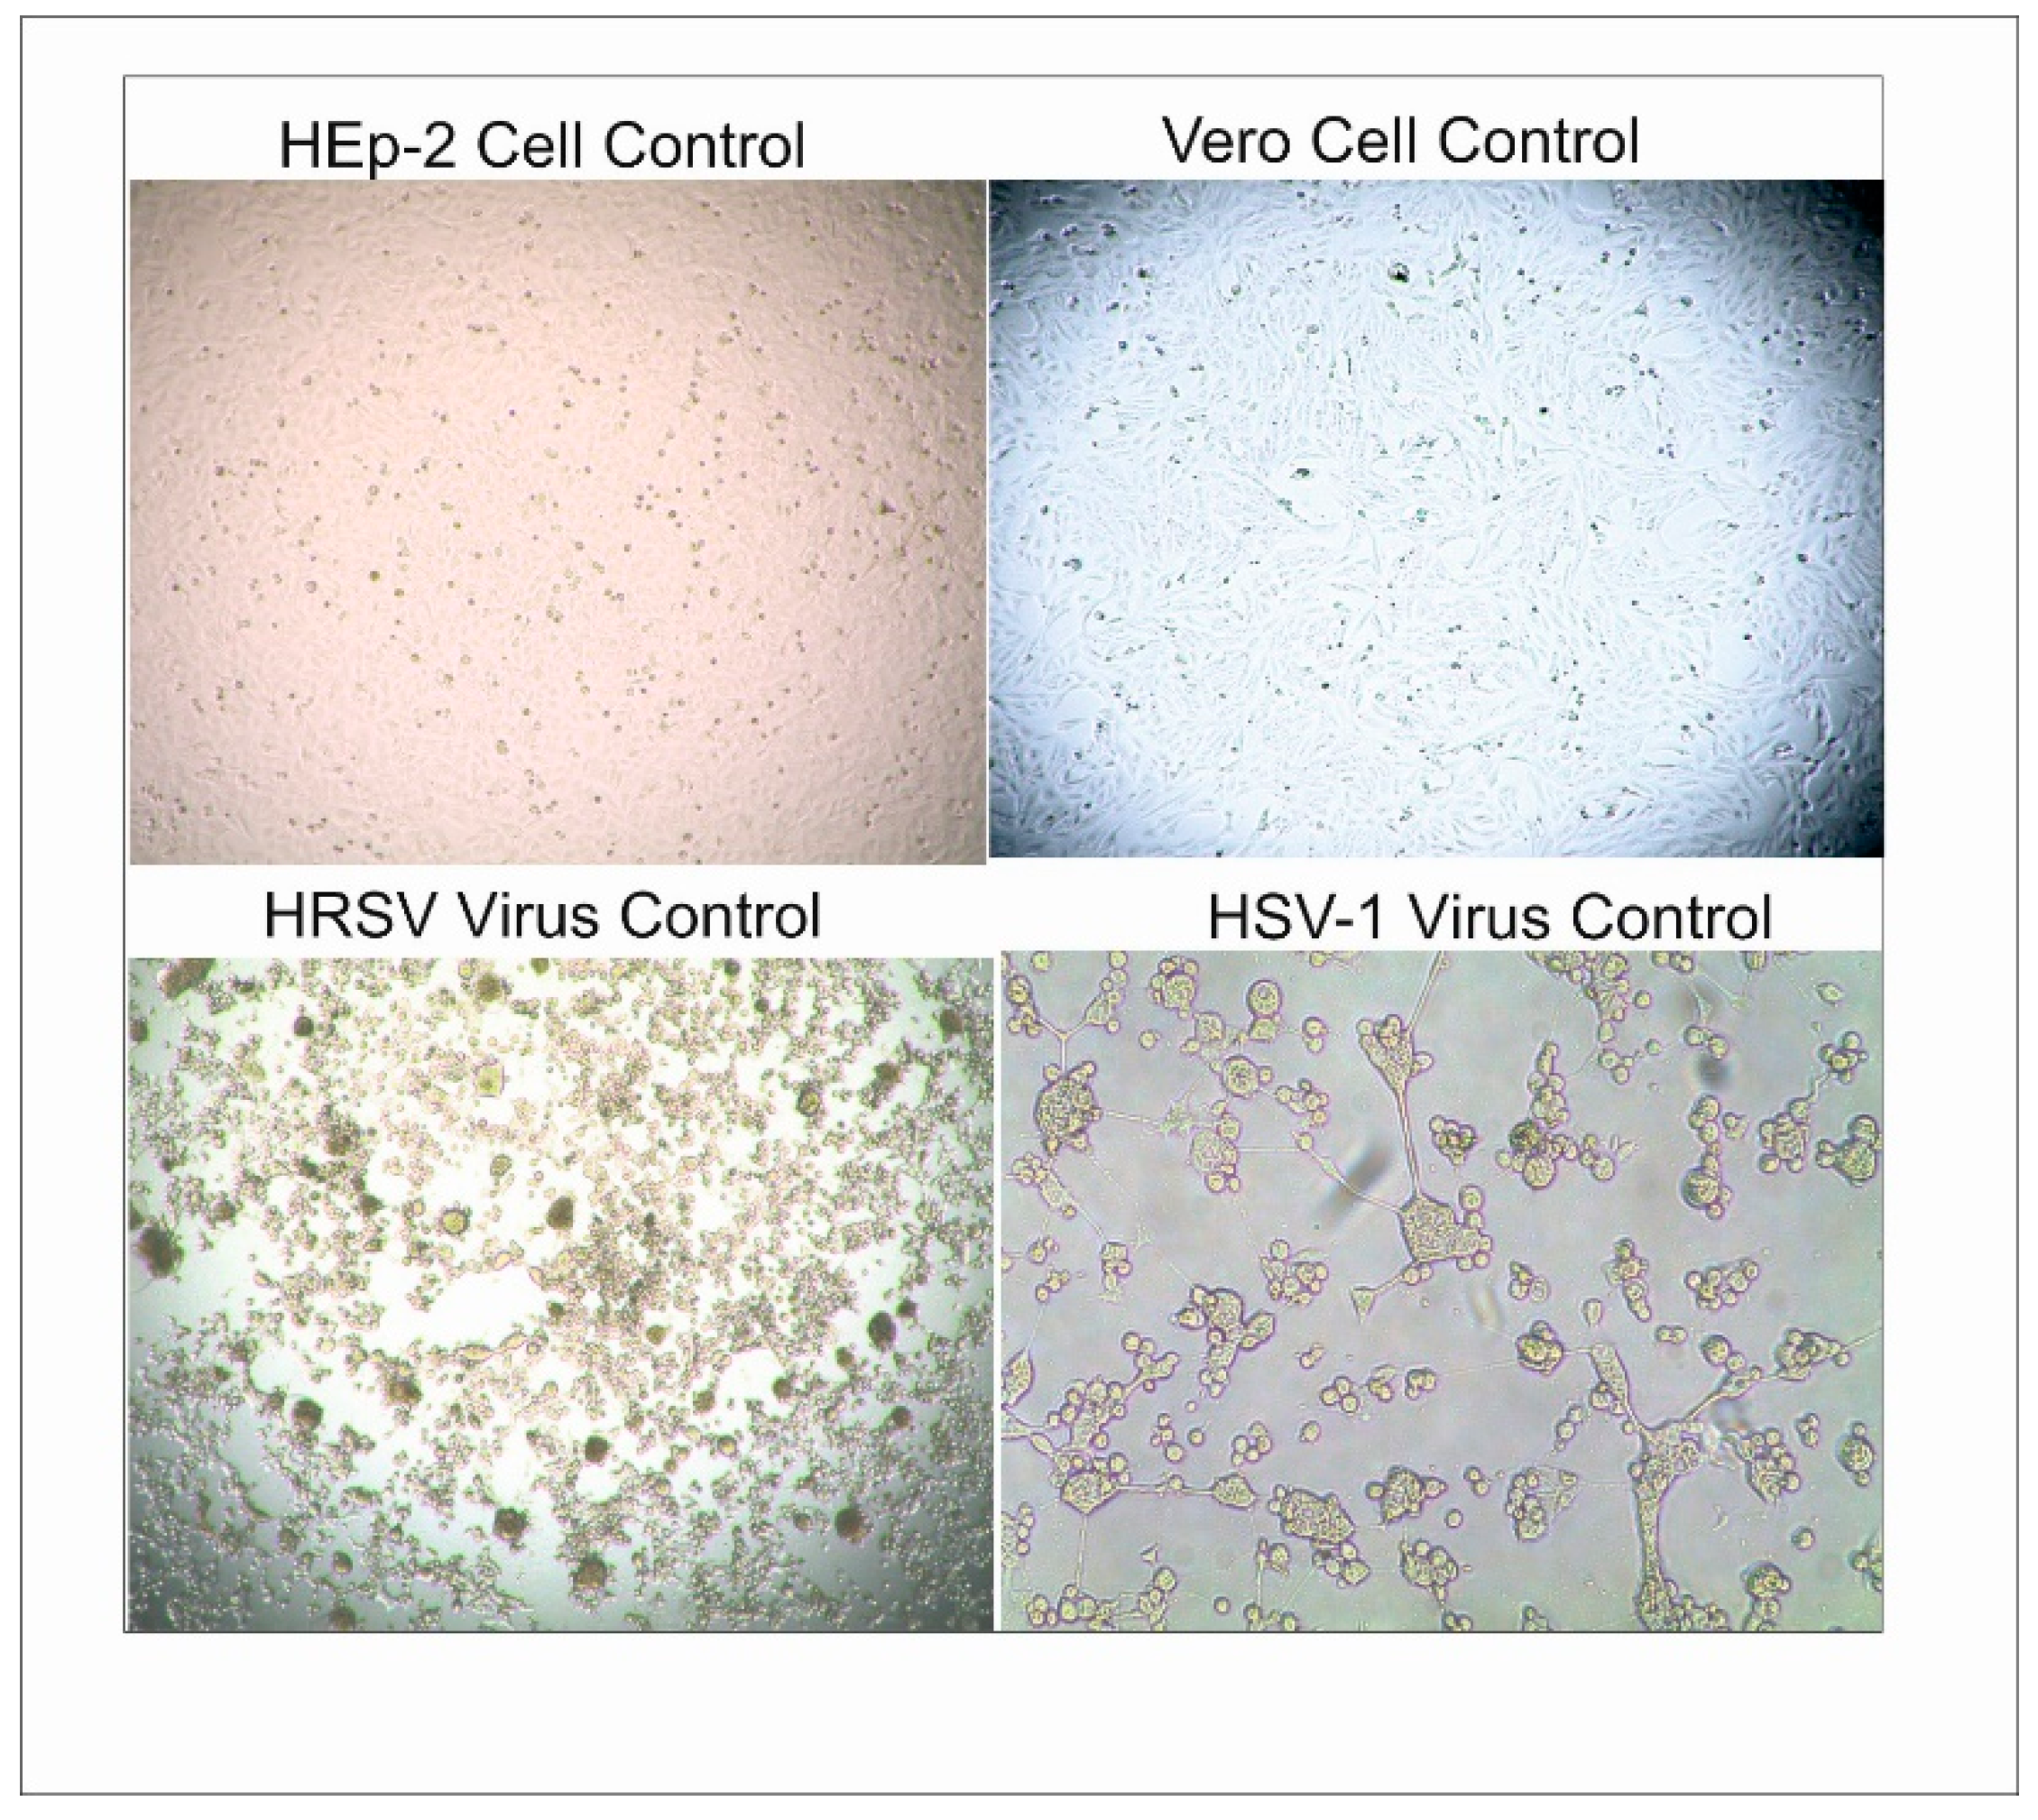
Figure 5.
Dose-response curves plotted with protection percentages of A. bisporus extracts against HRSV and HSV-1. The results showed that they have different percentage protection values against HRSV, which increased in a manner dependent upon dose at all concentrations. Among the tested extracts, only the aqueous extract obtained by ultrasonic-assisted extraction demonstrated a differential percentage protection against HSV-1, which increased dose-dependently at all concentrations.
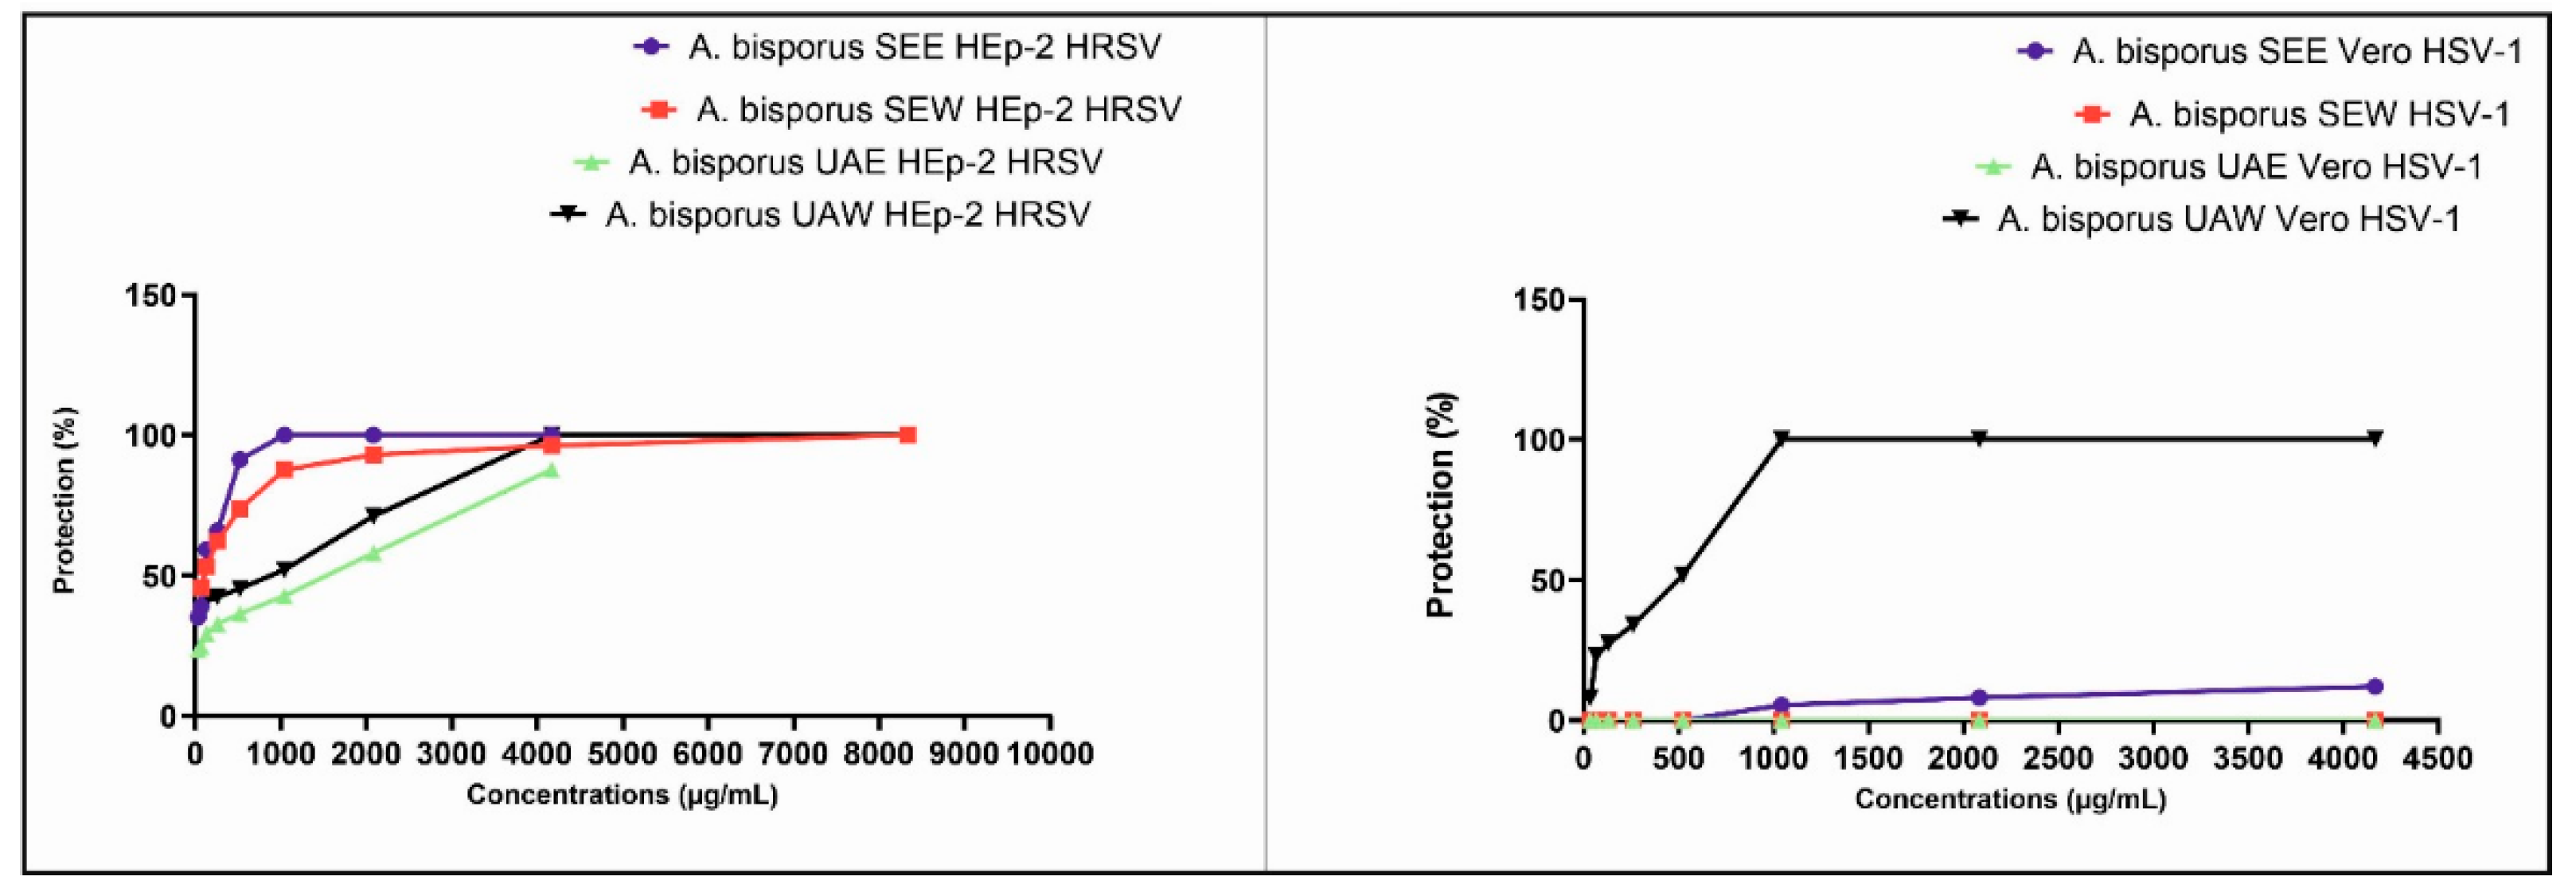

Table 1.
Concentrations of phenolic compounds determined in the extracts (mg/g extract).
| Phenolics (mg/g extracts) | SEE | SEW | UAE | UAW |
|---|---|---|---|---|
| Gallic Acid | 0.388±0.019ay | 0.005±0.001by | 0.111±0.008bx | 0.050±0.003cx |
| Homogentisic Acid | 0.495±0.073ay | 0.222±0.008bx | 0.225±0.019bx | 0.194±0.021bx |
| 3.4 Dihidroxybenzoic Acid (5) | 0.261±0.012ay | 0.031±0.006bx | 0.049±0.001ax | 0.631±1.003ax |
| Chlorogenic Acid | 0.448±0.066ay | 0.008±0.003bx | 0.113±0.064ax | 0.017±0.008bx |
| Quercetin-3-O-Rutinoside 7-O-Glucoside (1) | 1.015±0.158ay | 0.049±0.043bx | 0.217±0.102ax | 0.283±0.146ax |
| (+)-Catechin (4) | 0.666±0.098y | nd | 0.138±0.120bx | 0.141±0.006b |
| 4-Hydroxybenzoic Acid | 0.379±0.056y | nd | 0.057±0.068ax | Nd |
| Vanillic Acid | 0.350±0.052 | nd | Nd | 0.004±0.003 |
| Epicatechin | 0.197±0.066 | nd | Nd | 0.053±0.025 |
| Rutin | 0.151±0.128 | nd | Nd | 0.138±0.151 |
| Ferulic Acid | Nd | nd | Nd | Nd |
| Isoquercitrin | 0.123±0.076 | nd | Nd | Nd |
| Naringin | 0.017±0.027 | nd | Nd | Nd |
| Quercitrin | 0.515±0.112y | Nd | 0.128±0.050ax | 0.137±0.119a |
| Myricetin | 0.201±0.046y | Nd | 0.038±0.045x | Nd |
| Quercetin (2) | 0.783±0.143ax | 0.447±0.056bx | 1.163±0.327ax | 1.184±0.506ax |
| Apigenin (6) | 0.232±0.147ay | 0.096±0.012by | 0.319±0.117ax | 0.317±0.124ax |
| Caffeic Acid | 0.257±0.055y | Nd | 0.056±0.014ax | 0.048±0.042a |
| Hyperoside | 0.231±0.076 | Nd | nd | 0.061±0.058 |
| Quercetin-3-O-Glucopyranoside | 0.281±0.079 | Nd | nd | 0.044±0.047 |
| Luteolin (3) | 0.661±0.103x | Nd | 0.691±0.087ax | 0.701±0.163a |
* Mean±Standard Deviation (n=3), nd: Not determined. SEE: Soxhlet ethanol extract, SEW: Soxhlet water extract, UAE: Ultrasonic-assisted ethanol extract, UAW: Ultrasonic-assisted water extract. The data shown with the same superscripts (a and b) in the same row for different extracts of the same species obtained with the same extraction method are not different at the 5% significance level according to the Tukey (honestly significant difference) post hoc test. According to the Student's t-test, data shown with the same superscripts (x and y) in the same row for the same extracts of the same species obtained with different extraction methods are not different at the 5% significance level.
Table 2.
Total phenolic and total flavonoid contents of the extracts.
| SEE | SEW | UAE | UAW | |
|---|---|---|---|---|
|
Total phenolic contents (mg GAEs/g extracts |
13.84±0.11ax | 9.56±0.06by | 11.60±0.05ax | 13.82±0.14ax |
|
Total flavonoid contents (mg REs/g extracts) |
0.73±0.03ax | 0.08±0.07bx | 0.38±0.04ax | 0.23±0.06ax |
*Mean±Standard Deviation (n=3); GAEs: Gallic acid equivalent; REs: Routine equivalent, SEE: Soxhlet ethanol extract, SEW: Soxhlet water extract, UAE: Ultrasonic-assisted ethanol extract, UAW: Ultrasonic-assisted water extract. For extracts with different solvents obtained with the same extraction method, data shown with different superscript letters (a and b) in the same row indicate statistical differences (P < 0.05) between the extract means. For extracts with different solvents obtained with the same extraction method, data shown with different superscript letters (x and y) in the same row indicate statistical differences (P < 0.05) between the extract means.
Table 3.
Antioxidant Activity Results of the Extracts.
| SEE | SEW | UAE | UAW | |
|---|---|---|---|---|
|
DPPH (mg TEs/g extract) |
20.29±1.69ax | 17.24±0.27ax | 13.81±1.45ay | 16.80±1.81ax |
|
ABTS (mg TE/g extract) |
48.33±3.03ax | 47.41±3.23ax | 37.32±2.70ax | 47.34±3.01ax |
|
FRAP (mg TEs/g extract) |
29.15±1.98 ax | 23.32±0.79 ax | 33.95±0.04 ax | 22.52±0.20 bx |
|
CUPRAC (mg TEs/g extract) |
54.35±1.24ax | 29.61±0.39bx | 49.71±0.59ax | 32.21±0.21ax |
|
Phosphomolybdate (mg TEs/g extract) |
1.44±0.06ax | 0.29±0.00bx | 1.41±0.08ax | 0.56±0.05ax |
|
Metalchelating (mg EDTAE/g extract) |
14.02±0.38ax | 29.55±0.04bx | 15.15±0.11ax | 25.68±0.20ax |
*Mean ± Standard Deviation (n=3). TEs: Trolox equivalent, EDTAE: EDTA equivalent, SEE: Soxhlet ethanol extract, SEW: Soxhlet water extract, UAE: Ultrasonic-assisted ethanol extract, UAW: Ultrasonic-assisted water extract. For extracts obtained with the same extraction method but using different solvents, data in the same row marked with different superscript letters (a and b) indicate a statistically significant difference between extract means (P < 0.05). For extracts obtained with different extraction methods but using the same solvent, data in the same row marked with different superscript letters (x and y) indicate a statistically significant difference between extract means (P < 0.05).
Table 4.
Enzyme Inhibition Activities of the Extracts.
| SEE | SEW | UAE | UAW | |
|---|---|---|---|---|
|
AChE inhibition (mg GALAEs/g extract) |
2.56±0.02a | 0.52±0.02ax | na | 0.44±0.02x |
|
BChE inhibition (mg GALAEs/g extract) |
5.93±0.09x | na | 6.34±0.08x | na |
|
Amylase inhibition (mmol ACEs/g extract) |
0.27±0.02ax | 0.05±0.00bx | 0.29±0.00ax | 0.07±0.01ax |
|
Glucosidase inhibition (mg ACEs/g extract) |
1.03±0.00x | na | 0.98±0.05x | na |
|
Tyrosinase inhibition (mg KAEs/g extract) |
51.97±0.80ax | 12.46±0.91bx | 50.42±0.39ax | 8.84±0.57bx |
|
Metalchelating (mg EDTAE/g extract) |
14.02±0.38ax | 29.55±0.04bx | 15.15±0.11ax | 25.68±0.20ax |
*Mean ± Standard Deviation (n=3). AChE: Acetylcholinesterase; BChE: Butyrylcholinesterase; GALAEs: Galantamine equivalent; ACEs: Acarbose equivalent; KAEs: Kojic acid equivalent; na: no inhibition observed, SEE: Soxhlet ethanol extract, SEW: Soxhlet water extract, UAE: Ultrasonic-assisted ethanol extract, UAW: Ultrasonic-assisted water extract. For extracts obtained with the same extraction method but using different solvents, data in the same row marked with different superscript letters (a and b) indicate a statistically significant difference between extract means (P < 0.05). For extracts obtained with different extraction methods but using the same solvent, data in the same row marked with different superscript letters (x and y) indicate a statistically significant difference between extract means (P < 0.05).
Table 5.
Results of cytotoxicity and antiviral activity tests for the tested extracts.
| Cytotoxicity | Antiviral activity | |||
|---|---|---|---|---|
| HRSV | ||||
| Extracts | MNTC (µg/mL) |
CC50 (µg/mL) |
EC50 (µg/mL) |
SI |
| SEE | 4166.67 | 7211 | 86.23 | 83.62 |
| SEW | 8333.33 | 14079 | 103.6 | 135.90 |
| UAE | 4166.67 | 11381 | 830.8 | 13.70 |
| UAW | 8333.33 | 17035 | 358.7 | 47.49 |
| RBV | 0.98 | 117 | 4.19 | 27.92 |
| HSV-1 | ||||
|
MNTC (µg/mL) |
CC50 (µg/mL) |
EC50 (µg/mL) |
SI | |
| SEE | 4166.67 | 12371 | 32302 | 0.38 |
| SEW | 4166.67 | 25213 | 0.00 | 0.00 |
| UAE | 4166.67 | 19453 | 0.00 | 0.00 |
| UAW | 4166.67 | 27880 | 324.7 | 85.86 |
| ACV | 31.25 | 1948 | 0.1967 | >1000 |
MNTC: Maximum non-toxic concentration, CC50: 50% cytotoxic concentration, EC50: The concentration providing 50% protection of infected cells, SI: Selective index, RBV: Ribavirin, ACV: Acyclovir, SEE: Soxhlet ethanol extract, SEW: Soxhlet water extract, UAE: Ultrasonic-assisted ethanol extract, UAW: Ultrasonic-assisted water extract.
Disclaimer/Publisher’s Note: The statements, opinions and data contained in all publications are solely those of the individual author(s) and contributor(s) and not of MDPI and/or the editor(s). MDPI and/or the editor(s) disclaim responsibility for any injury to people or property resulting from any ideas, methods, instructions or products referred to in the content. |
© 2025 by the authors. Licensee MDPI, Basel, Switzerland. This article is an open access article distributed under the terms and conditions of the Creative Commons Attribution (CC BY) license (http://creativecommons.org/licenses/by/4.0/).
Copyright: This open access article is published under a Creative Commons CC BY 4.0 license, which permit the free download, distribution, and reuse, provided that the author and preprint are cited in any reuse.


