Submitted:
25 March 2025
Posted:
25 March 2025
Read the latest preprint version here
Abstract
In this study, flotation tests were conducted on a laboratory scale using sample of microcrystalline graphite ore from the Canindé region, Ceará, Brazil. The objective was to investigate the grinding time, reagent dosage, and purification process for obtaining graphene-based nanomaterials. Natural graphite has stacked planar structure and exhibits polymorphism with rhombohedral, hexagonal, and turbostratic geometries, characteristics that directly influence its properties and technological applications. The results demonstrated that it was possible to obtain rougher concentrate with a graphite carbon content of 23.4% and a recovery of 86.4%, using grinding time of 7.5 minutes and reagent dosages of 150 g/t of kerosene and 100 g/t of Flotanol D-25. This flotation process resulted in a graphite concentrate with 76.6% graphite carbon content. To increase the purity of the concentrate and expand its industrial applications, the graphite was purified in an alkaline autoclave using the hydrothermal method. In the next stage, acid leaching was performed, and this chemical treatment destabilized the regular stacking of the graphite layers, promoting the formation of graphene-like nanoplates, including monolayer graphene. Thus, the nanomaterials obtained through the process developed in this study have potential for various innovative applications, such as lithium-ion batteries, electric vehicles, and two-dimensional graphene-based materials.
Keywords:
microcrystalline graphite
; mineral characterization
; raman spectroscopy
; high-purity graphite
; graphene nanoplates
1. Introduction
The microcrystalline graphite ore is located in the Canindé region, Ceará, in northeastern Brazil. Geologically, it is embedded in schists and paragneisses of the Central Domain of the northern subprovince of the Borborema Province [1]. Carbon [2], an abundant element in the biosphere, has been known since ancient times. In its native form, carbon mainly occurs as the diamond and graphite phases. Despite having identical chemical compositions (theoretically pure carbon), these minerals exhibit completely different physical, structural, and crystallochemical properties due to the distinct pressure and temperature conditions under which they crystallize. Graphite is stable at petrologically lower temperature and pressure conditions compared to diamond. Consequently, graphite has a less dense crystalline structure than diamond.
Natural graphite deposits are rarely found in a pure state [3]; they usually contain impurities such as silicates, sulfides, iron oxides, or other substances. Graphite is an industrially significant mineral due to its chemical composition and unique structure. Its chemical formula is represented by pure carbon (C), with a crystalline structure composed of layers of carbon atoms arranged in a hexagonal network [4]. These layers are held together by Van der Waals forces, allowing them to slide over each other, which gives graphite properties such as solid lubrication and high thermal and electrical resistance. However, natural graphite generally contains impurities such as silicates, iron oxides, and sulfides, making purification necessary for high-performance applications [5].
Beyond its importance as a raw material for various industries, natural graphite is a strategic resource for producing advanced materials. With the growing advancements in nanotechnology and electronics, the demand for high-purity graphite has increased significantly. Obtaining a high-quality graphite concentrate is essential for manufacturing high-performance products, including lithium-ion batteries, supercapacitors, and conductive materials [6].
Various methods are employed for graphite purification, including thermal, chemical, and physical processes [7]. The thermal method involves heating at high temperatures to volatilize impurities but requires high energy consumption. Chemical methods use strong acids and bases to dissolve impurities, which can generate harmful environmental waste. Physical beneficiation includes techniques such as gravity and electrostatic separation, which may have limited efficiency in removing finely dispersed impurities. In this context, flotation emerges as a highly effective method, as it allows the selective separation of graphite from impurities through the interaction of specific reagents with particle surfaces. Flotation not only maximizes graphite recovery but also minimizes environmental impacts, making it a sustainable alternative [8].
Graphite has widely diversified technological applications due to its structural and electronic properties. Its transformation into nanomaterials, such as graphene, further expands its potential applications in fields such as advanced electronics, biomedical devices, sensors, and energy storage. Graphene is obtained by exfoliating graphite layers [9], resulting in atomic-thin sheets with exceptional properties such as high mechanical strength, excellent electrical and thermal conductivity, and a large surface area. This transformation process can occur through mechanical, chemical, or electrochemical methods, with material stability being a critical factor for its applicability. Graphene nanoplates, which are intermediates between graphite and monolayer graphene, represent a promising alternative due to their ease of production and superior stability in various applications [10].
Among the methods used for graphene production, acid leaching stands out, as it selectively removes impurities and destabilizes graphite layers. This process uses acidic solutions to oxidize and separate individual graphene layers, resulting in materials with high purity and controlled structural properties. Acid leaching offers significant advantages, such as lower environmental impact compared to traditional chemical methods and better control over graphene morphology and properties. Additionally, this technique enables the production of graphene nanoplates with a high degree of crystallinity, enhancing their electrical and mechanical properties, making them ideal for applications in electronic devices and structural composites [10].
The exploration and beneficiation of graphite in the Canindé region, Ceará, have great potential to generate high-value-added products and boost local socioeconomic development. The production of graphene nanoplates from graphite extracted in the region can foster new industries focused on advanced technologies, such as high-capacity batteries, flexible electronic devices, and multifunctional coatings. Furthermore, developing a local production chain based on graphite purification and nanomaterial production could attract investments and create skilled jobs, strengthening the regional economy and promoting sustainable growth [11].
This study aims to develop and optimize methods for purifying and preparing graphene nanoplatelets from natural graphite from Canindé. For this purpose, flotation, leaching, and chemical treatment processes will be investigated to obtain materials with enhanced properties for use in strategic sectors. The results of this study are expected to contribute to advancing knowledge on graphite beneficiation and its applications in nanomaterials, opening new technological and industrial opportunities for the region. Additionally, the economic and environmental feasibility of the employed processes will be evaluated to ensure that the conversion of graphite into graphene nanoplatelets occurs sustainably and efficiently.
Graphene-like products obtained by exfoliating this graphite have a wide range of applications and can be used in composite materials (incorporating graphene into polymers [12] and other materials significantly improves mechanical properties such as strength and hardness, making it useful for applications requiring lightweight and durable materials [13]) and special coatings [14] (corrosion protection [15], flexible displays and sensors, antistatic and antimicrobial coatings, etc. [16]). Due to the challenges of stabilizing graphene, graphite nanoplatelets have been considered a substitute for graphene in various applications. These nanoplatelets may occur naturally, associated with geological shear zones [4], or be obtained through simple beneficiation processes.
2. Experimental
2.1. Experimental Methods
The sample preparation was carried out at Lagetec, Department of Geology, Federal University of Ceará (UFC), while the flotation study was conducted at the Laboratory for the Development of Ceramic Materials, Department of Metallurgical and Materials Engineering, UFC. The graphite purification and nanomaterial formation experiments were performed at the Ceará Center for Technology and Industrial Quality (NUTEC). Chemical analyses by X-ray fluorescence and X-ray diffraction were conducted at the X-ray Laboratory, Department of Physics, UFC. Raman spectroscopy measurements were performed at the Analytical Center and the Structural Crystallography Laboratory, both within the Department of Physics at UFC.
2.1.1. Flotation Experiment
Flotation tests were conducted using a sample of microcrystalline graphite ore. The ore needs to be ground to meet the feed requirements before flotation. For natural graphite, a process flow based on staged grinding and flotation is generally used. Laboratory-scale rougher flotation tests were performed to study the grinding time and the dosage of reagents, kerosene (collector) and Flotanol D-25 (frother) [7,8]. The study demonstrated that it was possible to obtain a rougher concentrate with a graphite carbon content of 23.4% and a recovery of 86.4% using a grinding time of 7.5 minutes and reagent dosages of 150 g/t of kerosene and 100 g/t of Flotanol D-25. Under these conditions, to further concentrate the graphite, a flotation circuit was carried out, consisting of a rougher stage followed by three successive stages of regrinding and cleaner flotation. During the selection process, the target minerals and impurities are gradually dissociated through multiple grinding stages, and the optimal number of grinding and flotation steps is experimentally studied and determined.
2.1.2. Chemical Purification in Alkaline Environment (C-NaOH treatment)
The purification of graphite was carried out through an alkaline treatment [17] in a hydrothermal reactor [18]. Initially, a 1M sodium hydroxide solution was prepared using 61 mL of deionized water. Then, 4.00 g of graphite (C-bulk) was dispersed in the solution, forming a dense and homogeneous suspension. The suspension was transferred to a Teflon vessel, which was properly sealed and placed inside a hydrothermal reactor. The system was then subjected to a thermal treatment in a muffle furnace at 200 °C for 6 hours. After this period, the material was cooled to room temperature and subjected to a neutralization process. The pH adjustment was performed until reaching pH 7 through successive washings with deionized water. The material was centrifuged and washed to ensure the complete removal of alkaline residues [18]. Finally, the sample was subjected to a drying process in an oven at 70 °C for 24 hours, ensuring the removal of residual moisture before subsequent processing and characterization steps.
2.1.3. Leaching in Acidic Environment (C-NaOH+H2SO4 treatment)
The acid leaching of the previously purified material was carried out using sulfuric acid (H₂SO₄) in an aqueous medium under magnetic stirring. For this purpose, a 1.0 M H₂SO₄ solution was prepared by diluting the required amount of analytical-grade sulfuric acid (98% purity, 18.4 M) in 25 mL of deionized water. The powder obtained from the hydrothermal purification step (C-NaOH treatment) was then added to this solution. The mixture was kept under constant magnetic stirring in a heated water bath at 90 °C for 120 minutes. After the reaction time, the material was centrifuged and washed until reaching pH 7, then dried in an oven at 70 °C until complete moisture removal [18]. The final product was labeled as “C-NaOH+H₂SO₄ treatment.”
2.2. Characterizations
To determine the crystalline structure of the solids, X-ray diffraction (XRD) measurements were performed using a Panalytical® Xpertpro MPD diffractometer equipped with a Co-Kα radiation tube, operating at 40 kV, 20 mA, and a step size of 2° per minute. The analyzed samples were randomly oriented using the powder method. The 2θ angle range was from 0 to 100°. The interplanar spacing (d) was used to interpret the mineral peaks.
The X-ray fluorescence (XRF) method was used for the chemical analysis of the mineral in powder form, allowing qualitative and semi-quantitative determination of the elements. XRF measurements were collected using a sequential wavelength-dispersive X-ray spectrometer (WDX) RIGAKU ZSX Mini II, operating at 40 kV and 1.2 mA, with a Pd (palladium) tube capable of performing semi-quantitative analysis of elements ranging from fluorine to uranium.
Fourier-transform infrared spectroscopy (FTIR) measurements were conducted using a SHIMADZU IRXross instrument, operating in the frequency range of 4000 to 400 cm⁻¹, with 64 scans. Absorbance was used as the analytical method, and potassium bromide (KBr) pellets served as the sample support [19].
To identify the physicochemical structure of the analyzed materials [20,21], Raman spectroscopy measurements were performed using an Alpha 300 spectrometer from Witec. A 532 nm excitation laser with a power of 300 microwatts was focused on the sample through a 10× magnification objective lens. Low excitation power was used to prevent sample degradation. The Raman spectra of all three samples exhibited the characteristic peaks of carbon-based materials (D, G, and 2D bands). The Raman spectra were analyzed using the Fityk software (version 1.3.1), where baseline subtraction and spectral deconvolution into Lorentzian components were performed. No significant Raman peak shifts were observed among the different samples. For comparison purposes, all spectra were normalized relative to the G band.
Atomic Force Microscopy (AFM) analyses were also conducted using an Asylum MFP-3D system, operating in intermittent contact mode with silicon tips (NCHR-W, manufactured by NanoWorld, characterized by a force constant of 42 N/m and a resonance frequency of 320 kHz). A scanning area of 10 µm × 10 µm was analyzed for each sample. All samples were dispersed in ethanol using magnetic stirring at room temperature for 15 minutes and subsequently deposited onto a silicon substrate suitable for nanomaterial characterization via atomic force microscopy.
3. Results and Discussion
3.1. Flotation
The microcrystalline graphite ore sample exhibited a graphite carbon content of 6.85%, indicating a significant number of impurities associated with and mixed into the natural graphite. The flotation study results demonstrated that a graphite concentrate with a graphite carbon content of 76.6% and a recovery rate of 64.0% was obtained in the laboratory, increasing the ore's purity by removing impurities. However, these results also highlight the need for further studies to improve recovery and achieve a concentrate with a higher graphite carbon content.
Given the necessity for more efficient purification, an autoclave purification method was applied in a basic medium, followed by acid leaching.
3.2. XRD Analysis
For the X-ray diffraction (XRD) analyses, the powders obtained from the following stages were used: raw graphite (ore - before flotation), C-Bulk (concentrate - after flotation), C-NaOH treatment (treatment in a basic medium), and C-NaOH+H₂SO₄ treatment (final graphene obtained). According to the results, graphite is responsible for the highest diffraction peak intensity, with a peak characteristic of graphite (002). Depending on the formation environment, graphite associations may involve muscovite, which was well-matched to most peaks, though with low intensity. The quartz mineral phase is also present. This association of the three minerals is common in deposits, especially when the host rock is a graphitic schist. In all samples, the graphite peak has a 2θ value at 31.5° and an average d₀₀₂ spacing of 3.35 Å [22,23]. Additionally, muscovite was interpreted in the same peak, coexisting with the graphite peak in the graphite ore, C-Bulk, and C-NaOH treatment samples (Figure 1a–c). Secondary peaks at 1.41 Å, in smaller proportions, were also identified, reinforcing the mineral interpretation for graphite. The XRD pattern of the sample before flotation (graphite ore) exhibits an association of graphite (88.2%) with muscovite (11.4%) and quartz (0.3%). The C-Bulk sample (concentrate - after flotation) consists of graphite (95%) and muscovite (5%), while the C-NaOH treatment sample (treatment in a basic medium) contains graphite (96%) and muscovite (4%). The C-NaOH+H₂SO₄ treatment sample showed an almost singular graphite peak (99%) with a d-spacing of 3.35 Å (Figure 1d), indicating a well-structured arrangement in the analyzed sample.
3.3. XRF Analysis
For the chemical analyses using the X-ray fluorescence (XRF) method, the powders obtained from the following samples were used: graphite ore (before flotation), C-Bulk (concentrate - after flotation), C-NaOH treatment (treatment in a basic medium), and C-NaOH+H₂SO₄ treatment (graphene).
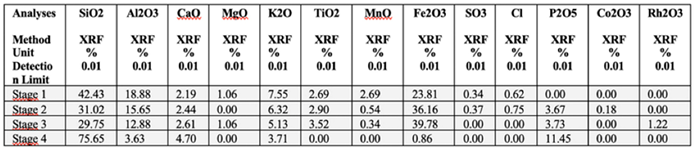
The chemical composition of the graphite ore sample shows SiO₂ = 42.43%, Al₂O₃ = 18.88%, CaO = 2.19%, MgO = 1.06%, K₂O = 7.55%, TiO₂ = 2.69%, MnO = 2.69%, Fe₂O₃ = 23.81%, SO₃ = 0.34%, and Cl = 0.62%. The C-Bulk sample contains SiO₂ = 31.02%, Al₂O₃ = 15.65%, CaO = 2.44%, K₂O = 6.32%, TiO₂ = 2.90%, MnO = 0.54%, Fe₂O₃ = 36.16%, SO₃ = 0.37%, Cl = 0.75%, P₂O₅ = 3.67%, and Co₂O₃ = 0.18%. The C-NaOH treatment sample presents SiO₂ = 29.75%, Al₂O₃ = 12.88%, CaO = 2.61%, MgO = 1.06%, K₂O = 5.13%, TiO₂ = 3.52%, MnO = 0.34%, Fe₂O₃ = 39.78%, P₂O₅ = 3.73%, and Rh₂O₃ = 1.22%. The C-NaOH+H₂SO₄ treatment sample exhibits SiO₂ = 75.65%, Al₂O₃ = 3.63%, CaO = 4.70%, K₂O = 3.71%, Fe₂O₃ = 0.86%, and P₂O₅ = 11.45%. These values are presented in Table 1.
The chemical composition of the sample before flotation (raw graphite) corresponds to the mineralogy of microcrystalline graphite ore, which, in addition to graphite, also comprises muscovite and quartz. The high Fe₂O₃ content (23.81%) suggests a composition similar to ferrimuscovite, a variety of muscovite that can occur in high-pressure metamorphic rocks or hydrothermal deposits.
The values of SiO₂ (31.02%), Al₂O₃ (15.65%), K₂O (6.32%), and MnO (0.54%) in the sample after flotation (C-Bulk) decreased, while the MgO content dropped to 0.00%. In contrast, CaO increased to 2.44%, TiO₂ to 2.90%, Fe₂O₃ to 36.16%, and Cl to 0.75%. The composition also revealed SO₃ (0.37%), P₂O₅ (3.67%), and Co₂O₃ (0.18%). These chemical analysis results for C-Bulk indicate that the flotation of microcrystalline graphite ore is essential for graphite concentration but still requires a more efficient purification process to improve the graphite carbon content.
The chemical composition of the C-NaOH treatment sample (basic medium treatment) compared to C-Bulk shows slightly lower values for SiO₂ (29.75%), Al₂O₃ (12.88%), K₂O (5.13%), and MnO (0.34%). However, the MgO content increased to 1.06%, while CaO (2.61%), TiO₂ (3.52%), Fe₂O₃ (39.78%), and P₂O₅ (3.73%) increased, with the appearance of Rh₂O₃ (1.22%) in the composition.
The C-NaOH+H₂SO₄ treatment sample presents the highest purity composition among all processing stages, showing a significant reduction in Al₂O₃ (3.63%), K₂O (3.71%), and Fe₂O₃ (0.86%), with the complete removal of MgO, TiO₂, and MnO. Additionally, CaO increased to 4.70%, P₂O₅ to 11.45%, and SiO₂ rose significantly to 75.43%.
The chemical composition of the C-NaOH+H₂SO₄ treatment sample demonstrates a strong reduction of impurities such as ferrimuscovite, through the reduction and elimination of elements that compose this mica. Since muscovite is the main impurity in microcrystalline graphite ore, the chemical data obtained by XRF and presented in this study indicate a purer natural microcrystalline graphite concentrate.
3.4. FTIR Analysis
Fourier-transform infrared spectroscopy (FTIR) was used to characterize the chemical modifications throughout the process of converting graphite into graphene [19]. A comparative analysis of the spectra of the samples allows for identifying the main structural changes and the gradual removal of oxygenated groups during the purification and reduction steps (Figure 2a). In the spectrum of pure graphite (C-Bulk), a characteristic band is observed at ~1620 cm⁻¹, attributed to the C=C stretching vibrations of the hexagonal rings in the graphitic structure. The absence of significant bands in the regions of ~3400 cm⁻¹ (axial vibration of hydroxyl -OH groups) and ~1720 cm⁻¹ (C=O stretching of carbonyl groups) indicates low functionalization and the hydrophobic nature of the starting material. During the chemical purification stage in an alkaline medium, the appearance of bands in the ~1200-1400 cm⁻¹ region is observed, associated with C-O vibrations of epoxy and hydroxyl groups, suggesting an initial modification in the graphite structure due to interaction with the alkaline solution. However, it is in the acidic oxidation phase that the most significant structural changes occur, characterizing the formation of graphene oxide (GO). The GO spectrum shows an intense and broad band at ~3400 cm⁻¹, attributed to the presence of hydroxyl (-OH) groups, along with a substantial increase in the band at ~1720 cm⁻¹, indicating the introduction of carbonyl (C=O) groups, typical of carboxylic acids and quinones. Additionally, new bands appear in the ~1050-1200 cm⁻¹ region, associated with C-O-C bonds, confirming the presence of epoxy groups. These structural modifications result from the oxidation of graphite, making the material more hydrophilic and dispersible in aqueous media. These spectral changes demonstrate the effectiveness of the purification and reduction process in obtaining high-quality graphene.
3.5. Raman Analysis
The structural analysis reveals the crystallochemical and mineralogical characteristics of the natural microcrystalline graphite samples (ore - before flotation). The Raman spectra (samples CAN-01 and CAN-02) are similar to those observed in high-quality graphite. The presented Raman spectra highlight characteristics of fine graphite, which is promising for graphene applications, especially the CAN-02_P2 spectrum (Figure 2b).
Raman spectroscopy analyses of the samples support the hypothesis of graphene nanoplatelets formation in the C-NaOH+H₂SO₄ treatment, as the characteristic Raman spectrum of this sample does not exhibit the shoulder in the 2D band (present in the spectra of the C-Bulk and C-NaOH samples), which is a distinctive feature of graphite samples, according to references. The main features in the Raman spectra of graphite and graphene are represented by the D, G, and 2D bands, as shown in Figure 2c. The G band, associated with graphite, appears at approximately 1579 cm⁻¹, while the 2D band is observed around 2700 cm⁻¹. These peaks are consistently present in graphite samples. The 2D band of graphite, located at ~2700 cm⁻¹, typically exhibits a shoulder near 2650 cm⁻¹, a distinguishing characteristic of graphite [20,24,25,26,27,28,29,30] as illustrated in Figure 2c, which presents the characteristic spectrum of the C-Bulk sample. In the C-NaOH+H₂SO₄ treatment sample, the formation of the D band (~1336 cm⁻¹) is observed, indicating the presence of defects or edges in the material. The intensity ratio between the D band (~1336 cm⁻¹) and the G band (~1579 cm⁻¹) provides information about the structure, size, and number of defects in the carbon material [26,31], with defects likely originating from the formation of smaller flakes. The 2D band spectrum, which appears without the characteristic shoulder, is consistent with the presence of multilayer graphene flakes. Thus, the Raman spectroscopy analyses reinforce the hypothesis of graphene nanoplatelet formation in the C-NaOH+H₂SO₄ treatment sample, as its characteristic Raman spectrum does not show the shoulder in the 2D band (present in the spectra of the C-Bulk and C-NaOH treatment samples), which is a distinctive feature of graphite samples, according to references.
3.6. Atomic Force Microscopy (AFM) Analysis
Atomic Force Microscopy (AFM) scans of the C-Bulk samples (Figure 3a) and C-NaOH treatment (Figure 3c) show the presence of particles exceeding 100 nm in size, as verified by the height profiles along the cross-sections indicated in the scans and shown in Figure 3b,d for the C-Bulk and C-NaOH treatment samples, respectively.
In contrast, the AFM scan of the C-NaOH+H₂SO₄ treatment sample (Figure 3e–f) reveals the presence of graphite agglomerates with sizes below 20 nm, which is consistent with the dimensions of graphene-like nanoplatelets.
4. Conclusions
The microcrystalline graphite ore sample from Canindé, CE, composed of 88.2% graphite, 11.4% muscovite, and 0.3% quartz, was subjected to flotation tests combined with chemical purification in a basic medium followed by acid leaching. After this process, the sample exhibited high purity (99% graphite) and strong potential for graphene and graphene-like materials production, displaying a well-defined crystalline structure and thin particles. This combination of processes disrupted the regular stacking of graphite layers, leading to the formation of graphene nanoplatelets, including monolayer graphene, as evidenced by decrease in intensity at 31° 2θ in the X-ray diffraction pattern, change in the Raman spectrum between unprocessed graphite and the C-NaOH+H₂SO₄-treated sample, where the shoulder in the 2D band is no longer observed, and AFM scan measurements showing particle sizes below 20 nm, consistent with graphene nanoplatelets. The chemical composition of the C-NaOH+H₂SO₄ treatment sample indicates a significant reduction in impurities such as ferrimuscovite due to the removal of elements that constitute this mica. The C-Bulk sample (graphite concentrate) contains 76.6% graphitic carbon, which increases to over 99% after leaching, with potential to reach 99.9%, suggesting highly efficient purification. Acid leaching presents significant advantages, such as lower environmental impact compared to traditional chemical methods and better control over the morphology and properties of the obtained graphene.
Author Contributions
Conceptualization, L.S.; methodology, L.S., R.S., J.R., A.A., B.A., F.V., T.M. and J.F.; software, L.S., J.R., B.A., F.V. and T.M.; validation, L.S., J.R., A.G. and R.S.; formal analysis, L.S., J.R., A.G. and R.S; investigation, L.S., J.R. and R.S.; data curation, L.S. and J.R.; writing—original draft preparation, L.S.; writing—review and editing, L.S., J.R., A.G.; visualization, L.S., J.R., F.V. and T.M.; supervision, L.S.; project administration, L.S.; funding acquisition, L.S. All authors have read and agreed to the published version of the manuscript.
Funding
This work was supported by the Company BrEEX (No. 20002023).
Institutional Review Board Statement
Not applicable.
Informed Consent Statement
Not applicable.
Data Availability Statement
Data are contained within the article.
Acknowledgments
We thank the Company BREEX for providing samples and logistical support for the research; To the Federal University of Ceará - UFC and the Center for Industrial Quality and Technology of Ceará - NUTEC, which provided the necessary facilities for the completion of this work; To the Mineral Nanotechnology Research Group – UFC/NUTEC/UFSM; To the Materials Research Group - NUTEC, Advanced Materials Chemistry Group - GQMAT/UFC, Analytical Center-UFC, Structural Crystallography Laboratory - UFC and Ceramic Materials Laboratory - UFC for the physical structure and discussion of the results; The Ceará Foundation for Support of Scientific and Technological Development (FUNCAP) for technical scientific support.
Conflicts of Interest
The authors declare no conflicts of interest.
References
- Van Schmus, W.R.; Oliveira, E.P.; Silva Filho, A.F.; Toteu, S.F. Proterozoic links between the Borborema Province, NE Brazil, and the Central African Fold Belt. Geological Society, London, Special Publications 2011, 294, 69–99. [Google Scholar]
- Hodkiewicz, J. Characterizing carbon materials with Raman spectroscopy. Thermo Scientific Application Note 2010, 51946. [Google Scholar]
- Belém, J. Caracterização mineralógica, física e termobarométrica de minérios de grafita da província grafítica Bahia-Minas. Master's Thesis, Universidade Federal de Minas Gerais, Belo Horizonte, Brazil, 2006. [Google Scholar]
- Nobre, A.G.; Martínez, J.A.E.; Terence, M.C.; Florêncio, O. The action of shear zones in the natural availability of graphite nanoplatelets: the example of the metadolomites of the Itaiacoca Group and the mica schist of the Dom Silverio Group. Brazilian Journal of Animal and Environmental Research 2020, 3, 3108–3118. [Google Scholar] [CrossRef]
- Peng, W.; Li, H.; Hu, Y.; Liu, Y.; Song, S. Does silicate mineral impurities in natural graphite affect the characteristics of synthesized graphene? Mater. Res. Bull. 2016, 74, 333–339. [Google Scholar] [CrossRef]
- Nobre, A.G.; de Andrade, F.R.D.; Salazar-Naranjo, A.F.; Rigue, J.N.; da Silva, R.B.; Vlach, S.R.F.; et al. Electrical resistance evolution of graphite and talc geological heterostructures under progressive metamorphism. C 2023, 9, 75. [Google Scholar] [CrossRef]
- Chehreh Chelgani, S.; Rudolph, M.; Kratzsch, R.; Sandmann, D.; Gutzmer, J. A review of graphite beneficiation techniques. Miner. Process. Extr. Metall. Rev. 2016, 37, 58–68. [Google Scholar] [CrossRef]
- Vasumathi, N.; Sarjekar, A.; Chandrayan, H.; Chennakesavulu, K.; Reddy, G.R.; Vijaya Kumar, T.V.; et al. A mini review on flotation techniques and reagents used in graphite beneficiation. Int. J. Chem. Eng. 2023, 1007689, 1–15. [Google Scholar] [CrossRef]
- Ithnin, N.F.B.M.; Liu, W.W. Exfoliation of Graphite into Graphene Oxide and Reduction by Plant Extract to Synthesize Graphene. International Journal of Nanoelectronics and Materials 2024, 17. [Google Scholar]
- Nobre, A.G.; da Silva, L.P.N.; de Andrade, F.R.D. Graphene geology and the fourth industrial revolution. In Proceedings of the 7th Brazilian Technology Symposium (BTSym'21); Iano, Y.; Saotome, O.; Kemper Vásquez, G.L.; Cotrim Pezzuto, C.; Arthur, R.; Gomes de Oliveira, G., Eds.; Smart Innovation, Systems and Technologies; Springer: Cham, Switzerland, 2023; Vol. 207.
- Nobre, A.G.; Martínez, J.A.E.; Florêncio, O. Mineral nanotechnology in circular economy. In Proceedings of the 6th Brazilian Technology Symposium (BTSym'20); Iano, Y.; Saotome, O.; Kemper, G.; Mendes de Seixas, A.C.; Gomes de Oliveira, G., Eds.; Smart Innovation, Systems and Technologies; Springer: Cham, Switzerland, 2021; Vol. 233.
- Potts, J.R.; Dreyer, D.R.; Bielawski, C.W.; Ruoff, R.S. Graphene-based polymer nanocomposites. Polymer 2011, 52, 5–25. [Google Scholar] [CrossRef]
- Zhang, X.; Xu, Y.; Wang, M.; et al. A powder-metallurgy-based strategy toward three-dimensional graphene-like network for reinforcing copper matrix composites. Nat. Commun. 2020, 11, 2775. [Google Scholar]
- Tan, L.; Wang, C.; Zeng, M.; Fu, L. Graphene: an outstanding multifunctional coating for conventional materials. Small 2017, 13. [Google Scholar]
- Kulyk, B.; Freitas, M.A.; Santos, N.F.; Mohseni, F.; Carvalho, A.F.; Yasakau, K.; et al. A critical review on the production and application of graphene and graphene-based materials in anti-corrosion coatings. Crit. Rev. Solid State Mater. Sci. 2021, 47, 309–355. [Google Scholar]
- Belov, D.V.; Belyaev, S.N.; Radishchev, D.B.; et al. Synthesis of coatings based on graphene-like materials and study of their physicochemical properties. Inorg. Mater. Appl. Res. 2024, 15, 506–522. [Google Scholar]
- Wang, H.; Feng, Q.; Liu, K.; Zuo, K.; Tang, X. A novel technique for microcrystalline graphite beneficiation based on alkali-acid leaching process. Sep. Sci. Technol. 2017, 53, 982–989. [Google Scholar]
- Xiyue, Z.; Hongjuan, S.; Tongjiang, P.; Li, Z.; Bo, L. Purification mechanism of microcrystalline graphite and dissolution of non-carbon impurity during alkali autoclave-acid leaching. Phys. Chem. Miner. 2024. [Google Scholar]
- Sala, O. Fundamentos da espectroscopia Raman e no infravermelho, 2nd ed.; UNESP: São Paulo, Brazil, 2008; Quim. Nova 31.
- Ferrari, A.C. Espectroscopia Raman de grafeno e grafite: Desordem, acoplamento elétron-fônon, dopagem e efeitos não adiabáticos. Comunic. Estado Sólido 2007, 143, 47–57. [Google Scholar]
- Cuesta-López, S.; Fernández, M.L.; Menendez-Aguado, J.M.; Ricci, C. Raman Spectroscopy as a tool for identification and valorisation assessment of critical raw materials: Graphite case. In Proceedings of the Mineral Exploration Symposium; 2020. [Google Scholar]
- Shokry, S.A.; Elmorsi, A.K.; Elsrogy, H. Preparation and Characterization of Chemically Converted Graphene from Natural Graphite. Egypt. J. Petrol. 2024, 33. [Google Scholar]
- Xie, X.; Zhang, J.; Chen, Y.; Wang, C. A method for the preparation of graphene from spent graphite of retired lithium-ion batteries. J. Power Sources 2024, 594. [Google Scholar]
- Cançado, L.G.; Monken, V.P.; Campos, J.L.E.; Santos, J.C.C.; Backes, C.; Chacham, H.; et al. Science and Metrology of defects in graphene using Raman Spectroscopy. Carbon 2024, 220. [Google Scholar]
- Ferrari, A.C.; Meyer, J.C.; Scardaci, V.; Casiraghi, C.; Lazzeri, M.; Mauri, F.; et al. Raman spectrum of graphene and graphene layers. Phys. Rev. Lett. 2006, 97, 187401. [Google Scholar]
- Lu, S.; Yao, M.; Yang, X.; Li, Q.; Xiao, J.; Yao, Z.; et al. High-pressure transformation of graphene nanoplates: A Raman study. Chem. Phys. Lett. 2013, 585, 101–106. [Google Scholar]
- Panyathip, R.; Sucharitakul, S.; Phaduangdhitidhada, S.; Ngamjarurojana, A.; Kumnorkaew, P.; Choopun, S. Surface Enhanced Raman Scattering in Graphene Quantum Dots Grown via Electrochemical Process. Molecules 2021, 26. [Google Scholar] [CrossRef] [PubMed]
- Pimenta, M.A.; Dresselhaus, G.; Dresselhaus, M.S.; Cançado, L.G.; Jorio, A.; Saito, R. Studying disorder in graphite-based systems by Raman spectroscopy. Phys. Chem. Chem. Phys. 2007, 9, 1276–1290. [Google Scholar] [PubMed]
- Sparavigna, A.C. Graphene, Graphene Oxide and Carbon Nanotubes in Raman Spectroscopy. Int. J. Sci. 2024, 13. [Google Scholar]
- Wu, W.; Ranasinghe, J.C.; Chatterjee, A.; Huang, S. Recent advances on Raman spectroscopy of graphene: towards biosensing applications. Mater. Chem. Phys. 2024, 318. [Google Scholar]
- Ahmad, I.; McCarthy, J.E.; Baranov, A.; Gun’ko, Y.K. Development of Graphene Nano-Platelet Based Counter Electrodes for Solar Cells. Materials 2015, 8, 5953–5973. [Google Scholar] [CrossRef]
Figure 1.
X-ray diffraction patterns of the samples: (a) graphite ore, (b) C-Bulk, (c) С-NaOH treatment, and (d) C-NaOH+H2SO4 treatment.
Figure 1.
X-ray diffraction patterns of the samples: (a) graphite ore, (b) C-Bulk, (c) С-NaOH treatment, and (d) C-NaOH+H2SO4 treatment.
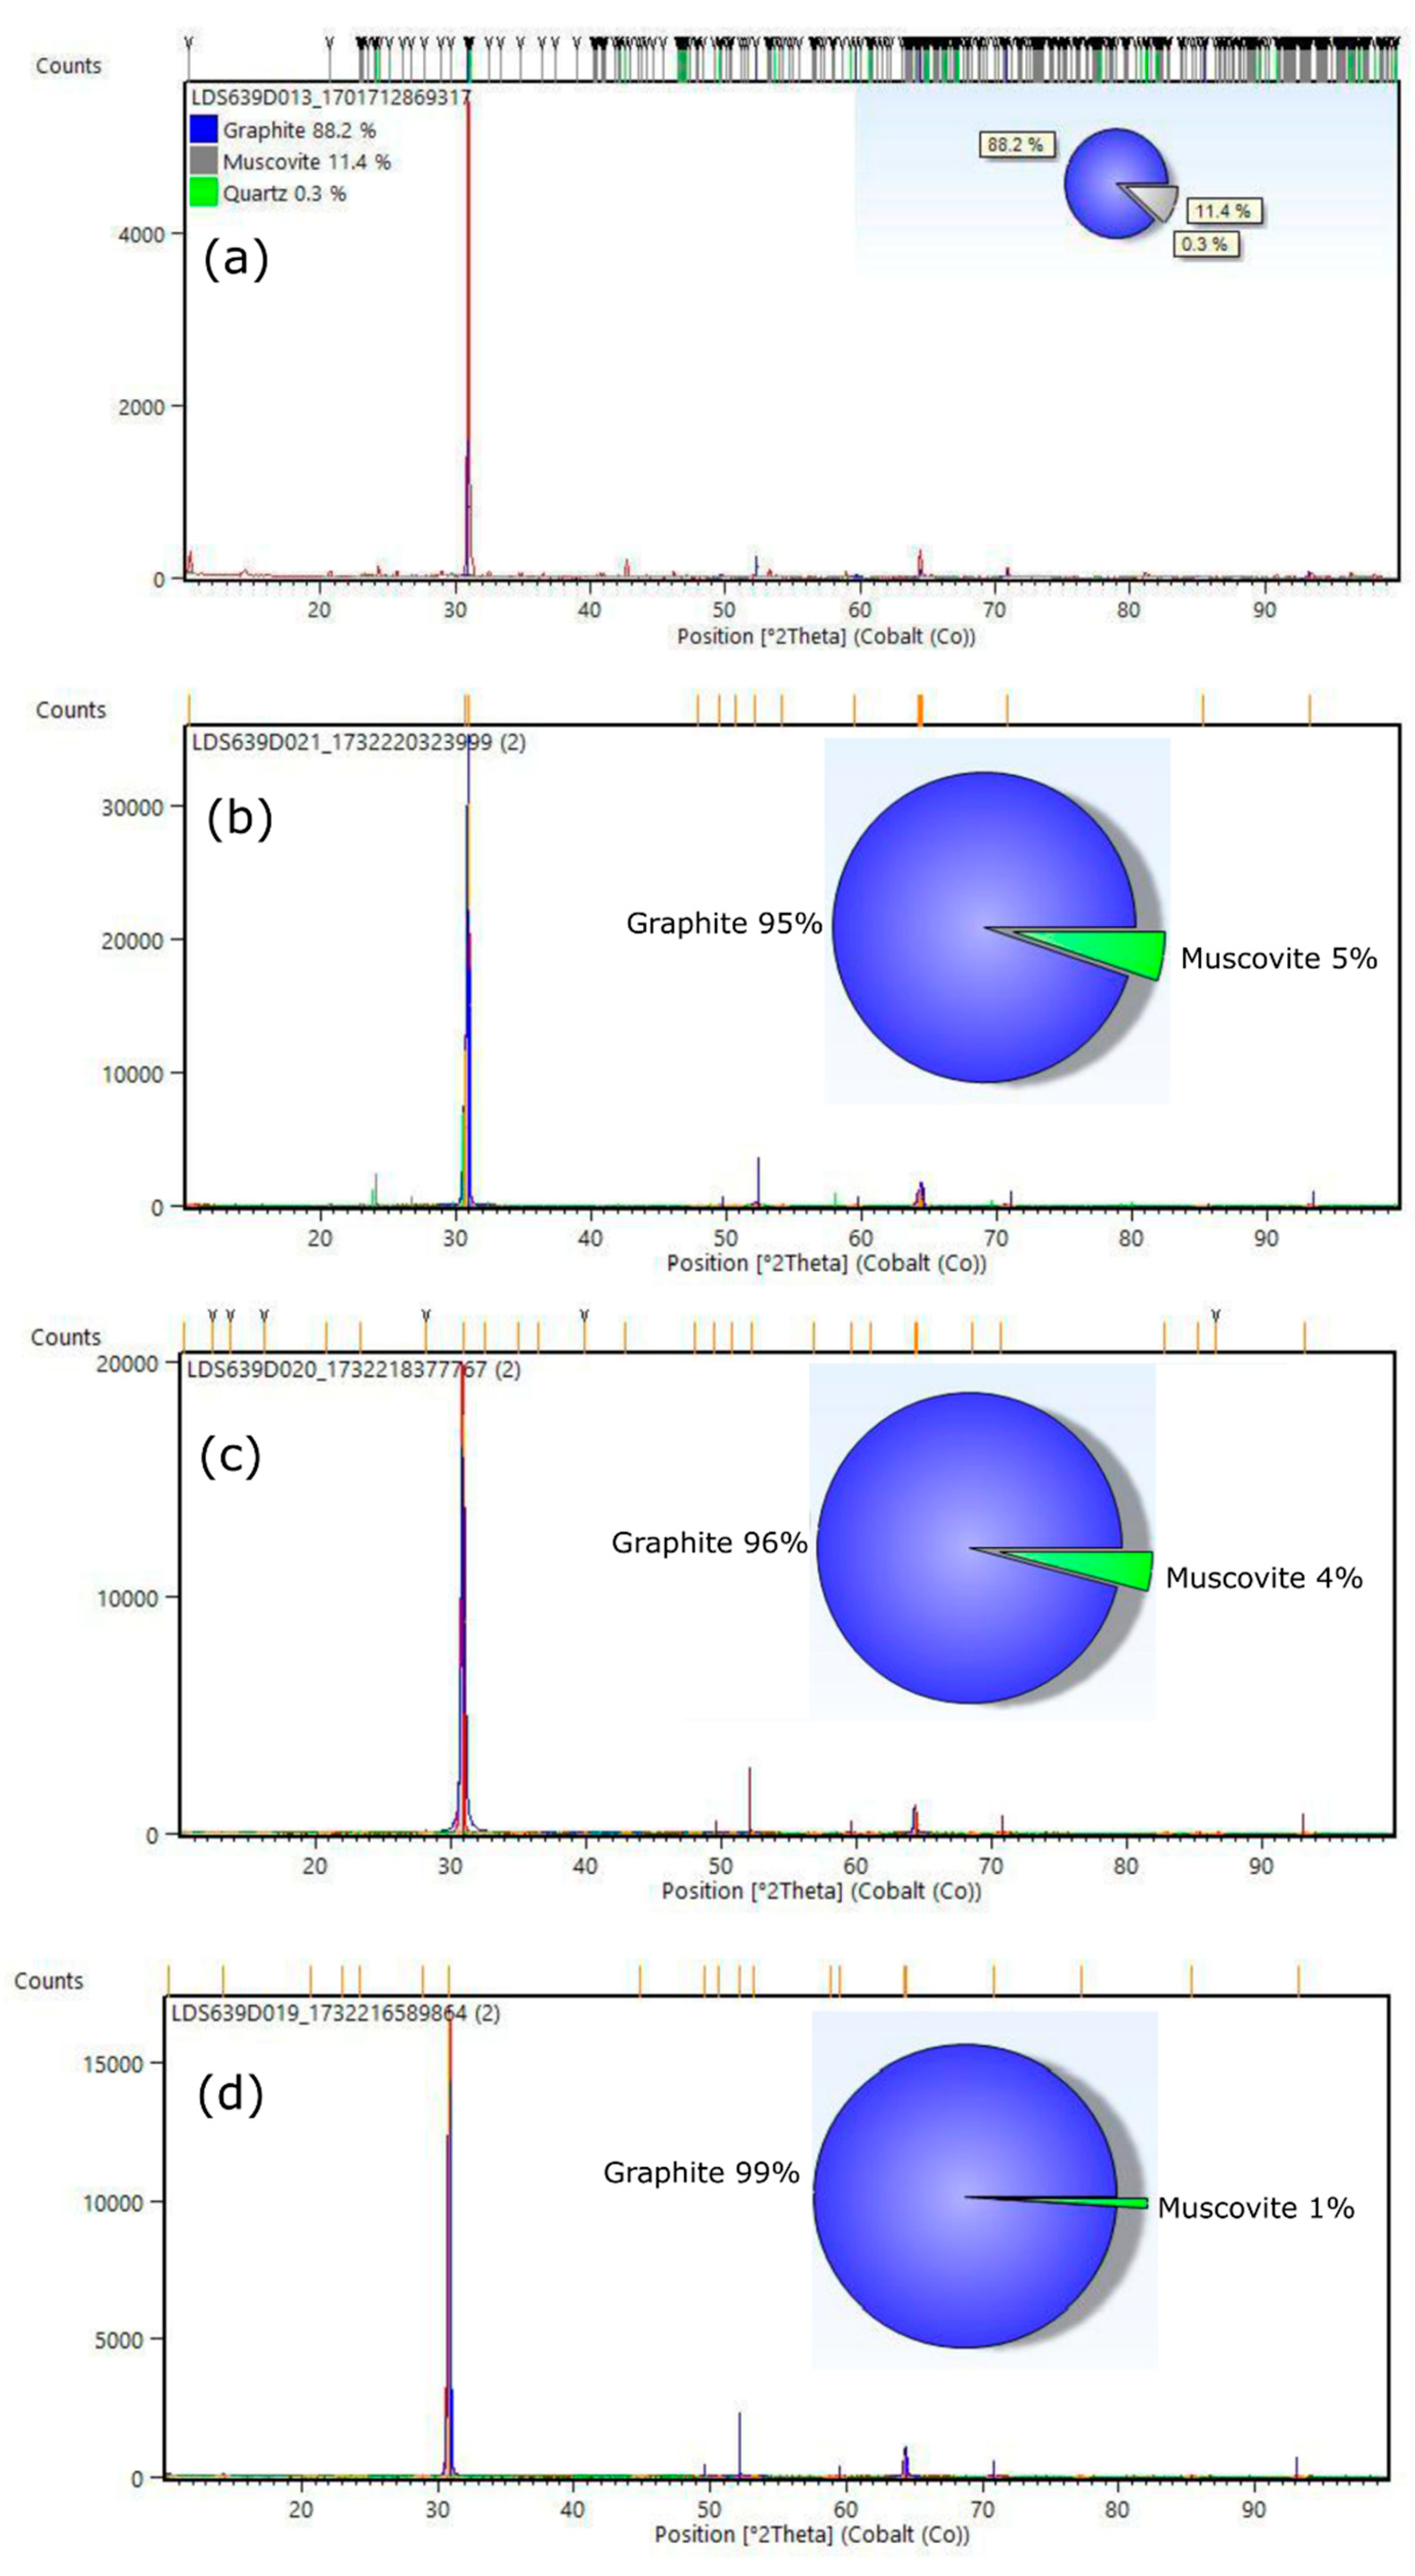
Figure 2.
(a) FTIR spectrum of the C-Bulk, C-NaOH treatment and C-NaOH+H2SO4 treatment samples; (b) Raman spectra of the graphite ore; (c) Raman spectra C-Bulk, C-NaOH treatment and C-NaOH+H2SO4 treatment samples.
Figure 2.
(a) FTIR spectrum of the C-Bulk, C-NaOH treatment and C-NaOH+H2SO4 treatment samples; (b) Raman spectra of the graphite ore; (c) Raman spectra C-Bulk, C-NaOH treatment and C-NaOH+H2SO4 treatment samples.
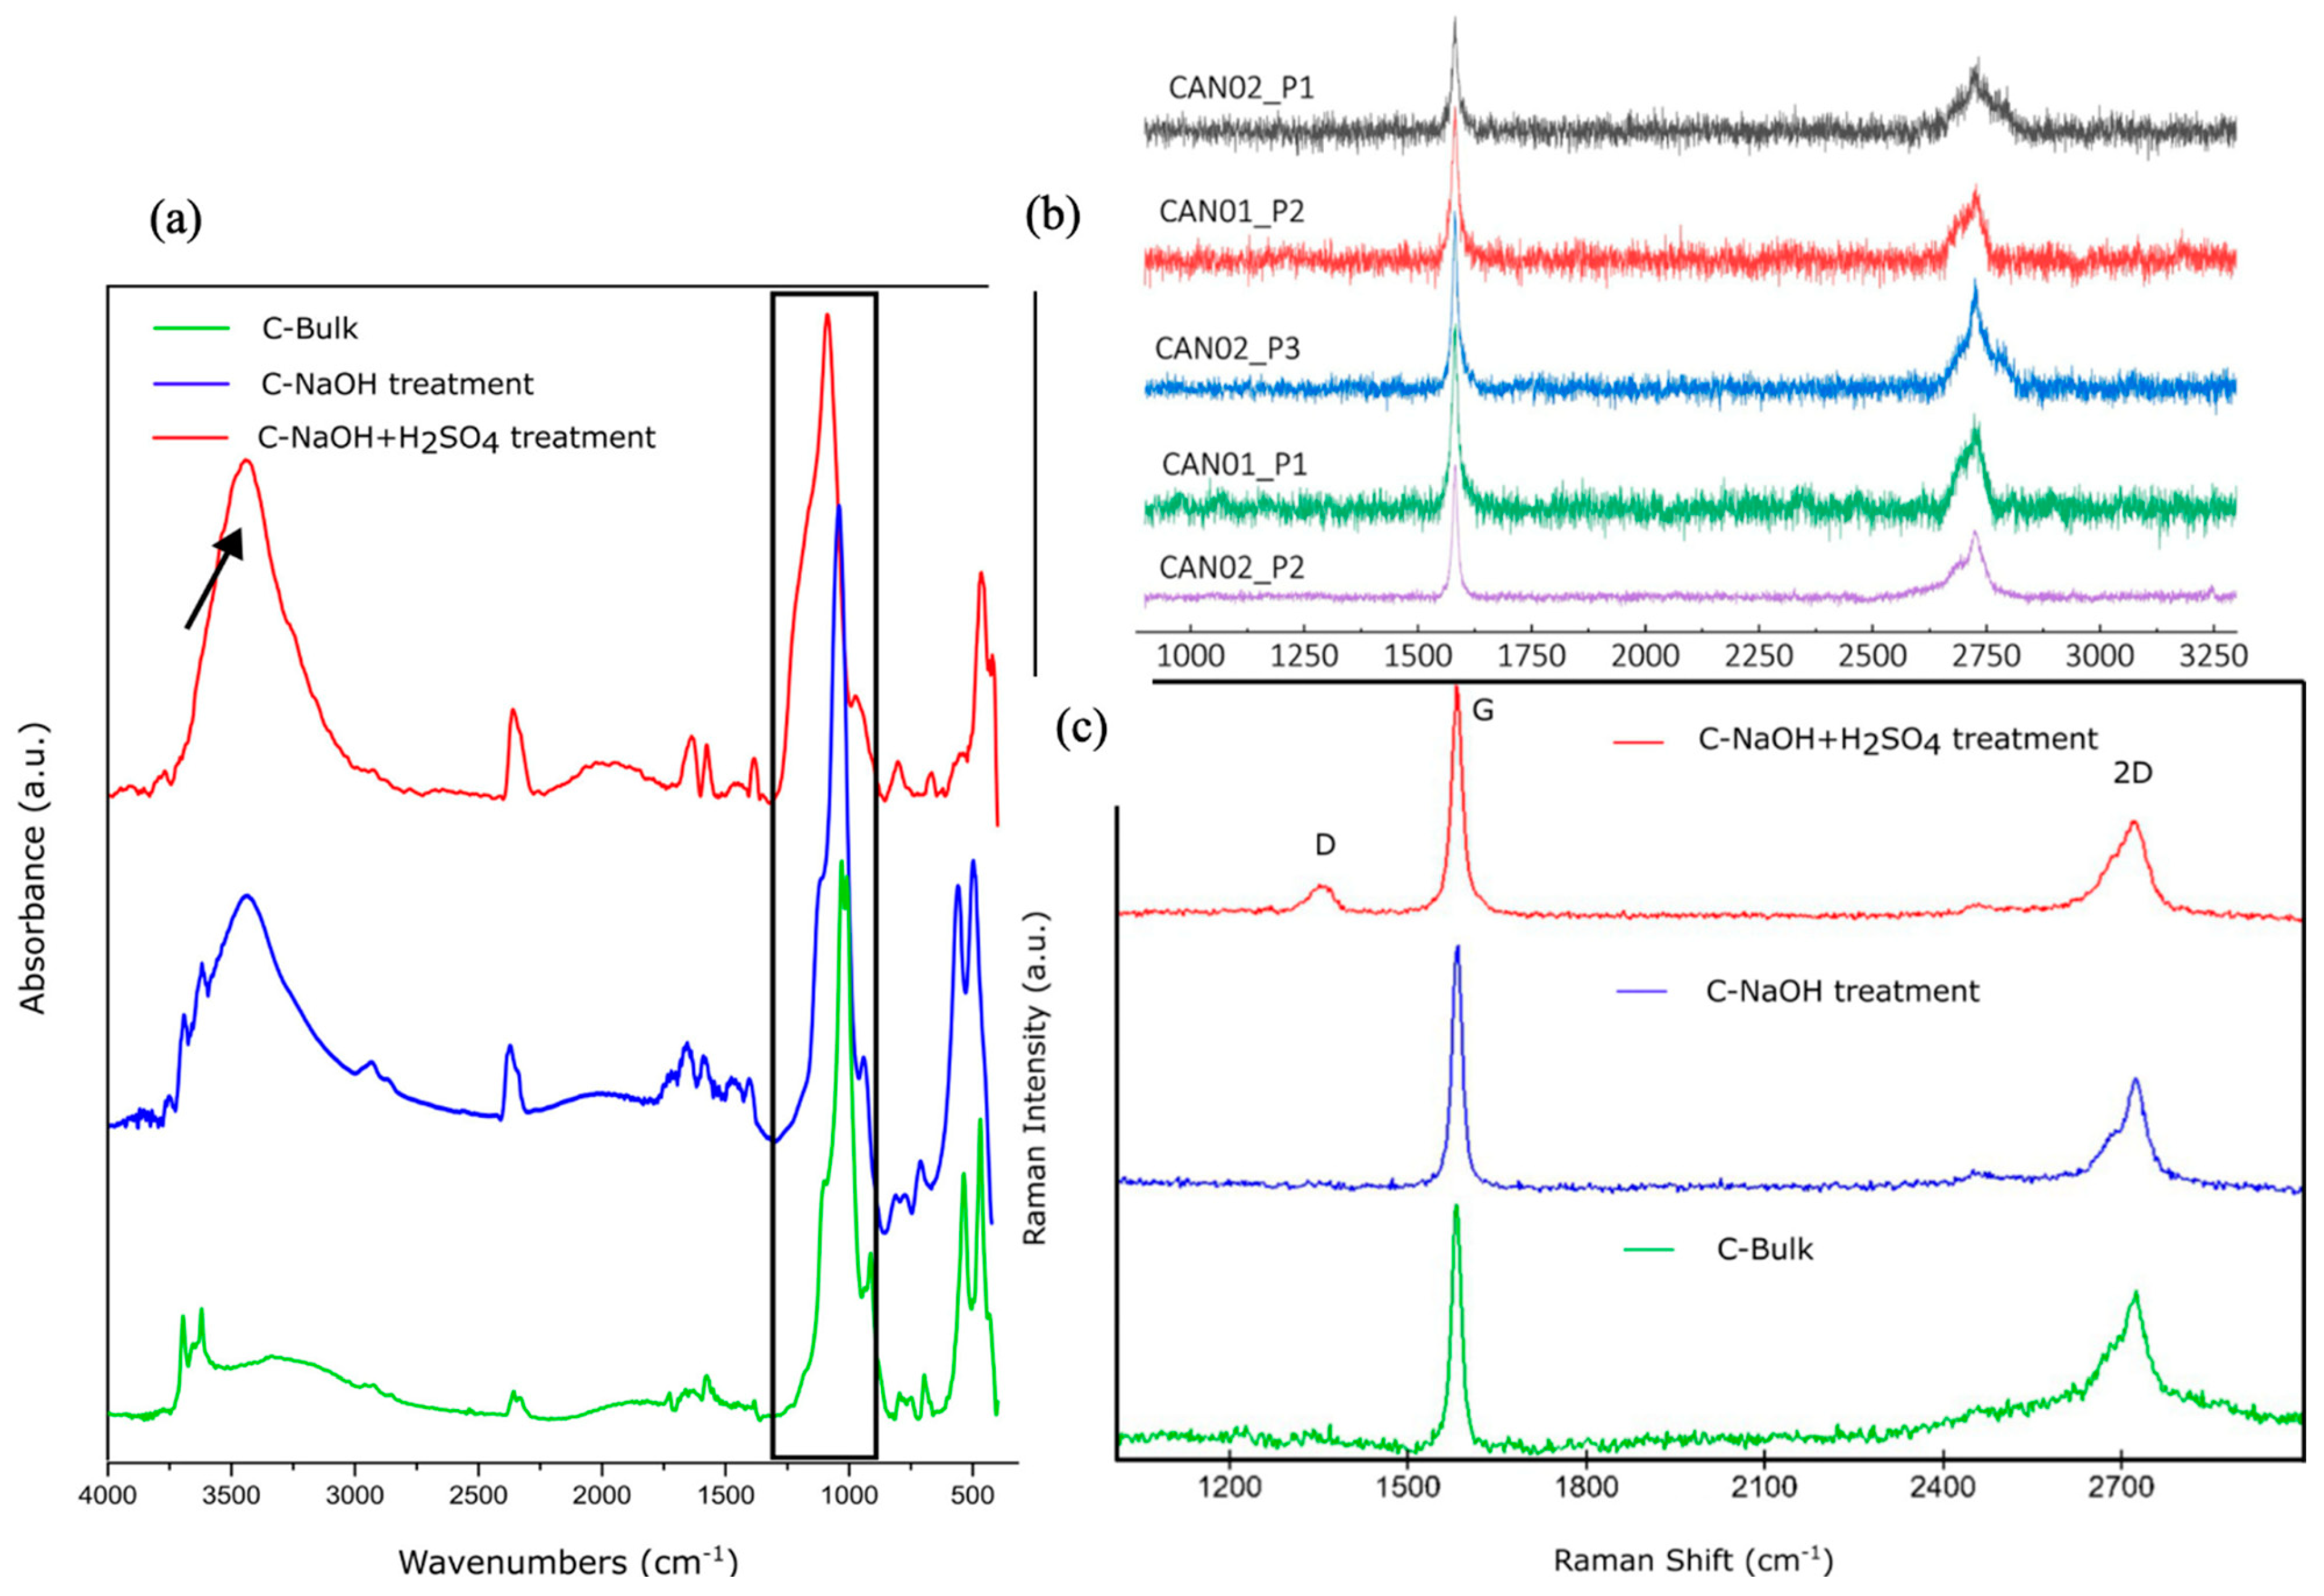
Figure 3.
Atomic Force Microscopy (AFM) images for all prepared materials. (a) C-Bulk; (b) C-Bulk - height profile along the cross-section; (c) С-NaOH treatment; (d) С-NaOH treatment - height profile along the cross-section; (e) C-NaOH+H₂SO₄ treatment; (f) C-NaOH+H₂SO₄ treatment- height profile along the cross-section.
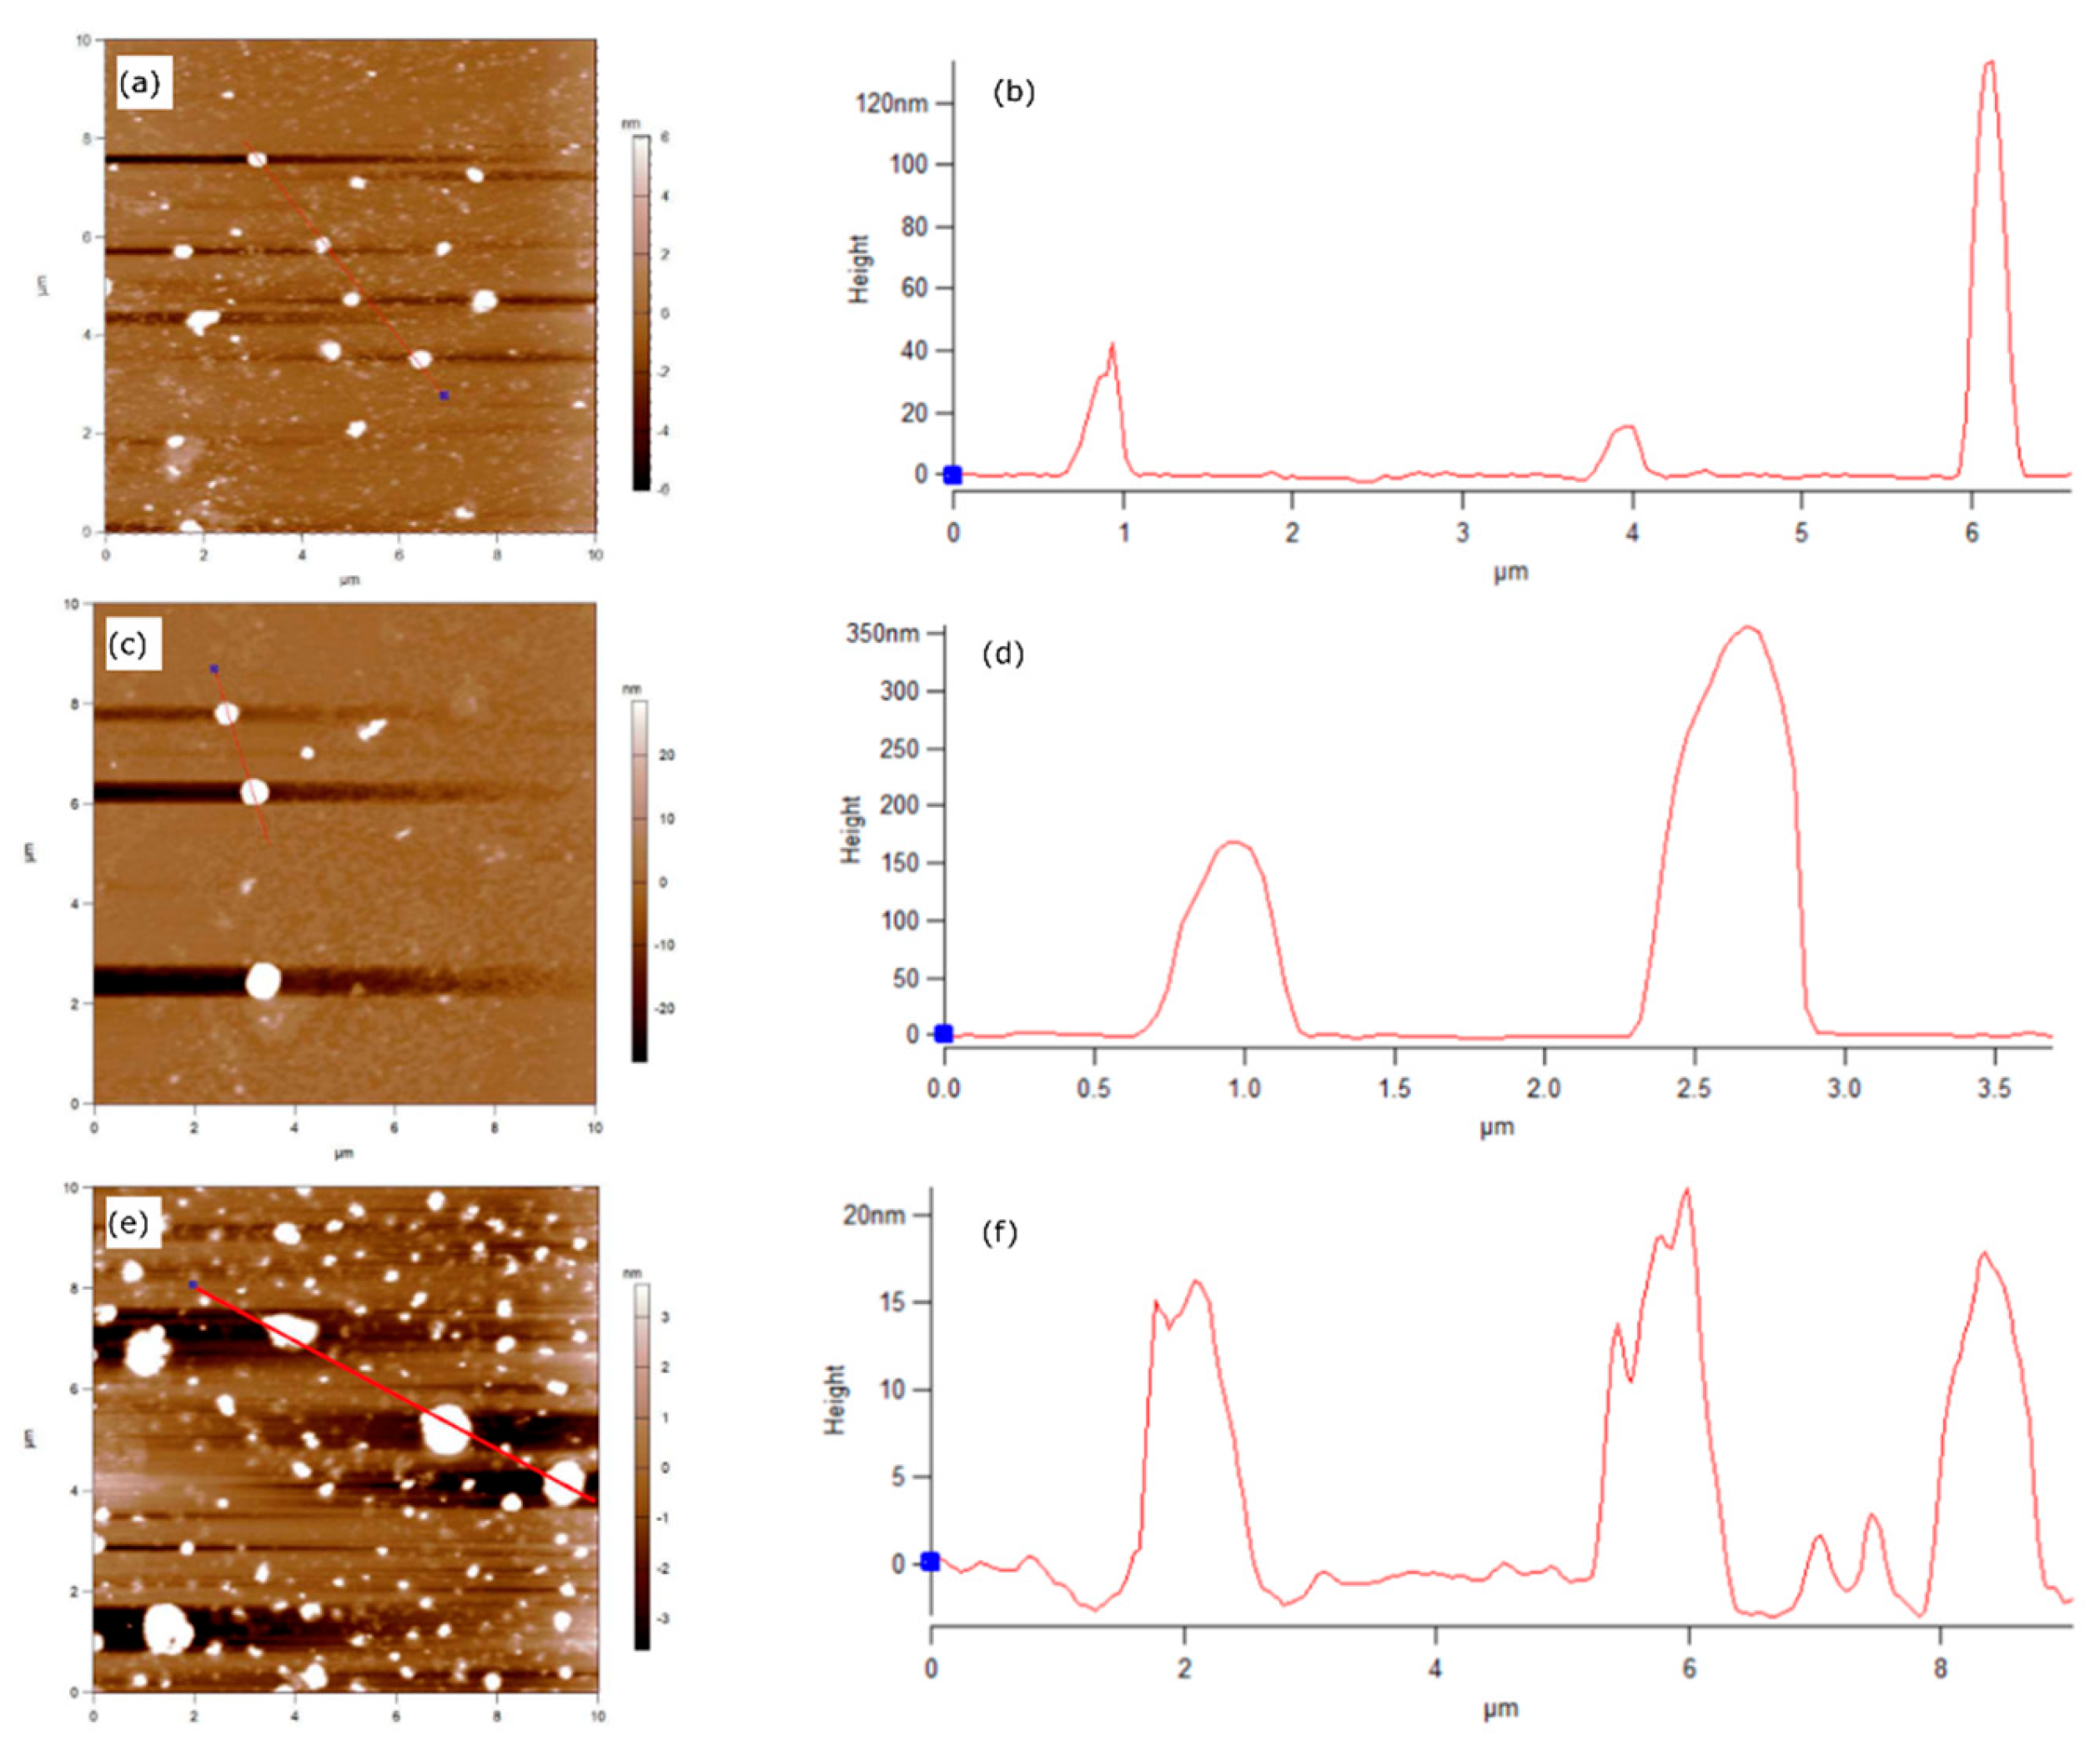

Table 1.
Chemical composition of the samples: graphite ore - Stage 1, C-Bulk – Stage 2, C-NaOH treatment - Stage 3, and C-NaOH+H2SO4 treatment - Stage 4.
Table 1.
Chemical composition of the samples: graphite ore - Stage 1, C-Bulk – Stage 2, C-NaOH treatment - Stage 3, and C-NaOH+H2SO4 treatment - Stage 4.
Disclaimer/Publisher’s Note: The statements, opinions and data contained in all publications are solely those of the individual author(s) and contributor(s) and not of MDPI and/or the editor(s). MDPI and/or the editor(s) disclaim responsibility for any injury to people or property resulting from any ideas, methods, instructions or products referred to in the content. |
© 2025 by the authors. Licensee MDPI, Basel, Switzerland. This article is an open access article distributed under the terms and conditions of the Creative Commons Attribution (CC BY) license (http://creativecommons.org/licenses/by/4.0/).
Copyright: This open access article is published under a Creative Commons CC BY 4.0 license, which permit the free download, distribution, and reuse, provided that the author and preprint are cited in any reuse.


