
Submitted:
24 March 2025
Posted:
25 March 2025
You are already at the latest version
Abstract
Chronic pain leads to not only physical discomfort but also psychological challenges, such as depression and anxiety, which contribute to a substantial healthcare burden. Still, pain detection and assessment remains a challenge due to its subjective nature. Indeed, current clinical methods may be inaccurate or unfeasible for non-verbal patients. Then, Electroencephalography (EEG) has emerged as a promising non-invasive tool for pain detection. However, EEG-based pain detection faces challenges such as noise, volume conduction effects, and high inter-subject variability. Deep Learning (DL) models have shown potential in overcoming these challenges by extracting nonlinear and discriminative patterns. Despite advancements, these models often require a subject-dependent approach and lack of interpretability. To address these limitations, we propose a threefold DL-based framework for coding EEG-based pain detection patterns. i) We employ the Kernel Cross-Spectral Gaussian Functional Connectivity Network (KCS-FCnet) to code pairwise channel dependencies for pain detection. ii) Furthermore, we introduce a frequency-based strategy for class activation mapping to visualize pertinent pain EEG features, thereby enhancing visual interpretability through spatio-frequency patterns. iii) Further, to account for subject variability, we conduct cross-subject analysis and grouping, clustering individuals based on similar pain detection performance, functional connectivity patterns, sex, and age. We evaluate our model using the Brain Mediators of Pain dataset and demonstrate its robustness through subject-dependent and cross-subject generalization tasks for pain detection on non-verbal patients.
Keywords:
pain detection
; EEG
; neural networks
; kernel methods
; interpretability
; cross-subject analysis
1. Introduction
Pain is an important global health issue; according to the Global Burden of Disease Study, this condition affects approximately 20% of the worldwide population, with low back pain, neck pain, and migraines being the most common causes [1]. Chronic pain not only leads to physical suffering but also contributes to psychological issues like depression and anxiety [2]. Uncontrolled pain has also been linked to increased healthcare utilization, including hospitalizations, emergency department visits, and greater financial burden [3]. Nevertheless, pain is not merely a physical sensation; it also involves emotional and psychological components, making it a complex and multidimensional experience [4]. In particular, chronic pain is an experience that persists beyond the healing period, often without a clear cause. Such prolonged issues can alter how the brain processes information, leading to magnified sensitivity. Hence, it requires comprehensive detection and treatment approaches that address both the physical and psychological aspects [5].
Pain detection and assessment are crucial for effective management, allowing healthcare professionals to understand intensity, nature, and impact [6]. Yet, pain is subjective; thus, self-reporting is often the most reliable method of assessment by means of tools such as the Numeric Rating Scale (NRS) and Visual Analog Scale (VAS) [7]. Nevertheless, in cases where self-reporting is challenging—such as with young children, older adults with cognitive impairments, or non-verbal patients—observational scales and physiological approaches are not suitable [6]. Significant progress has been made in pain assessment, particularly in patients unable to communicate. However, current clinical methods still predominantly depend on subjective evaluations [7]. These tools are susceptible to external factors such as mood and lack of physiological bases, limiting their accuracy [8].
In contrast, electrical, pressure, and thermal stimulators have been created, as well as PainMatcher, to get a more accurate picture of pain. Nevertheless, these methods are invasive as they require the application of painful stimuli to record responses [9]. Since pain perception is deeply influenced by brain activity, as well as psychological factors such as expectations and emotions that shape conscious pain experience, neuroimaging techniques have been extensively studied for brain activity-based pain detection [10]. These techniques are broadly classified into invasive and non-invasive methods. Invasive methods, like Electrocorticography (ECoG) and intracranial Electroencephalography (iEEG), offer high spatial and temporal resolution but involve surgical risks. Magnetic Resonance Imaging (fMRI), Magnetoencephalography (MEG), Near-Infrared Spectroscopy (NIRS), and Electroencephalography (EEG) are some of the non-invasive techniques that are more commonly used because they are safe, cost-effective, and simple to use [11]. EEG, in particular, has gained popularity for studying brain connectivity and identifying dysfunctional areas [12]. Its ability to capture specific brain activity patterns makes it a valuable tool for understanding pain and enhancing applications in neurorehabilitation, including motor imagery and brain-computer interface (BCI) systems [13,14].
Still, EEG-based pain detection is significantly hindered by inherent challenges, such as high noise levels and volume conduction issues [15]. The inherent noise in scalp-recorded signals significantly obscures the underlying neural activity. Also, EEG signals are less accurate when they are affected by things outside the brain, such as electromagnetic interference from lights, AC power lines, and electronics, and noise from things going on inside the body, such as digestion, skin resistance changes, heart activity, eye movements, muscle movements, and breathing [16]. Furthermore, functional activities detected by EEG are affected by volume conduction before being recorded in the scalp, leading to correlations between multiple EEG channels that affect competitive performance [17,18].
Moreover, both between- and within-subject variability pose significant challenges to developing a universal EEG-based pain detection algorithm. Genetic, cognitive, and neurodevelopmental differences contribute to variability in neural responses to pain, making it difficult to generalize across individuals. Research has shown that inter- and intra-individual neural variability significantly affects the accuracy of decoding pain-related EEG signals, complicating the identification of universal neural pain markers [19]. Additionally, genetic variations, such as those related to serotonin regulation, have been linked to differences in pain perception and EEG-based biomarkers, further underscoring the complexity of subject-independent pain assessment [20]. Furthermore, EEG-based functional connectivity analyses have revealed substantial differences in pain-related neural activity in newborns, emphasizing the need for adaptive, personalized models for pain detection [21].
In the specific context of EEG-based pain assessment using Machine Learning (ML), traditional approaches such as Support Vector Machines (SVM), k-Nearest Neighbors (k-NN), Random Forests, and Linear Discriminant Analysis (LDA) have been widely applied [22]. These methods are popular due to their ability to handle high-dimensional data and provide interpretability, which is crucial to understanding the relationship between EEG signals and pain. Additionally, in [23] the authors underscored the potential of EEG and ML models such as SVM, LDA, k-NN, and Common Spatial Patterns (CSP) in pain biomarker research. Moreover, [24] explored the potential of EEG to detect pain in adolescents, including those with chronic musculoskeletal pain and those without it, by using SVMs and logistic regression models to classify resting and pain conditions based on EEG signal features. Recently, authors in [8] introduce a ML strategy to distinguish between pain states and non-pain by extracting functional connectivity features and employing a combination of an SVM with a Radial Basis Function (RBF) kernel and a decision tree. Similarly, [25] implemented a decision tree based on average brain maps to classify pain levels. In contrast, [26] developed a hierarchical SVM classifier to categorize pain intensities. Each node within this classifier utilized a custom subset of features, selected using the sequential forward selection method, with the SVM parameters fine-tuned through Bayesian optimization. However, ML-based strategies rely on handcrafted features and struggles with capturing complex brain activity patterns, often lacking the generalization required for robust EEG-based analysis [27].
Deep Learning (DL)-based EEG classification algorithms have demonstrated exceptional potential in overcoming the challenges associated with EEG signal analysis. Among these, convolutional neural networks (CNNs) have emerged as the most effective for feature extraction, as they can efficiently capture both spatial and temporal patterns [28]. Notable CNN architectures widely used for EEG classification include EEGNet, ShallowConvNet, and DeepConvNet, which have shown superior performance in decoding. Beyond CNNs, various DL models have been investigated for EEG analysis. Autoencoders, for example, transform EEG data into a lower-dimensional feature space while reducing noise, enabling the generation of more refined signal representations [29]. Meanwhile, Recurrent Neural Networks (RNNs) leverage the sequential nature of EEG signals, effectively capturing temporal dependencies essential for understanding signal dynamics [30]. Recently, Transformer-based models have gained prominence for their ability to capture long-range dependencies, effectively extracting both global and local features of EEG signals through attention mechanisms [31]. Despite these advancements, applying these DL approaches in the medical field, particularly for EEG-based pain detection, remains a significant challenge. First, their black box nature hinders interpretability, making it difficult to derive meaningful insights into the neurological mechanisms specific to each individual [32]. Second, these models frequently fail to account for the intricate interconnections between neurological, physiological, and behavioral factors [33]. Recognizing and incorporating these influences is essential to achieve more personalized outcomes.
To face the above challenges, some approaches have been proposed to enhance the well-established EEGNet architecture. For instance, the Kernel Regularized EEGNet (KREEGNet) employs a Central Kernel Alignment (CKA) framework as a regularization strategy to optimize model performance [34]. Besides, the Kernel Cross-Spectral Functional Connectivity Network (KCS-FCNet) applies Gaussian kernels aiming to determine functional connectivities and feeding these into a fully connected layer, that maps EEG data into a higher-dimensional feature space to enhance its representation and favors classification tasks [35]. Nevertheless, subject-dependent approaches remain widely used, often lacking the necessary generalization for effective cross-subject pain assessment.
On the other hand, in terms of interpretability, various attribution methods have emerged. Class Activation Maps (CAMs) are widely used for image-based tasks, as they identify which parts of the input most influence the model’s decisions. Initially introduced in [36], CAMs employ weighted activations in a given layer to compute the impact of each feature on the outcome. Grad-CAM extends this by reweighting based on gradients from the model, though it presumes uniform importance across activations [37]. Yet, crucial spatio-frequency features remain unclear, limiting their potential for enhancing explainability in EEG-based pain detection [38].
We present an EEG-based pain detection framework for non-verbal patients leveraging the KCS-FCNet model [35]. We structure our approach into three key components:
- KCS-FCNet-based Pain Detection: We employ 1D convolutional layers to extract rich spatio-frequency features from EEG channels. Additionally, cross-spectral distribution estimation is utilized to capture pain-related patterns, generating functional connectivity feature maps that reveal meaningful pairwise channel relationships.
- Explainability through Frequency CAM (FCAM): To enhance model interpretability, we introduce Frequency CAM (FCAM), a novel technique that provides deeper insights into the model’s decision-making by analyzing both input EEG channel importance and frequency band contributions to pain detection.
- Cross-Subject Analysis: We address subject variability by performing cross-subject analysis and grouping, clustering individuals based on similar pain detection performance, functional connectivity patterns, sex, and age, thus improving generalizability across diverse populations.
For testing, we employ the Brain Mediators of Pain dataset [39], to classify between no pain and high pain states. To assess the inter-subject generalization capabilities, we compare the performance of classical machine learning models, EEGNet, and our enhanced KCS-FCNet framework in EEG-based pain detection tasks [39]. Furthermore, we utilize both subject-dependent training and a leave-one-subject-out cross-validation strategy to evaluate model generalizability across different individuals. Our findings demonstrate that the proposed KCS-FCNet model offers a robust, non-invasive pain detection solution with enhanced spatio-frequency interpretability, making it particularly valuable for assisting in pain assessment for non-verbal patients.
2. Materials and Methods
2.1. Brain Mediators of Pain Database
Brain Mediators of Pain is an EEG database that consists of four paradigms recorded on 51 subjects for pain assessment [39]. In each paradigm, 60 painful stimuli were applied by cutaneous laser stimulation to the dorsum of the left hand. The intensity of the stimulus was varied between three levels: low, medium, and high in a pseudo-randomized sequence where each level was applied 20 times. The stimuli were presented with an interstimulus interval of 8–12 seconds. EEG data were collected using 65 electrodes, covering all positions from the international 10–20 system, with two additional electrodes placed below the outer canthus of each eye. Figure 1 shows the EEG montage used. During acquisition, the EEG signals were referenced to the FCz electrode and grounded at AFz, with a sampling rate of 1000 Hz. The signals were filtered with a high-pass of 0.015 Hz and a low-pass of 250 Hz. The data were downsampled to 500 Hz. For artifact detection, a 1 Hz high-pass filter and a 50 Hz notch filter were applied to remove line noise. Finally, for the purpose of this study, the EEG data was downsampled again to 256 Hz, band-pass filtered between 4 and 60 Hz to preserve the theta (4-8 Hz), alpha (8-13 Hz), beta (13-30 Hz), and gamma (30-60 Hz) frequency bands. For simplicity, EEG channels and conventional 10–20 electrodes are preserved. Then, LE, RE, Ne, Ma, Ext, and ECG records are removed.
The demographic summary in Table 1 presents key characteristics of the study participants. The sample is composed of 26 men and 25 women, resulting in a nearly balanced distribution between genders. The participants’ ages range from a minimum of 20 to a maximum of 37 years, indicating a relatively young cohort. The mean age is 26.74 years with a standard deviation of 3.86, reflecting moderate age variability within the group.
Regarding the pain classification paradigms, see Figure 2, the motor one required participants to release a button as quickly as possible after receiving the pain stimulus, and reaction times served as an indicator of intensity. The perception paradigm asked participants to verbally rate their pain on a scale from 0 (no pain) to 100 (worst tolerable pain) three seconds after each stimulus. The third paradigm, autonomic, involved the administration of 60 painful stimuli while simultaneously recording Skin Conductance Responses (SCRs). Finally, for the combined one, participants first released a button and then immediately provided a verbal pain rating while the SCRs were recorded.
Notably, given our objective to facilitate pain detection tasks for non-verbal patients, we adopt the motor paradigm as a binary classification approach, distinguishing between no pain and high-intensity stimulus, e.g., high pain [40]. For concrete evaluation, each of the 51 subjects contributes 40 EEG trials, each lasting three seconds and recorded at a sampling frequency of 256 Hz across 64 channels.
2.2. Kernel Cross-Spectral Functional Connectivity Network (KCS-FCNet)
Let represents a wide-sense stationary stochastic process with a real-valued auto-correlation function , defined as [41]:
where is a monotonic, absolutely continuous, and differentiable spectral distribution function over the frequency domain .
Considering two vectors , Equation (1) can be extended from a univariate correlation function to a pairwise correlation using a generalized stationary kernel . This kernel maps the data into a Reproducing Kernel Hilbert Space (RKHS) via a nonlinear function . Bochner’s theorem states that such an extension is valid under the assumption that the spectral representation between the vectors satisfies [42]:
where is a vector-valued frequency domain within the bandwidth , and is the cross-spectral density function, with , where is the cross-spectral distribution. Thereby, the cross-spectral distribution yields:
where stands for the Fourier transform and captures cross-frequency information by extracting nonlinear dependencies within . Next, the Gaussian kernel is fixed in Equation 3 for its universal approximation capabilities and efficient computation:
where is the l2-norm and is a scale hyperparameter.
Now, let be a subject-dependent input-output EEG-based pain detection dataset, holding N trials, T time instants, C channels, and classes. In particular, for no-pain vs. high-pain states. To capture the most informative EEG patterns from a given trial , the Kernel Cross-Spectral Functional Connectivity Network (KCS-FCNet) estimates the cross-spectral distribution between EEG channels as in Equation 3 within a DL approach [35]. Indeed, KCS-FCnet uses 1-D convolutions to combine feature layers that pull out time-frequency patterns in each channel and a Gaussian kernel-based pairwise similarity as:
where notation ∘ stands for function composition, holds 1-D convolutional filters with , , and Also, Equation 5 operates for each pair of filtered EEG channels regarding the weights ; then, holds the pairwise EEG channel kernel-based cross-spectral distribution feature map of the input trial for the f-th KCS-FCNet’s filter. Moreover, an average cross-spectral functional connectivity measure can be computed as:
where . The latter allows coding different frequency bands of a single-trial EEG that relate to each other across channels. After computing the average functional connectivity measure, as in Equation 6, a softmax-based output layer is applied over a vectorized version of . Then, the predicted class membership is as follows:
where , ⊗ stands for tensor product, and
2.3. Pain Detection Explainability Through Frequency Class Activation Maps (FCAM)
Gradient-weighted Class Activation Mapping++ (Grad-CAM++) is an advanced deep learning interpretability technique that generates high-resolution heatmaps to localize important regions within an input image more accurately than traditional CAM approaches [43]. By leveraging higher-order gradients, Grad-CAM++ provides refined localization and a more detailed understanding of model decisions. In our approach, we integrate Grad-CAM++ into an EEG-based pain detection framework, representing each trial as an image with C rows (channels) and T columns (time steps) to enhance interpretability and feature relevance analysis.
Here, an upsampled EEG-CAM, denoted as , is computed for an input trial corresponding to the k-th class (). This CAM is derived from the layer in Equation 5 to highlight salient spatio-temporal patterns encoded by KCS-FCNet:
denotes an up-sampling function, is the Rectified Linear Unit, represents the activation map for the f-th 1-D convolutional filter regarding the k-th class, and ⊙ stands for the Hadamard product. The Grad-CAM++ weights are computed as:
where is the k-th class score, and are the Grad-CAM++ coefficients calculated using higher-order partial derivatives of with respect to .
We normalize the EEG-CAM to focus on important spatial and temporal EEG inputs and reduce unwanted CAM artifacts between classes, as follows:
with .
Lastly, to reveal explainable spatio-frequency patterns, we propose to compute the Frequency CAM (FCAM) vector as:
where rules the frequency band of interest and is an all-ones vector of size
2.4. Cross-Subject Pain Detection Analysis
To address pain detection subject variability, we build a scoring matrix that contains as many rows as subjects in the Brain Mediators of Pain Database dataset. In particular, we compute the Accuracy (ACC), the Area Under the ROC Curve (AUC), and the Cohen’s Kappa scores for subject-dependent pain detection performance:
where , , , and stand for true positive, true negative, false positive, and false negative pain detection values. Then, to code classification variability, we also include the standard deviation of each performance measure in Equations 13–.
Next, to incorporate pairwise channel dependencies captured by the KSC-FCNet, we computed the average trial-wise, Gaussian-based functional connectivity matrix for each subject set after network training. Subsequently, a two-sample Kolmogorov–Smirnov test (2KS) [44] is conducted for each pairwise connection to assess differences between the two pain detection classes (no-pain vs. high-pain). The average p-value across all pairwise functional connectivity 2KS tests is then calculated to summarize group-level distinctions. In turn, subject-specific features such as sex and age are also included in the analysis.
All features are normalized within the range to keep the intuition of higher is better in the score matrix. We replace the standard deviation with its complement and normalize Cohen’s kappa by adding the unit and dividing by two. Finally, the well-known t-Distributed Stochastic Neighbor Embedding (t-SNE) [27] is carried out for visual inspection and further stratification and cross-subject testing. Figure 4 depicts the proposed cross-subject pain detection analysis pipeline.
3. Experimental Set-Up
Our proposed KCS-FCNet framework, incorporating enhanced spatio-frequency explainability via FCAMs, is evaluated across both subject-dependent and cross-subject pain detection tasks, specifically distinguishing between no-pain and high-pain conditions.
3.1. Assessment and Method Comparison
We computed the ACC, AUC, and Kappa performance measures in Equations 13- as quantitative assessment. As a method comparison, we tested the Power-based EEG Features with SVM classifier presented in [40], the Filterbank CSP (FBCSP) with LDA [45], and the well-known end-to-end EEG classification network EEGNet [46]. Of note, to maintain consistency with previous research on the relationship between neural activity and pain perception and to ensure the preservation of critical information necessary for accurate pain classification, a band-pass filter was applied between 4 and 60 Hz to preserve Theta (4–8 Hz), Alpha (8–13 Hz), Beta (13–32 Hz), and Gamma (30–60 Hz) rhythms, as these have been associated with various aspects of the pain experience.
3.2. Training Details
The models were trained using 5-fold cross-validation (80% training, 20% testing), with ACC as the primary performance measure. Besides, the best-performing fold was selected for each model and subject to generate the most representative FCAMs (see Section 2.3). We employ the Scikit-Learn, MNE, and TensorFlow Python libraries. All experiments were conducted in a Kaggle notebook using the 2022-10-20 environment, which provides two Tesla T4 GPUs with 15GB of VRAM, 30GB of RAM, and an Intel Xeon CPU @ 2GHz with two threads per core and two sockets per core. We trained the DL methods for 500 epochs using the Adam optimizer (1e-3 learning rate) and binary cross-entropy loss. Additionally, we implemented callbacks to terminate training upon encountering NaN values and to reduce the learning rate when training plateaued.
For hyperparameter selection, we used grid search, varying the value as , , and , and setting the number of filters for KCS-FCNet to 2, 4, or 8. The kernel bandwidth in Equation 4 is tuned through gradient descent within KCS-FCNet training, taking as reference the median pairwise channel EEG Euclidean distances. Table 2 summarizes the DL hyperparameters used, with any unspecified values set to TensorFlow’s defaults. Also, Table 3 details the architecture of the KCS-FCnet. All Python codes are publicly available at https://github.com/sbuitragoo/master-thesis/tree/main/code.
For subject-dependent training, each model was independently trained and evaluated using data from individual subjects. This approach highlights the importance of capturing subject-specific pain mechanisms, which can inform more personalized treatment strategies—ultimately improving the likelihood of therapeutic success [47]. Subsequently, to assess whether the tested pain detection approaches can achieve a suitable cross-subject generalization, the presented approach in Section 2.4 is carried out for visual subject stratification and grouping. Then, a Leave-One-Subject-Out (LOSO) cross-validation strategy evaluates each model on EEG recordings from previously unseen subjects, ensuring a robust measure of inter-subject generalization.
Figure 5 summarizes the main sketch for testing subject-independent and cross-subject pain detection.
4. Results and Discussion
4.1. Subject-Dependent Method Comparison Results
Figure 6 and Table 4 present the subject-dependent classification results for the FBCSP, EEGNet, and KCS-FCNet methods. As illustrated, both EEGNet and KCS-FCNet consistently outperformed traditional approaches such as FBCSP and Power-based feature extraction, demonstrating robust intra-subject performance. Notably, KCS-FCNet surpassed EEGNet in the majority of subjects, yielding superior average scores across all major evaluation measures, including ACC, Kappa, and AUC.
These results highlight KCS-FCNet’s enhanced capability in reliably identifying pain-related neural patterns. Its higher Kappa values indicate greater consistency in classification decisions, while the elevated AUC reflects stronger class separability. Then, KCS-FCNet is more adept at modeling individualized neural responses to pain stimuli. A key factor contributing to this advantage is KCS-FCNet’s integration of Gaussian functional connectivity, which enables it to capture complex, distributed interactions across EEG channels and frequency bands. By leveraging these nuanced interdependencies, the model constructs a more expressive and discriminative representation of brain activity.
4.2. Cross-Subject Method Comparison Results
Figure 7 shows the 2D t-SNE projection of the suggested method for cross-subject analysis, which is explained in Section 2.4. The embedding illustrates the cross-subject relationships based on subject-dependent performance measures (ACC, AUC, Kappa) for the FBCSP, EEGNet, and KSC-FCNet pain detection methods. Besides, it includes the KCS-FCNet-derived functional connectivity patterns and demographic attributes, including sex and age. Hence, 22 features are used to represent each subject. Of note, points within the blue region represent female subjects, while those in the orange region correspond to male subjects. Additionally, marker sizes correspond to subject age, while color intensity reflects subject-dependent pain detection ACC.
At first glance, the subject-dependent performance metrics, when analyzed alongside demographic data, suggest that gender plays a significant role in influencing the model’s decision-making. This observation underscores the importance of incorporating gender as a critical factor in pain classification analyses.
Similarly, Figure 8 presents a 2D t-SNE projection illustrating cross-subject relationships based on the functional connectivity estimated by KCS-FCNet. The color bar represents the p-values of each connection within the subject-specific connectivity matrices, with darker blue tones indicating stronger class separability. Thus, the bluer the matrix, the greater its discriminative power. The visualization reveals substantial inter-subject variability, particularly in terms of local and global discriminative connectivity patterns identified via the 2KS test (see Section 2.4). Overall, male subjects tend to exhibit denser brain connectivity profiles, whereas female subjects display more sparse but distinct FC.
Given the demonstrated impact of gender on EEG-based pain classification, new subgroups were formed by selecting male and female subjects with subject-dependent ACC exceeding 85% to preserve good-performing pain detection. Table 5 summarizes key demographic characteristics of these subgroups, including subject sex along with minimum, maximum, and average ages. Table 6 and Table 7 show the cross-subject pain detection results for males and females, respectively, from sex-based grouping as in Table 5. As seen, straightforward FBCSP achieves a poor generalization performance. DL-based approaches, such as EEGNet and KCS-FCNet, demonstrate good generalization performance for male-based cross-subject analysis. However, KCS-FCnet outperformed the others, particularly for male-based grouping. Of note, the LOSO strategy yields higher pain detection performance among male subjects compared to female subjects. The latter may be attributed to sex-related differences in EEG patterns, which have been shown to be distinguishable with high ACC by both ML and DL models. Such findings suggest that sex-specific neural characteristics can significantly influence classification outcomes in tasks like pain detection [48].
Furthermore, Figure 9 compares the models’ ACC within the male group across subject-dependent and cross-subject pain detection experiments. The figure highlights an expected drop in ACC when transitioning to subject-independent evaluation, as models are tested on previously unseen subjects. Despite this decline, the models, particularly KCS-FCNet, maintain strong performance, demonstrating their ability to generalize effectively to unseen data.
Although overall performance was slightly reduced in the female subgroup, KCS-FCNet consistently outperformed all other models, as shown in Figure 10. This highlights its robust generalization capabilities, particularly for pain detection in previously unseen subjects—a critical requirement for reliable assessment in non-verbal patient populations. These results underscore the model’s potential for real-world, subject-independent applications. Notably, KCS-FCNet exhibited particularly strong performance in the male group, achieving the highest scores across all evaluation metrics, further reinforcing its effectiveness and robustness across diverse demographic profiles.
4.3. FCAM-Based Spatio-Frequency Explainability Results
To provide deeper insight into the pain detection results, Figure 11 and Figure 12 present the FCAM spatio-frequency relevance analysis results (see Equation 12). Spatio-frequency topomaps are presented using Subjects 15 and 29 as a representative male and female case, respectively. Frequency bands include theta (4–8 Hz), alpha (8–13 Hz), beta (13–30 Hz), gamma (30–60 Hz), and the full band (4–60 Hz). The FCAM relevance vectors are scaled from 0 to 1, which lets them pick out patterns that are different between the no-pain and high-pain detection classes. Moreover, Figure 13 show their corresponding KCS-FCNet-based Gaussian functional connectivities.
As seen, this visualization aligns closely with the findings in [49], which identified a direct correlation between pain experience and a decrease in the activity of the alpha and beta frequency bands for male subjects. Likewise, it closely aligns with the results obtained in [50] where they indicated that in women, the subjective unpleasantness of pain is strongly associated with an increase in activity in the pregenual anterior cingulate cortex. Together, the CAMs reinforce the relationship between specific EEG frequency bands and the neural representation of pain, highlighting their importance in accurate pain classification.
4.4. Limitations
Despite the promising results obtained with our proposed EEG-pain detection framework using KCS-FCNet and FCAM, several limitations should be acknowledged. First, although the model shows competitive subject-independent performance, especially when compared to traditional methods, the variability in EEG responses across individuals remains a significant challenge. Inter-subject variability related to genetic, psychological, and neurodevelopmental factors can result in distinct neural signatures of pain, which limits the generalizability of DL models trained on limited cohorts. Furthermore, while sex-specific grouping enhanced cross-subject pain detection performance in our experiments, the model’s ability to generalize across other demographic dimensions—such as cultural background, pain tolerance, or cognitive state—was not explored and may affect its robustness in real-world clinical scenarios [3].
Another key limitation concerns the availability and diversity of EEG datasets for pain assessment. Most publicly available databases, including the one used in this study, rely on controlled experimental pain stimuli (e.g., laser-evoked pain) that may not fully capture the complexity of chronic or spontaneous pain experienced by patients in clinical settings [51]. Additionally, the relatively short duration of EEG recordings and the binary nature of the classification task (no-pain vs. high-pain) do not reflect the continuous and subjective nature of real pain experiences. This underscores the need for future work to explore multimodal data fusion (e.g., EEG with fNIRS, facial expressions, or physiological signals), develop more nuanced pain intensity scales, and validate models in naturalistic and clinical environments. Moreover, interpretability methods such as FCAMs, while useful, still require domain expert validation to ensure the clinical relevance of the identified patterns.
5. Conclusions
We present a novel EEG-based pain detection framework designed to support pain assessment in non-verbal patients. Central to our approach is the Kernel Cross-Spectral Functional Connectivity Network (KCS-FCNet), which effectively captures discriminative spatio-frequency EEG patterns by modeling pairwise channel dependencies through Gaussian kernel-based connectivity. To improve interpretability, we introduce the Frequency Class Activation Mapping (FCAM) technique—an adaptation of the Grad-CAM++ method—allowing for detailed visualization of relevant EEG channels and frequency bands contributing to the model’s predictions. Furthermore, we perform a comprehensive cross-subject analysis that incorporates subject-dependent performance metrics, KCS-FCNet-derived functional connectivity patterns, as well as demographic attributes such as sex and age, enabling the grouping of individuals with similar pain-related neural responses.
Our results demonstrate that the proposed KCS-FCNet framework offers a robust and interpretable solution for EEG-based pain detection, particularly suited for non-verbal populations. By integrating kernel-based functional connectivity estimation with convolutional neural networks, our model effectively captures spatio-frequency dependencies across EEG channels, achieving superior classification performance compared to traditional machine learning methods and baseline deep learning models such as EEGNet. Also, the incorporation of Frequency Class Activation Maps (FCAMs) further enhances the model’s interpretability, providing insight into the spectral and spatial patterns associated with pain states, differentiation male and female pain detection patterns.
Additionally, the cross-subject analysis underscores the model’s generalization capability, especially when stratifying by sex and leveraging connectivity-based metrics. The improved performance within specific demographic subgroups suggests that personalized models, informed by subject-specific features, can yield more accurate and reliable pain detection. These findings reinforce the importance of considering both biological and connectivity-based heterogeneity in EEG signals when developing clinically applicable tools for objective pain assessment.
Future work will explore the extension of this approach to multimodal data, integrating EEG with other physiological or behavioral signals such as fNIRS, heart rate variability, or facial expressions to enhance pain classification performance in real-world scenarios [52]. We also plan to validate the framework on clinical datasets involving chronic and spontaneous pain conditions, moving beyond experimental stimuli [53]. Furthermore, the development of lightweight, real-time implementations of KCS-FCNet will be essential for deployment in bedside or wearable monitoring systems, ultimately supporting continuous and objective pain assessment in clinical environments.
Author Contributions
Conceptualization, S.B.-O., A.A.-M. and J.G.-G.; data curation, S.B.-O.; methodology, S.B.-O., A.A.-M., D.C.-P.; project administration, A. A.-M., and A.O.-G.; supervision, A.A.-M., J.G.-G., and D. C.-D.; resources, S.B.-O. and D. C.-P. All authors have read and agreed to the published version of the manuscript.
Funding
Under grants provided by the research program ACEMATE, cod. 111091991908, and the project “Optimización de rutas de atención en salud mental a través de estrategias comunitarias y de herramientas tecnológicas para el pre-diagnóstico, la intervención y el seguimiento de poblaciones con factores de riesgo biopsicosocial” with code 92406, both funded by Minciencias.
Institutional Review Board Statement
Not applicable
Informed Consent Statement
Not applicable
Data Availability Statement
The publicly available dataset analyzed in this study and our Python codes can be found at https://github.com/sbuitragoo/master-thesis/tree/main/code (accessed on 1 December 2024).
Conflicts of Interest
The authors declare no conflicts of interest.
References
- Lindsay, N.M.; Chen, C.; Gilam, G.; Mackey, S.; Scherrer, G. Brain circuits for pain and its treatment. Science Translational Medicine 2021, 13, eabj7360. [Google Scholar] [CrossRef] [PubMed]
- Calati, R.; Bakhiyi, C.L.; Artero, S.; Ilgen, M.; Courtet, P. The impact of physical pain on suicidal thoughts and behaviors: Meta-analyses. Journal of psychiatric research 2015, 71, 16–32. [Google Scholar]
- Zhang, M.; Zhu, L.; Lin, S.Y.; Herr, K.; Chi, C.L.; Demir, I.; Dunn Lopez, K.; Chi, N.C. Using artificial intelligence to improve pain assessment and pain management: a scoping review. Journal of the American Medical Informatics Association 2023, 30, 570–587. [Google Scholar]
- Ploner M, Sorg C, G. J. Brain Rhythms of Pain. Trends Cogn Sci 2017. [Google Scholar]
- Baliki, M.N.; Apkarian, A.V. Nociception, pain, negative moods, and behavior selection. Neuron 2015, 87, 474–491. [Google Scholar] [PubMed]
- Cascella, M.; Schiavo, D.; Cuomo, A.; Ottaiano, A.; Perri, F.; Patrone, R.; Migliarelli, S.; Bignami, E.G.; Vittori, A.; Cutugno, F. Artificial intelligence for automatic pain assessment: research methods and perspectives. Pain Research and Management 2023, 2023, 6018736. [Google Scholar]
- Wu, F.; Mai, W.; Tang, Y.; Liu, Q.; Chen, J.; Guo, Z. Learning Spatial-Spectral-Temporal EEG Representations with Deep Attentive-Recurrent-Convolutional Neural Networks for Pain Intensity Assessment. Neuroscience 2022, 481, 144–155. [Google Scholar] [CrossRef] [PubMed]
- Modares-Haghighi, P.; Boostani, R.; Nami, M.; Sanei, S. Quantification of pain severity using EEG-based functional connectivity. Biomedical Signal Processing and Control 2021, 69, 102840. [Google Scholar] [CrossRef]
- SH, W.; van der Velden, JM.; AS, G.; AW, H.K. ; van Dijk JFM.; JJC, V. A Systematic Review of Devices and Techniques that Objectively Measure Patients’ Pain. Pain Physician, 2019. [Google Scholar]
- Nicolas-Alonso, L.F.; Gomez-Gil, J. Brain computer interfaces, a review. sensors 2012, 12, 1211–1279. [Google Scholar] [CrossRef]
- Miao, M.; Hu, W.; Yin, H.; Zhang, K. Spatial-frequency feature learning and classification of motor imagery EEG based on deep convolution neural network. Computational and mathematical methods in medicine 2020, 2020. [Google Scholar]
- Cao, J.; Zhao, Y.; Shan, X.; Wei, H.l.; Guo, Y.; Chen, L.; Erkoyuncu, J.A.; Sarrigiannis, P.G. Brain functional and effective connectivity based on electroencephalography recordings: A review. Human Brain Mapping 2022, 43, 860–879. [Google Scholar] [CrossRef]
- P, Z.; A, L.; Artemiadis A, T.G.; P, N.; Unwin Z, K.V.; GM, H.; G, V.; Y, Z.; PG, S. EEG Recordings as Biomarkers of Pain Perception: Where Do We Stand and Where to Go? Pain Ther 2022. [Google Scholar] [CrossRef]
- Guggisberg, A.; Dalal, S.; Findlay, A.; Nagarajan, S. High-frequency oscillations in distributed neural networks reveal the dynamics of human decision making. Frontiers in Human Neuroscience 2008, 2. [Google Scholar] [CrossRef]
- Koenig, T.; Smailovic, U.; Jelic, V. Past, present and future EEG in the clinical workup of dementias. Psychiatry Research: Neuroimaging 2020, 306, 111182. [Google Scholar] [CrossRef]
- Yadav, S.; Saha, S.K.; Kar, R. Evolutionary algorithm-based optimal wiener-adaptive filter design: An application on eeg noise mitigation. IEEE Transactions on Instrumentation and Measurement 2023, 72, 1–12. [Google Scholar]
- Sazgar, M.; Young, M.G. , 2019; pp. 149–162. https://doi.org/10.1007/978-3-030-03511-2_8.Artifacts. In Absolute Epilepsy and EEG Rotation Review: Essentials for Trainees; Springer International Publishing: Cham, 2019; pp. 149–162. [Google Scholar] [CrossRef]
- Mumtaz, W.; Rasheed, S.; Irfan, A. Review of challenges associated with the EEG artifact removal methods. Biomedical Signal Processing and Control 2021, 68, 102741. [Google Scholar] [CrossRef]
- Marsicano, G.; Bertini, C.; Ronconi, L. Decoding cognition in neurodevelopmental, psychiatric and neurological conditions with multivariate pattern analysis of EEG data. Neuroscience & Biobehavioral Reviews, 2024; 105795. [Google Scholar]
- Guldner, S.; Ernst, J.; Nees, F.; Holz, N. The Utility of Biomarkers for Assessment and Intervention in Neurodevelopmental Disorders. In Digital Technologies for Learning and Psychological Interventions; Springer, 2024; pp. 43–81.
- Bastianelli, M.; Bertini, G.; Cossu, C.; Coviello, C.; Dani, C.; Frassineti, L.; Gabbanini, S.; Guarguagli, V.; Lanata, A.; Lori, S.; et al. Multivariate EEG functional connectivity analysis in newborns: Preliminary results on painful procedures and neurodevelopmental outcomes. Journal of Neonatal-Perinatal Medicine 2024, 17, 361–362. [Google Scholar]
- Mari, T.; Henderson, J.; Maden, M.; Nevitt, S.; Duarte, R.; Fallon, N. Systematic Review of the Effectiveness of Machine Learning Algorithms for Classifying Pain Intensity, Phenotype or Treatment Outcomes Using Electroencephalogram Data. The Journal of Pain 2021, 23. [Google Scholar] [CrossRef]
- Rockholt, M.M.; Kenefati, G.; Doan, L.V.; Chen, Z.S.; Wang, J. In search of a composite biomarker for chronic pain by way of EEG and machine learning: where do we currently stand? Frontiers in Neuroscience 2023, 17. [Google Scholar] [CrossRef]
- Teel, E.F.; Ocay, D.D.; Blain-Moraes, S.; Ferland, C.E. Accurate classification of pain experiences using wearable electroencephalography in adolescents with and without chronic musculoskeletal pain. Frontiers in Pain Research 2022, 3. [Google Scholar] [CrossRef]
- Nezam, T.; Boostani, R.; Abootalebi, V.; Rastegar, K. A Novel Classification Strategy to Distinguish Five Levels of Pain Using the EEG Signal Features. IEEE Transactions on Affective Computing 2021, 12, 131–140. [Google Scholar] [CrossRef]
- Afrasiabi, S.; Boostani, R.; Masnadi-Shirazi, M.A.; Nezam, T. An EEG based hierarchical classification strategy to differentiate five intensities of pain. Expert Systems with Applications 2021, 180, 115010. [Google Scholar] [CrossRef]
- Murphy, K. Probabilistic Machine Learning: An Introduction; Adaptive Computation and Machine Learning series, MIT Press, 2022.
- Rakhmatulin, I.; Dao, M.S.; Nassibi, A.; Mandic, D. Exploring Convolutional Neural Network Architectures for EEG Feature Extraction. Sensors 2024, 24. [Google Scholar] [CrossRef]
- Liu, J.; Wu, G.; Luo, Y.; Qiu, S.; Yang, S.; Li, W.; Bi, Y. EEG-based emotion classification using a deep neural network and sparse autoencoder. Frontiers in Systems Neuroscience 2020, 14, 43. [Google Scholar]
- Chowdary, M.K.; Anitha, J.; Hemanth, D.J. Emotion recognition from EEG signals using recurrent neural networks. Electronics 2022, 11, 2387. [Google Scholar] [CrossRef]
- Ma, Y.; Song, Y.; Gao, F. A novel hybrid CNN-transformer model for EEG motor imagery classification. In Proceedings of the 2022 International Joint Conference on Neural Networks (IJCNN). IEEE; 2022; pp. 1–8. [Google Scholar]
- Li, X.; Xiong, H.; Li, X.; Wu, X.; Zhang, X.; Liu, J.; Bian, J.; Dou, D. Interpretable deep learning: Interpretation, interpretability, trustworthiness, and beyond. Knowledge and Information Systems 2022, 64, 3197–3234. [Google Scholar]
- Bhardwaj, H.; Tomar, P.; Sakalle, A.; Ibrahim, W. Eeg-based personality prediction using fast fourier transform and deeplstm model. Computational Intelligence and Neuroscience 2021, 2021, 6524858. [Google Scholar] [CrossRef]
- Tobón-Henao, M.; Álvarez Meza, A.M.; Castellanos-Dominguez, C.G. Kernel-Based Regularized EEGNet Using Centered Alignment and Gaussian Connectivity for Motor Imagery Discrimination. Computers 2023, 12. [Google Scholar] [CrossRef]
- García-Murillo, D.G.; Álvarez Meza, A.M.; Castellanos-Dominguez, C.G. KCS-FCnet: Kernel Cross-Spectral Functional Connectivity Network for EEG-Based Motor Imagery Classification. Diagnostics 2023, 13. [Google Scholar] [CrossRef]
- Zhou, B.; Khosla, A.; Lapedriza, A.; Oliva, A.; Torralba, A. Learning Deep Features for Discriminative Localization. In Proceedings of the 2016 IEEE Conference on Computer Vision and Pattern Recognition (CVPR); 2016; pp. 2921–2929. [Google Scholar] [CrossRef]
- Selvaraju, R.R.; Cogswell, M.; Das, A.; Vedantam, R.; Parikh, D.; Batra, D. Grad-CAM: Visual Explanations from Deep Networks via Gradient-Based Localization. International Journal of Computer Vision 2019, 128, 336–359. [Google Scholar] [CrossRef]
- Modares-Haghighi, P.; Boostani, R.; Nami, M.; Sanei, S. Quantification of pain severity using EEG-based functional connectivity. Biomedical Signal Processing and Control 2021, 69, 102840. [Google Scholar]
- Tiemann, L.; Hohn, V.; Ploner, M. Brain mediators of pain, 2024.
- Sun, G.; Wen, Z.; Ok, D.; Doan, L.; Wang, J.; Chen, Z.S. Detecting acute pain signals from human EEG. Journal of Neuroscience Methods 2021, 347, 108964. [Google Scholar] [CrossRef]
- Cohen, L. The generalization of the Wiener-Khinchin theorem. In Proceedings of the Proceedings of the 1998 IEEE International Conference on Acoustics, Speech and Signal Processing, ICASSP’98 (Cat.
- Wackernagel, H. Multivariate geostatistics: an introduction with applications; Springer Science & Business Media, 2003.
- Chattopadhay, A.; Sarkar, A.; Howlader, P.; Balasubramanian, V.N. Grad-cam++: Generalized gradient-based visual explanations for deep convolutional networks. In Proceedings of the 2018 IEEE winter conference on applications of computer vision (WACV). IEEE; 2018; pp. 839–847. [Google Scholar]
- Berger, V.W.; Zhou, Y. Kolmogorov–smirnov test: Overview. Wiley statsref: Statistics reference online 2014. [Google Scholar]
- Ang, K.K.; Chin, Z.Y.; Zhang, H.; Guan, C. Filter Bank Common Spatial Pattern (FBCSP) in Brain-Computer Interface. In Proceedings of the 2008 IEEE International Joint Conference on Neural Networks (IEEE World Congress on Computational Intelligence); 2008; pp. 2390–2397. [Google Scholar] [CrossRef]
- Lawhern, V.J.; Solon, A.J.; Waytowich, N.R.; Gordon, S.M.; Hung, C.P.; Lance, B.J. EEGNet: a compact convolutional neural network for EEG-based brain–computer interfaces. Journal of Neural Engineering 2018, 15, 056013. [Google Scholar] [CrossRef]
- Tedeschi, R.; Giorgi, F.; Platano, D.; Berti, L. Classifying Low Back Pain Through Pain Mechanisms: A Scoping Review for Physiotherapy Practice. Journal of Clinical Medicine 2025, 14, 412. [Google Scholar] [CrossRef]
- Khayretdinova, M.; Zakharov, I.; Pshonkovskaya, P.; Adamovich, T.; Kiryasov, A.; Zhdanov, A.; Shovkun, A. Prediction of brain sex from EEG: using large-scale heterogeneous dataset for developing a highly accurate and interpretable ML model. NeuroImage 2024, 285, 120495. [Google Scholar]
- Elsayed, M.; Sim, K.S.; Tan, S.C. A Novel Approach to Objectively Quantify the Subjective Perception of Pain Through Electroencephalogram Signal Analysis. IEEE Access 2020, 8, 199920–199930. [Google Scholar] [CrossRef]
- Girard-Tremblay, L.; Auclair, V.; Daigle, K.; Léonard, G.; Whittingstall, K.; Goffaux, P. Sex Differences in the Neural Representation of Pain Unpleasantness. The Journal of Pain 2014, 15, 867–877. [Google Scholar] [CrossRef]
- Teel, E.F.; Ocay, D.D.; Blain-Moraes, S.; Ferland, C.E. Accurate classification of pain experiences using wearable electroencephalography in adolescents with and without chronic musculoskeletal pain. Frontiers in Pain Research 2022, 3, 991793. [Google Scholar]
- Cascella, M.; Leoni, M.L.; Shariff, M.N.; Varrassi, G. Artificial Intelligence-Driven Diagnostic Processes and Comprehensive Multimodal Models in Pain Medicine. Journal of Personalized Medicine 2024, 14, 983. [Google Scholar]
- Badura, A.; Bienkowska, M.; Mysliwiec, A.; Pietka, E. Continuous short-term pain assessment in temporomandibular joint therapy using LSTM models supported by heat-induced pain data patterns. IEEE Transactions on Neural Systems and Rehabilitation Engineering 2024. [Google Scholar]
Figure 1.
Brain Mediators of Pain EEG Montage. The topoplot illustrates the sensor positions in a 10–20 placement EEG electrode system, containing 65 channels. Besides, it highlights in color the main parts of the brain ( Frontal left, Frontal, Frontal right, Central right, Posterior right, Posterior, Posterior left, Central left).
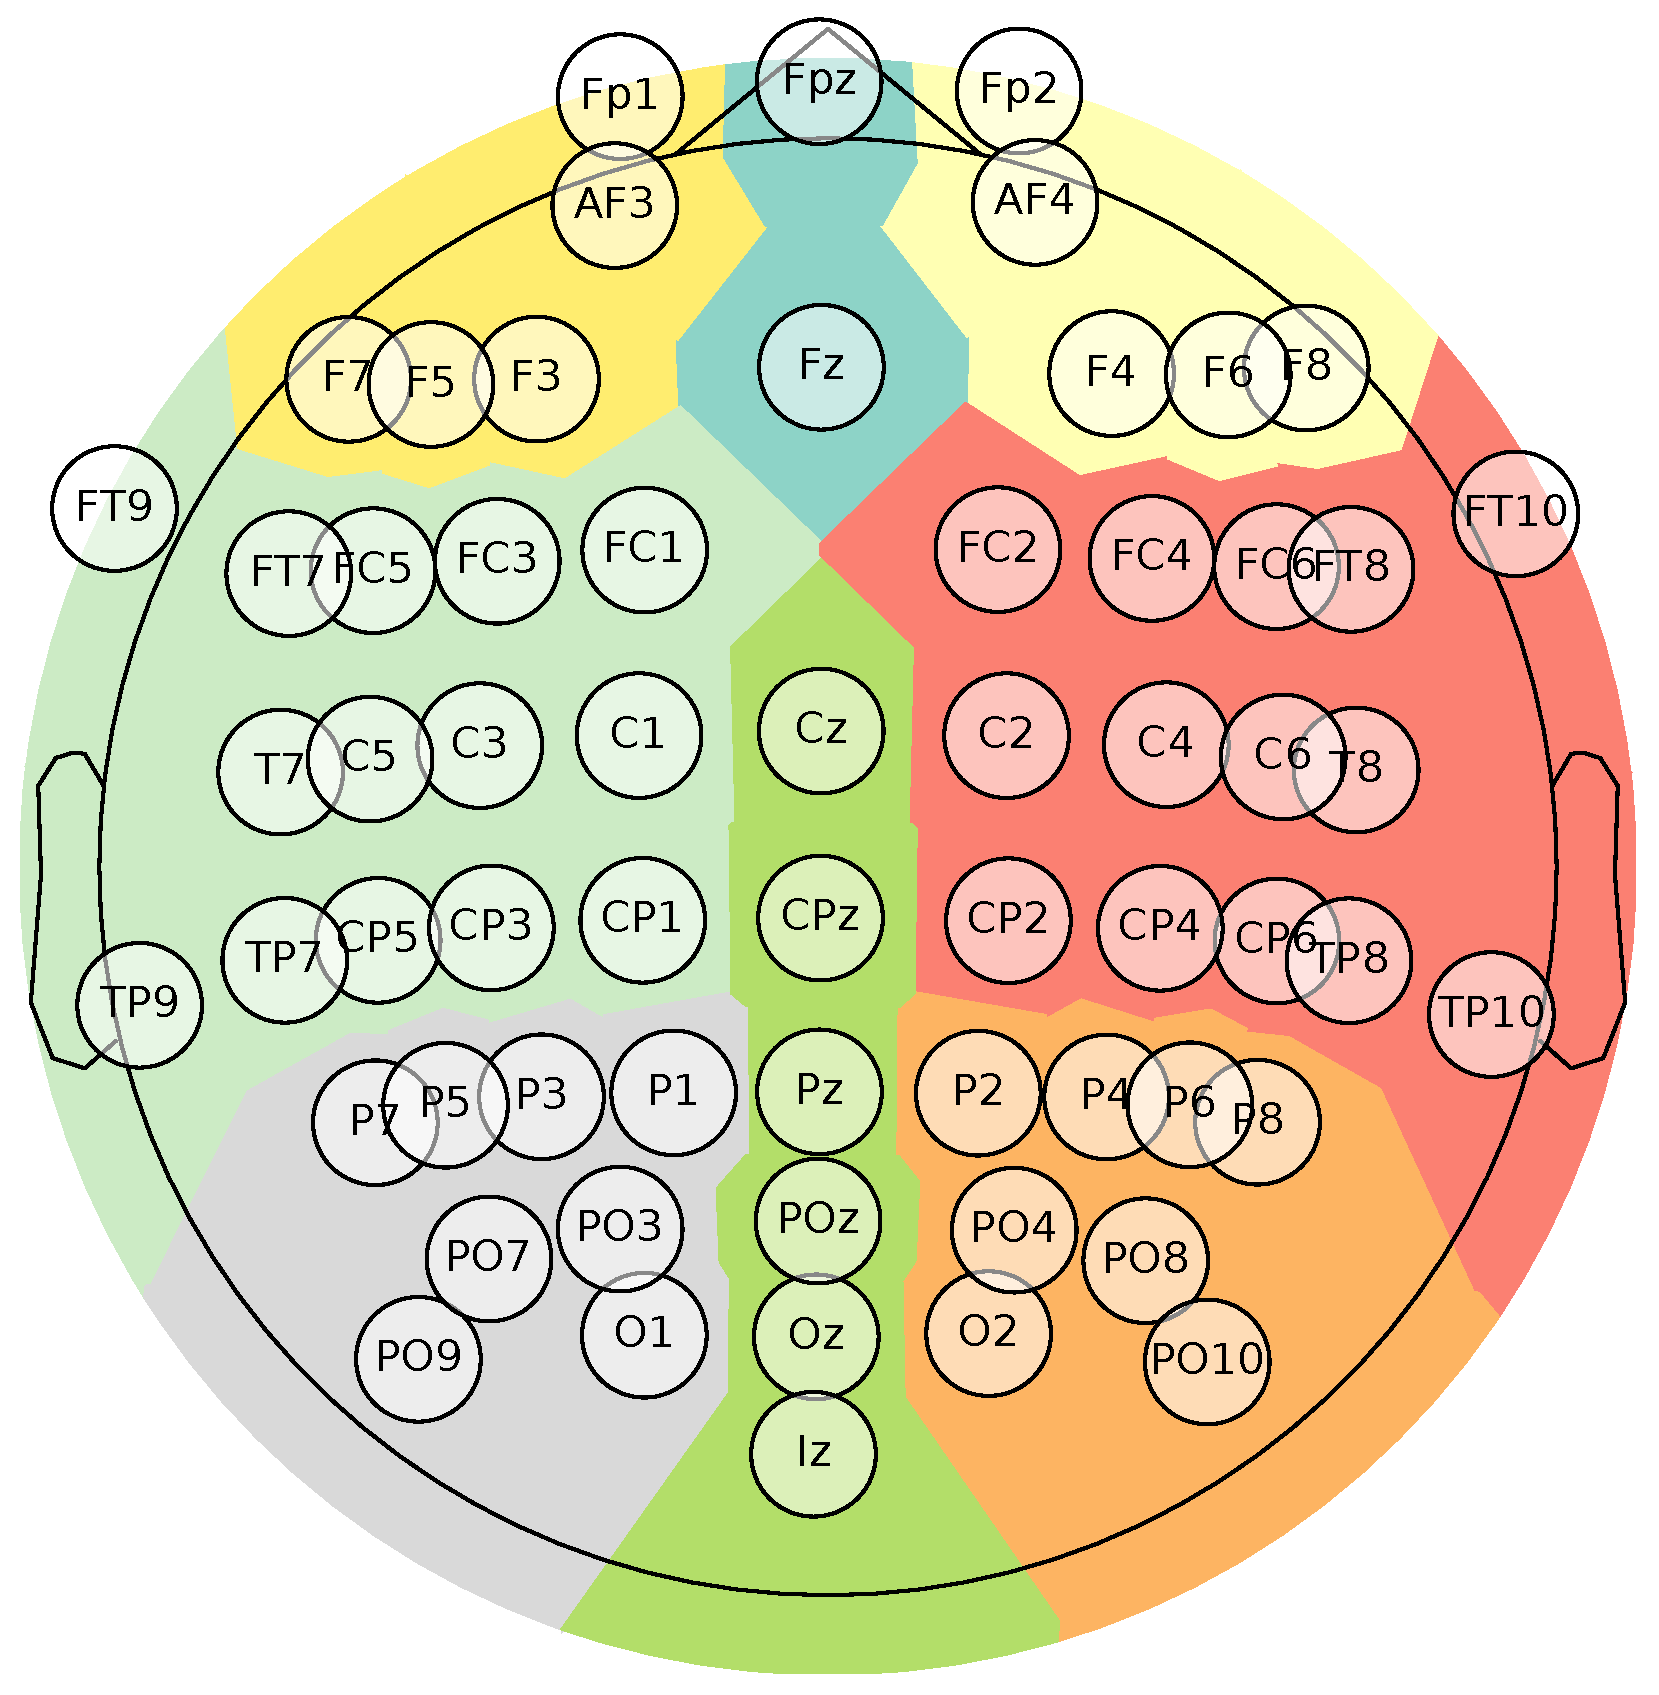
Figure 2.
Brain Mediators of Pain database experimental paradigms sketch.
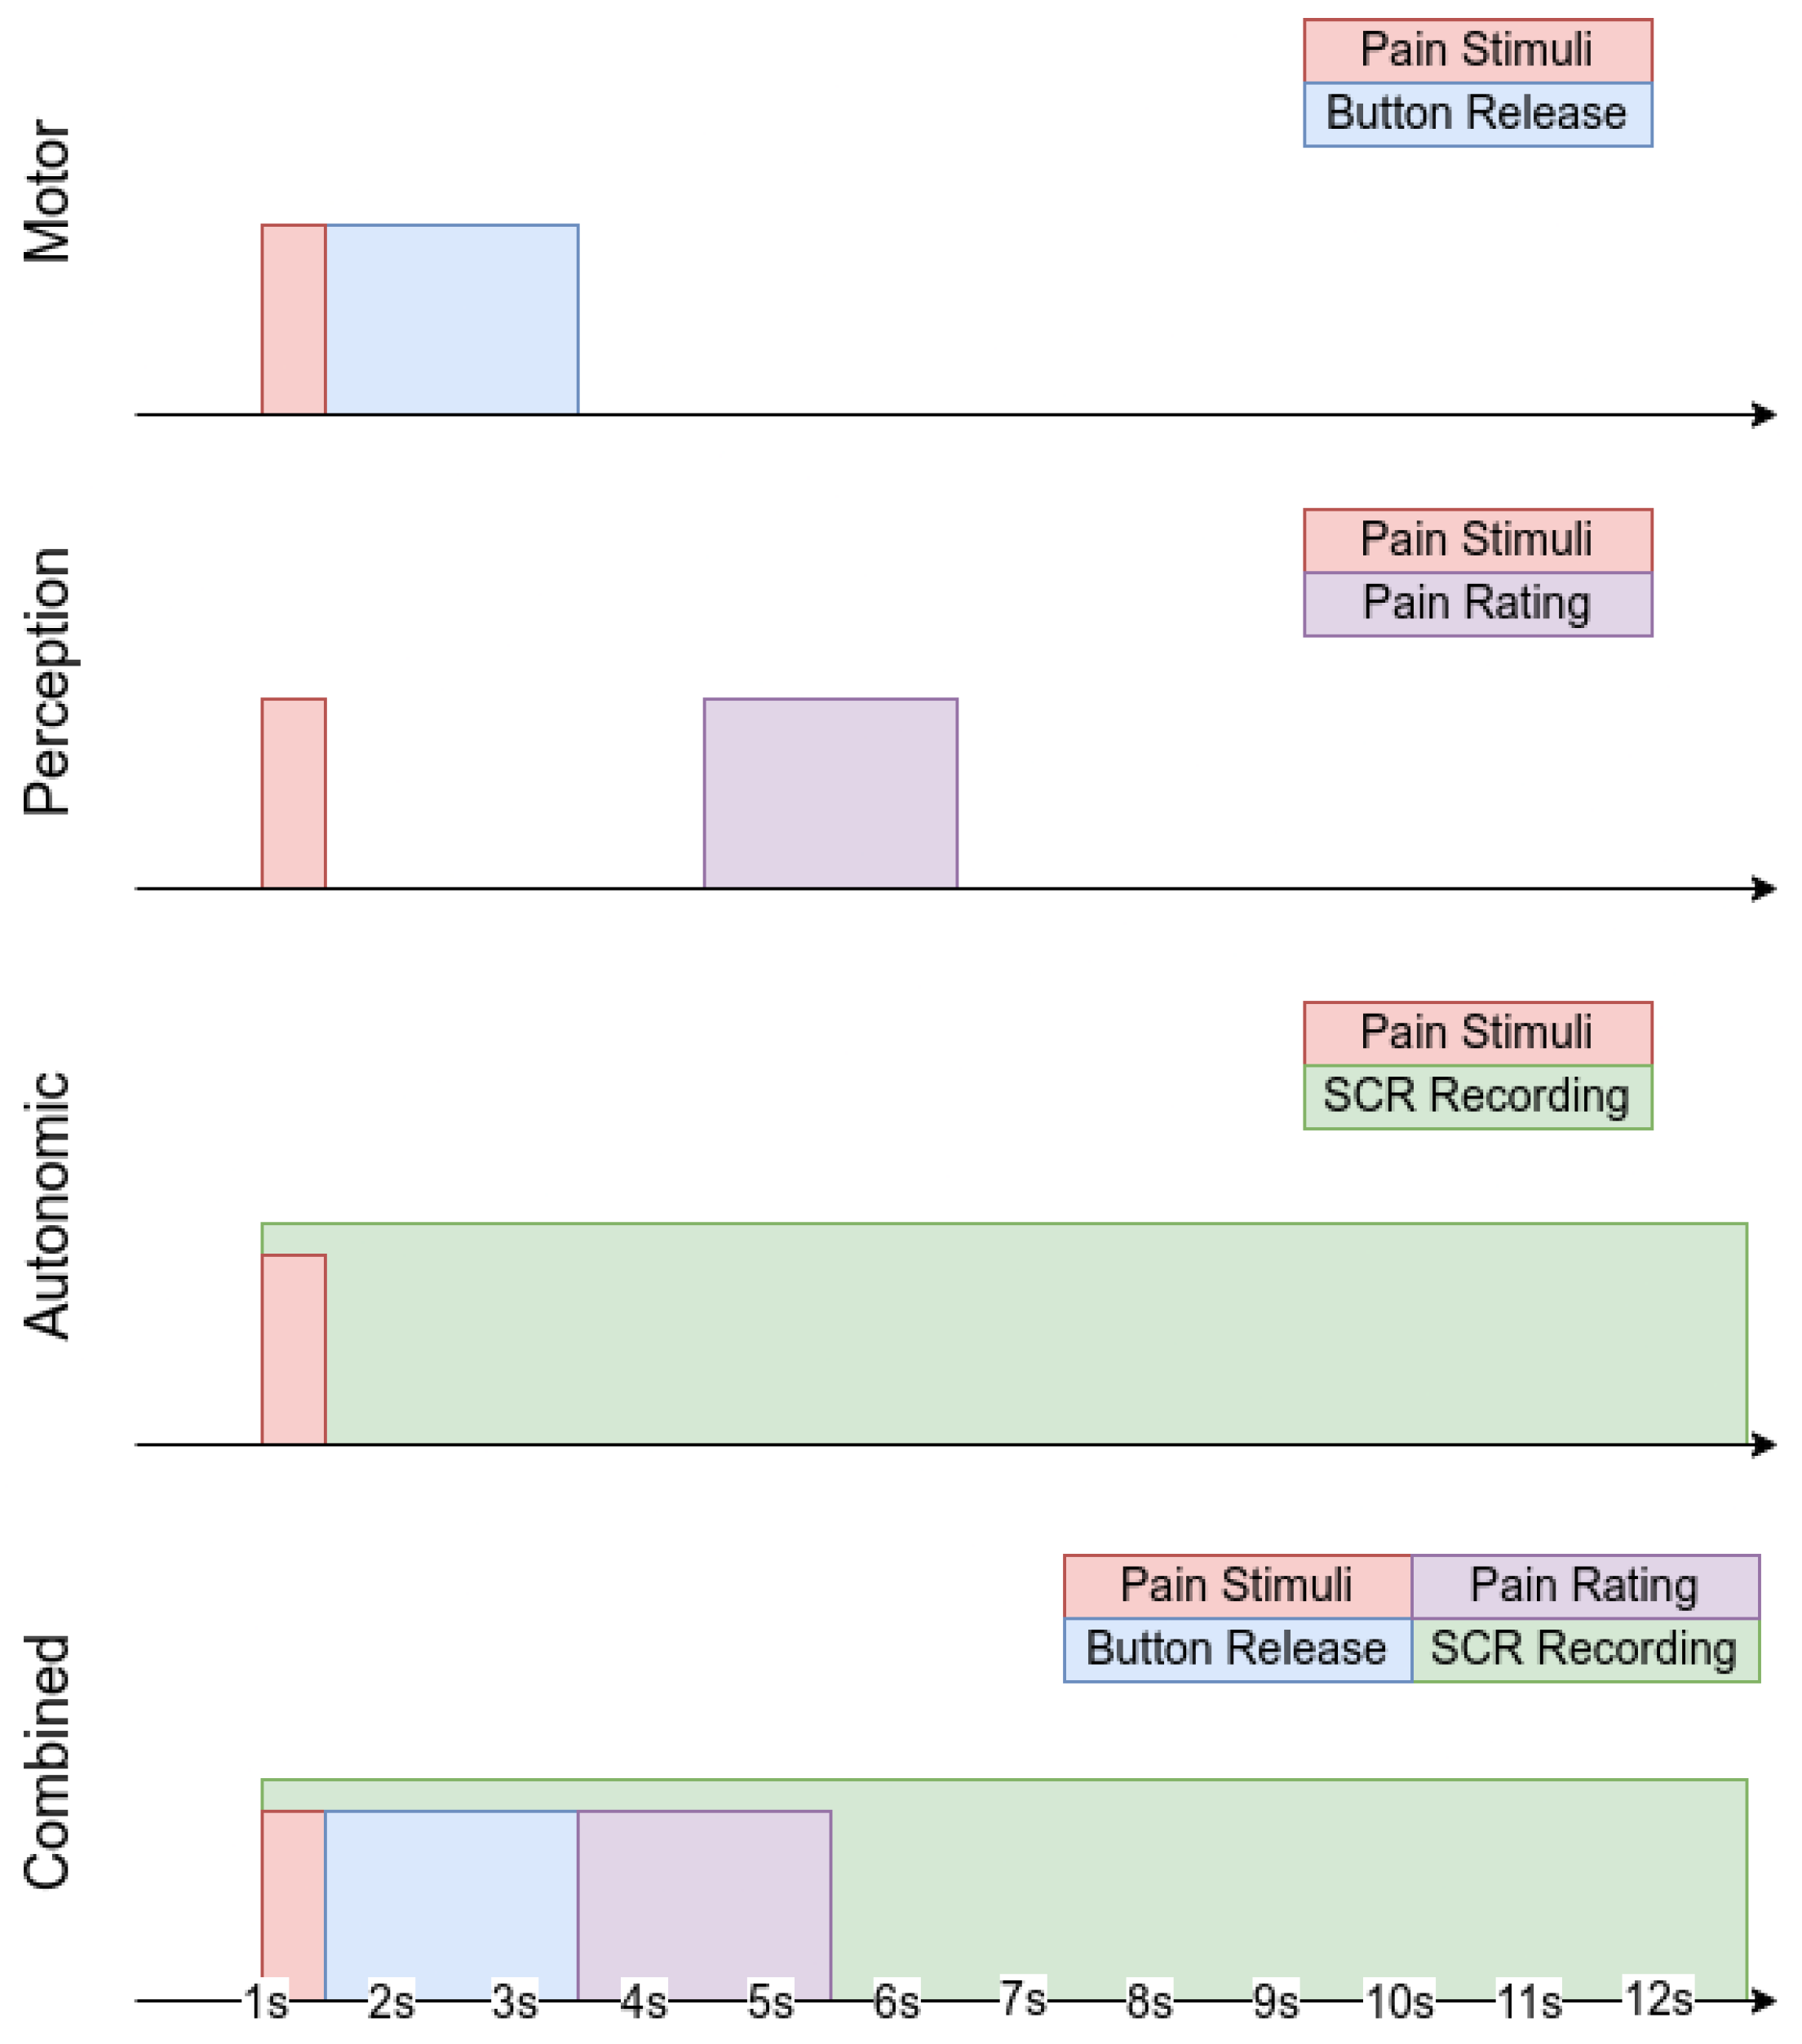
Figure 3.
Kernel Cross-Spectral Functional Connectivity Network-(KCS-FCNet) pipeline for EEG-based pain detection. Our proposal aims to support non-verbal patient pain detection through brain activity analysis (no-pain vs. high-pain).
Figure 3.
Kernel Cross-Spectral Functional Connectivity Network-(KCS-FCNet) pipeline for EEG-based pain detection. Our proposal aims to support non-verbal patient pain detection through brain activity analysis (no-pain vs. high-pain).
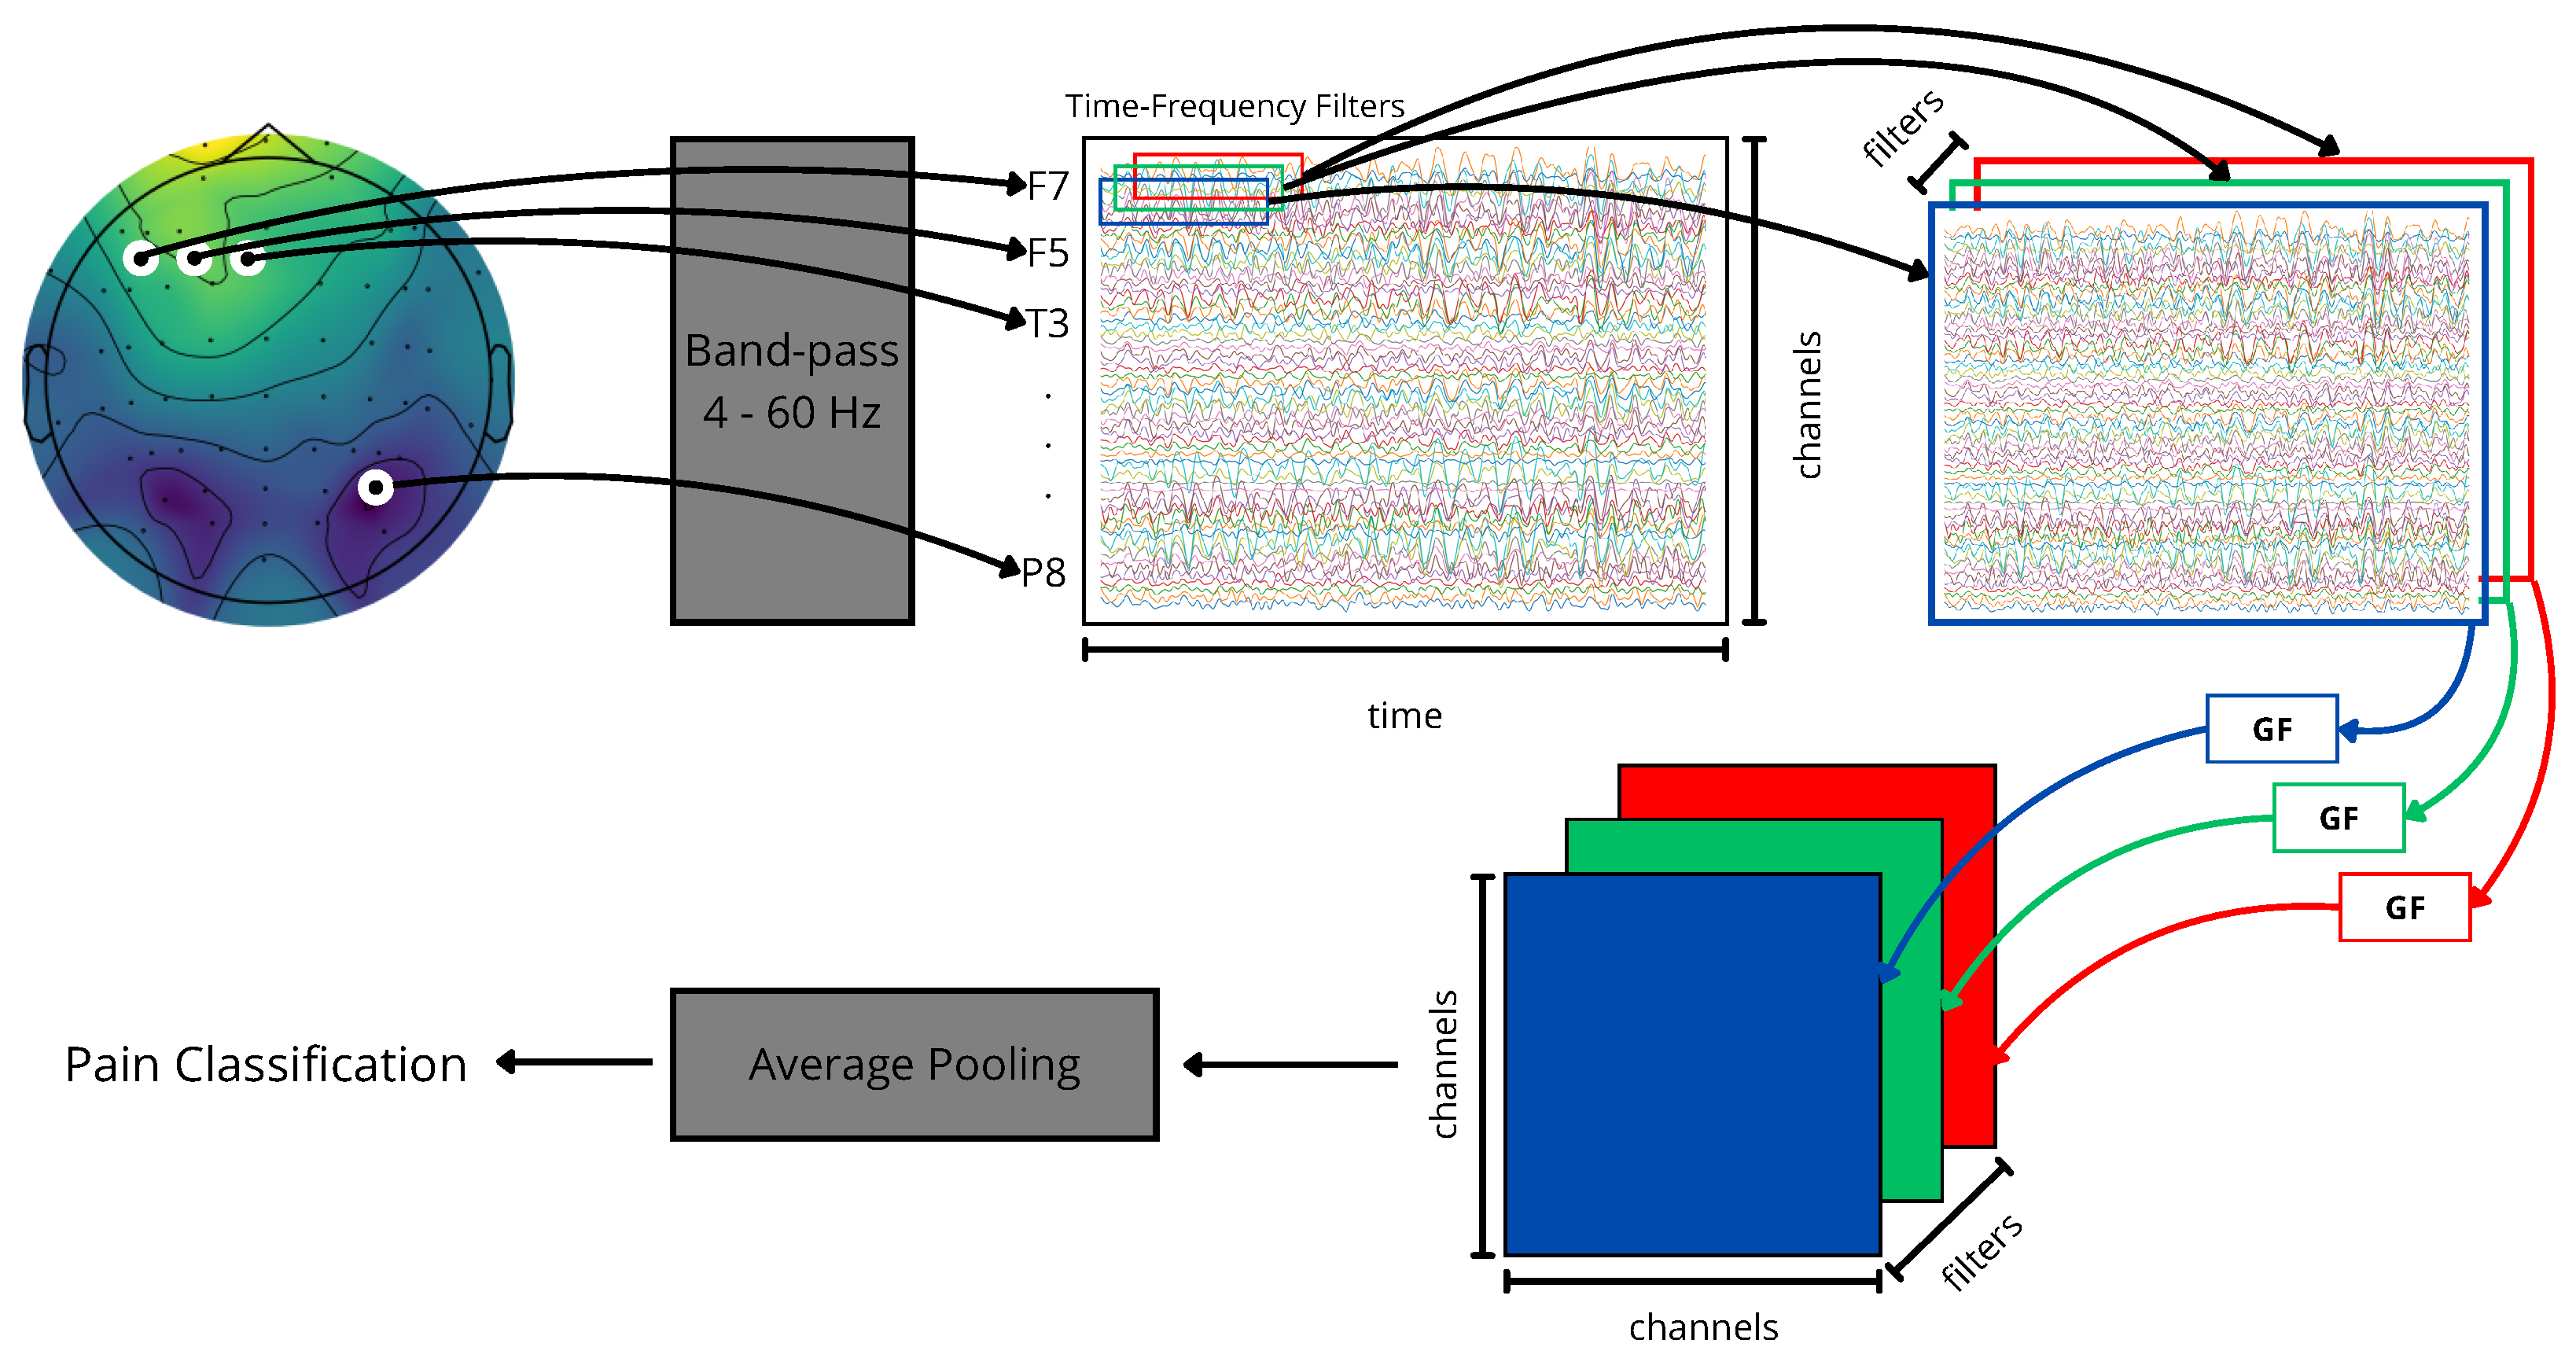
Figure 4.
Cross-Subject Pain Detection Analysis based on KCS-FCNet detection.
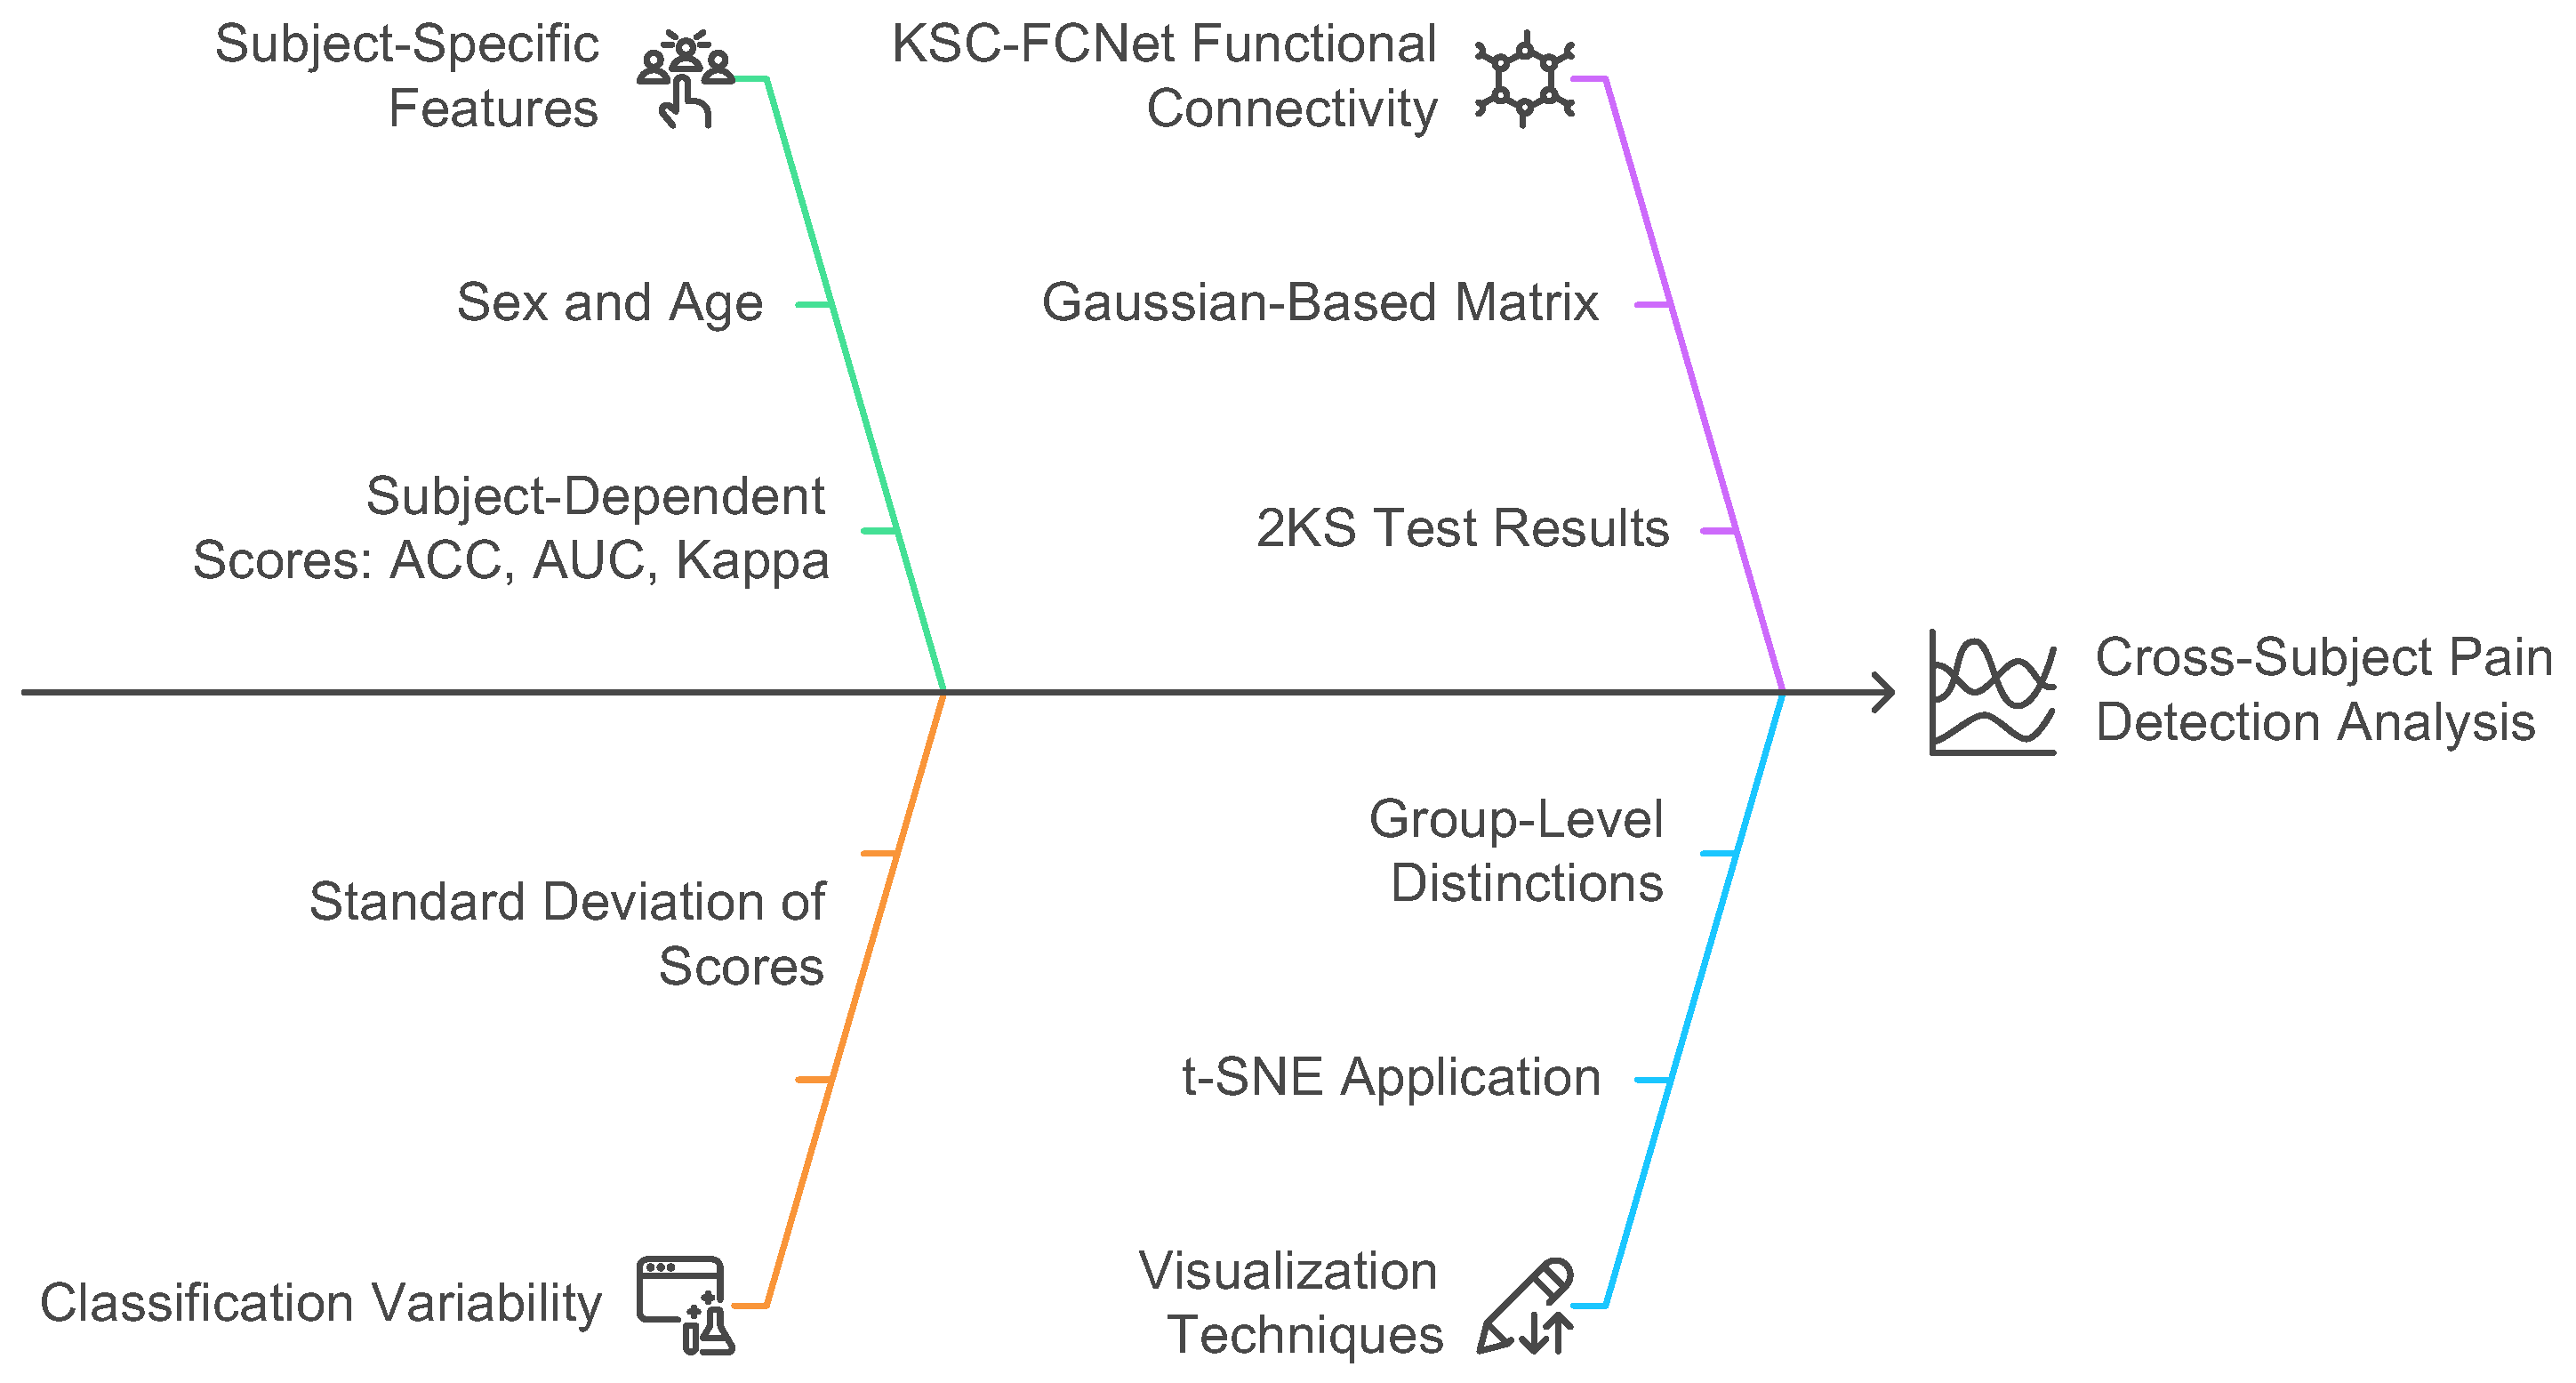
Figure 5.
Proposed pipeline for subject-dependent and cross-subject pain detection testing.
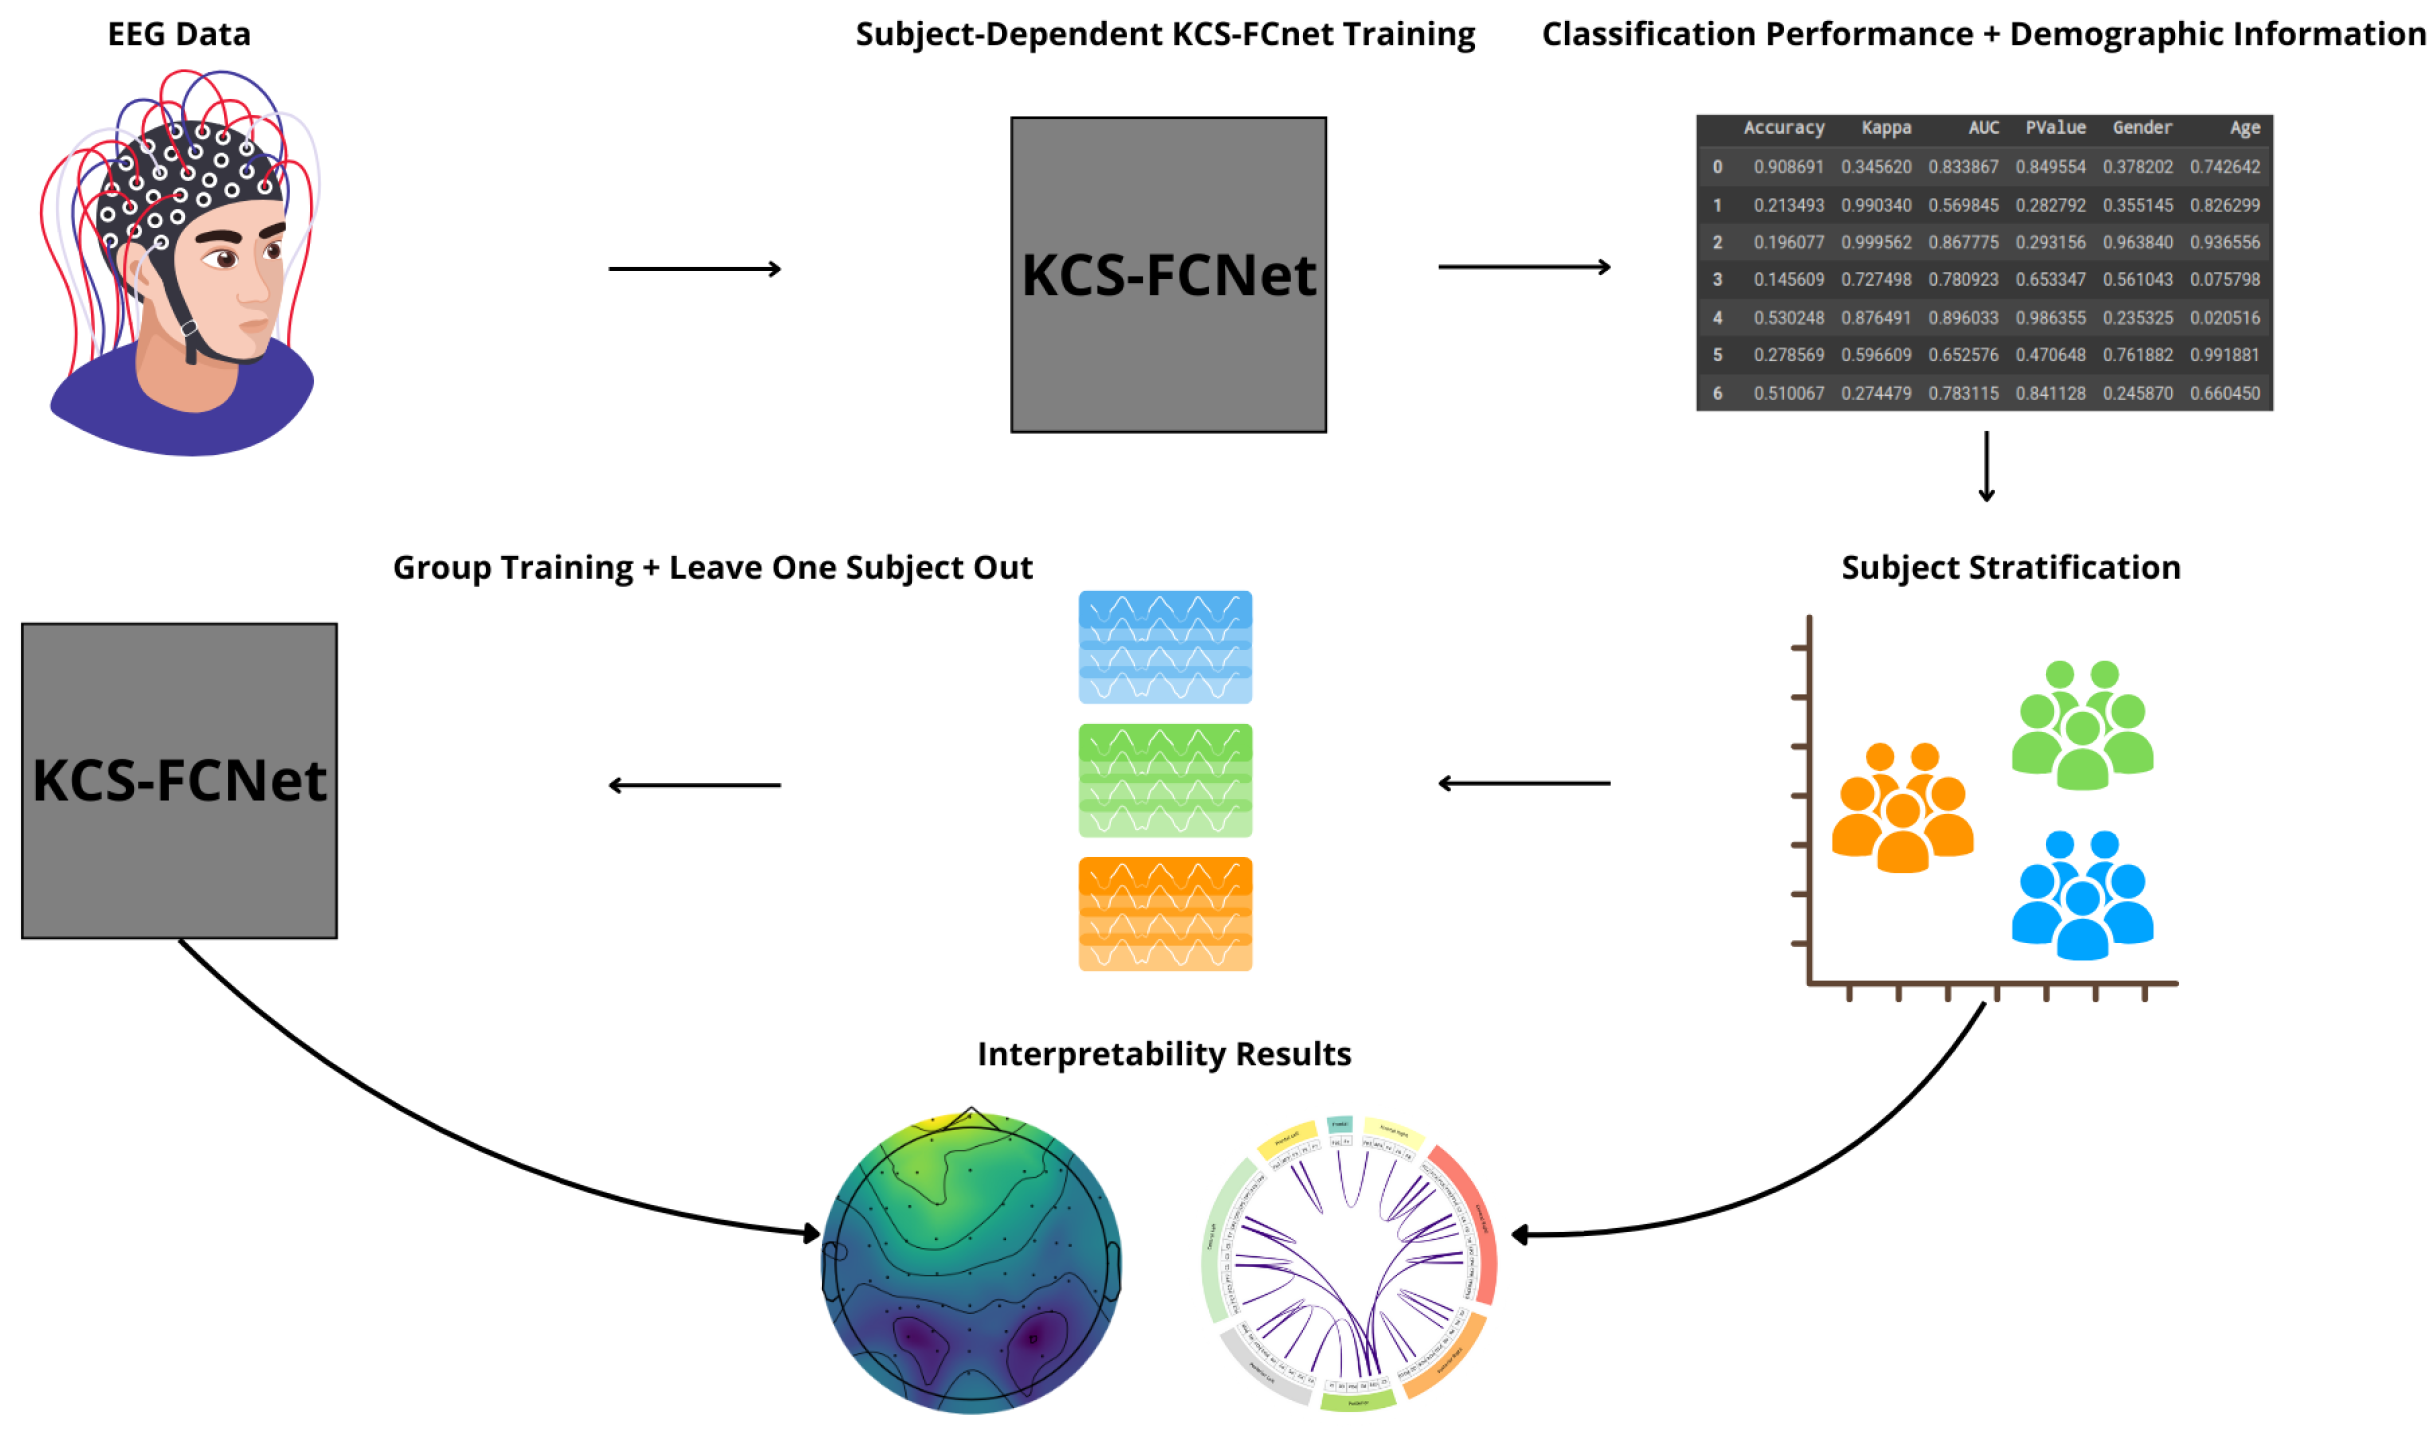
Figure 6.
Subject-dependent pain detection results. An accuracy comparison between FBCSP, EEGNet, and KCS-FCNet (ours) is presented. Subjects are sorted regarding the KCS-FCNet performance.
Figure 6.
Subject-dependent pain detection results. An accuracy comparison between FBCSP, EEGNet, and KCS-FCNet (ours) is presented. Subjects are sorted regarding the KCS-FCNet performance.
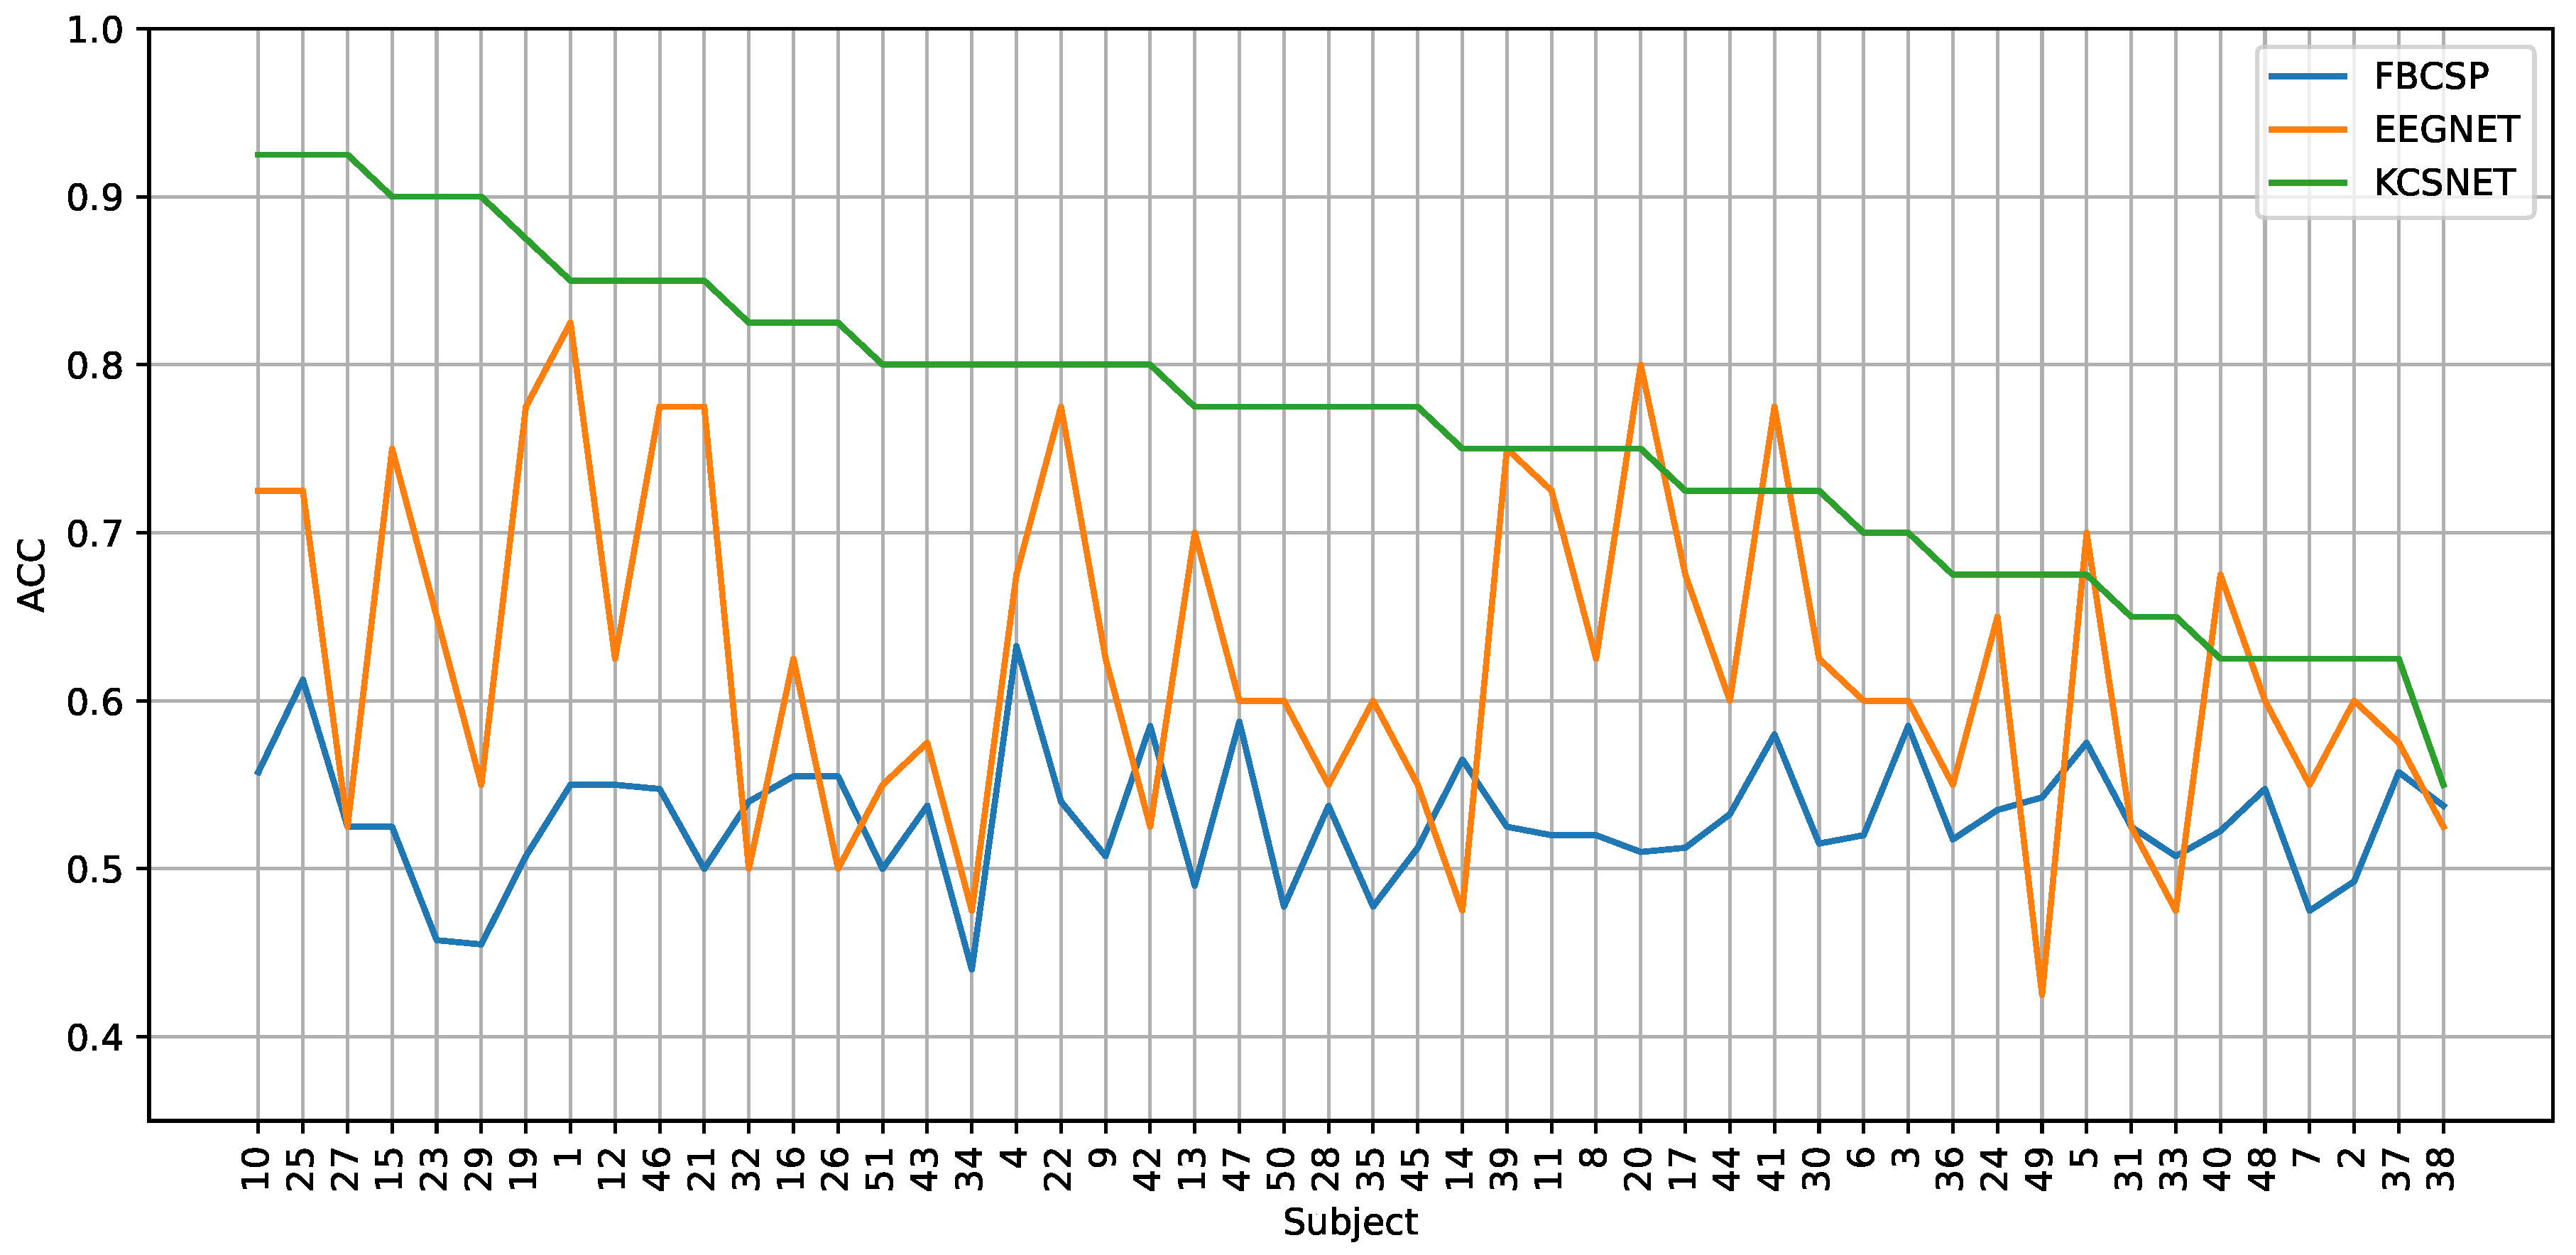
Figure 7.
2D t-SNE projection visualizing cross-subject relationships. Subject-dependent performance (ACC, AUC, and Kappa) for FBSCP, EEGNet, and KCS-FCNet. Also, KCS-FCNet functional connectivity patterns, sex, and age features are used for subject stratification. Points within the blue region represent women, while those within the orange regions represent men. The sizes correspond to the subjects’ ages, and the color point stands for subject-dependent pain detection ACC.
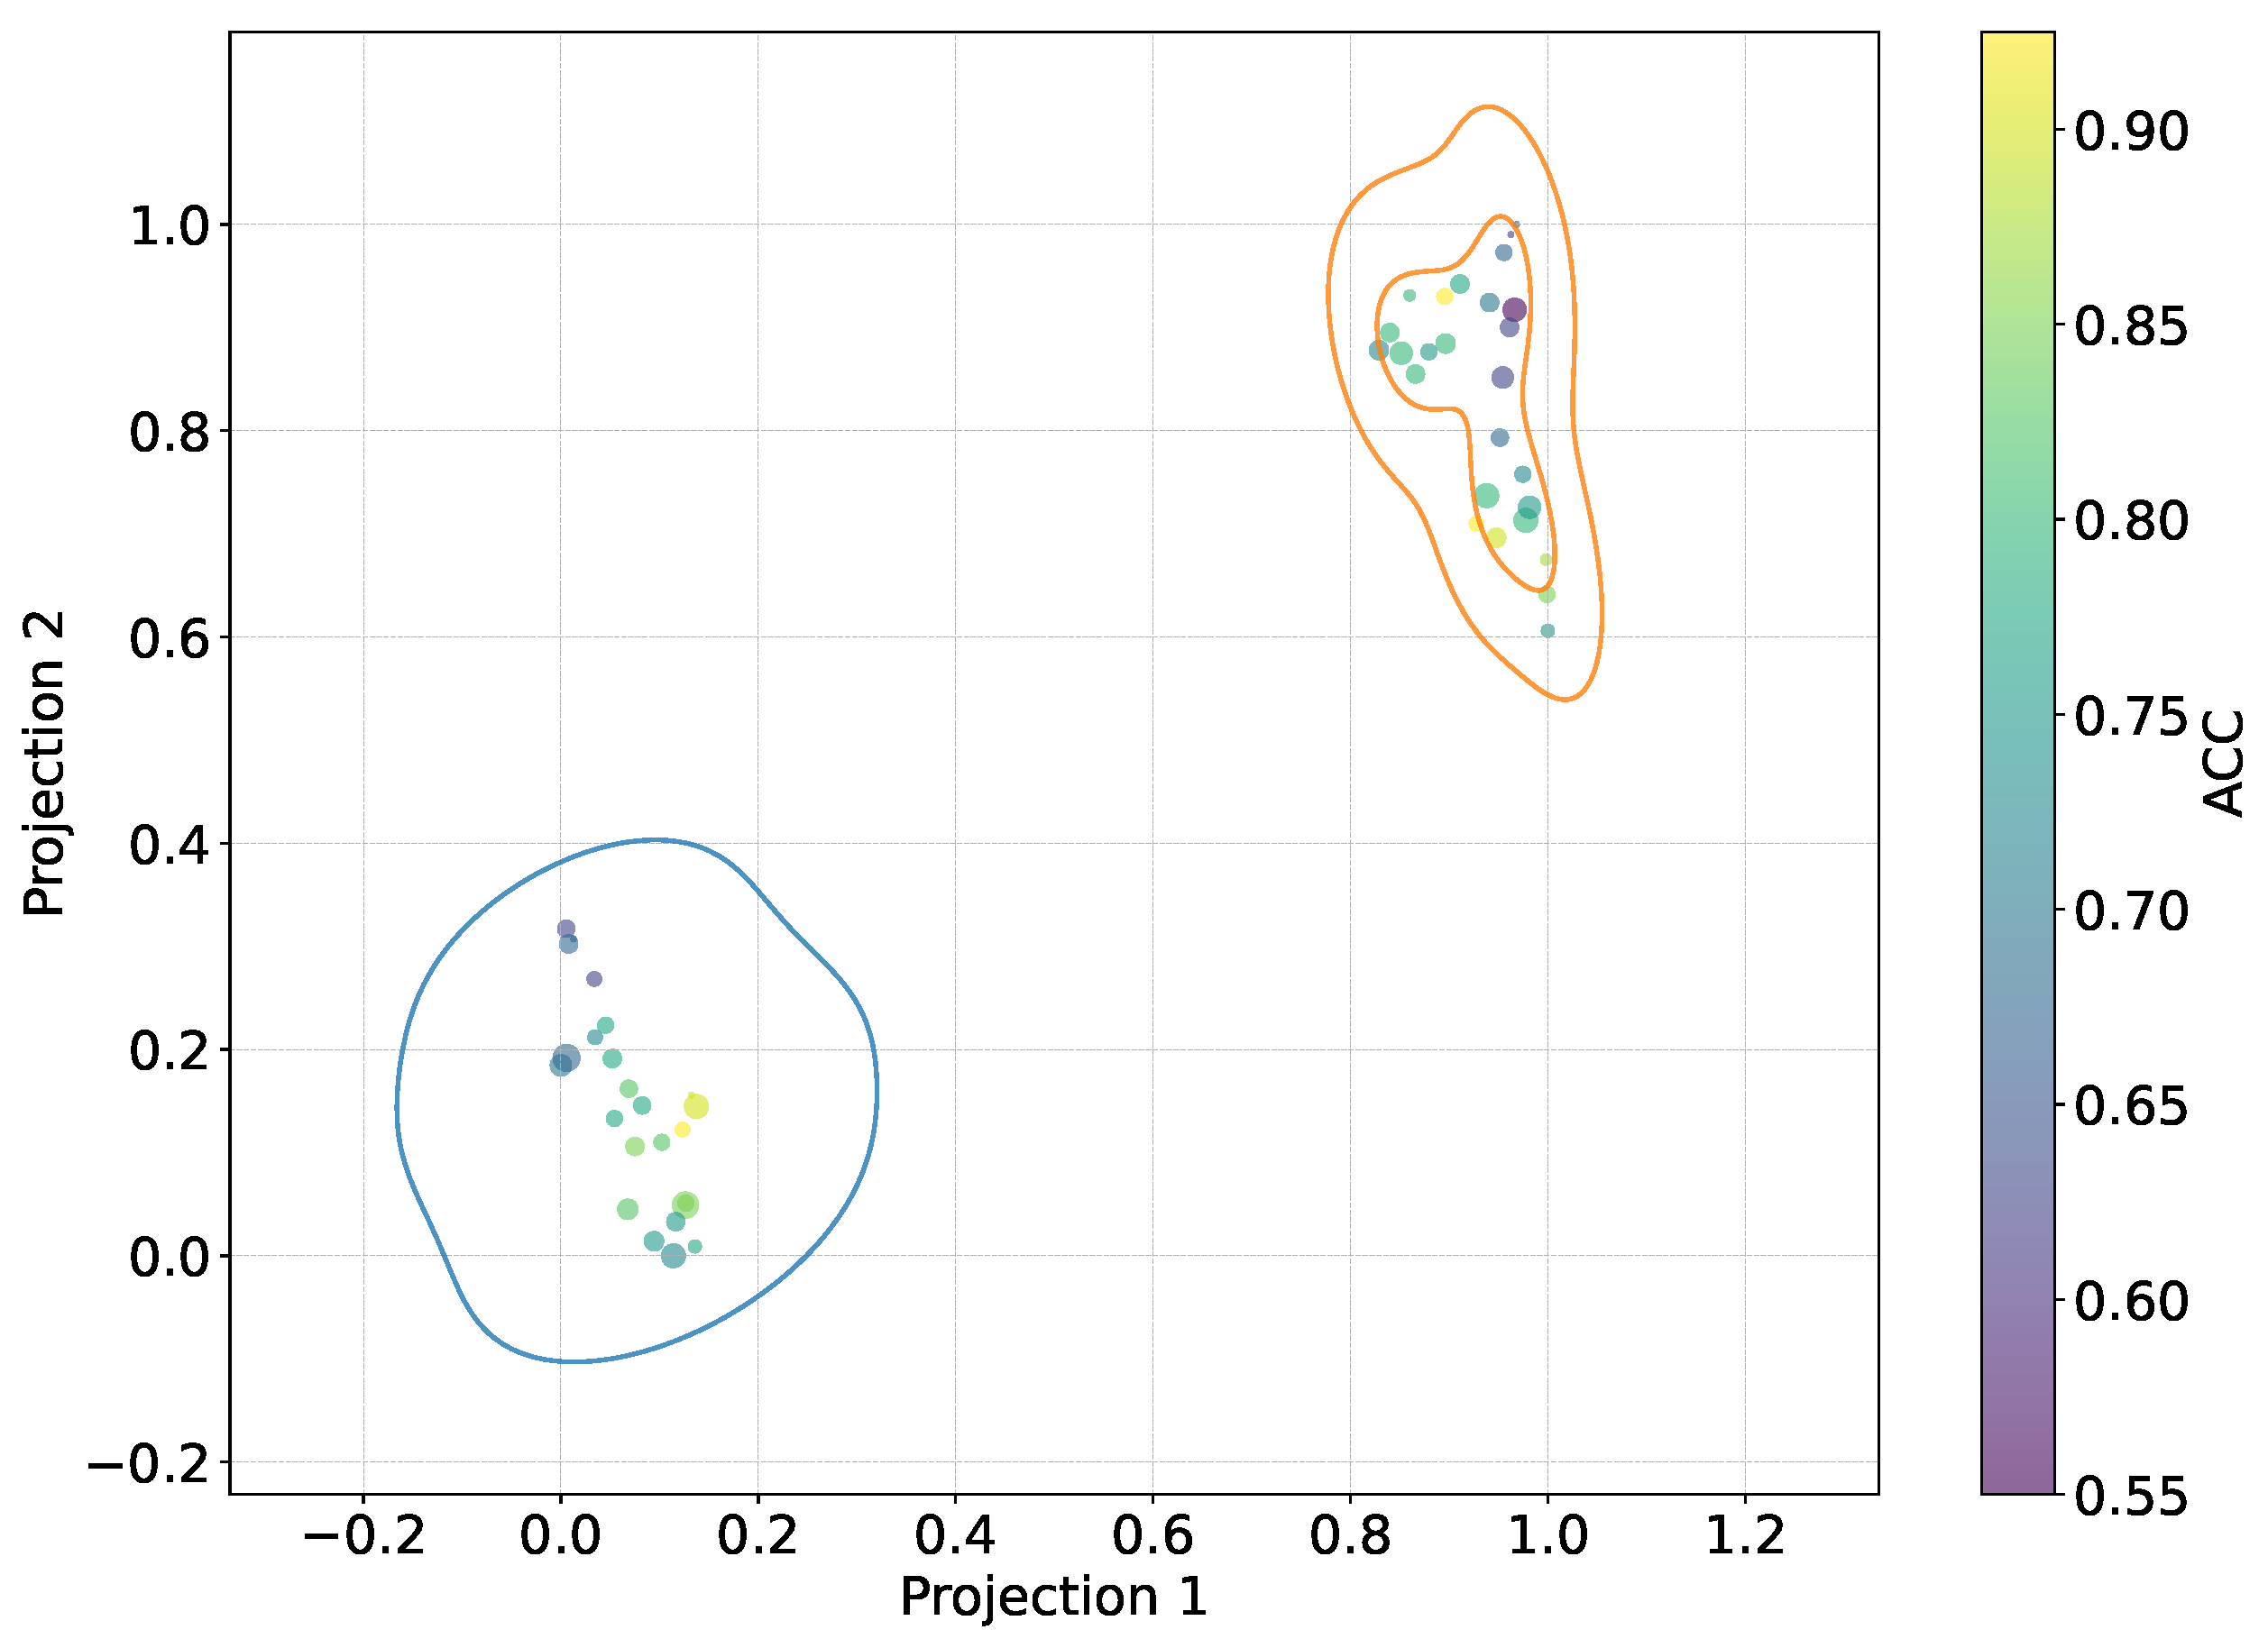
Figure 8.
2D t-SNE projection visualizing cross-subject relationships regarding the KCS-FCNet estimated connectivity. Pruned functional connectivity matrices based on the 2KS are shown (see Section 2.4). The color bar depicts the p-value of every connection for each subject matrix, where deep blue means more class separability. Therefore, the bluer the matrix, the better the discriminability. Outer boxes indicate subject gender: orange for male and blue for female.
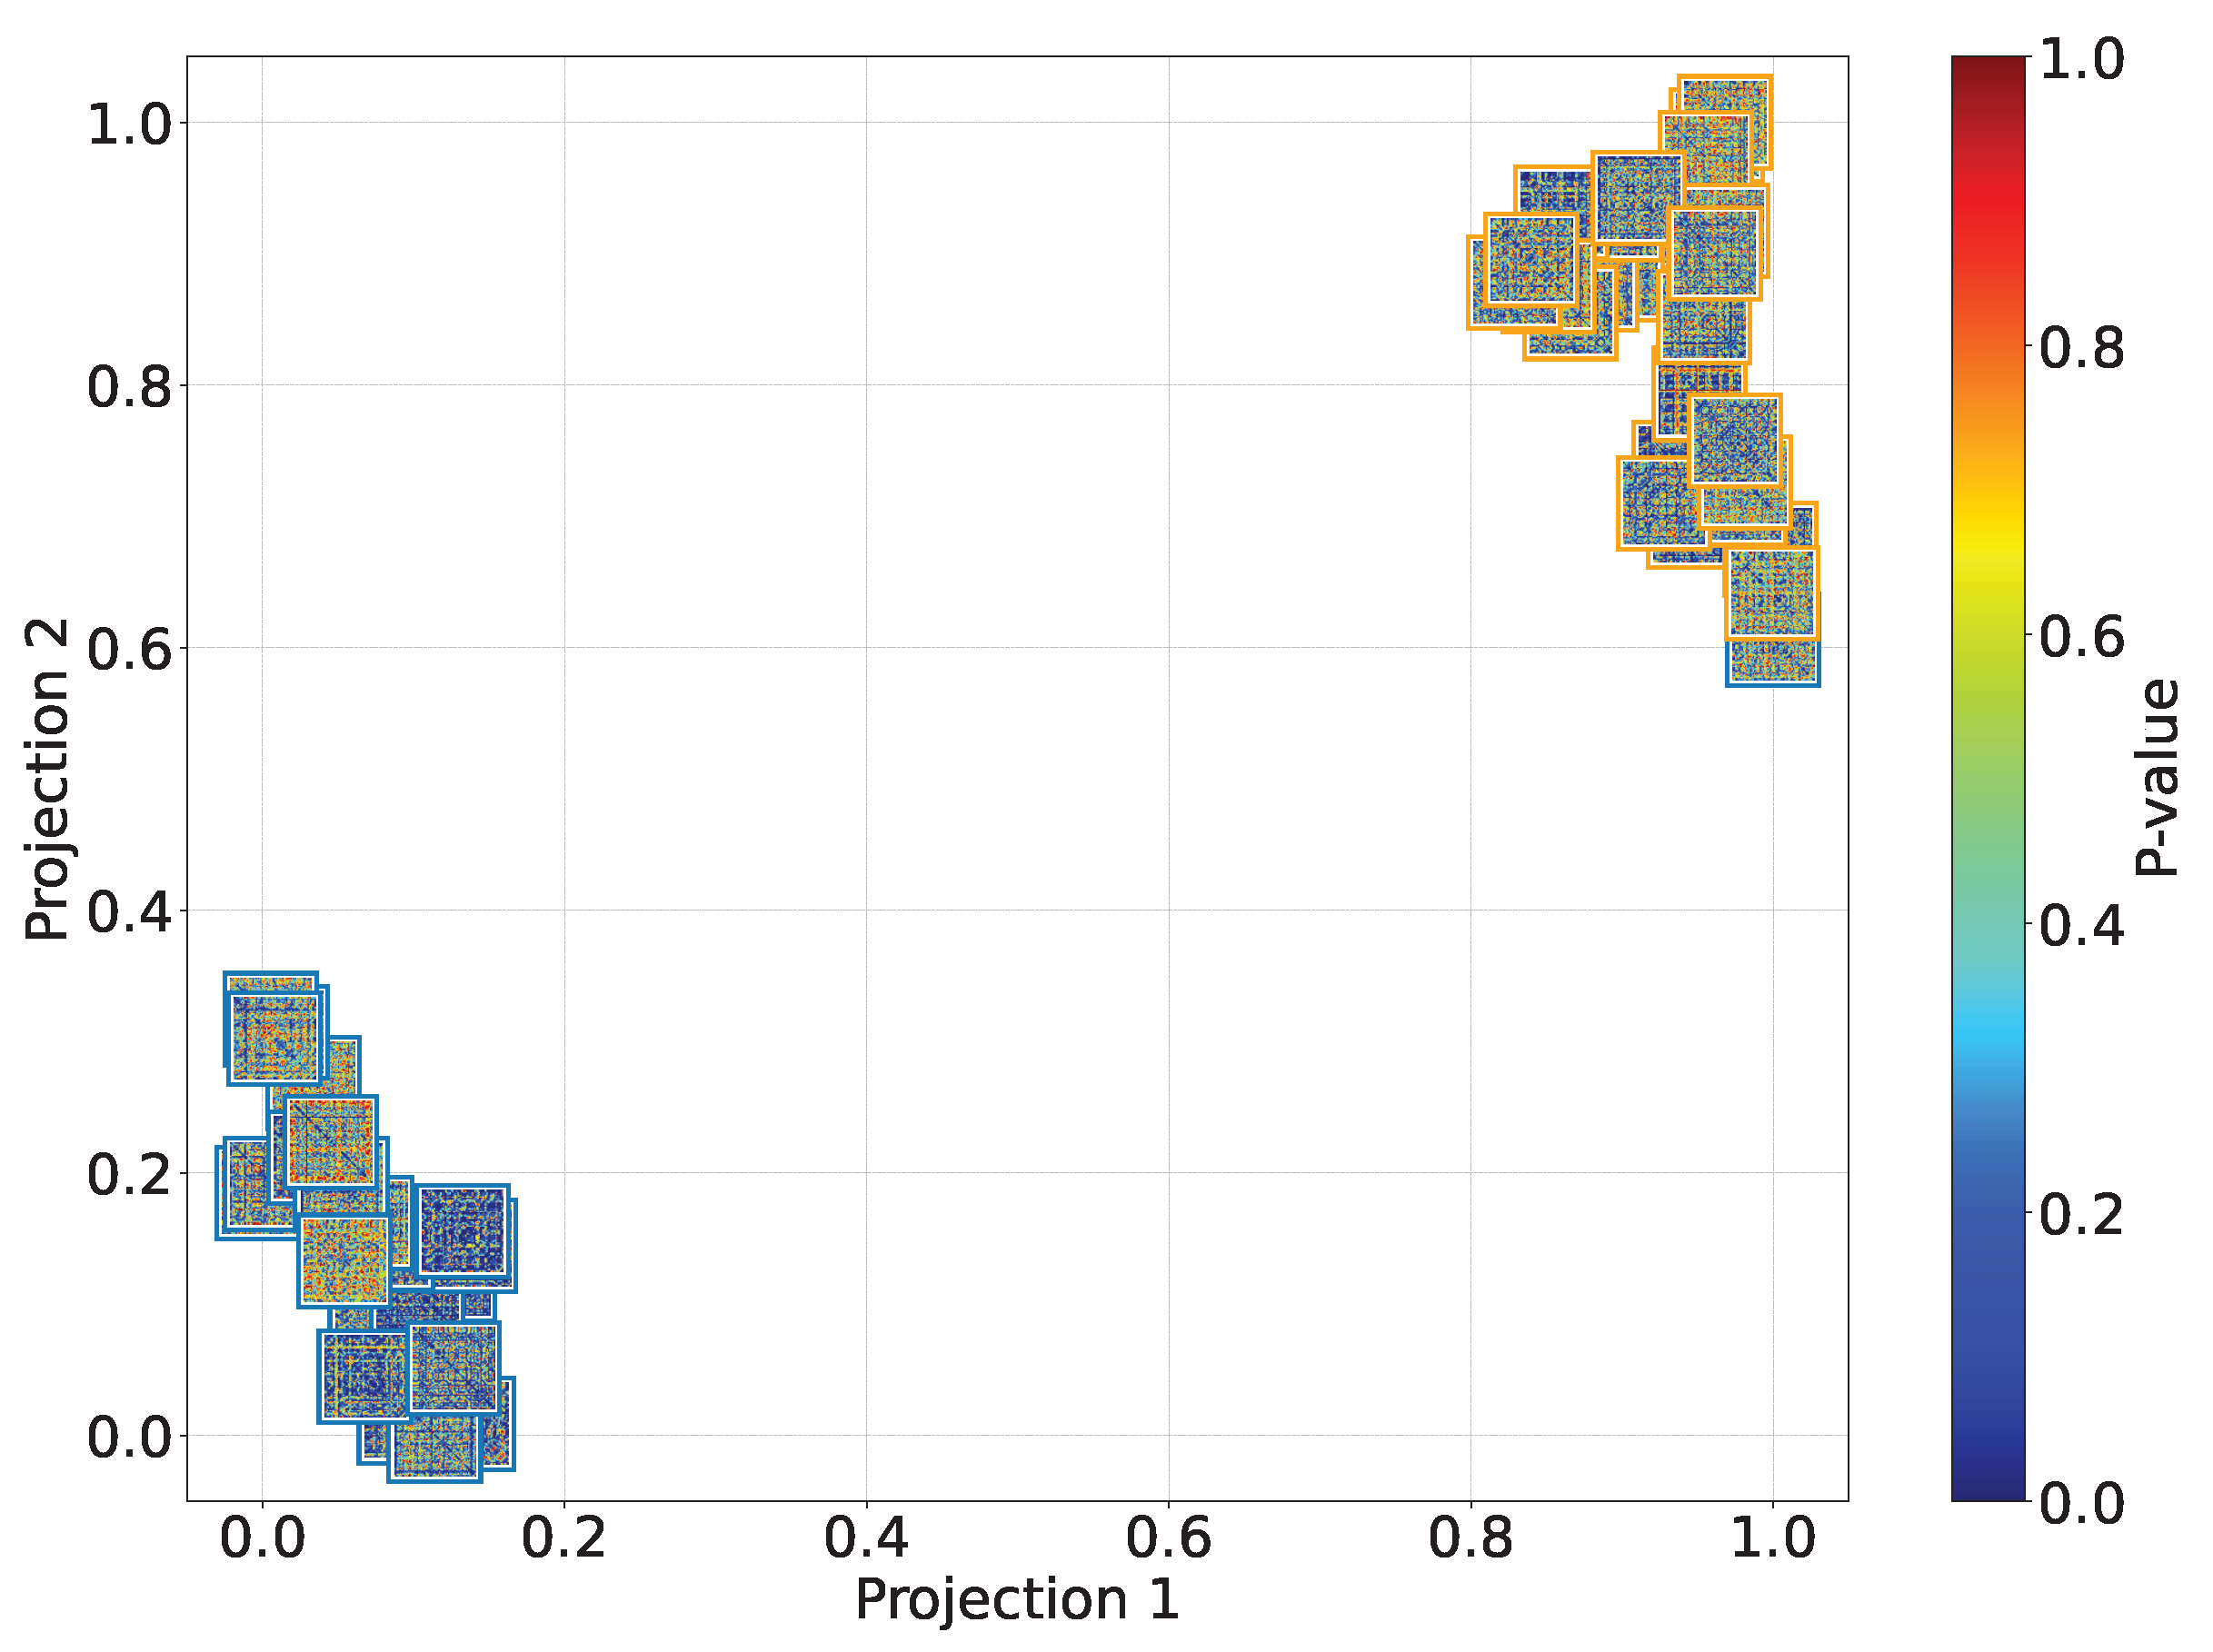
Figure 9.
Males’ group accuracy comparison within the subject-dependent and cross-subject pain detection experiments.
Figure 9.
Males’ group accuracy comparison within the subject-dependent and cross-subject pain detection experiments.
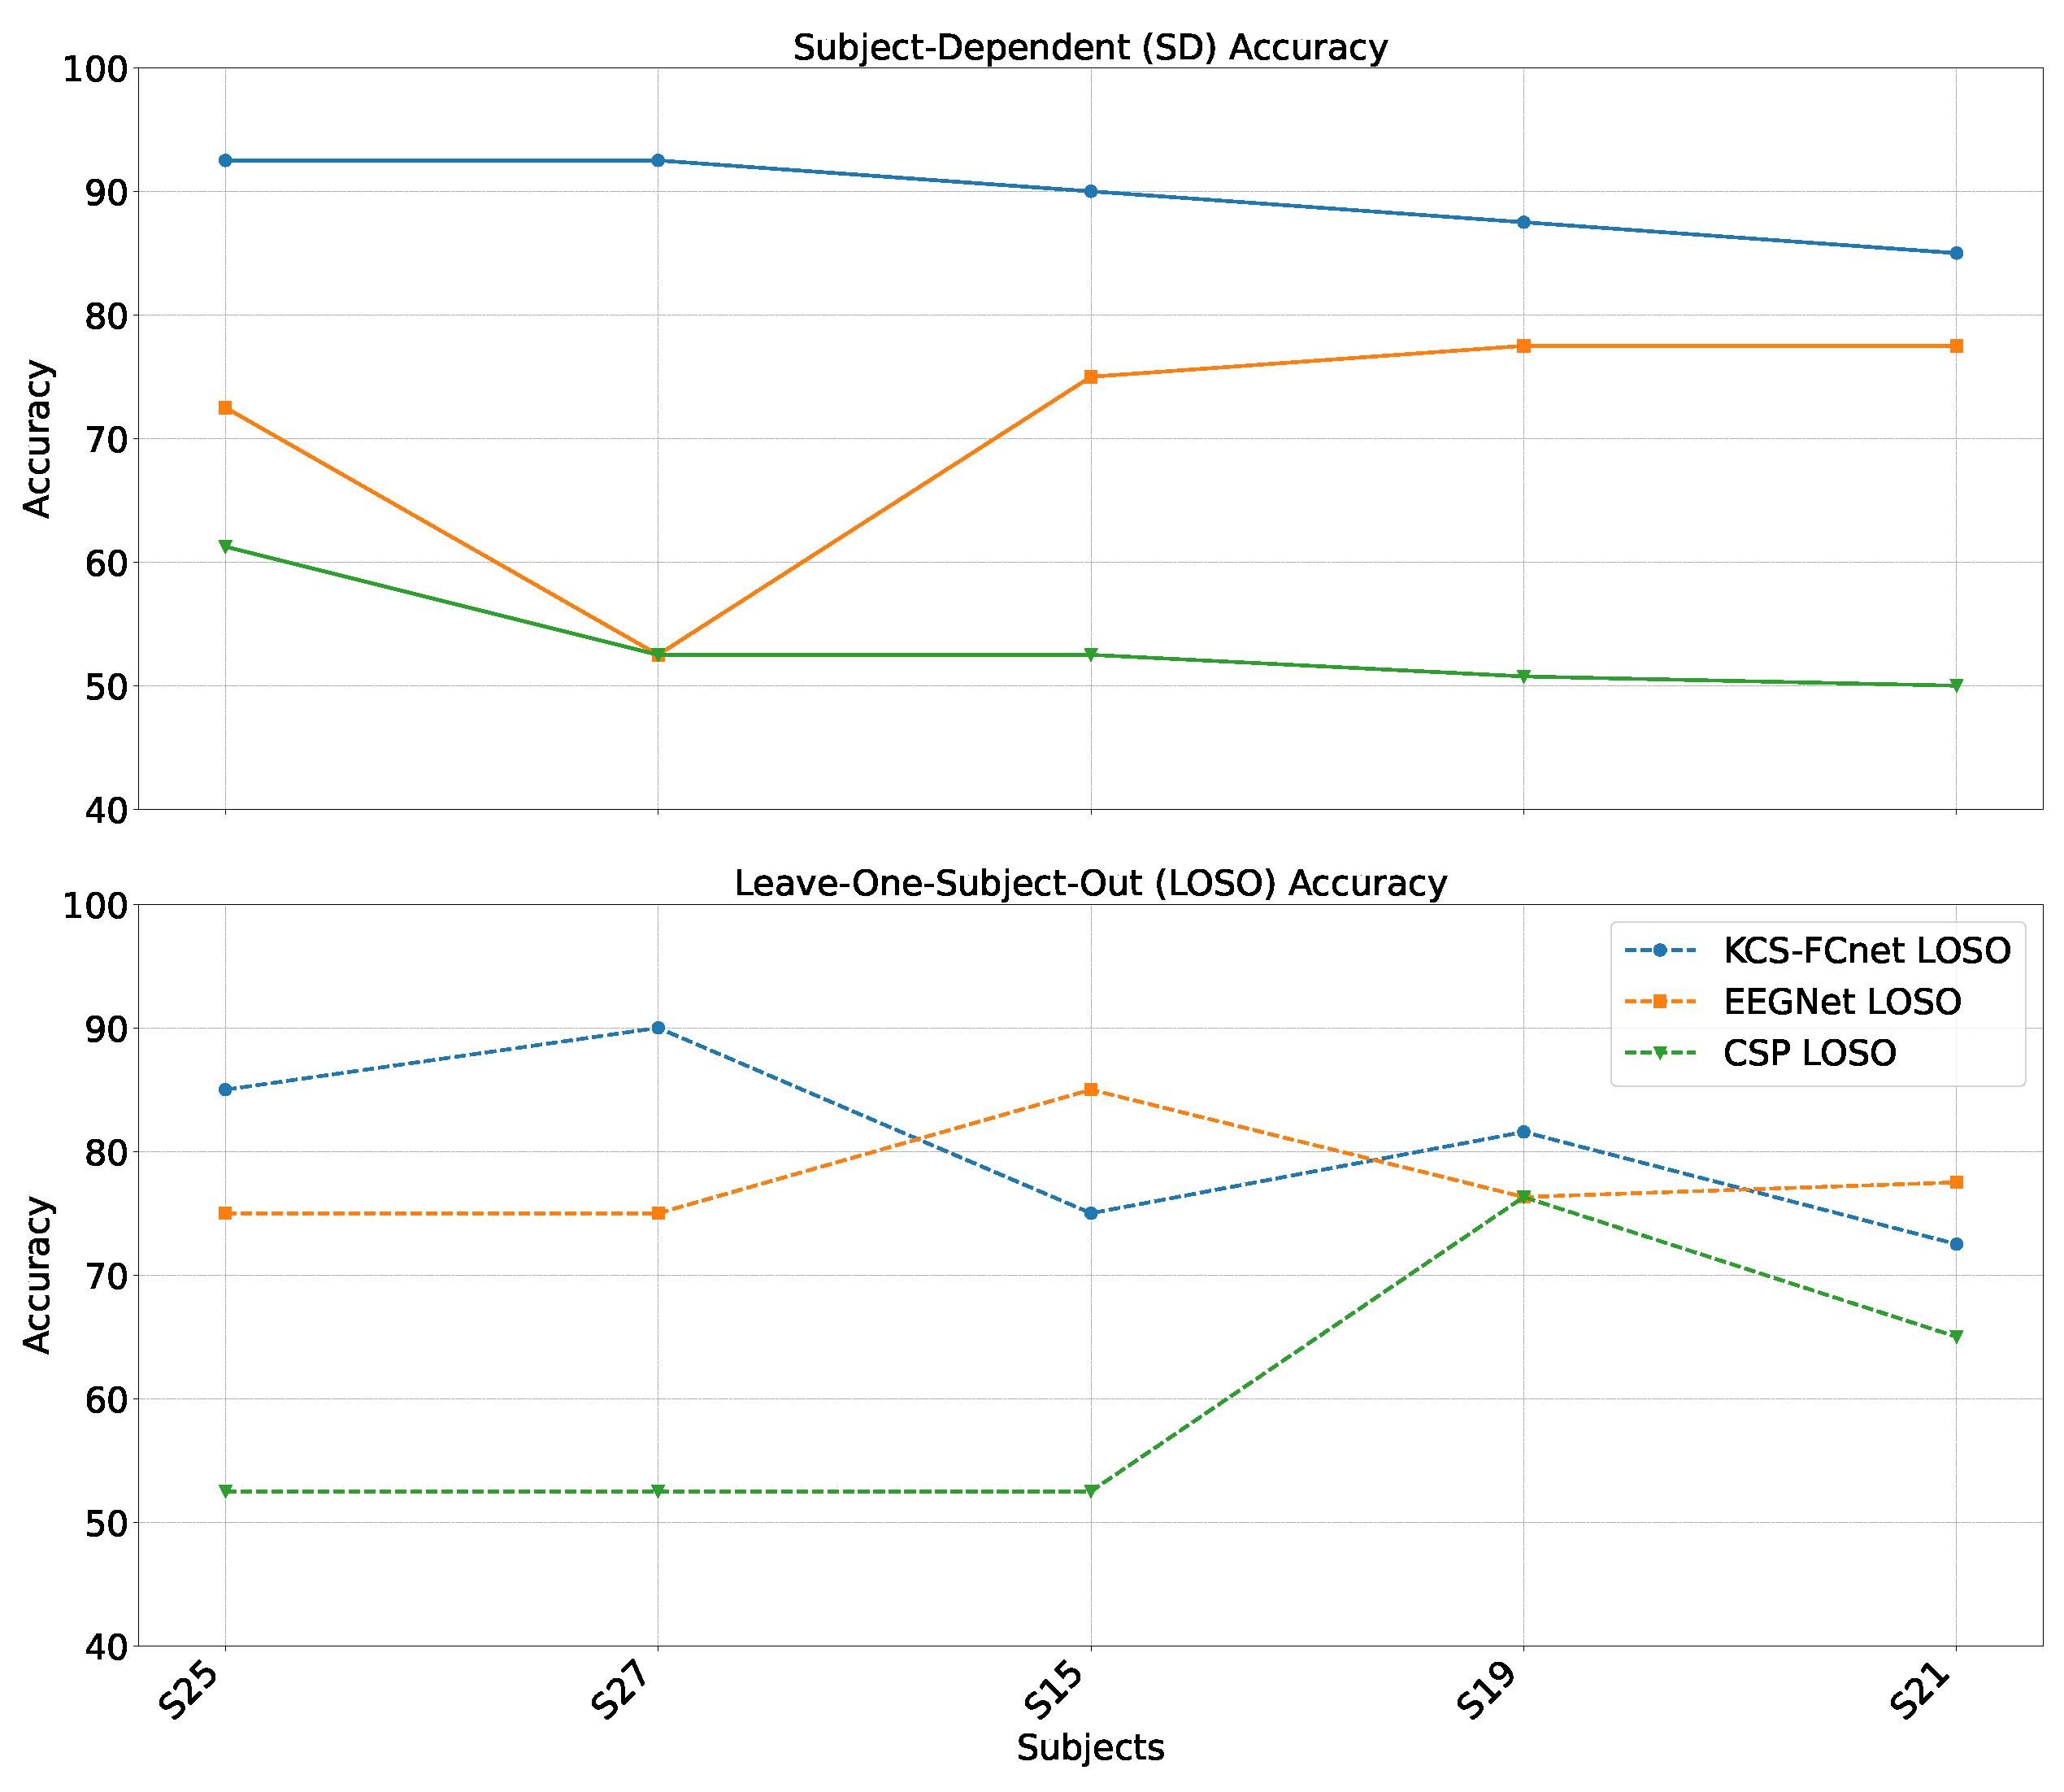
Figure 10.
Females’ group accuracy comparison within the subject-dependent and cross-subject pain detection experiments.
Figure 10.
Females’ group accuracy comparison within the subject-dependent and cross-subject pain detection experiments.
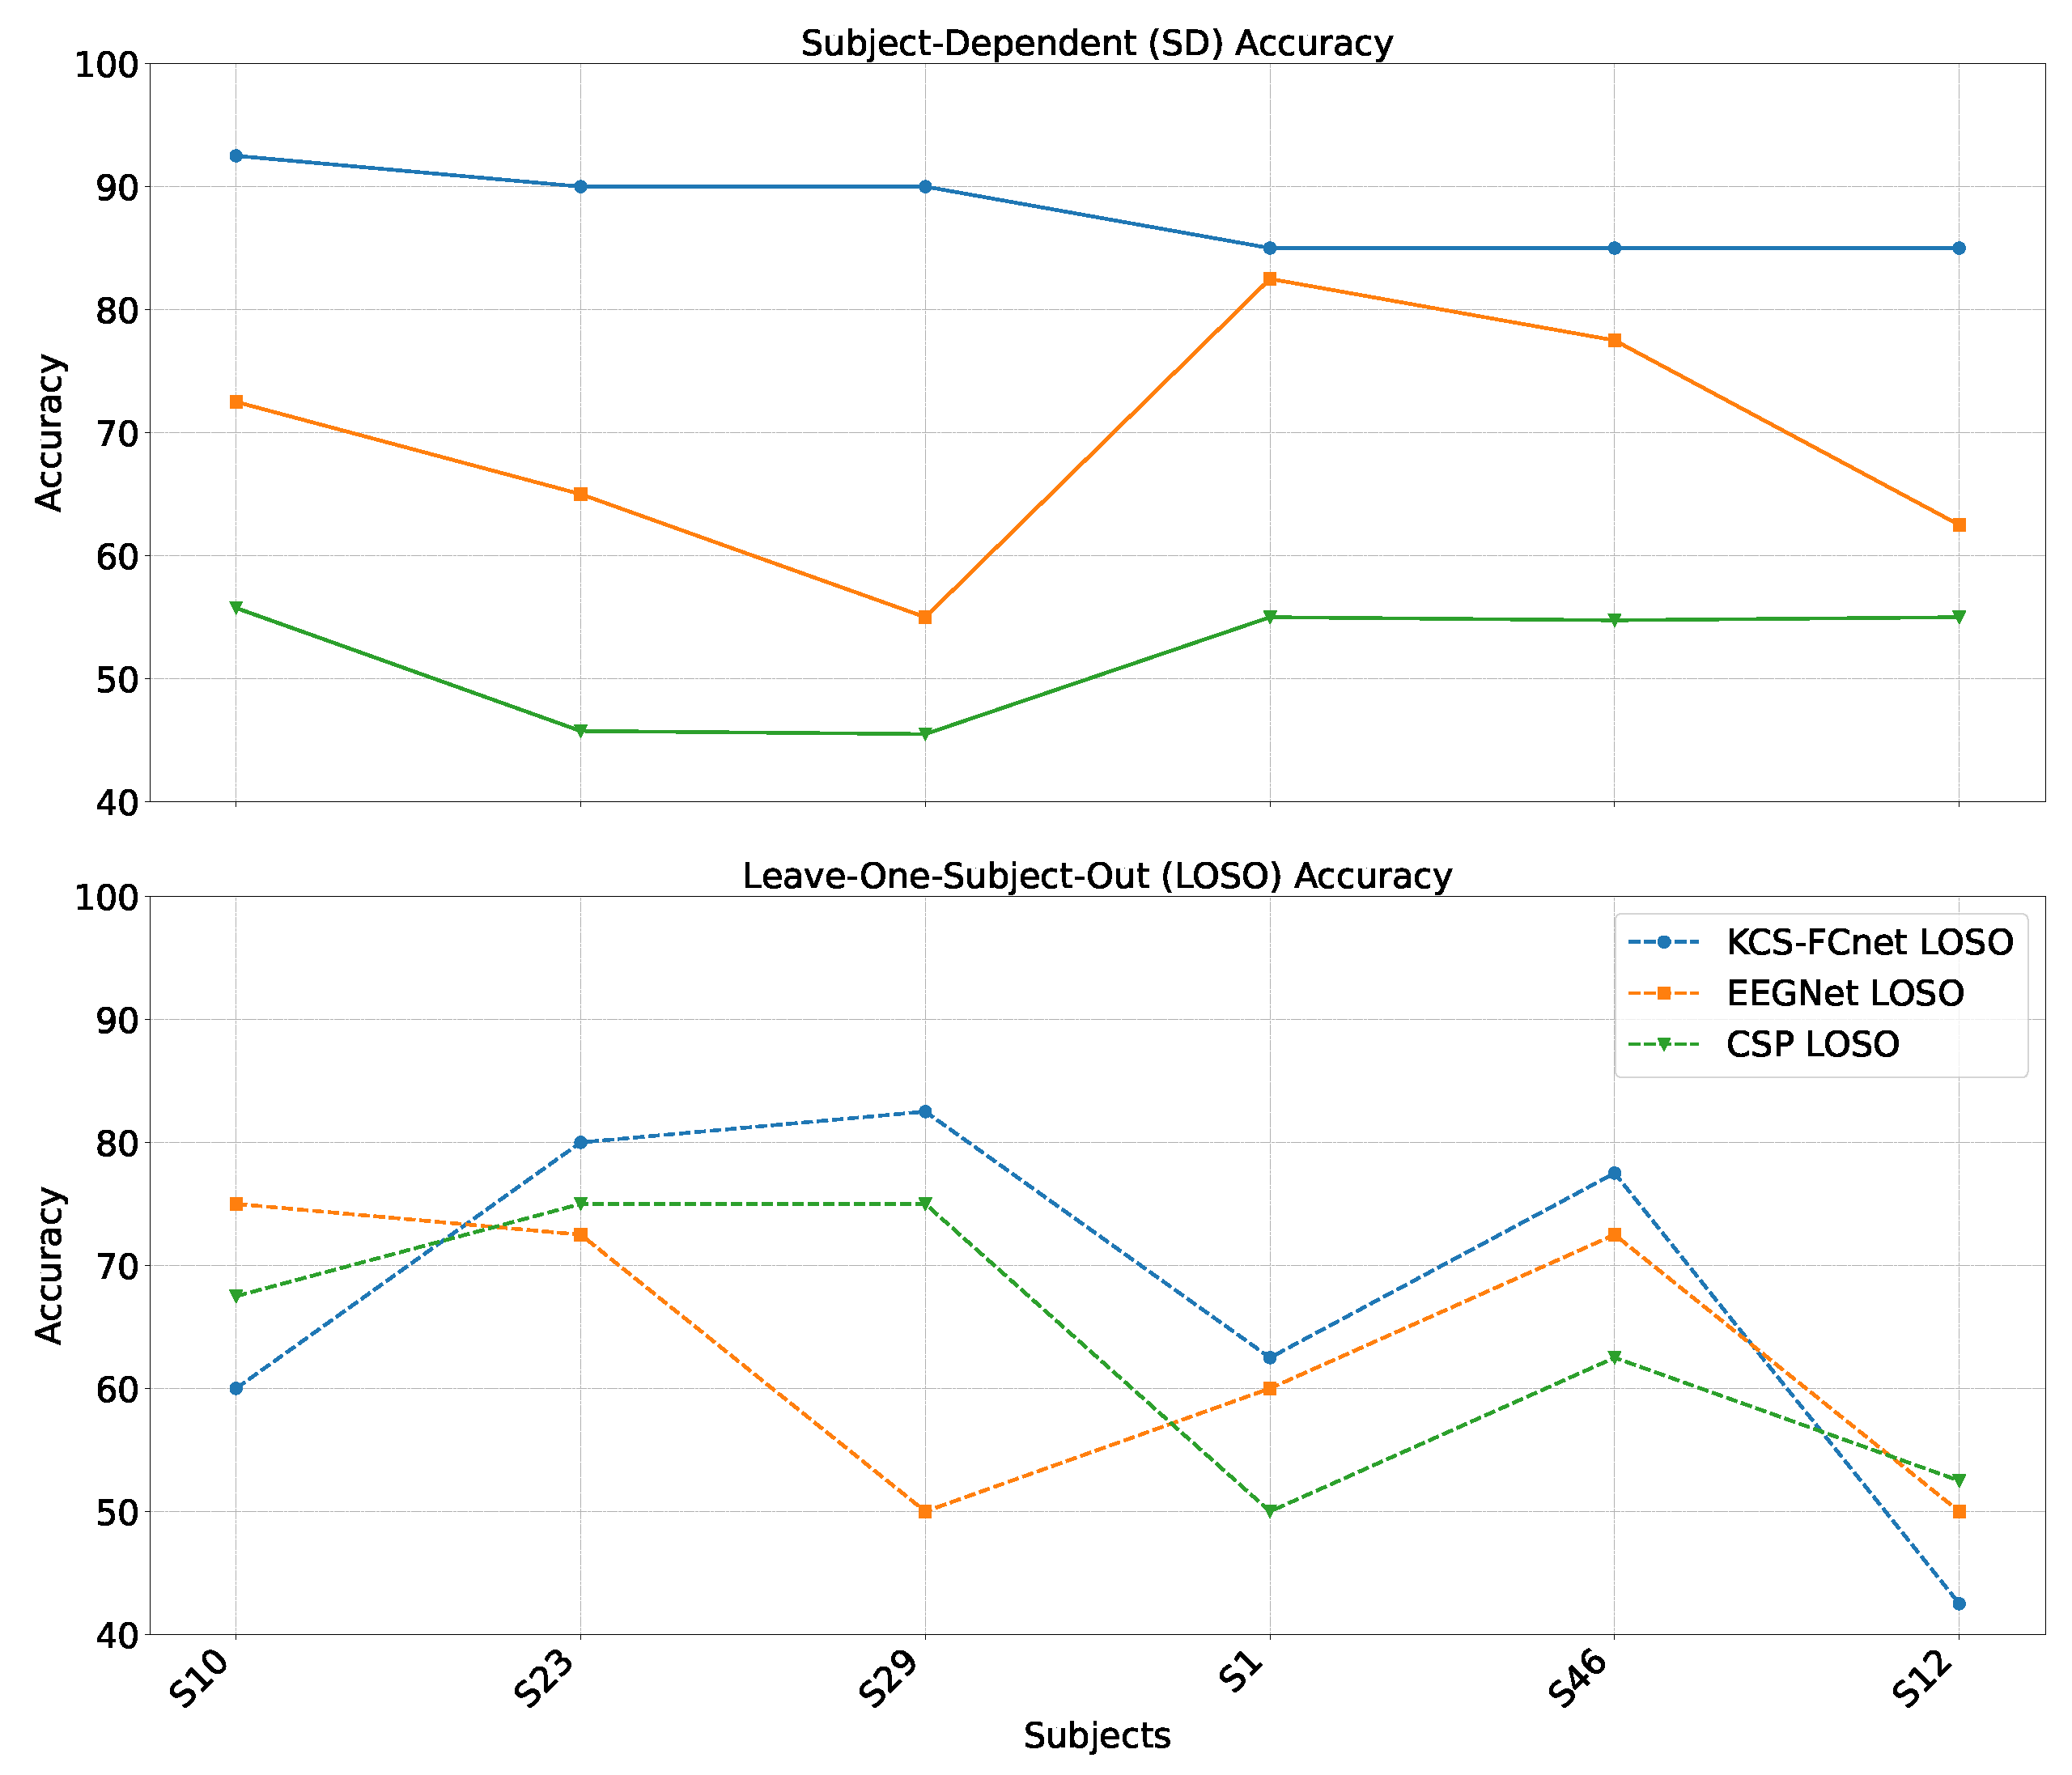
Figure 11.
FCAM-based spatio-frequency results. We present Subject 15 as a representative male subject. Theta (4-8 Hz), alpha (8-13 Hz), beta (13-30 Hz), gamma (30-60 Hz), and full-band (4-60 Hz) are shown. FCAM relevance vector is normalized between 0 and 1, considering both no-pain and high-pain pain detection classes.
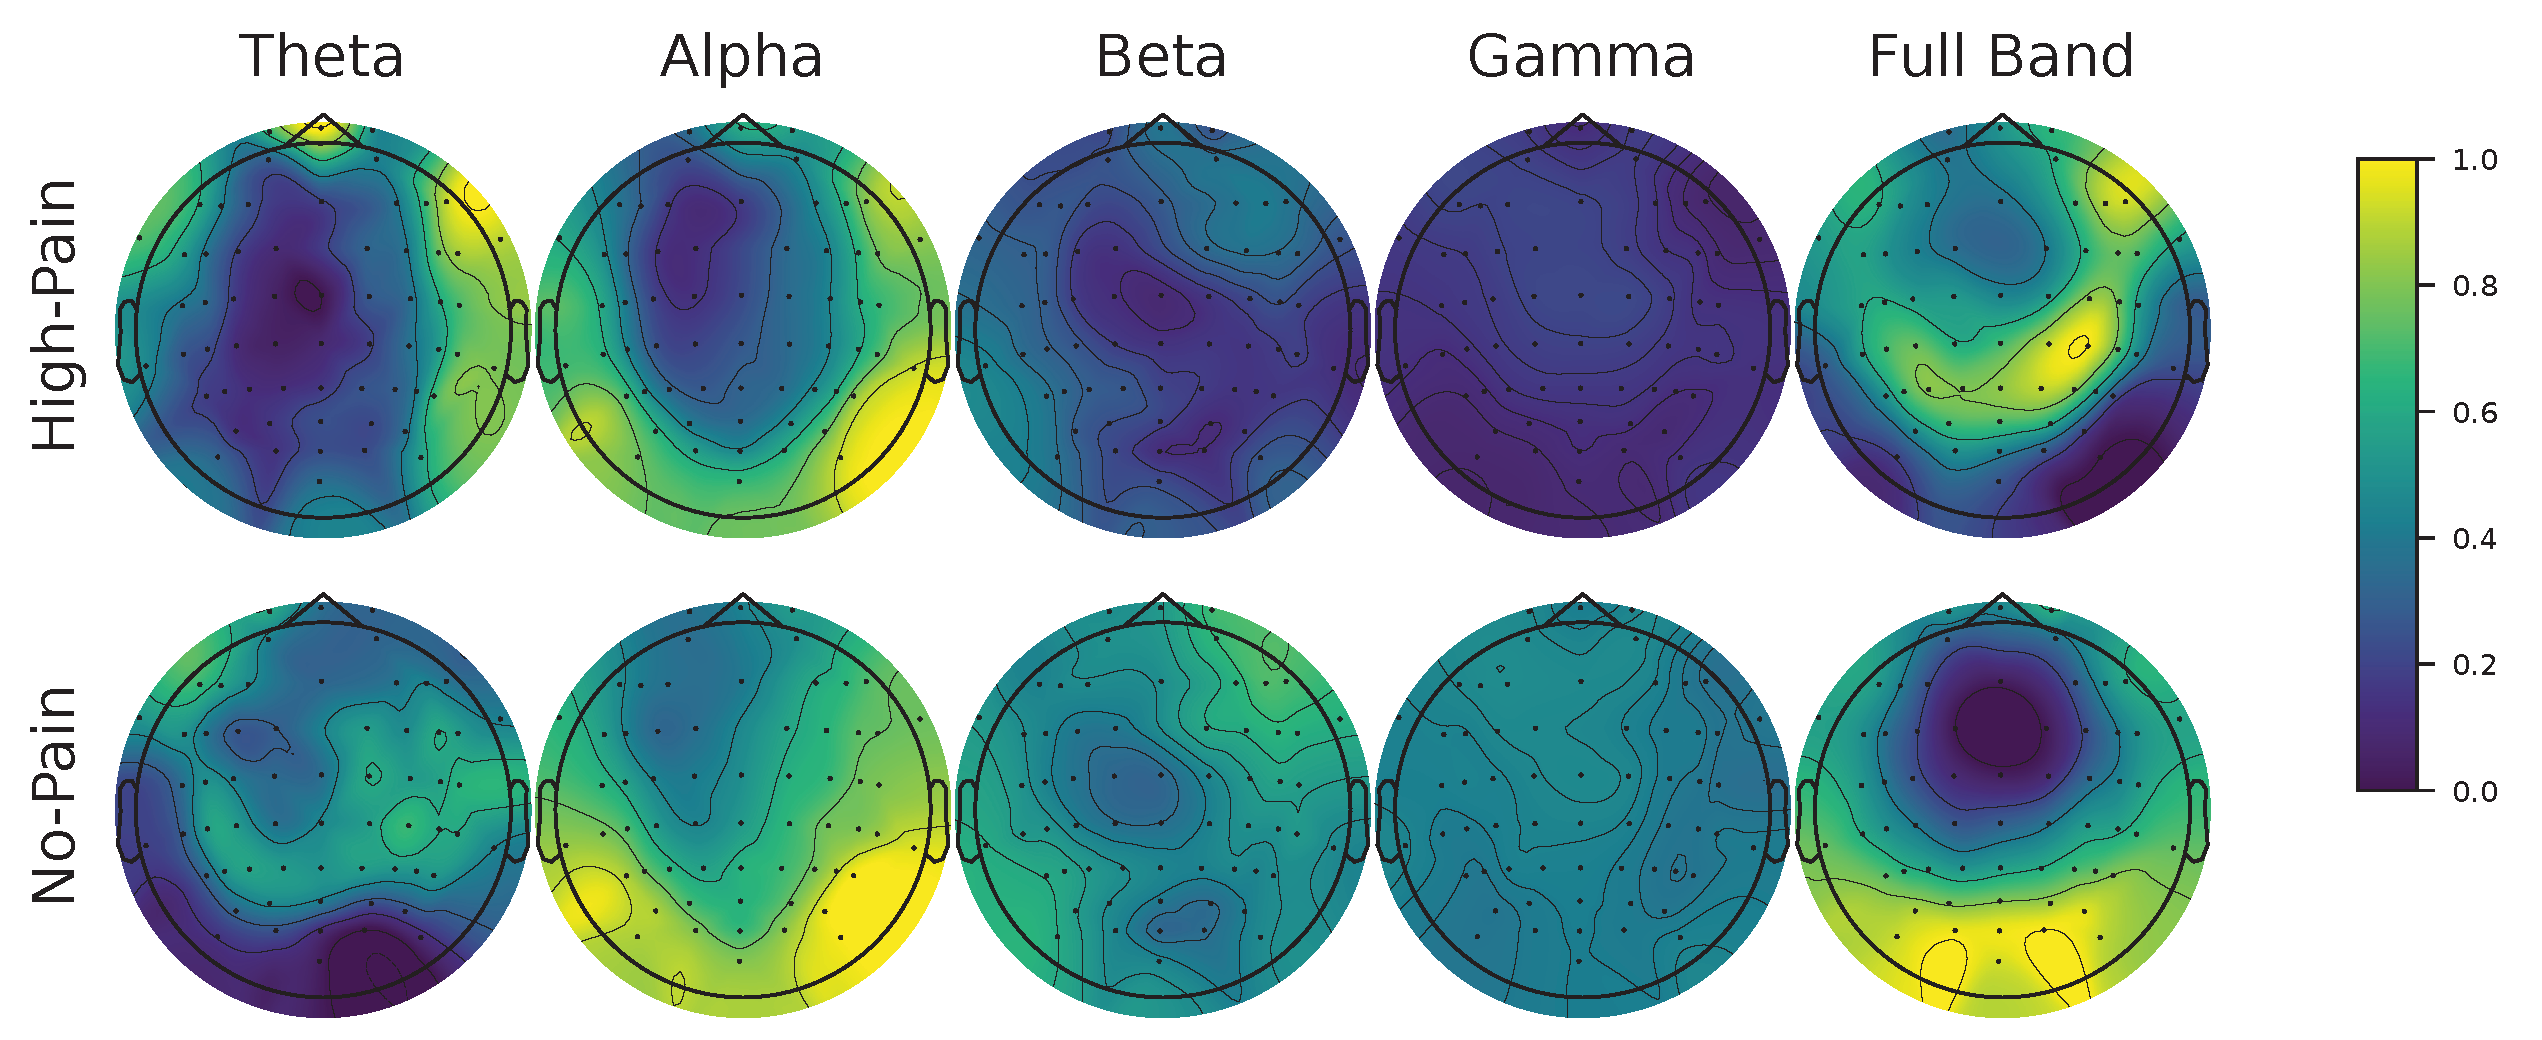
Figure 12.
FCAM-based spatio-frequency results. We present Subject 29 as a representative female subject. Theta (4-8 Hz), alpha (8-13 Hz), beta (13-30 Hz), gamma (30-60 Hz), and full-band (4-60 Hz) are shown. FCAM relevance vector is normalized between 0 and 1, considering both no-pain and high-pain pain detection classes.
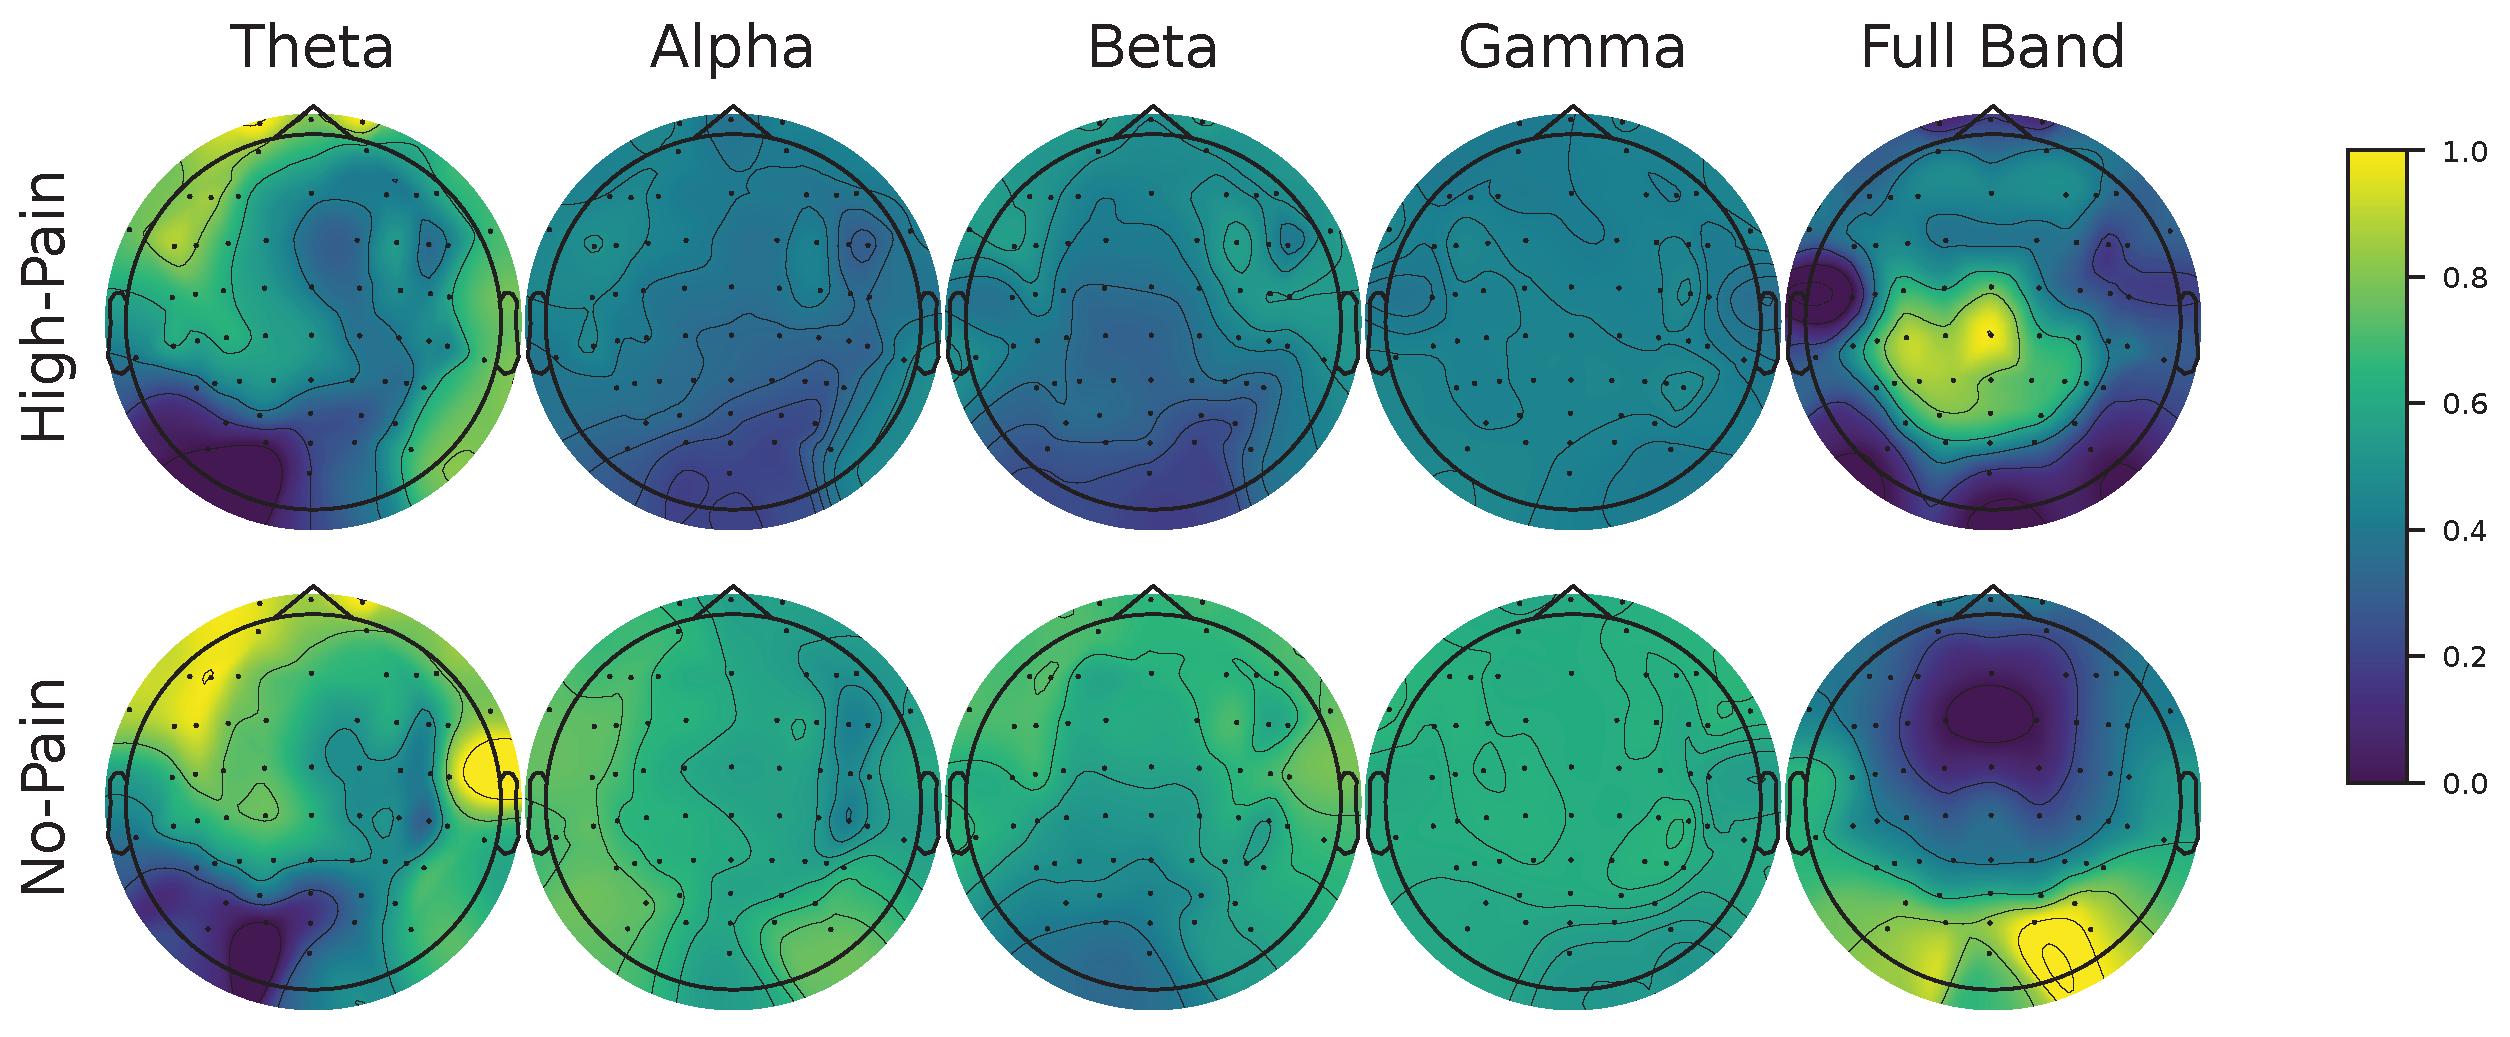
Figure 13.
KCS-FCNet-derived Gaussian functional connectivity patterns for representative subjects: female (Subject 29) and male (Subject 15). 2KS-based pruning is carried out to preserve discriminative FC with p-value. Then, connections exceeding 97% of the maximum relevance value are retained for visualization. Colored brain regions within the graph are related to Figure 1.
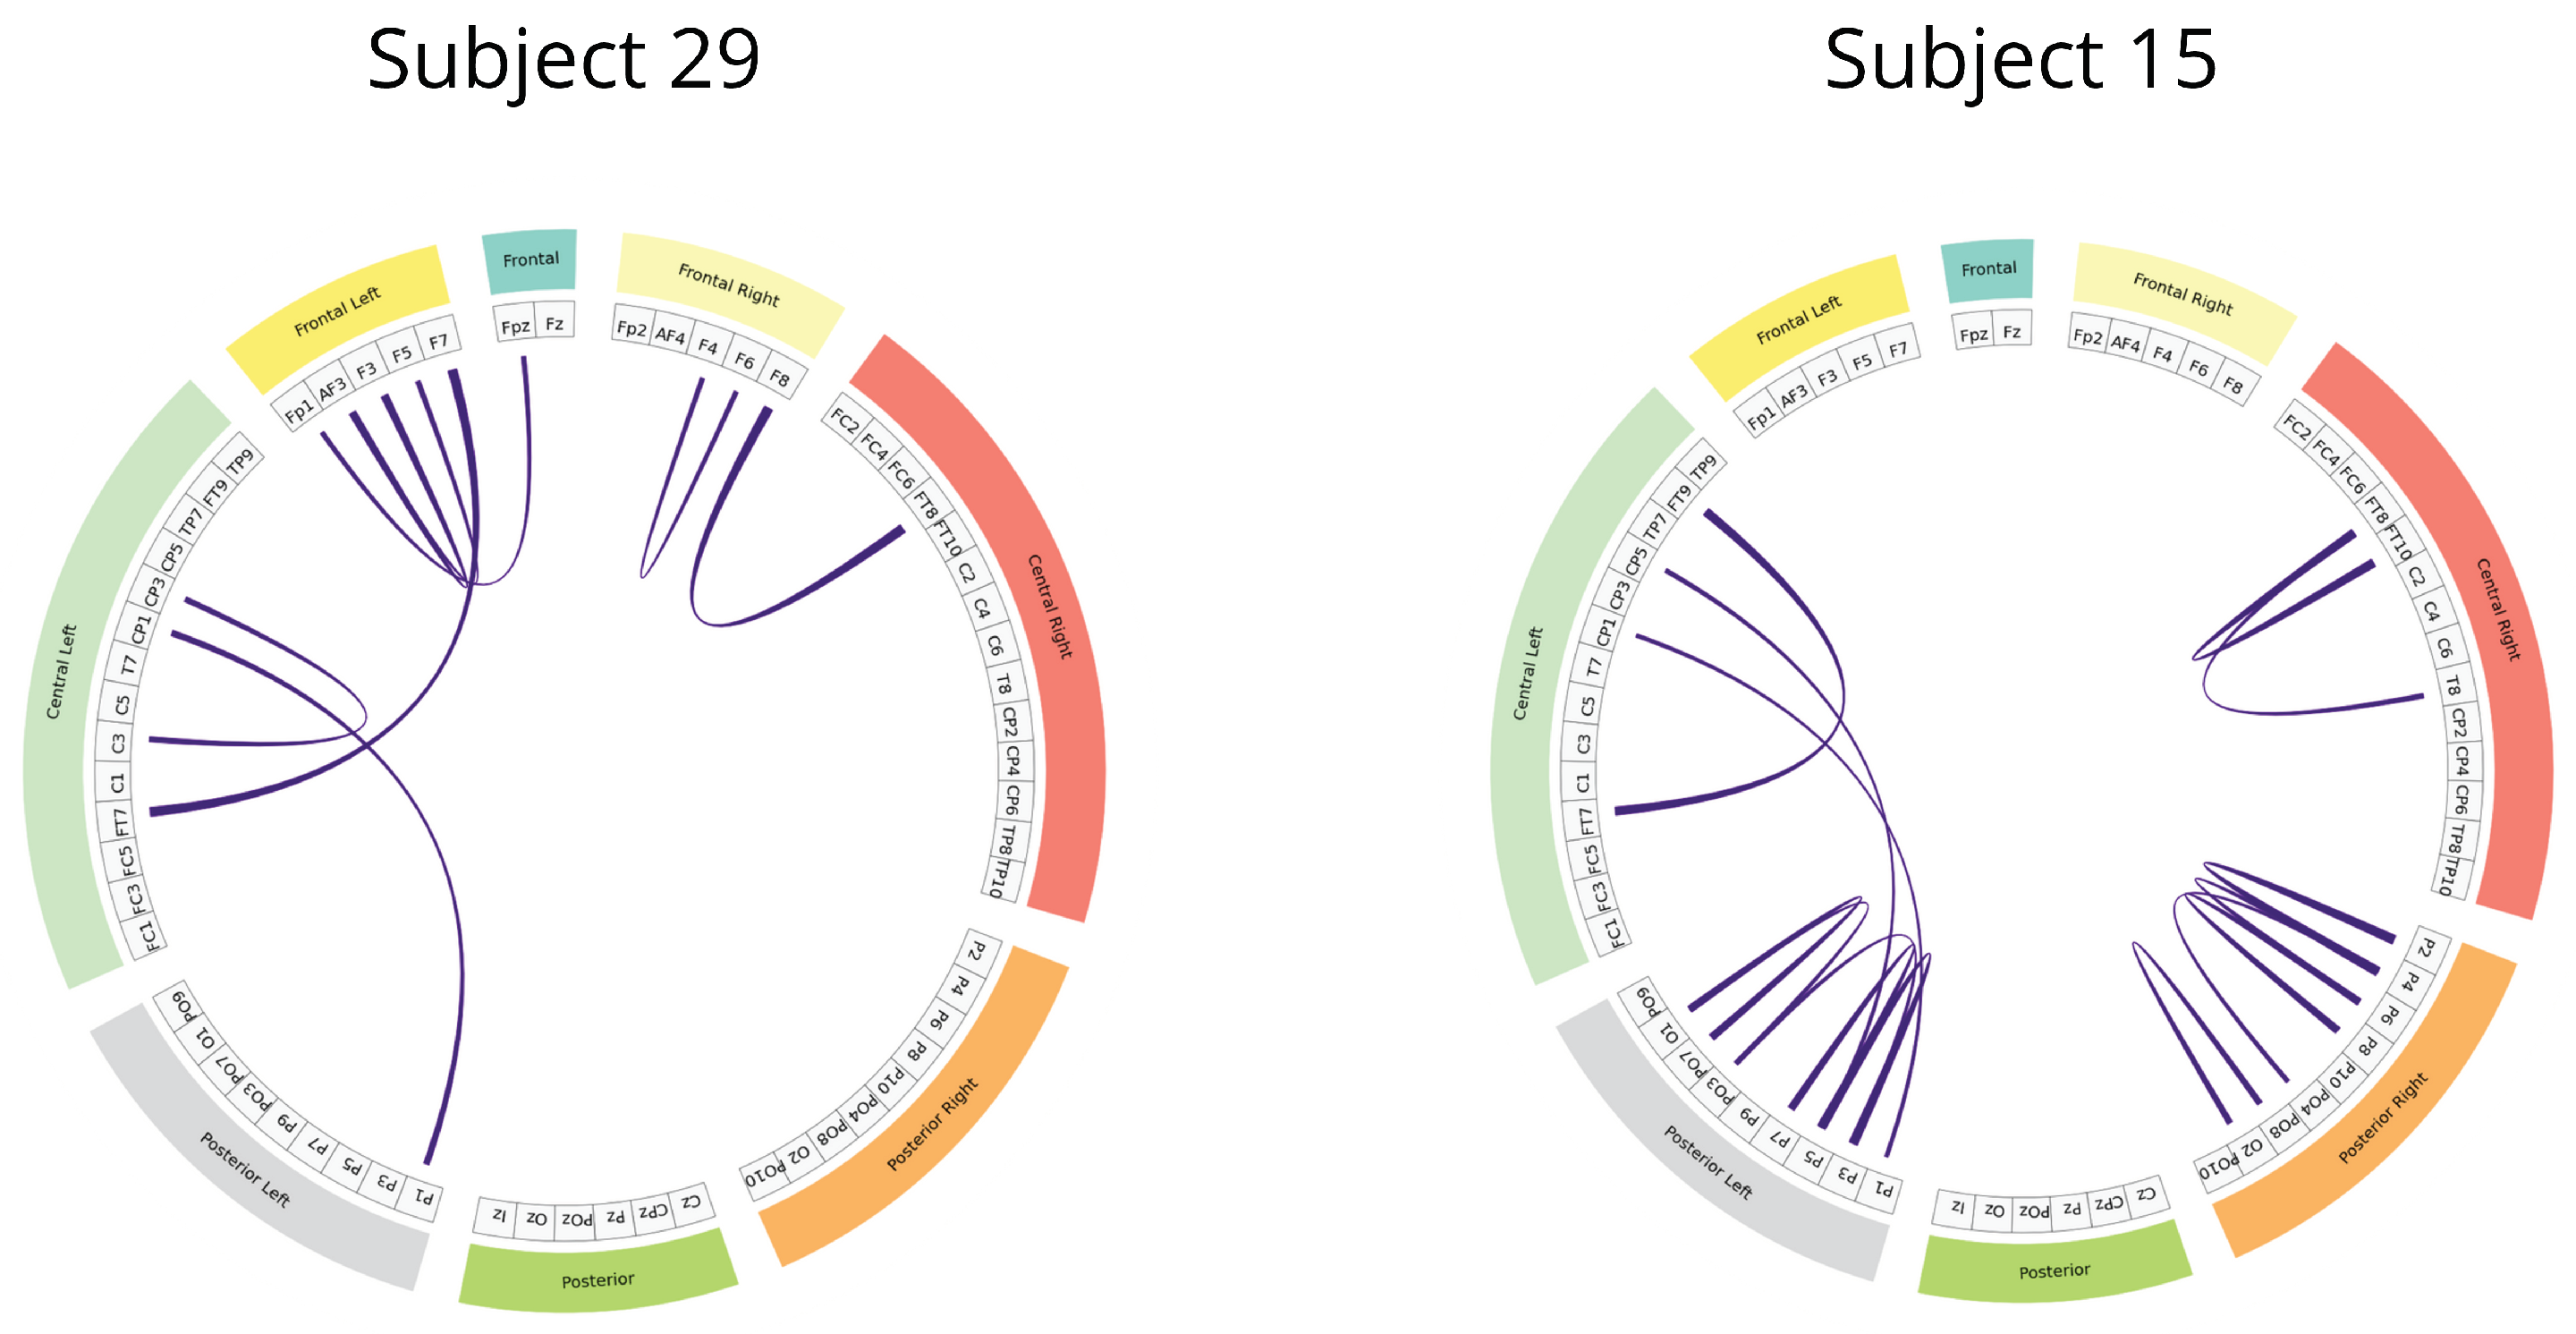

Table 1.
Brain Mediators of Pain database demographic information summary.
| Attribute | Value |
|---|---|
| Men | 26 |
| Women | 25 |
| Min Age | 20 |
| Max Age | 37 |
| Mean Age |
Table 2.
Deep learning hyperparameter setting.
| Training Hyperparameter | Argument | Value |
|---|---|---|
| Monitor | Training Loss | |
| Factor | 0.1 | |
| Reduce learning rate on plateau | Patience | 30 |
| Min Delta | 0.01 | |
| Min Learning Rate | 0 | |
| Adam | Learning Rate | 0.1 |
| Stratified Shuffle Split | Splits | 5 |
| Test size | 0.2 |
Table 3.
Detailed KCS-FCNet Architecture for pain detection.
| Layer | Output shape | Params |
|---|---|---|
| Input | (C, T, 1) | . |
| Conv2D | (C, , ) | max norm=, kernel size=, Stride size=, Bias=False |
| BatchNormalization | (C, , ) | . |
| ELU Activation | ||
| FC Block | (, , 1) | . |
| AveragePooling2D | (1, , 1) | . |
| BatchNormalization | (1, , 1) | . |
| ELU Activation | ||
| Flatten | . | |
| Dropout | Dropout rate = | |
| Dense | Max Norm = | |
| Softmax |
Table 4.
Average subject-dependent pain detection performance. Standard deviation is also included. − stands for not provided.
Table 4.
Average subject-dependent pain detection performance. Standard deviation is also included. − stands for not provided.
| Approach | Accuracy | Kappa | AUC |
|---|---|---|---|
| Power features + SVM [40] | 56.5 ± 7.5 | – ± – | – ± – |
| FBCSP [45] | 53.0 ± 3.8 | 5.9 ± 7.6 | 53.0 ± 3.8 |
| EEGNet [46] | 62.5 ± 9.9 | 24.9 ± 19.7 | 64.6 ± 14.7 |
| KCS-FCnet (ours) | 76.4 ± 9.1 | 52.8 ± 18.1 | 81.2 ± 11.5 |
Table 5.
Gender-based group distribution. Male and female subjects with subject-dependent are considered.
Table 5.
Gender-based group distribution. Male and female subjects with subject-dependent are considered.
| Group | Subjects | Min Age | Max Age | Average Age |
|---|---|---|---|---|
| Females | 1, 10, 12, 23, 29, 46 | 20 | 36 | 26.5 ± 3.9 |
| Males | 15, 19, 21, 25, 27 | 22 | 33 | 27.1 ± 3.5 |
Table 6.
Male cross-subject pain detection results. A LOSO cross-validation is carried out. Average ACC and standard deviation are presented.
Table 6.
Male cross-subject pain detection results. A LOSO cross-validation is carried out. Average ACC and standard deviation are presented.
| Approach | Accuracy | Kappa | AUC |
|---|---|---|---|
| FBCSP [45] | 57.6 ± 7.8 | 15.3 ± 15.6 | 57.7 ± 7.8 |
| EEGNet [46] | 77.7 ± 3.7 | 55.5 ± 7.5 | 86.5 ± 3.7 |
| KCS-FCNet (ours) | 80.8 ± 6.4 | 61.6 ± 12.8 | 90.8 ± 7.7 |
Table 7.
Female cross-subject pain detection results. A LOSO cross-validation is carried out. Average ACC and standard deviation are presented.
Table 7.
Female cross-subject pain detection results. A LOSO cross-validation is carried out. Average ACC and standard deviation are presented.
| Approach | Accuracy | Kappa | AUC |
|---|---|---|---|
| FBCSP [45] | 62.5 ± 10.1 | 25.0 ± 20.2 | 62.5 ± 10.1 |
| EEGNet [46] | 63.3 ± 10.6 | 26.6 ± 21.1 | 78.3 ± 17.9 |
| KCS-FCNet (ours) | 67.5 ± 14.0 | 35.0 ± 28.1 | 80.9 ± 18.3 |
Disclaimer/Publisher’s Note: The statements, opinions and data contained in all publications are solely those of the individual author(s) and contributor(s) and not of MDPI and/or the editor(s). MDPI and/or the editor(s) disclaim responsibility for any injury to people or property resulting from any ideas, methods, instructions or products referred to in the content. |
© 2025 by the authors. Licensee MDPI, Basel, Switzerland. This article is an open access article distributed under the terms and conditions of the Creative Commons Attribution (CC BY) license (http://creativecommons.org/licenses/by/4.0/).
Copyright: This open access article is published under a Creative Commons CC BY 4.0 license, which permit the free download, distribution, and reuse, provided that the author and preprint are cited in any reuse.


