
Submitted:
24 March 2025
Posted:
25 March 2025
You are already at the latest version
Abstract
This study investigated how Kwara State's rice farmers' productivity was influenced by digital technology. Through a three-step sampling approach, primary data was acquired from 151 rice producers. Descriptive statistics, the sigma scoring approach, ordinary least square regression, logit regression model, and a Likert-type scale were used to examine the gathered data. According to the study's results, 74.17% of the respondents were between the ages of 20 and 40. There were 99.34% males and 59.60% with tertiary education. Six to ten persons made up an average family, and 82.12% of them were married. The most extensively utilized digital technology among farmers was proven to be mobile phones, with a high adoption level of Sigma score of 5.94. Major determinants of digital technology usage among rice farmers were age (p<0.01), digital awareness (p<0.01), experience in rice farming (p<0.05), access to financing (p<0.05), and digital awareness (p<0.01). Additional studies showed the purpose of digital technology usage, how frequently it is utilized, and how mobile phone communication with extension workers has a positive statistically significant effect on rice productivity of farmers. The exorbitant cost of mobile phones, poor access to extension workers, inadequate power supply, weak network connectivity, and poor access to credit are some of the challenges that impede rice farmers from embracing digital technology. The study advises that to increase farmers' agricultural productivity, the government and development partners should educate farmers about the benefits and correct usage of mobile phones. Expanding network coverage to remote places should also be a focus to improve seamless digital technology use.
Keywords:
productivity
; Sigma scoring approach
; the logit regression model
; ordinary least square regression
; digital technology
; rice farmers
; Kwara State
Introduction
Background to the Study
Agriculture is a large industry that has a considerable impact on both food security and the global economy. For the 80 percent of impoverished people on the earth who reside in rural regions and work largely in the agricultural sector, agriculture may help fight poverty, improve earnings, and secure food security (World Bank, 2023). Expanding the economy also depends on agriculture. It is impossible to overestimate the crucial importance that Nigeria's agriculture industry plays in the country's economy. Between 2016 and 2023, its GDP contribution fluctuated between 24.45% and roughly 23% (NBS, 2023). With a richness of natural resources, the nation can generate a wide variety of food items on 70.8 million hectares of agro-ecological agricultural land (African Development Bank, 2023). With a current population of roughly 223.8 million, Nigeria is the most populous country in Africa and has been for some years (UNFPA, 2023). Continuous population expansion in the nation raises the demand for agricultural output to the point where it lowers food availability and jeopardizes the security of food supply for the country. When population increase outpaces available agricultural output or commodities, a condition of food insecurity occurs because average population growth outpaces average agricultural output by a sufficient margin (Tavershima et al., 2022). Doing away with hunger will require a tremendous boost in agricultural productivity. Quick expansion and adjustments to the agri-food systems are required to accomplish this (FAO, 2018); meanwhile, the social and environmental repercussions must be carefully evaluated (Smit, 2016). The digital revolution in agriculture has opened up new ways for this to be achieved.
Oryza sativa, rice, is the most common food product in the world (Opeyemi et al. 2015). More than half of the world's population, or 4.8 billion people across 176 countries, eat rice, making it the most significant staple food crop in the world. Of them, more than 2.89 billion live in Asia and more than 150.3 million in Africa (Opeyemi et al., 2015). Rice is the second most significant grain crop in the world, feeding about two thirds of all people. It delivers high-quality, easily digested, hypoallergenic protein and is a considerable source of energy (Firouzi, 2014).
Rice is an important crop, grown practically everywhere in Nigeria's agro ecological zones. It is harvested annually. Nevertheless, the entire yield of rice is still not enough to satisfy customer demand. This significant meal is a crucial component of attempts to achieve food security since it gives the populace of a nation the bare minimum of 2,400 calories per day. Given the aforementioned, substantial concerns have been raised regarding the relative importance of Nigeria's domestic rice production (Banjoko et al. 2016).
Despite import restrictions, rice production is not keeping up with the country's population growth. Furthermore, due to quality variances and consumer preferences, a lot of people like imported rice over local rice, also the value chain-specific constraints beyond manufacturing (Karkare & Odijie, 2022).
Digital technologies play a vital role in the acquisition, retention, evaluation, and dissemination of information. These technologies are deemed to be a potential way to boost supply chain operations, including logistics, scheduling, planning, and procurement (Arunachalam et al., 2018). A more circular economy is made practicable by digital technologies, which are also being used to measure and track sustainability progress, optimize resource use, minimize greenhouse gas emissions, and drive innovation and collaboration, it also improve efficiency, equity, and environmental sustainability in the food chain (World Economic Forum, 2022). Numerous smartphone apps stimulate agriculture on different levels throughout the world. By allowing farmers access to real-time, actionable information, eliminating economic inequities, and creating opportunities for rural communities, a range of technologies from simple offline farmer advice to complicated precision agriculture systems are revolutionizing the agricultural sector. Access to bank accounts, weather forecasts, market information, and extension agent contact are all made available by using mobile phones (World Economic Forum, 2020). For instance, farmers, professionals, and practitioners can communicate and share knowledge in real time through the interactive platform GeoFarmer. It allows timely performance indicators, interactive feedback, and cost-effective monitoring of agricultural output. GeoFarmer promotes farming communities' livelihoods, minimizes hazards, and raises productivity through the optimization of management practices (Eitzinger et al., 2019).
In terms of widespread acceptance, the mobile phone has eclipsed all previous technologies (Nakasone & Torero, 2016; Baumüller, 2018; Samuel, 2018). The utilization of mobile phones to provide services, especially through the adoption of short messaging services (SMS), is presently seeing a remarkable upswing across Africa. This increase has been attributed to the introduction of prepaid packages, the expansion of networks to remote areas, and the decline in phone prices and calling rates. But it's crucial to underline that Africa still has a low broadband internet usage rate (Baumüller, 2012). Due to the rapid expansion of mobile phones in developing nations, it is now possible to overcome social and geographic constraints and reach farmers who are often dispersed, far away, and undersupplied. The scope and use of agricultural m-services are anticipated to expand substantially in the future due to the rapid developments in mobile technology (Baumüller, 2017). By evaluating how digital technology affects rice farmers' production in Kwara state, Nigeria, this study adds to the body of knowledge on productivity and digital technologies. The influence of digital technologies on productivity needs to be thoroughly researched since the results will provide policy proposals for the advancement and uptake of digital technology among farmers.
Problem Statement
Over half of the world's population relies on rice as a staple food, and it also offers more than 19% of the calories per person. Over the years, most of Nigeria's land has been used for farming rice. There is still a continuous discrepancy between the amount of rice produced and consumed in the country. For 2016, local output was 2.3 million metric tonnes, whereas national production was projected at 6.3 million metric tonnes (FMARD, 2016). The 4 million metric tonne shortage was expected to be supplied by import. Consequently, the government of Nigeria spent over $2 billion on rice imports between 2012 and 2015 (Premium Times, 2015). That is to say, despite the increased demand, the supply of rice has remained unchanged. If Nigeria were to continue importing rice, it is detrimental for the economy since it could lead to currency loss and a reduction in the country's foreign reserves (Abbas et al., 2018). Various factors such as climate change, high temperatures, drought (a shortage of water), flooding, weeds, diseases, pests, and so forth could increase the challenges encountered by the Nigeria's rice sector (Saito et al., 2023).
To adjust the negative tendencies in local rice production, it is necessary for to accept and use digital agriculture technologies. The growth of digital technology has the opportunity to modify the rice sector by supporting farmers in working faster, safer, and more efficiently, resulting in increased yields. Insights produced from data may improve operations and decision-making, aid improve environmental performance, and attract new generations to the field. Value chain business models could also be updated by digital technologies since they create new channels of communication between suppliers and customers. Nonetheless, as far as the researcher is aware there is a paucity of information on the effect of digital technologies on the productivity of rice farmers. This research gap has offered no impetus for policy development in this area. Providing responses to the following research questions is how this study attempts to fill this knowledge gap.
1. What are the digital technologies applied by rice farmers in the research area?
2. What is the farm level of adoption and uptake of digital technologies among rice farmers in the study area?
3. What are the determinants of digital technologies usage among rice farmers in the study area?
4. What is the impact of digital technology on the productivity of rice producers in the research area?
5. What are the restrictions to rice farmers’ adoption and utilization of digital technology in the study area?
Objectives of the Study
The primary objective of the research is to analyze the effect of digital technologies on the productivity of rice farmers in Kwara State, Nigeria.
The following are the explicit goals of the study:
1. To identify the digital technologies that are being deployed by rice growers.
2. To analyze the amount of farm-level adoption and uptake of digital technologies among rice farmers.
3. To access the determinants of digital technologies usage among rice farmers.
4. To examine the effects of digital technologies on the productivity of rice farmers in the study area
5. To identify the constraints to rice farmers’ utilization of digital technologies
Justification of the Study
Not producing enough is the major difficulty in Nigerian agriculture. This is especially true for Nigeria's rice sector. Productivity is limited because the majority of rice farmers use less better varieties, fertilizers, and irrigation systems; they also embrace and execute digital technologies insufficiently, and they have restricted access to information from extension agents.
The goal of this study project is to examine how digital technologies affects rice productivity among Nigerian farmers in Kwara State. These demand urgent policy attention to boost and increase the adoption and uptake of digital technologies on rice productivity. The result of this study will assist the government and stakeholders in establishing and implementing policies that can promote and stimulate more efficient use of digital technologies in the production of agricultural products among farmers. Therefore, the study's findings can be used as a guide for potential policy decisions made by domestic rice industry participants in an effort to increase local rice output and, in turn, the country's rice production.
The effect of digital technology on rice productivity in Nigeria, notably in Kwara State, has not been properly researched. As a result, the objective of this research is to overcome the knowledge gap in the field and supply farmers with information on how digital technologies impact rice production, which would ultimately enhance rice productivity. Additionally, it advances the national aim of minimizing the disparity between supply and demand so that rice may be grown to feed the growing population. Additionally, by adding to the corpus of existing literature, this study will broaden our understanding of the relationship between digital technology and rice productivity and benefit prospective researchers working in similar fields.
Methodology
Study Area
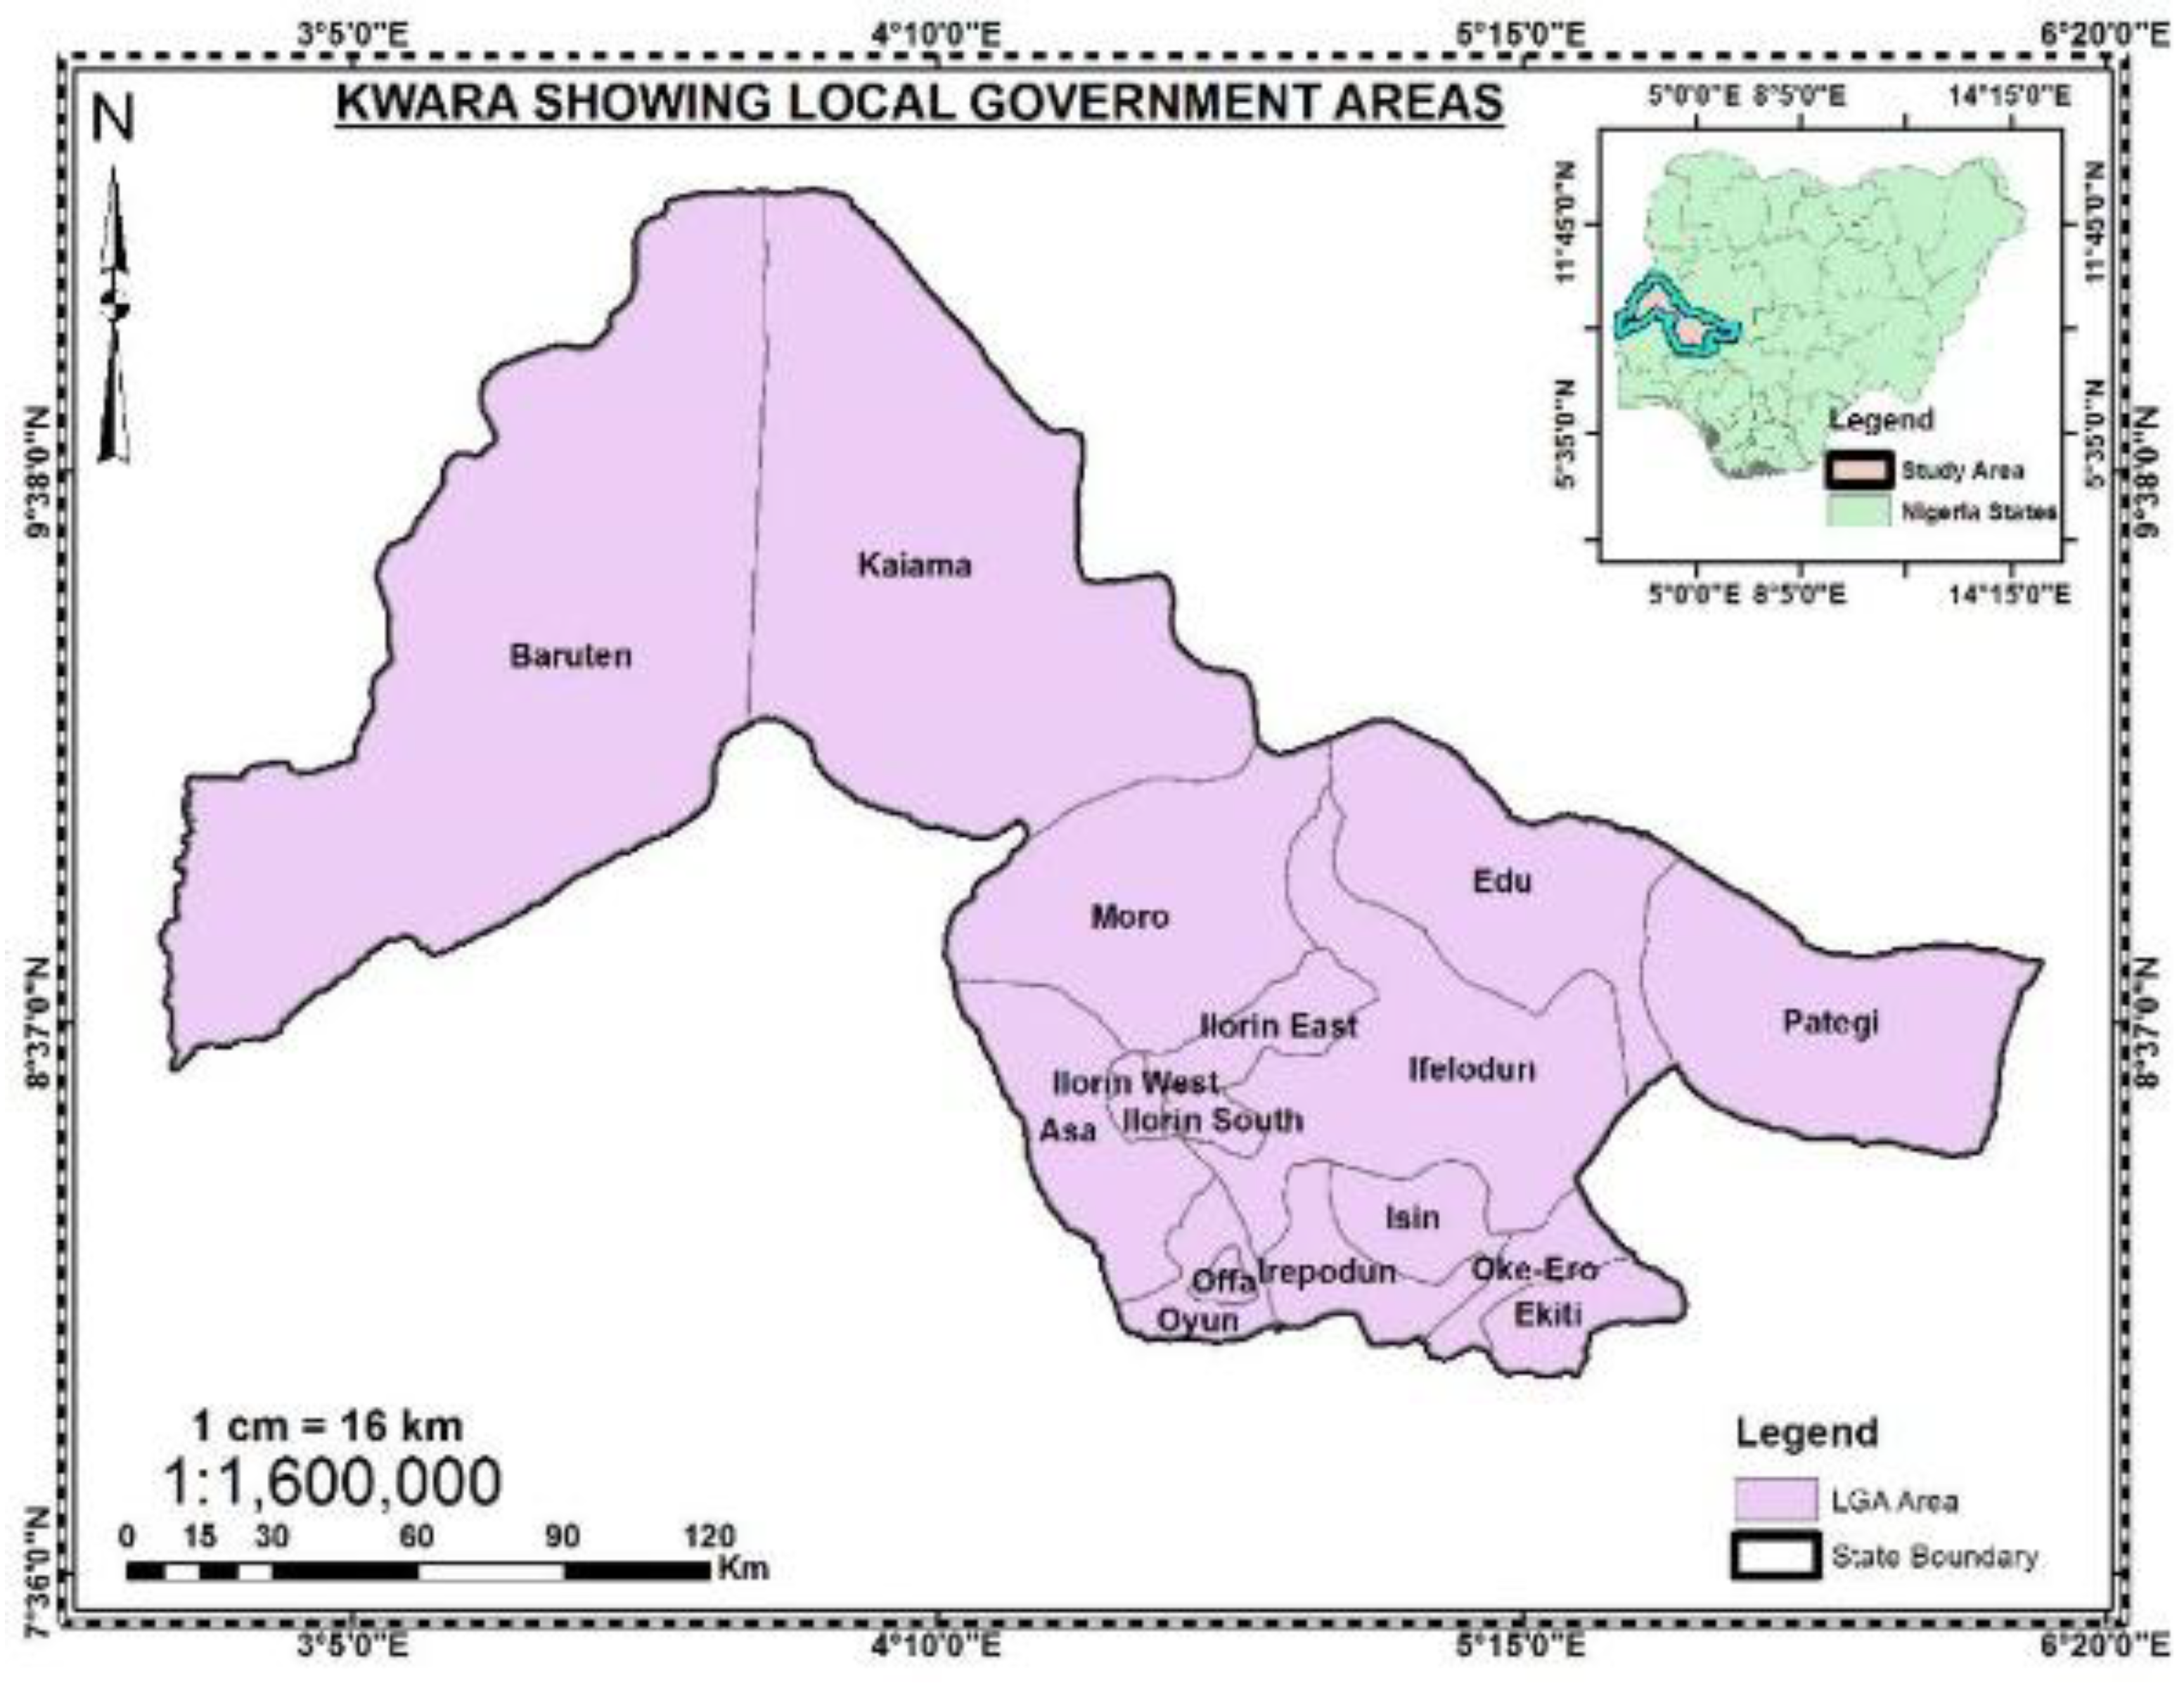
Kwara State, Nigeria is the location of the current study. It was created on May 27, 1967, together with eleven other federation states. The Middle Belt, a north-central geopolitical zone, is where Kwara State is located in Nigeria. Having Ilorin as its capital, the state is divided into sixteen Local Government Areas (LGAs). The constituent communities that make up each district are part of the LGA's further division. According to the National Bureau of Statistics, there are about 3.2 million as at 2016 living in Kwara state altogether. There are around 75 persons per square km on average. Kogi State borders the state on the east, Oyo State borders it on the west, Niger State borders it on the north, and Osun and Ondo State border it on the south. An international boundary separates Kwara State from the Republic of Benin (Adeoti et al., 2016). The geographical coordinates of Kwara State are latitude 7 45'N and 90 30’N, and longitude 60 25'E to 20 30'E (Oladimeji et al., 2015). Approximately 3.5% of the country's total land area, or 3,682,500 hectares, is made up of gently sloping hills intermingled with plains. Kwara state's land area is utilized for agriculture to the tune of around 25%. The majority of agricultural production is done on a modest, peasant scale, utilizing manual labour and simple tools. Fertilizers, mechanical equipment, better seeds, and agrochemicals are also applied, although not considerably (KWADP, 2007).
Rainfall amounts are between 1,000 and 1,500 mm per year. The usual temperature is in the 300–350C range. Rainy and dry seasons alternate throughout the state's humid tropical climate (Olanrewaju, 2009). The "dry season," lasts from November to March, while the rainy season, also known as the "wet season," runs from April to October. The state's major economy is agriculture due to its large amount of rich, fertile land and lush soil. The majority of food crops are consumed, while some cultivate cash crops like cashew, palm oil, and rice, and others sell a small percentage of their products in the market to supplement their income for family needs. Additionally, there are an estimated 203,833 agricultural facilities, most of which are found in rural regions. Agriculture is the principal industry in the state, with over 70% of the people employed in agriculture (Ayinde et al., 2018). Approximately 36,825 km2 (3.5%) of Nigeria's estimated 923,768 km2 land area is contained in Kwara State, which is located in North Central Nigeria (Babatunde et al. 2007). According to a study of the gender distribution, males make up around 49.6% of the state's total population, while women make up around 50.4%. The analysis of the age distribution indicates that Kwarans under the age of 18 make up roughly 48% of the overall population, while adults make up around 52%. The state has a strikingly diversified blend of cultures and ethnicities. Islam, Christianity, and numerous traditional religions make up the state's religious mix. The State also produces a substantial amount of rice (Matanmi et al., 2011). The research region was selected due to the importance of agriculture to the state's economy and the presence of several ecological zones that give rise to a wide array of crop kinds (Olabode, 2011).
Figure 1.
Map of Kwara State, Nigeria (Omotesho et al. 2019).
Sources of Data/Method of Data Collection
For the study, primary and secondary sources were sorted out. In addition to an oral interview schedule designed to elicit responses from the respondents, a structured questionnaire was implemented to collect the primary data for the study. The purpose of the questionnaire was to gather data on socioeconomic indicators, including years of experience, years of farming, and size of farm, membership in cooperatives, age, gender, marital status, education level, and so forth. To achieve the study's aims, input-output data were acquired, including the quantity and cost of rice as well as the amount and cost of other inputs employed in rice growing. There are both closed-ended and open-ended questions on the survey. Nonetheless, secondary material was obtained via textbooks, journal papers, online searches, other documented reports and publications, and applicable investigations.
Sampling Techniques and Sample Size
The study focused on the Kwara State rice farmers as a demographic group. A three-stage selection technique was utilized to identify 151 respondents who gave the data for this study to produce a representative sample for the research. Two local government areas in Kwara State that produced rice were purposely picked for the first phase. Ten (10) villages were selected at random from the two local government regions for the second stage. To produce a sample of 151 rice farmers overall for the third stage, 151 rice farmers were randomly picked from the two villages. Table 1 gives the summary.
Analytical Techniques/Method of Analysis
Data obtained were assessed using different analytical procedures according to the goals of the investigation. These approaches include descriptive statistical analysis, sigma scoring system, binary logit regression, ordinary least square regression and Likert-type scale.
Descriptive Statistics
Frequency distribution tables and measures of central tendency, such as mean, measure of dispersion, and percentage, are examples of the descriptive statistical studies that were employed. These were used to identify the digital technologies deployed by the rice farmers in the study region and to explain and illustrate the findings of the socioeconomic characteristics of the respondents.
Sigma Scoring Method
The level of adoption of digital technologies at the farm level among rice farmers in the research area was evaluated using the Sigma scoring technique. Steps for applying the sigma scoring technique are as follows;
Step 1: Determine the proportion of farmers using the digital technologies: {(Number of farmers utilizing digital technologies / Total responders) ×100} = A%
Step 2: Take the percentage (A%), divide it by two, and deduct the result from 100. 100 – (A% / 2) = B%.
Step 3: Get the sigma distance (X), by checking B% in the statistical table of normal deviates.
Step 4: Add a constant figure of two (2) to the value of the sigma distance and multiply the result by the same constant. (X + 2) * 2 = Y
Step 5: The correct sigma score would be 10 minus the outcome (Y), as the sigma technique assigns weight on a 10-point scale in the reverse direction. 10 – Y = Z
Decision rule: The adoption of digital technology was judged to be at a low level if the mean score (Z) was less than 5.
Logit Regression
The factors influencing the utilization of digital technologies by rice farmers in the research area were analyzed using logit regression. Using logistic regression techniques, it is possible to forecast whether rice farmers will employ digital technology based on the independent parameters in the model. This shows up as
where: Pi = is the probability that the event occurs to an individual with a given set of attributes, Xi
Qi = β0 + βiXi
Li = (Pi / [1 - Pi]) = β0 + βiXi
β0 = is the intercept or constant;
βi = is the vector of coefficients of the vector of covariates or coefficients, Xi
Li = logit; Pi /1 - Pi = is the odds ratio of the likelihood that an event will occur.
Xi =Independent/ predictor variables;
Qi = Adoption of digital technologies; 1= adopt, otherwise = 0.
Dependent Variable Q= 1 for usage of digital technologies for rice production and 0 otherwise
The independent/ predictor variables are;
- ➢
- X1 = Farmers' age (years);
- ➢
- X2 = Income (Naira)
- ➢
- X3 = Access to credit (1= access and 0 otherwise)
- ➢
- X4 = Level of education (years)
- ➢
- X5 = Awareness on digital technologies (1= aware and 0 otherwise)
- ➢
- X6 = Size of the household (numbers)
- ➢
- X7 = Years of farming experience
- ➢
- e = error term.
Ordinary Least Square Regression
The effect of digital technologies on the productivity of rice farmers in the research area was explored using Ordinary Least Square regression analysis.
The regression model is: Y= α + β1X1 + β2X2 + ----------- β6X6
- Where Y= Total Factor Productivity: A/TVC (Dependent Variable)
- Where A = Value of Rice output (₦)/farmer
- TVC = Total Variable Cost (₦)
TVC= ∑ PiXi
where Pi= unit price of ith variable input and Xi= quantity of ith variable input.
Independent variables are;
- ➢
- X1= Type of digital technology used(1=mobile base extension, 2= mobile base extension market info, 3= others
- ➢
- X2= Frequency of usage of digital technology in days/week
- ➢
- X3= Purpose of usage of digital technology,(1=rice production, 0=others)
- ➢
- X4 =Age of farmers (Years)
- ➢
- X5= Number of network access/usage per farmer
- ➢
- X6= Educational level of the farmer in years.
Likert Scale Analysis
The constraints preventing rice farmers in the research areas from embracing digital technology were rated using a Likert scale. Using a 4-point rating scale technique, the mean, frequency, and percentage were used. The scoring mechanism for the 4-point rating was as follows:
Strongly agree (SA) = 4
Agree (A) = 3
Disagree (D) = 2
Disagree strongly (SD) =1
Based on a 4-point rating system, the mean score of the respondents was determined as follows:
4 + 3 + 2 + 1 = 10
10/4 = 2.50 the threshold Point.
Variables with mean values of 2.50 and above were regarded as constraints for rice farmers in the research area, with a threshold criterion of 2.50 being employed for decision-making. Conversely, variables with mean values below the 2.50 threshold value were found to be unrelated to rice farming growth in the research area
Limitations of the Study
Limitations observed during this study include the unwillingness of the respondents to give accurate responses to certain questions such as age, access to credit, money earned annually and amount spent on rice farming. Also, the majority of the respondents (farmers) could not offer the necessary measures of the total product generated, the amount spent on call card and internet service(data) monthly, total quantity and cost of inputs(herbicides, pesticides, fertilizers) and the labour employed owing to lack of effective record keeping. Therefore the information offered by the farmers was dependent on memory which is prone to bias on the part of the respondents.
Results and Discussion
Rice Farmers' Socio-Economic Features/Characteristics
Gender, marital status, age, farm size (hectare), size of household, years of schooling, highest level of education attained, cooperative membership, general and rice farming experience, primary occupation, and interactions with extension agents are among the socioeconomic characteristics of the respondents that were analyzed.
According to the findings of the analysis of the respondents' socioeconomic characteristics, which are shown in Table 2, most of the respondents (39.74%) are between the ages of 20 and 30, with an average age of 36. This suggests that a sizable portion of respondents in their middle years were engaged in the rice farming. Furthermore, since men made up the vast majority of responses (99.34%), it suggested that males dominated rice farming. According to research by Chekene and Chancellor (2015), most of Nigeria's rice growers are men. A whopping 82.12% of respondents were married, this is congruent with study by Henri-Ukoha et al., (2015) which indicated that married adults participate largely in farming-related activities. This likely explains why children were available for domestic employment. The prevalence of married farmers among the respondents may be linked to the desire to care for their families. The main source of family labour is the size of the household. The median home size is 6-10 persons, or 45.70 percent of all homes, whereas the mean household size is 7 people. This makes it possible for everyone in the family to help with the rice farming. Rice production relies significantly on family labour because it eliminates the need for paid labour. Also, using family labour improves the adoption of agriculture technologies (Ehiak-por et al., 2019). The statistics also stated that 98% of the respondents had at least elementary or adult education (formal education) with the majority (60%) having a university education as the highest degree of education. 30.46% had secondary and 7% had an elementary education and had their highest degree of schooling. With an average formal education year of 13.34 years, it shows that most rice farmers are well-educated and possess a high level of comprehension regarding the problems involved with information transmission utilizing mobile phones. This confirms study by Kolawole et al. (2012), which revealed that farmers' literacy enhances the pace at which new technology is implemented. Thus, the tendency of rice farmers in Kwara State to go for strategies that boost rice yield while minimizing their harmful effects on the environment may be impacted by education and knowledge.
Many people (97.35%) work largely as farmers, and 2.65% are employed by the government. This means that the great majority of the farmers rely considerably on farming as their main source of income. Among those surveyed, 88.74% had been farmers for ten years or more. Of the respondents, 63.58% had between 10 and 20 years of experience farming rice, and 21.85% had more than 20 years. The average amount of years spent farming rice is 17.43. The farmers' enormous experience in rice farming is evidenced by this, which could increase their managerial abilities, raise rice yields, and speed the adoption of new technologies. The degree of productivity on farms can be enhanced by the experienced farmers (Adeagbo et al., 2021). When the farm size was computed in hectares, the majority of rice farmers (54.30%) planted between 6-10 hectares of land. This shows that the rice farmers were small to medium-sized farmers. This is consistent with Sodiya and Oyediran's (2014) findings that the majority of Nigerian rural farmers live subsistence-level lives.
Moreover, roughly 55.63% of rice farmers joined cooperative groups, which allowed them to acquire many advantages like as access to funding and input procurement for their rice farming. Because it allows farmers to exchange information, Ogunleye et al., (2021) reported that membership in a farmers' cooperative or association is a type of social capital. Additionally, 46 respondents, or 30.46% of the rice farmers, reported not communicating with extension agents during the previous growing season. Sixty-five respondents, or 69.54% of the sample, reported interacting with extension agents at least once during the most recent farming season. Most of the participants had encounters with extension agents during the previous farming season. Communication with extension agents and access to timely information helps in the adjustment of farming practices which can in turn improve their productivity.
Digital Technologies Used by Rice Farmers and How It Is Used
Table 3 shows the various digital technologies that rice farmers employ during the production process.
Findings from the survey result most of the respondents 147 (97.35%) had mobile phones. The outcomes of the investigation were similar to prior studies. According to Nzonzo and Mogambi's (2016) study, mobile phones (45.8%) were determined to be the most helpful ICT among rice farmers, followed by radio (26.0%), mobile phones/TV/mobile phones (20.8%), and PCs and the Internet (7.3%). The internet, cell phones, radio, and television were deemed to be the most essential methods of communication for providing farmers with knowledge and information about agriculture (Chhachhar et al., 2014). The most dependable sources of agricultural information and innovation for smallholders, according to Sennuga et al.'s (2020) study, are television, radio, and mobile phones. According to figures from Okoedo-Okojie and Omoregbee (2012), farmers only have access to and regular use of GSM, but they use PCs, email, and the internet sparingly or not at all. All the respondents had a phone (100%) and the majority (126) of the farmers representing 83.44% have been using a phone for more than 5 years. But about 97% used it in the process of rice production. The types of mobile phones used include; android, common phones and iPhone.

Table 4.
Mobile phones used by rice farmers.
| Types of mobile phones used | Frequency | Percentage |
|---|---|---|
| Android | 65 | 43.05 |
| Common phones | 51 | 33.77 |
| Android & common phones | 34 | 22.52 |
| Android & I-phone | 1 | 0.66 |
| Total | 151 | 100 |
Source: Field survey, 2024.
The most used is the Android phones followed by common phones and iPhone, indicating that a greater proportion of the respondents 100, representing (66.23%) had access to internet connectivity with majorly two networks.
Table 5.
Years of mobile phone usage .
| Years of mobile phone usage(Years) | Frequency | Percentage | Mean |
|---|---|---|---|
| 1-5 | 25 | 16.56 | 11.33 years |
| 6-10 | 67 | 44.37 | |
| 11-15 | 36 | 23.84 | |
| >15 | 23 | 15.23 | |
| Total | 151 | 100 |
Source: Field survey, 2024.
16.56% of the respondents had been using phones for around 1-5 years, 44.37% of the rice farmers had been using phones for around 6-10 years, and 39.07% had been using phones for over 10 years. On average, the rice farmers had been using mobile phones for 11.33 years. This shows that the farmers have been using mobile phones for an extended period.
81 respondents representing 53.65% were spending between 1000-2,000 naira monthly on internet services alone, while thirteen (13) respondents representing 8.61% were spending less than #1,000 monthly on internet services alone and six (6) respondents representing 3.97% were spending greater than #2,000 monthly on the internet alone. The majority of the rice farmers with an internet connection (83%) participate in 3G internet service, 16% engage in 4G, hardly 1% engage in E-internet service and most of them (96%) utilize their online service daily. However, few exploited their internet connectivity in the process of rice farming.
A considerable percentage of the rice farmers employed their cell phones for calling and mobile SMS. Majority of farmers searched for information with their mobile phones on pest and disease control, weather forecast, rice varieties to plant, when to plant and how, agrochemicals and fertilizer, availability of agricultural inputs, credit facilities, market information, weed control measures, irrigation methods and new cultivation methods. Malsha et al. (2011) asserted in their study that the majority of farmers used ICT tools to get information about new growing techniques, agrochemicals, and pest and disease management. Additionally, Nzonzo and Mogambi (2016) noted in their study that information and communication technologies (ICTs) i.e. mobile phones, televisions, radios, the Internet, and computers, were utilized to gather data on the varieties of paddy seed that were available, the cost of the seed and packaged rice, pests and diseases that affect paddy and the necessary control measures, planting and management techniques, market research on paddy production, and more. More so, 70.20% of the respondents employed their mobile phones to interact with extension agents and a considerable number of them (88.68%) had been utilizing it for over four years. 94.04% utilized their mobile phone for marketing. 89.44% of them have been using it for over four years and 98.01% used their cell phone to engage with their fellow farmers. Some of the farmers also employed other tools such as PCs, tablets and laptops to interact with extension agents (6.62%), other farmers (7.95%) and buyers (7.95%).
Farm Level of Adoption and Uptake of Digital Technologies (N=151)
The findings reported in Table 6 demonstrate that a remarkable level of mobile phone usage was discovered among the rice farmers within the studied region. Computers, tablets and drones have a limited degree of adoption since the adoption score is not greater than 5. The finding can be attributable to the high degree of awareness about mobile phone usage for agricultural activities among rice farmers. Consistently, every time a new technology is embraced, awareness comes before the technology itself. Since awareness and knowledge of improved agricultural technologies piques interest in fresh concepts and techniques, it is particularly vital. It also facilitates the adoption of newer technologies by helping farmers identify them and learning how to employ them successfully. These results corroborate the research of Mwangi & Kariuk (2015), who hypothesized that farmers would only accept technology that they are familiar with or have been informed about. Agbamu (2006) noted that one of the primary criteria for the greater adoption of agricultural technologies is the delivery of high-quality information. The widespread usage of mobile phones may also be related to greater access to extension agents, who may advise people about their availability, as well as the advantages and successful implementation of improved technologies.
Determinant of Digital Technology Usage Among Rice Farmers (N=151)
Findings from the logit regression model used to evaluate the factors influencing rice farmers' usage of digital technology are provided in Table 7. Age, family size, access to funding, expertise and rice farming experience, of the respondent substantially affect the option to apply digital technology.
At the 1% probability level, age showed a negative significant influence. When all other characteristics stay unchanged, a farmer's likelihood of utilizing digital technology drops by 0.177 for every unit increase in age. This validates the intuitive assumption that younger farmers are more eager to utilize digital technologies in the process of rice farming operations. This could be related to the fact that younger farmers, that is, the youth, know more about how to operate these tools than the older farmers. The results of Masuka et al. (2016), who discovered that younger farmers employed mobile technology more frequently than their older counterparts (p < 0.05), are consistent with this. The generation in which improved technologies are introduced and that accepts new technology tends to grasp them better. Accor ding to Oladimeji et al. (2013), labor productivity is proportional to age when all other parameters are maintained constant. Oladimeji et al. (2013), also stated that there was a presumption that younger individuals were more receptive to accepting new technology to enhance productivity, but elderly people tended to cling steadfastly to traditional production procedures. Similarly, it was discovered that household size was significant and negative at the 5% probability level. This shows that an increase in the number of households would result in a 0.408 decline in the likelihood that farmers would adopt digital technologies. The negative coefficient might be attributable to the fact that the farmers had a lot of dependents to feed; hence, less money is left to be employed to buy digital technologies (mobile phones).
Access to funding was considerable at 5% and favourably connected to farmers’ probability for digital technology use. The data reveals that farmers growing rice who could obtain financing were 10 times more likely to accept digital technology compared to those who did not have credit, as demonstrated by the odd ratio of 10.346%. This research correlates with the findings of Mohammed & Temu (2008), who discovered that financial accessibility has been proven to boost the adoption of new technologies.
Awareness of digital technology was positively significant at 1% suggesting a favourable correlation with adoption and usage of digital technologies. Those who have an awareness of the existence of digital technology were 8.4 times more likely to accept the utilization of digital technology than those who do not. Rice farming experience demonstrated a positive significant at 5%, meaning an increase of one unit in rice farming experience enhanced the likelihood of adopting digital technology usage by a factor of 1.16.
Effect of Digital Technologies on the Productivity of Rice Farmers (N=151)
Table 8.
Effect of digital technologies on rice Farmers’ productivity.
|
Variable Y= Total Factor productivity |
Co-efficient | p-value |
|---|---|---|
| Age(years) | -0.031 | 0.111 |
| Level of education(years of schooling) | -0.029 | 0.525 |
| Purpose of usage of digital technologies | 1.923*** | 0.001 |
| Number of network usage | -0.296 | 0.108 |
| Frequency of usage of digital technologies | 1.256** | 0.014 |
| Access to extension agents | 1.400** | 0.011 |
| Constant | 5.092 | 0.000 |
| R- square | 0.5451 | |
| Adjusted R- square | 0.5262 | |
| F- value | 28.76 | 0.000 |
Note: *** and ** represent significance at 1% and 5% respectively. Source: Field survey, 2024.
The outcome of the regression model revealed that the R-square was 0.5451 which meant that that the independent variables accounted for 54.5% of the variation in the total factor productivity levels of the rice farmers. It was obvious that the model was well-fitting since the F-statistic was significant at the 1% level of significance, showing that the independent variables' combined effects were relevant in explaining the dependent variable. Key variables affecting the productivity of the rice farmers were the purpose of use of digital technologies, frequency of use and communication with extension agents via the use of these digital technologies (i.e. mobile phones) for receiving and delivering information.
The purpose of usage was positively significant at 1% probability level. According to this, farmers who used digital technology for the purpose of rice production, had a productivity rise of 1.923 percent, ceteris paribus, over those who do not. Productivity was positively connected with the frequency of digital technology use, which was significant at the 5% probability level. This suggests that the productivity of farmers who employed their digital technology more regularly i.e. every day in the process of rice cultivation was 1.256 more than those who used it seldomly.
The coefficient of communication with extension agents via the usage of mobile phones was significant at 5% and positively linked to productivity. This implies that farmers who utilized their cell phones to engage with extension agents on rice farming were more productive than those who do not. The total factor production was not significantly affected by age, years of schooling and the number of network access. The study of Khatun & Haider (2016), further implies that there is a potential for further increase in productivity by purposeful manipulation of technology adoption levels in different phases of agricultural production. Also, Ali et al. (2016), discovered there was a favourable influence of ICTs on agricultural productivity.
Constraints to Rice Farmers’ Ultilization of Digital Technologies
Table 9.
Constraints to rice farmer utilization of digital technologies in the study area.
| Constraints | Strongly Disagree | Disagree | Agree | Strongly Agree | Mean | Rank |
|---|---|---|---|---|---|---|
| Little or no internet network access | 0(0.00) | 33(21.85) | 93(61.59) | 25(16.56) | 2.95 | 1st |
| Inadequate power supply | 1(0.66) | 32(21.19) | 93(61.59) | 25(16.56) | 2.94 | 2nd |
| Poor access to credit | 2(1.32) | 41(27.15) | 99(65.56) | 9(5.96) | 2.76 | 3rd |
| High cost of mobile phones | 3(1.99) | 50(33.11) | 82(54.30) | 16(10.60) | 2.74 | 4th |
| Poor access to extension agent | 1(0.66) | 116(76.82) | 30(19.87) | 4(2.65) | 2.25 | 5th |
| Lack of literacy | 3(1.99) | 133(88.08) | 14(9.27) | 1(0.66) | 2.09 | 6th |
Source: Field survey, 2024. Values in parentheses are percentages.
The challenges that rice farmers in the research area face when utilizing digital technologies are shown in the table above. The result showed that little or no network access is ranked 1st with a mean of 2.95, inadequate power supply is ranked 2nd with a mean of 2.94, poor access to credit is ranked 3rd with a mean of 2.76, high mobile phones cost is ranked 4th with mean of 2.74, poor access to extension agent is ranked 5th with a mean of 2.25, lack of literacy is ranked 6th with a mean of 2.09.
As graded using the mean, the survey findings suggested that the main impediments to rice farmers’ usage of digital technologies were little or no network connection, inadequate power supply, poor access to funding, high cost of mobile phones, poor access to extension agents and lack of literacy. These findings corroborate past studies. According to Mwakaje (2010), a substantial portion of respondents (68%) said they lacked the funds to purchase ICT services or facilities, as well as to cover associated operating costs (8.5%), while 4% admitted they were ignorant on how to use ICTs. In a similar vein, Kituyi-Kwake and Adigun's (2008) study revealed that expensive services accounted for 32.0% of the barriers to ICT adoption. A research on ICT adoption and its effect on Sri Lankan agriculture was performed by Jayathilake et al. (2008) Their investigation's findings showed that the cost of technology is by far the largest impediment hindering the usage of ICTs in agriculture. Another obstacle preventing its implementation is farmers' incapacity and lack of training in using ICTs. According to Mwakaje (2010), a large percentage of respondents (68%) claimed they lacked the resources to purchase ICT services or facilities, as well as to cover associated running costs (8.5%), while 4% admitted they were uninformed on how to use ICTs. In a similar vein, Kituyi-Kwake and Adigun's (2008) study found that pricy services accounted for 32.0% of the hurdles to ICT adoption. An inquiry into ICT adoption and its implications on Sri Lankan agriculture was performed by Jayathilake et al. (2008). Their investigation's findings showed that the expense of technology is by far the largest impediment hindering the employment of ICTs in agriculture. The second obstacle preventing its implementation is farmers' incapacity and lack of training in using ICTs. Additionally, Musa et al. (2012) indicated that 50.8% of farmers had little to no access to energy (either solar or the grid), which made it difficult for them to use ICTs. This discovery was based on the restrictions associated with poor infrastructure support.
Summary, Conclusion and Recommendations
Summary of the Major Findings
This study looked at how digital technology affects Nigeria's Kwara State rice farmers' production. 151 rice farmers were sampled in three stages using a structured questionnaire to obtain primary data. Descriptive statistics, the sigma scoring method, the logit regression model, ordinary least square regression, and the Likert-type scale were used to analyze the data. Based on the study's findings, approximately 74.17% of the respondents were within the middle-aged (20–40 years old) category, with an average age of 35. 99.34% were males and 59.60% had a tertiary degree of education. The usual household size was 6-10 with around 82.12% being married. Also, 97% of participants work as farmers and this represents their primary occupation. Most of them are small- to medium-sized farmers with 5–10 hectares of land. The average rice farming experience is 17 years and 55.63% belong to at least one cooperative or farm organization.
With a high acceptance level of sigma score of 5.94, it concluded that the mobile phone was the most extensively utilized digital tools among farmers. The adoption of digital technology by rice farmers was substantially influenced by various criteria, including their age (p<0.01), level of digital awareness (p<0.01), family size (p<0.05), access to finance (p<0.05), and expertise in rice farming (p<0.05). Further study indicated that the aim of digital technology use, frequency of use and the use of mobile phones in communicating with extension agents had a beneficial statistically significant impact on the rice output of farmers. The challenges to rice farmer’s adoption of digital technology include inadequate network connection, insufficient power supply, poor access to funding, expensive cost of mobile phones, little access to extension agents and poor literacy level.
Conclusions
The research indicated that rice farmers’ digital technology adoption was largely mobile phones and it has a favourable effect on their productivity. The usefulness of mobile phone usage has been impeded by inadequate access to network, insufficient power supply, low access to money, high cost of mobile phones, poor access to extension agents and lack of literacy.
Recommendations
The following suggestions were provided in light of the research's findings:
- Since digital technologies (purpose of usage and frequency of usage) had a statistically positive effect on productivity, there is a need for a targeted enlightenment campaign among farmers on the uses and benefits of engaging digital technologies for enhanced productivity.
- The Nigerian Government and development partners should create an enabling environment and improved digital rural infrastructure to enhance farmers’ adoption of digital technologies.
- For farmers to use digital technology to access modern information sources, the government should create credit facilities
References
- Abbas, A.M.; Agada, I.G.; Kolade, O. Impacts of rice importation on Nigeria’s economy. Journal of Scientific Agriculture 2018, 2, 71–75. [Google Scholar] [CrossRef]
- Adeagbo, O.A.; Ojo, T.O.; Adetoro, A.A. Understanding the determinants of climate change adaptation strategies among smallholder maize farmers in South-west, Nigeria. Heliyon 2021, 7, e06231. [Google Scholar] [CrossRef]
- Adeoti, A.I.; Coster, A.S.; Akanni, T.A. Analysis of farmers’ vulnerability, perception and adaptation to climate change in Kwara State, Nigeria. International Journal of Climate Research 2016, 1, 1–16. [Google Scholar]
- African Development Bank. Nigeria: Country Food and Agriculture Delivery Compact. 2023. Available online: https://www.afdb.org/en/documents/nigeria-country-food-and-agriculture-delivery-compact.
- Agbamu, J. U Essentials of Agricultural Communication in Nigeria; Malthouse Press Limited: Lagos, 2006; pp. 34–56. [Google Scholar]
- Ali, S.; Jabeen, U.A.; Nikhitha, M. Impact of ICTs on agricultural productivity. European Journal of Business, Economics and Accountancy 2016, 4. [Google Scholar]
- Arunachalam, D.; Kumar, N.; Kawalek, J.P. Understanding big data analytics capabilities in supply chain management: Unravelling the issues, challenges and implications for practice. Transportation Research Part E: Logistics and Transportation Review 2018, 114, 416–436. [Google Scholar] [CrossRef]
- Ayinde, O.E.; Fatigun, O.; Ogunbiyi, K.; Ayinde, K.; Ambali, Y.O. Assessment of Central Bank Intervention on Rice Production in Kwara State, Nigeria: A Case-study of Anchor Borrower’s Program. In Proceedings of the 2018 Conference, Vancouver, British Columbia, 28 July 28--2 August 2018; International Association of Agricultural Economists, 277429. 2018. [Google Scholar]
- Babatunde, R.O.; Omotosho, O.A.; Sholotan, O.S. Socio–economic characteristics and food security status of farming households in Kwara State, North-Central, Nigeria. Pakistan Journal of Nutrition 2007, 6, 49–58. [Google Scholar]
- Baumüller, H. Facilitating agricultural technology adoption among the poor: The role of service delivery through mobile phones; ZEF Working Paper Series, No. 93; University of Bonn, Center for Development Research (ZEF): Bonn, 2012. [Google Scholar]
- Baumüller, H. Towards smart farming? Mobile technology trends and their potential for developing country agriculture. In Handbook on ICT in Developing Countries; Skouby, K.E., Williams, I., Gyamfi, A., Eds.; River Publishers: Delft, 2017. [Google Scholar]
- Baumüller, H. The Little We Know: An Exploratory Literature Review on the Utility of Mobile Phone-Enabled Services for Smallholder Farmers. Journal of International Development 2018, 30, 134–154. [Google Scholar] [CrossRef]
- Chekene, M.B.; Chancellor, T.S.B. Factors Affecting the Adoption of Improved Rice Varieties in Borno State, Nigeria. J. Agric. Ext 2015, 19, 21–33. [Google Scholar] [CrossRef]
- Chhachhar, A.R.; Qureshi, B.; Khushk, G.M.; Ahmed, S. Impact of Information and Communication Technologies in Agricultural Development. Journal of Basic and Applied Scientific Research 2014, 4, 281–288. [Google Scholar]
- Ehiakpor, D.S.; Danso-Abbeam, G.; Dagunga, G.; Ayambila, S.N. Impact of Zai technology on farmers’ welfare: Evidence from northern Ghana. Technology in Society 2019, 59, 101189. [Google Scholar] [CrossRef]
- Eitzinger, A.; Cock, J.; Atzmanstorfer, K.; Binder, C.R.; Läderach, P.; Bonilla-Findji, O.; Bartling, M.; Mwongera, C.; Zurita, L.; Jarvis, A. GeoFarmer: A monitoring and feedback system for agricultural development projects. Computers and Electronics in Agriculture 2019, 158, 109–121. [Google Scholar] [CrossRef] [PubMed]
- Federal Ministry of Agriculture and Rural Development (FMARD). The Agricultural Promotion Policy (2016-2020): Building on the Successes of the ATA, Closing Key Gaps. Federal Government of Nigeria Policy and Strategy Document. 2016.
- Firouzi, S. Effect of Pre-Milling on Milled Rice Breakage – A Review. Thai Journal of Agricultural Science 2014, 47, 241–250. [Google Scholar]
- Food and Agriculture Organization. Digital Technologies in Agriculture and Rural Areas. 2018.
- Henri-Ukoha, A.; Anaeto, F.C.; Chikezie, C.; Ibeagwa, O.B.; Oshaji, L.I.; Ukoha, I.O.; Anyiam, K.H. Analysis of cassava value chain in Ideato south local government area, Imo State, South-East, Nigeria. International Journal of Life Sciences 2015, 4, 209–215. [Google Scholar]
- Jayathilake, H.A.C.K.; Jayaweera, B.P.A.; Waidyasekera, E.C.S. ICTs Adoption and Its’ Implications for Agriculture in Sri Lanka. Journal of Food and Agriculture 2008, 1, 54–63. [Google Scholar] [CrossRef]
- Khatun, F.; Haider, M.Z. Impact of Technology Adoption on Agricultural Productivity. Journal of Agriculture and Crops 2016, 2, 87–93. [Google Scholar]
- Kituyi-Kwake, A.; Adigun, M.O. Analyzing ICTs use and access amongst rural women in Kenya. International Journal of Education and Development using Information and Communication Technology 2008, 4, 127–147. [Google Scholar]
- Kolawole, A.; Oladele, O.I.; Alarima, C.I.; Wakatsuki, T. Farmers’ Perception of Sawah Rice Production Technology in Nigeria. J. Hum. Ecol 2012, 37, 13–17. [Google Scholar] [CrossRef]
- Kwara State Agricultural Development Project (KWADP), Ilorin, Nigeria, 2007.
- Malsha, A.P.S.; Jayasinghe, A.P.R.; Wijeratne, M. Effect of ICT on Agricultural Production A Sri Lankan Case Study. Joint National Conference on Information Technology in Agriculture 2011. [Google Scholar]
- Masuka, B.; Matenda, T.; Chipomho, J.; Mapope, N.; Mupeti, S.; Tatsvarei, S.; Ngezimana, W. Mobile phone use by small-scale farmers: a potential to transform production and marketing in Zimbabwe. S. Afr. J. Agric. Ext. 2016, 44, 121–135. [Google Scholar] [CrossRef]
- Matanmi, B.M.; Adesiji, G.B.; Owawusi, W.O.; Oladipo, F.O. Perceived factors limiting rice production in Patigi local government area of Kwara State, Nigeria. Journal of Agricultural and Social Research (JASR) 2011, 11, 40–45. [Google Scholar]
- Mohamed, K.; Temu, A. Access to credit and its effect on the adoption of agricultural technologies: The case of Zanzibar. In African Review of Money Finance and Banking; 2008; pp. 45–89. [Google Scholar]
- Musa, N.S.; Githeko, J.M.; El-siddig, K. The adoption and use of ICTS by small-scale farmers in Gezira State, Sudan. In Research Application Summary; 2012; pp. 625–633. [Google Scholar]
- Mwakaje, A.G. Information and Communication Technology for Rural Farmers Market Access in Tanzania. Journal of information Technology Impact 2010, 10, 111–128. [Google Scholar]
- Mwangi, M.; Kariuk, S. Factors Determining Adoption of New Agricultural Technology by Smallholder Farmers in Developing Countries. Journal of Economics and Sustainable Development 2015, 6. [Google Scholar]
- Nakasone, E.; Torero, M. A text message away: ICTs as a tool to improve food security. Agricultural Economics (United Kingdom) 2016, 47, 49–59. [Google Scholar] [CrossRef]
- National Bureau of Statistics. Nigerian Gross Domestic Product Report; 2023; p. 2023. [Google Scholar]
- Nzonzo, D.; Mogambi, H. Analysis of Communication and Information Communication Technologies Adoption in Irrigated Rice Production in Mwea Irrigation Scheme, Kenya. International Journal of Education and Research 2016, 4. [Google Scholar]
- Ogunleye, M.T.; Bodunde, J.G.; Makinde, E.A.; Sobukola, O.P.; Shobo, B.A. Fertilizer type and harvest maturity index on nutritive content and proximate composition of tomato fruit. International Journal of Vegetable Science 2021, 27, 505–512. [Google Scholar] [CrossRef]
- Okoedo-Okojie, D.U.; Omoregbee, F.E. Determinants of Access and Farmers’ use of Information and Communication Technologies (1CTs) in Edo State, Nigeria. J. Appl. Sci. Environ. Manage 2012, 16, 41–44. [Google Scholar]
- Olabode, O. Smart card identification management over a distributed database model. Journal of Computer Science 2011, 7, 1770. [Google Scholar] [CrossRef]
- Oladimeji, Y.U.; Abdulsalam, Z.; Abdullahi, A.N. Determinants of participation of rural farm households in non-farm activities in Kwara state, Nigeria: A paradigm of poverty alleviation. Ethiopian Journal of Environmental Studies and Management 2015, 8, 635–649. [Google Scholar] [CrossRef]
- Oladimeji, Y.U.; Abdulsalam, Z.; Damisa, M.A.; Omokore, D.F. Estimating the determinants of poverty among artisanal fishing households in Edu and Moro local government areas of Kwara State, Nigeria. Agriculture and Biology Journal of North America 2013. [Google Scholar] [CrossRef]
- Olanrewaju, R.M. Climate and the growth cycle of yam plant in the Guinea Savannah Ecological Zone of Kwara State, Nigeria. Journal of Meteorological and Climate Science 2009, 7, 43–48. [Google Scholar]
- Omotesho, K.; Akinrinde, F.A.; Adenike, A.J.; and Awoyemi, A.O. Analysis of the Use of Information Communication Technologies in Fish Farming In Kwara State, Nigeria. Journal of Agribusiness and Rural Development 2019, 54, 327–334. [Google Scholar] [CrossRef]
- Opeyemi, G.; Adedeji, S.O.; Komolafe, S.E.; Arotiba, K.; Ifabiyi, J.O. Consumers’ Beliefs And Behaviours Influencing The Patronage And Consumption Of Locally Produced And Imported Rice In Niger State, Nigeria. Nigerian Journal of Agriculture, Food and Environment's 2015. [Google Scholar]
- Premium Times. Nigeria spends $2.41b on rice importation in 3 years–Emefiele. 2015. Available online: www.premiumtimesng.com/business/187406-nigeria-spends-2-4bn-on-rice-importation-in-3-years-emefiele.html.
- Saito, K.; Senthilkumar, K.; Dossou-Yovo, E.R.; Ali, I.; Johnson, J.-M.; Mujawamariya, G.; Rodenburg, J. Status quo and challenges of rice production in sub-Saharan Africa. Plant Production Science 2023, 26, 320–333. [Google Scholar] [CrossRef]
- Samuel, M. Mobile Phone Use by Zimbabwean Smallholder Farmers: A Baseline Study. The African Journal of Information and Communication 2018, 29–52. [Google Scholar] [CrossRef]
- Sennuga, S.O.; Conway, J.S.; Sennuga, M.A. Impact of Information and Communication technologies (ICTS) on Agricultural Productivity among smallholder farmers: Evidence from Sub-Saharan African Communities. International Journal of Agricultural Extension and Rural Development Studies 2020, 7, 27–43. [Google Scholar]
- Smit, L.C.B. Climate change, food security, and livelihoods in sub-Saharan Africa. Regional Environmental Change 2016, 385–399. [Google Scholar] [CrossRef]
- Sodiya, C.I.; Oyediran, W.O. Contributions of melon production to livelihood sustainability of rural farming households in Oyo State, Nigeria. Journal of Biology, Agriculture and Healthcare 2014, 4, 8–18. [Google Scholar]
- Tavershima, T.; Kotur, L.N.; Tseaa, E.M. Food Security and Population Growth in Nigeria. Direct Research Journal of Agriculture and Food Science 2022, 10, 176–183. [Google Scholar]
- UNFPA. World Population Dashboard: Nigeria. 2023. Available online: https://www.unfpa.org/data/world-population/NG.
- World Bank. Agriculture Overview. 2023. Available online: https://www.worldbank.org/en/topic/agriculture/overview.
- World Economic Forum. Grow back better? Here’s how digital agriculture could revolutionize rural communities affected by COVID-19. 2020. Available online: https://www.weforum.org/agenda/2020/07/digital-agriculture-technology/.
- World Economic Forum. 3 ways digital technology can be a sustainability game-changer. Davos Agenda. 2022. Available online: https://www.weforum.org/agenda/2022/01/digital-technology-sustainability-strategy/.
Table 1.
An overview of the methods used in sampling.
| LGA | COMMUNITIES | NO OF RESPONDENTS |
|---|---|---|
| Edu | Bokungi | 15 |
| Patidzuru | 15 | |
| Efu Abu | 15 | |
| Ndamaraki | 15 | |
| Takogabi | 16 | |
| Patigi | Lalagi | 15 |
| Sakpefu | 15 | |
| Dzwajiwo | 15 | |
| Godiwa | 15 | |
| Edogi-Kpansanko | 15 | |
| TOTAL = 2 | 10 | 151 |
Source: Field Survey, 2024.
Table 2.
Rice farmers' socio-economic features/characteristics.
| Variables | Frequency | Percentage | Mean |
|---|---|---|---|
| Age(years) | |||
| 20-30 | 60 | 39.74 | 35.62 years |
| 31-40 | 52 | 34.43 | |
| 41-50 | 29 | 19.21 | |
| >50 | 10 | 6.62 | |
| Total | 151 | 100.0 | |
| Gender | |||
| Male | 150 | 99.34 | |
| Female Total |
1 151 |
0.66 100.0 |
|
| Marital status | |||
| Married | 124 | 82.12 | |
| Single | 27 | 17.88 | |
| Total | 151 | 100.0 | |
| Educational status | |||
| None formal | 3 | 1.99 | |
| Primary | 10 | 6.62 | |
| Secondary | 46 | 30.46 | |
| Tertiary | 90 | 59.60 | |
| Others | 2 | 1.32 | |
| Total | 151 | 100.0 | |
| Years of schooling | |||
| 0-6 | 17 | 11.26 | 13.34 years |
| 7-12 | 43 | 28.48 | |
| 13-18 | 88 | 58.27 | |
| >18 | 3 | 1.99 | |
| Total | 151 | 100.0 | |
| Household size | |||
| 1-5 | 59 | 39.07 | 7.15 persons |
| 6-10 | 69 | 45.70 | |
| 11-15 | 9 | 5.96 | |
| >15 | 14 | 9.27 | |
| Total | 151 | 100.0 | |
| Primary occupation | |||
| Farming | 147 | 97.35 | |
| Civil servant | 4 | 2.65 | |
| Total | 151 | 100.0 | |
| General farming experience | |||
| <10 | 17 | 11.26 | 18.08 years |
| 10-20 | 95 | 62.91 | |
| >20 | 39 | 25.83 | |
| Rice farming experience | |||
| <10 | 22 | 14.57 | 17.43 years |
| 10-20 | 96 | 63.58 | |
| >20 | 33 | 21.85 | |
| Total | 151 | 100.0 | |
| Farm size(hectares) | |||
| 1-5 | 48 | 31.79 | 7.75 hectares |
| 6-10 | 82 | 54.30 | |
| >10 | 21 | 13.91 | |
| Total | 151 | 100.0 | |
| Farming status | |||
| Full time | 92 | 60.93 | |
| Part time | 59 | 39.07 | |
| Total | 151 | 100.0 | |
| Membership of cooperative | |||
| Yes | 84 | 55.63 | |
| No | 67 | 44.37 | |
| Total | 151 | 100.0 | |
| Contacts with an extension agent | |||
| 0 | 46 | 30.46 | 2.79 times |
| 1-5 | 90 | 59.61 | |
| 6-10 | 12 | 7.94 | |
| >10 | 3 | 1.99 | |
| Total | 151 | 100.0 |
Source: Field Survey, 2024.
Table 3.
Digital technologies used by rice farmers.
| Types of digital technology used | Frequency | Percentage |
|---|---|---|
| Mobile phones | 147 | 97.35 |
| Computers | 3 | 1.99 |
| Tablets | 3 | 1.99 |
| Drones | 0 | 0.00 |
| Total | 151 | 100 |
Source: Field survey, 2024.
Table 6.
Adoption level of digital technologies among the rice farmers.
| Digital technologies | Frequency | Percentage | Sigma Score | Remark |
|---|---|---|---|---|
| Mobile Phones | 147 | 97 | 5.94 | High |
| Computers | 3 | 2 | 1.34 | Low |
| Tablets | 3 | 2 | 1.34 | Low |
| Drones | 0 | 0 | 0.00 | Low |
Source: Field survey, 2024.
Table 7.
Determinant of digital technology usage among rice farmers.
| Variable | Co-efficient | p-value | Odd ratio |
|---|---|---|---|
| Age(years) | -0.177*** | 0.004 | 0.838 |
| Size of households | -0.408** | 0.014 | 0.665 |
| Income from rice farming | -5.270 | 0.969 | 0.999 |
| Access to credit | 2.337** | 0.012 | 10.346 |
| Level of education(years of schooling) | 0.219 | 0.283 | 1.246 |
| Awareness of digital technologies | 2.131*** | 0.008 | 8.423 |
| Farm size | 0.102 | 0.954 | 0.989 |
| Rice farming experience | 0.144** | 0.039 | 1.155 |
| Constant | 2.082 | 0.551 | 8.019 |
| Log likelihood | -26.62227 | ||
| Pseudo R2 | 0.6875 |
Note: *** and ** represent significance at 1% and 5% respectively. Source: Field survey, 2024.
Disclaimer/Publisher’s Note: The statements, opinions and data contained in all publications are solely those of the individual author(s) and contributor(s) and not of MDPI and/or the editor(s). MDPI and/or the editor(s) disclaim responsibility for any injury to people or property resulting from any ideas, methods, instructions or products referred to in the content. |
© 2025 by the authors. Licensee MDPI, Basel, Switzerland. This article is an open access article distributed under the terms and conditions of the Creative Commons Attribution (CC BY) license (http://creativecommons.org/licenses/by/4.0/).
Copyright: This open access article is published under a Creative Commons CC BY 4.0 license, which permit the free download, distribution, and reuse, provided that the author and preprint are cited in any reuse.


