
Submitted:
24 March 2025
Posted:
25 March 2025
You are already at the latest version
Abstract
In the summer of 2022, central and eastern China experienced prolonged extreme high temperatures and severe drought, leading to significant economic losses. This study examines the atmospheric circulation anomalies linked to the drought event and compares the relative contributions of water vapor transport and warm air activity in causing the drought, using two parameters defined in the paper. The results show that: (1) The West Pacific Subtropical High (WPSH) was more intense than usual and extended westward, consistently controlling the Yangtze River Basin. Simultaneously, the polar vortex area was smaller and weaker, the South Asian High area was larger and stronger, and it shifted eastward. These factors collectively led to weakened water vapor transport conditions and prevailing subsiding air currents in the Yangtze River Basin, causing frequent high temperatures. (2) By defining Iq and It to represent the contributions of moisture and temperature to precipitation, we found that the drought event in the Yangtze River Basin was driven by both reduced moisture anomalies in the lower troposphere and higher-than-normal temperatures, with temperature playing a dominant role.
Keywords:
extreme heat drought
; temperature and humidity anomalies
; WPSH
1. Introduction
In the summer of 2022, China experienced an extreme heat and drought event, particularly affecting the Yangtze River Basin and southwestern regions, where temperatures reached their highest levels since 1961. This drought event was characterized by its exceptional intensity, extensive geographic coverage, and prolonged duration[1,2,3,4,5]. It not only underscored the impacts of climate change but also presented new challenges for predicting extreme heat-induced droughts and enhancing disaster prevention strategies. During this period, approximately 76% of meteorological stations across the country recorded high-temperature conditions. The intensity and persistence of the drought were primarily influenced by changes in water vapor transport and temperature anomalies [6,7,8,9,10,].
Previous studies have demonstrated that the interaction between water vapor and temperature plays a crucial role in the development of precipitation anomalies. Anomalous variations in water vapor transport and temperature have frequently acted in tandem during historical drought events, with temperature anomalies often being particularly pronounced in extreme heat-induced droughts [11,12]. During the 2022 extreme heat drought event, the West Pacific Subtropical High (WPSH) exhibited an anomalous westward extension, inhibiting the southward movement of cold air over an extended period. This resulted in the accumulation of heat in the middle and lower reaches of the Yangtze River, thereby exacerbating the persistence of the drought.
It is widely recognized that abnormally low water vapor levels are a key factor in drought formation [13,14,15,16,17]. However, while water vapor plays a critical role in precipitation processes, the decisive factor in precipitation formation is atmospheric saturation. Higher temperatures correspond to increased saturated vapor pressure, making it more difficult for water vapor to reach saturation and condense into liquid water, thereby inhibiting atmospheric precipitation. Consequently, both water vapor and temperature must be considered simultaneously when analyzing precipitation formation.
When assessing the relative importance of water vapor and temperature anomalies in precipitation, their interactions often exhibit significant complexity. Existing quantitative methods, such as the analysis of relative humidity anomalies based on water vapor and temperature variations, provide effective tools for understanding this interplay. For instance, Lu et al. demonstrated that the severe drought in Southwest China during 2009–2010 resulted from the synergistic effects of water vapor and temperature anomalies [18], while the severe drought in the Yangtze River Basin in the spring of 2011 was primarily driven by a substantial reduction in water vapor [19]. These findings highlight that the roles of water vapor and temperature anomalies vary across different drought and flood events [20,21].
By analyzing anomaly deviations in relative humidity and applying a quantitative approach, we can elucidate the respective contributions of temperature and water vapor to precipitation anomalies. This study focuses on the extreme heat drought event of summer 2022 in China and employs the aforementioned method to compare the relative contributions of temperature and water vapor anomalies, which were induced by warm air activity and water vapor transport. This analytical approach enhances our understanding of the mechanisms underlying this extreme weather event and provides a theoretical foundation for improving future disaster prediction efforts.
2. Data and Methods
2.1. Station Observation Data and Reanalysis Data
The data utilized in this study includes daily precipitation records from 2,419 stations across China, provided by the China National Climate Center, spanning the period from 1951 to 2022. In addition, monthly-averaged reanalysis datasets, which encompass global geopotential height, temperature, wind fields, relative humidity, and sea surface temperature, covering the years 1979 to 2022, were obtained from the National Centers for Environmental Prediction/Department of Energy (NCEP/DOE). The reanalysis data have a horizontal resolution of 2.5°×2.5°, and the vertical layers range from 1000 hPa to 10 hPa, comprising 17 levels. The anomalies or departures discussed in this study represent deviations of each meteorological variable relative to the climatological mean of the past 30 years (1991–2020).
2.2. SWAP Index
Lu made a significant conceptual breakthrough by proposing that "drought-flood conditions" should be regarded as an instantaneous state, rather than an average condition over an extended period of time [22]. Building upon this idea, a simple physical model was developed to describe the temporal variation of drought-flood conditions. In this model, both forcing and dissipation terms were introduced to account for the dynamic changes in these conditions. By integrating the governing equation, the final expression for the monitoring index, weighted average precipitation (WAP), was derived:
In this model, Pn represents the daily precipitation on the n-th day preceding the current day, while wn denotes the weight of Pn, with wn = (1 - a)an, where a is the weight parameter that reflects the temporal decay of precipitation. N refers to the number of days considered for the calculation. For large-scale meteorological monitoring, a value of a = 0.9 and N = 44 is typically used.
In subsequent research, Lu applied a normalization transformation to WAP and introduced the standardized WAP, referred to as the SWAP index [23]. Based on the principle of equal distribution probabilities, the transformation equation from WAP to SWAP is expressed as:
In this equation, β > 0 and γ > 0 represent the scale and shape parameters of the Gamma distribution, respectively. Equation (2) can be solved numerically to obtain the SWAP, with maximum likelihood estimation being the commonly employed method for its computation.
2.3. Methods for Comparing the Relative Contributions of Water Vapor and Temperature in Drought and Flood Events
Lu and Takle conducted spatial large sample studies and found a strong positive correlation between precipitation and relative humidity for interannual variations [24]. By establishing the relationship between precipitation and relative humidity, both the effects of water vapor and temperature changes can be simultaneously considered. In this study, indices representing "water vapor change" and "temperature change" are defined separately, with the goal of linearly isolating the variations in water vapor and temperature within the relative humidity changes. This approach facilitates the comparison of the respective contributions of water vapor and temperature changes.
Given the positive correlation between precipitation and relative humidity, precipitation is lower in dry years compared to normal years (Pdry < Pnor), and relative humidity is also reduced in dry years (rdry < rnor). Based on the definition of relative humidity, r is the ratio of the water vapor pressure e to the saturation water vapor pressure es at temperature T, expressed as r = e / es(T). Consequently, the interannual variation of relative humidity, denoted as Cr = rdry / rnor, can be defined as follows:
In this context, Cq representing the variation in water vapor, is defined as Cq = edry / enor, and CT representing the variation in temperature, is expressed as CT = es(Tdry) / es(Tnor). By applying the Clausius-Clapeyron equation (C-C equation), Cq and CT can be expressed as follows:
Here, ,, , . The relative significance of water vapor and temperature anomalies in relation to drought can be assessed by comparing the magnitudes of Cq and CT.
To facilitate comparison, the logarithms of Cq and CT are taken, transforming equation (3) into Ir = Iq + It < 0, where Iq = ln(Cq) and It = ln(CT). The variables Iq and It represent the anomalies in water vapor and temperature, respectively. When Iq < 0, it indicates a water vapor deficit, and when It < 0, it signifies an increase in temperature. Negative values of both Iq and It contribute positively to drought formation. Ir represents the combined effect of both anomalies, and when Ir < 0, it corresponds to a negative anomaly in relative humidity and a decrease in precipitation. Through quantitative analysis, it is possible to isolate the contributions of water vapor and temperature anomalies to the relative humidity anomaly, providing a means to assess the respective impacts of these variables during a drought-flood process.
3. Results and Discussion
3.1. Overview of the Drought Event
Figure 1 presents the percentage anomaly of total summer precipitation in 2022 relative to the average summer precipitation from 1991 to 2020. It is evident that the entire Yangtze River Basin, as well as most of southern China (with the exception of Guangdong), experienced significant negative anomalies. This suggests that both the Yangtze River Basin and a large portion of southern China endured extreme drought conditions during the summer of 2022. Figure 2 illustrates the daily precipitation evolution and SWAP index for the middle and lower reaches of the Yangtze River over the first eight months of 2022, with the climatological mean overlaid for comparison. The figure shows a strong correspondence between the peak values of both precipitation and the SWAP index, indicating that the SWAP trend closely tracks variations in precipitation. This consistency implies that SWAP effectively captures the temporal dynamics of drought evolution and may serve as a valuable tool for real-time assessment of drought severity.
The daily precipitation variation shown in Figure 2a reveals that the first half of 2022 generally experienced wet conditions, with more days of precipitation exceeding the climatological average and substantial rainfall amounts. However, there were also several consecutive periods with little to no precipitation, such as in mid-January, early March, and from early to mid-April. Starting in June, most days exhibited precipitation levels below the climatological average, indicating a transition to relatively dry conditions, although there were still occasional days with rainfall exceeding the climatological mean. Despite scarce precipitation around early August, continuous rainfall during this period brought the region into a near-normal state, characterized by neither extreme dryness nor excessive wetness. However, this condition is not clearly reflected in the daily precipitation graph, as there is no distinct criterion for defining a "normal" state in terms of daily precipitation. The daily precipitation data alone presents challenges in assessing drought conditions and their severity. In contrast, the SWAP index offers a much clearer representation of drought and flood status on a daily basis, with many drought and flood events distinctly captured in the daily SWAP graphs.
As depicted in Figure 2b, converting daily precipitation into the daily SWAP index allows for a straightforward assessment of drought and flood conditions by observing the positive or negative values of the SWAP index. This method enables easy identification of the onset and cessation of flooding and drought events. From the graph, it is apparent that between January and February, the SWAP values fluctuated around zero, indicating normal conditions. From early February to early March, SWAP remained positive, signifying a wet period. This was followed by a brief drought period lasting approximately half a month, after which the region experienced a substantial increase in precipitation. Prior to mid-June, conditions were predominantly very wet. However, by mid- to late June, drought conditions began to emerge, leading to over a month of severe drought. Although there was some improvement around August 1, the region again entered severe drought, which persisted until the end of August. The SWAP index, therefore, provides a more effective and precise means of monitoring drought and wet conditions over time, offering valuable insight into the temporal dynamics of precipitation and the severity of droughts.
3.2. Circulation Anomalies During the Drought Event
Figure 3 and Figure 4 compare the geopotential height fields at the 500 hPa and 300 hPa levels for June to August 2022 with the summer average climatological fields. During the summer of 2022, the WPSH at the 500 hPa level was anomalously stronger than the climatological mean. In June, the WPSH remained in a normal state; however, from July to August, its western ridge extended from the east of 112°E to the west of 90°E, exerting control over the middle and lower reaches of the Yangtze River. This extension of the WPSH placed the region under its high-pressure influence, contributing to the dry conditions. In the mid- to high-latitudes of Eurasia, the height anomaly field exhibited a zonal wave pattern. In July, high-pressure ridges were present near the Ural Mountains and the Sea of Okhotsk, while a low trough formed to the west of Lake Baikal in central Siberia. Behind this trough, smaller troughs fragmented and brought cold air southward, interacting with warm and moist air from the western side of the subtropical high near North China, which facilitated the northward shift of the rainband. In August, a warm high-pressure system over Europe expanded, while the low trough near Lake Baikal shifted eastward, resulting in increased precipitation in the northeastern region of China. Meanwhile, the strengthening and westward extension of the WPSH blocked the southward movement of cold air, causing the Yangtze River Basin to continue experiencing persistent hot and dry conditions. Overall, the circulation anomalies at the 300 hPa level mirrored those at 500 hPa, with anomalous centers at both levels consistently stronger than the climatological mean. The stable warm structure at both levels contributed to the persistence of high temperatures throughout this period. The alignment of these circulation anomalies at different atmospheric levels established a sustained atmospheric pattern that favored prolonged heat and drought conditions in the affected regions.
The formation of drought is primarily governed by moisture conditions, with local variations in moisture largely influenced by the convergence and divergence of moisture flux. Figure 5 illustrates the anomalies of total water vapor flux and divergence from June to August 2022, along with the summer average. In July, as the WPSH expanded westward, the northern regions of China predominantly experienced westerly winds, while the northward winds weakened, resulting in a decrease in the southward transport of moisture from high latitudes. Additionally, the southern trough weakened, and a cyclonic anomaly developed over the Bay of Bengal, with easterly airflows on the northern side of the cyclone inhibiting moisture transport to the western side of the Yangtze River Basin. Concurrently, both the upper and lower layers over the Yangtze River Basin experienced strong subsidence, leading to moisture divergence. This subsidence process hindered the formation of precipitation in the region. In the South China Sea, a cyclonic anomaly prevailed, and the easterly airflows near the southern boundary of the WPSH were positioned far from the Yangtze River Basin, further preventing moisture from reaching the inland areas of China. By August, although southerly winds transported warm and moist air toward the Yangtze River Basin, the anomalous anticyclonic circulation associated with the WPSH accelerated the divergence of moisture above the region, reducing moisture content and increasing solar shortwave radiation reaching the surface, which exacerbated the high temperatures. Simultaneously, the center of subsidence was located near the Yangtze River Basin, inhibiting convective activity. Moreover, the westerly winds at mid to high latitudes hindered the southward movement of cold air, weakening the conditions necessary for the interaction of cold and warm air masses, thus preventing the generation of precipitation. As a result, this combination of atmospheric anomalies and moisture conditions contributed to the prolonged drought in the Yangtze River Basin, coinciding with the most severe phase of the drought during the summer of 2022. The moisture divergence, coupled with reduced precipitation and persistent high temperatures, significantly exacerbated the ongoing drought disaster in the region.
3.3. The Relative Importance of Moisture and Temperature Anomalies in Drought Events
Moisture plays a crucial role in the formation of precipitation; however, the decisive factor for precipitation formation is the level of atmospheric saturation. Therefore, to fully understand precipitation formation, it is essential to consider both moisture and temperature together. Previous studies have established a significant positive correlation between precipitation and relative humidity on an interannual timescale. During the drought event, anomalously high temperatures were observed in the middle to upper troposphere (300 hPa, 500 hPa, and 850 hPa) over the middle and lower Yangtze River Basin (Figure 6b,e,h), consistent with the earlier analysis of the westward extension of the Western Pacific Subtropical High (WPSH). These higher-than-normal temperatures inhibited precipitation formation, and the abnormal reduction in moisture (Figure 6a,d) further obstructed rain development. At the low level (850 hPa) over the Yangtze River Basin, temperatures were in the positive anomaly range (Figure 6h), with the higher temperatures at these lower layers contributing to the onset of drought in the region. However, despite the temperature anomalies, moisture transport at this level appeared anomalously abundant, which had a counteracting effect on the drought. This suggests a complex interaction between temperature and moisture. As temperature and moisture anomalies evolve, relative humidity in the atmosphere may also change. As observed in the third column of Figure 6, the relative humidity in the drought-affected areas was consistently anomalously low at all three levels (300 hPa, 500 hPa, and 850 hPa). In comparison to the anomalies in moisture and temperature, the negative anomalies in relative humidity were more stable in both location and intensity. The persistently low relative humidity inhibited the condensation of moisture into precipitation. The lower-than-normal relative humidity in the Yangtze River Basin during this period was consistent with the reduced precipitation in the region. The anomalously high temperatures in the middle and upper troposphere contributed to the lowering of relative humidity, while the overall moisture deficit further exacerbated the reduction in relative humidity. The combined effects of temperature and moisture anomalies on relative humidity were synergistic, with both factors contributing to the unusually low relative humidity, which, in turn, facilitated the drought. However, specific humidity, temperature, and relative humidity are distinct quantities, and as shown in Figure 6, they cannot be directly compared. To facilitate a more intuitive comparison of the contributions of moisture and temperature anomalies to the formation of the drought, a quantitative and clear comparison method is provided in the subsequent section. This will offer a more direct understanding of how each factor contributed to the drought.
The formation of precipitation is closely linked to atmospheric saturation in the middle troposphere (500-700 hPa), where relatively high relative humidity directly contributes to precipitation. At lower levels (below 850 hPa), a relatively moist atmosphere can also indirectly promote precipitation formation. Through vertical motion, moist and cold air at lower levels can enhance the moisture content and cooling in the condensation layer, thus favoring precipitation. Therefore, relative humidity at different altitudes serves as an indicator of changes in precipitation patterns. In drought conditions, which are typically associated with predominant subsiding air, the air in the upper troposphere can also influence the condensation layer through vertical movement. This vertical influence can modulate the moisture conditions at lower levels and, consequently, affect precipitation.
Historical drought events have demonstrated that severe droughts result from a combination of anomalies in both moisture and temperature, with moisture playing a more significant role. This aligns with the traditional understanding of precipitation formation, where moisture is the primary factor. However, for the 2022 drought event, it is important to acknowledge that without the presence of warm air, the drought would likely have been much less severe, highlighting the significant role of temperature in exacerbating drought conditions.
Figure 7 and Figure 8 depict the distribution of Iq, It, and Ir at various altitudes for July, August, and the summer average of 2022. These figures provide a visual comparison of the contributions of moisture, temperature, and relative humidity to the drought during this period. By selecting specific regions in the Yangtze River Basin, where the drought was particularly severe, the distributions of Iq, It, and Ir for July and August were compared layer by layer. Overall, Ir corresponds with the distribution of relative humidity. When analyzing Iq and It for the study area, it was observed that in July, moisture in the lower and middle layers was relatively high (Iq > 0), which positively influenced precipitation. However, temperatures were higher than normal (It < 0), which hindered precipitation formation. Ir revealed that the effects of moisture and temperature were approximately equal in magnitude, with their opposing effects effectively canceling each other out. As altitude increased, moisture gradually decreased, while temperature remained relatively constant, leading to a reduction in Ir and an increase in the positive influence of drought. During this period, the magnitude of both moisture and temperature anomalies was similar, and their contributions to the drought were approximately equal. In August, although moisture increased at all levels, temperatures also rose sharply. Consequently, the overall Ir decreased compared to July, indicating that in July, the combined effect of higher-than-normal temperatures and reduced moisture dominated the drought. In August, the primary factor behind the lack of precipitation was the unusually high temperatures.
From the summer average distribution (Figure 9), it is evident that the distribution of diagnostic quantities at each altitude exhibits a generally similar pattern. At the 500 hPa level (the condensation layer), the drought region is located at the positive edge of Iq, indicating that moisture is slightly above normal. Consequently, at certain altitudes during the drought, moisture activity did not significantly differ from the climate average. The drought area coincides with the center of negative Ir, where temperatures are clearly higher than normal. In comparison, the absolute value of It is much larger than that of Iq, suggesting that the abnormally high temperatures at many levels can offset the otherwise neutral effects of normal moisture levels on drought formation. This constitutes a relatively rare occurrence. The abnormal warmth in the lower layers at the 850 hPa level plays a dual role. On one hand, the unusually high temperatures enhance evaporation, reducing surface moisture and contributing to drought (primarily due to agricultural and hydrological drought caused by increased evaporation). On the other hand, as noted earlier, the elevated temperatures hinder atmospheric saturation, further promoting drought development. Thus, the primary cause of this drought can be attributed to the persistent abnormal warming across all altitudes, with minimal changes in moisture, which failed to alter the overall trend of drought formation.
To facilitate a more intuitive comparison, vertical profiles of Iq, It, and Ir were plotted for the study area (Figure 10). These profiles clearly demonstrate how Iq and It vary with altitude in the Yangtze-Huai River Basin. In July, Iq was greater than zero in the lower layers, indicating that moisture anomalies contributed positively to precipitation. However, It was negative with a larger magnitude, suggesting that the effect of elevated temperatures offset the potential precipitation increase from moisture. This implies that, while moisture slightly alleviated the drought, the abnormally high temperatures hindered atmospheric moisture from reaching saturation, ultimately inhibiting precipitation. As altitude increased, Iq gradually decreased, indicating that the role of moisture anomalies in exacerbating the drought became more pronounced. Above 700 hPa, Iq was negative, and its magnitude became comparable to that of It, signifying that both factors contributed equally to the drought at these levels. In contrast to July, in August, Iq remained positive below 600 hPa, indicating increased moisture at these levels. However, the intensity of the temperature anomalies was even stronger, with |It| exceeding Iq, resulting in a negative Ir overall. This suggests that, in August, temperature, rather than moisture, was the dominant factor driving the drought. The summer average distribution closely mirrored that of August, with Iq greater than zero below 600 hPa and It less than zero; however, the larger magnitude of |It| resulted in an overall negative Ir. During this extreme drought event, although increased moisture in the lower layers was conducive to precipitation, its impact was relatively limited. In contrast, the abnormally high temperatures across all atmospheric levels had a more severe effect. Consistent with earlier findings, the condensation layer exhibited large absolute values, with the maximum occurring below 850 hPa. The persistently higher-than-normal temperatures in the lower layers played a crucial role in sustaining the drought by enhancing surface evaporation, particularly exacerbating hydrological drought. In conclusion, this drought was primarily driven by abnormally high temperatures at all atmospheric levels, corroborating the analysis presented in previous sections.
3.4. Causes of Intense High Temperature Anomalies
3.4.1. Influence of the WPSH
Prolonged high-temperature drought events are often linked to abnormal atmospheric circulation patterns, particularly the intensity, location, and behavior of the subtropical high and the South Asian high [25,26,27,28,29,30]. Using daily data from the National Climate Center on the area, intensity, ridge line, and westernmost ridge point of the WPSH, the characteristics of the summer subtropical high over the Yangtze River Basin were analyzed (Figure 11). In early June 2022, the area and intensity of the WPSH were smaller than average, with the westernmost ridge point positioned farther east and the ridge line located to the south. During this period, the middle and lower reaches of the Yangtze River had already entered the plum rain season, with precipitation levels being above normal to the south of the Yangtze River. From mid-June to early July, the area, intensity, and westernmost ridge point of the WPSH fluctuated, with the westernmost ridge point generally shifting westward. In this timeframe, the rainfall pattern in the Yangtze River Basin oscillated between periods of higher and lower precipitation, with the overall trend favoring reduced rainfall. From mid-July to the end of August, the average area index of the WPSH was approximately 50 grid points higher than the climatological average, the intensity index was around 250 dagpm higher, and the westernmost ridge point shifted about 17 degrees of longitude farther west. During this period, precipitation in the Yangtze River Basin remained generally below average.
Further analysis was conducted on the 500 hPa geopotential height anomalies and the top-of-atmosphere outgoing longwave radiation (OLR) anomalies during the summer of 2022. In June 2022, the intensity and extent of the WPSH were closely aligned with the climatological average (Figure 12a). During this period, moisture from tropical oceans was transported into the South China region, moving in a northwestward direction. The South China region was influenced by a low-pressure system, which induced stronger convective activity (Figure 12d) and resulted in above-normal precipitation in the region. In July, the WPSH strengthened and extended northwestward. Under the influence of the WPSH, convective activity in both the South China and Yangtze River regions weakened (Figure 12b,e), creating favorable conditions for the high-temperature and drought conditions in central and eastern China. By August, the WPSH continued to strengthen and extend westward, nearly covering the central and southern parts of China. This expansion caused convective activity to decrease significantly (Figure 12c,f), further exacerbating the extreme high-temperature and drought conditions in the region. Therefore, the intensified WPSH during the summer of 2022 was a key factor contributing to the high-temperature and drought climate anomaly in central and eastern China. In particular, the unprecedented WPSH anomalies in August played a critical role in driving many climate indicators of the high-temperature drought event, which broke historical records.
Based on the zonal-averaged wind anomaly vertical profiles (Figure 13), it is evident that in July, under the influence of the WPSH, a pronounced subsiding motion developed over southern China. By August, the Hadley circulation had shifted further northward, with its descending branch positioned near the Jiangnan region (25°–30°N). As subsidence intensified, low-level divergence increased, further suppressing convection in the Yangtze River Basin and inhibiting cloud formation and precipitation. Under this circulation pattern, from July to August, the surface net radiation anomalies exhibited a significant net gain (Figure 13e,f), indicating substantial surface heating across the Yangtze River Basin. The heated surface, in turn, emitted longwave radiation upward, contributing to atmospheric warming. This process played a key role in sustaining the extreme high-temperature conditions in the region during midsummer. The feedback mechanism between subsidence and surface heating was a crucial factor in maintaining the prolonged heatwave, which, in conjunction with suppressed precipitation, led to the severe drought and extreme temperatures observed during this period.
3.4.2. Causes of the Westward Extension of the WPSH
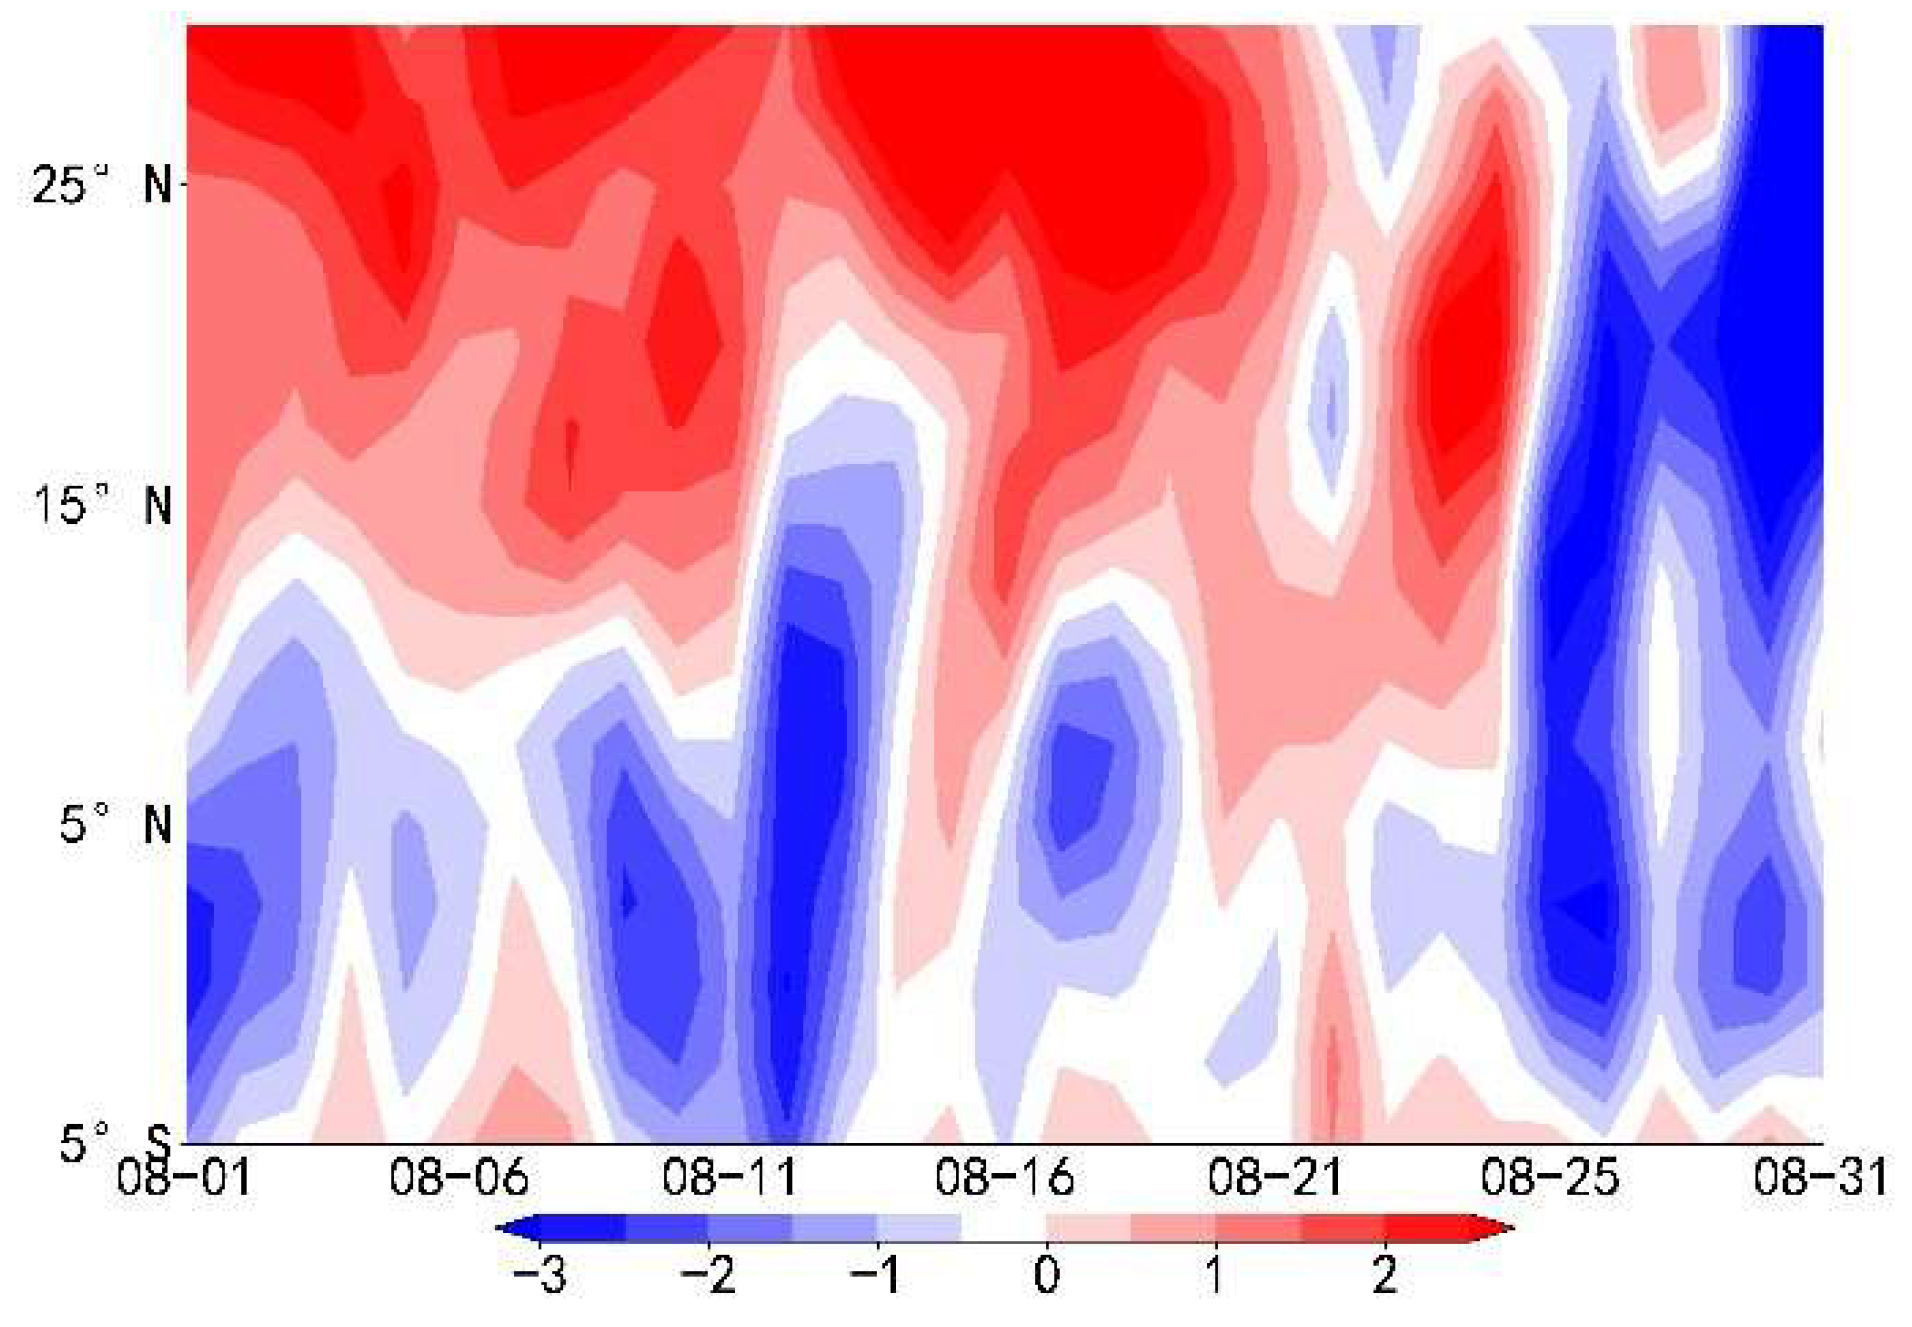
Climatically, the Intertropical Convergence Zone (ITCZ) typically shifts northward to approximately 15°N every August. In August 2022, the ITCZ over the Western Pacific and South China Sea underwent multiple periods of intensification. An analysis of the 850 hPa wind anomaly from August 1 to August 31 (figure omitted) revealed a broad cyclonic wind anomaly west of 120°E in the South China Sea, signifying a sustained intensification of convergence in the region. Figure 14 illustrates the OLR anomalies over the South China Sea and surrounding areas. As shown in Figure 14a, the region from the Bay of Bengal to the South China Sea exhibited a negative OLR anomaly, with centers of negative anomalies located in both the Bay of Bengal and the South China Sea. This suggests that convection in the tropical region was stronger than the climatological average. The convective center in the South China Sea was located farther west and had a larger spatial extent compared to the climatological norm. Figure 14b depicts the temporal variation of the OLR in the key convective region of the South China Sea (7.5°–21°N, 108°–130°E). For most of August, the OLR in this region was lower than the climatological average. Specific periods of low OLR, which corresponded to enhanced convection in the South China Sea, occurred from August 1–4, August 6–10, August 14–19, and August 22–24. As shown in Figure 11, the westward extension of the subtropical high occurred on August 3, 9, 11, 16, 19, and 24. With the exception of the westward extension on August 11, when the OLR anomaly was positive in the South China Sea, the other five westward extension events coincided with negative OLR anomalies in the region, indicating stronger convection. This relationship between the enhanced convection over the South China Sea and the westward extension of the WPSH suggests that intensified convection in this region plays a significant role in triggering the westward expansion of the subtropical high. The stronger convection generates a feedback loop, further strengthening the subtropical high and contributing to its westward expansion.
To further elucidate the intensity variations of the ITCZ, we analyze its convergence characteristics. Figure 15 presents the time-latitude cross-section of meridional wind (V-wind) anomalies averaged over the longitudinal range 108°E–130°E at 850 hPa. During the periods of August 1–12, August 14–21, and August 22–25, the key convective region over the South China Sea experienced three distinct episodes of positive meridional wind anomalies, indicating a strengthening of low-level southerly winds. This signifies the occurrence of monsoon surges over the South China Sea. In conjunction with the intensified southerly winds, the low-level atmosphere over the South China Sea exhibited negative divergence anomalies, suggesting enhanced convergence, while the upper-levels displayed positive divergence anomalies, indicating intensified divergence. This pattern reflects anomalous low-level convergence and high-level divergence, conditions which favor the strengthening of the ITCZ. A comparison with the OLR time series over the South China Sea (Figure 14b) reveals that these three monsoon surge events coincide precisely with periods of reduced OLR, thereby confirming that the surges contributed to the intensification of convection over the region. The abnormally strong ITCZ had a profound impact on the surrounding atmospheric circulation. As shown in Figure 13b, there was a marked anomalous ascending motion around 15°N, while anomalous subsidence occurred near 30°N. This pattern is indicative of a strengthened Hadley circulation, with an intensified upward branch near 15°N and a reinforced downward branch around 30°N. The enhanced Hadley circulation created favorable conditions for the westward extension and intensification of the WPSH, thereby contributing to the prolonged extreme heat and drought conditions in central and eastern China during August 2022.
4. Conclusions
In the summer of 2022, China experienced its most severe drought in nearly 70 years. This study examined the characteristics of atmospheric circulation anomalies during the drought, compared the distribution of various meteorological factors throughout its progression, analyzed the relative importance of moisture and temperature anomalies in drought formation, and explored the underlying causes of these anomalies. The key conclusions are as follows:
In the summer of 2022, the WPSH was abnormally strong and extended westward. Corresponding to the persistent high-temperature and drought conditions observed in July and August, the WPSH exhibited an expanded area and intensified strength, exerting prolonged control over the Yangtze River Basin. Simultaneously, the polar vortex was weaker and smaller than usual, while the South Asian High was both larger and stronger, shifting eastward. These factors collectively altered the regional circulation pattern, resulting in weakened moisture transport and prevailing subsidence over the Yangtze River Basin, which contributed to frequent extreme heat events.
By defining Iq and It as indicators representing the contributions of moisture and temperature to precipitation, the analysis revealed that the drought in the Yangtze River Basin was driven by both anomalously low moisture levels and higher-than-normal temperatures, with temperature playing a dominant role. At certain condensation height layers, moisture anomalies were not significantly different from climatological norms; however, the amplifying effect of elevated temperatures outweighed the negative impact of moisture deficits, thereby emerging as the primary factor in drought formation.
Throughout the summer of 2022, the subtropical high remained significantly stronger than usual, exerting near-continuous control over the Yangtze River Basin, suppressing convective activity, and leading to recurrent extreme heat events. Concurrently, monsoon surges over the South China Sea enhanced tropical convection, thereby strengthening the ascending branch of the Hadley circulation in the lower latitudes. This, in turn, led to anomalous subsidence at approximately 30°N, which further stabilized and facilitated the westward extension of the WPSH, reinforcing the drought conditions over the Yangtze River Basin.
It is important to note that the analysis methods for Iq, It, and Ir employed in this study allow for a direct comparison of the relative contributions of moisture and temperature anomalies at different altitudes. In the analytical process, Iq and It at different altitudes were assigned equal weight; however, given that moisture transport predominantly occurs in the lower and middle troposphere, while temperature plays a supplementary role in moisture condensation, the weighting of lower-tropospheric contributions should be considered more heavily. Future research should refine the theoretical framework and improve the weighting methodology by increasing the emphasis on lower-tropospheric layers while reducing the weight of upper-tropospheric contributions. Such refinements would provide a more accurate representation of atmospheric column anomalies and enhance the applicability of the proposed analysis.
Author Contributions
Conceptualization, D.L.; Methodology, D.L.; Software, D.L.; Validation, D.Y.; Investigation, R.L. and D.Y.; Writing—original draft, D.L.; Supervision, E.L.; Funding acquisition, E.L. All authors have read and agreed to the published version of the manuscript.
Funding
This work was jointly sponsored by the National Natural Science Foundation of China (Grant Nos. 42475034 and 41991281). We also acknowledge the support from the Key Natural Science Research Project of Anhui Provincial Department of Education (2023AH051631).
Data Availability Statement
The NCEP Reanalysis Derived data used in this study were provided by the NOAA/OAR/ESRL, which are available at the site https://www.esrl.noaa.gov/psd/. The station data can be obtained from the corresponding author upon request.
Acknowledgments
We are very grateful to the anonymous reviewers for their constructive comments and thoughtful suggestions.
Conflicts of Interest
The authors declare no conflict of interest.
References
- Lin, S.; Li, H. Y.; Huang, P. C.; et al. Characteristics of high-temperature drought in China in summer 2022 and analysis of its circulation situation. Arid Meteorology, 2022, 40, 16. [Google Scholar]
- Xia, J.; Chen, J.; She, D. X. Extreme drought events in the Yangtze River Basin in 2022: Impacts and countermeasures. Journal of Hydraulic Engineering, 2022, 53, 1143–1153. [Google Scholar]
- Sun, B.; Wang, H. J.; Huang, Y. Y.; et al. Characteristics and causes of the hot-dry climate anomalies in China during summer of 2022. Trans Atmos Sci, 2023, 46, 1–8. [Google Scholar]
- Chyi, D.; He, L. F. Stage characteristics and mechanisms of extreme high temperature in China in summer of 2022. J Appl Meteor Sci, 2023, 34, 385–399. [Google Scholar]
- Mei, M.; Gao, G.; Li, Y.; et al. Change characteristics in compound high temperature and drought extreme events over Yangtze River Basin from 1961 to 2022. Yangtze River, 2023, 54, 12–20. [Google Scholar]
- Ma, Y. Y.; Pan, X.; Liu, J. Y.; et al. Diagnostic analysis of the causes of persistent high-temperature drought events in Jiangnan in the summer of 2022. Meteorology and Disaster Reduction Research, 2024, 47, 194–204. [Google Scholar]
- Peng, J. B.; Sun, S. Q.; Lin, D. W. Causes of persistent extreme high-temperature events in the Yangtze River Basin in August 2022. Journal of Applied Meteorology, 2023, 34, 527–539. [Google Scholar]
- Tan, G. R.; Zhang, Y. Circulation anomaly characteristics of high temperatures in China in the summer of 2022. Journal of Marine Meteorology, 2023, 43, 31–41. [Google Scholar]
- Hao, L. S.; Ma, N.; He, L. Y. Circulation anomaly characteristics of abnormal drought and high-temperature events in the middle and lower reaches of the Yangtze River in summer 2022. Arid Meteorology, 2022, 40, 721–732. [Google Scholar]
- Li, Y. P.; Zhang, J. Y.; Yue, P.; et al. Characteristics and causes of major droughts in the Yangtze River Basin in summer 2022. Arid Meteorology, 2022, 40, 733–747. [Google Scholar]
- Yuan, X.; Ma, F.; Li, H.; et al. Research progress on multi-scale drought processes and prediction under global change. Journal of Atmospheric Sciences, 2020, 43, 225–237. [Google Scholar]
- Tao, S. Y.; Wei, J.; Sun, J. H.; et al. Analysis of severe drought in eastern China in the autumn and winter of 2008/2009. Meteorology, 2009, 35, 3–10. [Google Scholar]
- Coles, N. A.; Eslamian, S. Definition of Drought. M, 2017.
- Otkin, J. A.; Svoboda, M.; Hunt, E. D.; et al. Flash droughts: A review and assessment of the challenges imposed by rapid-onset droughts in the United States. American Meteorological Society, 2017, 99, 911–919. [Google Scholar] [CrossRef]
- Samantaray, A. K.; Ramadas, M.; Panda, R. K. Changes in drought characteristics based on rainfall pattern drought index and the CMIP6 multi-model ensemble. Agricultural Water Management, 2022, 266, 107568. [Google Scholar] [CrossRef]
- Mishra, A. K.; Singh, V. P. A review of drought concepts. Journal of Hydrology, 2010, 391(1-2), 202-216.
- Khan, M.; Muhammad, N.; El-Shafie, A. A review of fundamental drought concepts, impacts and analyses of indices in Asian continent. Journal of Urban and Environmental Engineering, 2018, 12, 106–119. [Google Scholar] [CrossRef]
- Lu, E.; Luo, Y.; Zhang, R. H.; et al. Regional atmospheric anomalies responsible for the 2009-2010 severe drought in China. J Geophys. Res., 2011, 116(D21).
- Lu, E.; Liu, S. Y.; Luo, Y.; et al. The atmospheric anomalies associated with the drought over the Yangtze River basin during spring 2011. J Geophys. Res., 2014, 119, 5881–5894. [Google Scholar] [CrossRef]
- Jiang, Y.; Lu, E. Flooding in Jianghuai from May to July 1991: A comparative analysis of the role of moisture and cold air. Meteorological Science, 2016, 36, 382–388. [Google Scholar]
- Chen, H. X.; Chen, Y.; Lu, E.; et al. Abnormal temperature and humidity during precipitation processes in the southern rain-snow freezing event in early 2008. Journal of Applied Meteorology, 2015, 26, 525–535. [Google Scholar]
- Lu, E. Determining the start, duration, and strength of flood and drought with daily precipitation: Rationale. Geophysical Research Letters, 2009, 36.
- Lu, E.; Cai, W.; Jiang, Z.; et al. The day-to-day monitoring of the 2011 severe drought in China. Climate Dynamics, 2013, 43(1-2), 1-9.
- Lu, E.; Takle, E. S. Concurrent variations of water vapor and temperature corresponding to the interannual variation of precipitation in the North American Regional Reanalysis. J Geophys. Res., 2010, 115(D11).
- Duan, X. Y.; Zhang, Q.; Zhang, L.; et al. Multidimensional anomaly characteristics of the Western Pacific Subtropical High during the development of major droughts in the Yangtze River Basin in 2022. Chinese Science Bulletin, 2024, 69, 2081–2092. [Google Scholar]
- Hu, Y. P.; Zhou, B. T.; Wang, H. J.; et al. Record-breaking summer-autumn drought in southern China in 2022: The role of tropical sea surface temperature and Eurasian heating. Science China: Earth Sciences, 2024, 54, 439–450. [Google Scholar] [CrossRef]
- Jiang, Y. T.; Hou, A. Z.; Hao, Z. C.; et al. Evolution and historical comparison of the 2022 high-temperature drought event in the Yangtze River Basin. Journal of Hydroelectric Engineering, 2023, 42, 1–9. [Google Scholar]
- Feng, B. F.; Qiu, H.; Ji, G. L. Characteristics and preliminary causes of meteorological drought in the Yangtze River Basin in summer 2022. People’s Yangtze River, 2022, 53, 6–15. [Google Scholar]
- Zhang, Y.; An, X.; Sun, S. L.; et al. Characteristics of boreal summer compound hot-drought events in the Yangtze River Valley and relationships with Indian Ocean sea surface temperature. PREPRINT (Version 1), 2024.
- Huang, H.; Zhu, Z.; Li, J. Disentangling the unprecedented Yangtze River Basin extreme high temperatures in summer 2022: Combined impacts of the reintensified La Niña and strong positive NAO. J. Climate, 2023, 37, 927–942. [Google Scholar] [CrossRef]
Figure 1.
The anomaly percentage of total precipitation for the summer of 2022.
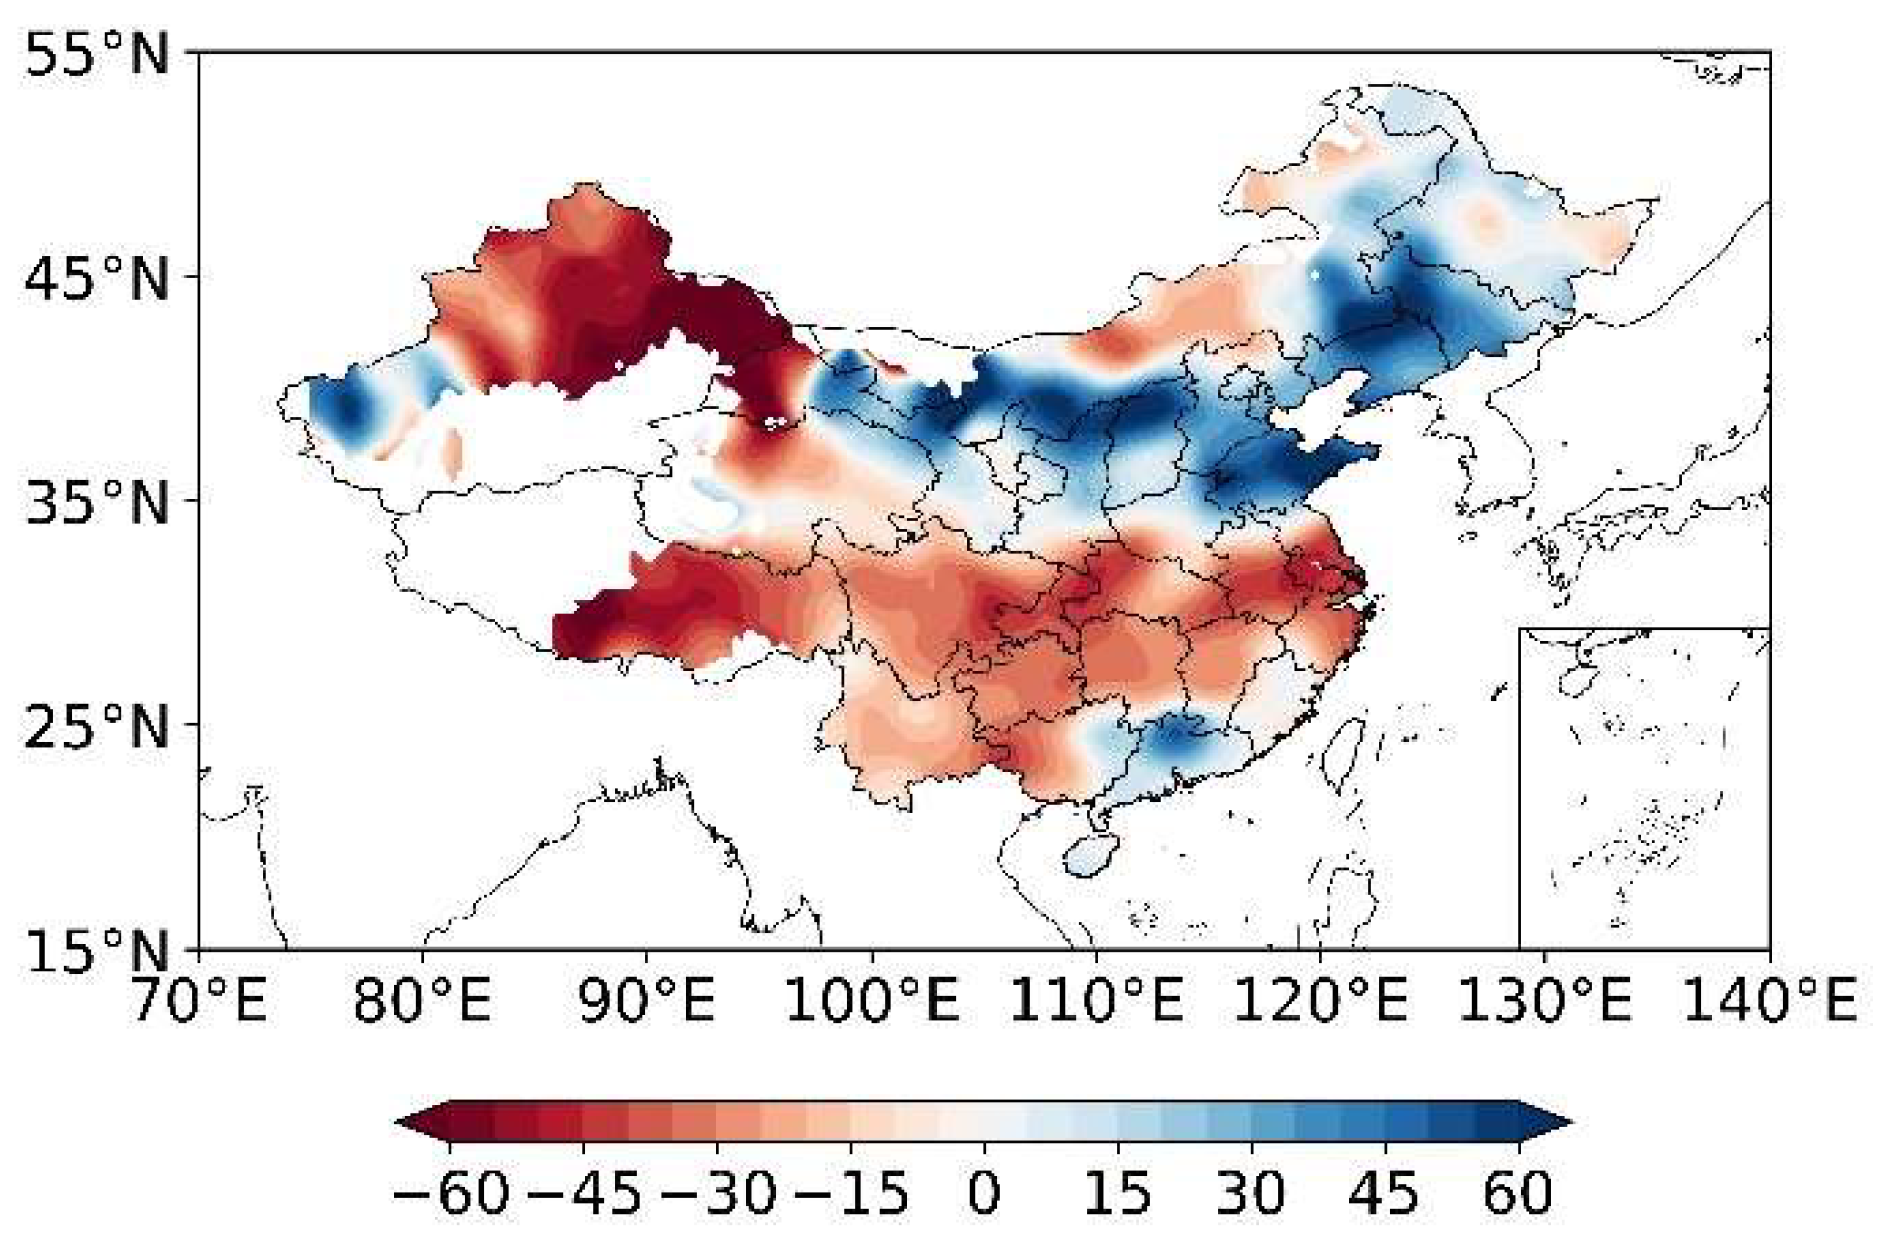
Figure 2.
The daily precipitation (a; unit: mm/day) and daily SWAP (b) for 108 stations in the middle and lower reaches of the Yangtze River (105–121°E, 28–32°N) during the summer of 2022.
Figure 2.
The daily precipitation (a; unit: mm/day) and daily SWAP (b) for 108 stations in the middle and lower reaches of the Yangtze River (105–121°E, 28–32°N) during the summer of 2022.
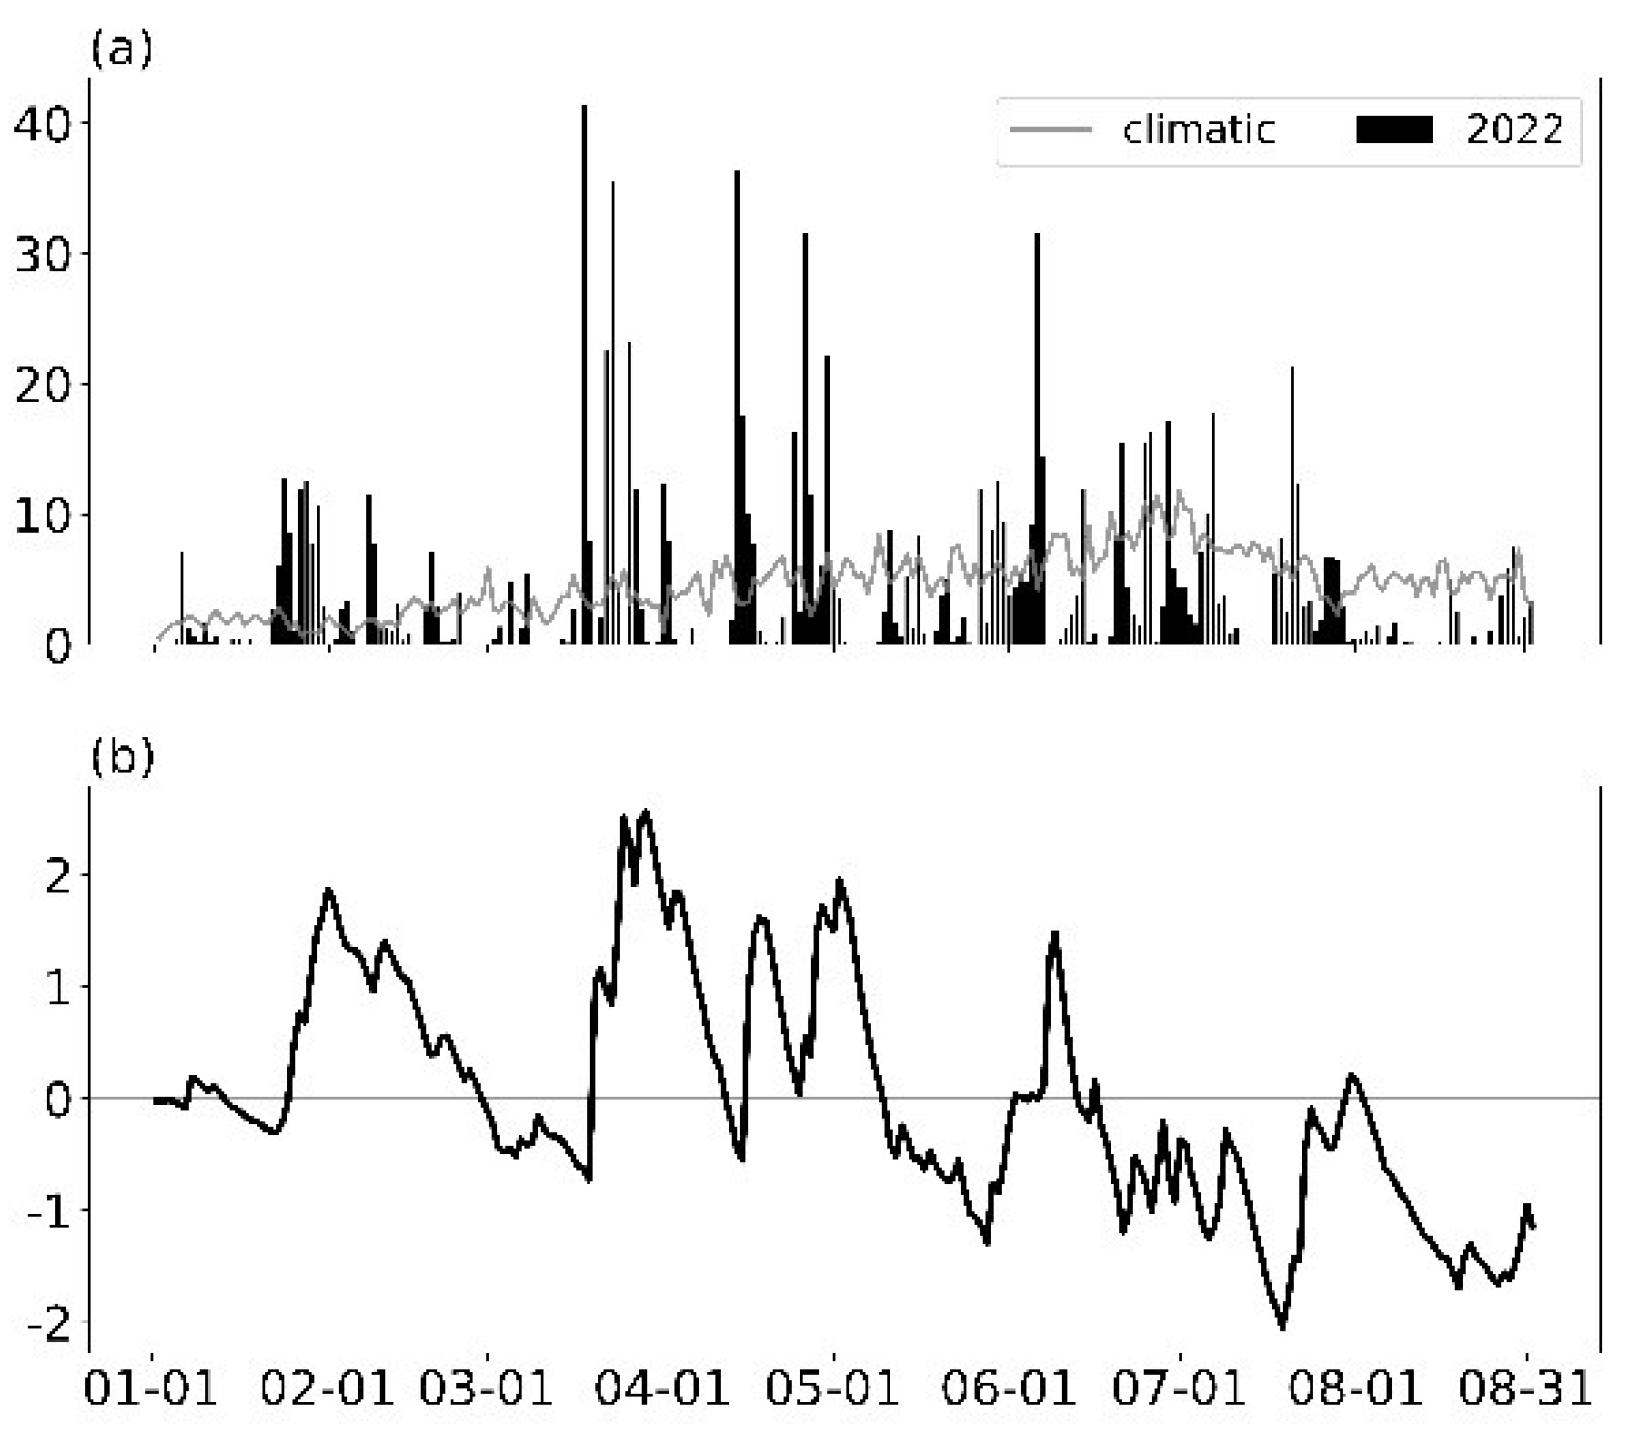
Figure 3.
The 500 hPa geopotential height anomalies (unit: dagpm) and wind field anomalies for the summer of 2022: (a) June, (b) July, (c) August, (d) Summer average.
Figure 3.
The 500 hPa geopotential height anomalies (unit: dagpm) and wind field anomalies for the summer of 2022: (a) June, (b) July, (c) August, (d) Summer average.
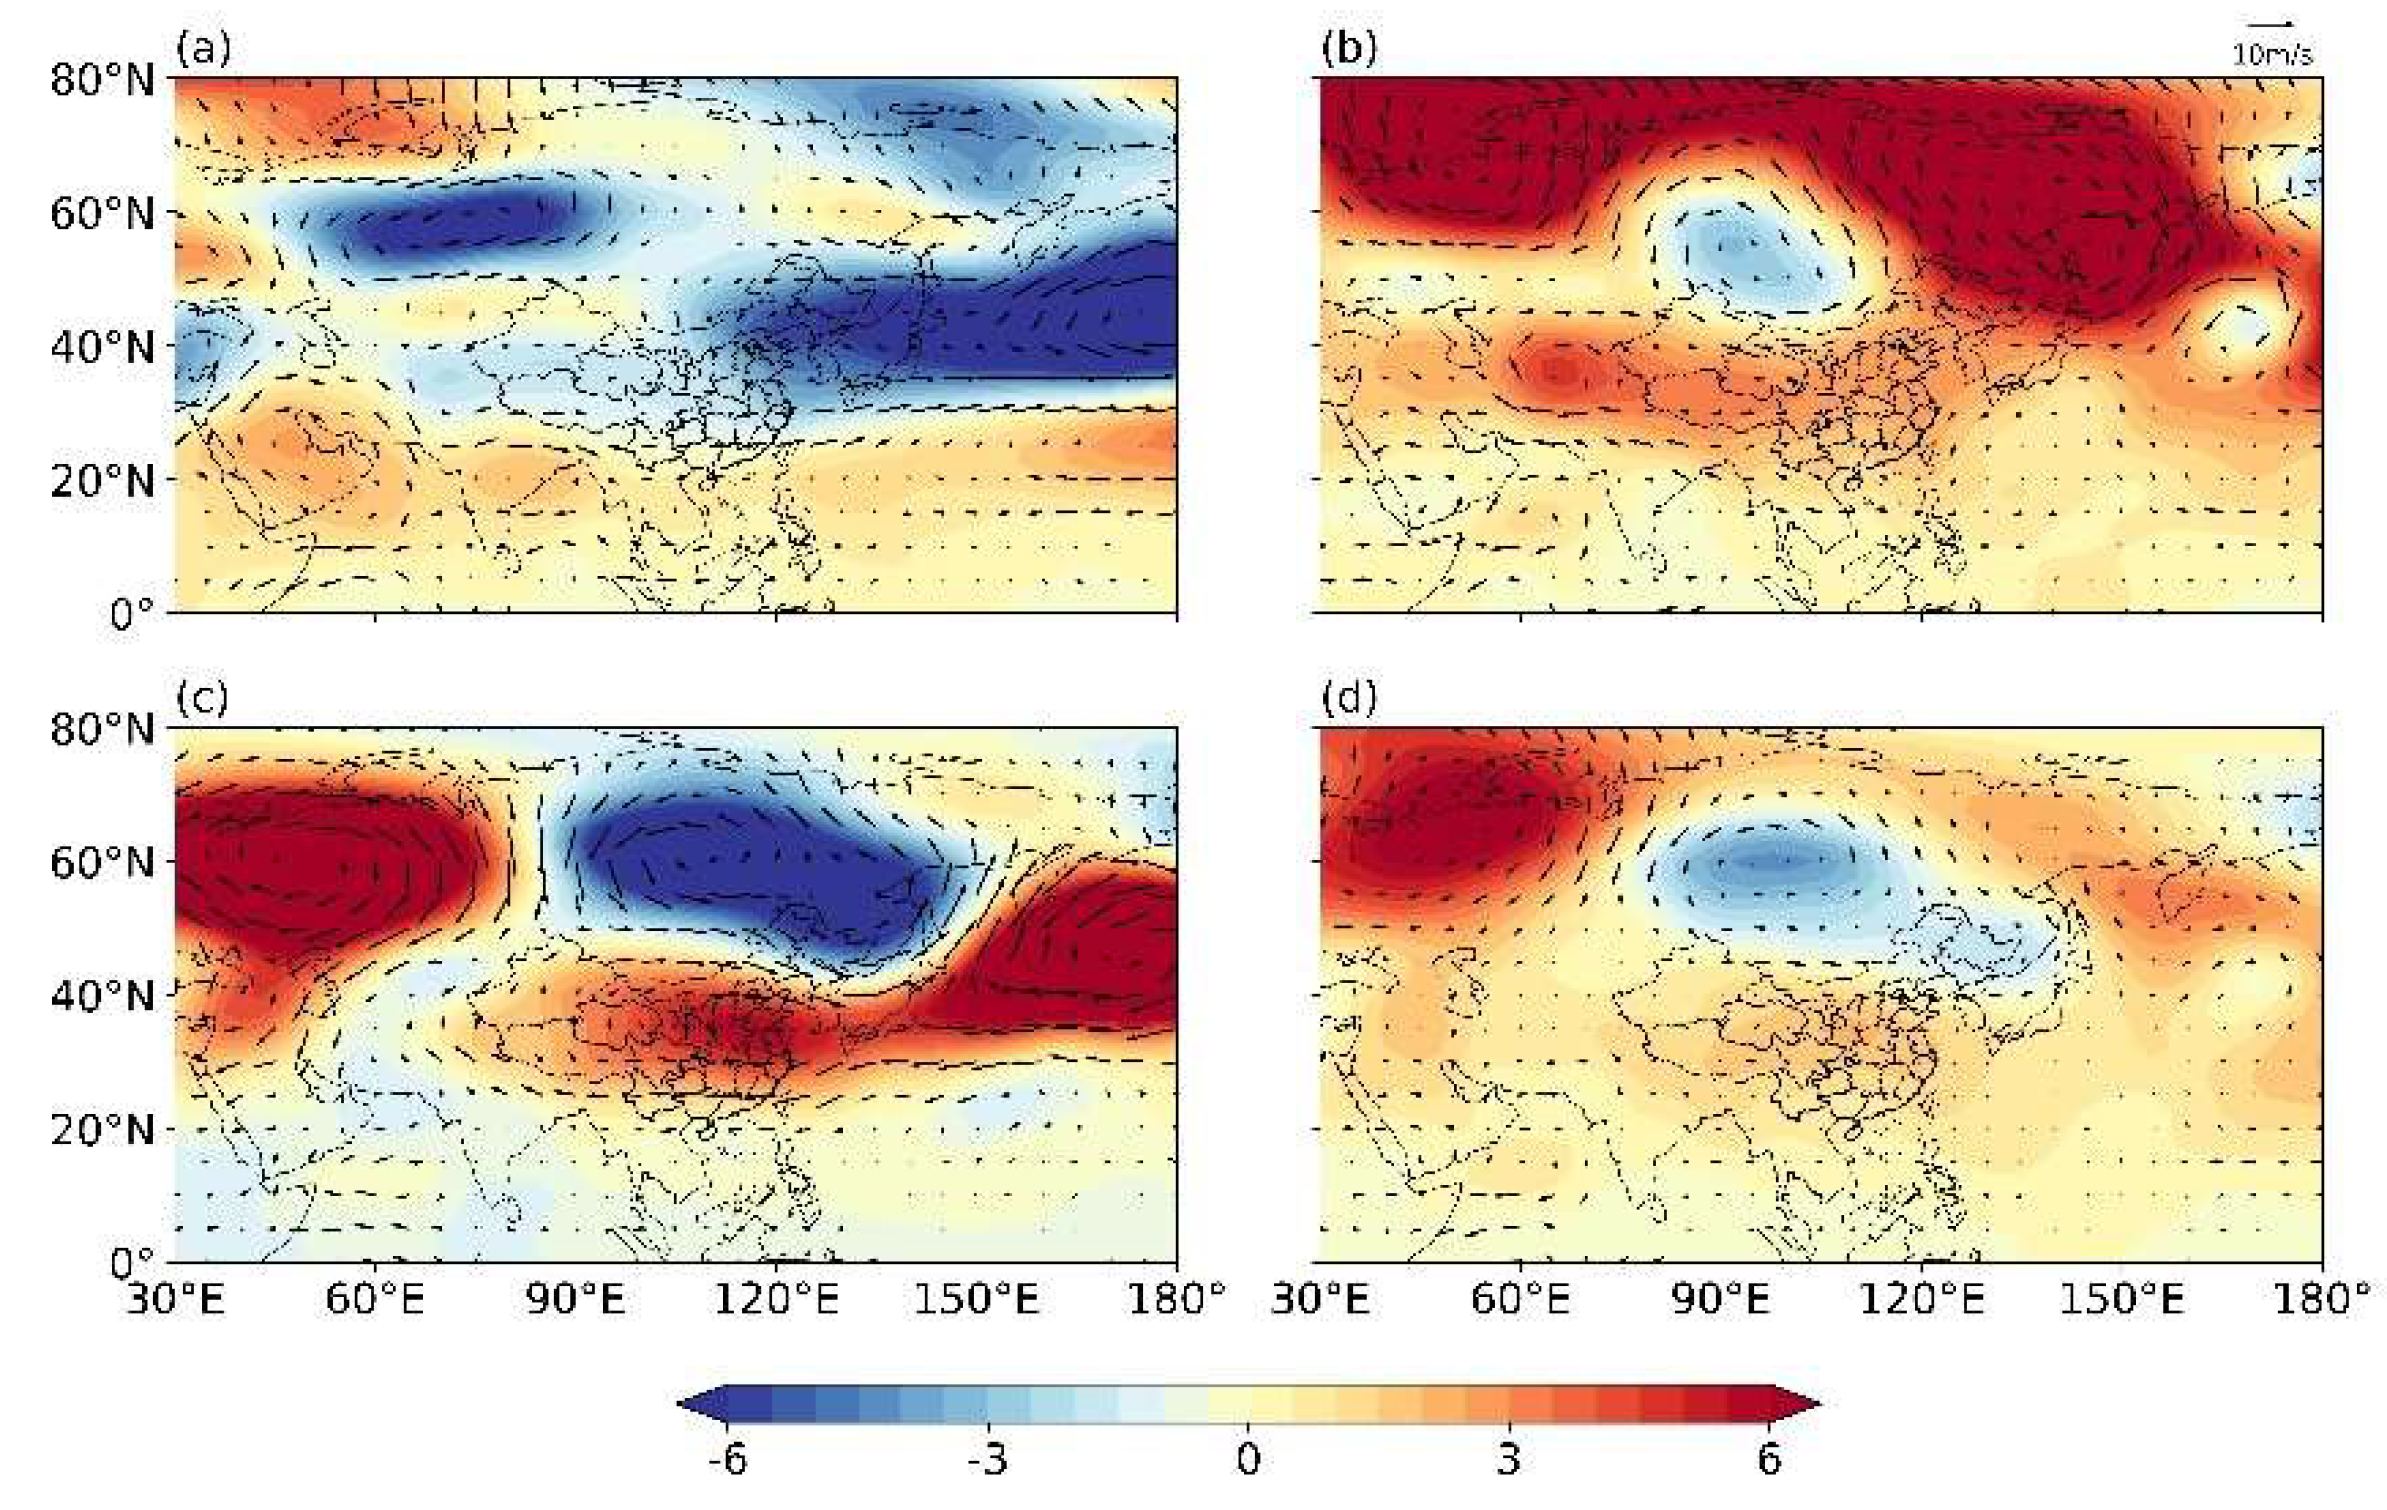
Figure 4.
The 300 hPa geopotential height anomalies (unit: dagpm) and wind field anomalies for the summer of 2022: (a) June, (b) July, (c) August, (d) Summer average.
Figure 4.
The 300 hPa geopotential height anomalies (unit: dagpm) and wind field anomalies for the summer of 2022: (a) June, (b) July, (c) August, (d) Summer average.
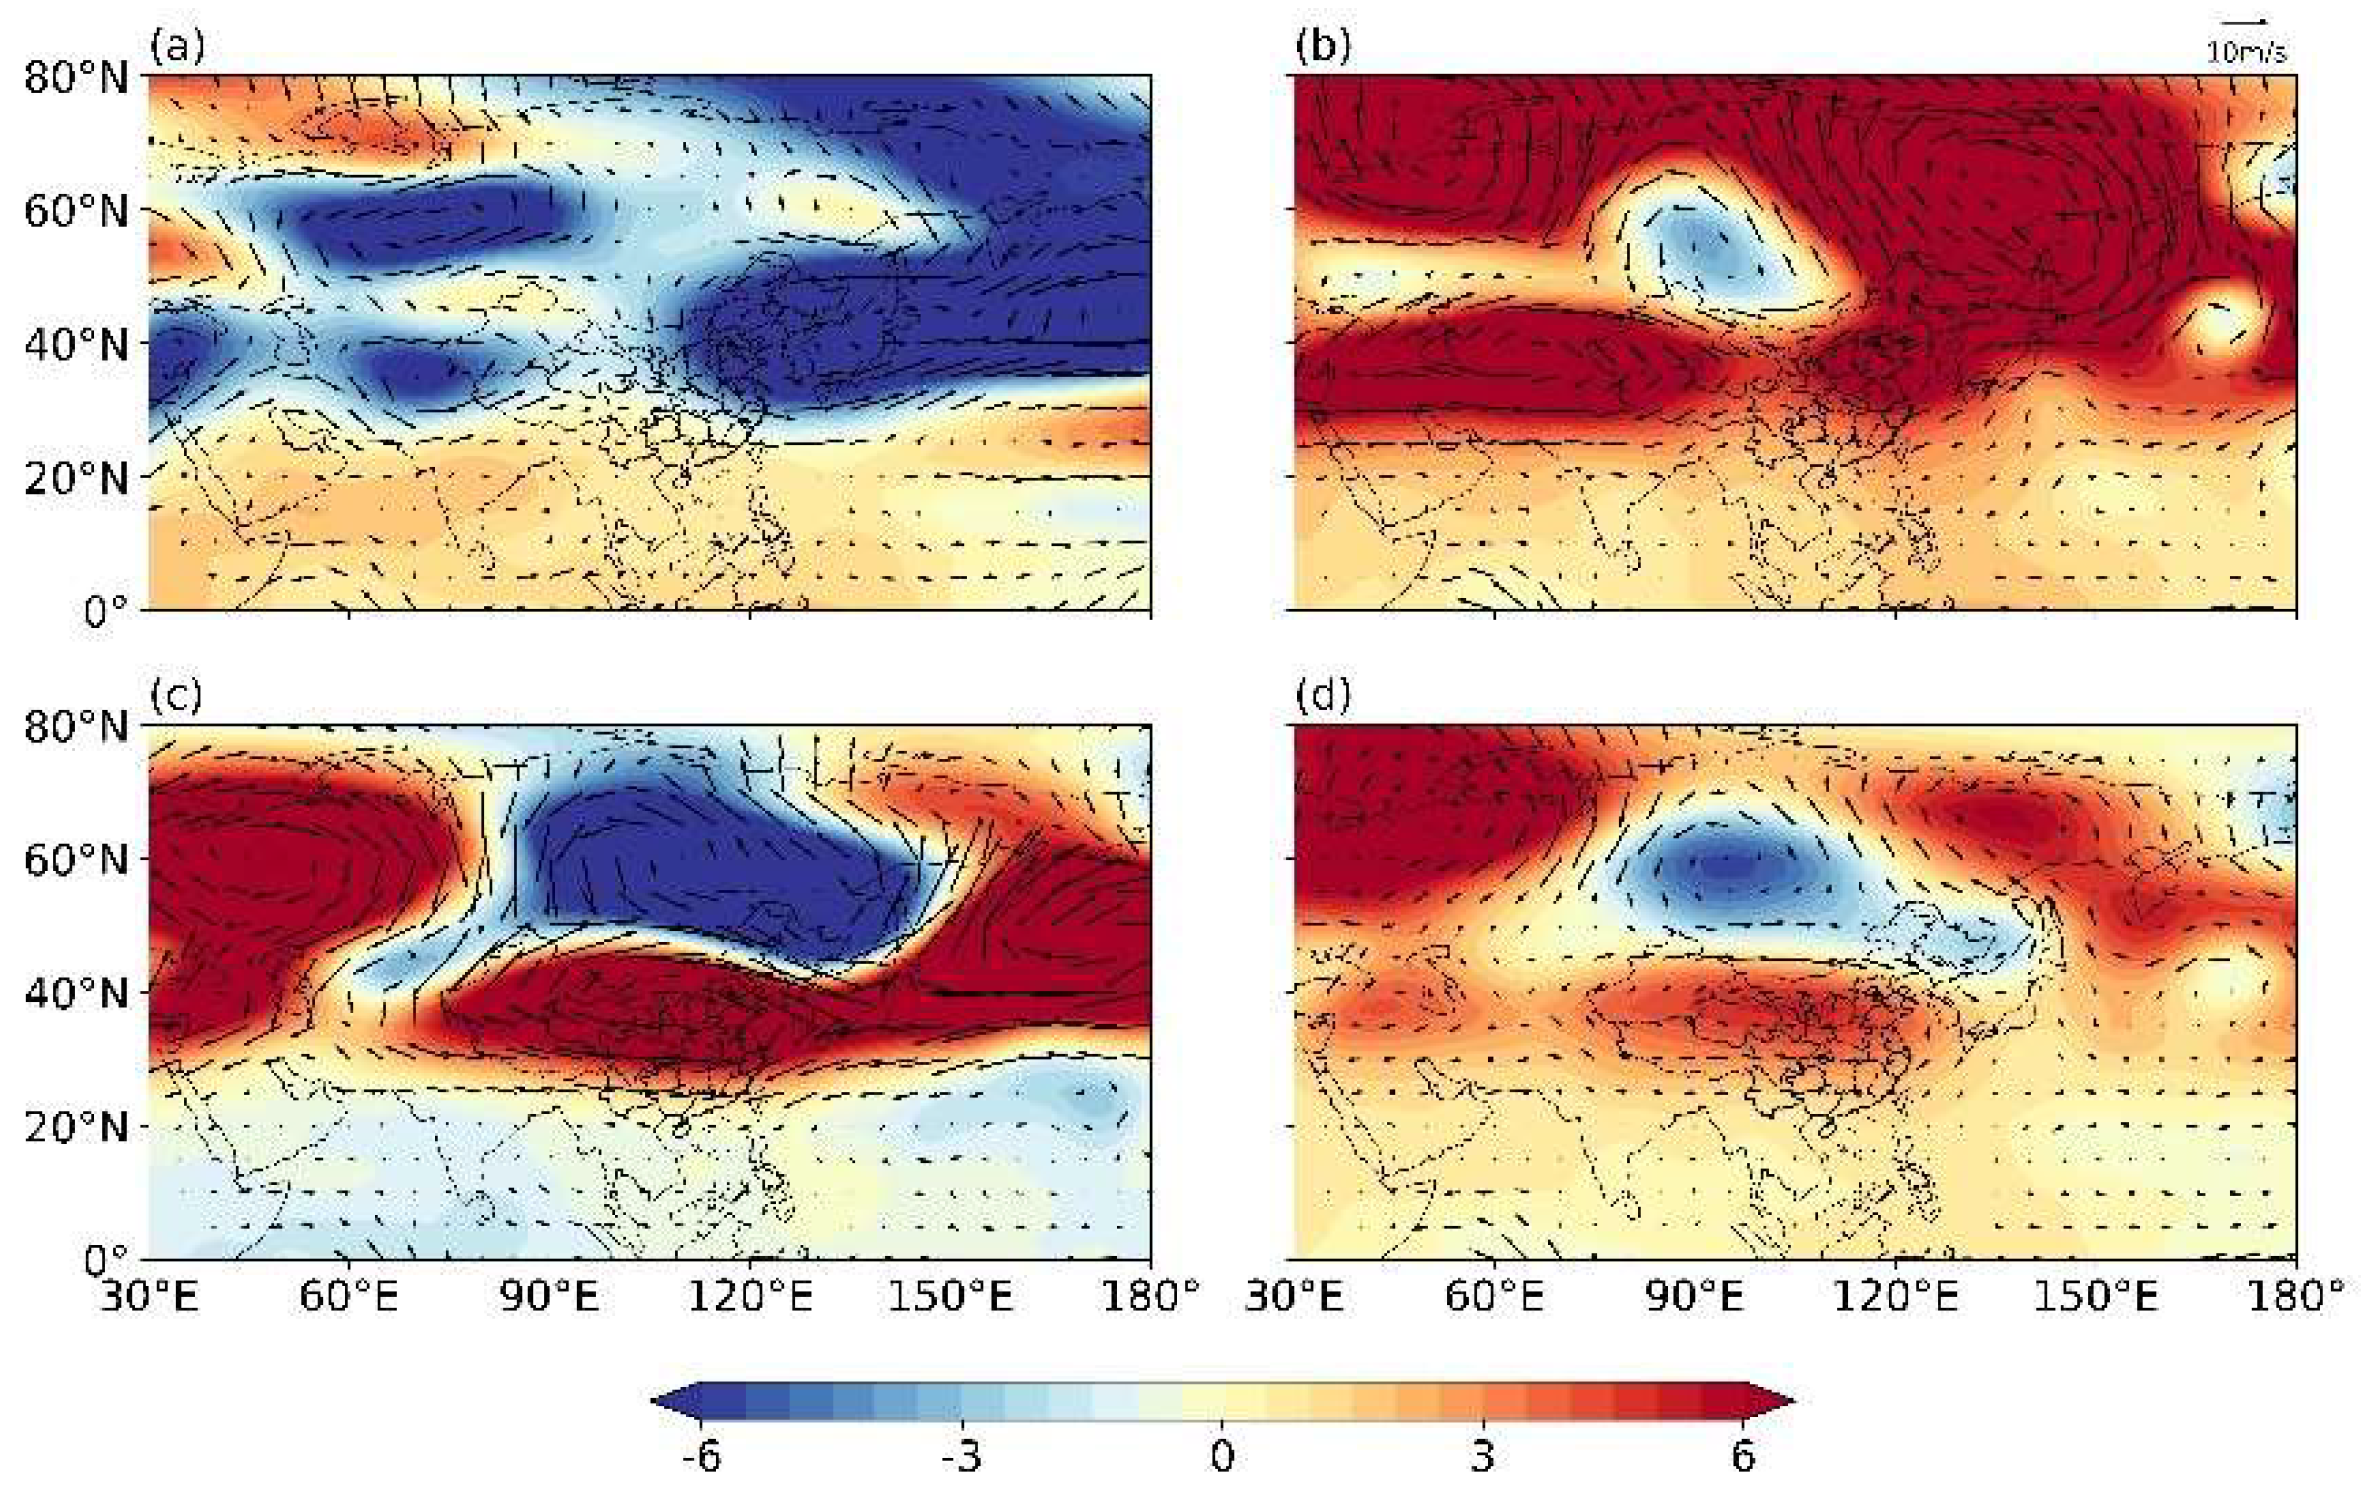
Figure 5.
The summer 2022 anomalies of the total column water vapor flux divergence (unit: 10⁻⁵ kg/(s·m²)) and total column water vapor flux transport (unit: kg/(s·m)): (a) June, (b) July, (c) August, (d) Summer average.
Figure 5.
The summer 2022 anomalies of the total column water vapor flux divergence (unit: 10⁻⁵ kg/(s·m²)) and total column water vapor flux transport (unit: kg/(s·m)): (a) June, (b) July, (c) August, (d) Summer average.
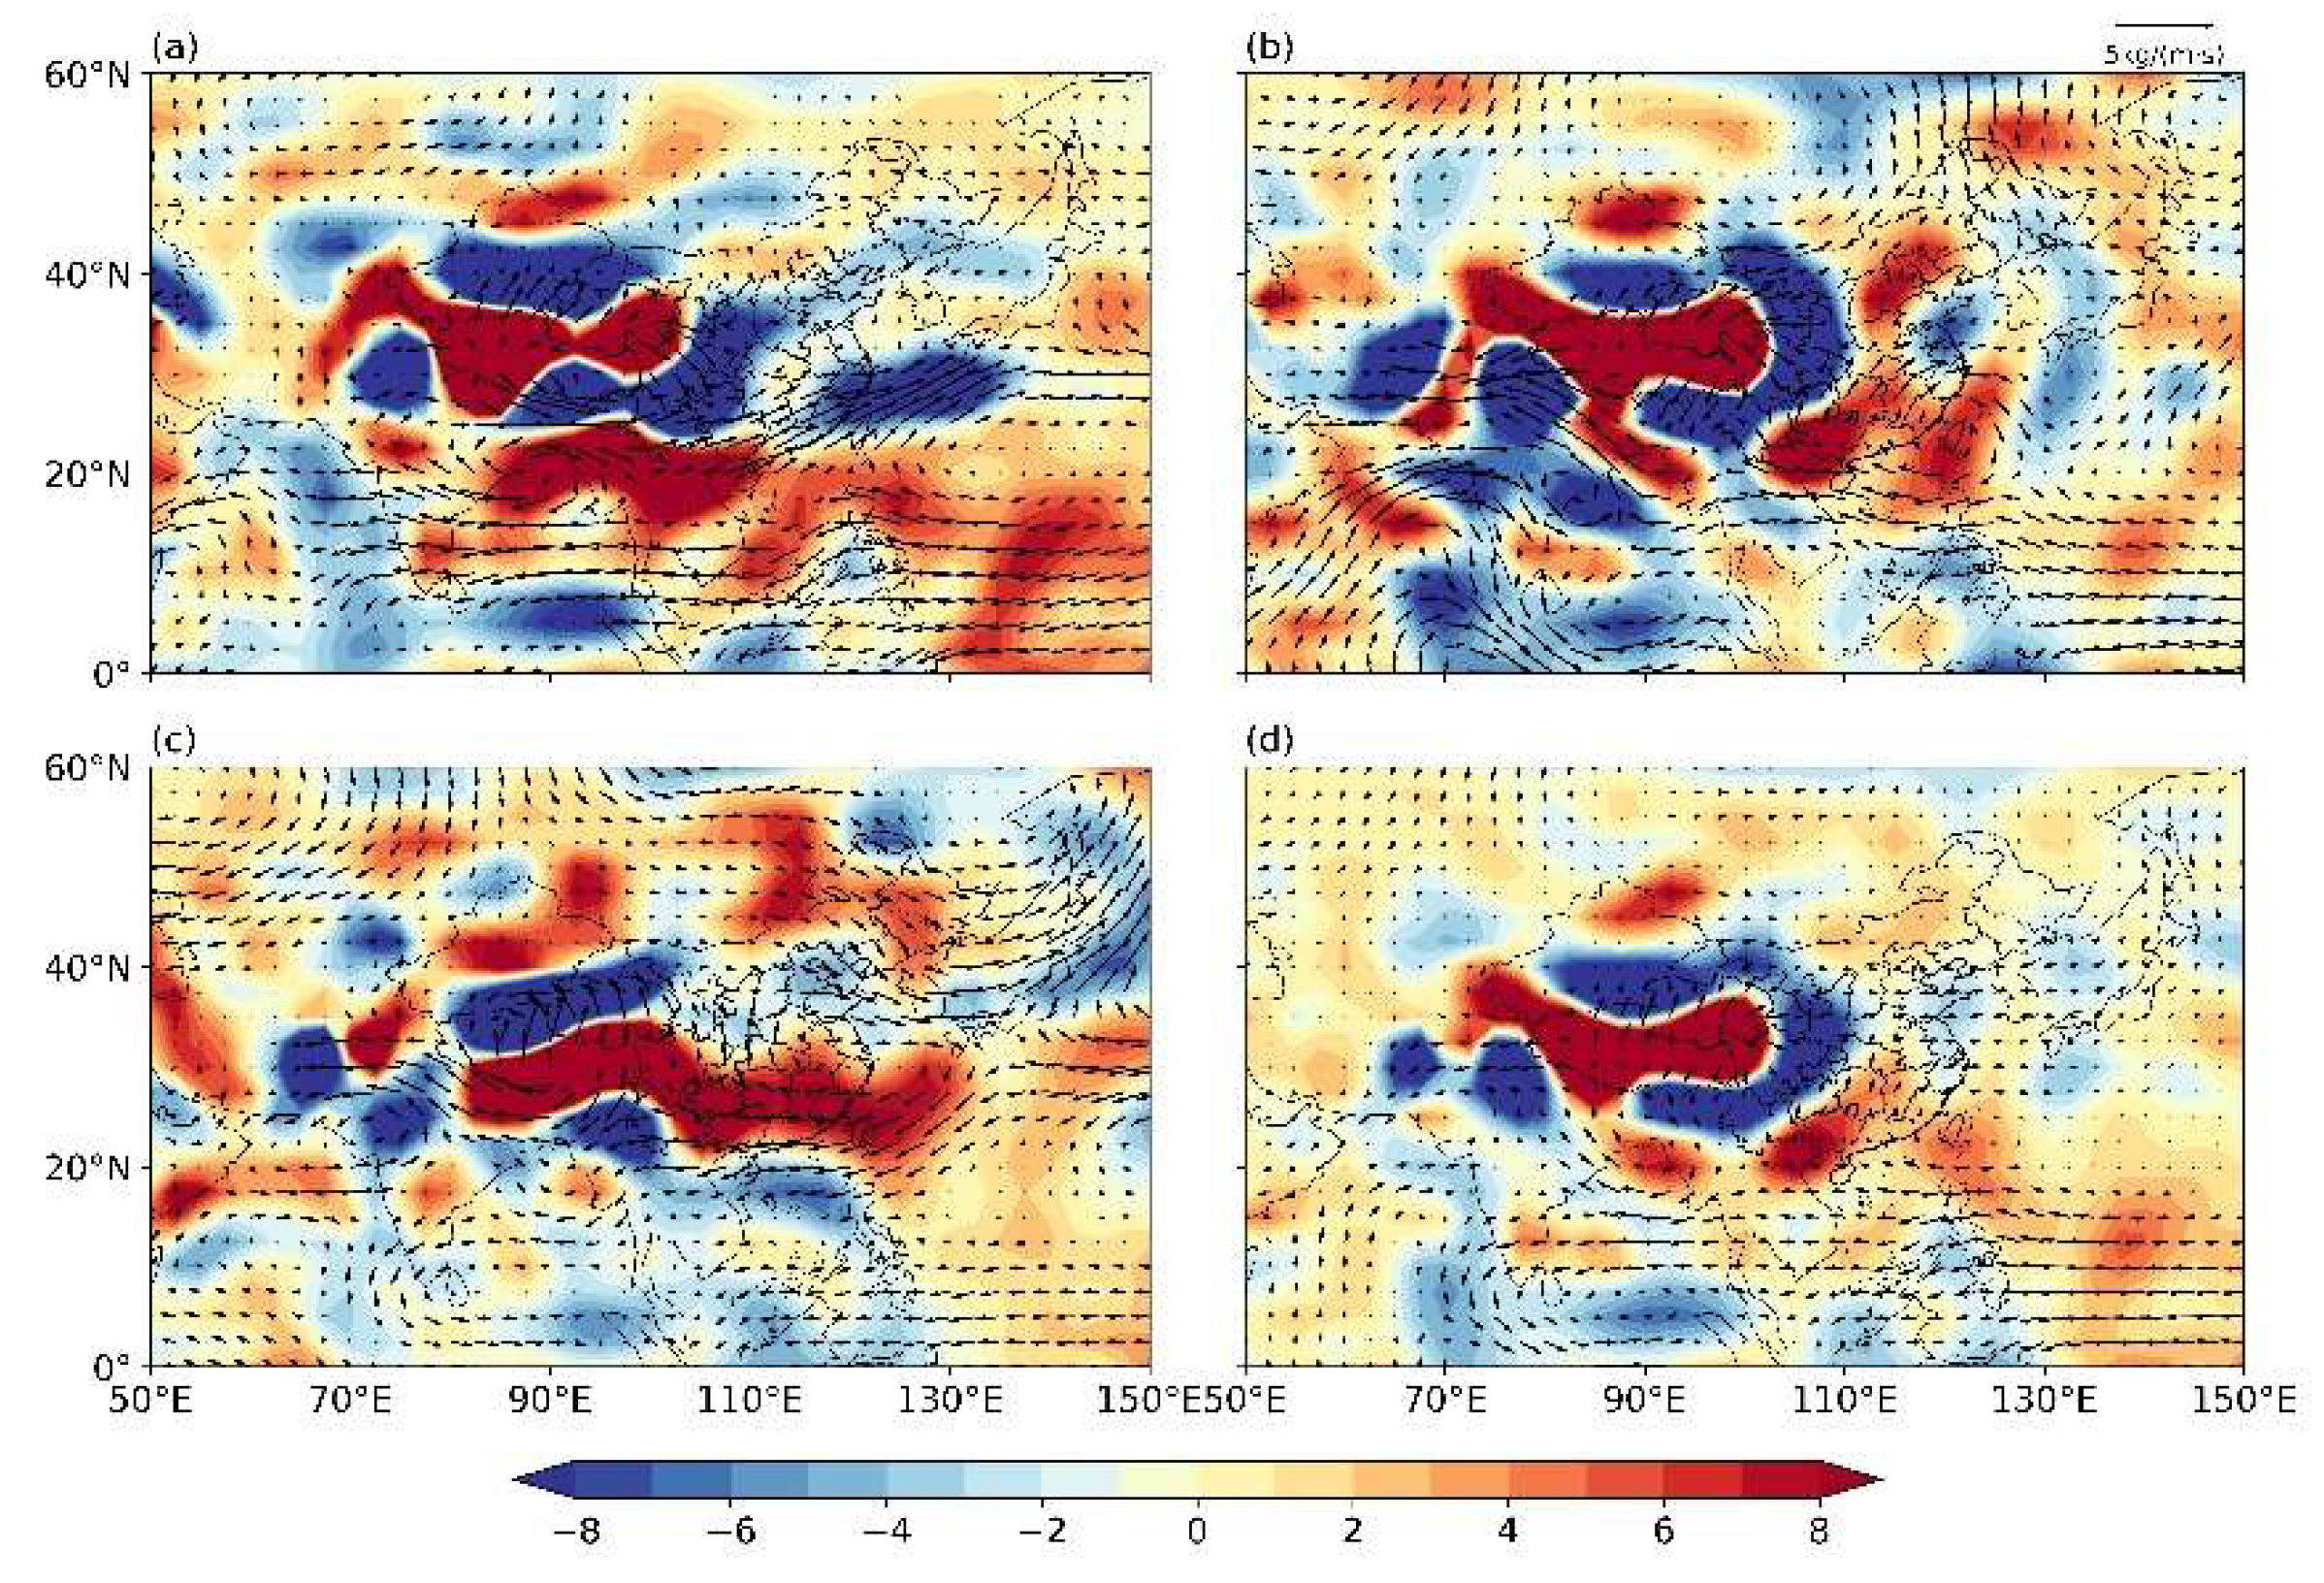
Figure 6.
The summer 2022 anomalies of specific humidity (a, d, g; unit: g/kg), air temperature (b, e, h; unit: ℃), and relative humidity (c, f, i), from top to bottom corresponding to 300, 500, and 850 hPa.
Figure 6.
The summer 2022 anomalies of specific humidity (a, d, g; unit: g/kg), air temperature (b, e, h; unit: ℃), and relative humidity (c, f, i), from top to bottom corresponding to 300, 500, and 850 hPa.
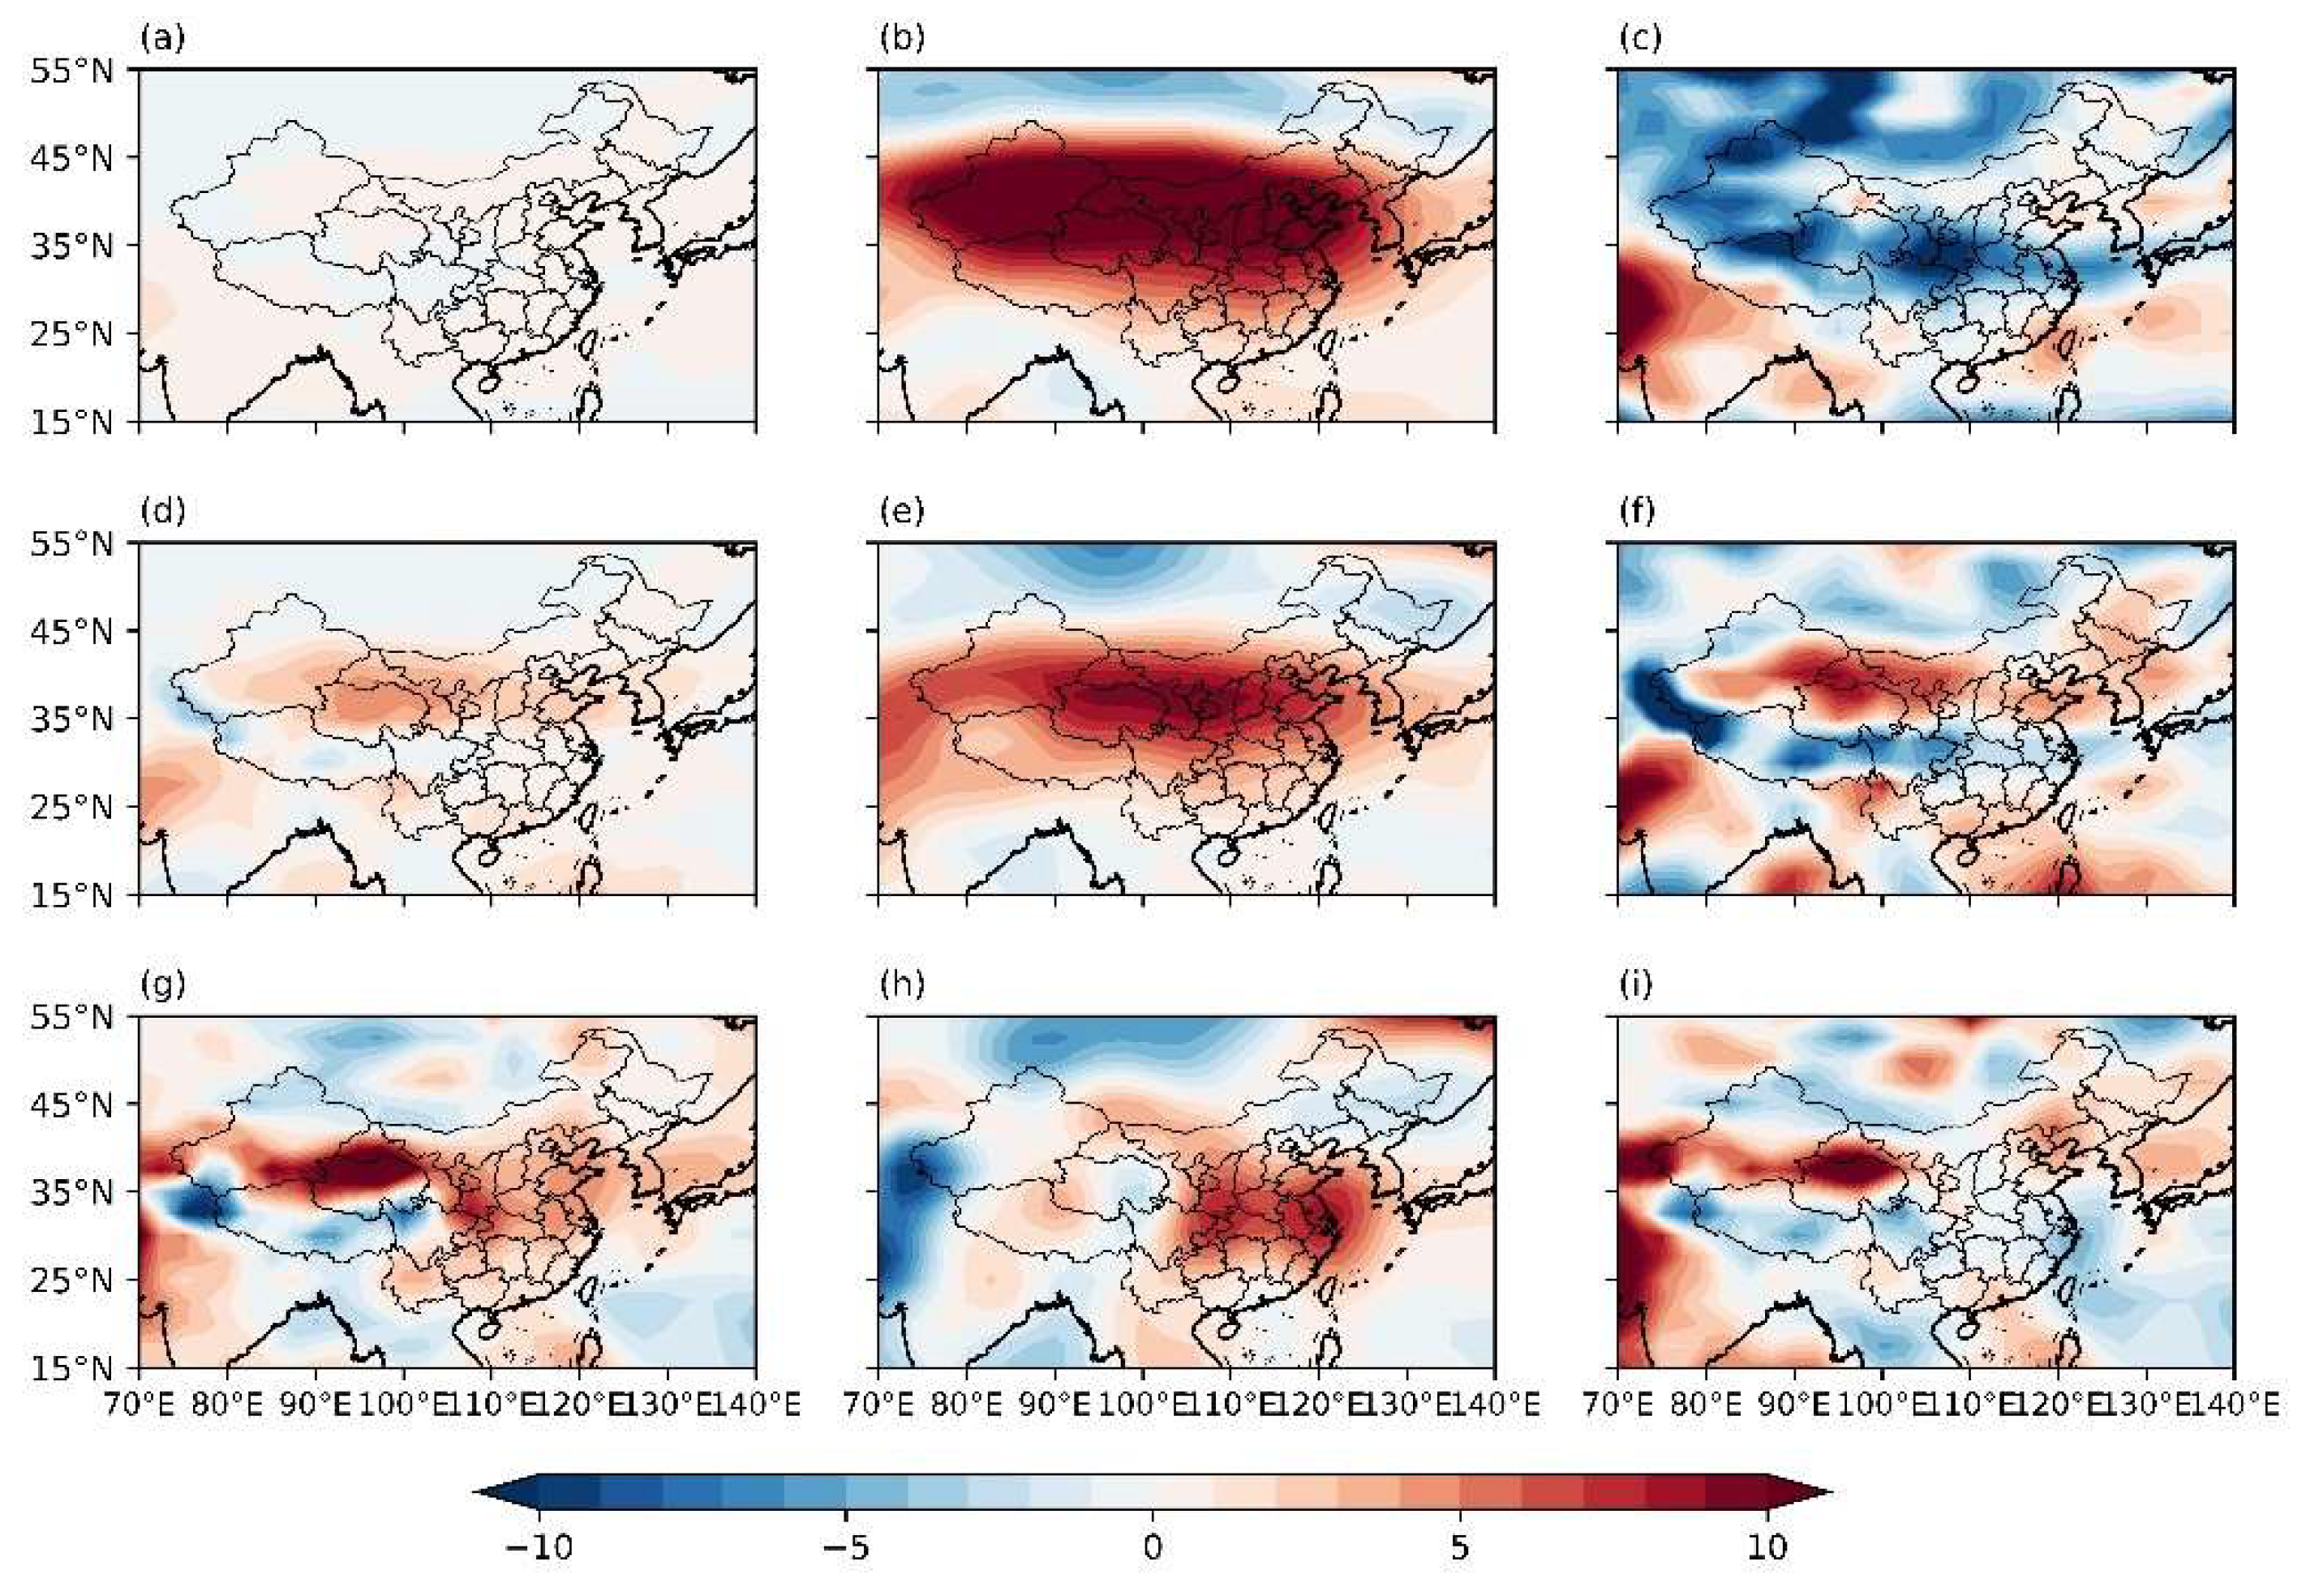
Figure 7.
The Iq, It, Ir at various levels for July 2022 (from top to bottom: 300 hPa, 500 hPa, 850 hPa; from left to right: Iq, It, Ir).
Figure 7.
The Iq, It, Ir at various levels for July 2022 (from top to bottom: 300 hPa, 500 hPa, 850 hPa; from left to right: Iq, It, Ir).
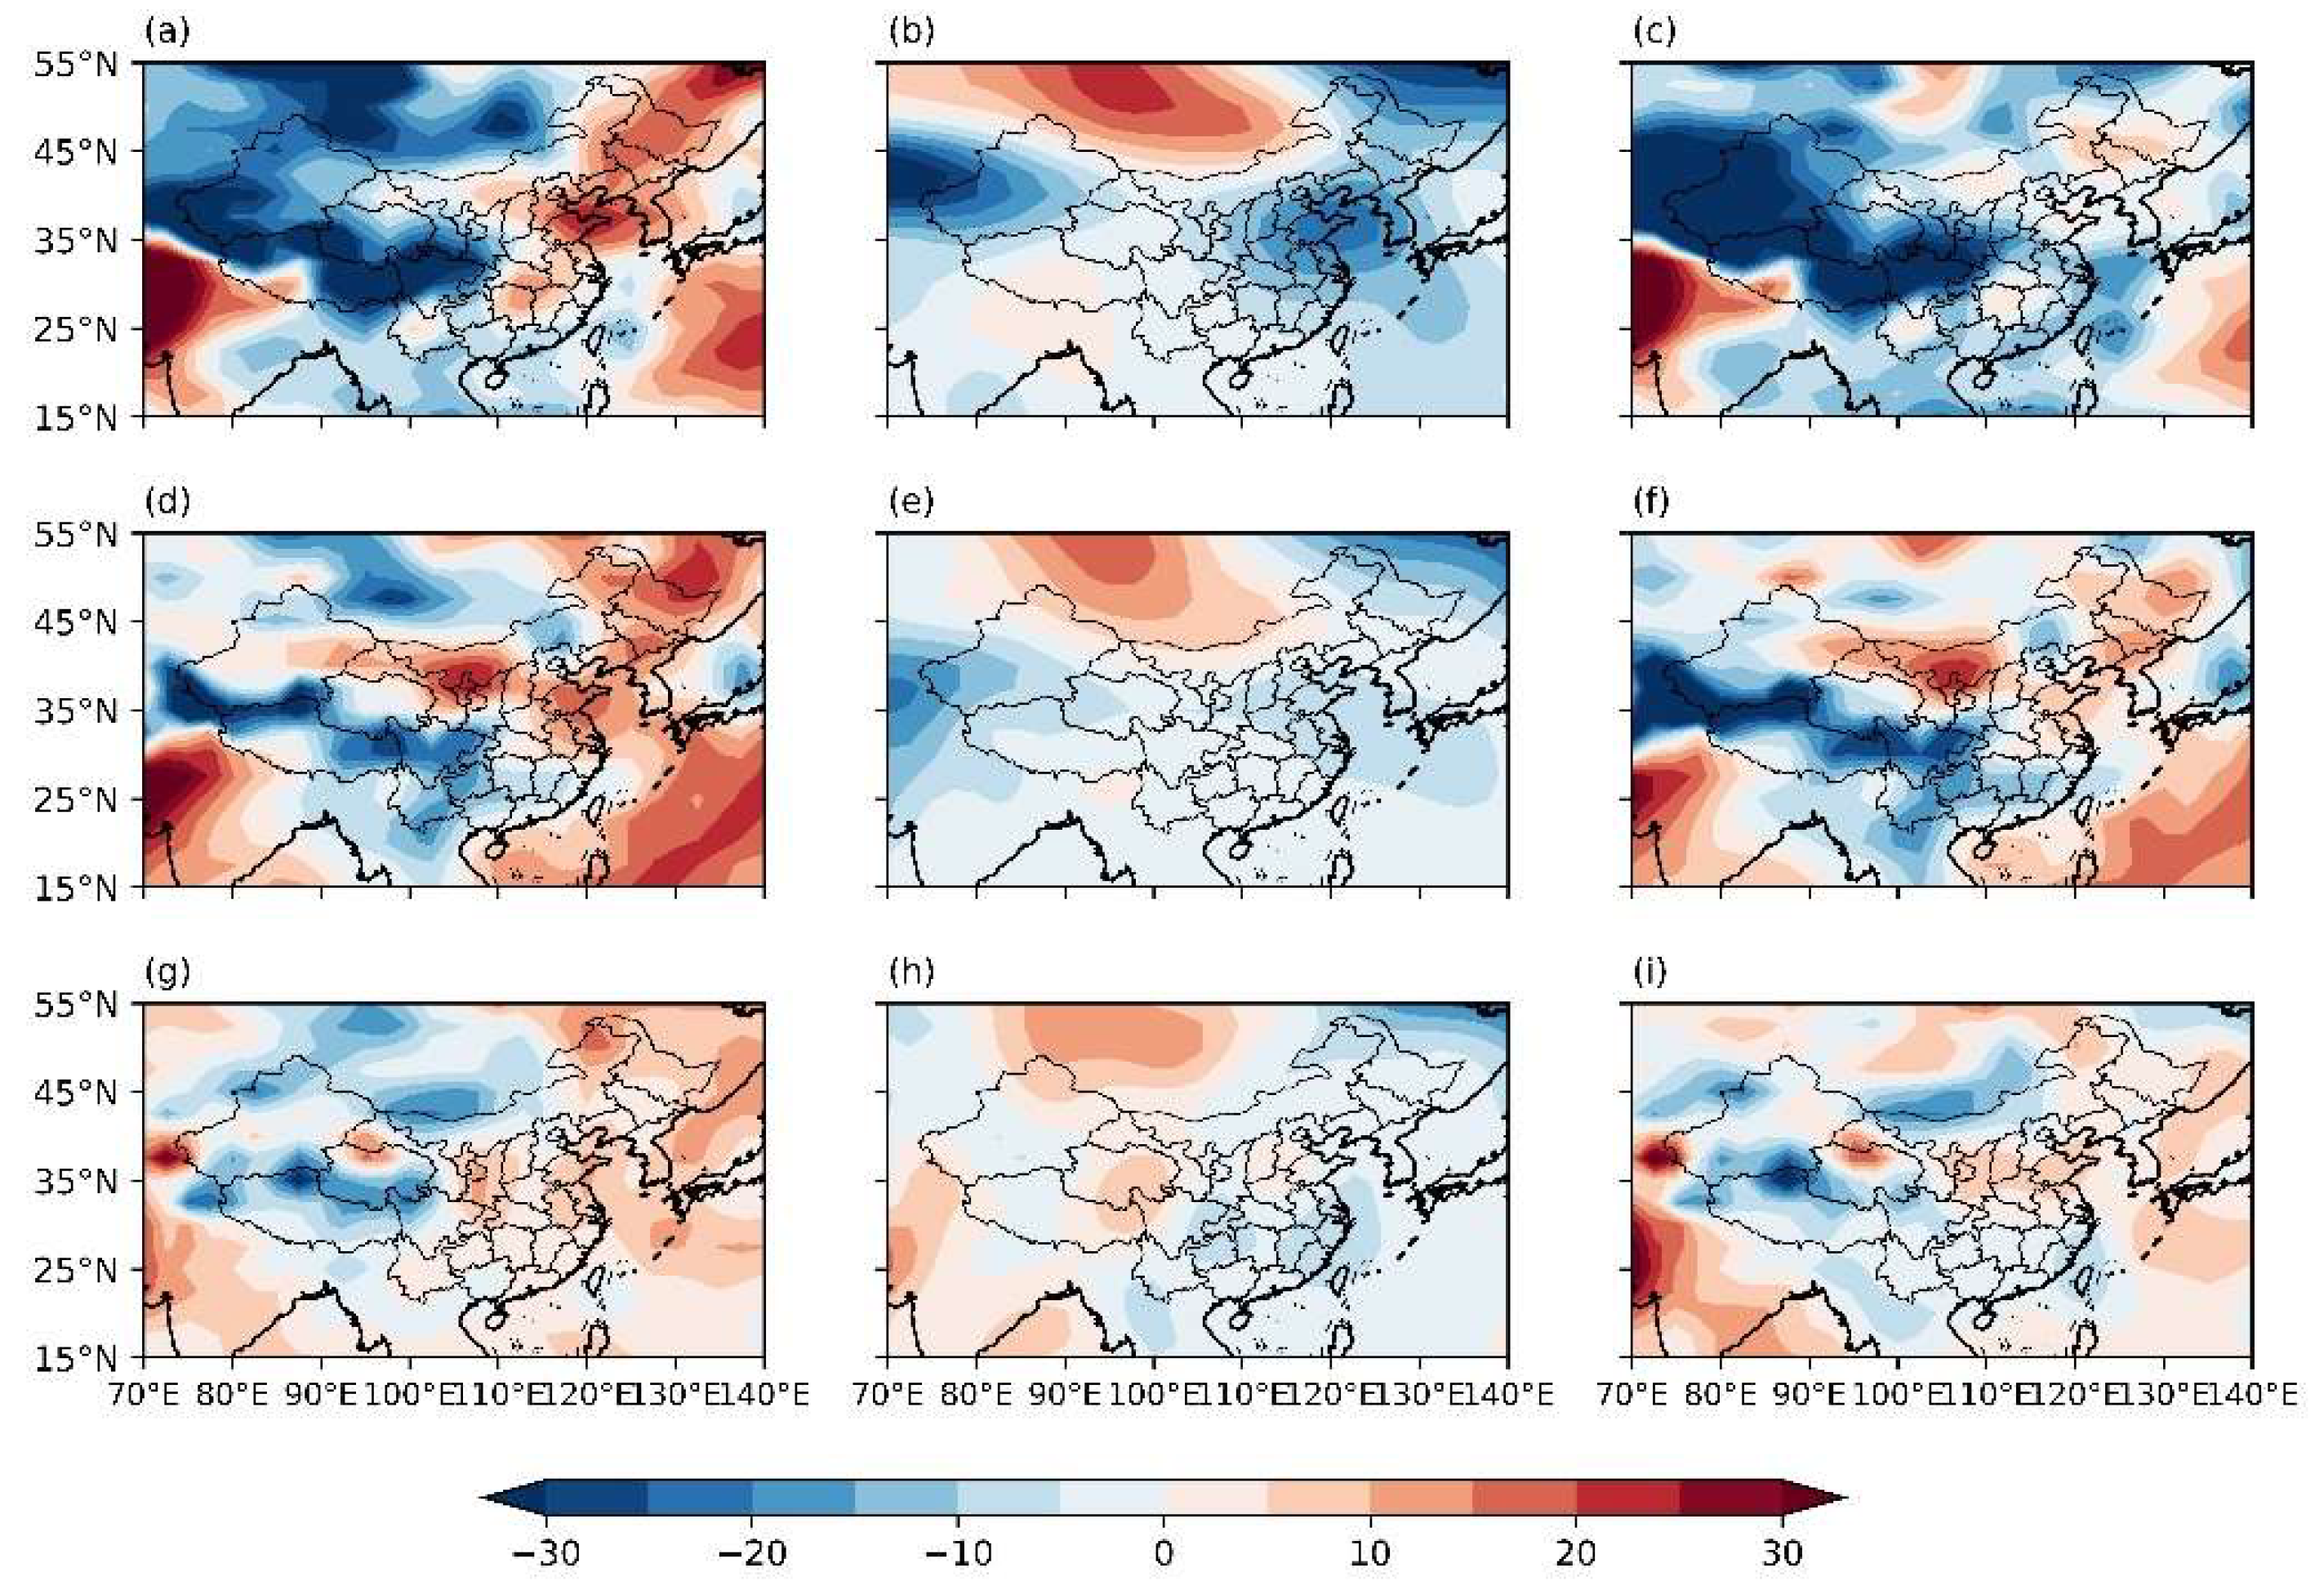
Figure 8.
The Iq, It, Ir at various levels for August 2022 (from top to bottom: 300 hPa, 500 hPa, 850 hPa; from left to right: Iq, It, Ir).
Figure 8.
The Iq, It, Ir at various levels for August 2022 (from top to bottom: 300 hPa, 500 hPa, 850 hPa; from left to right: Iq, It, Ir).
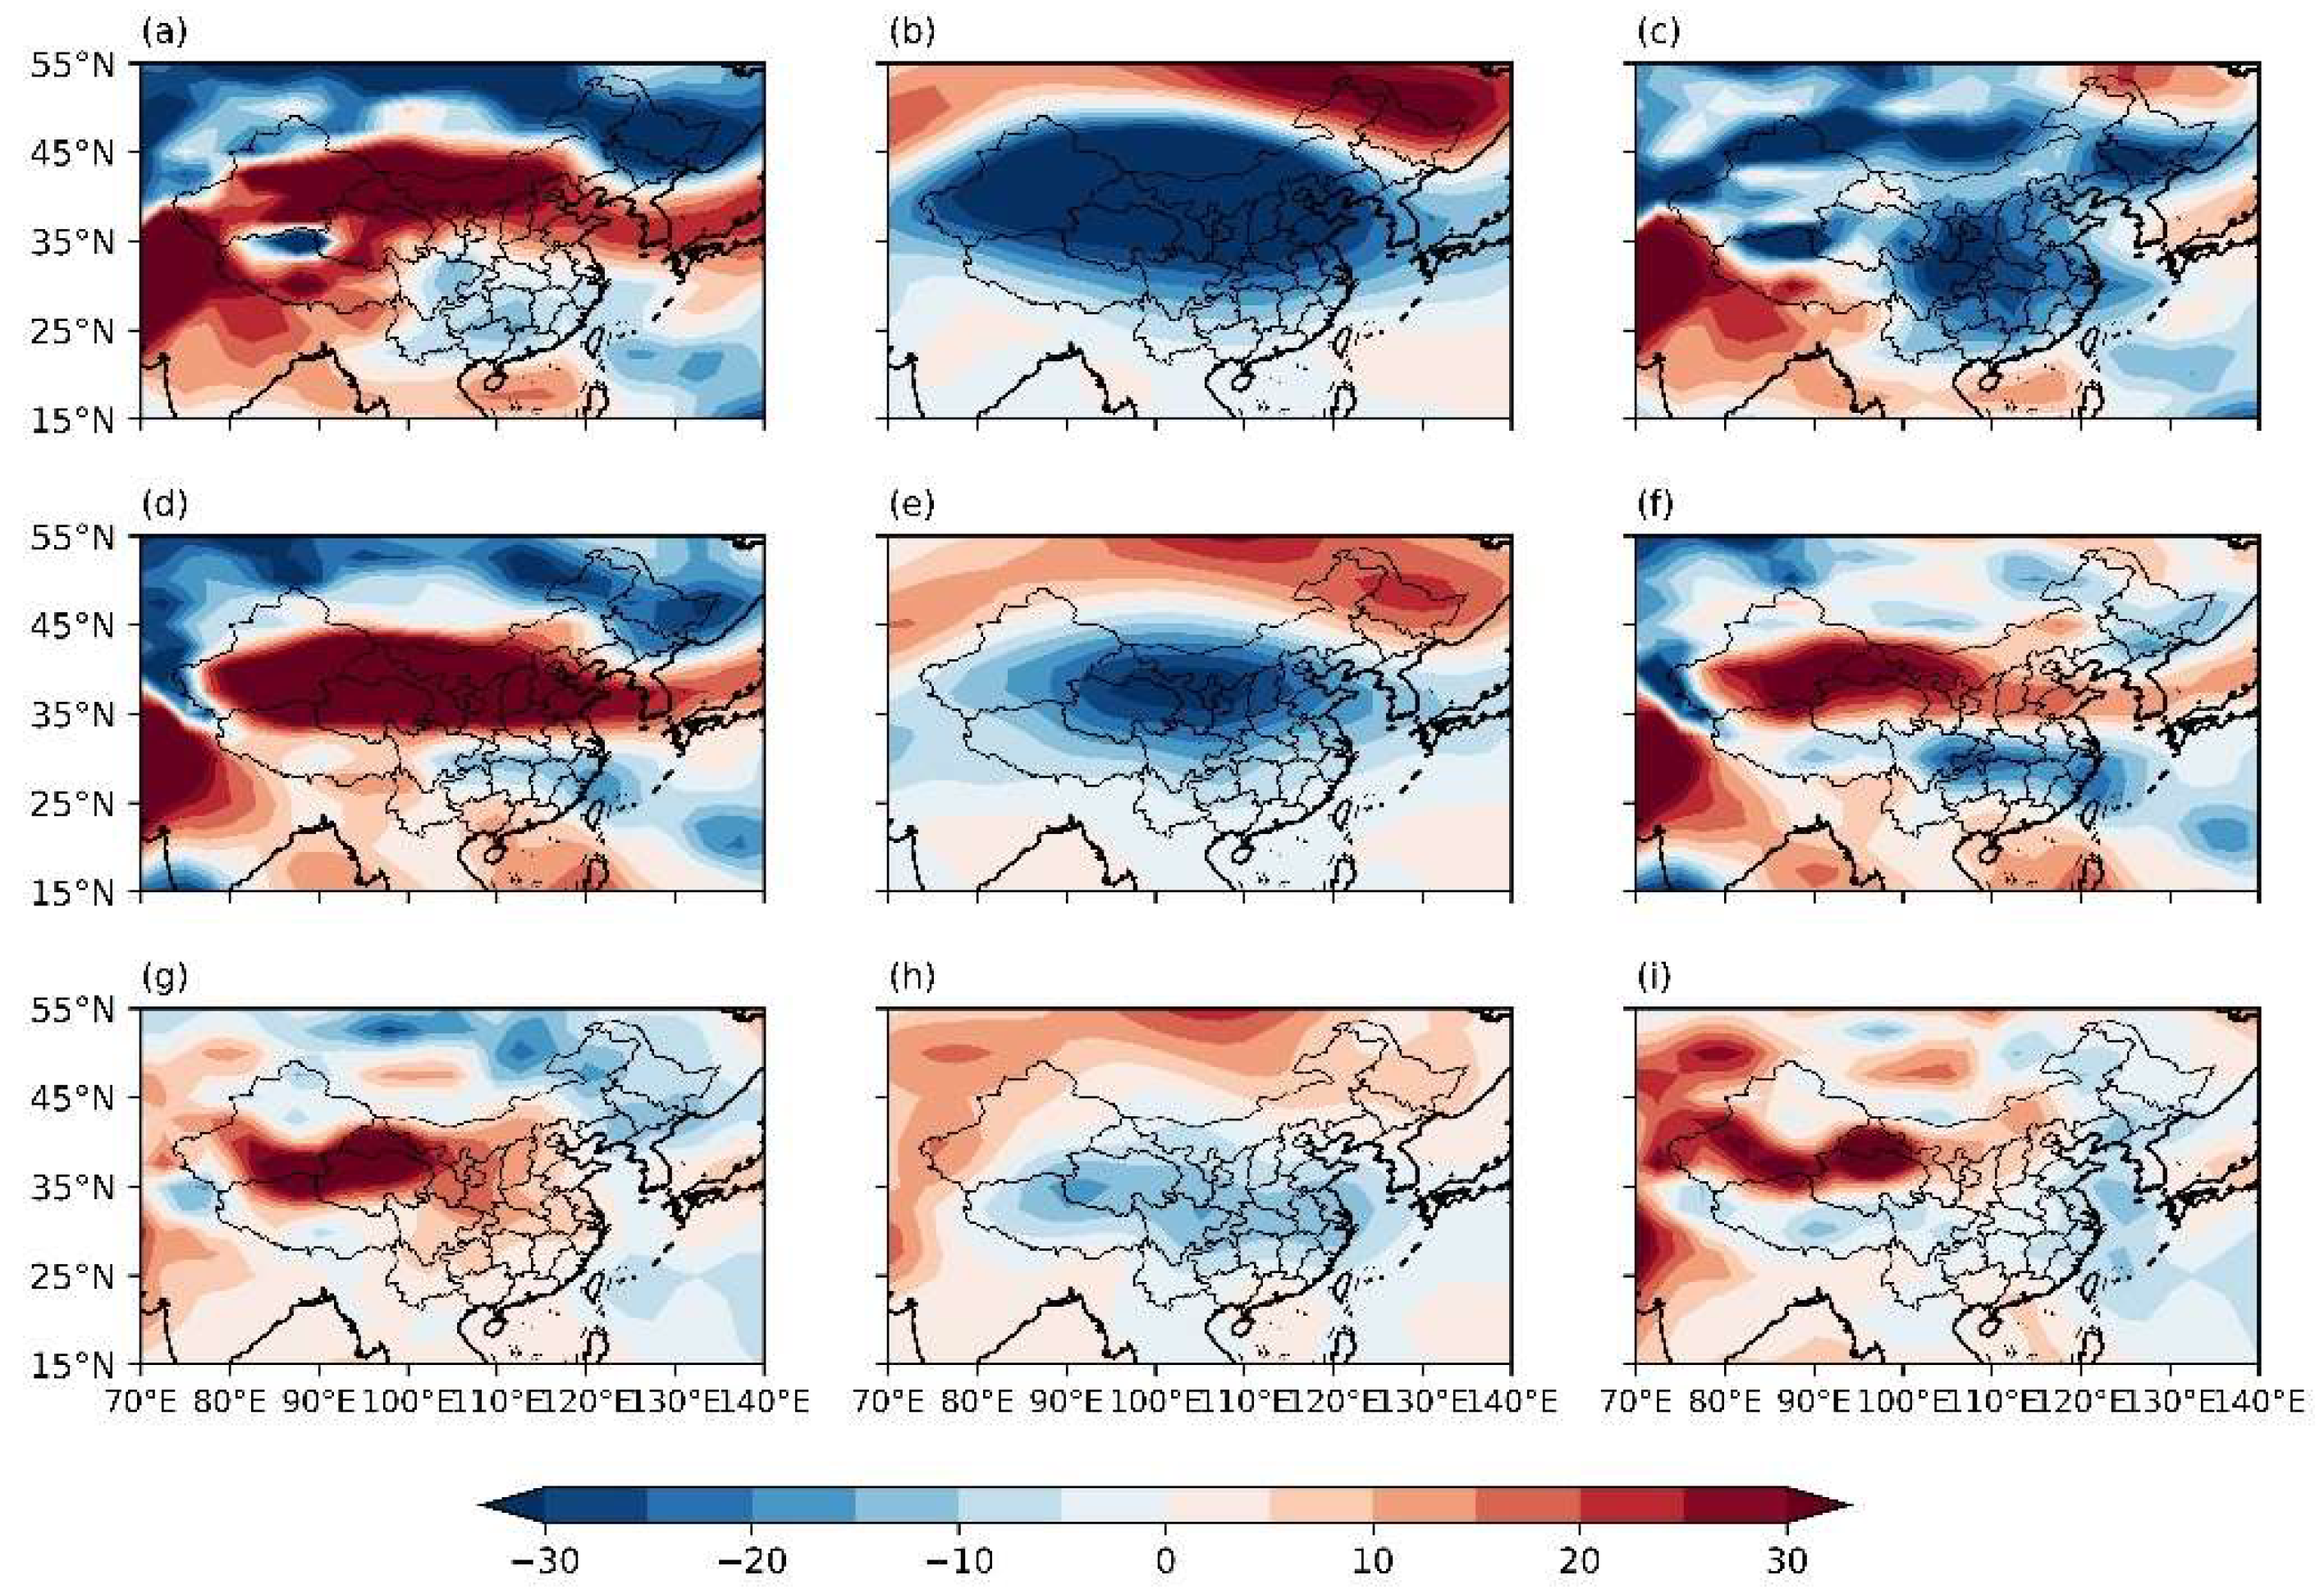
Figure 9.
The summer average of Iq, It, Ir at various levels for 2022 (from top to bottom: 300 hPa, 500 hPa, 850 hPa; from left to right: Iq, It, Ir).
Figure 9.
The summer average of Iq, It, Ir at various levels for 2022 (from top to bottom: 300 hPa, 500 hPa, 850 hPa; from left to right: Iq, It, Ir).
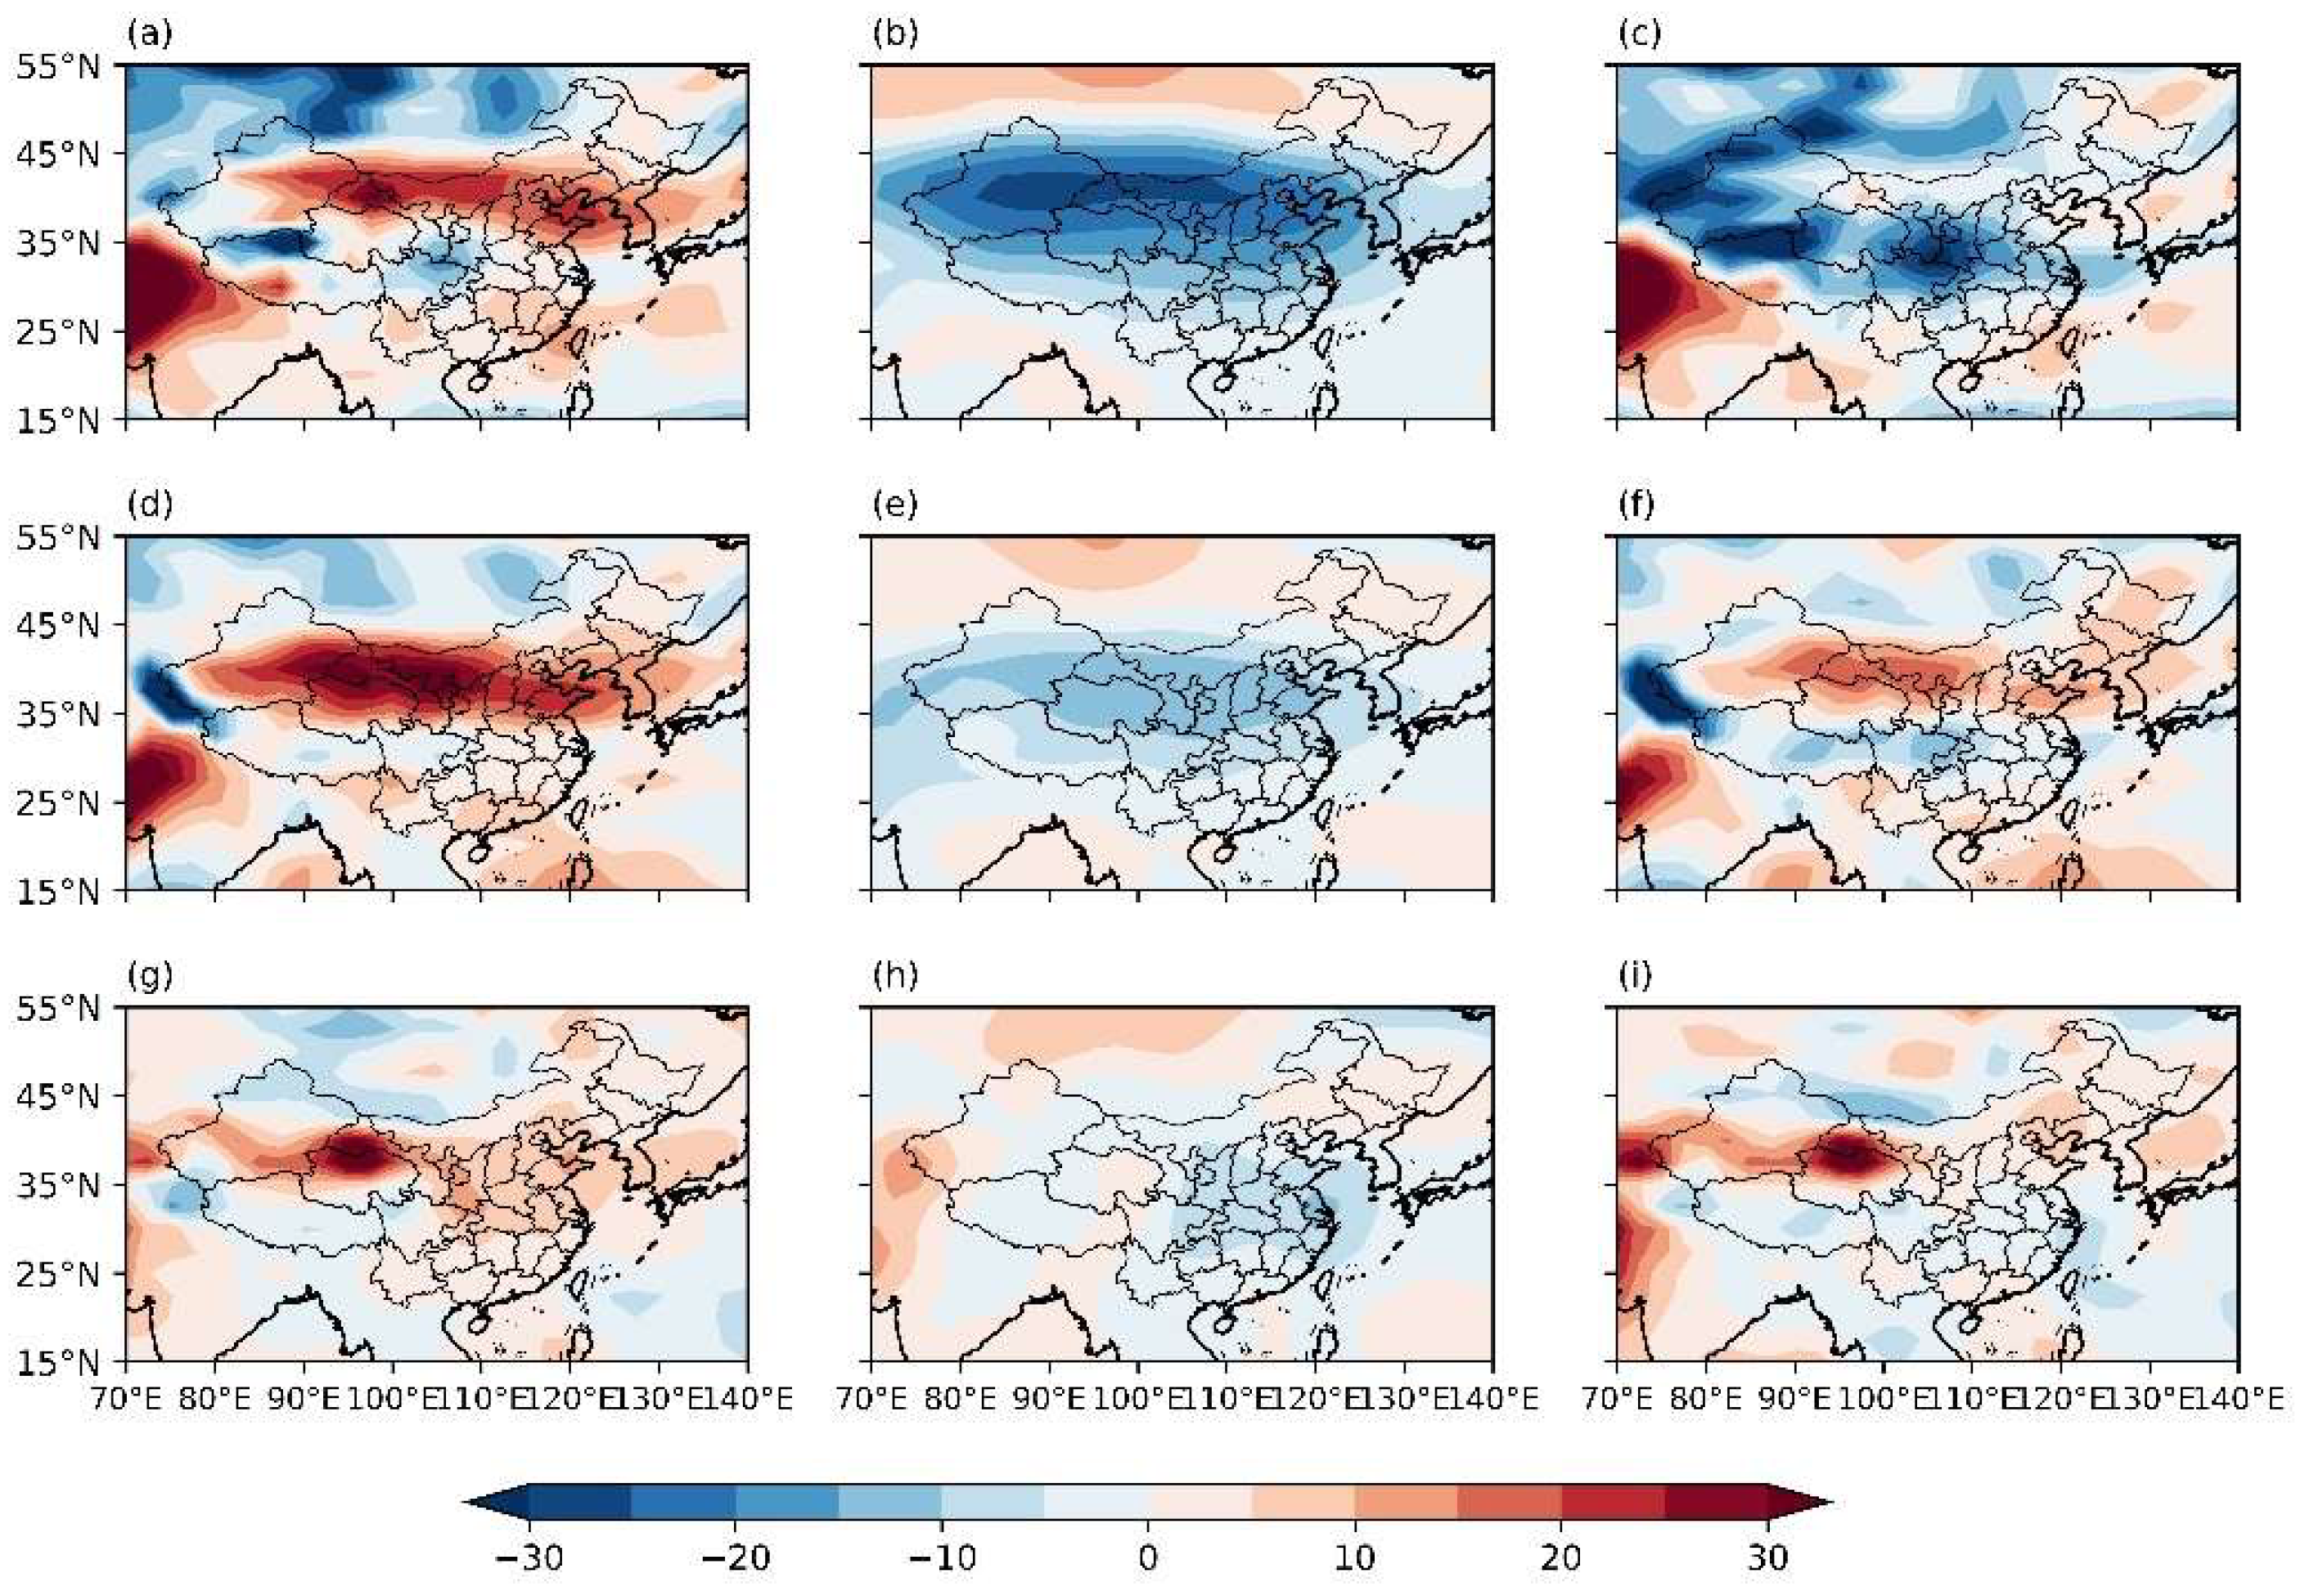
Figure 10.
The vertical distribution of the regional averages of Iq, It, Ir in the Yangtze River Basin for the summer of 2022: (a) July, (b) August, (c) Summer average.
Figure 10.
The vertical distribution of the regional averages of Iq, It, Ir in the Yangtze River Basin for the summer of 2022: (a) July, (b) August, (c) Summer average.
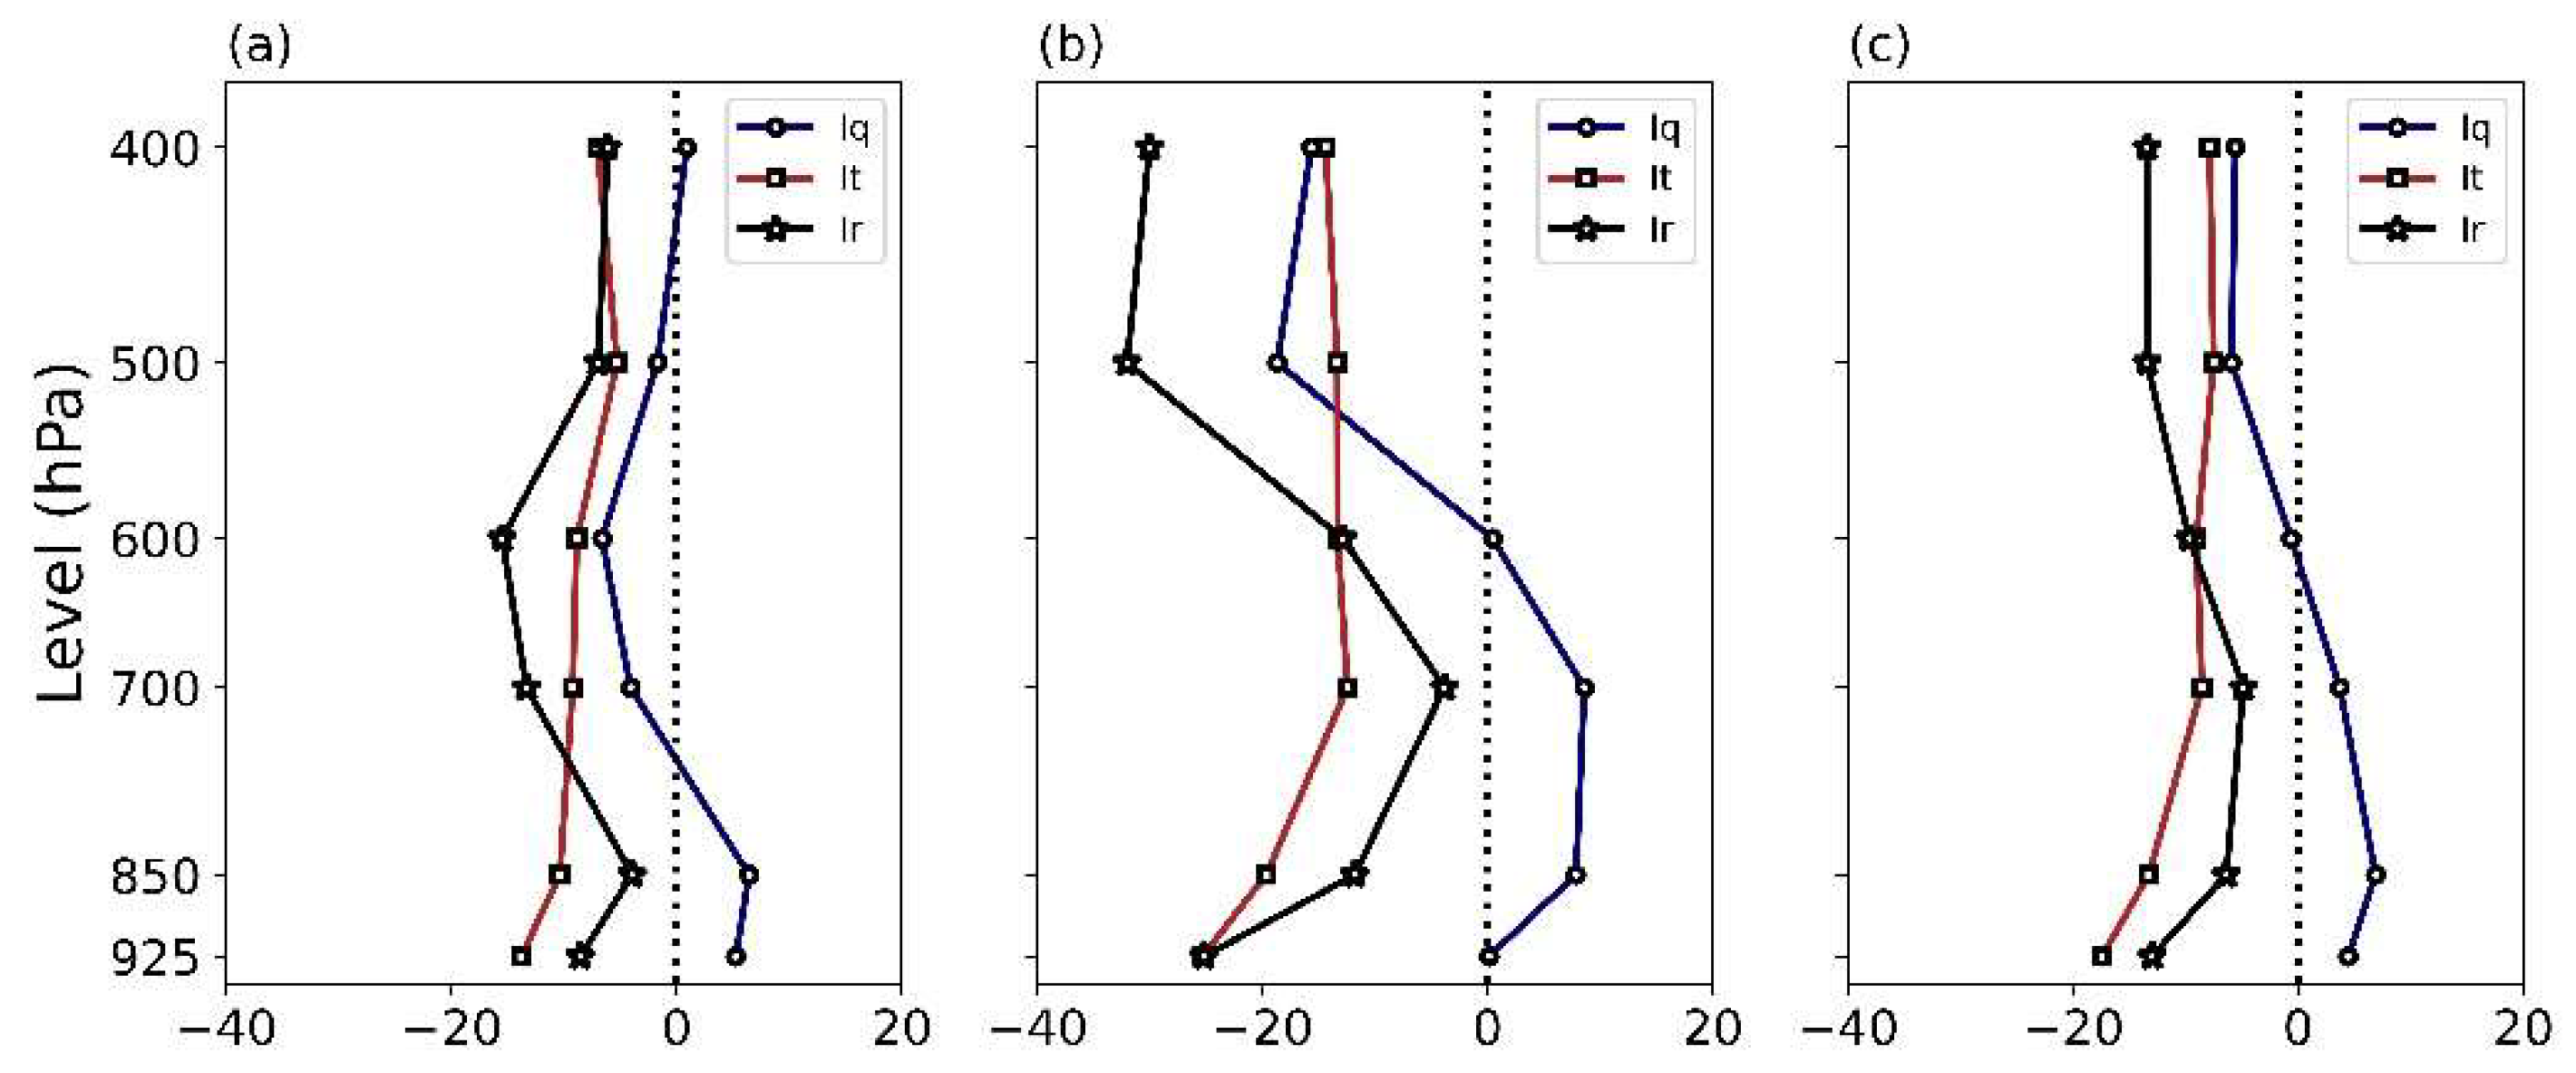
Figure 11.
Daily variation of the Western Pacific subtropical high index in the summer of 2022.
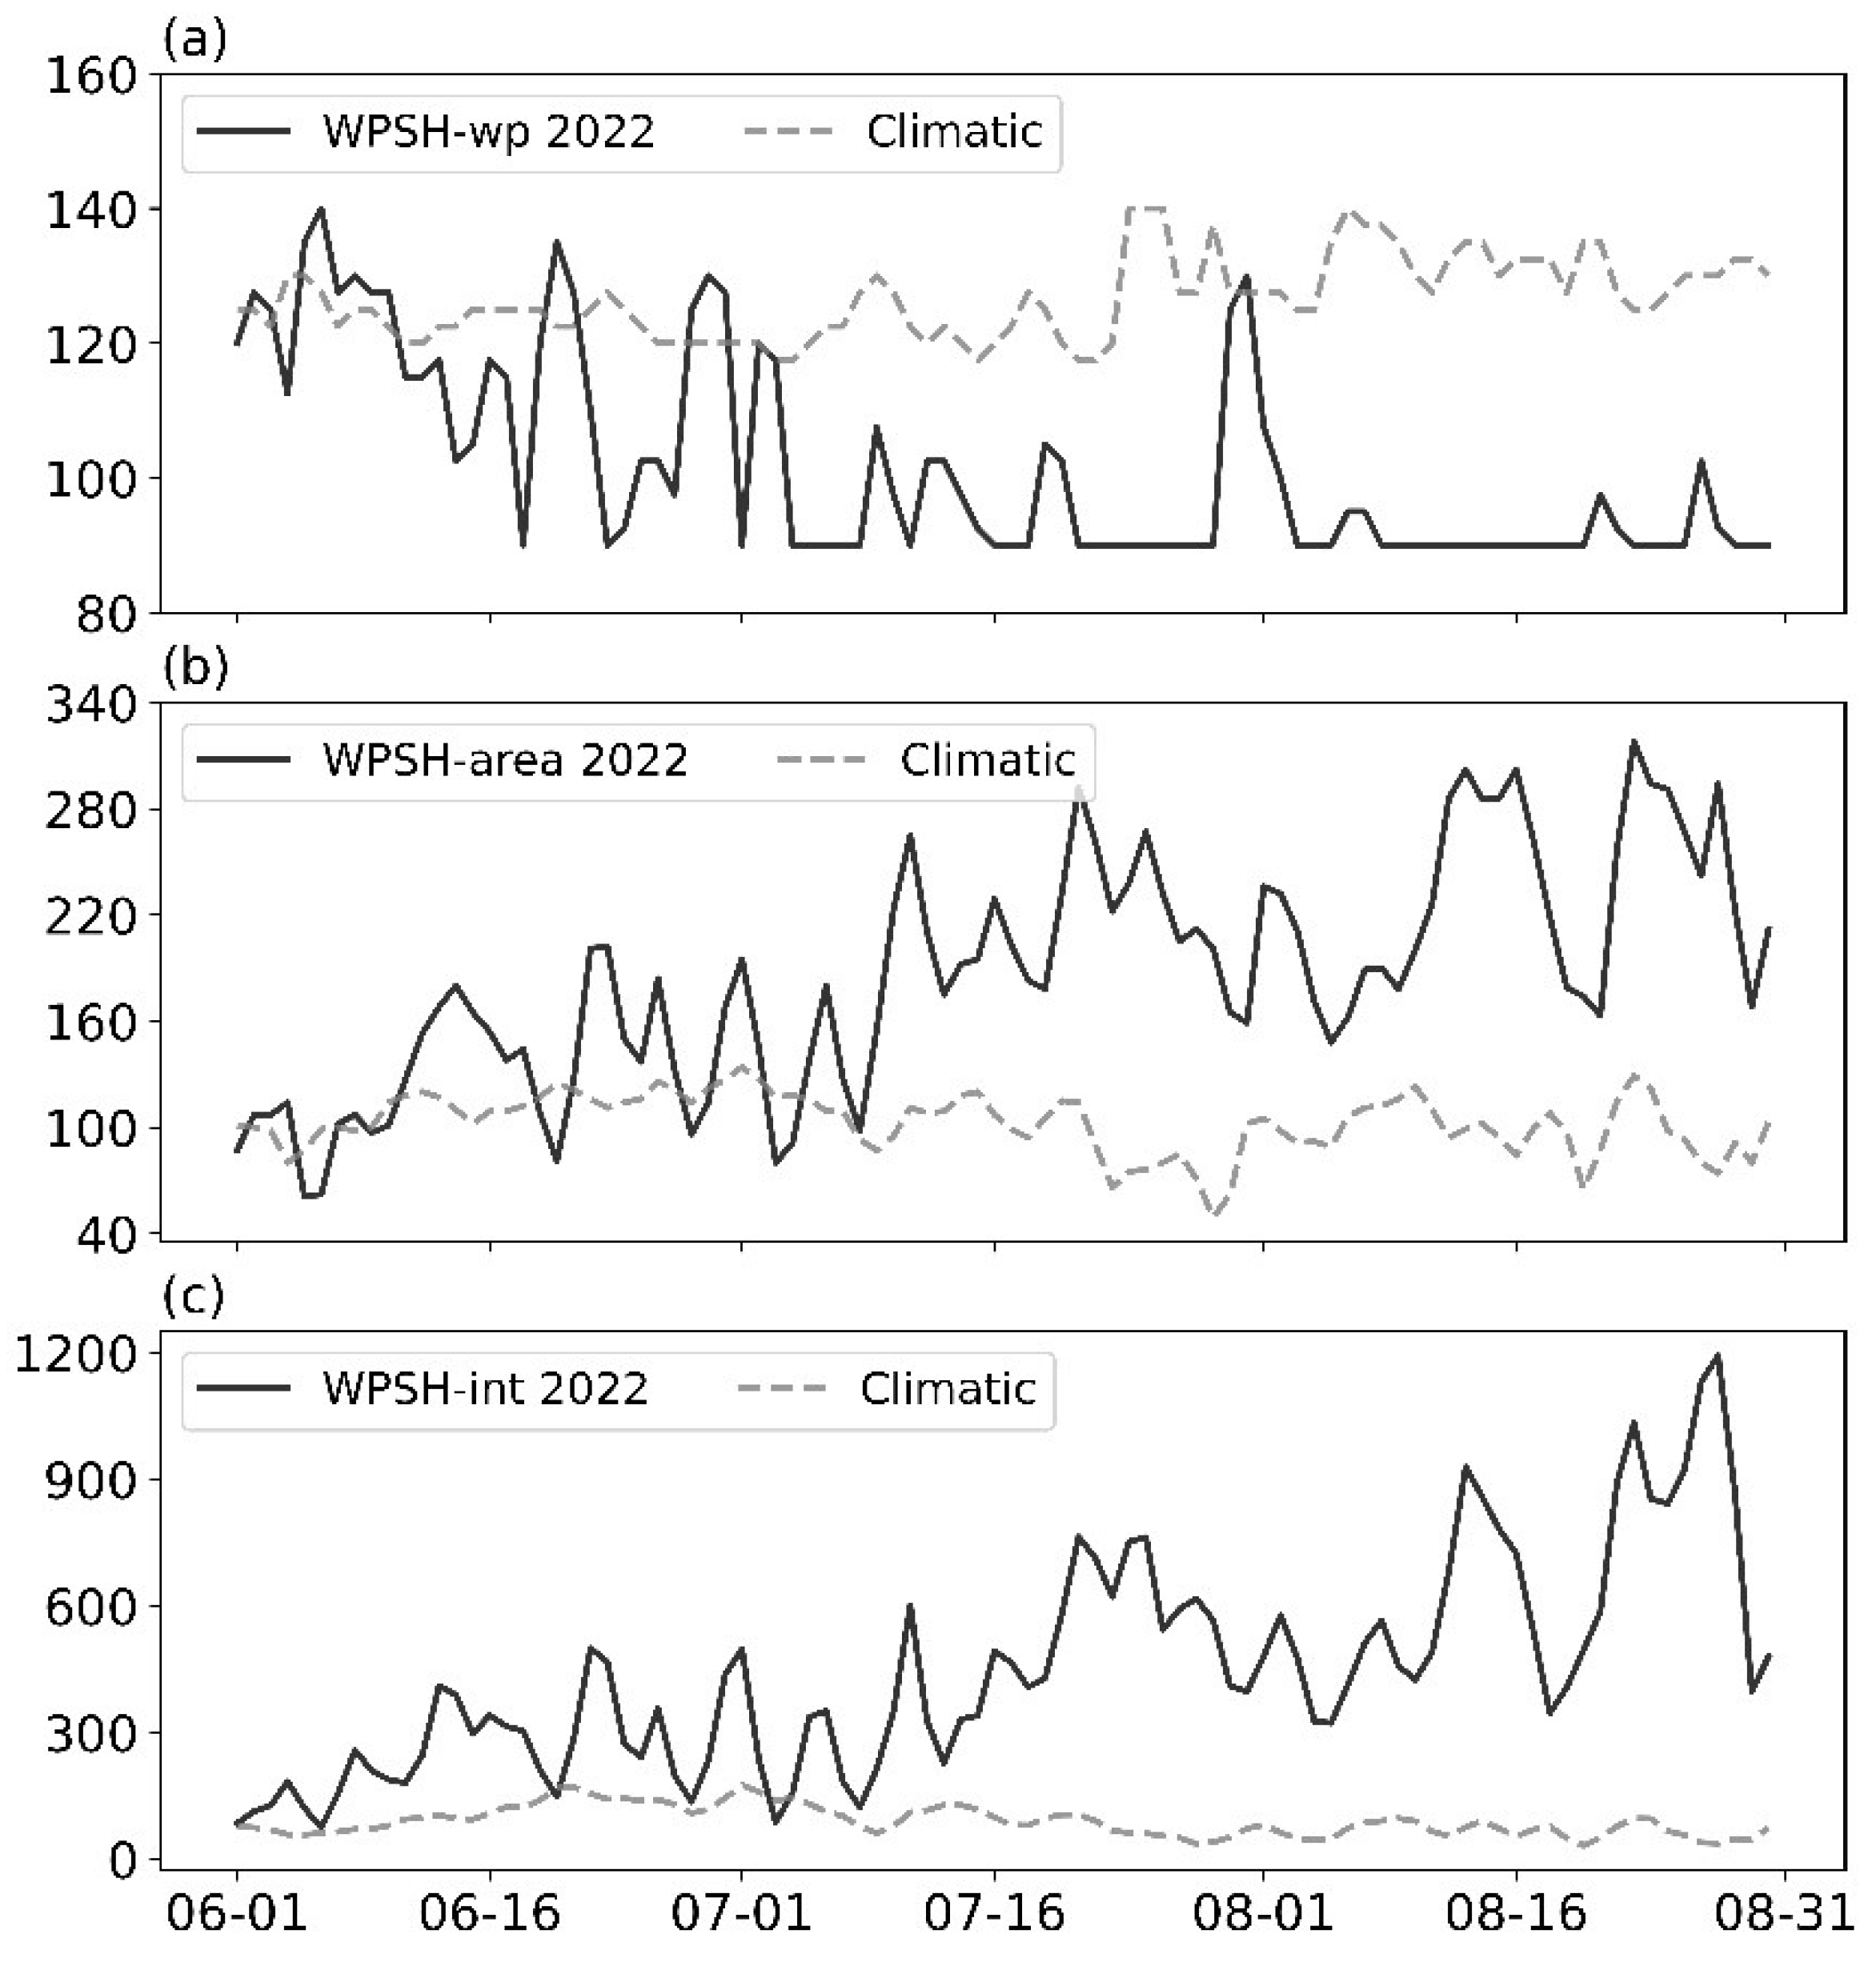
Figure 12.
The anomalies of 500 hPa geopotential height (a, b, c; unit: dagpm) and outgoing longwave radiation (OLR; d, e, f; unit: W/m²) for June (a, d), July (b, e), and August (c, f) of 2022. The red solid line represents the 588 dagpm contour line for different months in 2022, and the black solid line represents the 588 dagpm contour line for the 1991-2020 climatology.
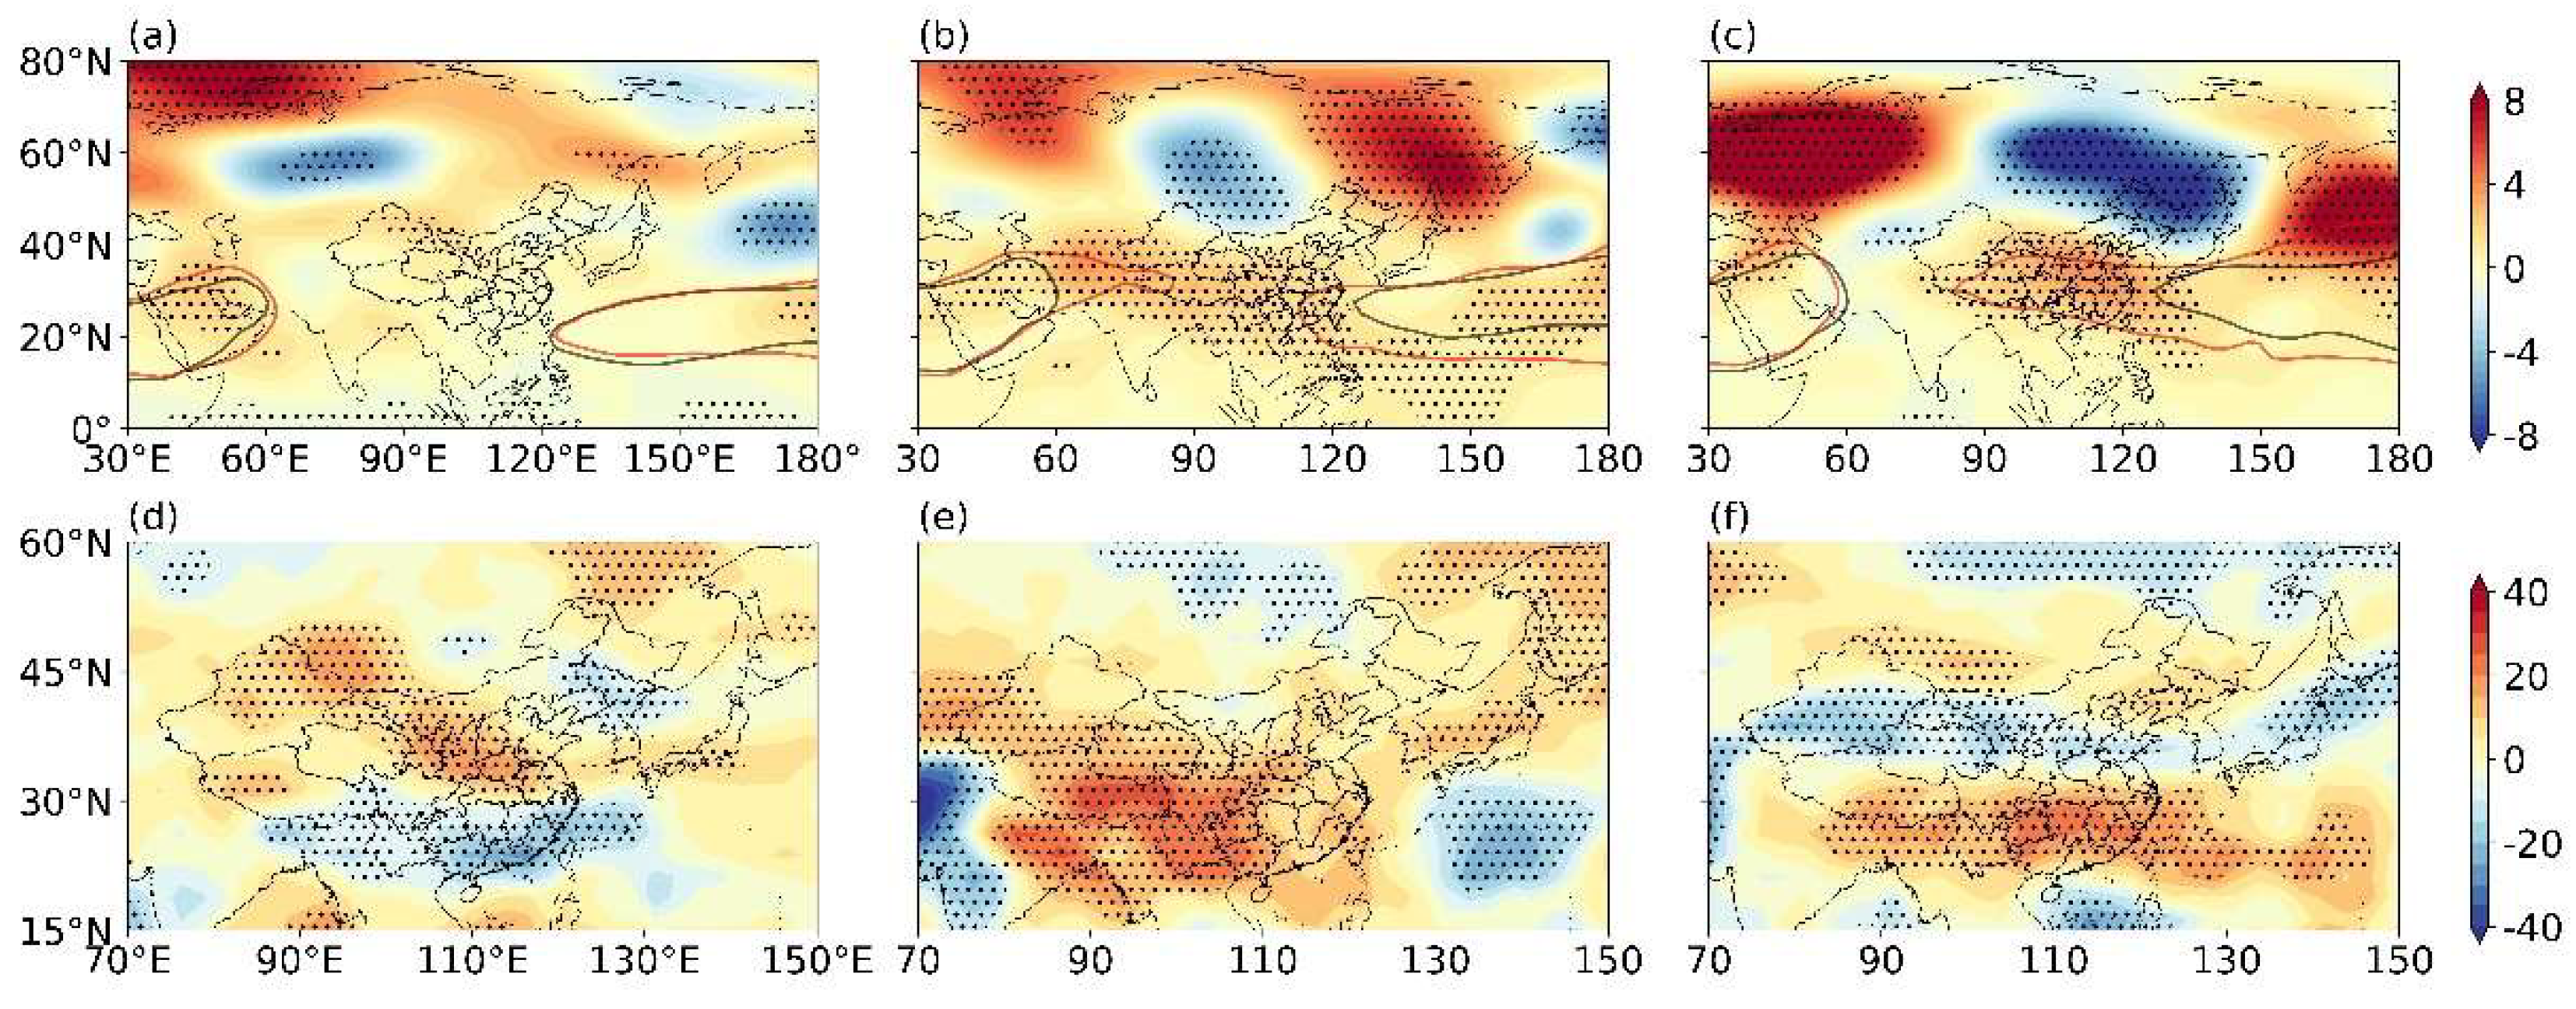
Figure 13.
The zonal mean anomalous wind field (vector lines) vertical profile and vertical velocity anomalies (unit: 10⁻² Pa/s) for July (a) and August (b) of 2022, in the region 114°-122°E.
Figure 13.
The zonal mean anomalous wind field (vector lines) vertical profile and vertical velocity anomalies (unit: 10⁻² Pa/s) for July (a) and August (b) of 2022, in the region 114°-122°E.
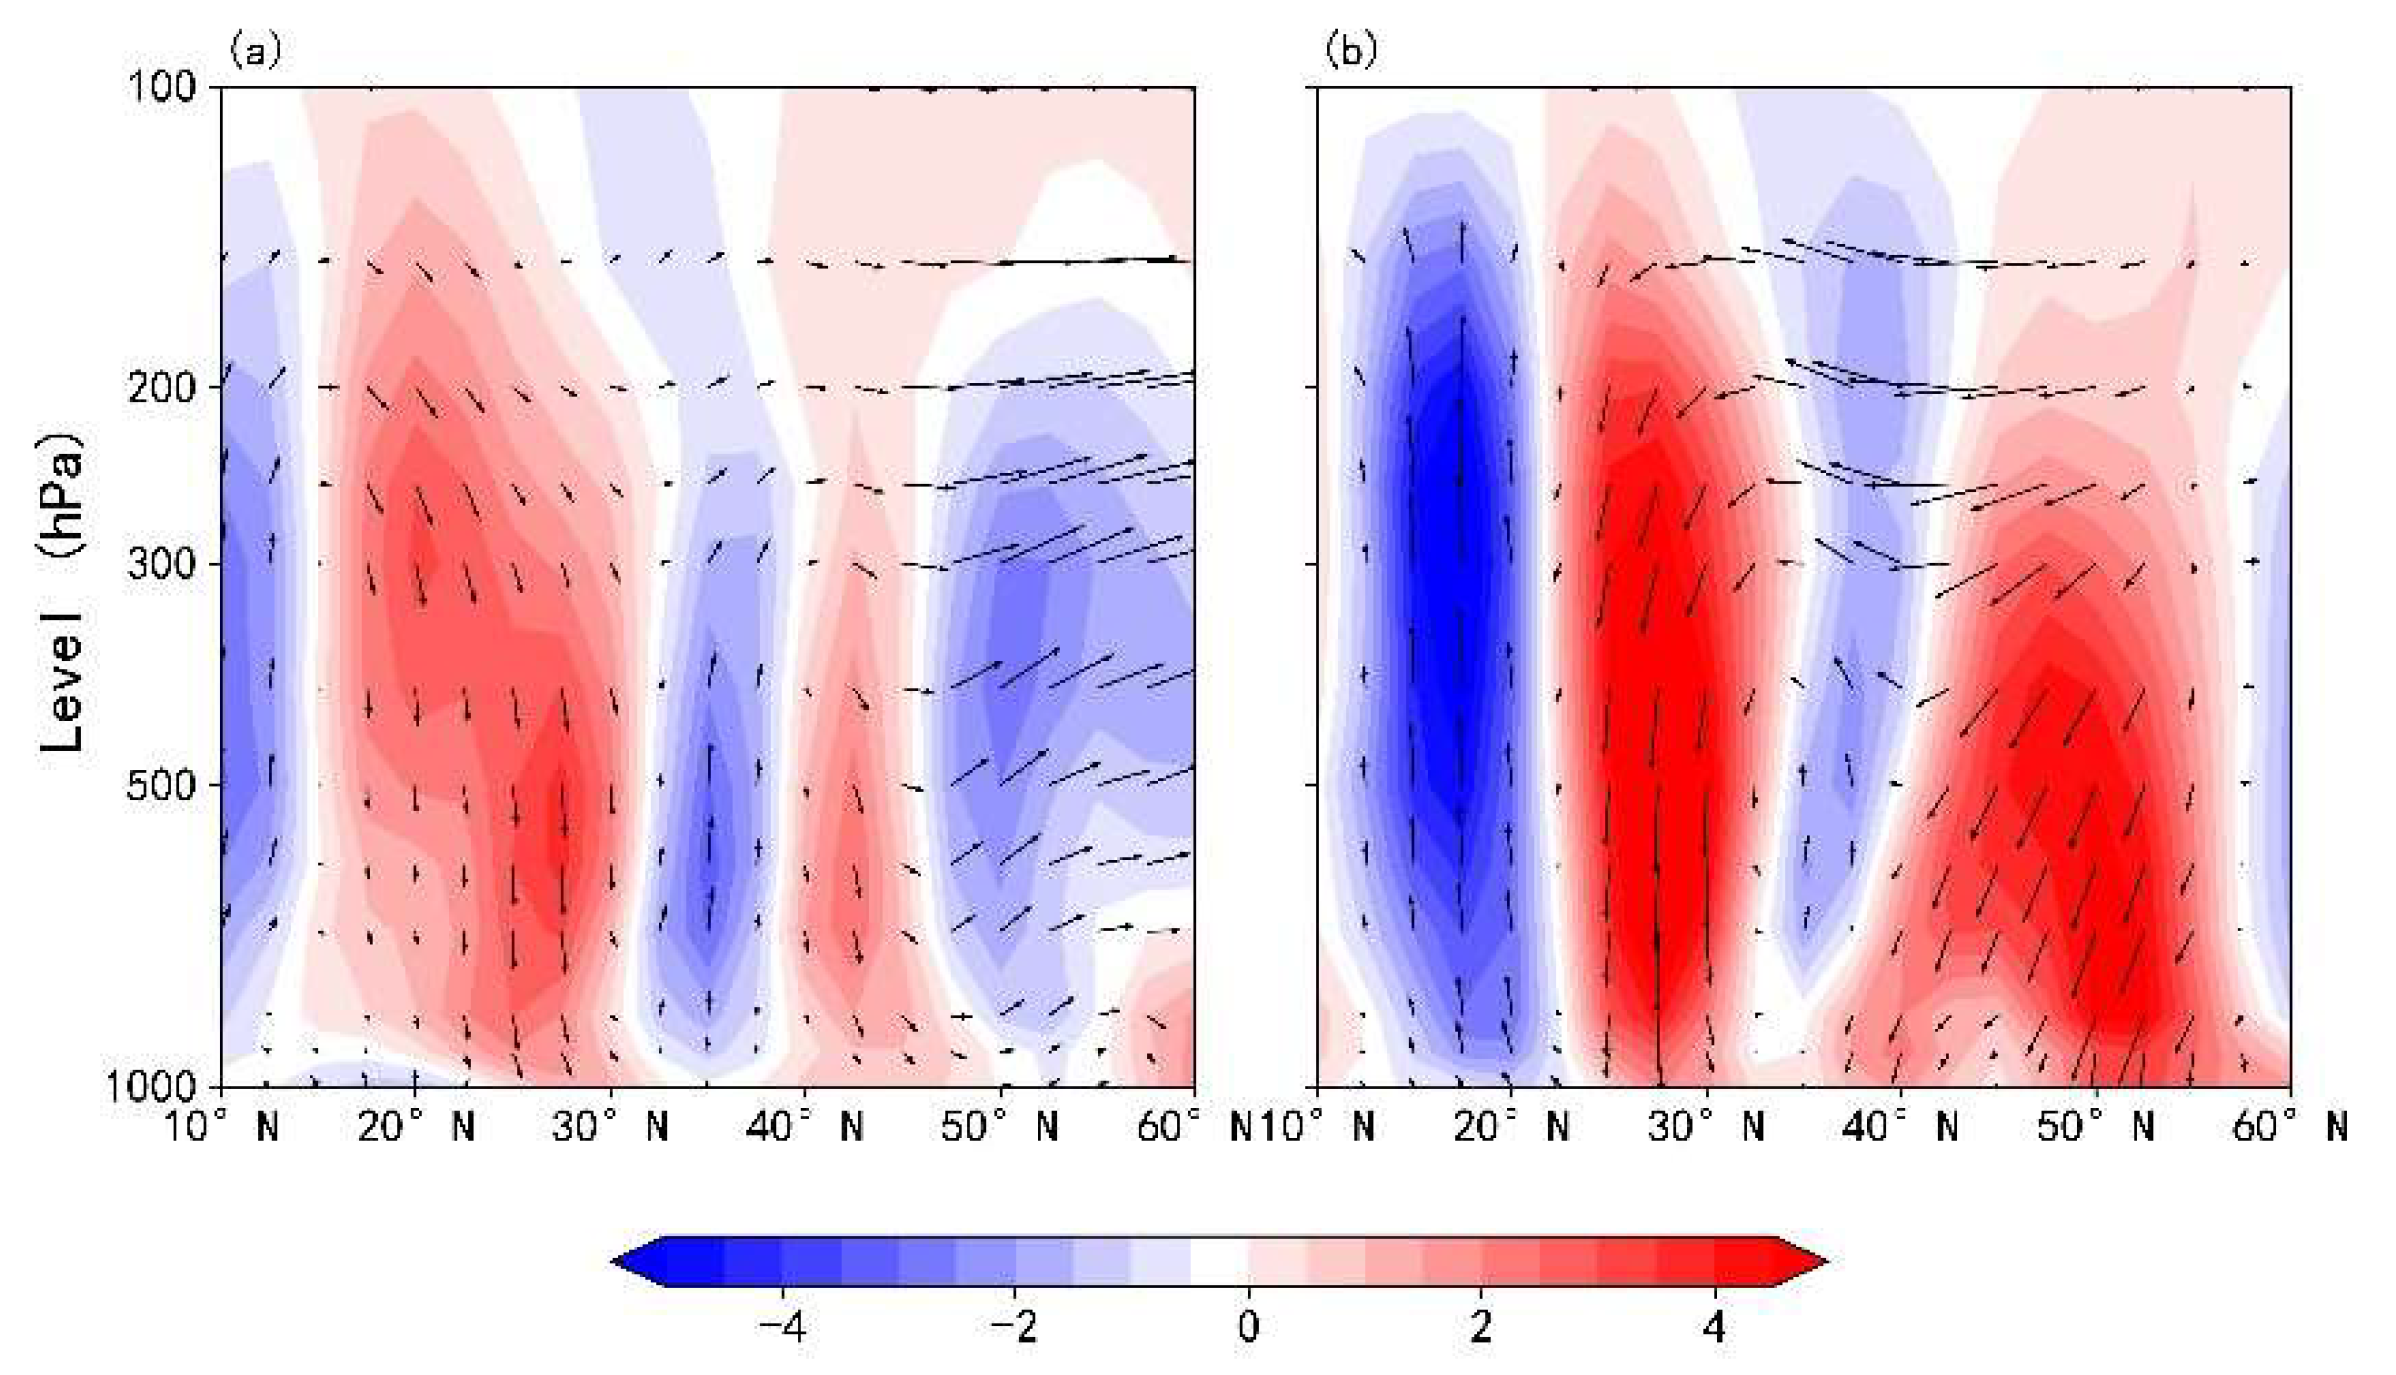
Figure 14.
The OLR anomaly averaged from August 1 to August 31, 2022 (a); daily variation of OLR (solid line) in the South China Sea convection key region from August 1 to August 31, 2022, along with the climatological average (dashed line) (b), where the vertical solid line indicates periods of high temperatures, and the vertical dashed line indicates the westward extension of the subtropical high.
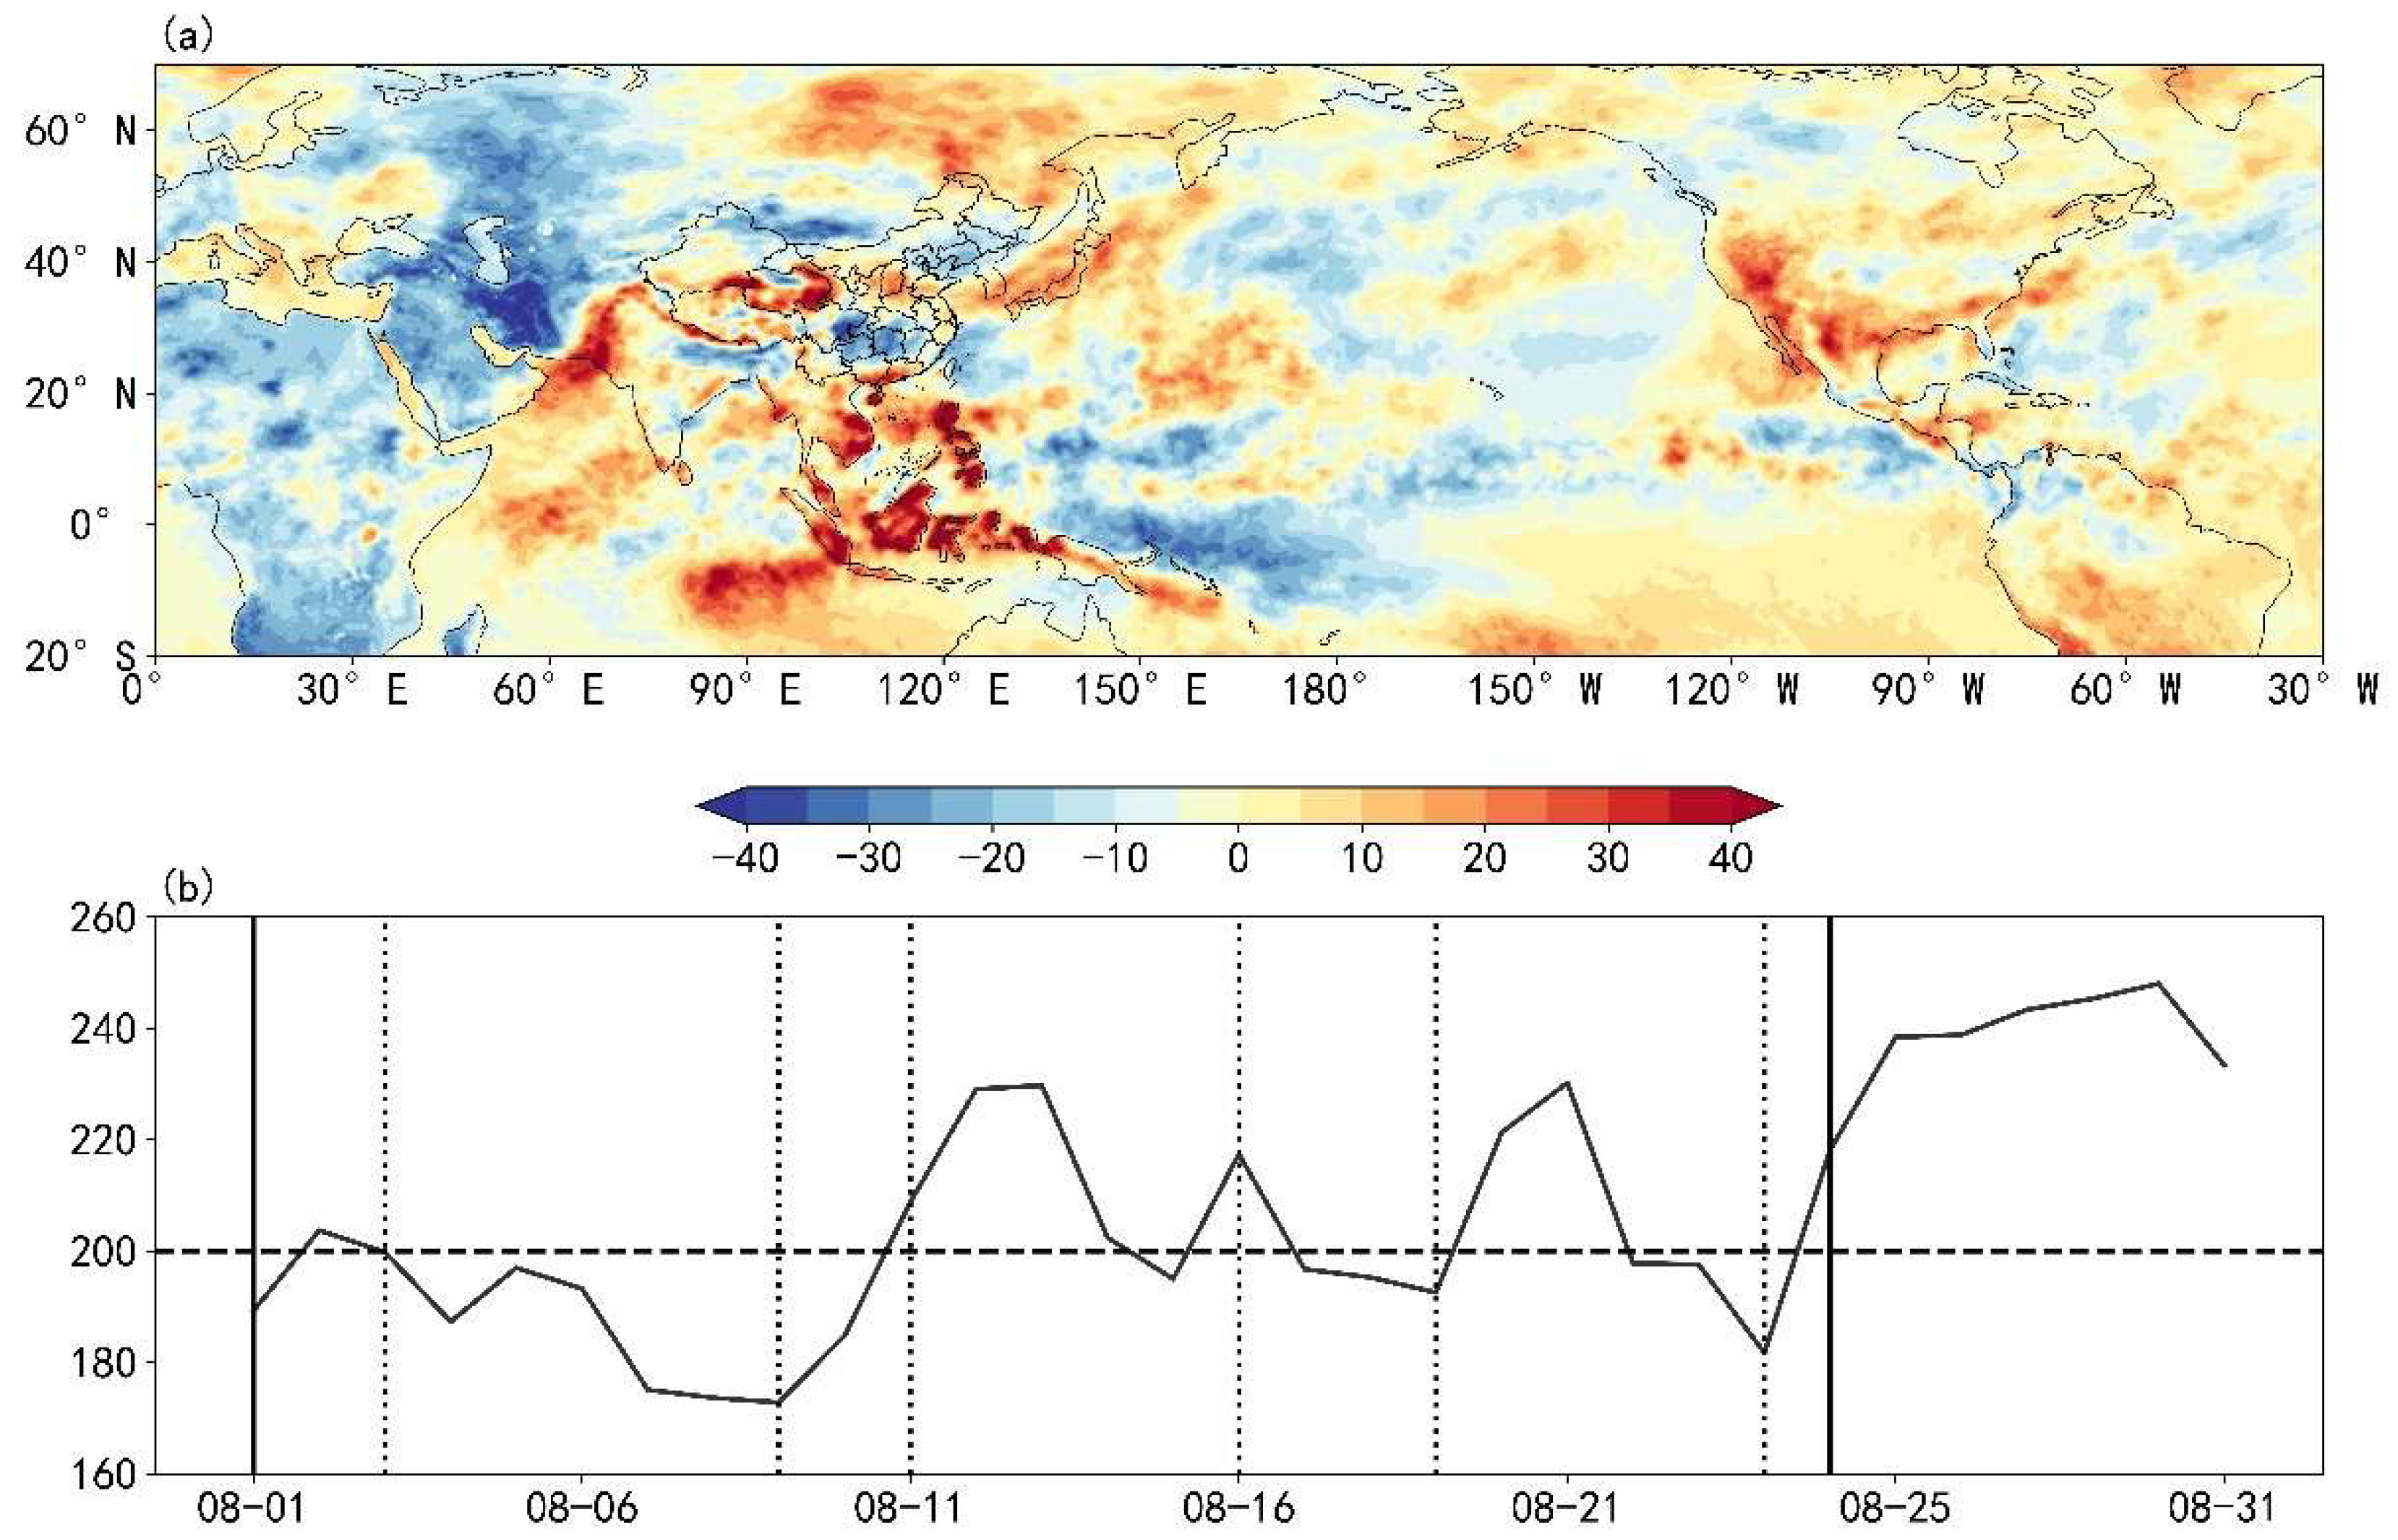
Figure 15.
The time-latitude cross-section of the meridional wind anomaly at 850 hPa, averaged from August 1 to August 31, 2022, in the region 108°-130°E (unit: m·s⁻¹).
Figure 15.
The time-latitude cross-section of the meridional wind anomaly at 850 hPa, averaged from August 1 to August 31, 2022, in the region 108°-130°E (unit: m·s⁻¹).
Disclaimer/Publisher’s Note: The statements, opinions and data contained in all publications are solely those of the individual author(s) and contributor(s) and not of MDPI and/or the editor(s). MDPI and/or the editor(s) disclaim responsibility for any injury to people or property resulting from any ideas, methods, instructions or products referred to in the content. |
© 2025 by the authors. Licensee MDPI, Basel, Switzerland. This article is an open access article distributed under the terms and conditions of the Creative Commons Attribution (CC BY) license (http://creativecommons.org/licenses/by/4.0/).
Copyright: This open access article is published under a Creative Commons CC BY 4.0 license, which permit the free download, distribution, and reuse, provided that the author and preprint are cited in any reuse.


