Submitted:
24 March 2025
Posted:
25 March 2025
You are already at the latest version
Abstract
The study and preservation of illuminated manuscripts, particularly miniatures on parchment, are crucial for understanding the artistic, cultural, and technological history of the past. This research investigates the materials used in a 16th-century illuminated scroll, analyzing both the miniatures and the written text through non-invasive techniques. A multi-analytical approach was applied, including optical microscopy, Hypercolorimetric Multispectral Imaging (HMI), Infrared Reflectography in the 950-1700 nm range, Fiber Optics Reflectance Spectra (FORS), macro X-ray fluorescence (MA-XRF) spectroscopy, Raman spectroscopy and External Reflection-Fourier Transform Infrared spectroscopy (ER-FTIR). These methods provided a comprehensive characterization of the chemical composition and artistic techniques employed, revealing new information on Renaissance materials and practices. The mineral-based pigments identified include smalt, vermillion, lead white, rouaite or gerhardtite. Aluminosilicate and calcite were used as fillers or substrates for organic dyes used for pink hues. Moreover, gold and silver were employed in decorations both as foils and shell pigments. Finally, the capital letters were created with smalt and vermillion, while the black text ink is composed by iron gall ink, commonly used on parchments.
Keywords:
MA-XRF
; multispectral imaging
; Raman Spectroscopy
; ER-FTIR
; illuminated manuscript
; FORS
1. Introduction
Analyzing the materials in Renaissance miniatures is essential to understand the techniques, cultural context, and historical value of these artworks [1,2,3]. Renaissance miniatures, often found in illuminated manuscripts, were created using sophisticated techniques and sometimes rare and precious materials that showcase the skill and artistry of their creators. These miniatures not only served religious, educational, and decorative purposes but also symbolized wealth and power, due to the precious materials often involved. Indeed, one key reason for analyzing materials in Renaissance miniatures is to better understand their economic and symbolic value. For example, pigments such as ultramarine blue, derived from lapis lazuli, were rare and costly, often reserved for high-status commissions [4]. Another significant aspect is understanding the chemical composition and degradation behavior of pigments, dyes and binders [5]. Renaissance miniatures, like all historical artifacts, are vulnerable to environmental factors such as light, humidity, and temperature fluctuations. Inks, organic pigments and binders can be particularly sensitive, leading to fading or discoloration over time [6]; preventive non-invasive investigations [7,8] can provide insights on how to improve proactive conservation actions.
An effective approach for analyzing Renaissance miniatures involves the use of non-invasive and non-destructive multispectral and hyperspectral imaging techniques to detect inhomogeneities in the spectral behavior of the materials and to uncover hidden details [9]. Infrared Reflectography (IRR), for example, is a valuable tool in revealing preliminary sketches and changes made during the artistic process that are not visible to the naked eye [10,11]. This technique helps scholars and conservators understand the evolution of the artwork, offering a glimpse into the artist’s planning and modifications.
Spectroscopic analyses are essential for identifying specific pigments, dyes, binders, and supports used in the creation of miniatures. Among the most commonly employed methods are X-ray fluorescence (XRF), Raman spectroscopy and Fiber Optic Reflectance Spectroscopy (FORS) [4,12,13,14,15]. These techniques allow for the detection of elemental and molecular components within the pigments and materials, helping to identify the exact substances used in the artwork. Moreover, Fourier-transform infrared spectroscopy (FTIR) also plays an important role, providing in-depth compositional information about the pigments and binders used in the miniature without causing damage [16]. These analyses contribute to the reconstruction of the artist’s methods and offer valuable insights into the technical knowledge and creativity that shaped the piece. Moreover, these methods are crucial in assessing the stability of the miniature and recommending appropriate conservation strategies. For example, the identification of light-sensitive pigments may inform best practices for the manuscript’s display and storage, helping to prevent further deterioration.
In this study, we present the analyses conducted during a Training Camp organized in 2021 by INFN, ENEA, and the University of Tuscia on a 16th-century illuminated manuscript. The goal was to achieve a comprehensive understanding of the inorganic pigments through a multi-analytical, non-invasive approach that combined imaging techniques with spectroscopic analyses, including scanning mode investigations. Hypercolorimetric Multispectral Imaging (HMI) [17,18,19,20,21] allowed to acquire data across a wide spectral range, from ultraviolet (UV, 300 nm) to near-infrared (NIR, 1000 nm), enabling us to perform various digital processing techniques on the calibrated images. To investigate the underdrawings more thoroughly, IR-reflectography images were captured in the 950-1700 nm range. Spectroscopic techniques such as macro X-ray fluorescence (MA-XRF), Raman Spectroscopy, Fiber Optic Reflectance Spectroscopy (FORS) and external reflection Fourier Transform Infrared spectroscopy (ER-FTIR) were employed for a detailed analysis of the pigments, binders, and supports. Finally, optical microscope observation was employed to identify specific details of the pictorial techniques, particularly regarding pigment mixtures.
2. Materials and Methods
2.1. The Illuminated Parchment
The illuminated parchment, shown in Figure 1, is dated back to 1585 AD (as reported on the document itself), now preserved in the parish Church of the Saints Valentine and Hillary in Viterbo (Italy). Originally the scroll belonged to the Brotherhood of the Corpus Christi of Civitella d'Agliano, a small town in the province of Viterbo, part of the Diocese of Bagnoregio at the time of the creation of the text. The information about the parchment was gained exclusively from the text written on it in Latin language, as usual for ecclesiastical and civil documents in that period. No written sources and archival references were found concerning the parchment, so the translation and interpretation were fundamental to understand its significance and value. The main concepts expressed in the parchment text are summarized as follows:
- -
- the parchment is an important document from the Counter-Reformation period, where the strength of the orthodoxy of the Catholic Church expressed by the Dominican Order is highlighted, starting from the title (Sit Nomine Domini Benedictum in Saecula Amen; Be the Name of God Blessed Forever Amen).
- -
- the text indirectly retrieves the apprehension and insistence of the members of a small and recently established Brotherhood, the one of the Corpus Christi of Civitella di Agliano, who requested approval from the Dominicans. In fact, the members of the Brotherhood were worried of not having acted according to the expected rules, i.e. by asking the permission of the Dominicans.
- -
- the document, in response to the requests of the Brotherhood, is drawn up by Frater Sixstus Fabri Lucensis Generalis Magister of the Dominican Order and Professor of Theology. He confirmed the approval and guaranteed the authorization to constitute the Brotherhood through patentibus literis (the parchment itself), to build an altar and a chapel in the Church of San Pietro in Civitella d'Agliano in the Diocese of Bagnoregio.
The illuminated frame is characterized by decorative elements and by four Saints represented in the upper part (left and right sides) and in the central part (left and right sides). The two Saints in the central parts are clearly Dominicans friars easily recognizable by their typical white dress with black mantle. The Dominican on the left side is Saint Peter from Verona identified thanks to the saber on the head by which he was killed.
The other Dominican on the right side is Saint Thomas from Aquino whose iconographic symbols are the ostensory, the book and the sun in his chest.
The Saints in the upper part of the frame are St. Peter (identified by the key) and St. Paul who can be inferred from the sword and from his usual association with St. Peter. The Christ Child is painted in the middle circle in a blue background with golden stars.
2.2. Experimental Section
2.2.1. Hypercolorimetric Multispectral Imaging (HMI)
The first step of the diagnostic campaign performed on the artwork was multispectral imaging investigation in the UV-Vis-NIR spectral range done with HMI system developed by Profilocolore (Rome, Italy) in 2013 [16,17] based on the following main components:
(i) the acquisition device is made up of a Nikon D800 camera modified in full range to register images in the spectral range 300-1000 nm and it is equipped with 60mm lens; optical filters for UV-Vis and Vis-IR acquisition (named filter A and filter B respectively) and for UVF (UV-IR cut filter coupled with filter A) and light sources (two modified flashes, NEEWER (Neewer, Shenzhen, China) 750II Flashes Speedlite TTL with LCD Display and Wireless Triggers. The flashes were modified by removing their front plastic lenses, thus allowing emissions in the 300–1000 nm region for multispectral imaging, and two UV CR230B-HP 10W LED projectors, peak emission at 365 nm, for ultraviolet fluorescence); white references patches positioned around the parchment and a colorchecker (version 8.0) made of 36 standard colours and 8 grayscale patches, plus two reference white and two blacks [7,8,9]; the illuminating sources are positioned at about 45° in respect to the artwork surface;
(ii) the calibration software, named SpectraPick®; it allows to obtain imaging data for seven monochromatic bands (.tiff images) centered at 350, 450, 550, 650, 750, 850 and 950 nm and the visible RGB output;
(iii) the processing software, named PickViewer®, enables the extraction of information to support materials characterization and highlight surface details by applying digital image processing tools to the calibrated bands.
The processing software was used to gather the infrared false color (IRFC) and ultraviolet false color (UVFC) images, by applying the specific algorithm for false color output production. Moreover, it was used to obtain the chromatic similarity maps through the specific algorithm. This algorithm works by selecting an area in the RGB image(3x3 pixels wide) and comparing the chromatic values of that area with all the other pixels of the artwork image: where the algorithm finds similarity it sets the pixel with white color, otherwise the pixel is reported in black. At the end of the calculation a white/black image is produced where the white pixels are those with high chromatic similarity (in respect to the chosen 3x3 area color) and the black ones are those without similarity in color.
2.2.2. Infrared Reflectography in the 950-1700 nm Range
The Infrared Reflectography in the 950-1700 nm range was performed with a SWIR camera (Hamamatsu “C12741-03”) has an InGaAs sensor with the spectral range at 950–1700 nm, a resolution of 640 x 512, a pixel pitch of 20 μm2. The digital output is 14 bit. For illuminating two halogen lamps (300 W) were posed at 45° with respect to the parchment
2.2.3. MA-XRF
Macro X-ray fluorescence (MA-XRF) allowed for the elemental characterisation of the inorganic materials in the parchment, providing the elemental distribution maps of the analysed areas.
A portable XRF scanner developed by the INFN-CHNet network in Florence for cultural heritage applications was employed [22]; this instrument is compact, lightweight and provided with a dynamic positioning system allowing for the analysis of non planar surfaces. A helium flow control system to enhance the detection of low energy X-rays is also available when needed.
The measuring head consists of a Mo-anode X-ray tube (Moxtek, 40 kV maximum voltage, 0.1 mA maximum anode current), an SDD detector (Amptek XR-100 SDD with OEM configuration) and a telemeter to measure the sample-to-head distance.
The low radiation emission of the X-ray tube (40 kV maximum voltage and 0.1 mA maximum anode current) allows in situ measurements also in museums and with the public, as in this case.
Homemade software controls all the scanning process, from the motion along the three positioning stages (Physik Instrumente, 300 mm travel range in X-, 300 mm Y- and 50 mm in Z-direction), to the data acquisition and the data processing to reconstruct the elemental distribution maps. These are obtained by selecting a region of interest (ROI) in the acquired XRF spectrum, usually corresponding to the characteristic X-ray line of an element, and assigning to each pixel a grayscale level corresponding to the X-ray counts falling within the ROI: white is assigned to the maximum value, while black to the minimum. Thus, the same grey tone in elemental maps obtained from different ROI of the same spectrum may correspond to different counts and different grey tones may correspond to the same number of counts.
The experimental conditions for this campaign were:
- -
- For the illuminated parts: 38 kV anode voltage, 70 uA filament current, 10 mm/s scanning velocity and 0.5 mm step in both X and Y directions. Beam diameter on the sample surface ~1 mm, no He flow.
- -
- For the written part: 30 kV anode voltage, 95 uA filament current, 0.5 mm/s scanning velocity and 0.25 mm step in both X and Y directions. Collimator diameter 0.4 mm, no He flow.
2.2.4. Raman Spectroscopy
Raman measurements have been performed in situ using a portable BWTek (B&W Tek, Plainsboro, NJ, USA) i-Raman system equipped with a probe with a spot on the target of about 3 mm. The system is equipped with a 785 nm laser source and a cooled 2048 pixel’s CCD array detector, with a spectral resolution of 3 cm−1 and coverage of the spectral range from 0 to 4000 cm−1. Its maximum power is 30 mW. The instrument is calibrated in Raman shift by the manufacturer, which periodically carries out system maintenance. At the beginning of each measurement campaign, the spectral calibration is checked using a reference sample in polytetrafluoroethylene (PTFE), characterized by clean and well-defined Raman bands. For the present campaign, laser power was kept between 1 and 20% of the maximum rated power, with an integration time of 10–30 s.
2.2.5. External Reflectance FT-IR (ER-FTIR) Spectroscopy
FT-IR measurements were performed using a portable IR spectrometer ALPHA-II (Bruker Optics) equipped with a DTGS detector, owned by DAFNE-Light (INFN-LNF). The measurements were collected in reflection mode, in the 7000 − 360 cm−1 range with a resolution of 4 cm−1 resolution and using 128 scans. Three spectra of each investigated area were measured to generate an average spectrum. The acquired spectra were represented as Pseudo-absorbance spectra [log(1/R); R = reflectance]. In reflection mode, absorption bands can be distorted due to surface and volume reflections. Surface reflection may cause distortion in the band shape, resulting in derivative-like features and inversion bands (Reststrahlen effect). On the other hand, volume reflection (also known as diffuse reflection) produces bands similar to those obtained in transmission mode [12]. In this study, derivative-like shapes are denoted by "*" and inversion bands by "+".
2.2.6. Optical Microscopy
Optical microscopic observations were perfomed with two devices. The 20x magnifications were obtained using a Nikon D750 reflex camera equipped with a microscope objective, while lower magnifications were achieved with a Dino-Lite equipped with white LED and UV light. By exciting with the UV source, it is possible to obtain UV fluorescence images.
2.2.7. Fiber Optic Reflectance Spectroscopy (FORS)
The FORS spectra were acquired using a spectrometer, an optical probe, and a halogen light source. The spectrometer (ATP2000P, Optosky) operates within a spectral range of 200–1100 nm, providing a spectral resolution of 2 nm. The optical probe directs light onto the sample surface and collects the emitted or reflected light at a 90° angle, ensuring perpendicular illumination and detection. A halogen lamp (AVALIGHT-HAL-S-MINI2) was used as the excitation source. The FORS spectra were normalized against a Spectralon® Diffuse Reflectance Standard (Labsphere).
3. Results and Discussion
3.1. Painting Technique
3.1.1. The Support
The ER-FTIR measurements confirmed that the support is parchment by identifying the derivative-like bands at 1655* and 1550* cm-1 attributable to the amide I and amide II of collagen [3]. Moreover calcium carbonate (2515, 1787, 1416+, 870* cm-1) was detected (Figure 2), as consistent with traditional practices in manuscript preparation, where calcium-based materials were commonly applied to provide a smooth, durable, and stable surface for writing and painting [23]. The presence of Ca-based compounds is also confirmed by MA-XRF analysis.
Regarding the parchment’s conservation state, the RGB image, acquired through the HMI system together with the colorchecker used as chromatic reference (Figure 3a), shows that the parchment is not perfectly flat due to the folds that probably affected the scroll in the past. In fact, the parchment is currently embedded in the frame and protected with a glass, but in the past it was folded.
In Figure 3b, in addiction the general light blue fluorescence associated with the organic nature of the parchment, some yellow-fluorescence spots (not yet characterized) are detected in the left lower side and in the central part in correspondence of a folding. Overall, from the analysis of the UVF image it is possible to state that the parchment is in a good state of conservation, apart from the heavy signs left by the folding suffered in the past.
3.1.2. Underdrawings
Infrared Reflectography (both achieved with the HMI system and InGaAs camera) shows the presence of underdrawing particularly in fleshtones and lighter draperies (yellow and red). The underdrawing does not show significant changes with respect to the final version of the paints. We can notice a great cure in the definition of the pictorial composition due to the fact that the decorative elements in the foreground (i. e. the palm, the lantern) were already provided in the drawing and, thus, were not directly painted on the underlying backgrounds, as shown in Figure 4.
3.2. Pigment Identification
To identify the pigments used, MA-XRF analysis was performed on selected areas of the illuminated scroll. Specifically, Figure 5 shows the distribution of the detected elements in three areas corresponding to the depiction of three saints.
The red hue is primarily composed of mercury (Hg), as shown in Figure 5, indicating the use of vermilion (HgS), confirmed by Raman spectroscopy through the characteristic peaks at 253 and 343 cm⁻¹ (Figure 6a).
In the pink hues, the ER-FTIR spectrum (Figure 6b) reveals bands at 3540 cm⁻¹, 2425 cm⁻¹, 1397+ cm⁻¹, and 670* cm⁻¹, which are attributed to hydrocerussite [3,24]. MA-XRF in these areas confirms the presence of Pb. Additionally, the presence of aluminosilicates is indicated by bands at 1030-1000+ cm⁻¹, 904+ cm⁻¹, 526+ cm⁻¹, and 466+ cm⁻¹ [25]. The FORS analysis reveals two absorption bands at 530 and 570 nm (Figure 6c).
These findings, combined with the detection of green fluorescence in the UVFC and a yellow-orange hue in the IRFC image, suggest the presence of an animal-derived lake (Figure 7) [26]. Moreover, Raman spectroscopy identifies vermillion in some pink areas related to the upper decorative motif, likely indicating its use to darken shaded regions.
The orange hue is mainly composed by lead (Pb), as shown in Figure 5. Raman spectroscopy reveals the presence of minium (121, 150, 225, 314, 391, 549 cm-1) as shown in Figure 8.
The blue color appears as red-purple in infrared reflectography (IRFC) and green in the ultraviolet fluorescence (UVFC), as shown in Figure 7, as typical of silicate-based pigments [27]. MA-XRF analysis detected the presence of silicon, cobalt and potassium (Figure 5), suggesting the use of smalt, which has the following typical composition: SiO₂ (65–72%), K₂O (10–21%), and CoO (2–18%) [28]. Additionally, the presence of iron, bismuth and arsenic can be attributed to the cobalt ore [29,30]. Infrared reflectance images further support the identification of this pigment, as at higher wavelengths (900–1700 nm), it shows significant IR absorption, appearing dark in images captured with the InGaAs camera, as illustrated in Figure 9a-c.
Furthermore, the XRF map shows that lead is present in all the blue pictorial layers, as illustrated in Figure 5, suggesting the use of a lead-based compound. Optical microscopy reveals the presence of white grains dispersed within the blue pigment (Figure 9d), indicating that the layer is composed of multiple materials. This hypothesis is further supported by ER-FTIR analysis, which confirms the presence of lead white through its characteristic bands at 1397+ cm⁻¹ and 670* cm⁻¹ (Figure 9e).
The green pigment appears dark yellow/brown in the UVFC and blue in the IRFC (Figure 7) suggesting the use of copper-based compound as confirmed by MA-XRF in Figure 5. Raman spectrum (Figure 10) shows the peaks at 152 (w), 277 (s), 708 (w) and 1086 (vs) cm-1 that can be attributed to calcium carbonate, whereas the peaks at 377 (s), 430 (w), 455 (w), 505 (w), 897 (w), 1116 (s), 1140 (w), 1260 (w), 1336 (w), 1377 (w), 1470 (w), 1527 (w) 1605 (w), 2896 (vw) could be attributed to use of microcrystalline cellulose [31]. This could be suggested by the use of a cellulose-based consolidant [32]. The ER-FTIR spectra confirm the presence of calcite, indicated by bands at 2516, 1795, 1421+, and 876* cm-1. However, additional bands were detected at 3536*, 2740, 2604, 2470, 2346, 2140, 2087, 2022, 1758, 1350*, 1048*, and 670+ cm-1 (Figure 11). These bands could be attributed to copper hydroxynitrate Cu2(NO3)(OH)3, [33,34] such as rouaite or gerhardtite [35]. This pigment is quite rare and is typically found as a replication product of historical verditer synthetic recipes [36,37]. Moreover, the bands at 506+, 420+ suggest the presence of a silicate-based compound [38].
Concerning the yellow hues, lead, arsenic, and calcium are detected by MA-XRF, with occasional traces of tin, particularly evident in the ovals depicting St. Thomas Aquinas and St. Peter, as well as in the yellow curtain beneath him (Figure 5). ER-FTIR analysis confirms that the calcium is associated with calcite, displaying characteristic absorption bands at 2516, 1795, 1421+, and 876* cm⁻¹. However, no additional pigment contributions could be identified. Similarly, Raman spectroscopy does not reveal significant peaks, likely due to the diluted nature of the yellow hue, as observed in the microscopic image in Figure 12, particularly in the one obtained through UV excitation. Furthermore, when the yellow details are more intense in color, they are often too small to be effectively detected by the Raman and FTIR beam spot size used. Based on these analyses, we are unable to conclusively definitively identify the pigment or pigments used for the yellow layer. However, we can hypothesize the presence of lead-based pigments, such as lead white, massicot and lead-tin yellow. In addition the presence of arsenic may be due to the use of orpiment or arsenic sulfide glass, also known as artificial orpiment [39].
Finally, IRR images reveal that black hues absorb in the infrared spectral range between 900 nm and 1700 nm (Figure 4), a behavior characteristic of carbon-based pigments. Additionally, XRF analysis does not detect elements associated with other black pigments, such as iron or manganese. However, lead is detected within the black hues, though it cannot be definitively attributed to a specific pigment. Microscopic images, however, reveal white grains embedded in the black areas (Figure 13), suggesting a possible contribution from lead-containing materials, such as lead white.
3.3. Metal Layers
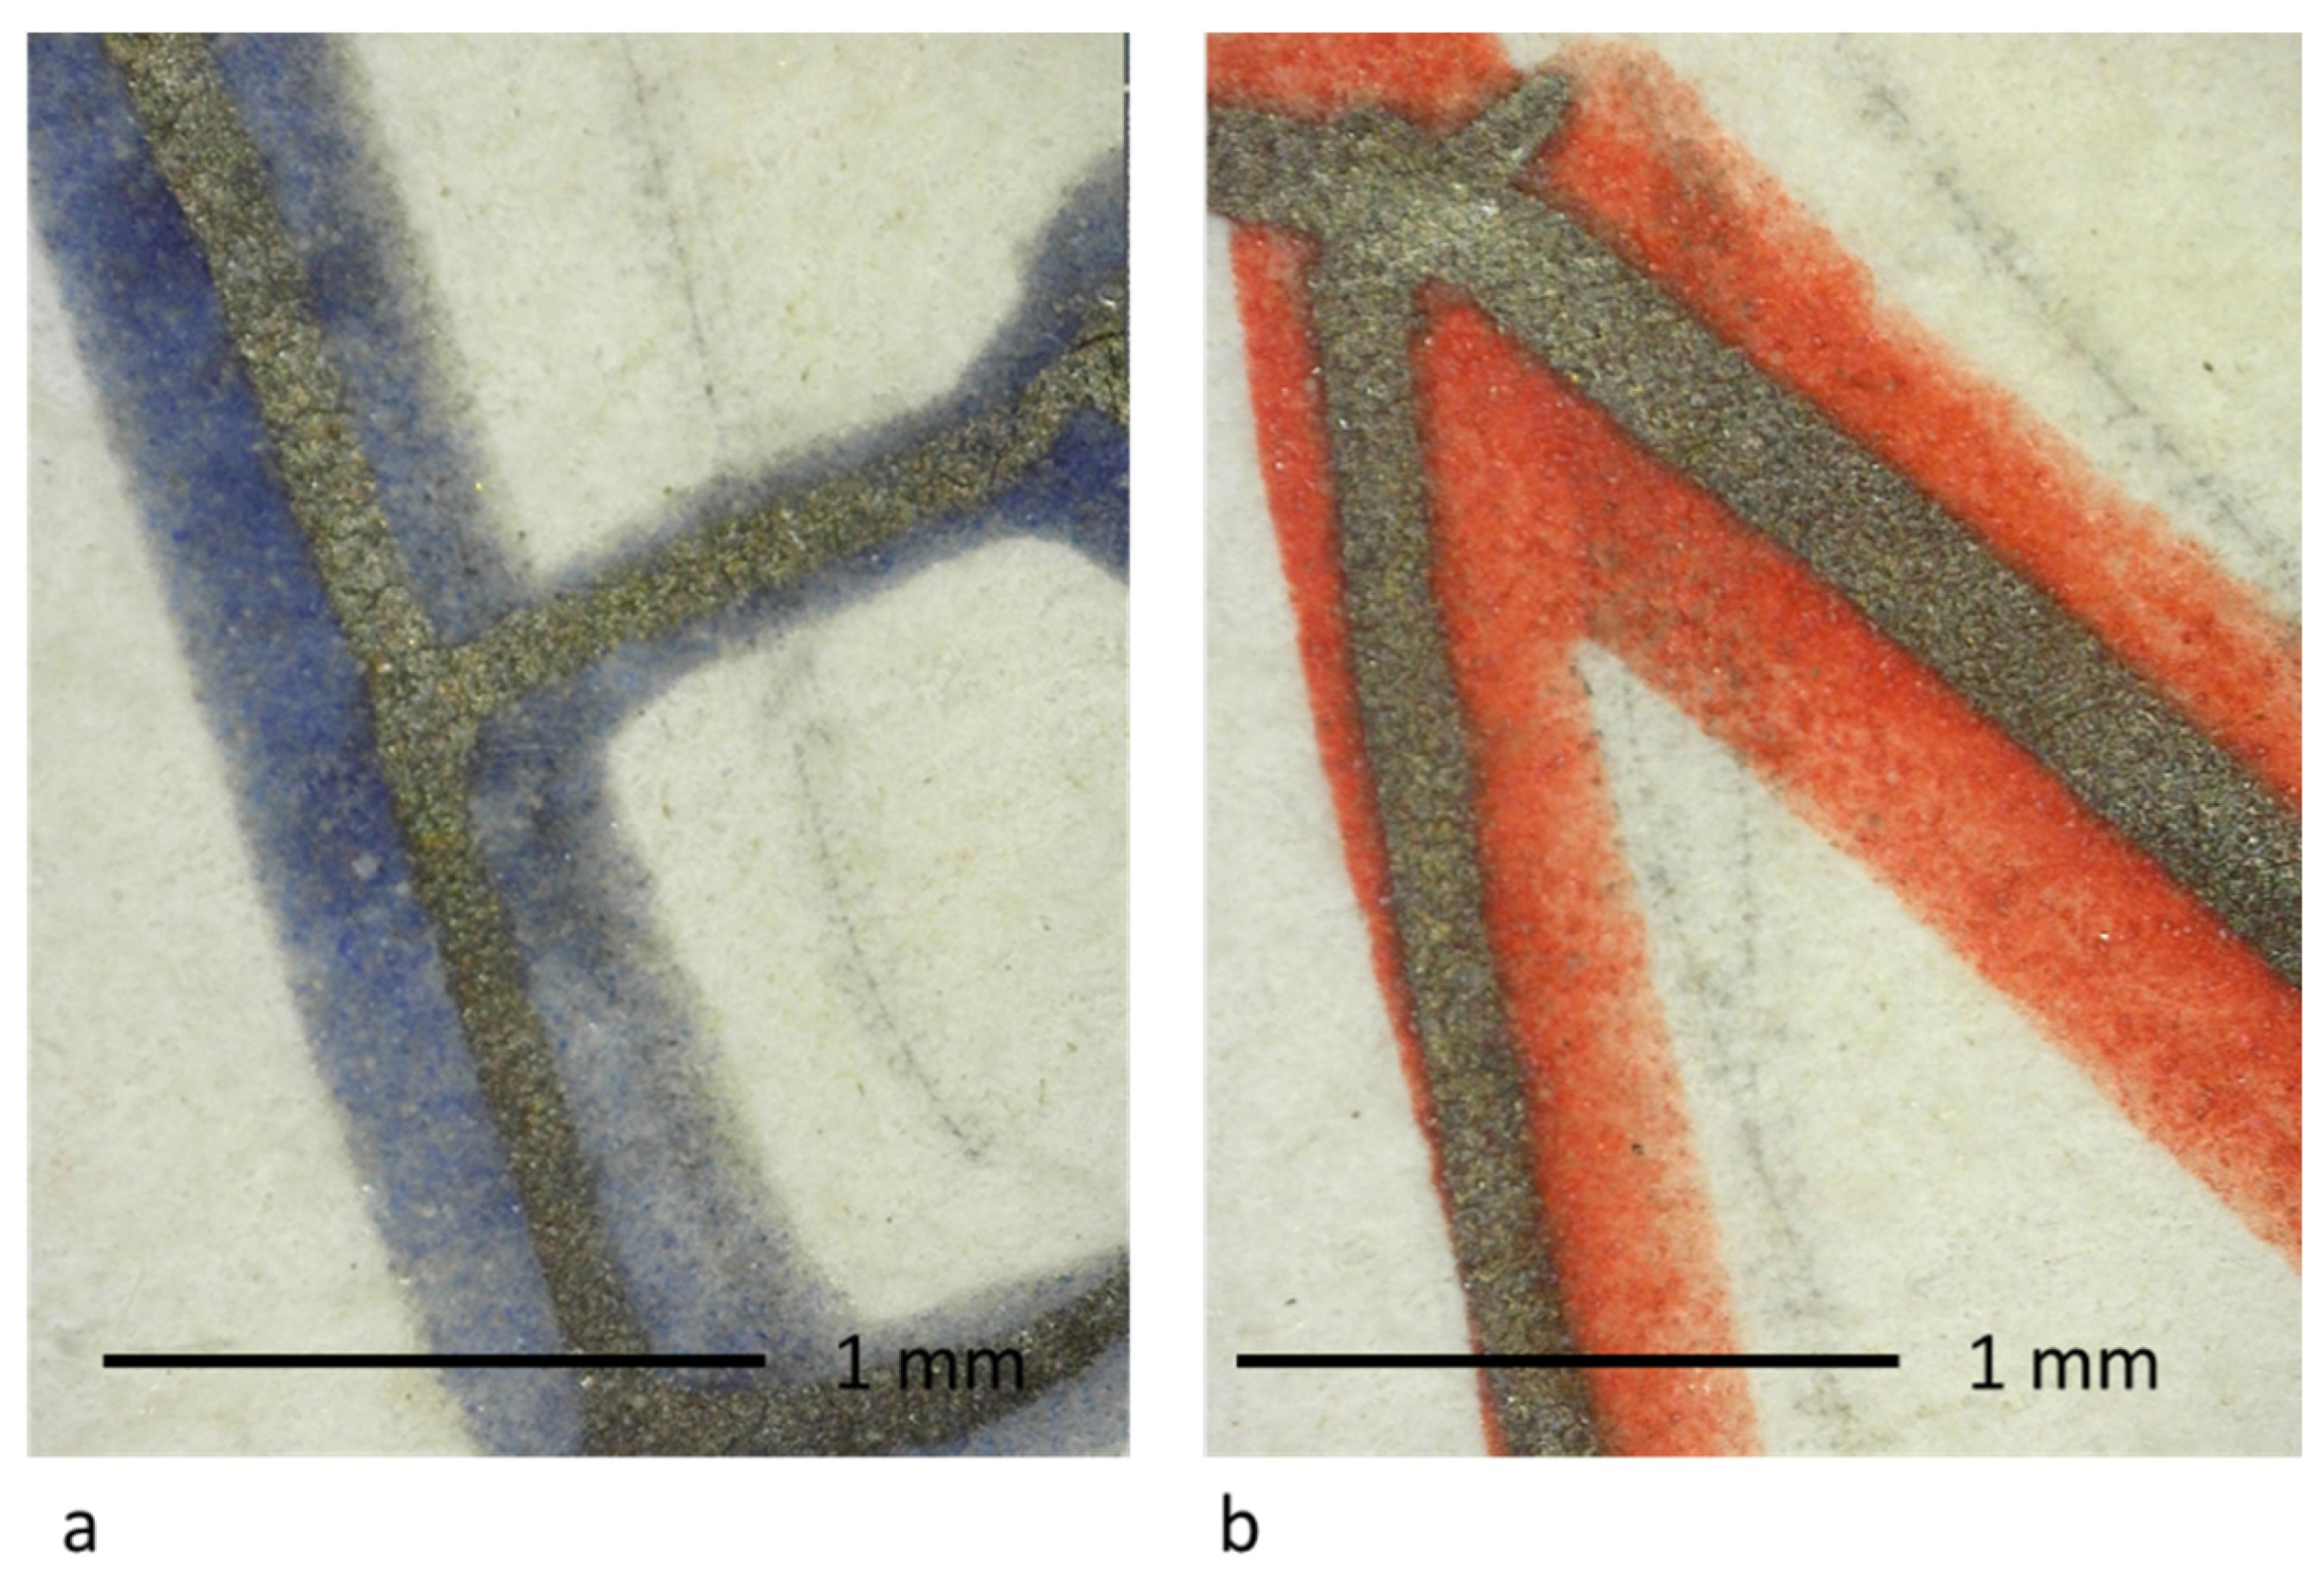
The XRF analysis detects the use of gold (Au) for the gilding (Figure 14). Microscopical observation (Figure 15a,b), together with the shape of the MA-XRF maps (Figure 14) where the structure is visible especially in foils overlaps, suggests that metal foil is used in the circular and rectangular frames (possibly as mordant gilding for the absence of Ca and Fe), while shell gold is likely used for the small details in the figures. Silver is also detected by MA-XRF, in particular in highlights of draperies, halos and other decorations. In this case it is likely to be employed as shell silver (Figure 15c,d). In the keys of Saint Peter (Figure 14c) it is possibly present in the form of a proper metal foil.
3.4. Written Text
MA-XRF analysis and IRR images confirm the use of iron-based ink for the black part of the text due to high transparency in the IRR (Figure 16) and the detection of iron.
Moreover, The UV fluorescence images allow to increase the contrast between the written part and the parchment consenting to better read some letters and numbers, as in the case for sign (Figure 17).
The capital letters are obtained with blue and red hues. The HMI processing software PickViewer® offers several digital imaging processing tools as a “spectral similarity” one. It enables to calculate the spectral reflectance of a selected area of some pixels in the 300-1000 nm range and to use this spectral signature as a filter to enhance all the pixels in the image with a similar (within a selected confidence threshold) spectral response. The process permits to evaluate that materials with a similar spectral signature have similar chemical-physical features or composition. The similarity tool can also be used choosing other input parameters for the image processing instead of the spectral reflectance, as the calibrated L* a* b* colorimetric values of a selected pixel area (chromatic similarity). For the blue hues, by observing the “chromatic similarity” image obtained from the small area in the lower part of the blue background of the central golden oval (white point in Figure 18a), it is conceivable that the same pictorial material was used for both the illustration and the capital letters (Figure 18). By observing the “chromatic similarity”, obtained from the blue hues, it becomes evident that the same pictorial layer was used for both the illustration and the capital letters (Figure 18).
Indeed, MA-XRF maps (Figure 5) confirm the blue pigment is characterized by cobalt potassium, iron, bismuth and lead, as the blue pigment used for the figurative parts (Figure 5). Whereas the presence of mercury (Hg) in the red pigment suggests the use of cinnabar. Moreover, shell silver is used also to highlight capital letters (Figure 19).
4. Conclusions
This study highlights the importance of combining non-invasive analytical techniques to investigate and preserve illuminated manuscripts, increasing the understanding of the materials used for 16th-century parchment miniatures. By applying a multi-analytical approach, including optical microscopy, Hypercolorimetric Multispectral Imaging (HMI), Infrared Reflectography in the 950-1700 nm range, Fiber Optics Reflectance Spectra (FORS), macro X-ray fluorescence (MA-XRF) spectroscopy, Raman spectroscopy and External Reflection-Fourier Transform Infrared spectroscopy (ER-FTIR), significant insights were obtained into the materials and techniques employed in the creation of this artifact. The results indicate the use of carbon-based materials for preparatory drawings. Pure gold was confirmed for gilding, and shell silver is also detected in some highlights of both the pictures and the written text, reflecting the high value and craftsmanship of the manuscript. Mineral-based pigments such as smalt, vermilion, calcite, lead white and copper hydroxynitrate, such as rouaite or gerhardtite, were detected. Moreover, pink hues are realized with an animal-derived lake and cinnabar in some darker areas. In contrast, the results obtained on the yellow hues suggest the presence of lead, arsenic, with occasional traces of tin which require further investigation for precise identification. Finally, the capital letter was realized with smalt and vermillion, respectively, meanwhile, the black ink used for the text is composed of iron gall ink, a widely utilized writing material on parchments.
Author Contributions
For research articles with several authors, a short paragraph specifying their individual contributions must be provided. The following statements should be used “Conceptualization, L.P.; methodology, L.P., M.R.; formal analysis, L.P., M.R., L.L., C.C., C.P., F. B., C.R., L.C., A.M., V.S.; investigation, L.P., M.R., L.L., C.C., C.P., C.R., L.C., V.S.; resources, M.C.G.; data curation, L.P., M.R., L.L., C.C., C.P., C.R., L.C., V.S.; writing—original draft preparation, L.P.; writing—review and editing, L.P., M.R., L.L., C.C., C.P., C.R., L.C., A.M., V.S.; supervision, M.C.G.; project administration, M.C.G.; funding acquisition, M.C.G. All authors have read and agreed to the published version of the manuscript.”
Funding
This research was performed in part during the Training Camp "From Diagnostics to Museum Enjoyment: The Works of the Museo del Colle del Duomo di Viterbo," funded under the public notice of the Lazio Region Framework Agreement "Research, Technological Innovation, Thematic Networks" (APQ6) - Extract "Implementation of Programmatic Interventions and New Interventions Related to the Technological District for New Technologies Applied to Cultural Heritage and Activities." Intervention TE1 - Invitation to the Center of Excellence to submit projects for the second phase (determination January 21, 2020, no. G00471 published in BUR Lazio no. 7 - Supplement no. 1 of January 23, 2020).
Acknowledgments
We would like to express our sincere gratitude to the Diocese of Viterbo and the ARCHEOAres Society for their hospitality and support at the monumental complex of Colle del Duomo during the Training Camp. A special thanks to Don Emanuele Germani for his kindness and willingness to allow us to further analyze the artwork at his parish, the “Parrocchia dei Santi Valentino e Ilario”. Moreover, we would like to thank Giacomo Viviani for its technical support during the measurements. Finally, a special thank you to Antonella Privitera for her valuable insight into the identification of the green pigment.
Conflicts of Interest
“The authors declare no conflicts of interest.”
References
- Pessanha, S.; Manso, M.; Carvalho, M.L. Application of spectroscopic techniques to the study of illuminated manuscripts: A survey. Spectrochim. Acta - Part B At. Spectrosc. 2012, 71–72, 54–61. [CrossRef]
- Chiriu, D.; Ricci, P.C.; Cappellini, G. Raman characterization of XIV–XVI centuries Sardinian documents: Inks, papers and parchments. Vib. Spectrosc. 2017, 92, 70–81. [CrossRef]
- Nodari, L.; Ricciardi, P. Non-invasive identification of paint binders in illuminated manuscripts by ER-FTIR spectroscopy: a systematic study of the influence of different pigments on the binders’ characteristic spectral features. Herit. Sci. 2019, 7. [CrossRef]
- Aceto, M.; Agostino, A.; Fenoglio, G.; Baraldi, P.; Zannini, P.; Hofmann, C.; Gamillscheg, E. First analytical evidences of precious colourants on Mediterranean illuminated manuscripts. Spectrochim. Acta - Part A Mol. Biomol. Spectrosc. 2012, 95, 235–245. [CrossRef]
- Vetter, W.; Latini, I.; Schreiner, M. Azurite in medieval illuminated manuscripts: a reflection-FTIR study concerning the characterization of binding media. Herit. Sci. 2019, 7, 1–9. [CrossRef]
- Edwards, H.G.M.; Vandenabeele, P.; Colomban, P. Analytical Raman Spectroscopy of Manuscripts and Maps: The Role of Inks. 2023, 215–231. [CrossRef]
- Pouyet, E.; Devine, S.; Grafakos, T.; Kieckhefer, R.; Salvant, J.; Smieska, L.; Woll, A.; Katsaggelos, A.; Cossairt, O.; Walton, M. Revealing the biography of a hidden medieval manuscript using synchrotron and conventional imaging techniques. Anal. Chim. Acta 2017, 982, 20–30. [CrossRef]
- Colantonio, C.; Clivet, L.; Laval, E.; Coquinot, Y.; Maury, C.; Melis, M.; Boust, C. Integration of multispectral imaging, XRF mapping and Raman analysis for noninvasive study of illustrated manuscripts: the case study of fifteenth century “Humay meets the Princess Humayun” Persian masterpiece from Louvre Museum. Eur. Phys. J. Plus 2021, 136, 958. [CrossRef]
- Cucci, C.; Delaney, J.K.; Picollo, M. Reflectance Hyperspectral Imaging for Investigation of Works of Art: Old Master Paintings and Illuminated Manuscripts. Acc. Chem. Res. 2016, 49, 2070–2079. [CrossRef]
- Titubante, M.; Giannini, F.; Pasqualucci, A.; Romani, M.; Verona-Rinati, G.; Mazzuca, C.; Micheli, L. Towards a non-invasive approach for the characterization of Arabic/Christian manuscripts. Microchem. J. 2020, 155, 104684. [CrossRef]
- Turner, N.K.; Patterson, C.S.; MacLennan, D.K.; Trentelman, K. Visualizing underdrawings in medieval manuscript illuminations with macro-X-ray fluorescence scanning. X-Ray Spectrom. 2019, 48, 251–261. [CrossRef]
- Mounier, A.; Le Bourdon, G.; Aupetit, C.; Belin, C.; Servant, L.; Lazare, S.; Lefrais, Y.; Daniel, F. Hyperspectral imaging, spectrofluorimetry, FORS and XRF for the non-invasive study of medieval miniatures materials. Herit. Sci. 2014, 2, 24. [CrossRef]
- Nastova, I.; Grupče, O.; Minčeva-Šukarova, B.; Ozcatal, M.; Mojsoska, L. Spectroscopic analysis of pigments and inks in manuscripts: I. Byzantine and post-Byzantine manuscripts (10-18th century). Vib. Spectrosc. 2013, 68, 11–19. [CrossRef]
- Mazzinghi, A.; Ruberto, C.; Castelli, L.; Ricciardi, P.; Czelusniak, C.; Giuntini, L.; Mandò, P.A.; Manetti, M.; Palla, L.; Taccetti, F. The importance of being little: MA-XRF on manuscripts on a Venetian island. X-Ray Spectrom. 2021, 50, 272–278. [CrossRef]
- Marucci, G.; Beeby, A.; Parker, A.W.; Nicholson, C.E. Raman spectroscopic library of medieval pigments collected with five different wavelengths for investigation of illuminated manuscripts. Anal. Methods 2018, 10, 1219–1236. [CrossRef]
- Faubel, W.; Staub, S.; Simon, R.; Heissler, S.; Pataki, A.; Banik, G. Non-destructive analysis for the investigation of decomposition phenomena of historical manuscripts and prints. Spectrochim. Acta Part B At. Spectrosc. 2007, 62, 669–676. [CrossRef]
- Melis, M.; Miccoli, M.; Quarta, D. Multispectral hypercolorimetry and automatic guided pigment identification: some masterpieces case studies. Opt. Metrol. 2013, 8790, 87900W. [CrossRef]
- Melis, M.; Miccoli, M.; Srl -Roma, P. Trasformazione evoluzionistica di una fotocamera reflex digitale in un sofisticato strumento per misure fotometriche e colorimetriche (oral).
- Laureti, S.; Colantonio, C.; Burrascano, P.; Melis, M.; Calabrò, G.; Malekmohammadi, H.; Sfarra, S.; Ricci, M.; Pelosi, C. Development of integrated innovative techniques for paintings examination: The case studies of The Resurrection of Christ attributed to Andrea Mantegna and the Crucifixion of Viterbo attributed to Michelangelo’s workshop. J. Cult. Herit. 2019, 40, 1–16. [CrossRef]
- Annarilli, S.; Casoli, A.; Colantonio, C.; Lanteri, L.; Marseglia, A.; Pelosi, C.; Sottile, S. A Multi-Instrument Analysis of the Late 16th Canvas Painting, “Coronation of the Virgin with the Saints Ambrose and Jerome”, Attributed to the Tuscany-Umbria Area to Support the Possibility of Bio-Cleaning Using a Bacteria-Based System. Herit. 2022, Vol. 5, Pages 2904-2921 2022, 5, 2904–2921. [CrossRef]
- Bonizzoni, L.; Caglio, S.; Galli, A.; Lanteri, L.; Pelosi, C. Materials and Technique: The First Look at Saturnino Gatti. Appl. Sci. 2023, Vol. 13, Page 6842 2023, 13, 6842. [CrossRef]
- Taccetti, F.; Castelli, L.; Czelusniak, C.; Gelli, N.; Mazzinghi, A.; Palla, L.; Ruberto, C.; Censori, C.; Lo Giudice, A.; Re, A.; et al. A multipurpose X-ray fluorescence scanner developed for in situ analysis. Rend. Lincei 2019, 30, 307–322. [CrossRef]
- Panayotova, S. The art & science of illuminated manuscripts : a handbook. 2020, 528.
- Siidra, O.; Nekrasova, D.; Depmeier, W.; Chukanov, N.; Zaitsev, A.; Turner, R. Hydrocerussite-related minerals and materials: structural principles, chemical variations and infrared spectroscopy. Acta Crystallogr. B. Struct. Sci. Cryst. Eng. Mater. 2018, 74, 182–195. [CrossRef]
- Mozgawa, W.; Handke, M.; Jastrzebski, W. Vibrational spectra of aluminosilicate structural clusters. J. Mol. Struct. 2004, 704, 247–257. [CrossRef]
- Cosentino, A. EFFECTS OF DIFFERENT BINDERS ON TECHNICAL PHOTOGRAPHY AND INFRARED REFLECTOGRAPHY OF 54 HISTORICAL PIGMENTS. 2015.
- Boust, C.; Wohlgelmuth, A. DATABASE : Pigments under UV and IR radiations. Sci. imaging Cult. Herit. 2017.
- Ricciardi, P.; Dooley, K.A.; Maclennan, D.; Bertolotti, G.; Gabrieli, F.; Patterson, C.S.; Delaney, J.K. Use of standard analytical tools to detect small amounts of smalt in the presence of ultramarine as observed in 15th - century Venetian illuminated manuscripts. Herit. Sci. 2022, 1–18. [CrossRef]
- Dehaine, Q.; Tijsseling, L.T.; Glass, H.J.; Törmänen, T.; Butcher, A.R. Geometallurgy of cobalt ores: A review. Miner. Eng. 2021, 160, 106656. [CrossRef]
- Nimis, P.; Costa, L.D.; Guastoni, A. Cobaltite-rich mineralization in the iron skarn deposit of Traversella (Western Alps, Italy). Mineral. Mag. 2014, 78, 11–27. [CrossRef]
- Agarwal, U.P. Analysis of Cellulose and Lignocellulose Materials by Raman Spectroscopy: A Review of the Current Status. Mol. 2019, Vol. 24, Page 1659 2019, 24, 1659. [CrossRef]
- Luiza Queiroz Brian M Kerins Jayprakash Yadav Fatma Farag Waleed Faisal Mary Ellen Crowley Simon E Lawrence Humphrey A Moynihan Anne-Marie Healy Sonja Vucen Abina M Crean, A.P.; P Queiroz Á B M Kerins Á F Farag Á W Faisal Á M E Crowley Á S Vucen Á A M Crean, A.L.; Yadav Á A-M Healy, J.; Lawrence Á H A Moynihan, S.E. Investigating microcrystalline cellulose crystallinity using Raman spectroscopy. Cellulose 2021, 28, 8971–8985. [CrossRef]
- Henrist, C.; Traina, K.; Hubert, C.; Toussaint, G.; Rulmont, A.; Cloots, R. Study of the morphology of copper hydroxynitrate nanoplatelets obtained by controlled double jet precipitation and urea hydrolysis. J. Cryst. Growth 2003, 254, 176–187. [CrossRef]
- Zhan, Y.; Zhou, X.; Fu, B.; Chen, Y. Catalytic wet peroxide oxidation of azo dye (Direct Blue 15) using solvothermally synthesized copper hydroxide nitrate as catalyst. J. Hazard. Mater. 2011, 187, 348–354. [CrossRef]
- Bushong, E.J.; Yoder, C.H. The Synthesis and Characterization of Rouaite, a Copper Hydroxy Nitrate. An Integrated First-Year Laboratory Project. J. Chem. Educ. 2009, 86, 80–81. [CrossRef]
- Purdy, E.H.; Critchley, S.; Clément Holé, ·; Cotte, · Marine; Kirkham, A.; Casford, · Michael; Holé, C.; Cotte, M. Characterisation of rouaite, an unusual copper-containing pigment in early modern English wall paintings, by synchrotron micro X-Ray diffraction and micro X-Ray absorption spectroscopy. Appl. Phys. A 123AD, 130. [CrossRef]
- Purdy, E.H.; Critchley, S.; Kirkham, A.; Casford, M. Illuminating the problem of blue verditer synthesis in the early modern English period: chemical characterisation and mechanistic understanding. [CrossRef]
- Fanost, A.; Gimat, A.; de Viguerie, L.; Martinetto, P.; Giot, A.C.; Clémancey, M.; Blondin, G.; Gaslain, F.; Glanville, H.; Walter, P.; et al. Revisiting the identification of commercial and historical green earth pigments. Colloids Surfaces A Physicochem. Eng. Asp. 2020, 584, 124035. [CrossRef]
- Burgio, L.; Manca, R.; Browne, C.; Button, V.; Horsfall Turner, O.; Rutherston, J. Orange for gold? Arsenic sulfide glass on the V&A Leman Album. J. Raman Spectrosc. 2019, 50, 1169–1176. [CrossRef]
Figure 1.
The illuminated scroll.
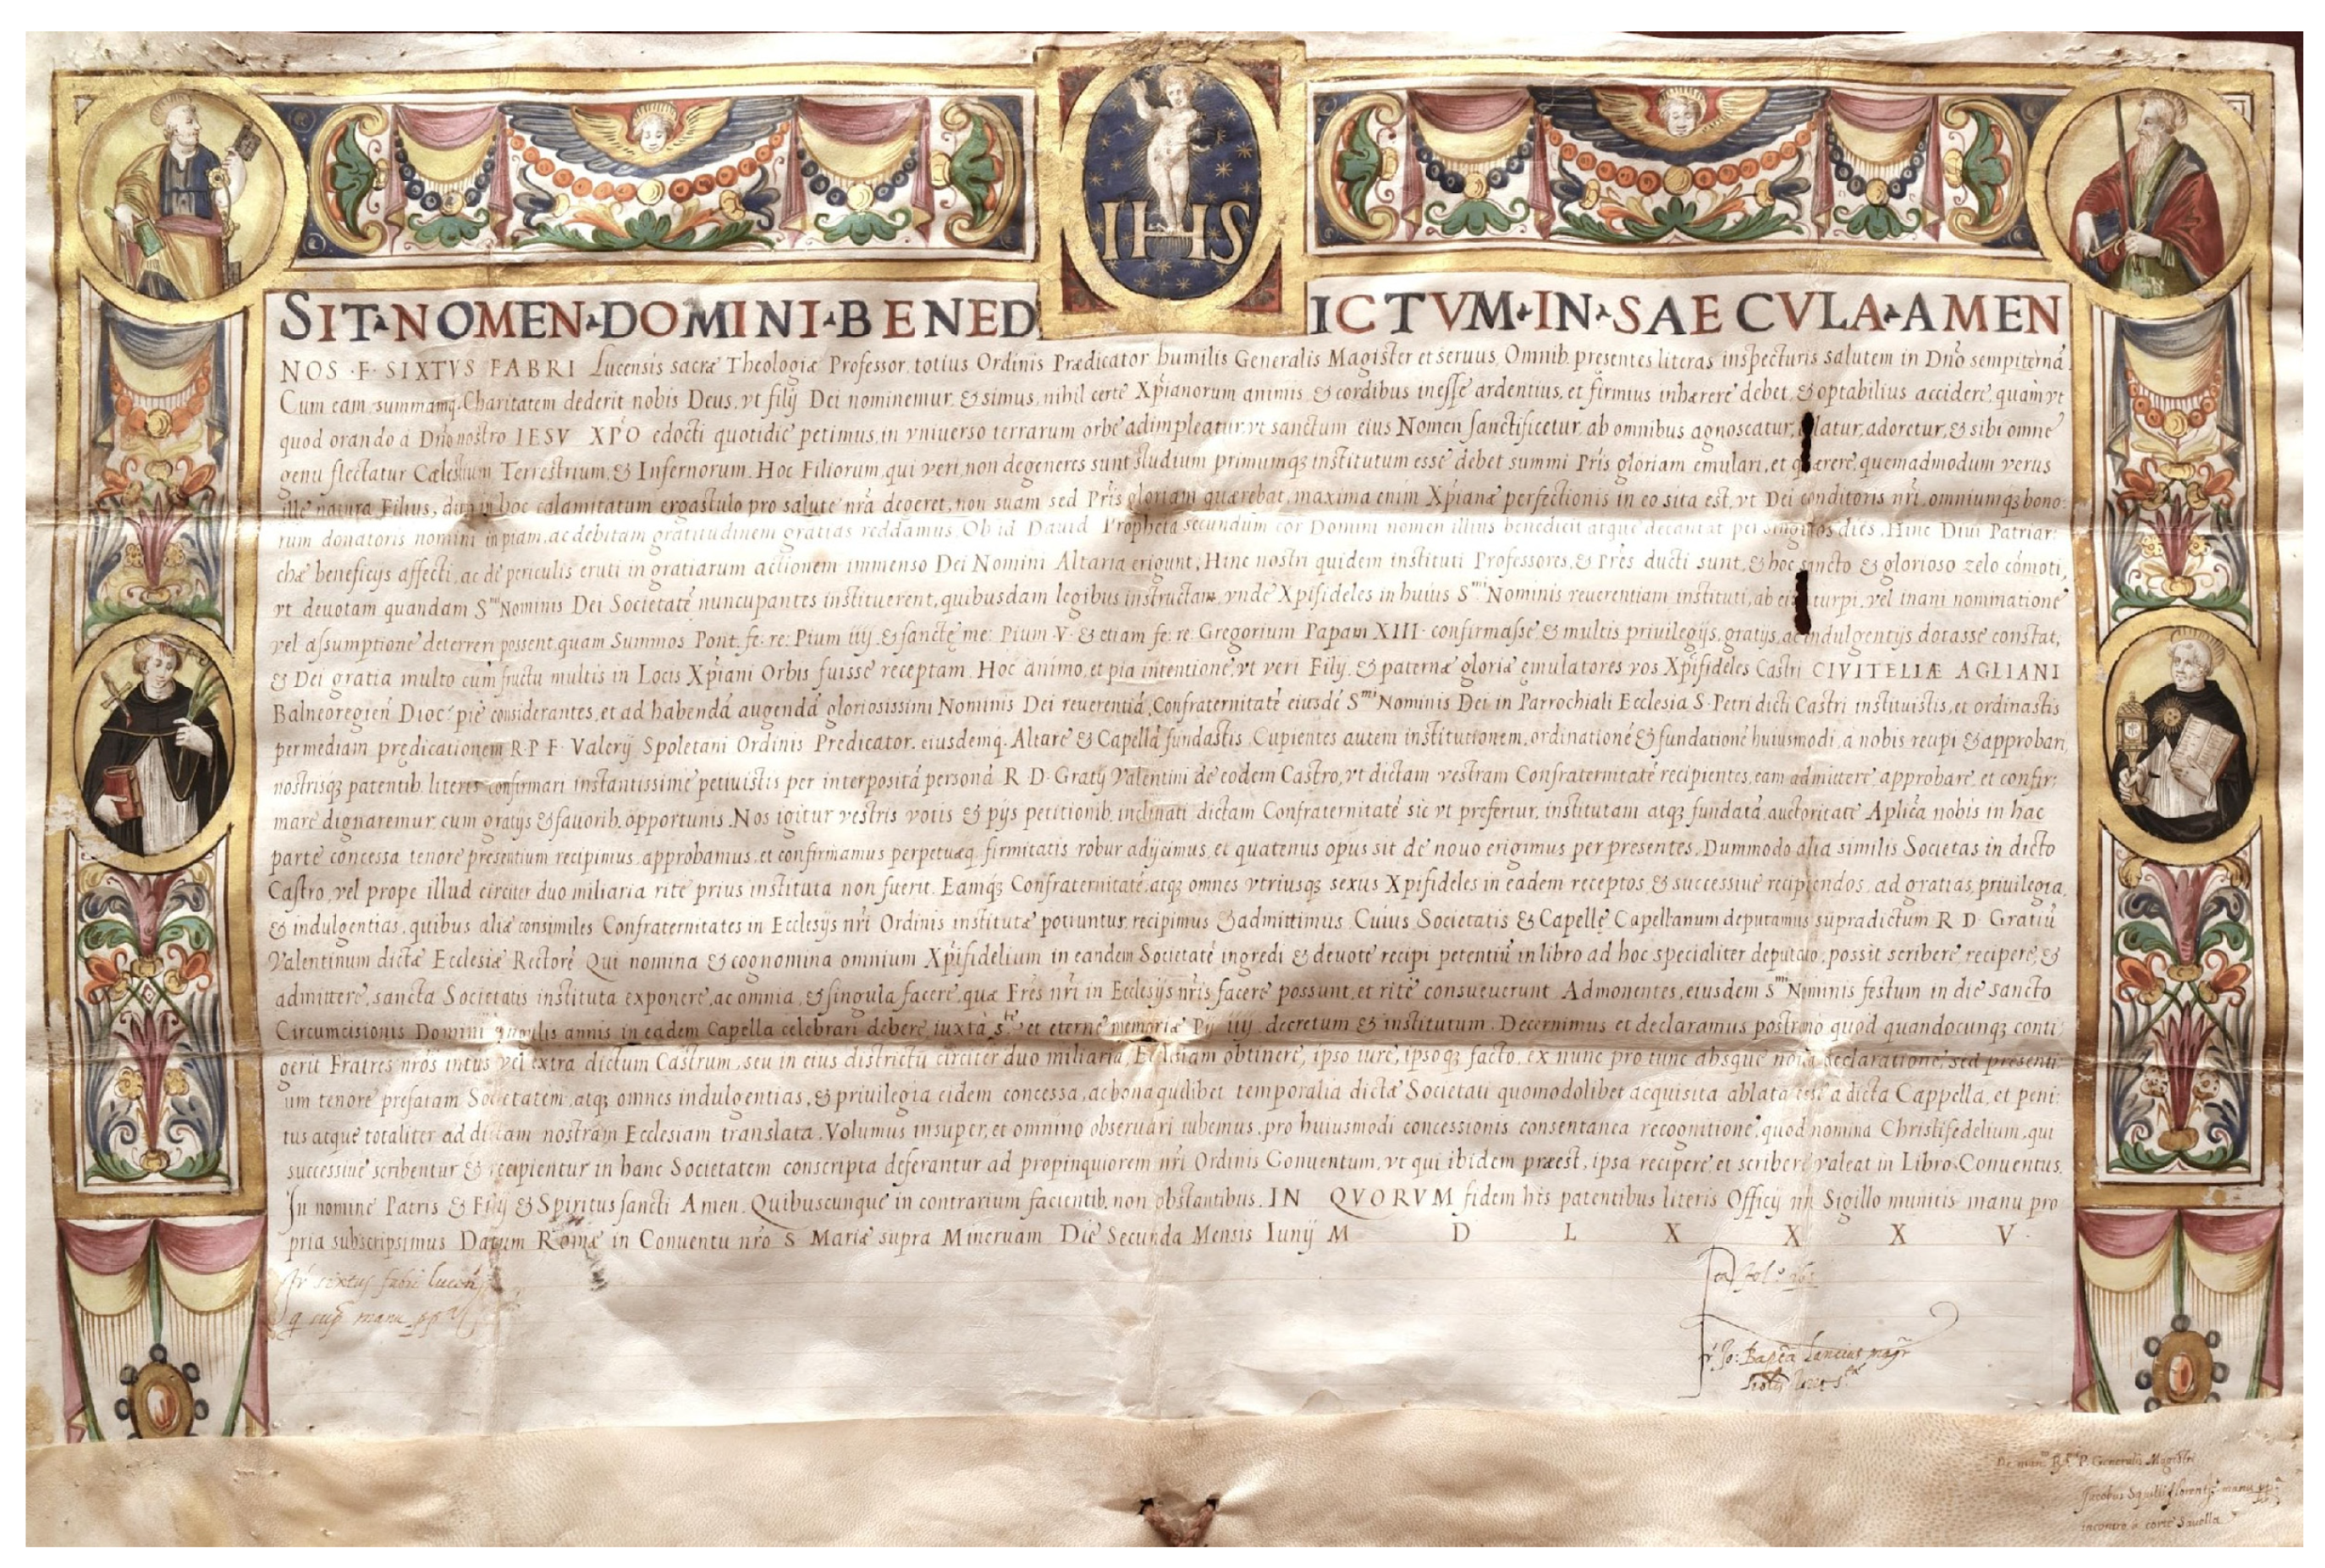
Figure 2.
ER-FTIR spectrum of the support.
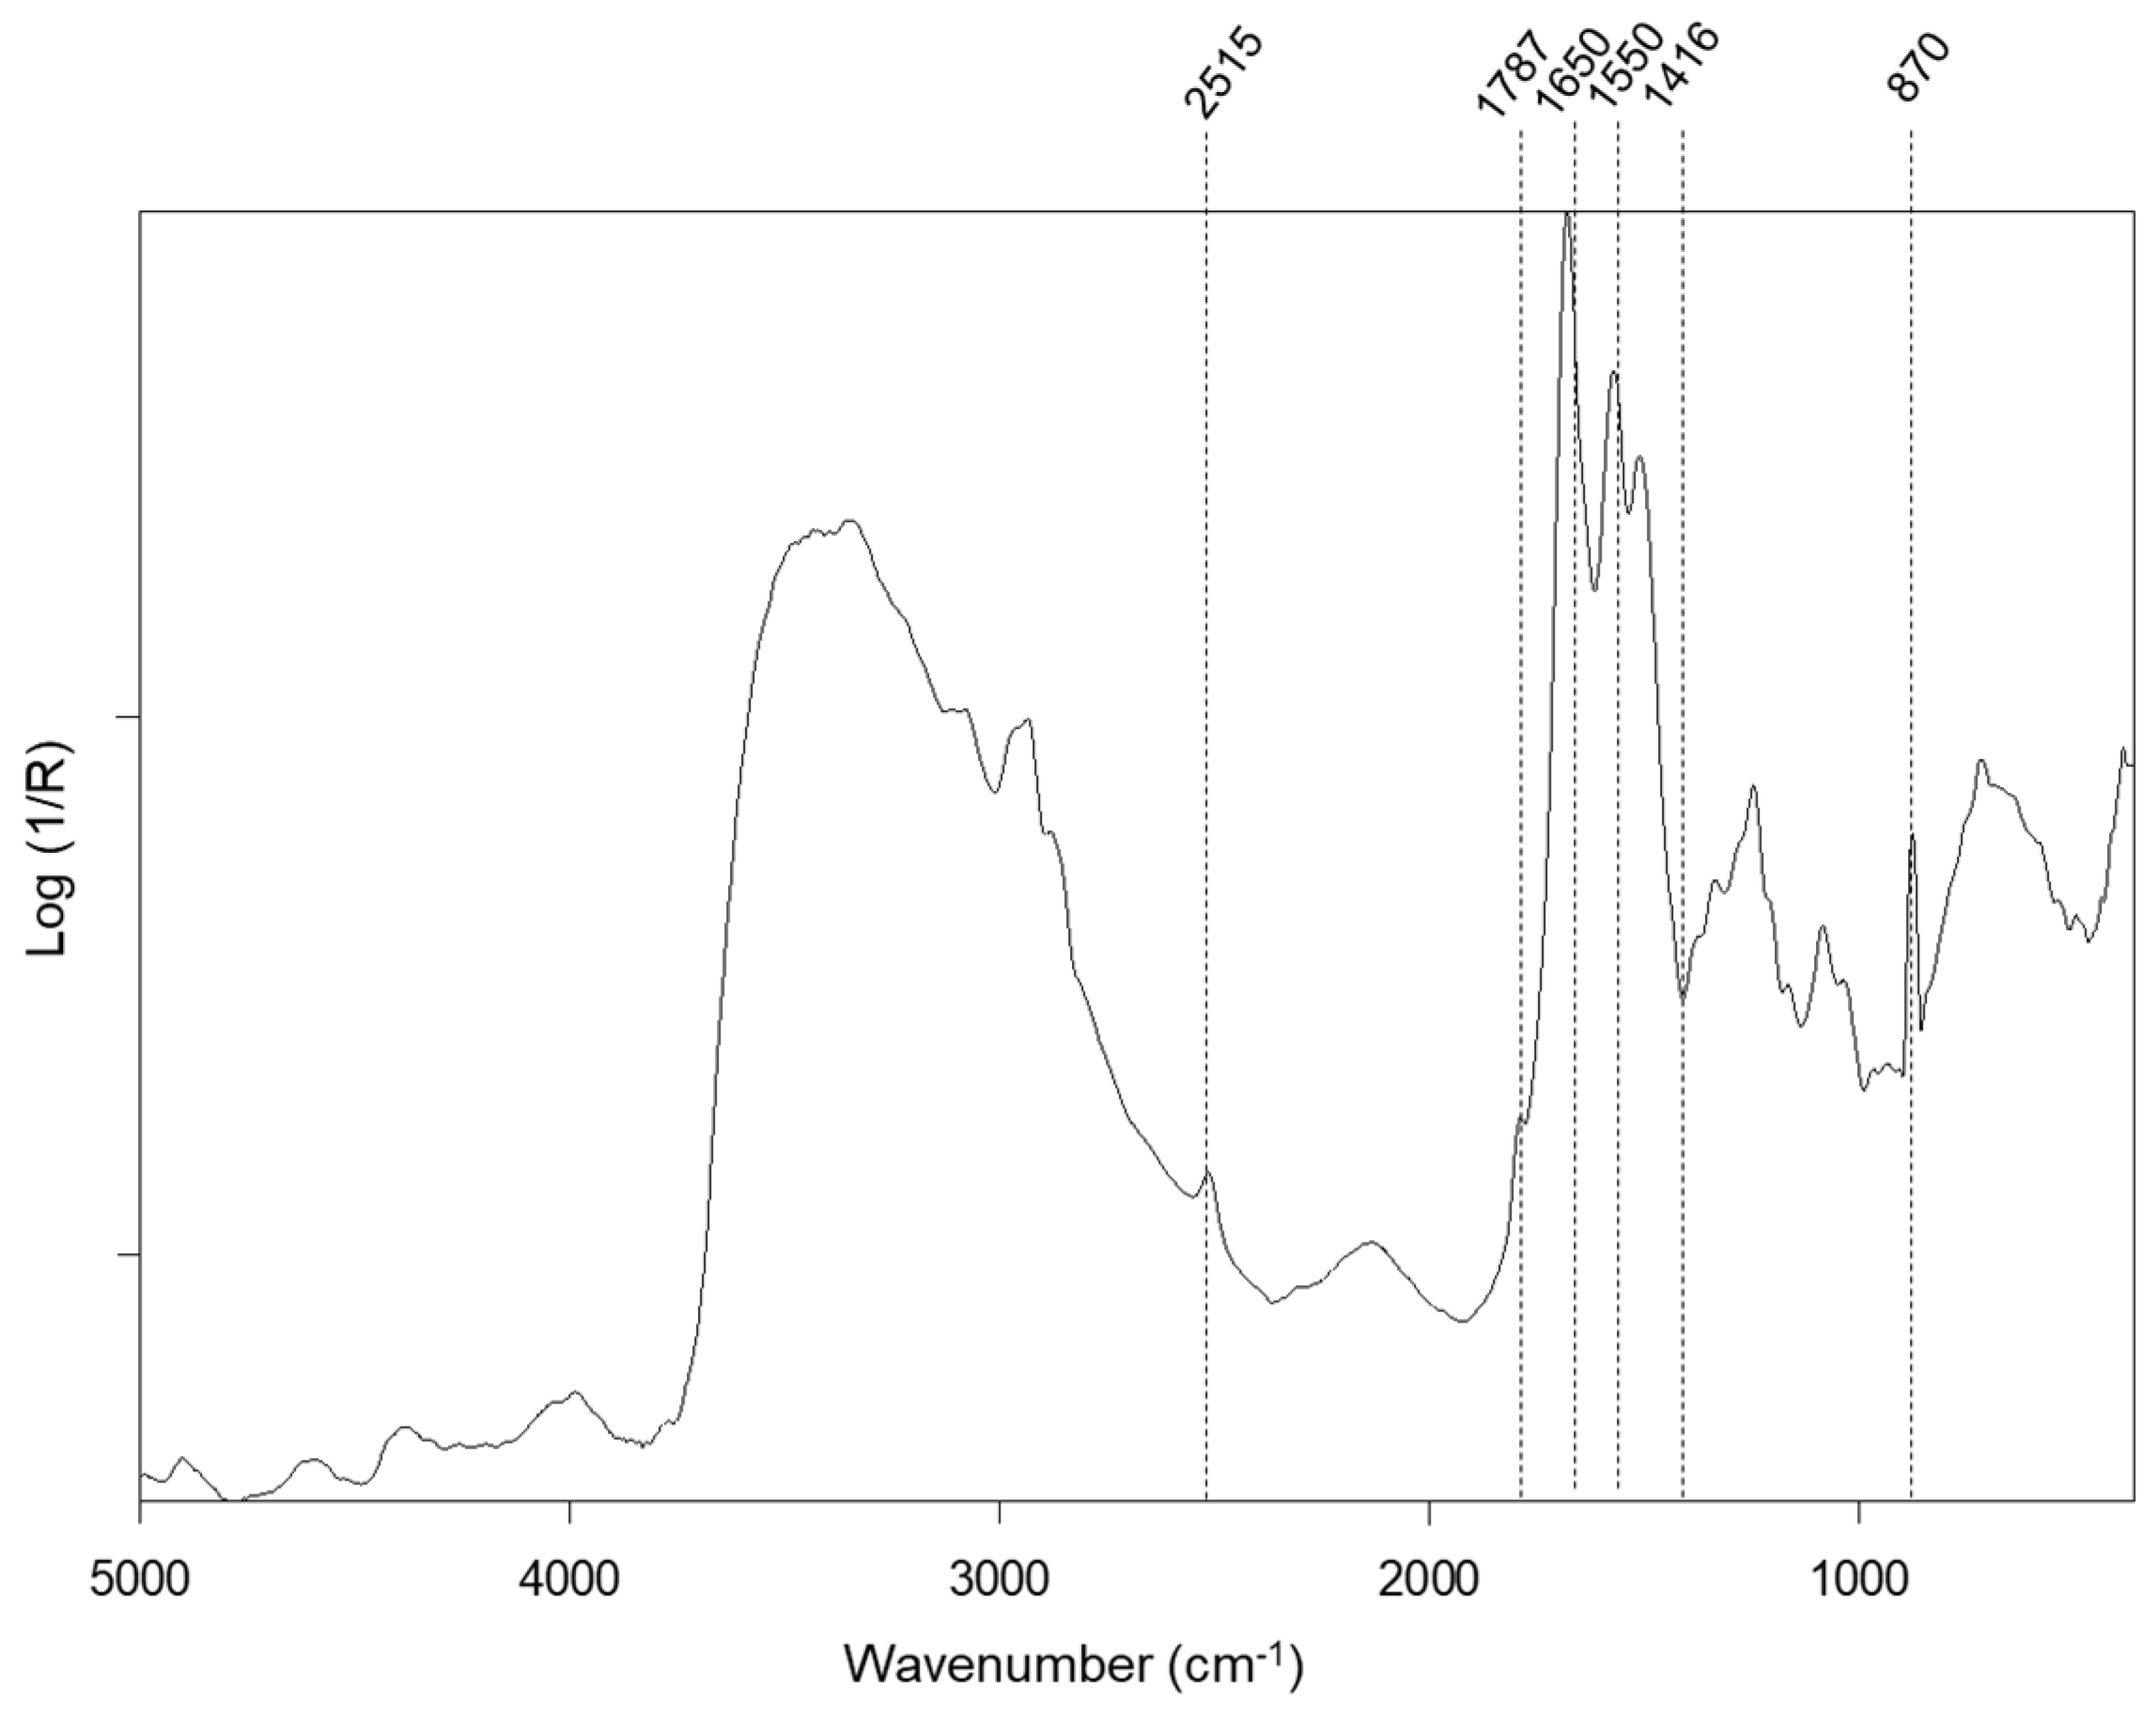
Figure 3.
The RGB calibrated image (a) and the ultraviolet fluorescence output (b) of the parchment.
Figure 3.
The RGB calibrated image (a) and the ultraviolet fluorescence output (b) of the parchment.
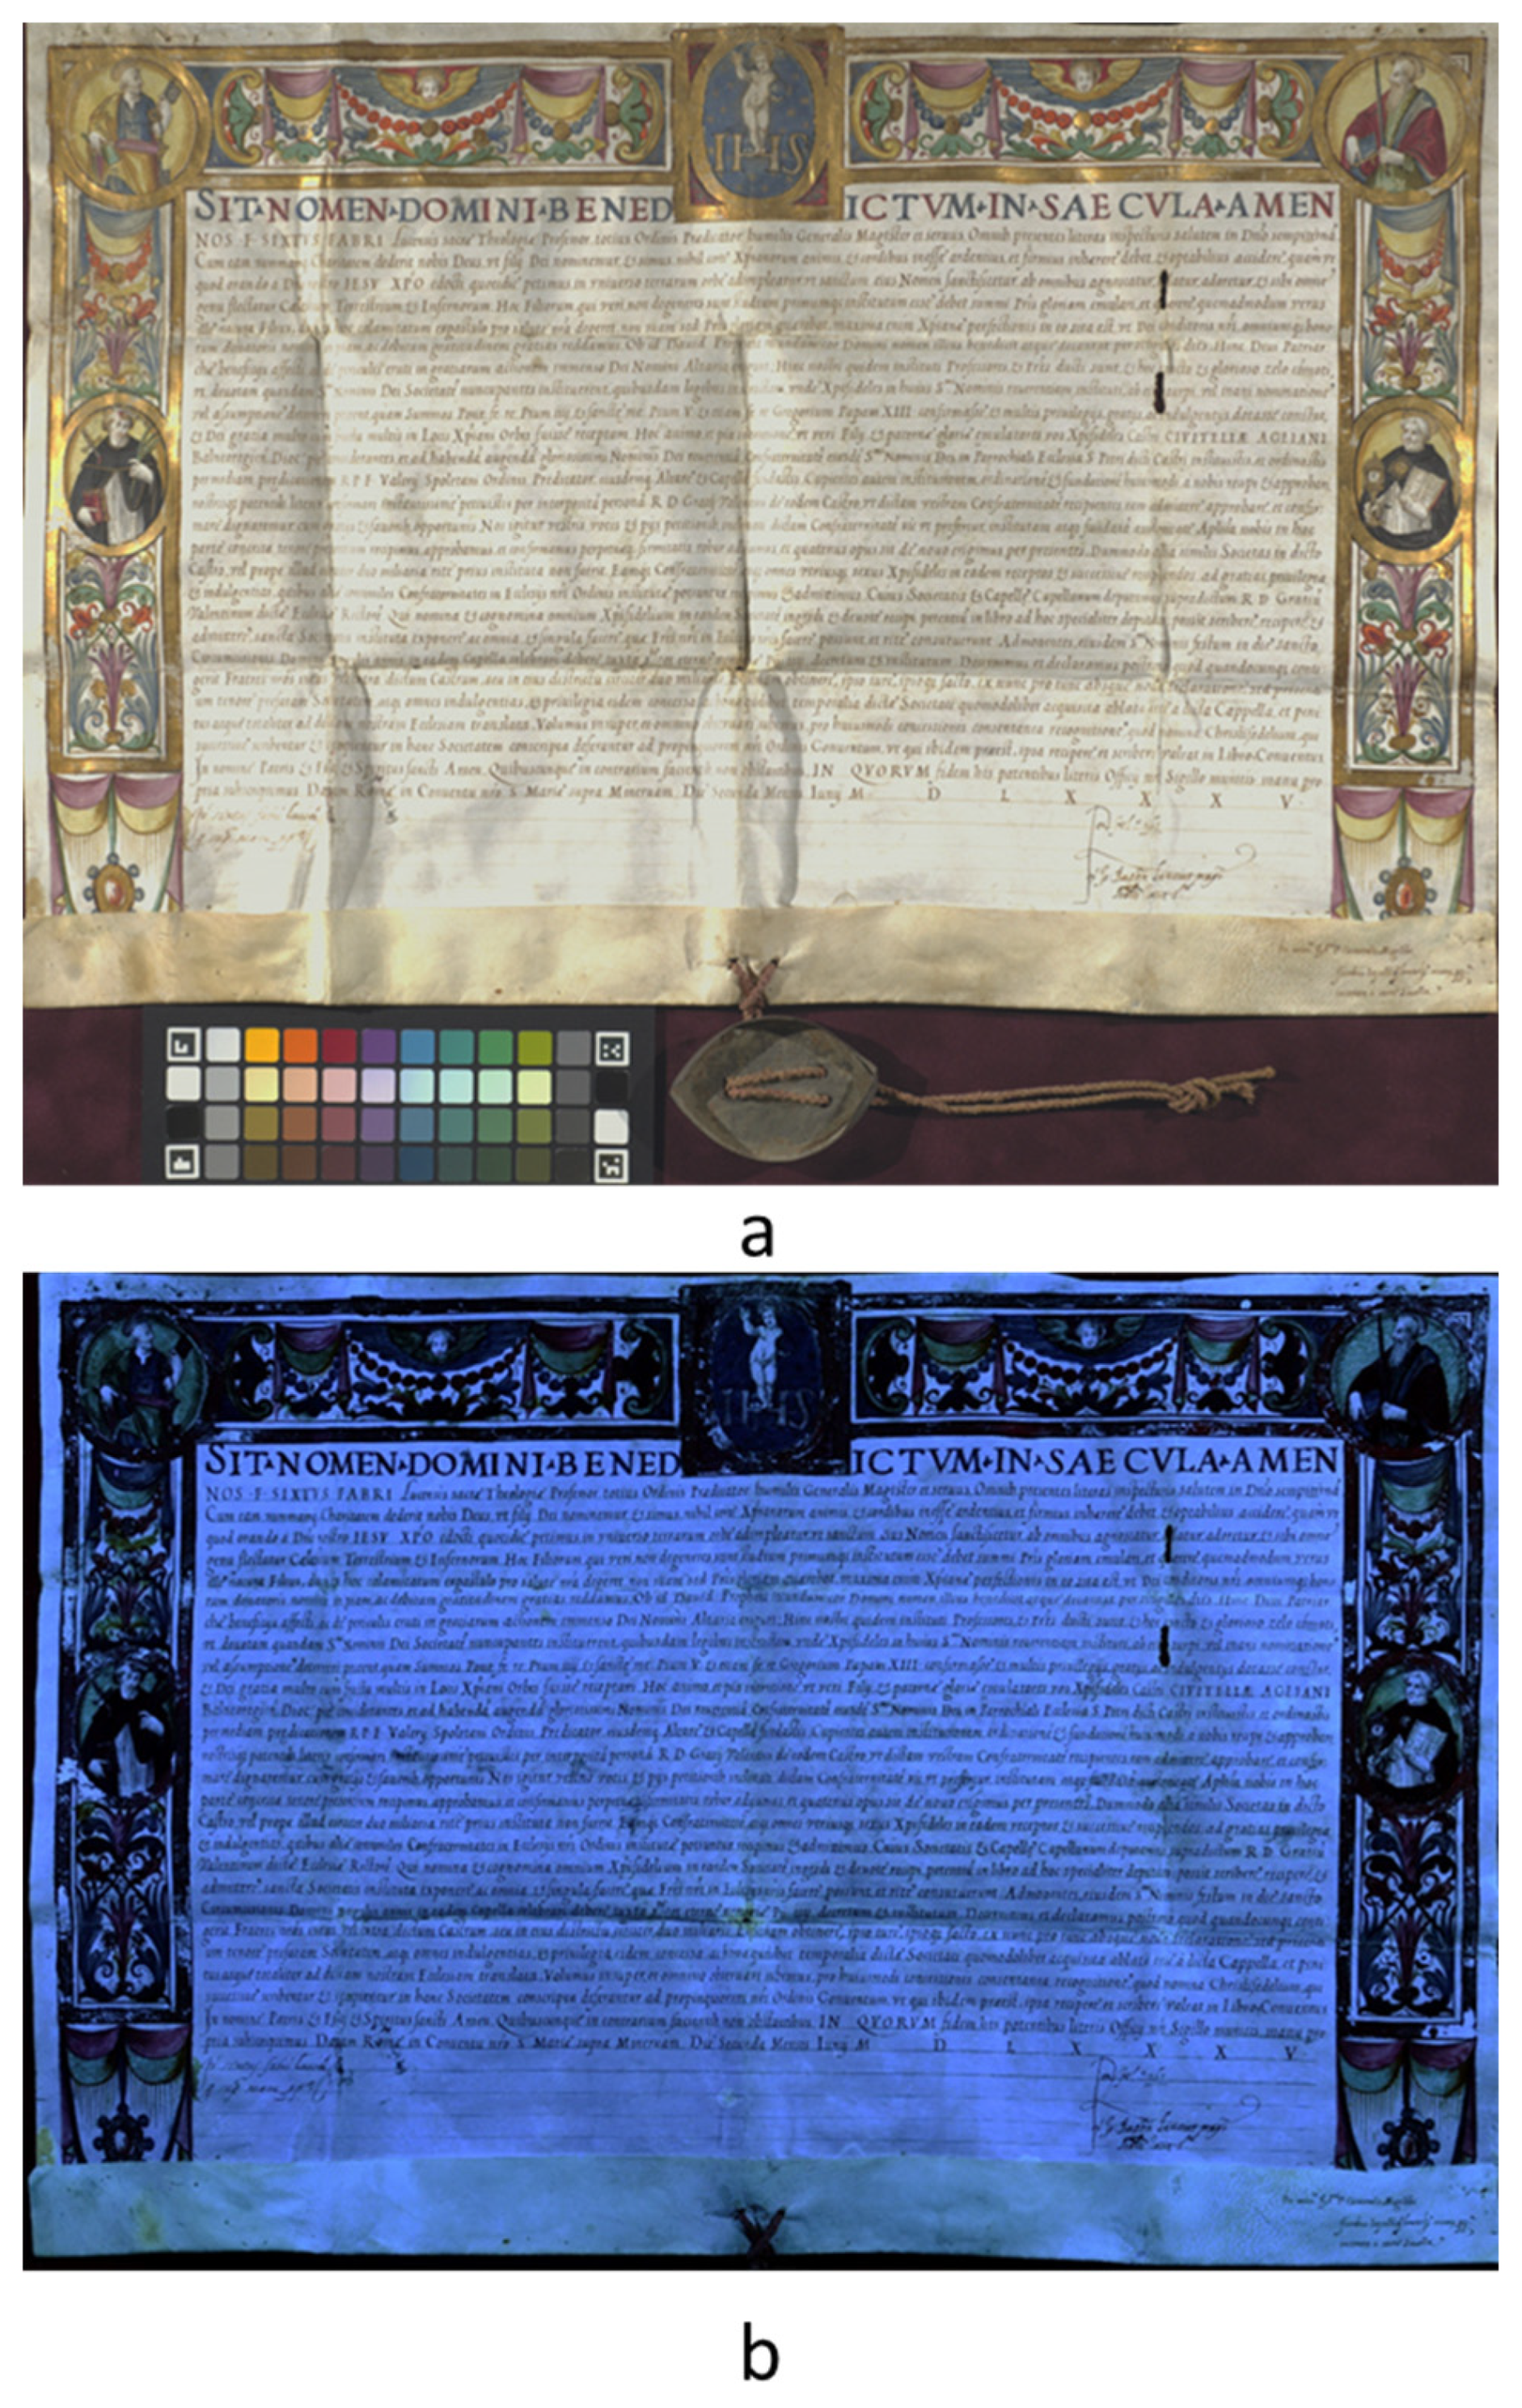
Figure 4.
Photografic images (a, c, e, g) and IRR (b, d, f, h) of the Saints taken in the range 900-1700 nm (InGaAs camera).
Figure 4.
Photografic images (a, c, e, g) and IRR (b, d, f, h) of the Saints taken in the range 900-1700 nm (InGaAs camera).
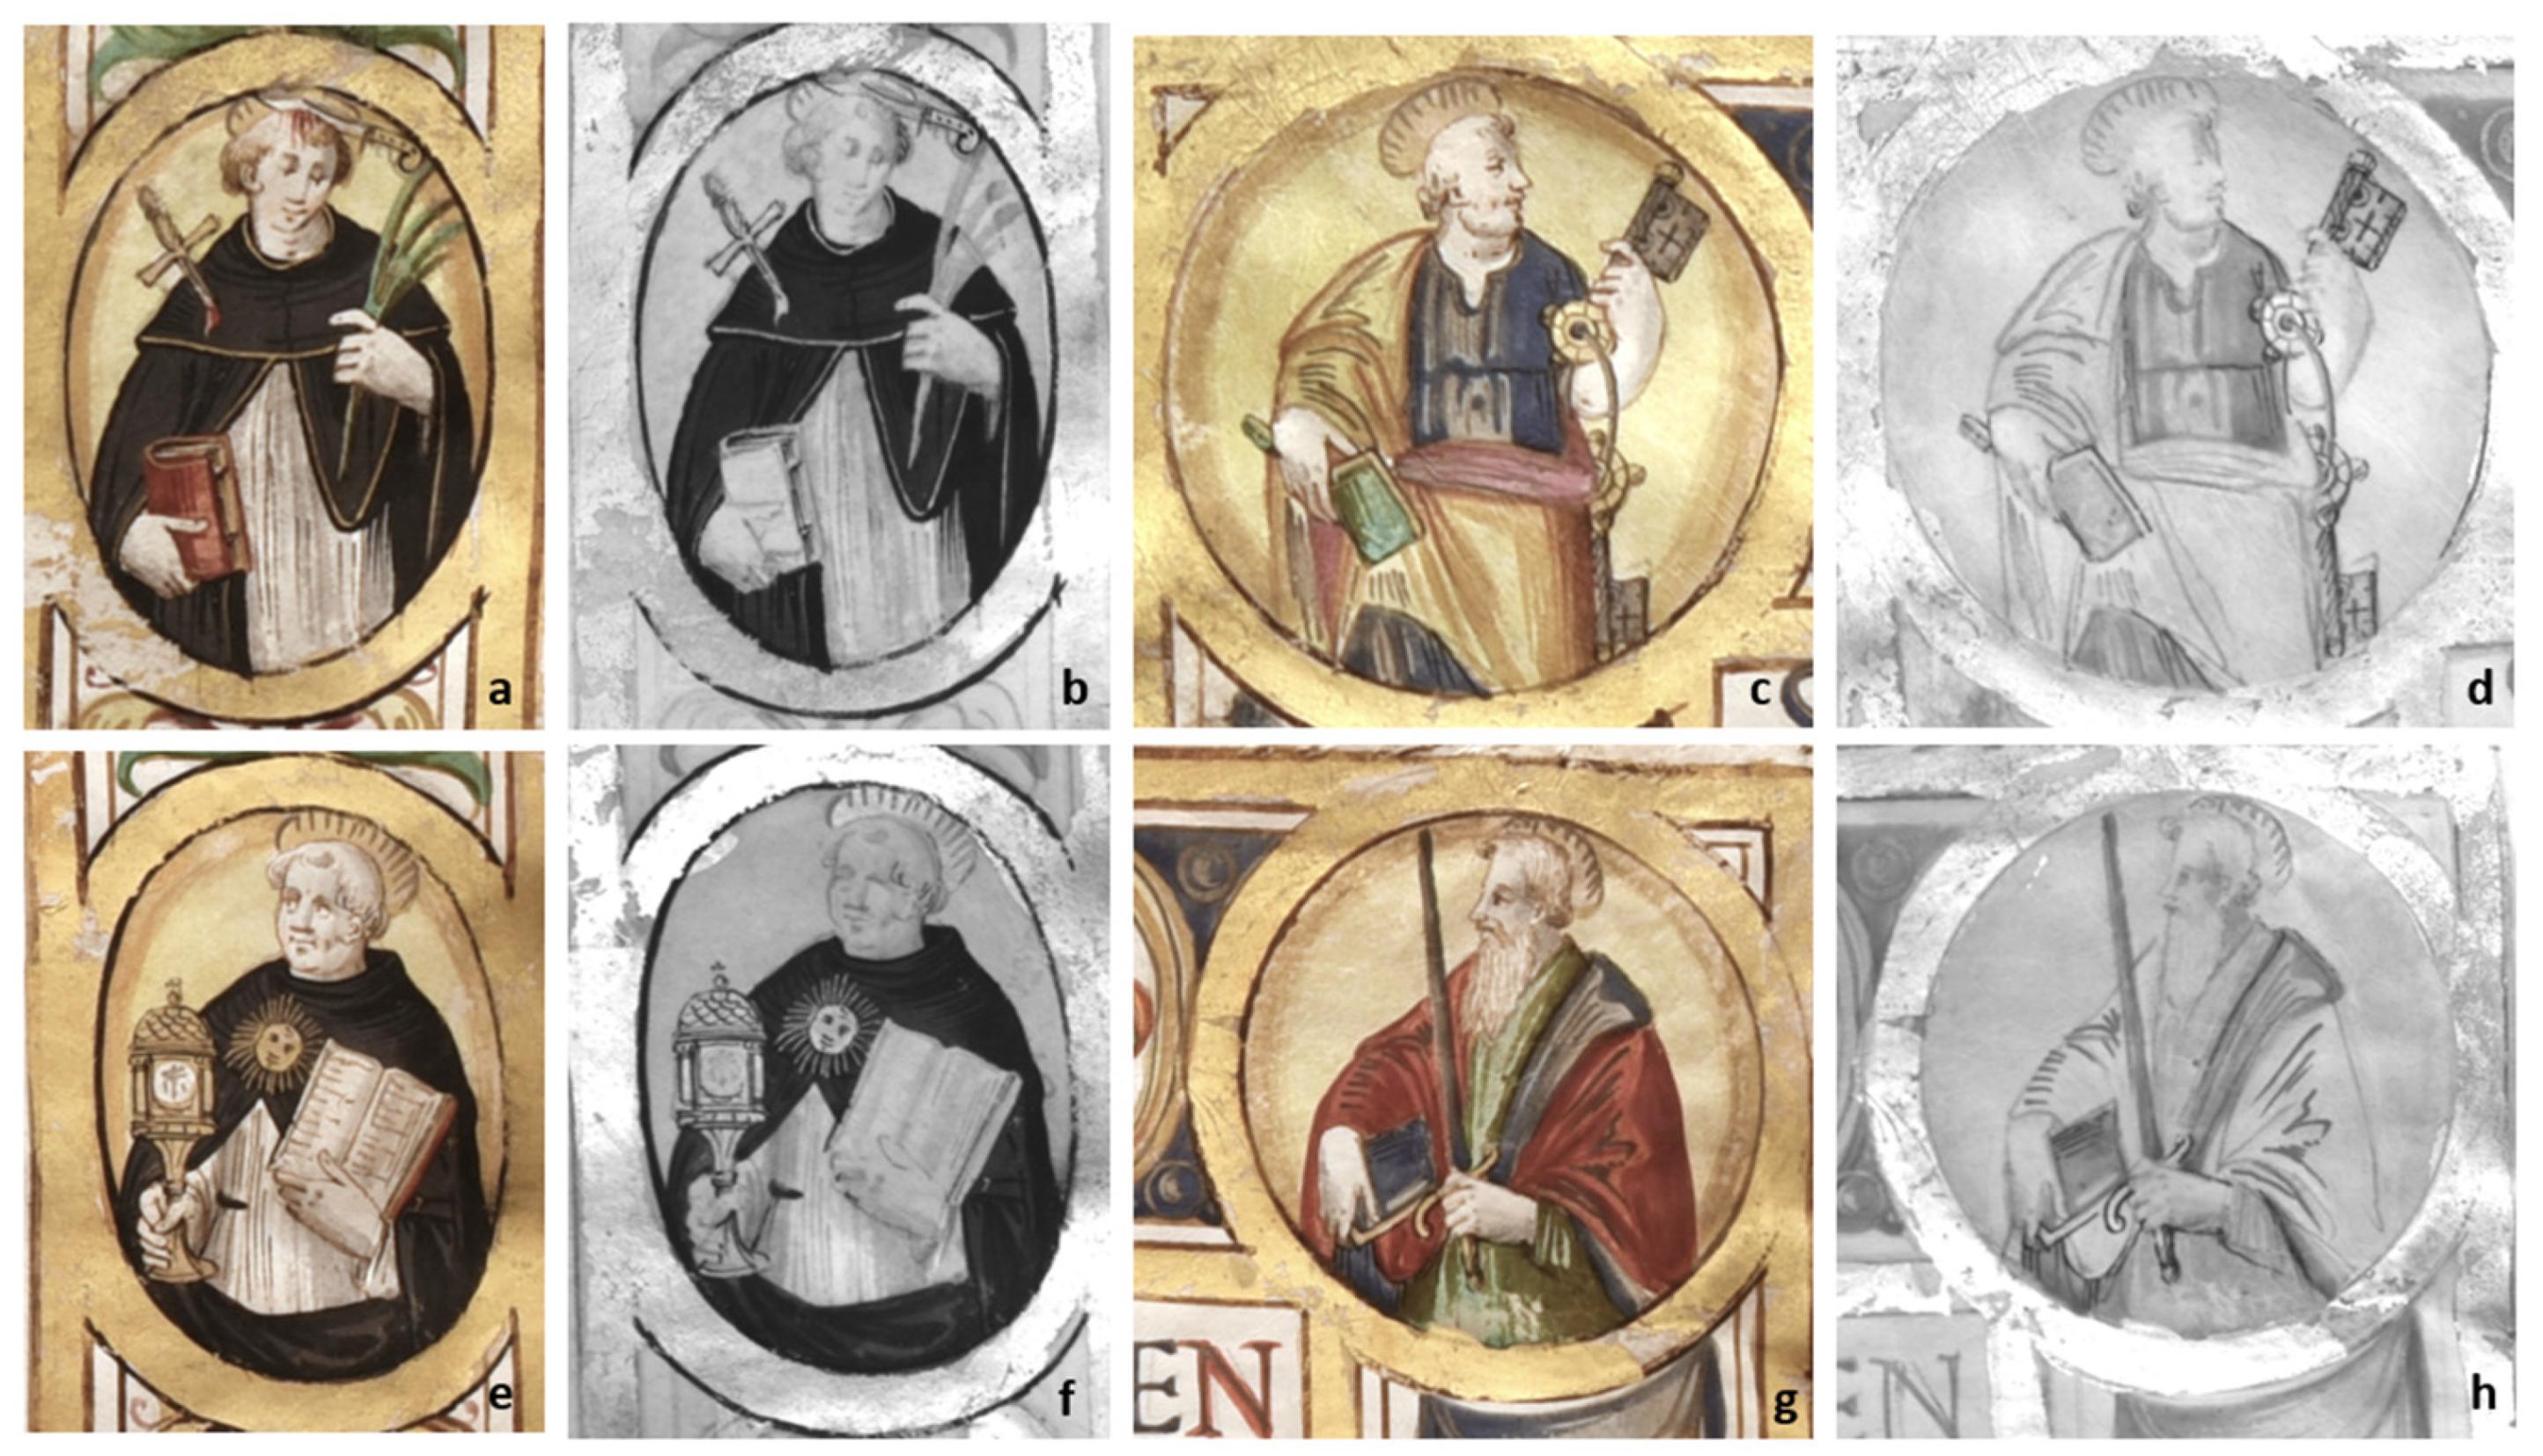
Figure 5.
XRF maps corresponding to three saints.
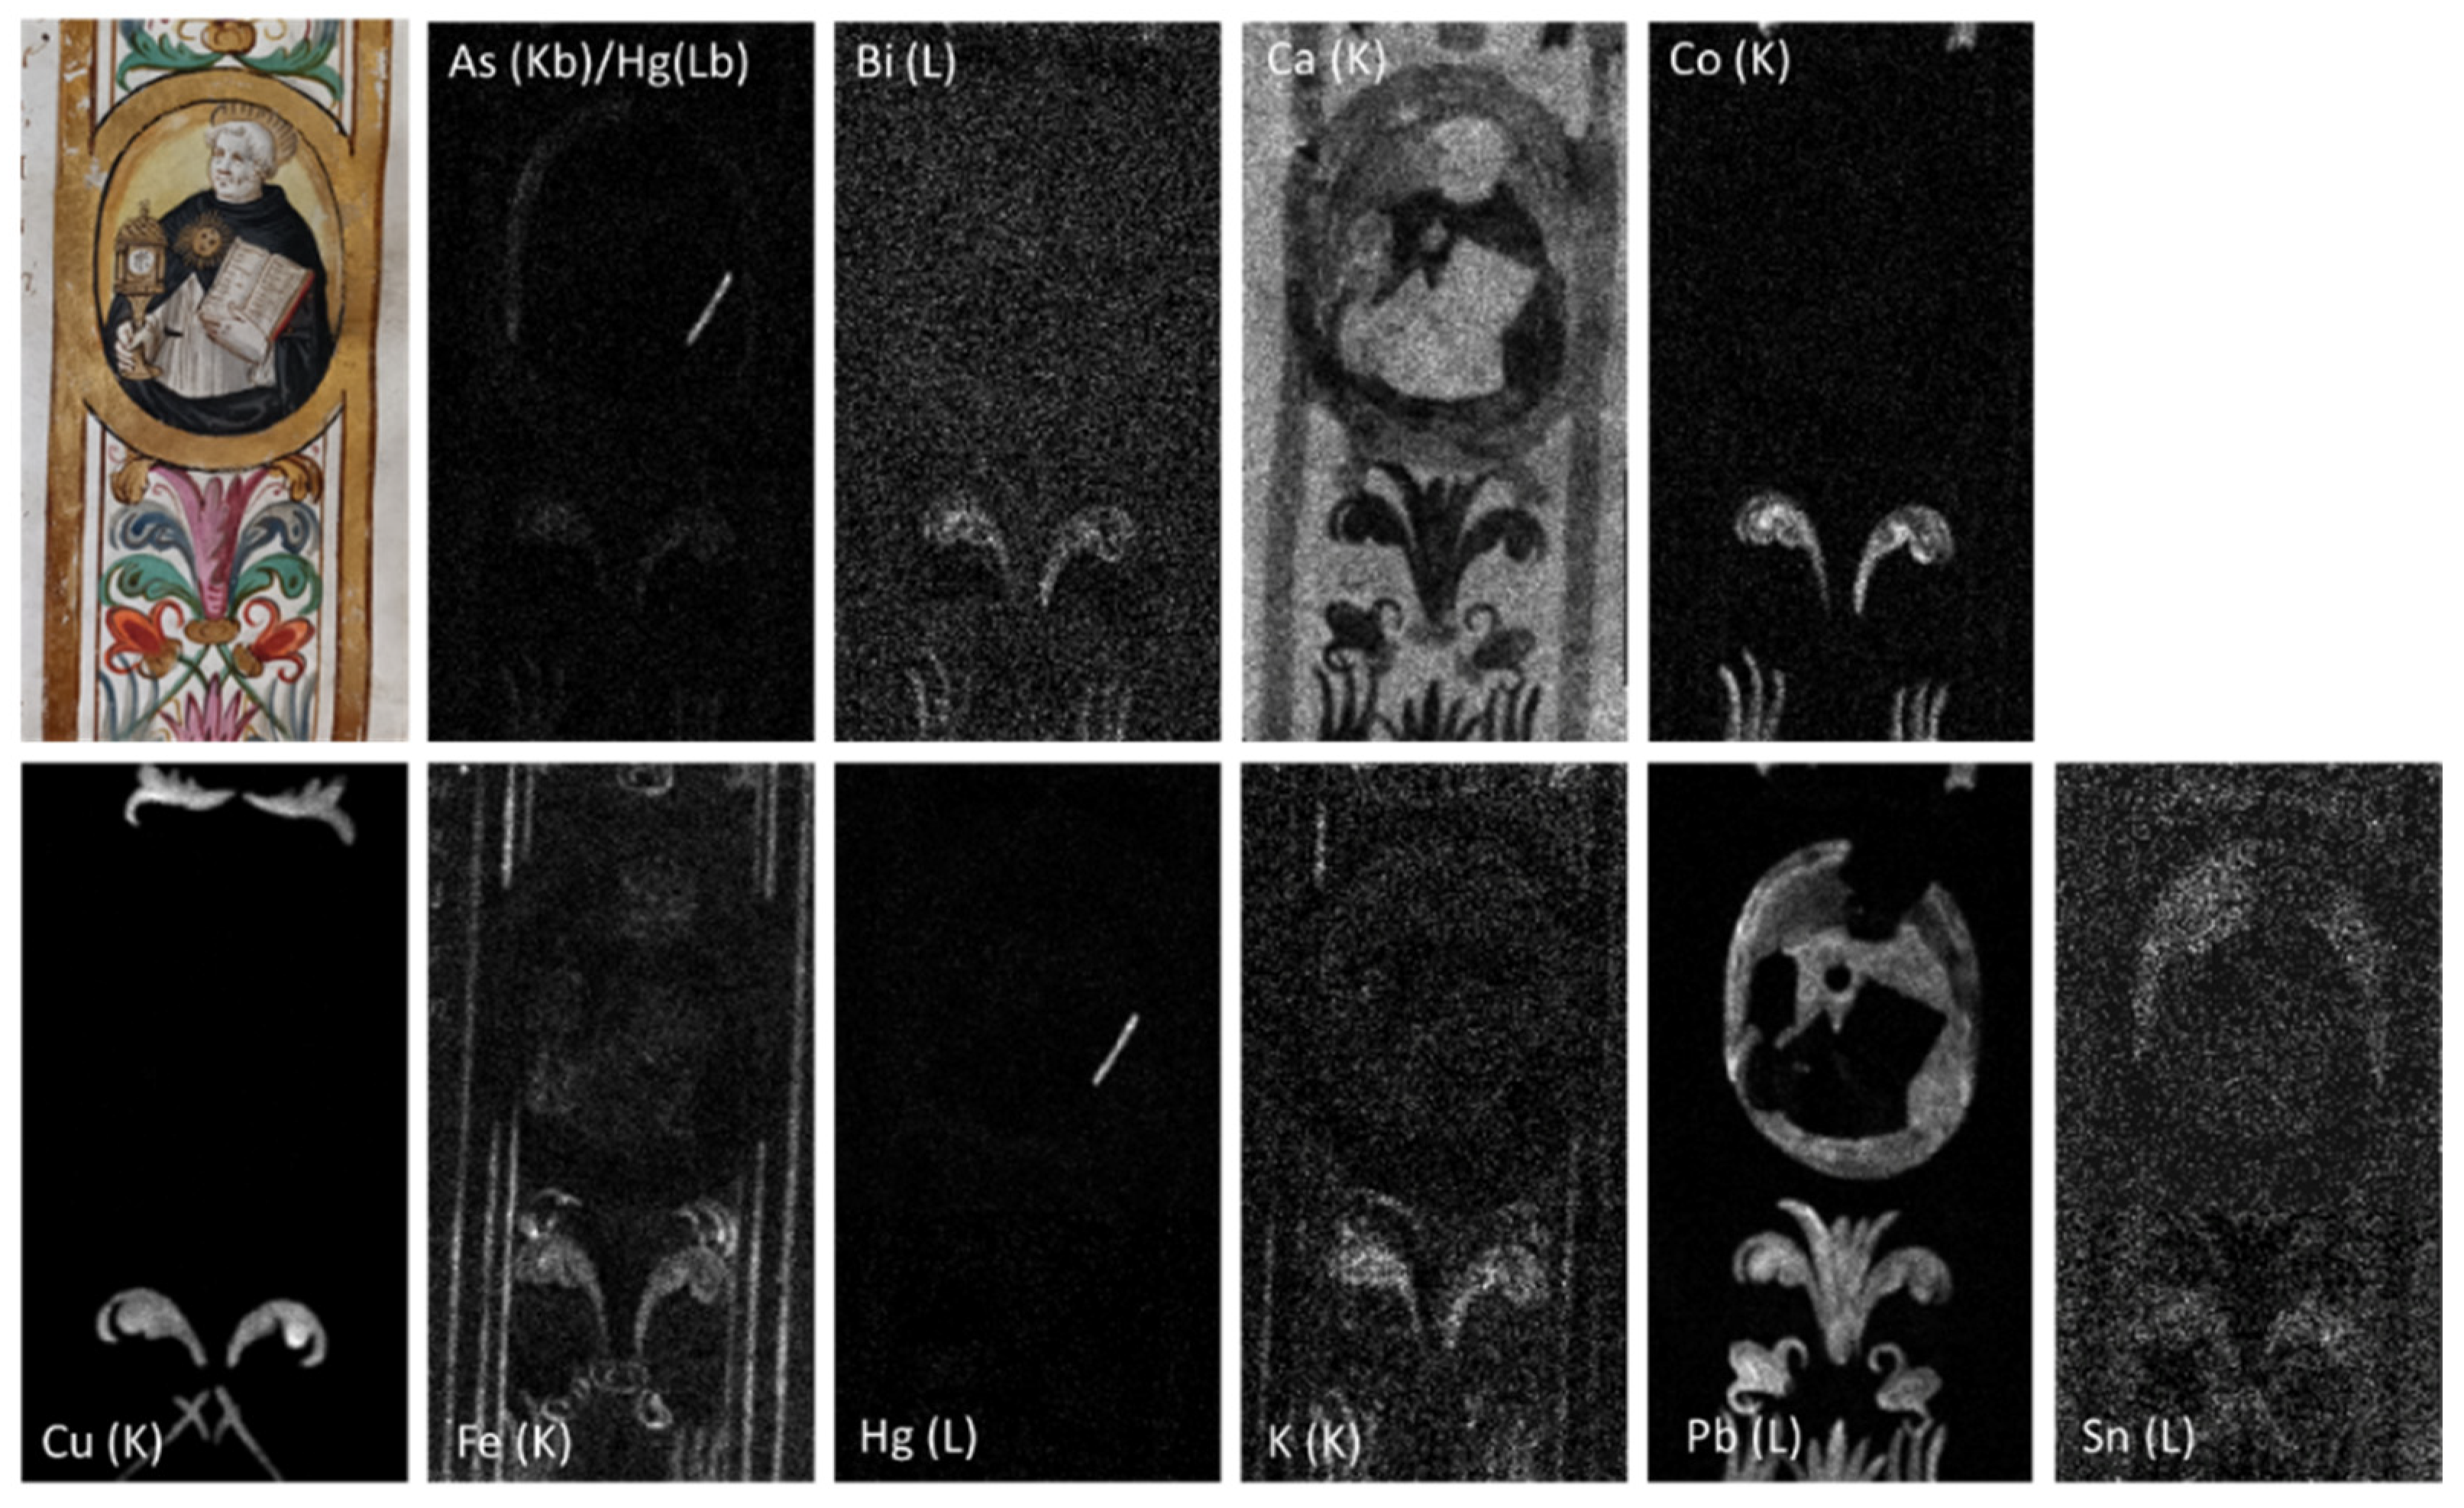
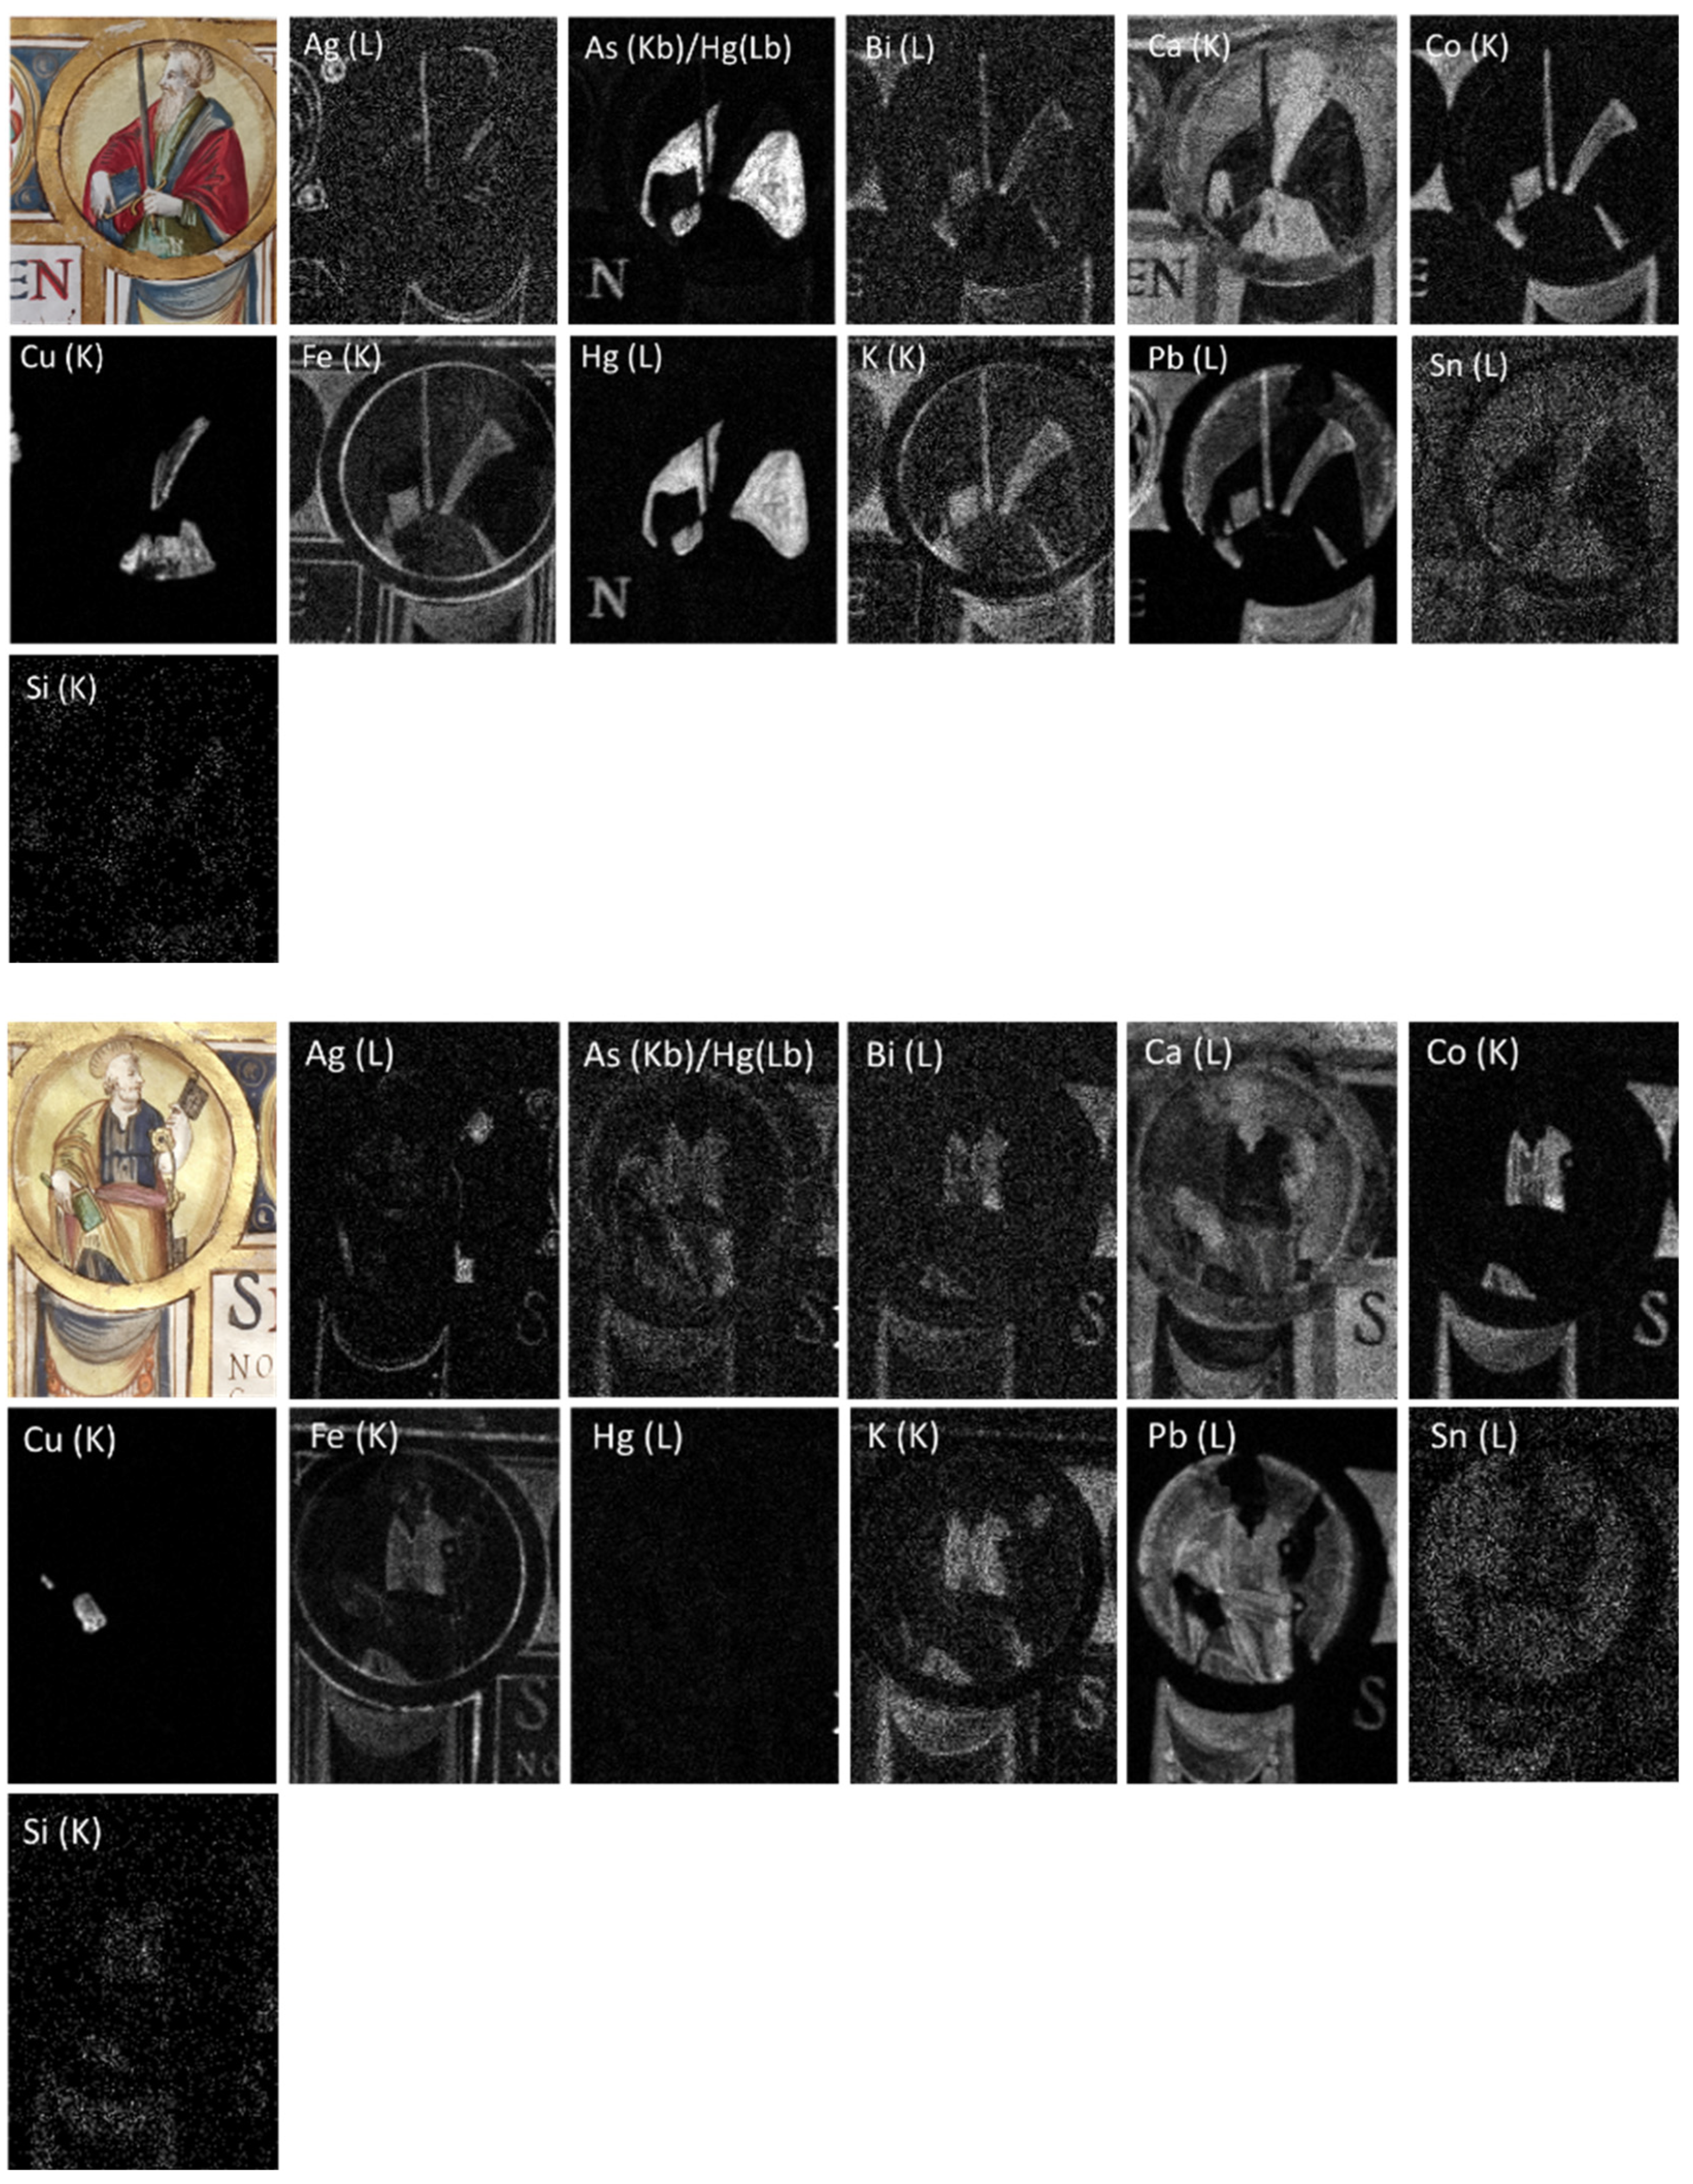

Figure 6.
Raman spectrum of the red hue (a), ER-FTIR (b) and FORS (c) spectra of the pink hue.
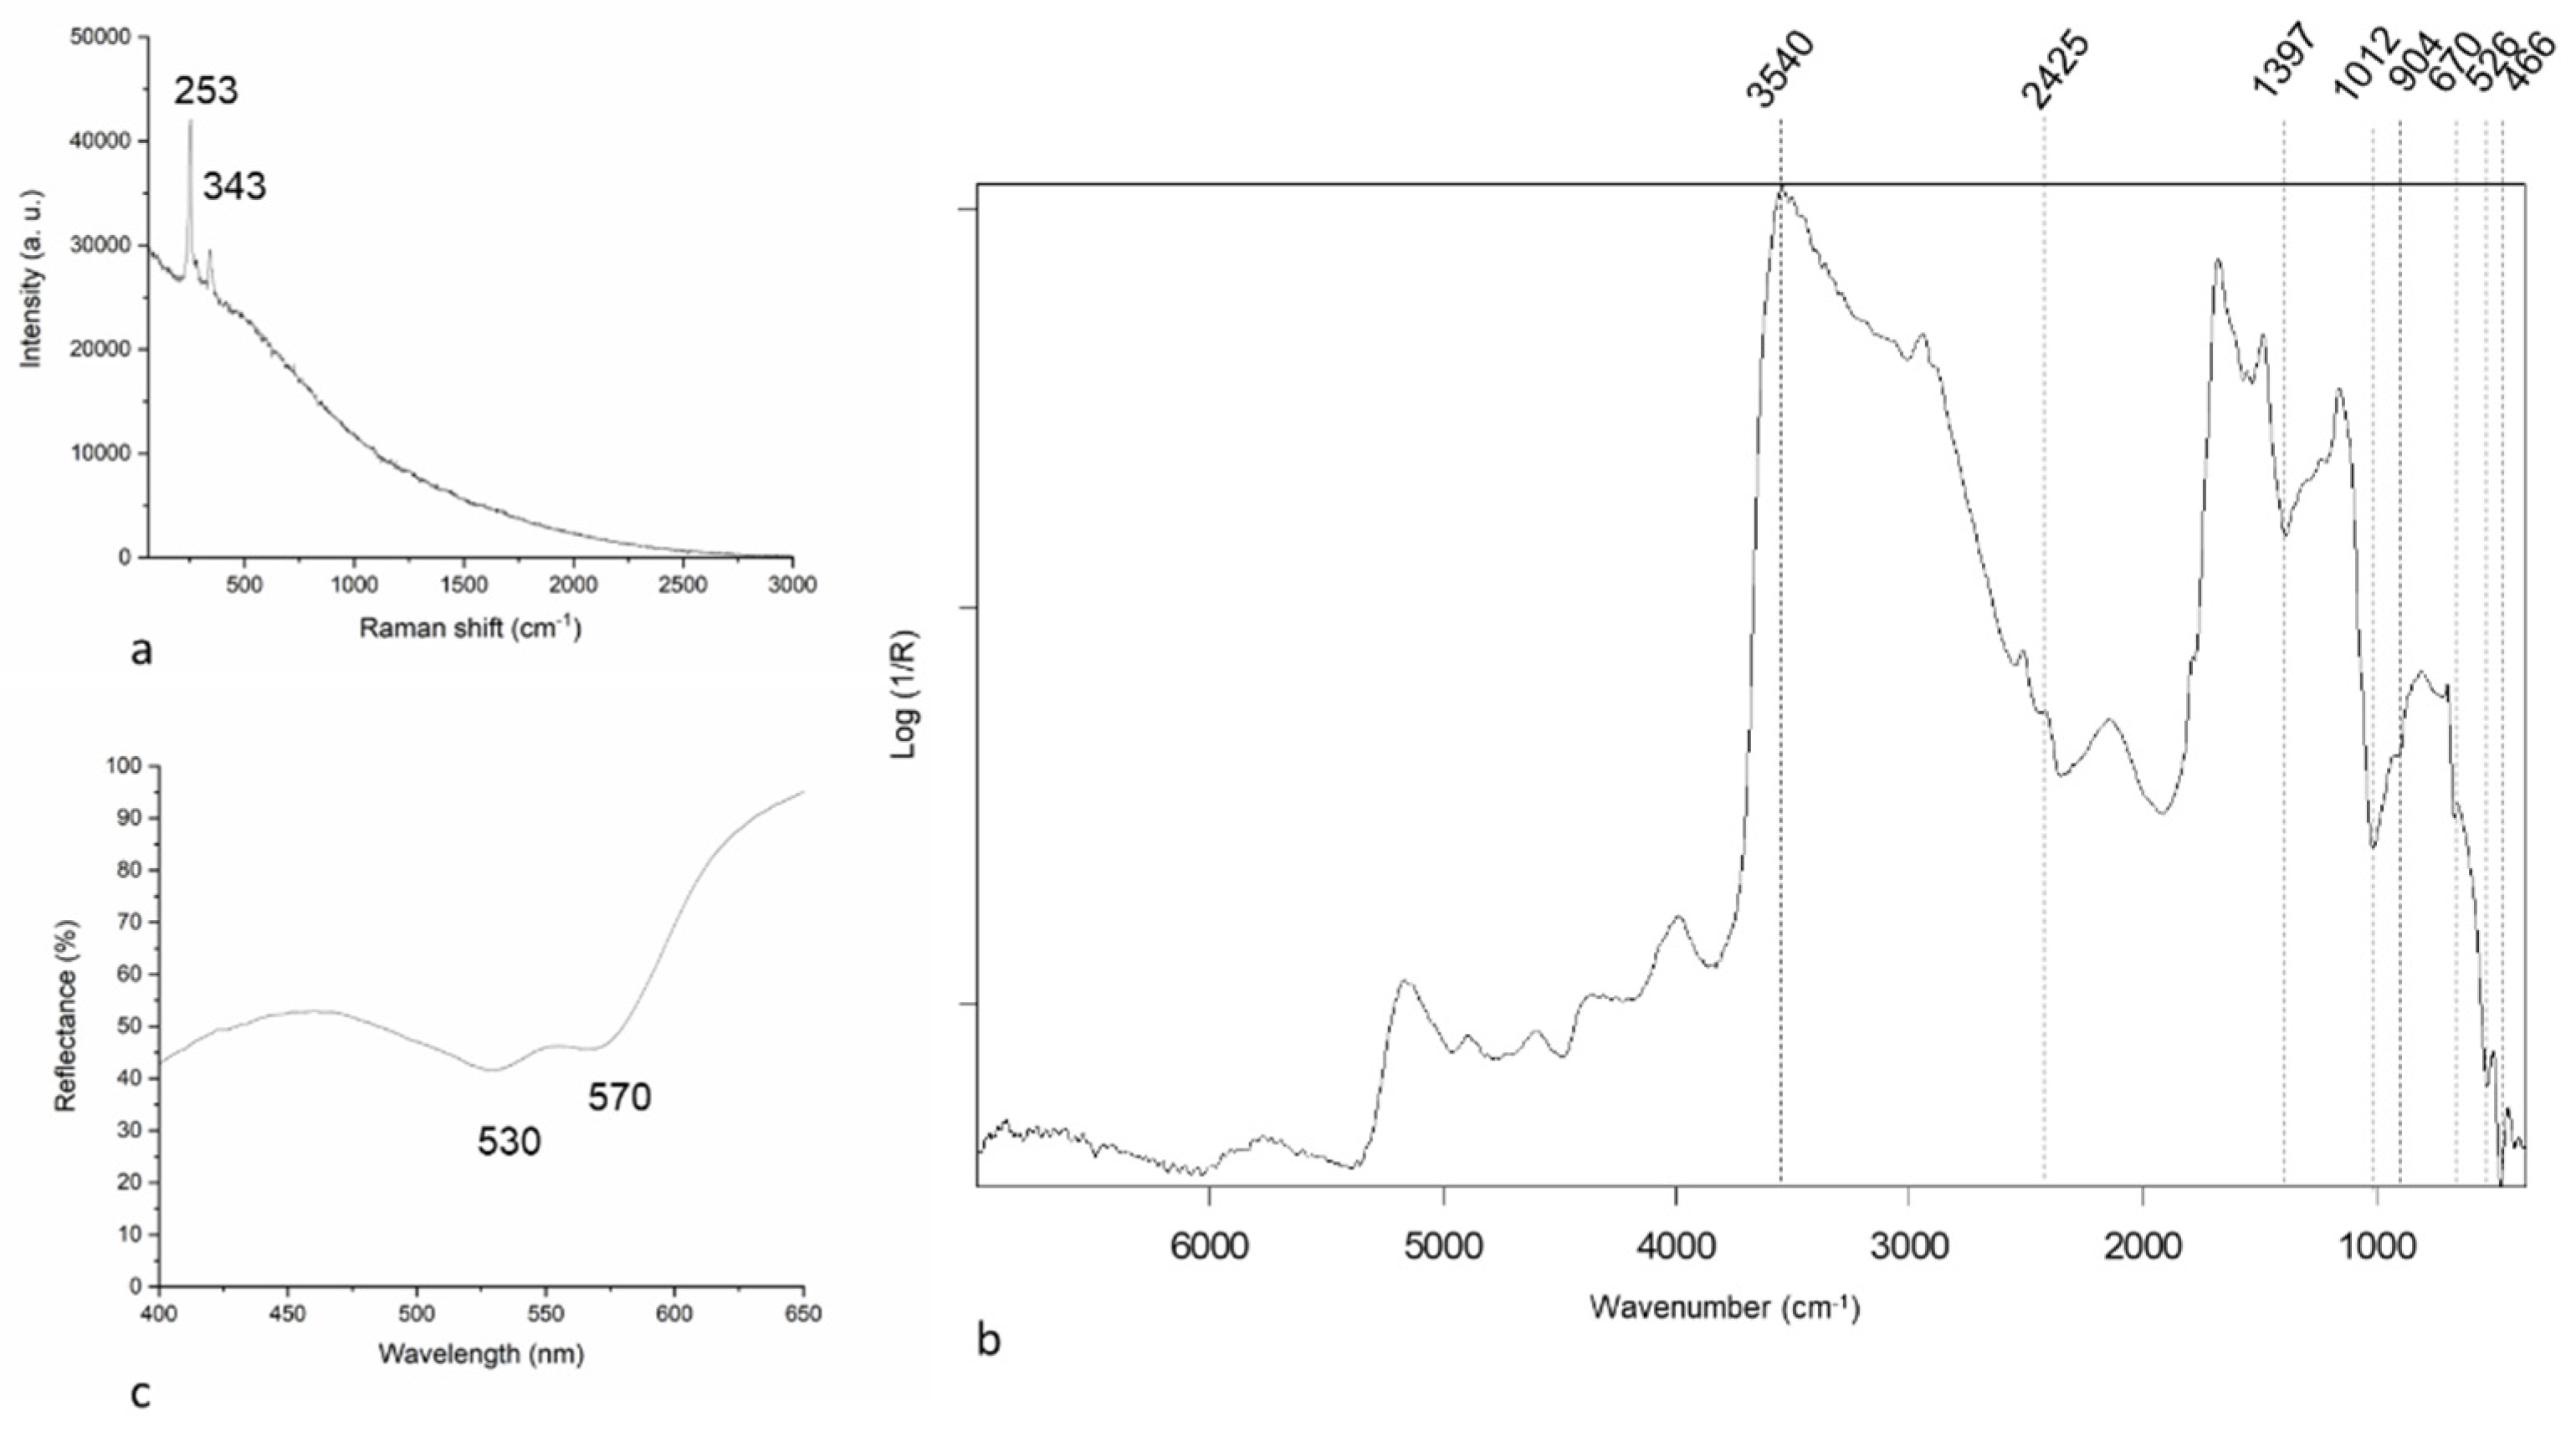
Figure 7.
RGB (a), UVFC(b) and IRFC (c) images of the scroll highlighting the changes of the spectral response of pigments.
Figure 7.
RGB (a), UVFC(b) and IRFC (c) images of the scroll highlighting the changes of the spectral response of pigments.
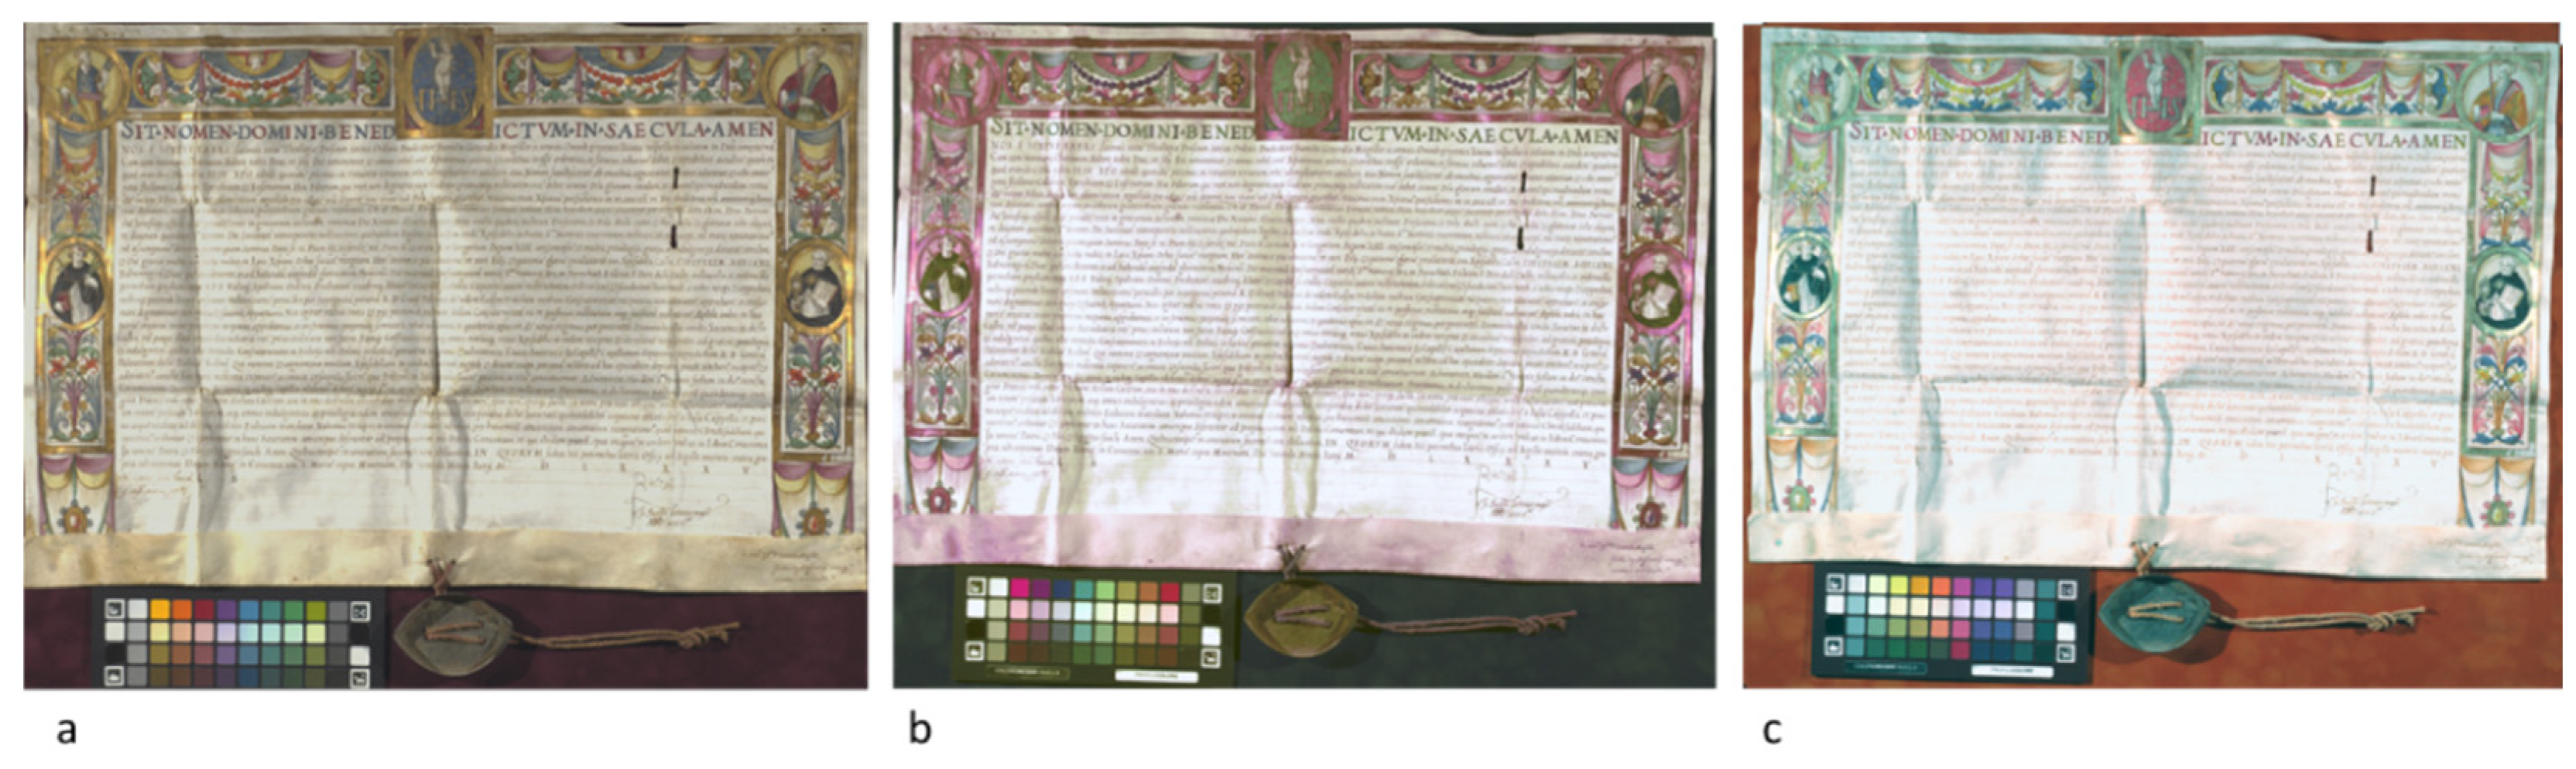
Figure 8.
Raman spectrum of orange hue.
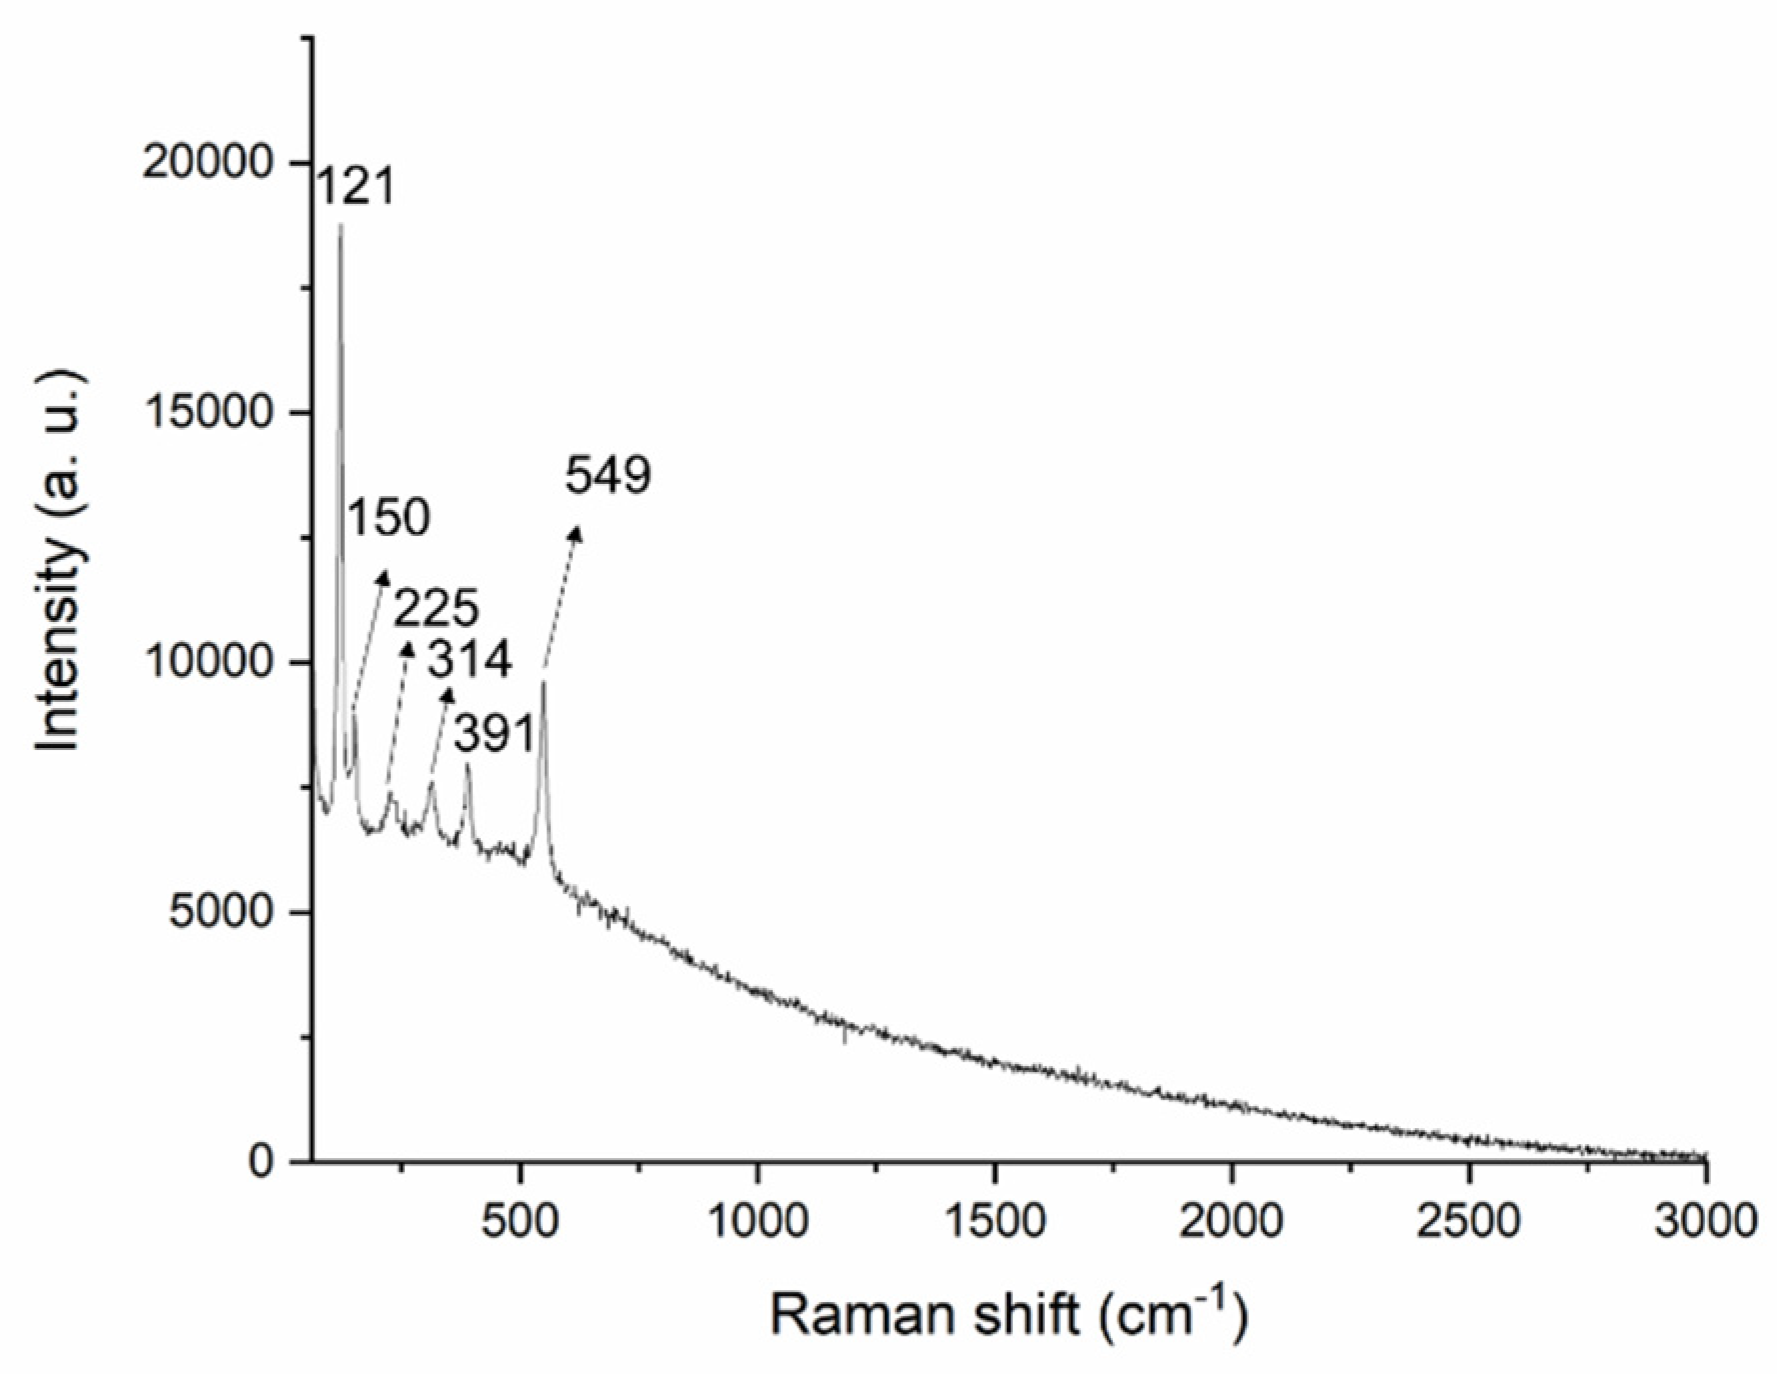
Figure 9.
Photographic image (a), IRR images of the figures taken at 1000 nm (b) and in the range 900-1700 nm (InGaAs camera) (c). Microscopical image (d) and ER-FTIR spectrum (e) of the blue paint layer.
Figure 9.
Photographic image (a), IRR images of the figures taken at 1000 nm (b) and in the range 900-1700 nm (InGaAs camera) (c). Microscopical image (d) and ER-FTIR spectrum (e) of the blue paint layer.
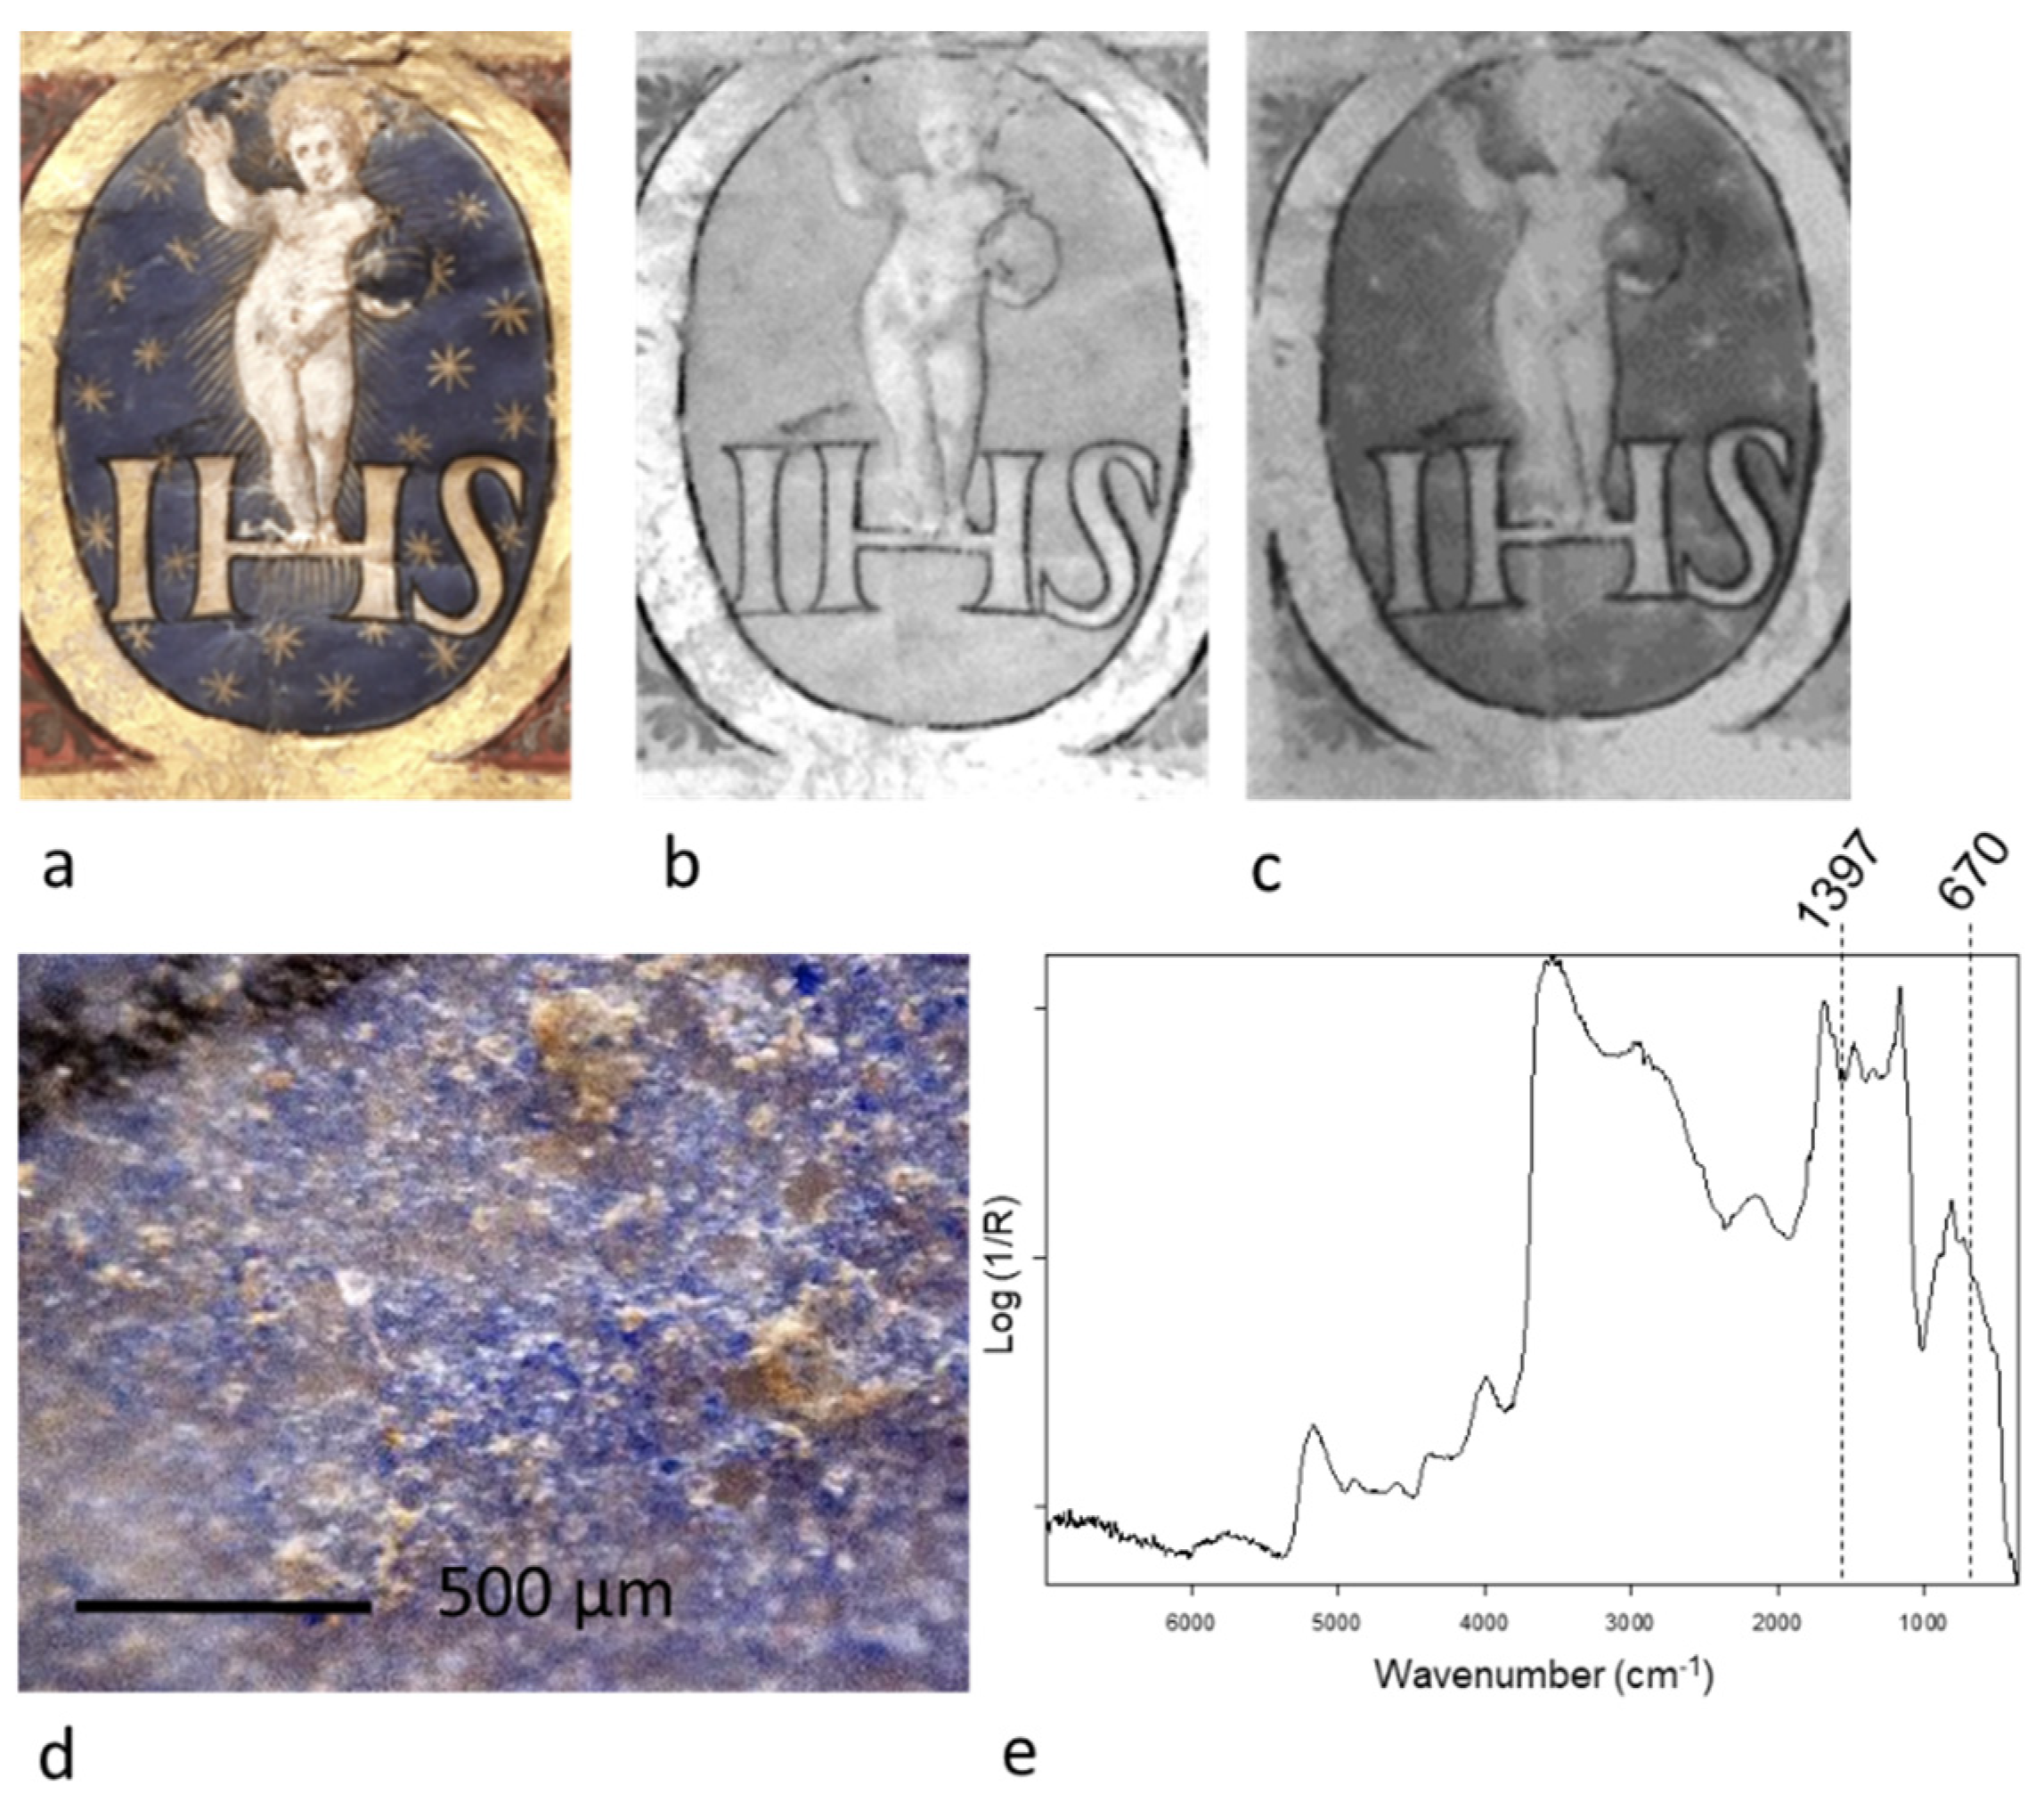
Figure 10.
Raman spectrum acquired on the green pictorial layer containing microcrystalline cellulose.
Figure 10.
Raman spectrum acquired on the green pictorial layer containing microcrystalline cellulose.
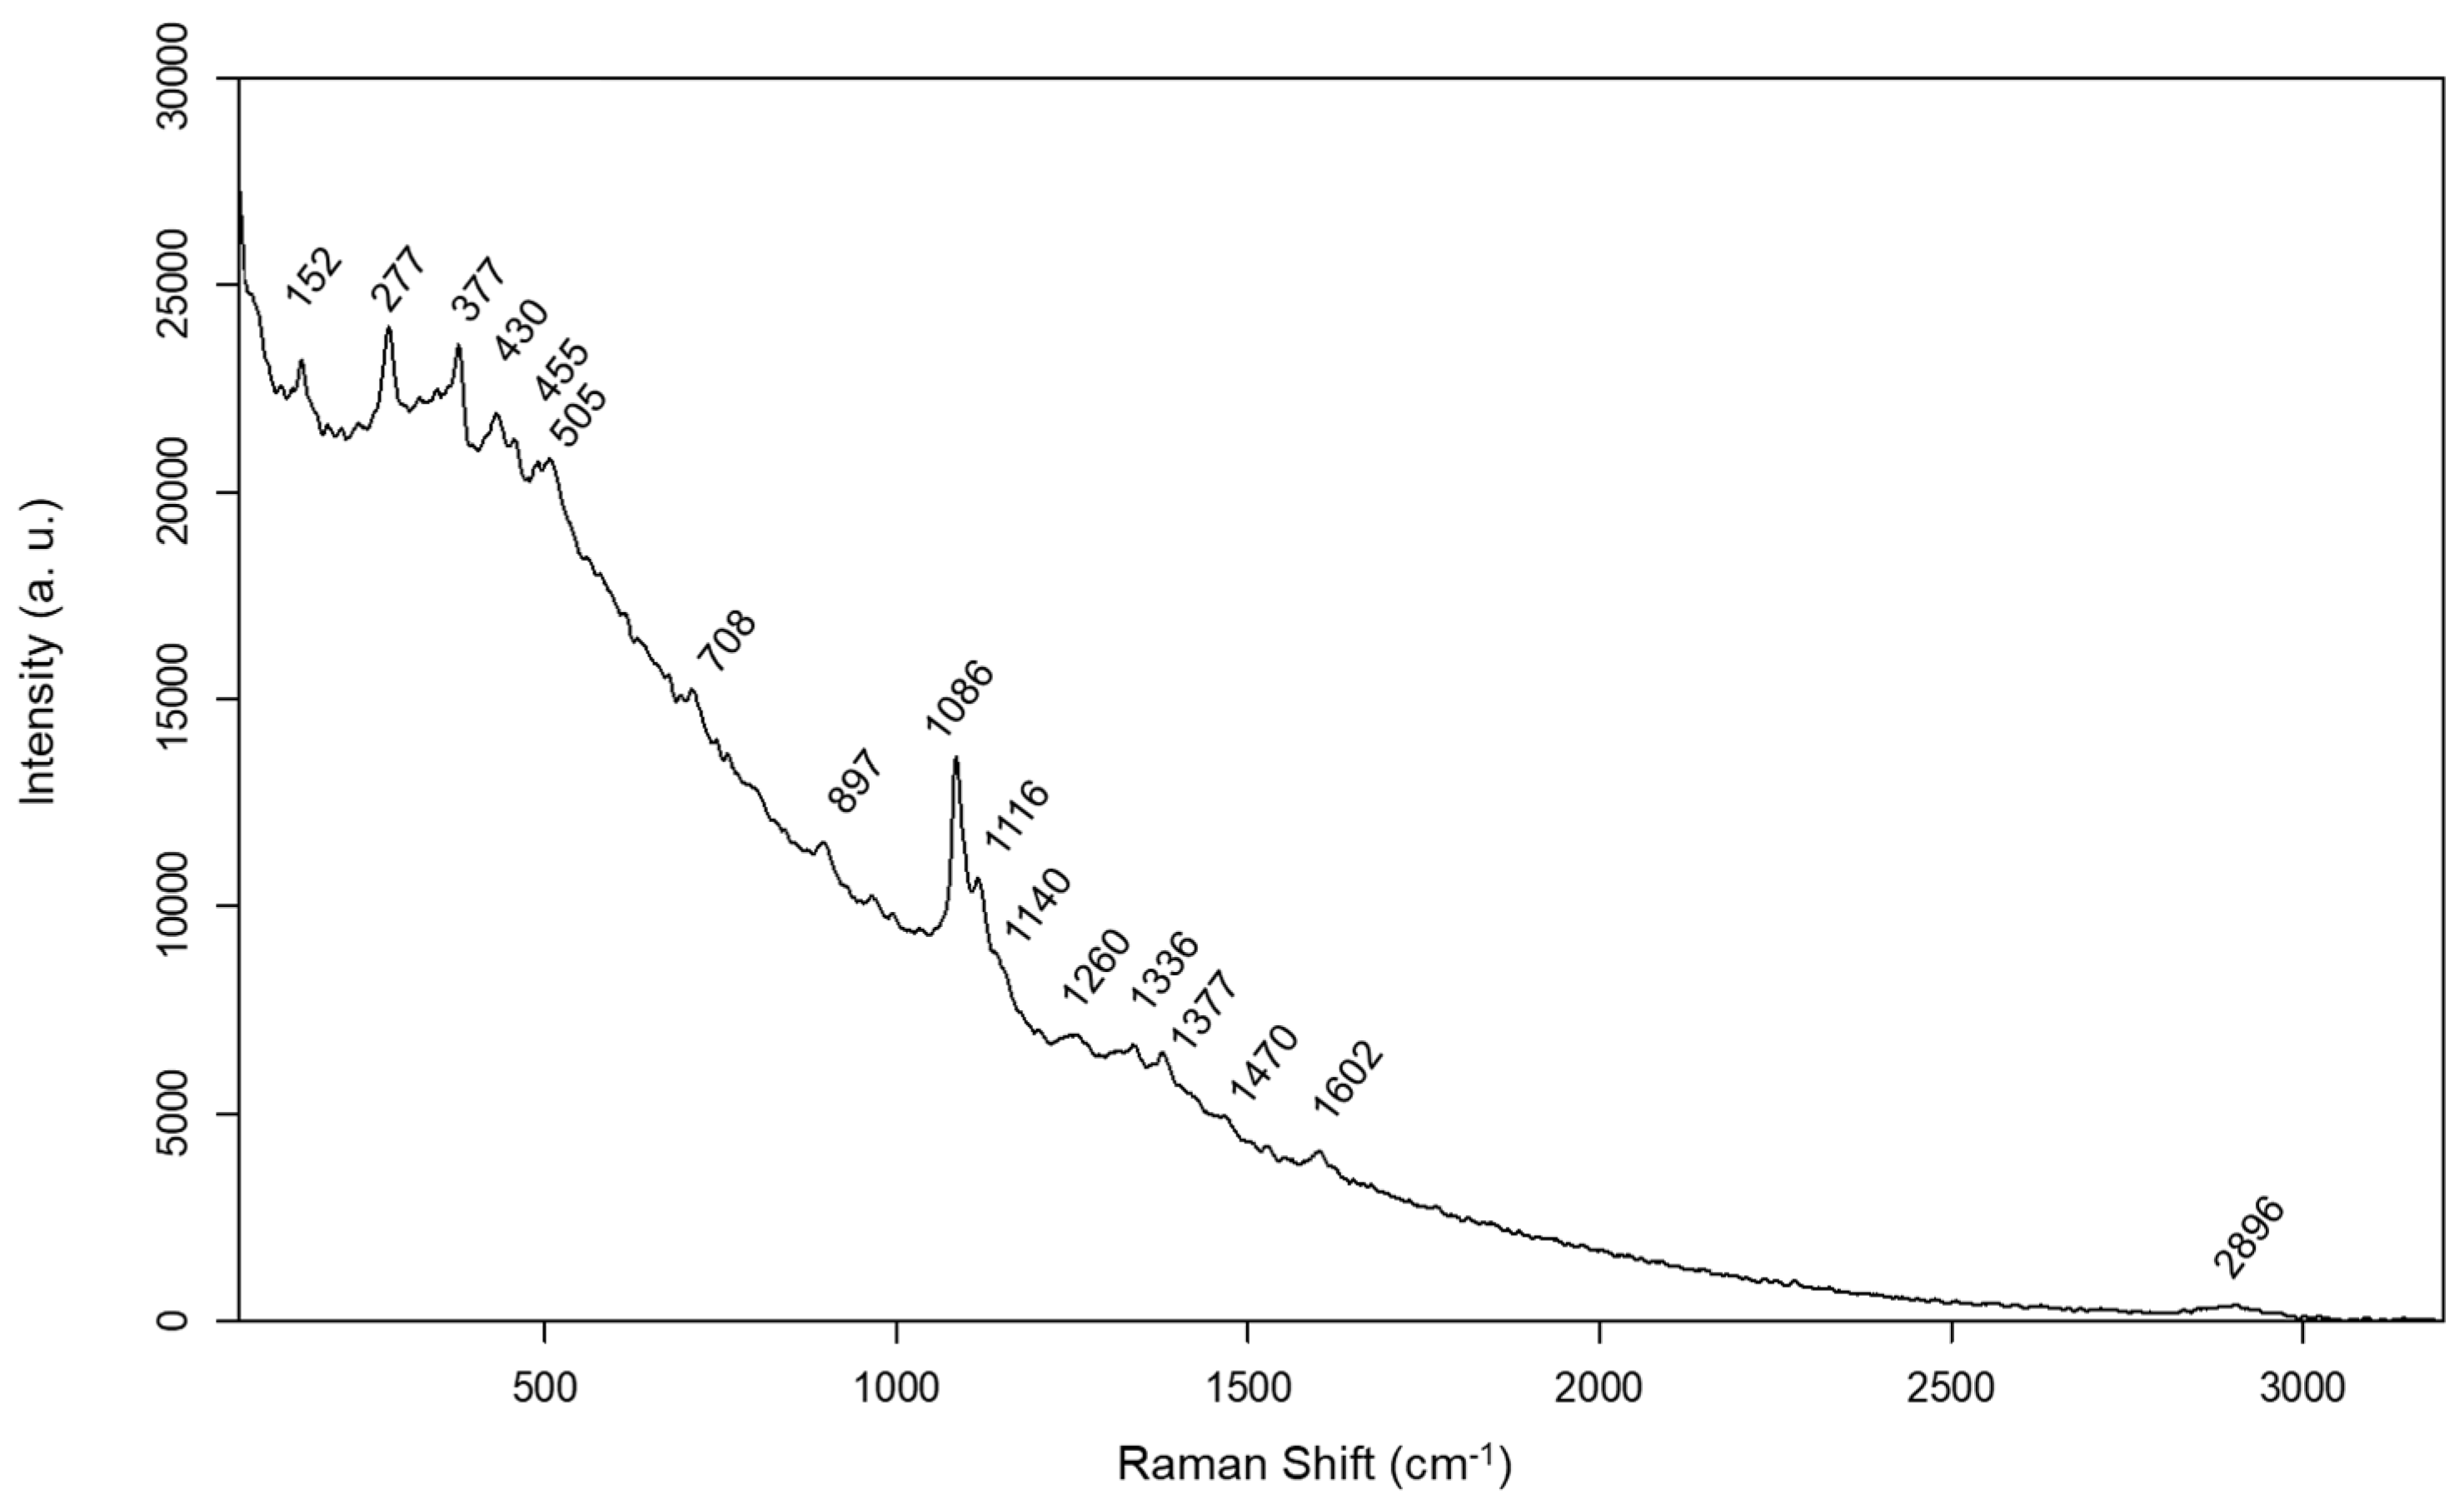
Figure 11.
ER-FTIR spectrum of the green pictorial layer.
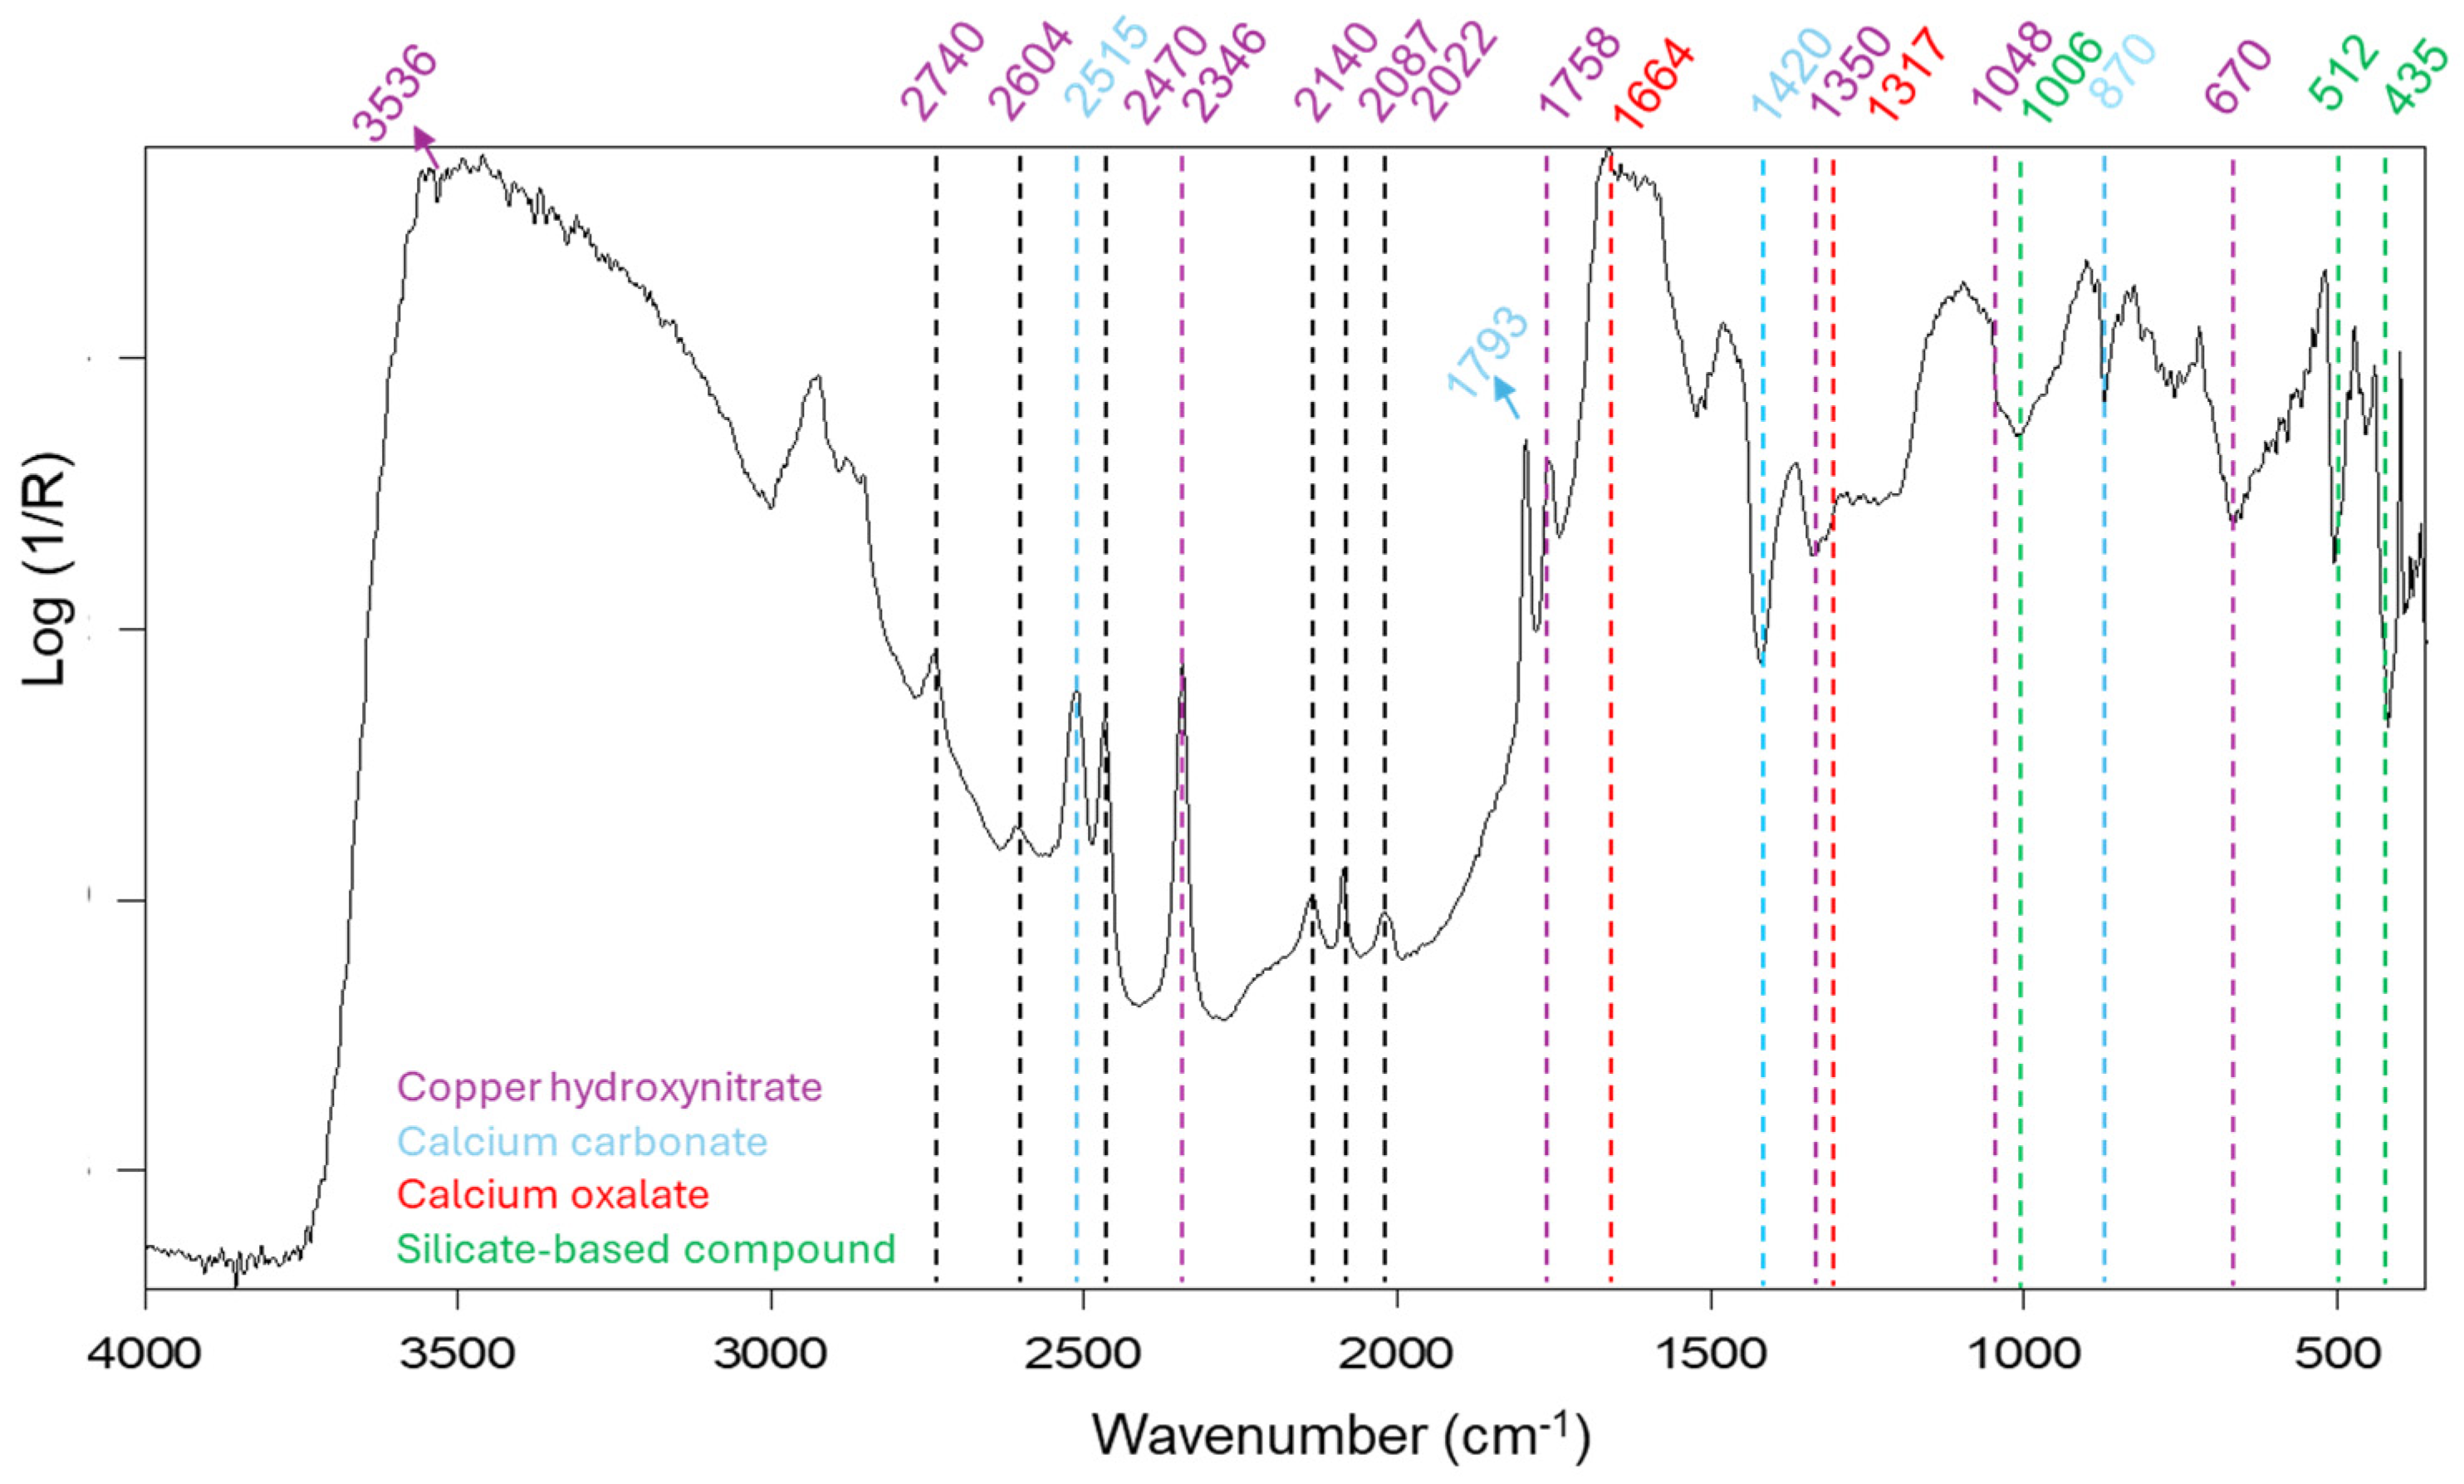
Figure 12.
Microscopical image under visible and UV source of a yellow painted area (a, b). The 20x magnification image is reported in the image with the black contour.
Figure 12.
Microscopical image under visible and UV source of a yellow painted area (a, b). The 20x magnification image is reported in the image with the black contour.
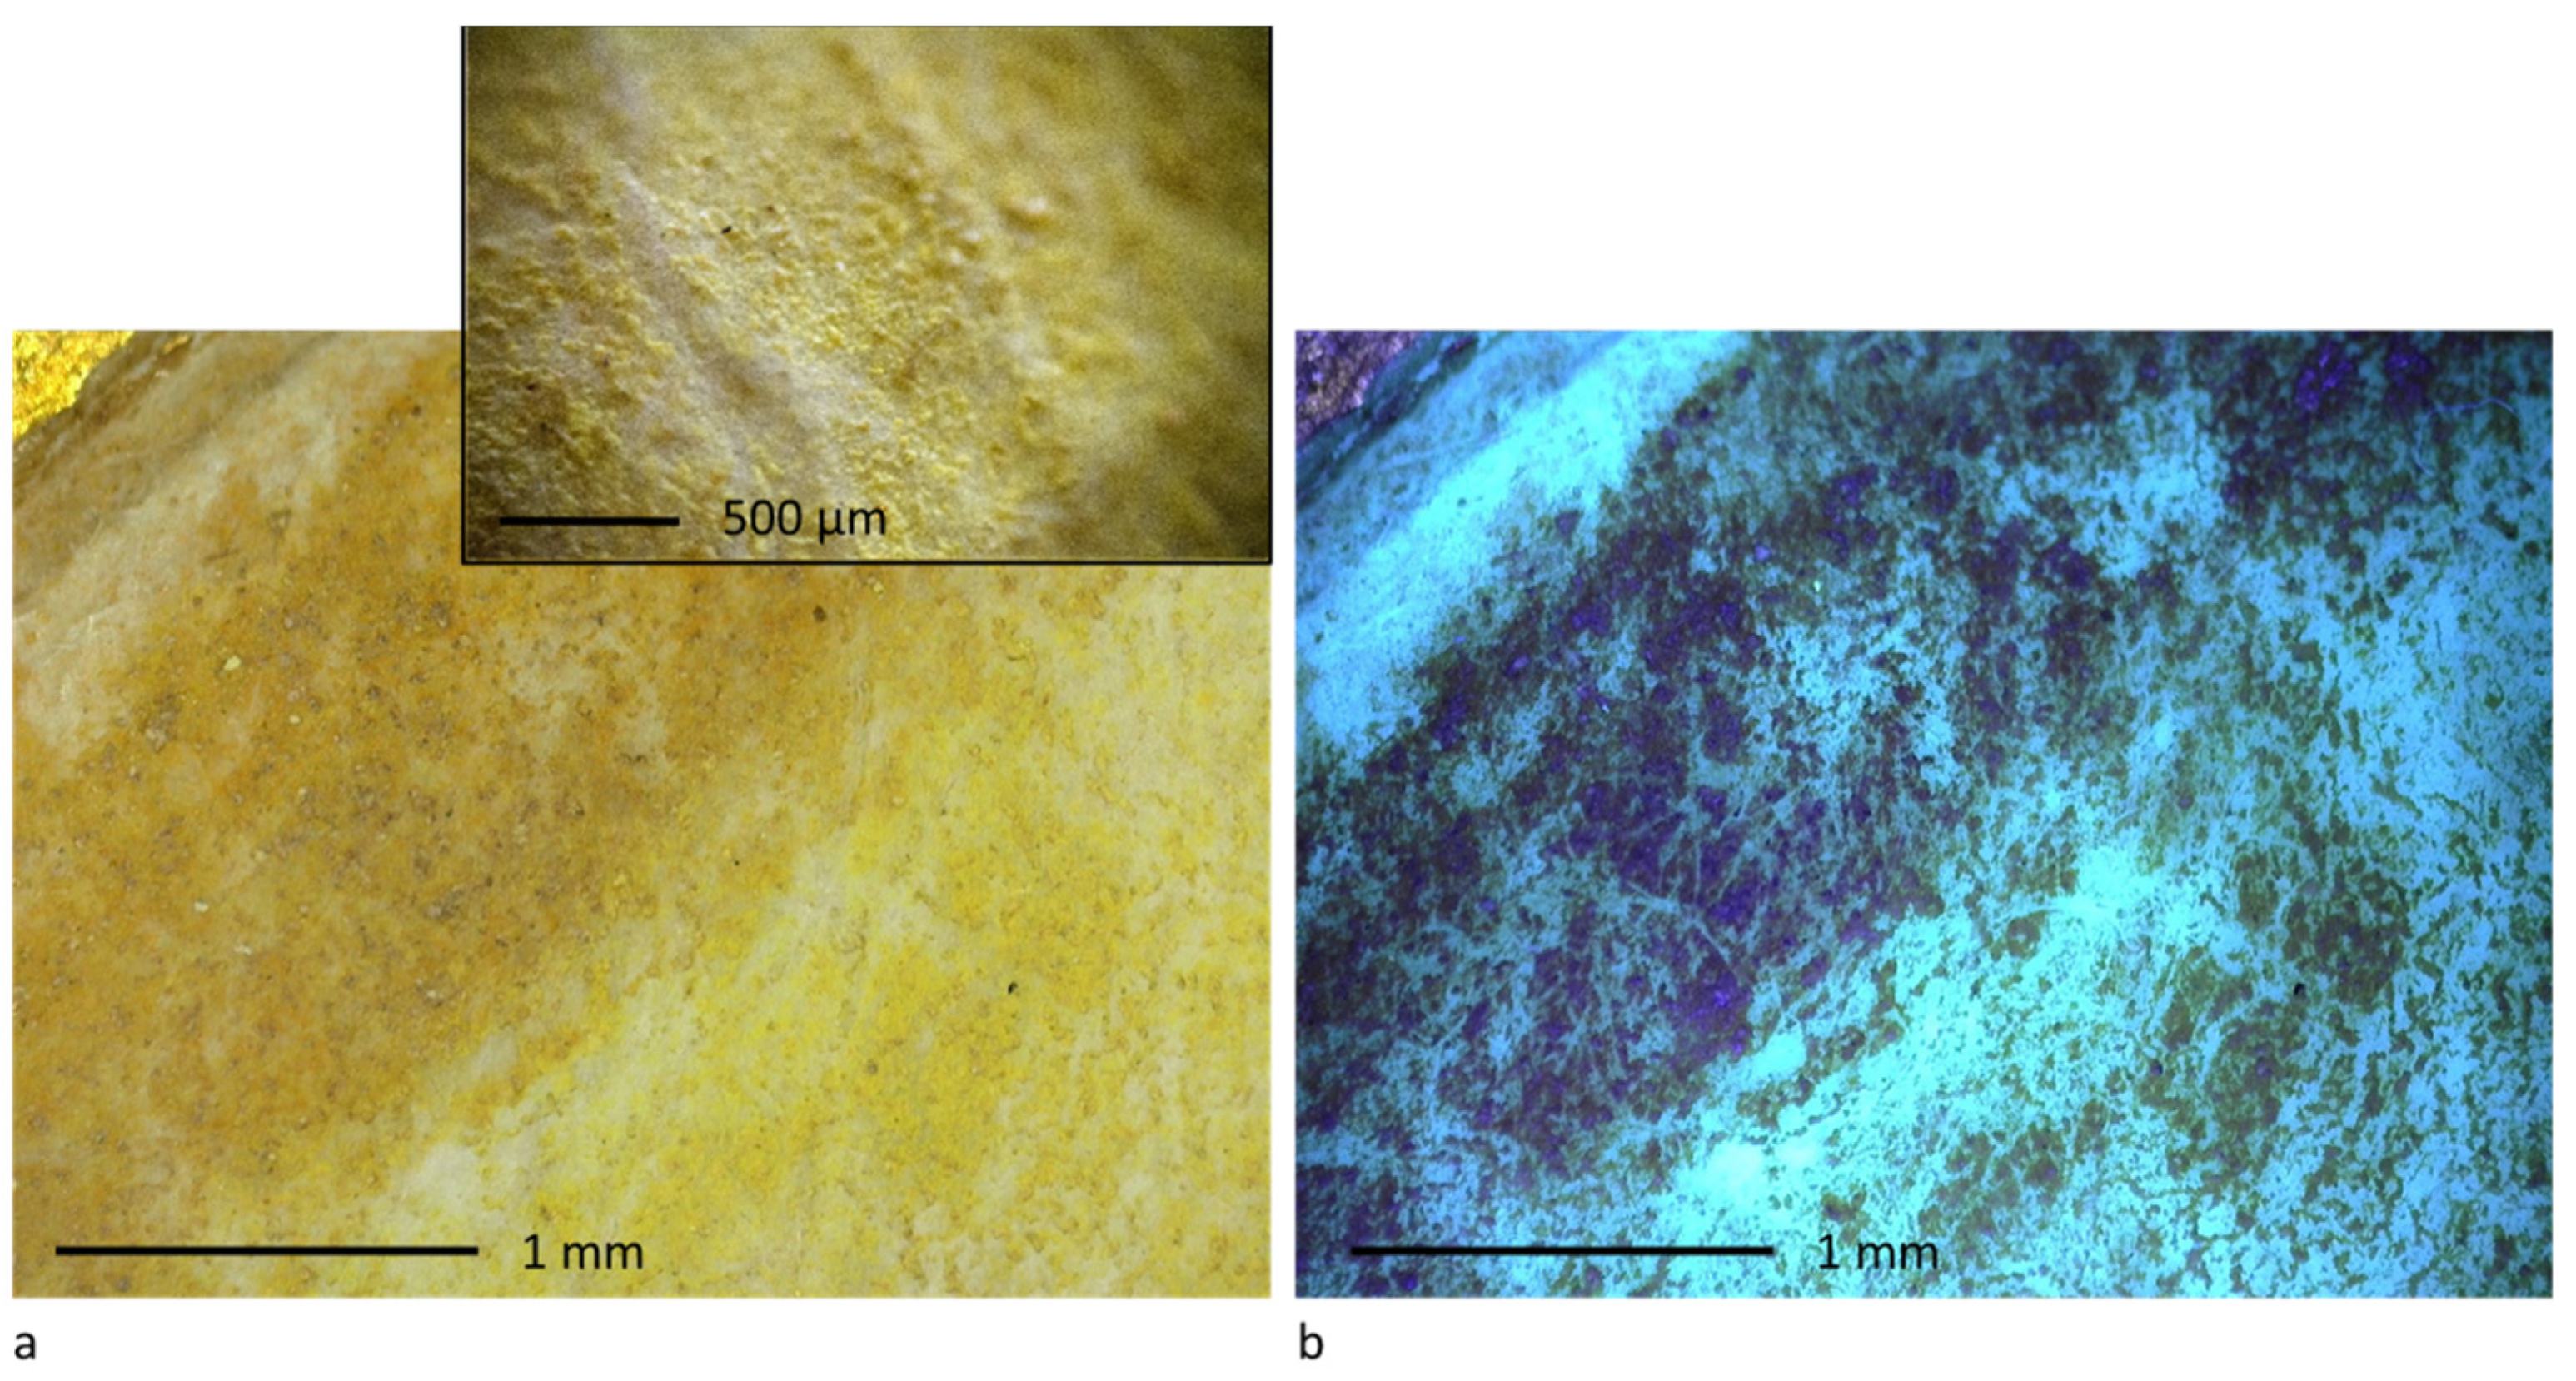
Figure 13.
Microscopical image of a black painted area. The 20x magnification image is reported in the yellow rectangle.
Figure 13.
Microscopical image of a black painted area. The 20x magnification image is reported in the yellow rectangle.
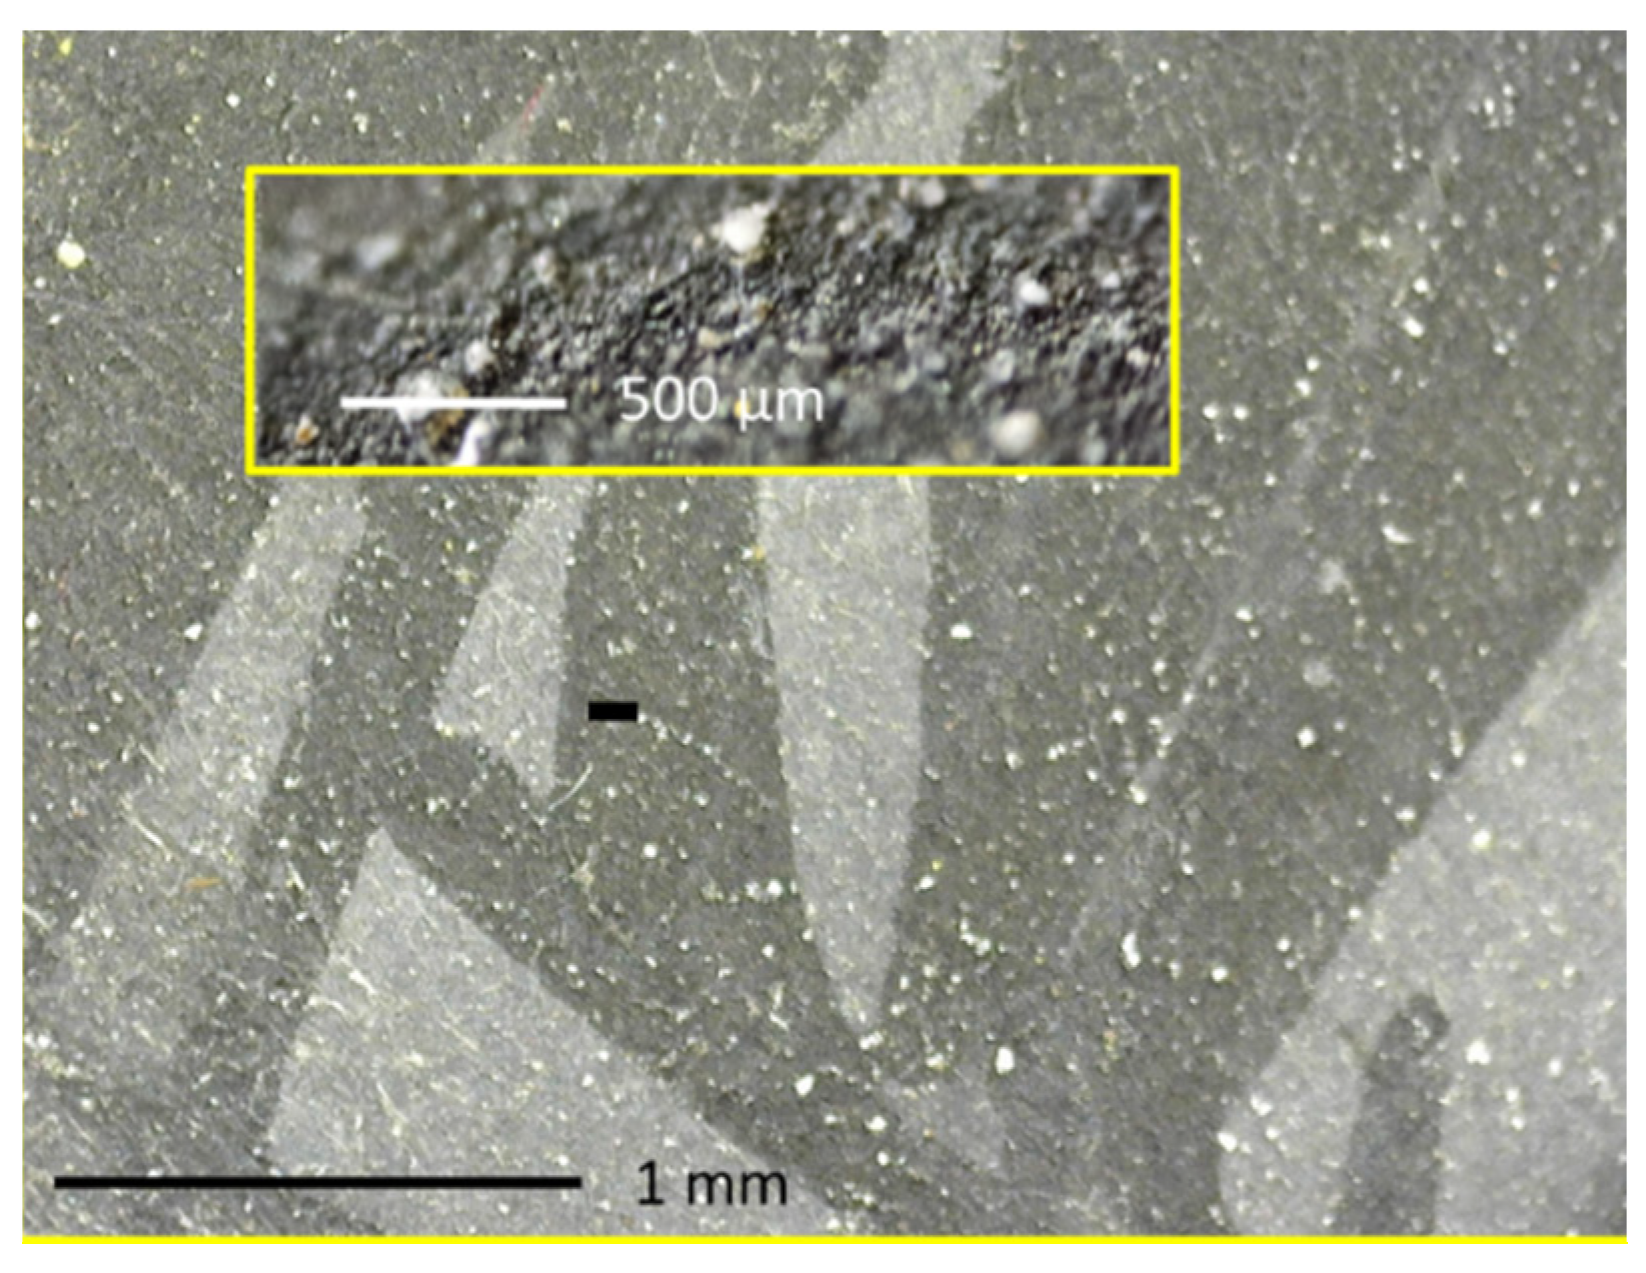
Figure 14.
XRF maps of Au (L) and Ag (L) of three Saints (a, b, c).
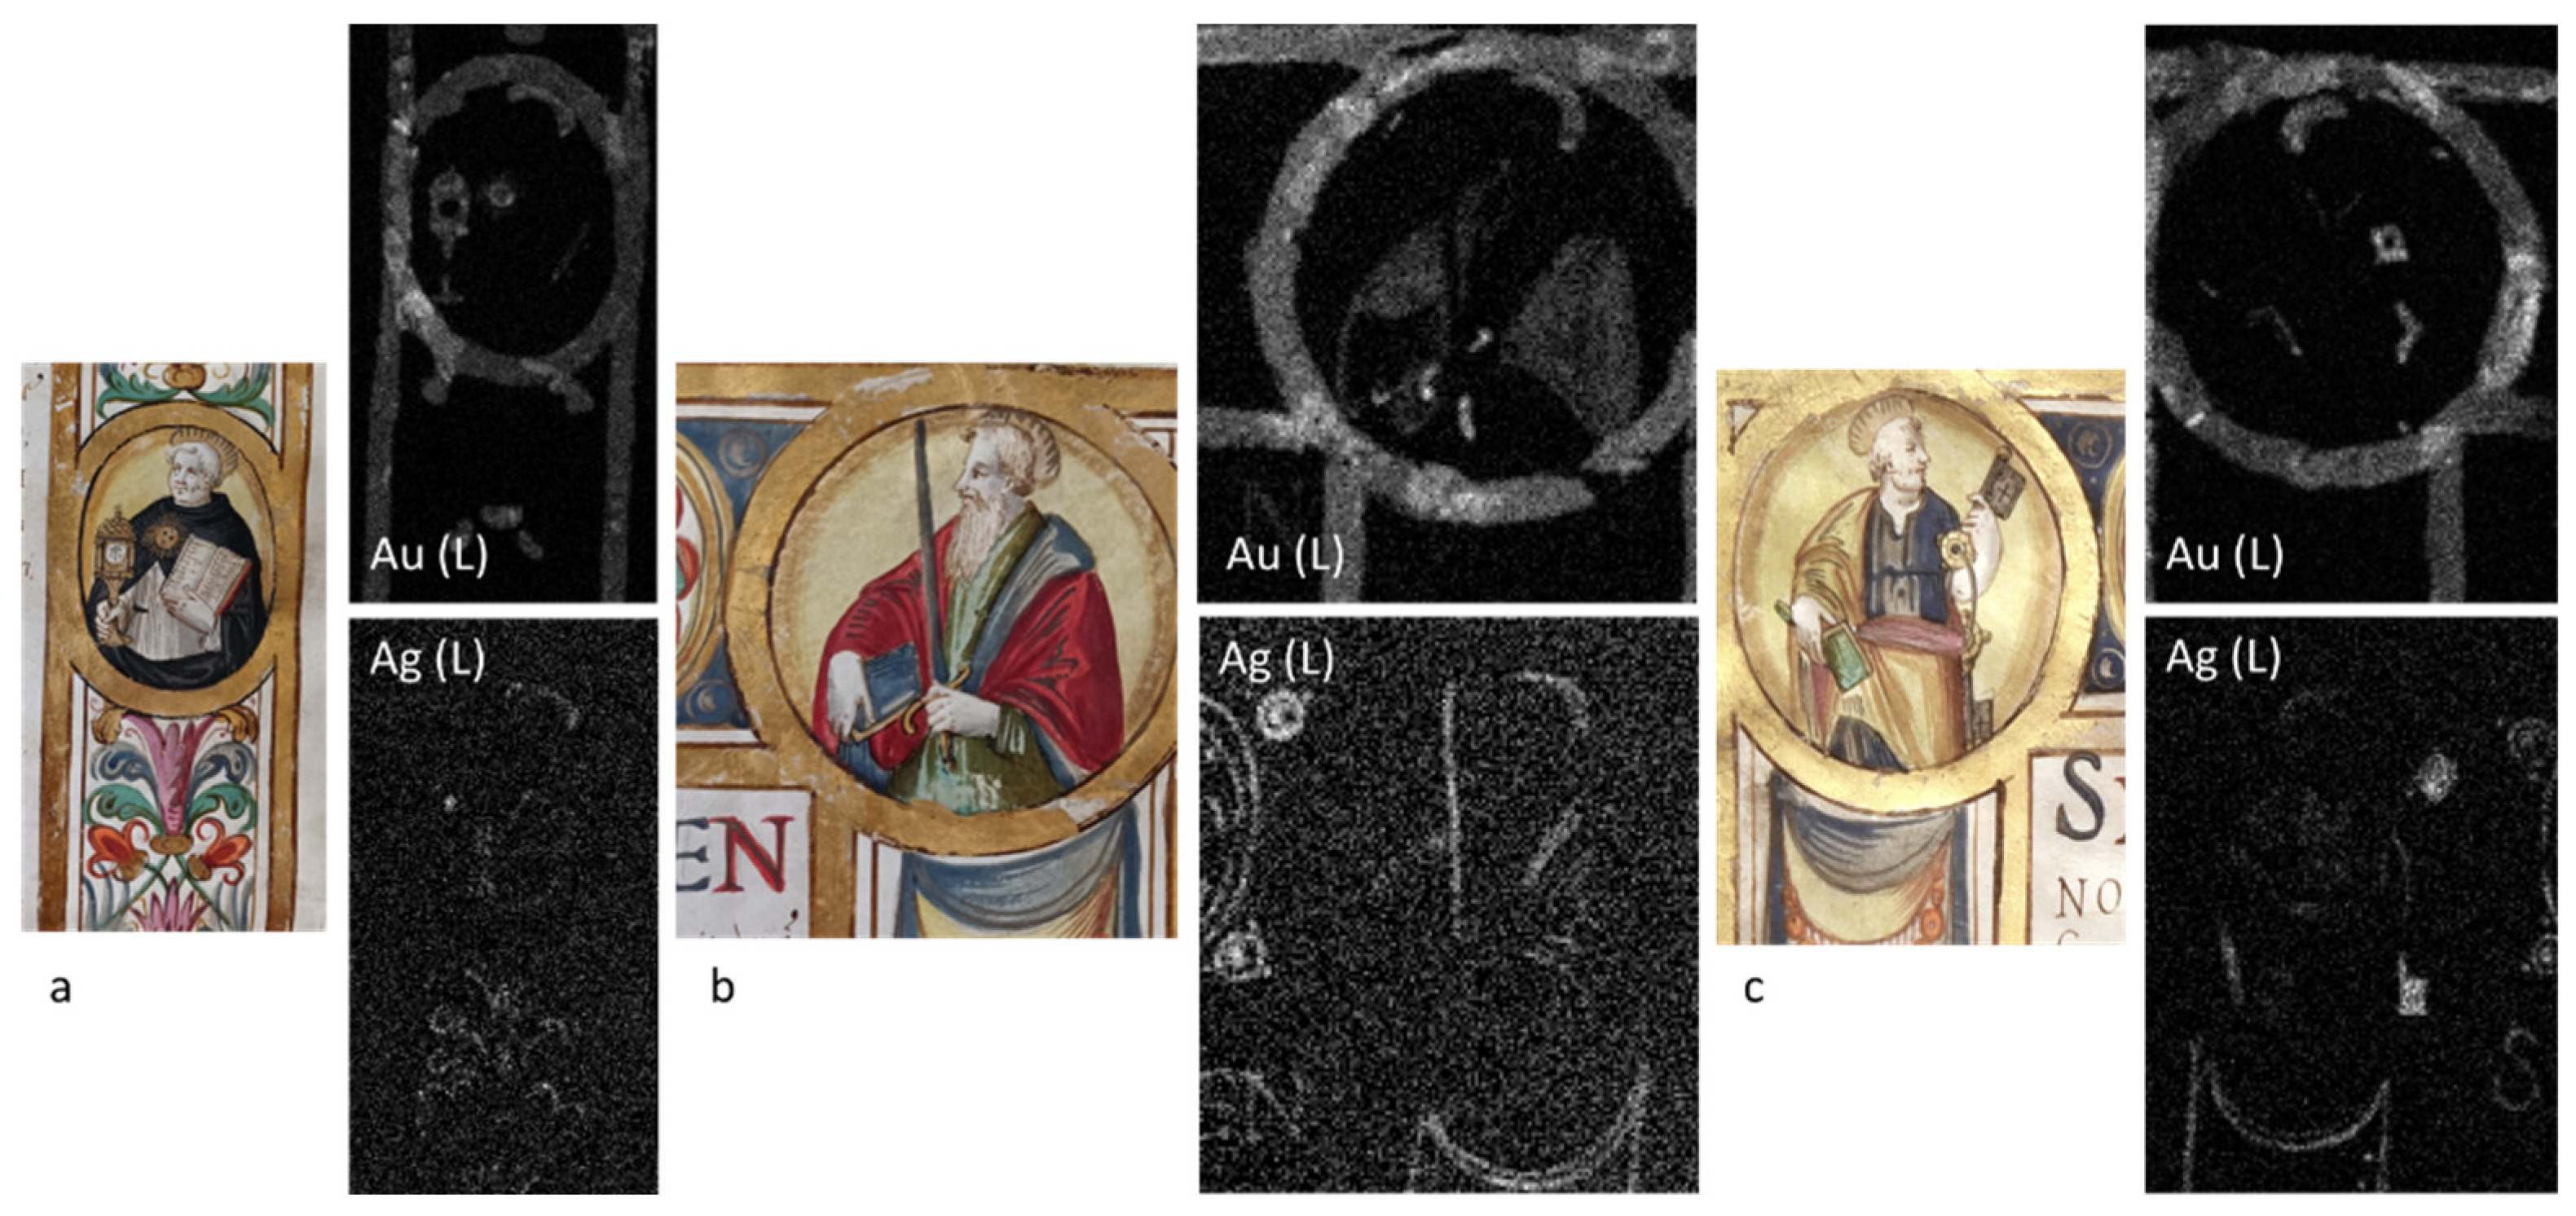
Figure 15.
Microscopical images of the gilding with two different magnifications (a, b). Microscopical images of the shell silver traits.
Figure 15.
Microscopical images of the gilding with two different magnifications (a, b). Microscopical images of the shell silver traits.
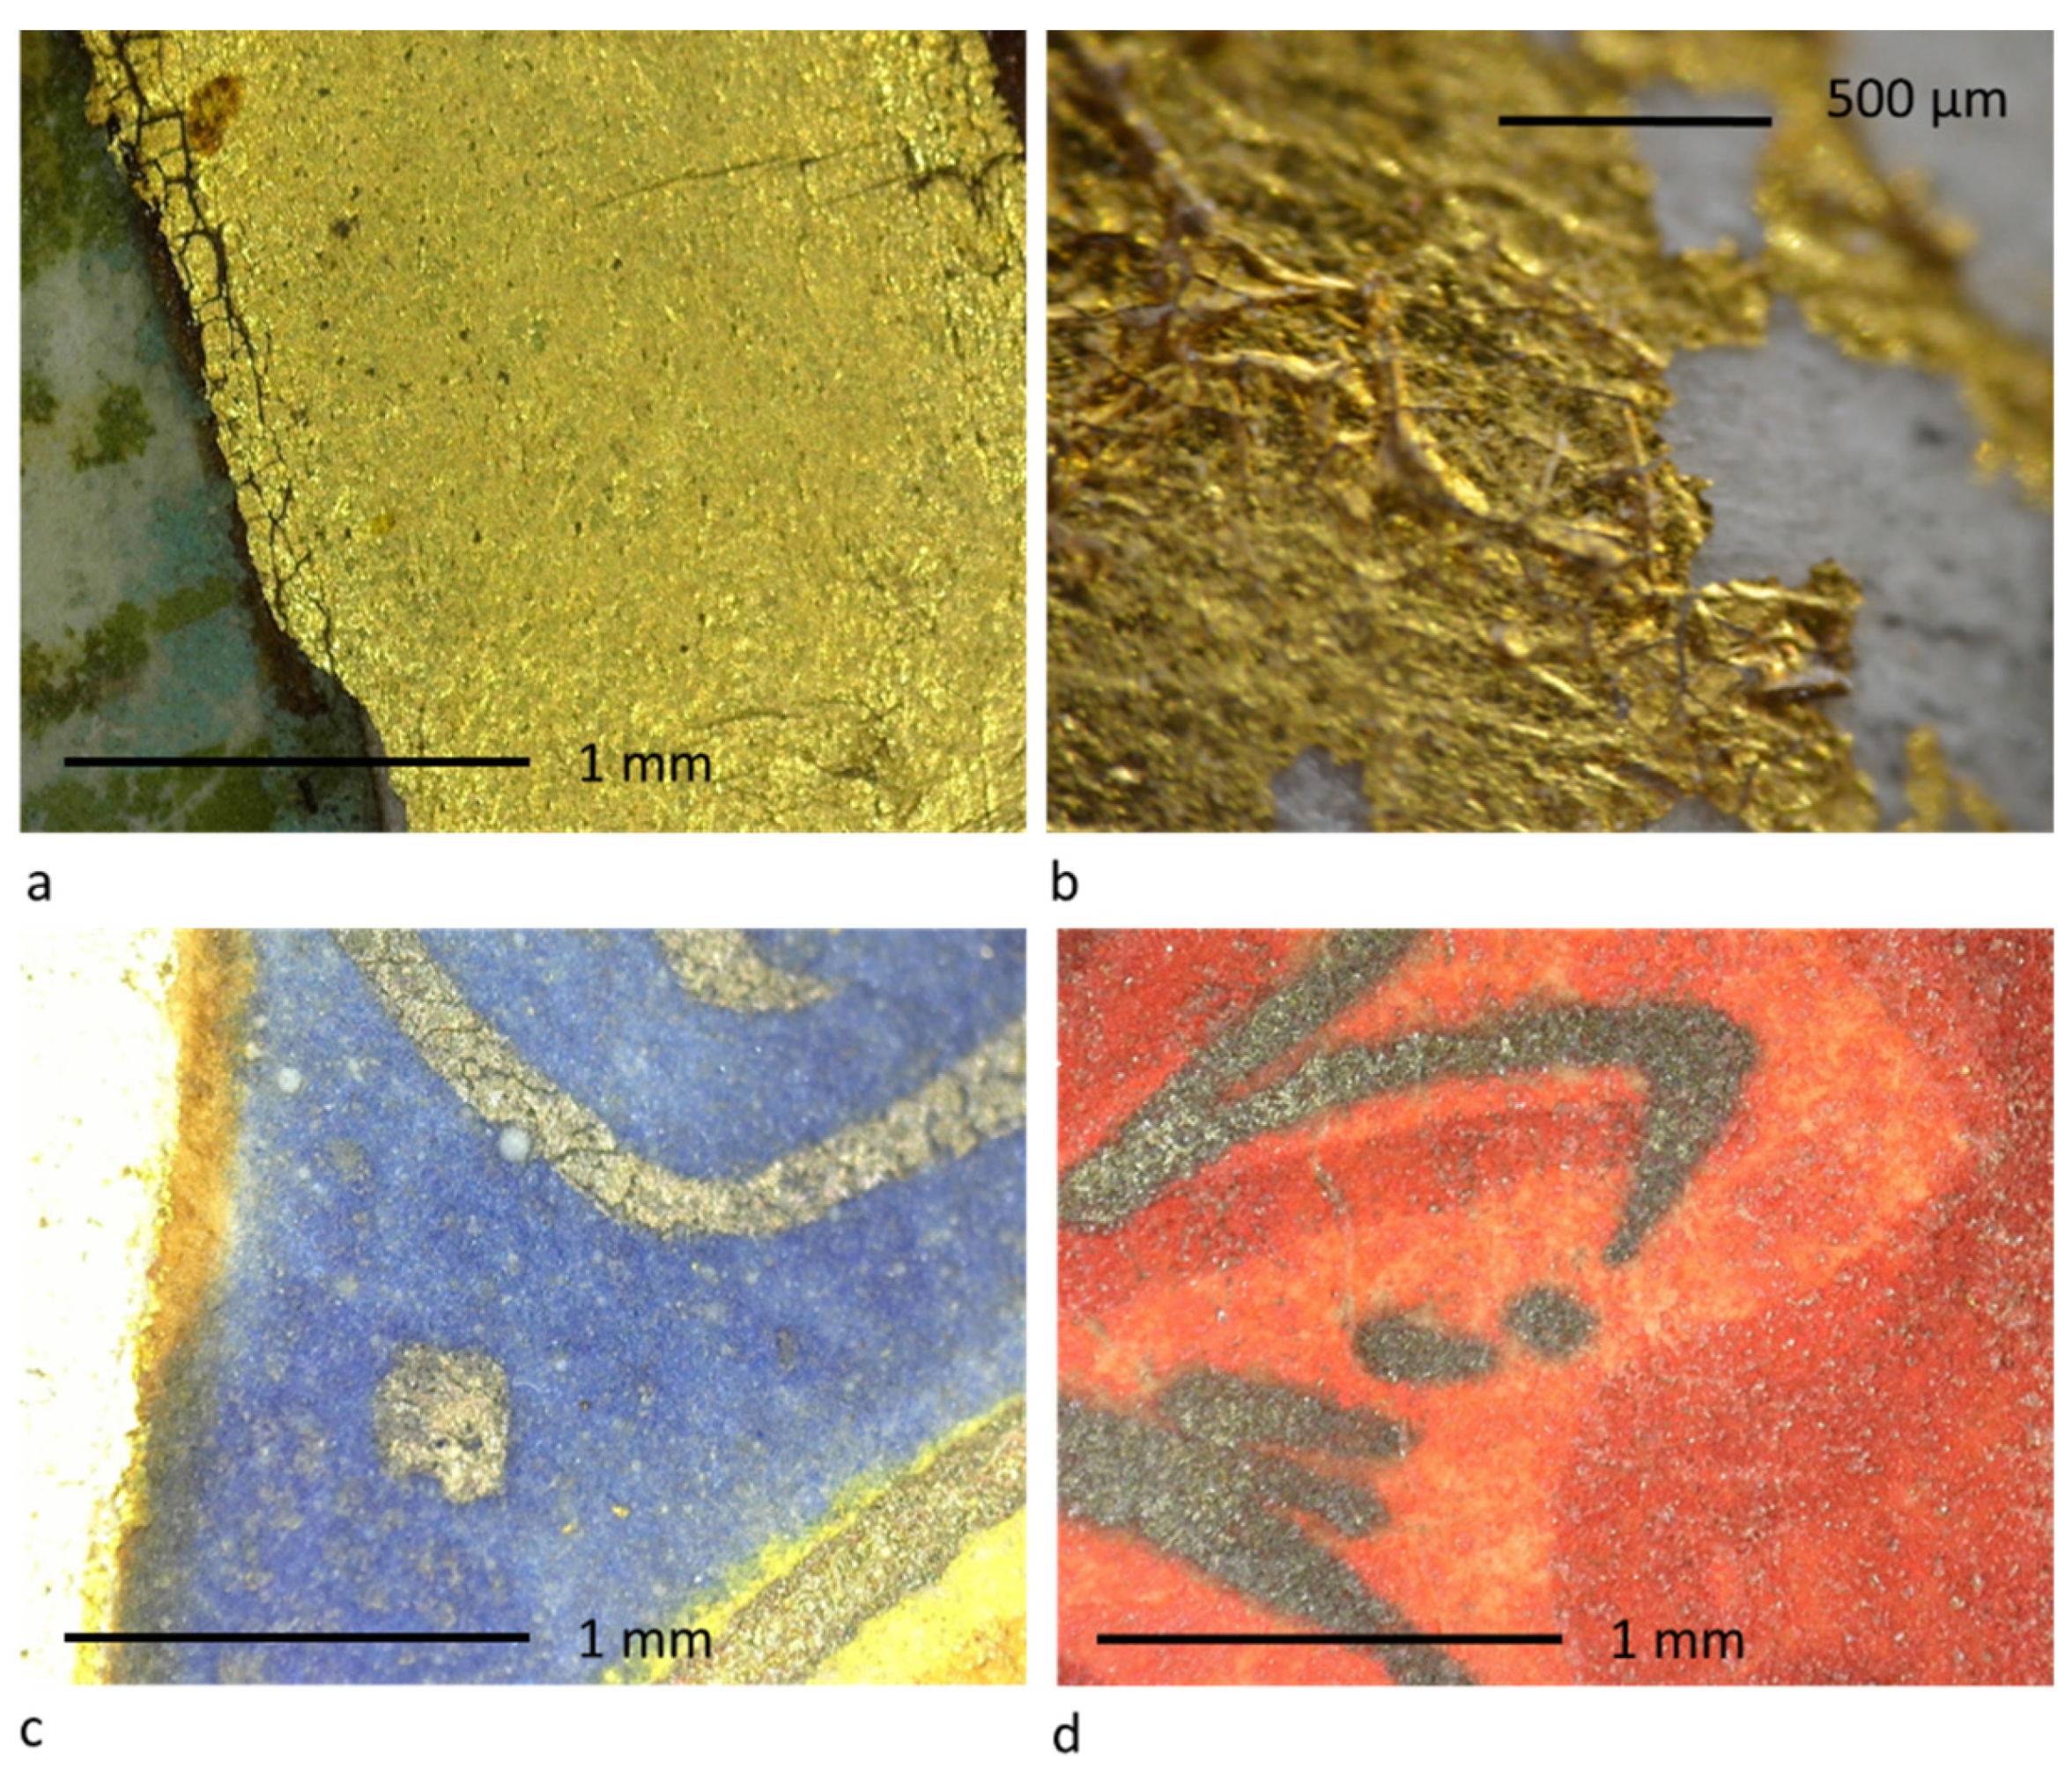
Figure 16.
Photographic (a) and IRR (c) images of the central section of the written part of the parchment, along with their respective magnified views (b, d). Photographic image of a detail (e), its XRF map of Fe Kα (f).
Figure 16.
Photographic (a) and IRR (c) images of the central section of the written part of the parchment, along with their respective magnified views (b, d). Photographic image of a detail (e), its XRF map of Fe Kα (f).
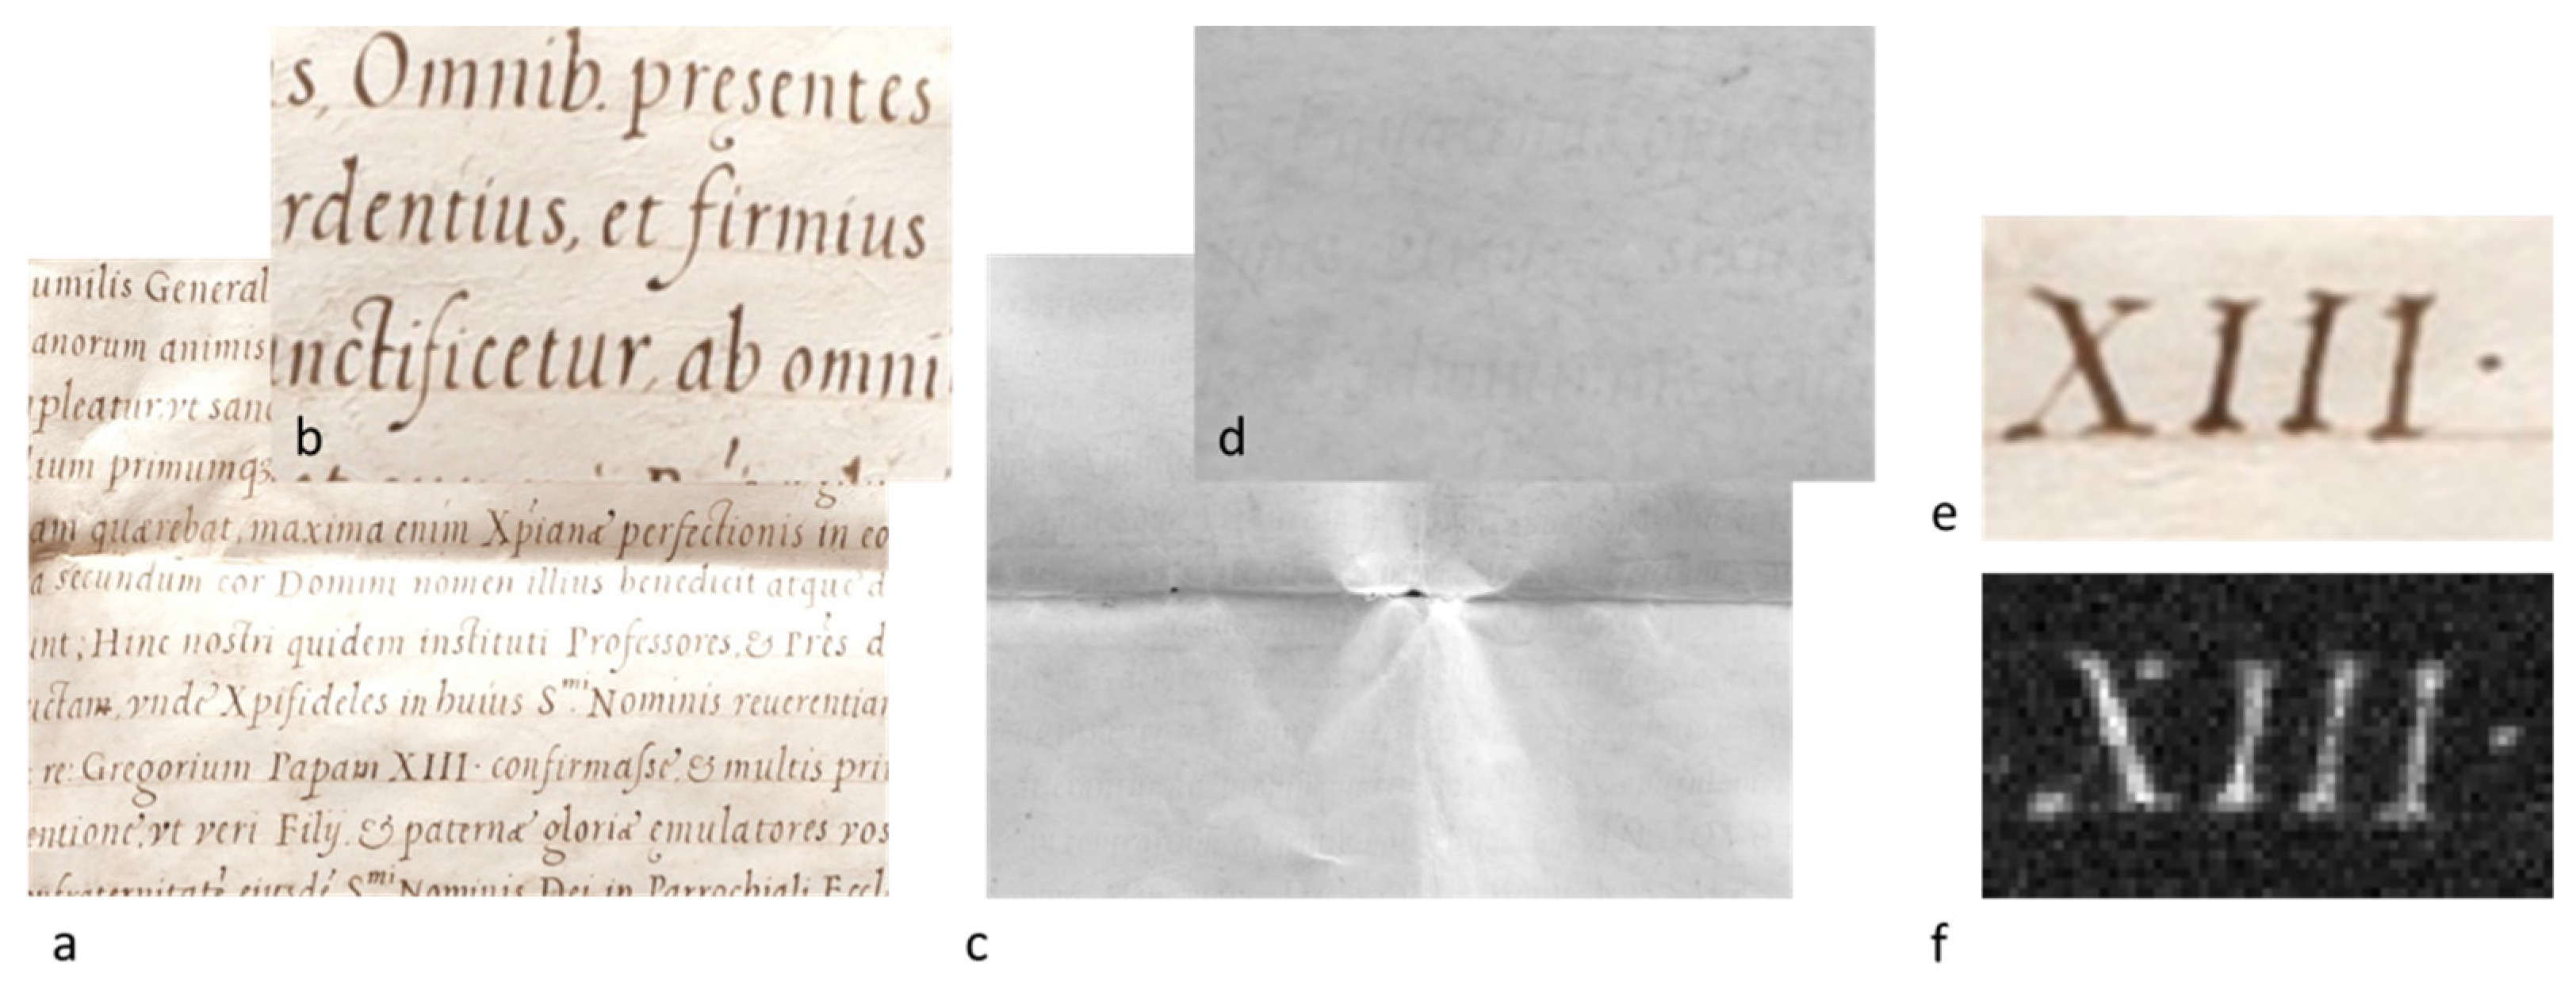
Figure 17.
Photographic image (a) and UV fluorescence image (b) of the sign. .
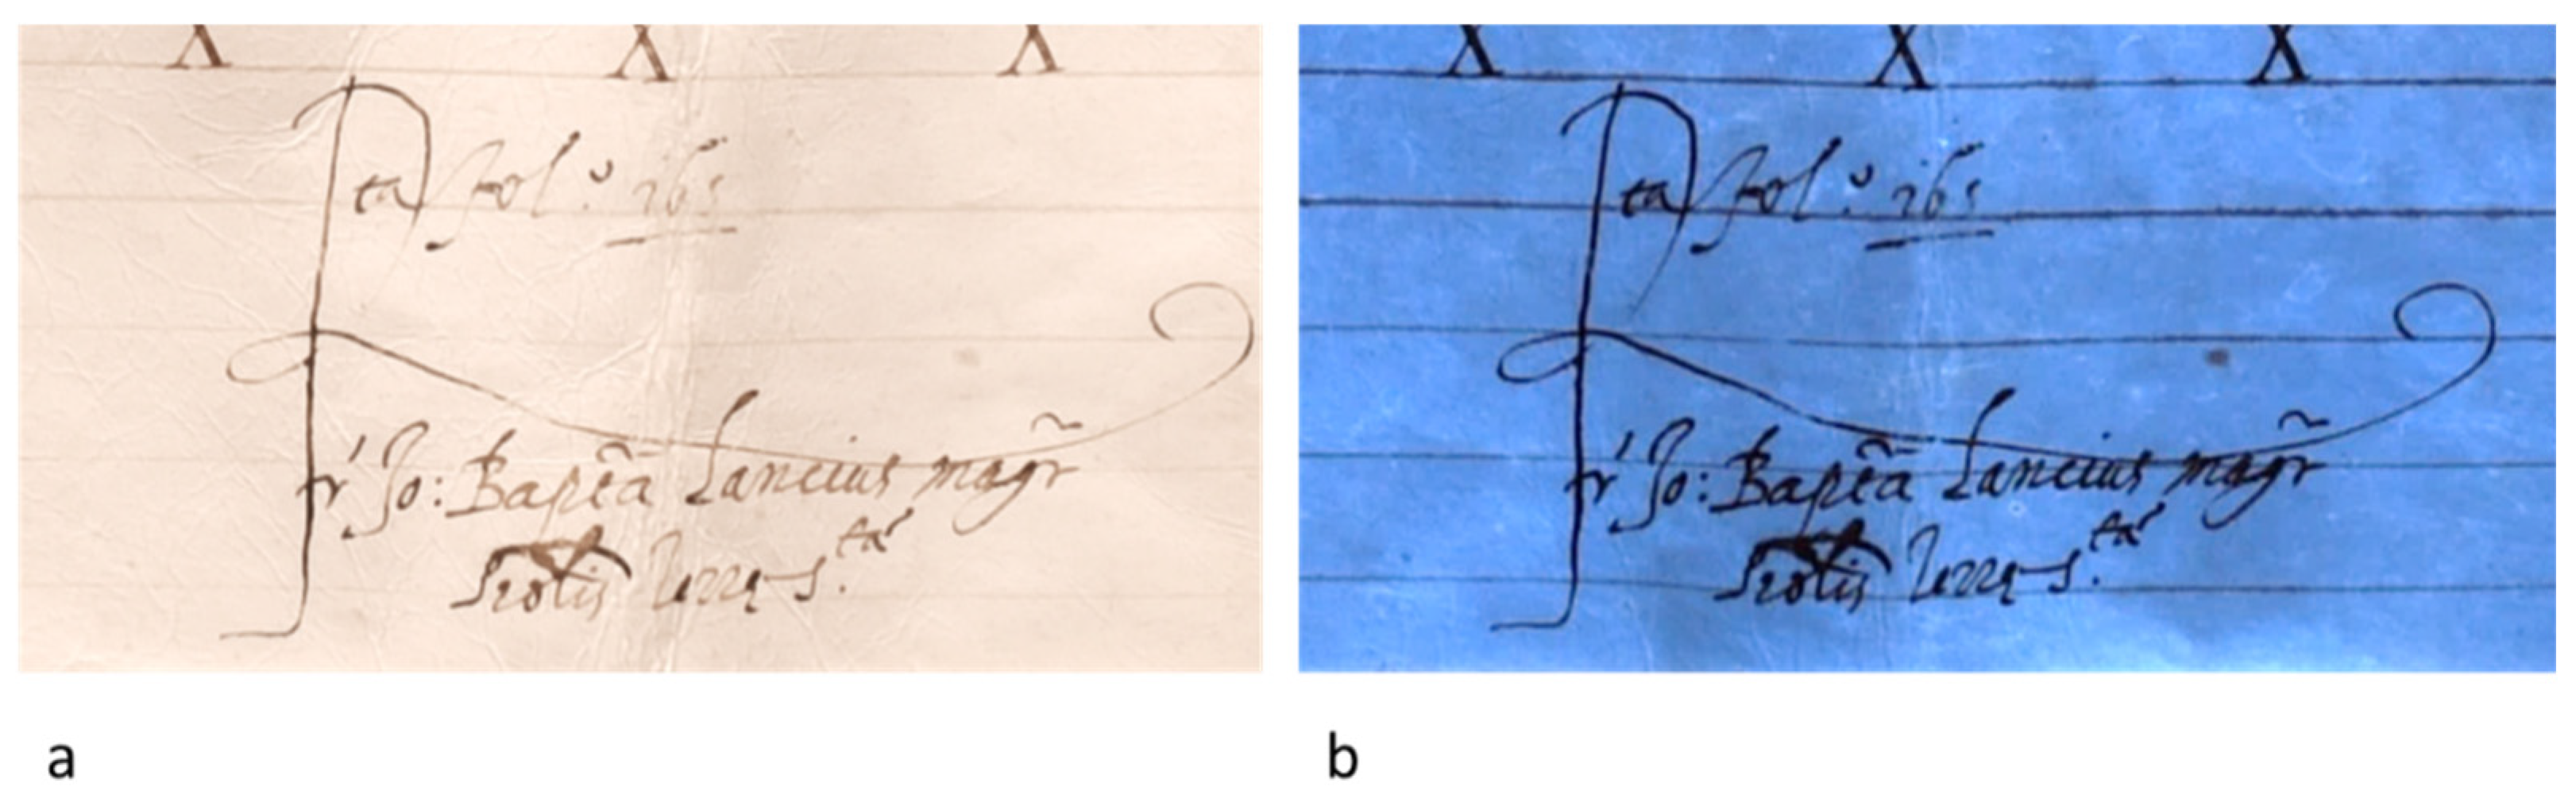
Figure 18.
RGB image (a) and chromatic similarity of the blue hues. The similarity map shown in (b) is obtained by selecting the white point in the image (a). The white pixels in (b) have high chromatic similarity, the black pixels have no similarity.
Figure 18.
RGB image (a) and chromatic similarity of the blue hues. The similarity map shown in (b) is obtained by selecting the white point in the image (a). The white pixels in (b) have high chromatic similarity, the black pixels have no similarity.
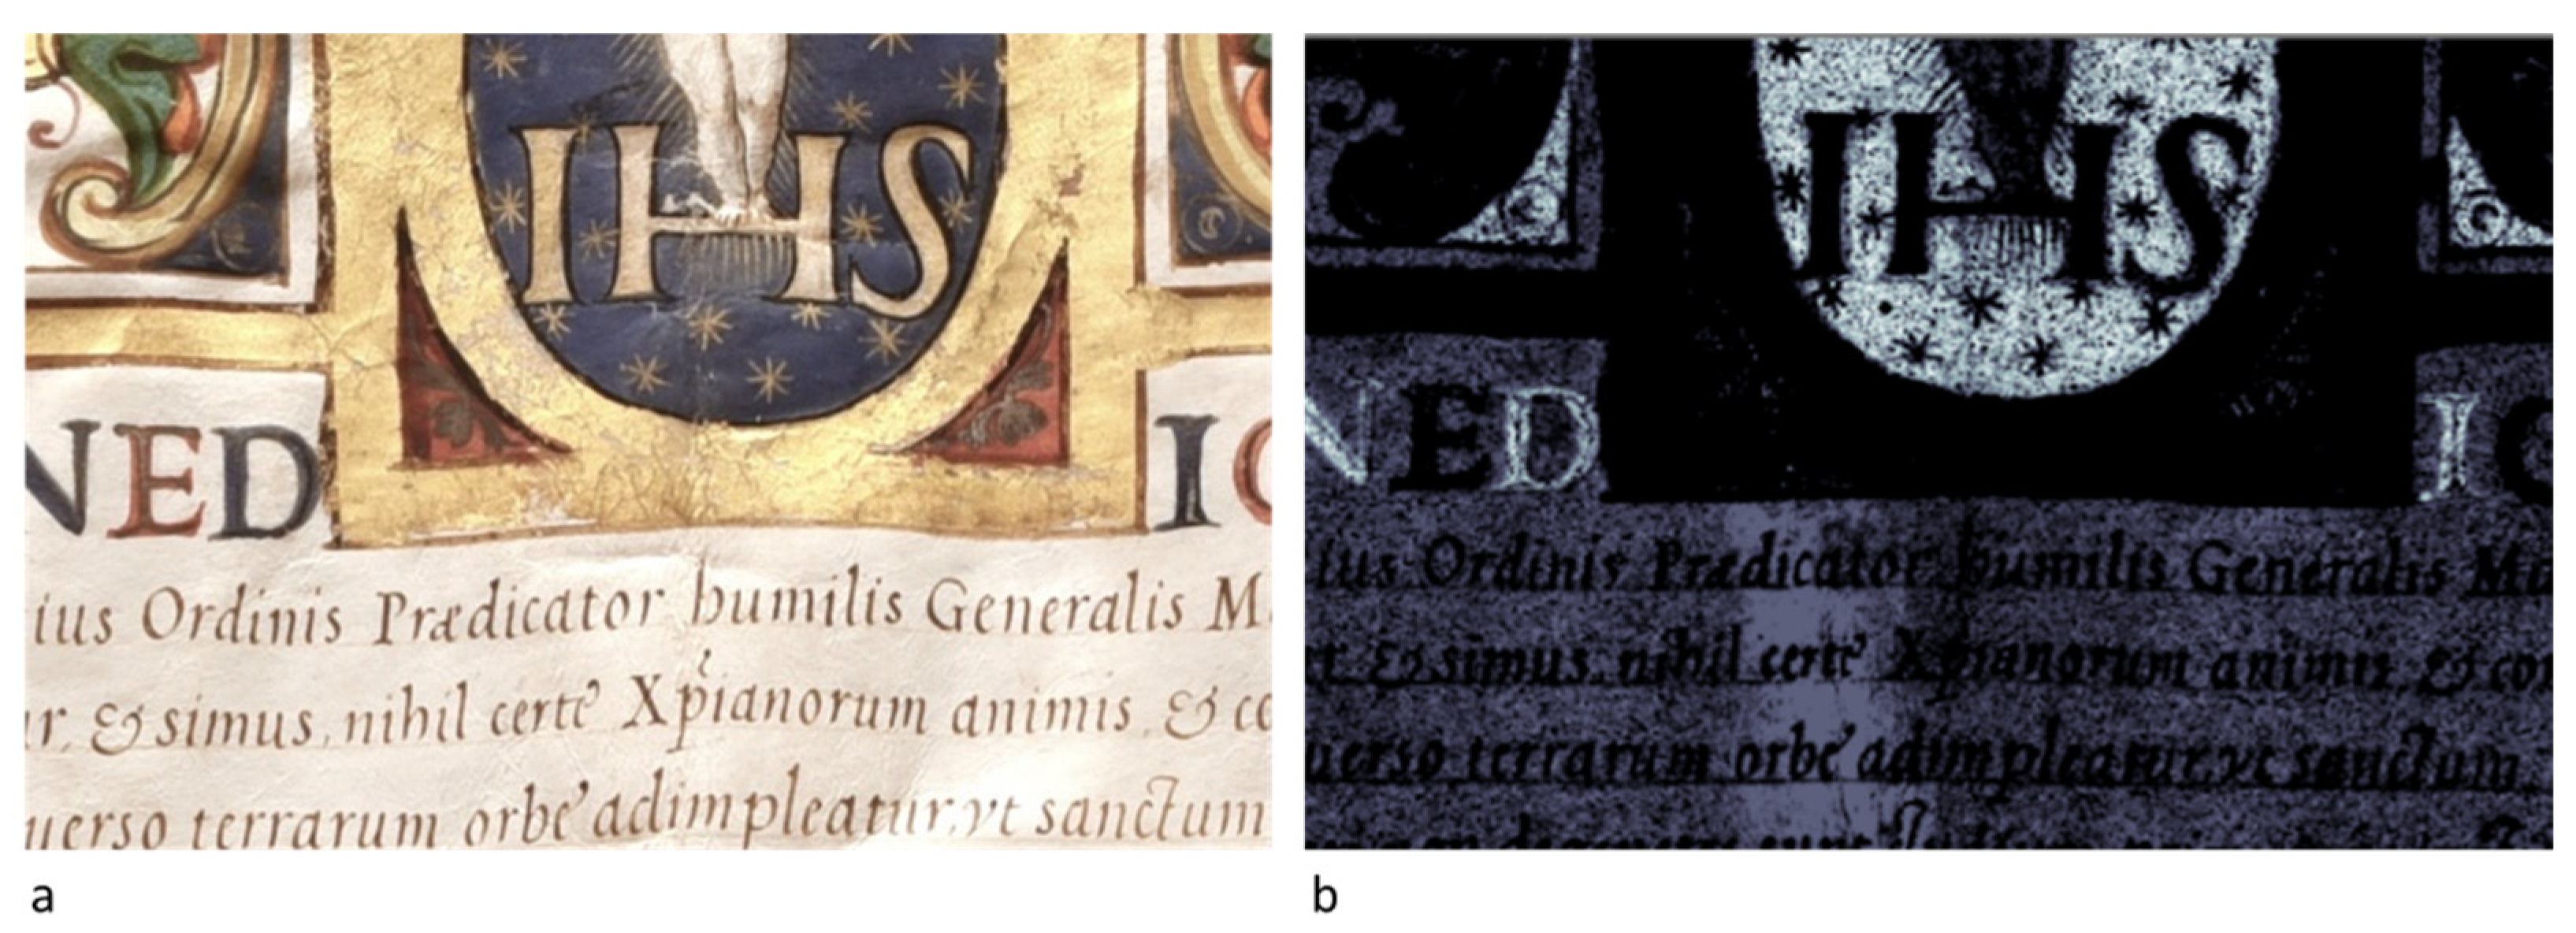
Figure 19.
Microscopical images of two capital letters (a, b).
Disclaimer/Publisher’s Note: The statements, opinions and data contained in all publications are solely those of the individual author(s) and contributor(s) and not of MDPI and/or the editor(s). MDPI and/or the editor(s) disclaim responsibility for any injury to people or property resulting from any ideas, methods, instructions or products referred to in the content. |
© 2025 by the authors. Licensee MDPI, Basel, Switzerland. This article is an open access article distributed under the terms and conditions of the Creative Commons Attribution (CC BY) license (http://creativecommons.org/licenses/by/4.0/).
Copyright: This open access article is published under a Creative Commons CC BY 4.0 license, which permit the free download, distribution, and reuse, provided that the author and preprint are cited in any reuse.


