Submitted:
21 March 2025
Posted:
25 March 2025
You are already at the latest version
Abstract
The water environment is a dynamic domain critical to global transportation and commerce, where seaplanes operate during take-offs, landings and ground operations, often near maritime traffic. Canada’s vast remote regions and unique geography increase reliance on seaplanes, espe-cially for private and recreational purposes. This article examines the intersection of aviation and maritime operations through a mixed-methods approach, analyzing seaplane safety on water-ways using quantitative and qualitative methods. First, data from 1,005 General Aviation (GA) seaplane accidents in Canada (1990–2022) is analyzed, revealing 179 fatalities, 401 injuries and 118 destroyed aircraft - significant given seaplanes comprise under 5% of GA aircraft. Of these, 50.35% occurred while the seaplane was not airborne. Second, insights from interviews, focus groups, and questionnaires involving 136 participants are explored through thematic and content analysis. These capture pilot concerns not evident in accident data, such as hazards from jet ski interactions and disruptive boat wakes. The findings highlight risks like limited visibility and maneuverability during waterborne take-offs, worsened by seaplanes’ lack of priority over mari-time vessels in shared spaces. This article concludes with recommendations for both the seaplane and maritime communities, including increasing awareness among boaters about the presence and operations of seaplanes and regulatory adjustments particularly considering the right of way.
Keywords:
seaplane
; safety
; take-off
; landing
; collision
; water operations
; maritime safety
; aviation safety
1. Introduction
Hazards, whether natural or human-made, present potential threats to individuals, equipment, and operations [1]. Reducing these and mitigating associated risks are essential objectives in transportation safety to protect lives, goods, and the environment. However, systematic hazard analysis is often constrained by reporting limitations, as incidents that do not result in significant damage or harm may go unreported. Public accident databases frequently lack critical contextual details, such as environmental factors or pilot decision-making processes, leading to incomplete insights. A comprehensive safety analysis must, therefore, go beyond traditional accident data to incorporate both qualitative and quantitative methods.
The maritime industry is considered the most complex and dangerous worldwide [2,3]. Canada is a nation that boasts a rich maritime heritage and vast coastal regions, with major ports such as Vancouver, Halifax, and Montreal playing critical roles in international trade and commerce. Maritime safety is crucial due to its role in providing a protective refuge for vessels, facilitating the transfer of people and goods, promoting trade and economic growth, and serving as significant sources of employment. In particular, ports represent dynamic environments with a complex set of safety challenges.
Canada is also a global leader in seaplane operations. These operate at the intersection of aviation and maritime environments, requiring pilots to navigate risks associated with both sectors. Canada, with its vast and rugged geography, is a global leader in seaplane operations, supporting both commercial and recreational activities. While commercial seaplane operations are subject to stringent regulatory oversight, private and recreational seaplane pilots often operate under more relaxed regulatory frameworks, increasing exposure to safety risks. Unlike land-based aircraft, seaplanes must contend with additional hazards, such as water conditions, limited maneuverability and interactions with maritime traffic. The dual nature of seaplane operations further complicates safety management, as regulatory distinctions exist between aircraft and vessels.
Seaplanes are generally defined as aircraft that can take off and land on water. The International Civil Aviation Organization (ICAO) defines a seaplane as “An airplane on floats (amphibious or non-amphibious) or a flying boat (water-only or amphibious)” [4]. There are two main categories of seaplanes in use in Canada:
- i)
- floatplanes – these have floats but no wheels, and
- ii)
- Amphibious - which are planes that have floats and retractable wheels, so they have the capability to land and take-off from both the land and the water.
In addition, according to the 1972 International Regulations for Preventing Collisions at Sea (COLREGs), a seaplane is regarded as a vessel when it is on the water, whether it is landing, anchored, or being launched from a water slide. However, when the seaplane is out of the water, it is treated as an aircraft [5].
Research relating to the safety of ships and seaplanes sharing the water environment is scarce, but there are a few studies that mention both. These have revealed several key areas of concern and methodological approaches. Gao [6] conducted an extensive risk analysis of seaplane operations in Sanya Port in China, comparing the maritime traffic environment of seaplanes to that of other vessels, and emphasizing unique safety challenges. Similarly, Vidan et al. [7] explored the operational and environmental safety of seaplane traffic in Croatia, noting differences in waste management between seaplanes and traditional vessels. These studies emphasize the need for customized safety protocols that consider the specific dynamics of seaplanes on water.
In complex socio-technical systems, the safety issues of smaller communities within a transport sector can often be overlooked. General safety measures designed for larger communities or transport sectors, outlined in safety management systems (SMS), may be ineffective for those which are smaller, requiring tailored safety strategies to address their unique challenges. For example, seaplane operations are part of both the aviation and maritime sectors and require specific safety measures due to their dual operational environments. Additionally, safety in commercial operations is more thoroughly addressed due to greater scrutiny and regulations needed to protect larger passenger and cargo volumes. In contrast, private operations often fall under less rigorous regulatory frameworks, with fewer mandatory safety measures and oversight, leading to gaps in comprehensive safety standards. Consequently, private pilots may be indirectly affected by factors less prevalent in commercial aviation, such as less rigorous training and infrequent flying. Given the unique risks associated with recreational seaplane flying, such as varying pilot experience and diverse operating environments, a thorough sector-specific analysis is imperative. Analysing subsets of occurrences is crucial to understand and address specific challenges for underrepresented communities in a transport sector. This approach aids in identifying specific safety issues and formulating targeted recommendations to enhance overall safety in complex transport systems.
In summary, the water environment is a complex and dynamic place where two transport sectors intersect. Even though the literature including both seaplanes and vessels is very limited, it remains important to study the interactions of these sectors and mitigate their specific risks. Both the maritime and aviation sectors benefit from tailored SMSs that incorporate both human factors and risk assessment methodologies. Therefore, this paper aims to address the above limitations by employing a mixed-method approach of qualitative and quantitative analysis of seaplane safety on water. A holistic understanding of seaplane safety is sought not only through data collection and analysis, but also through understanding the importance of minor incidents or near-misses and their reporting, the knowledge and expertise of different stakeholders and industry professionals, and finally assessing how organizational aspects come into play and share safety knowledge.
2. Materials and Methods
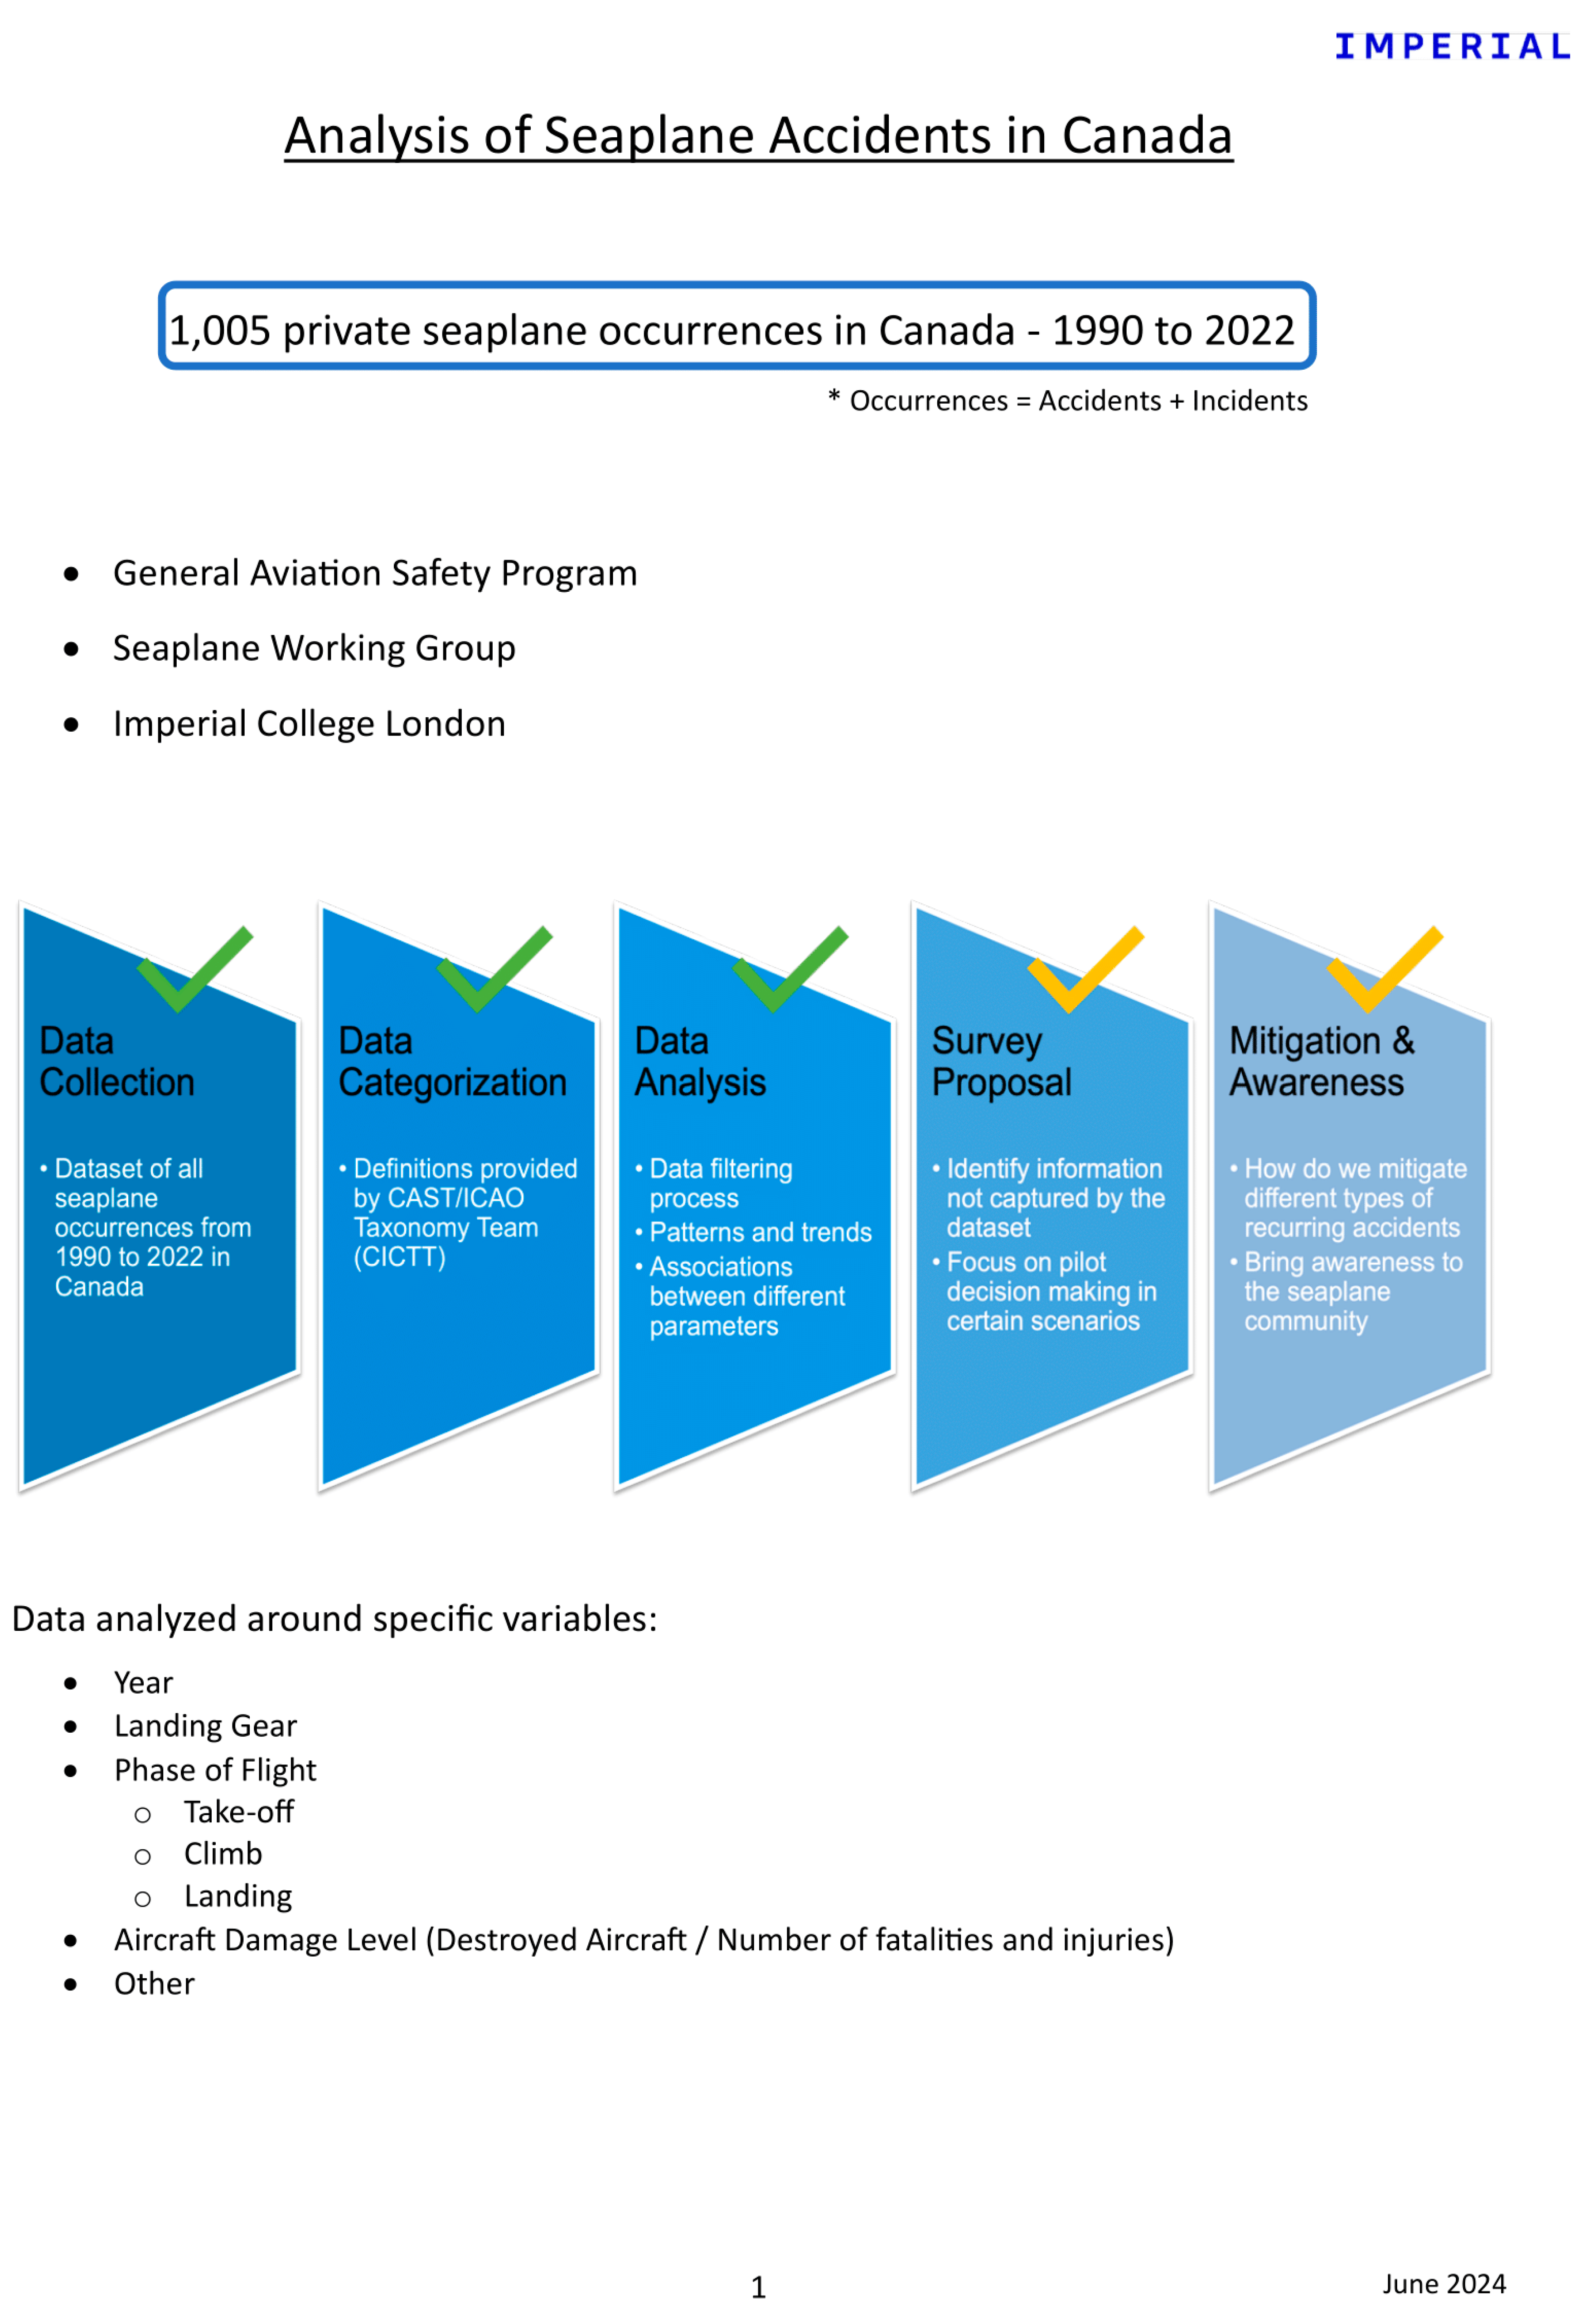
This section outlines the methodology used to analyze the safety of private, recreational seaplane operations in Canada, as shown in Figure 1. It includes details of the occurrence (accident/incident) database (Section 2.1), data categorization (Section 2.2), data analysis (Section 2.3) and survey proposal (Section 2.4).
Firstly, as this paper considers only occurrences of seaplanes on the water, it is important to correctly categorize the phase of flight when an accident or incident occurs. For this purpose, Goblet et al. [8] provide a comprehensive list of possible safety events during each phase of flight and develop an algorithm to detect the phase of flight. However, these phases of flight are for commercial operations and we make changes below to reflect the phases of flight for General Aviation (GA) operations. It should be noted that, for seaplanes, a runway can also be on a body of water.
The phases of flight where an occurrence can happen for GA seaplane operations have been separated into 14 categories, presented in Table 1. This is based on adaptation of the CAST/ICAO Common Taxonomy Team (CICTT) [9] definitions of phases of flight, so as to reflect the phase categories used by the regulator, Transport Canada, for its occurrence reports and for GA.
Figure 2 has been created to account for 10 out of the 14 phases of flight. It does not include Maneuvering, En Route, Post-Impact and Unknown.
2.1. Description of the Database of Seaplane Occurrences in Canada
Transport Canada (TC), the safety regulator, has collated a database that consists of 1,771 seaplane occurrences (accidents and incidents) in Canada, from 1990 to 2022. In this database, there are 466 occurrences on water involving private, recreational operations, during the following phases of flight: standing, taxi, take-off, landing, landing run (roll out) and docking (including parked).
While TC provided a comprehensive data set, certain data fields had to be derived from the narratives, such as the cause of the occurrence (categorization), number of injuries and fatalities and route. The data fields include general information (e.g., date, time, phase of flight), details of the surrounding environment (e.g., route, location), aircraft specifications (e.g., damage level, tonnage, landing gear) and environmental conditions (e.g., weather).
Details of individuals affected (e.g., gender, age, injuries) were unavailable, as well as any details about the pilot’s performance. Complementary data collection methods such as interviews, focus groups, and decision-making studies e.g. those by Irwi et al. [10] are considered in this paper. The underreporting of incidents either due to minimal reporting requirements or fear of repercussions further limits dataset accuracy, potentially skewing risk assessments. Comprehensive reporting and interdisciplinary approaches are essential therefore to address these limitations, ensuring a holistic understanding of seaplane safety and enabling meaningful recommendations for mitigating risks in shared waterways.
2.2. Categorisation of Seaplane Occurrences
Hazards which can lead to an occurrence are categorized using the Hazards Common taxonomy [11], according to their type as: Human, Technical, Environmental and Organizational. Aviation occurrences are categorized using the Aviation Occurrence Categories from the Commercial Aviation Safety Team (CAST) and the International Civil Aviation Organization (ICAO), as of May 2021 [12], according to their contributory factor(s). These categories are grouped into the following: Take-off and landing, Airborne, Ground operations, Aircraft, Non-aircraft-related, Weather and Miscellaneous [12]. The categorization is not part of the recorded data fields of reported accidents or incidents, and it is determined separately only for the few occurrences that require deeper investigation and have a published Canadian Transport Safety Board (TSB) report.
2.3. Analysis of Past Seaplane Occurrences on Canadian Waters
Descriptive statistics, frequency analysis and distributions were used to analyze trends of seaplane occurrences on Canadian waters. The TC dataset contains the following types of data:
- Continuous (e.g. number of injured people);
- Categorical (e.g. phase of flight);
- Textual (e.g. accident description).
Both continuous and categorical data were tested for normality using the Kolmogorov-Smirnov (sample>50) and the Shapiro-Wilk tests (sample<50) [13]. Non-parametric statistical tests, such as Pearson’s Chi Square test (χ2), were applied for non-normally distributed data. For categorical variables, the Pearson’s Chi Square test (χ2) was used to compare the actual frequencies with the corresponding expected frequencies in the categories of the variables [13]. The χ2 statistic is calculated using Equation (1):
where the expected frequency refers to the expected count if there was no association between parameters, while the observed frequency is obtained from the dataset. Moreover, the data fields are adjusted such that the expected frequencies less than five are under 20% [14]. Otherwise, it is considered that there is not enough data to test the association.
The p-value indicates the statistical significance of the association, with lower p-values, meaning stronger evidence against the null hypothesis, for statistically significant relationships. The significance was set at p<0.05 for the statistical test, meaning a 95% confidence level. Consequently, the phi-value was used as a measure of the strength of the association, with higher phi-values indicating stronger relationships. Based on this, the strength of the relationship is determined (weak, moderate or strong). Table 2 shows the interpretation of the phi-values.
2.4. Survey
While the analysis of accident and incident data is crucial for improving safety and ensuring accident prevention in the future, there are though certain limitations that hinder a comprehensive understanding of all underlying safety factors. There are gaps in the available data which have been mentioned previously, especially related to the people involved in the occurrence, such as decision-making, concerns, and other contributory factors that can influence safety outcomes. Hence, additional data was collected to complement the insights from accident and incident data analysis, by means of a survey, that engaged with pilots and other safety professionals in the field.
This survey encompassed a wide range of scenarios that encourage pilots to consider critically their actions in different conditions, while bringing awareness regarding current safety issues. These scenarios are around the most frequent occurrence categories and phases of flight when accidents occur. The methods used to gather qualitative data from recreational, private GA pilots in Canada are: semi-structured interviews, phenomenological focus groups and a phenomenological questionnaire. Thematic and content analysis are employed to identify key safety issues and develop an in-depth understanding of the processes and interactions affecting GA seaplane safety. The data is coded and analyzed iteratively, enabling themes to emerge naturally from the data. This approach ensures a comprehensive understanding of the participants' perspectives and experiences.
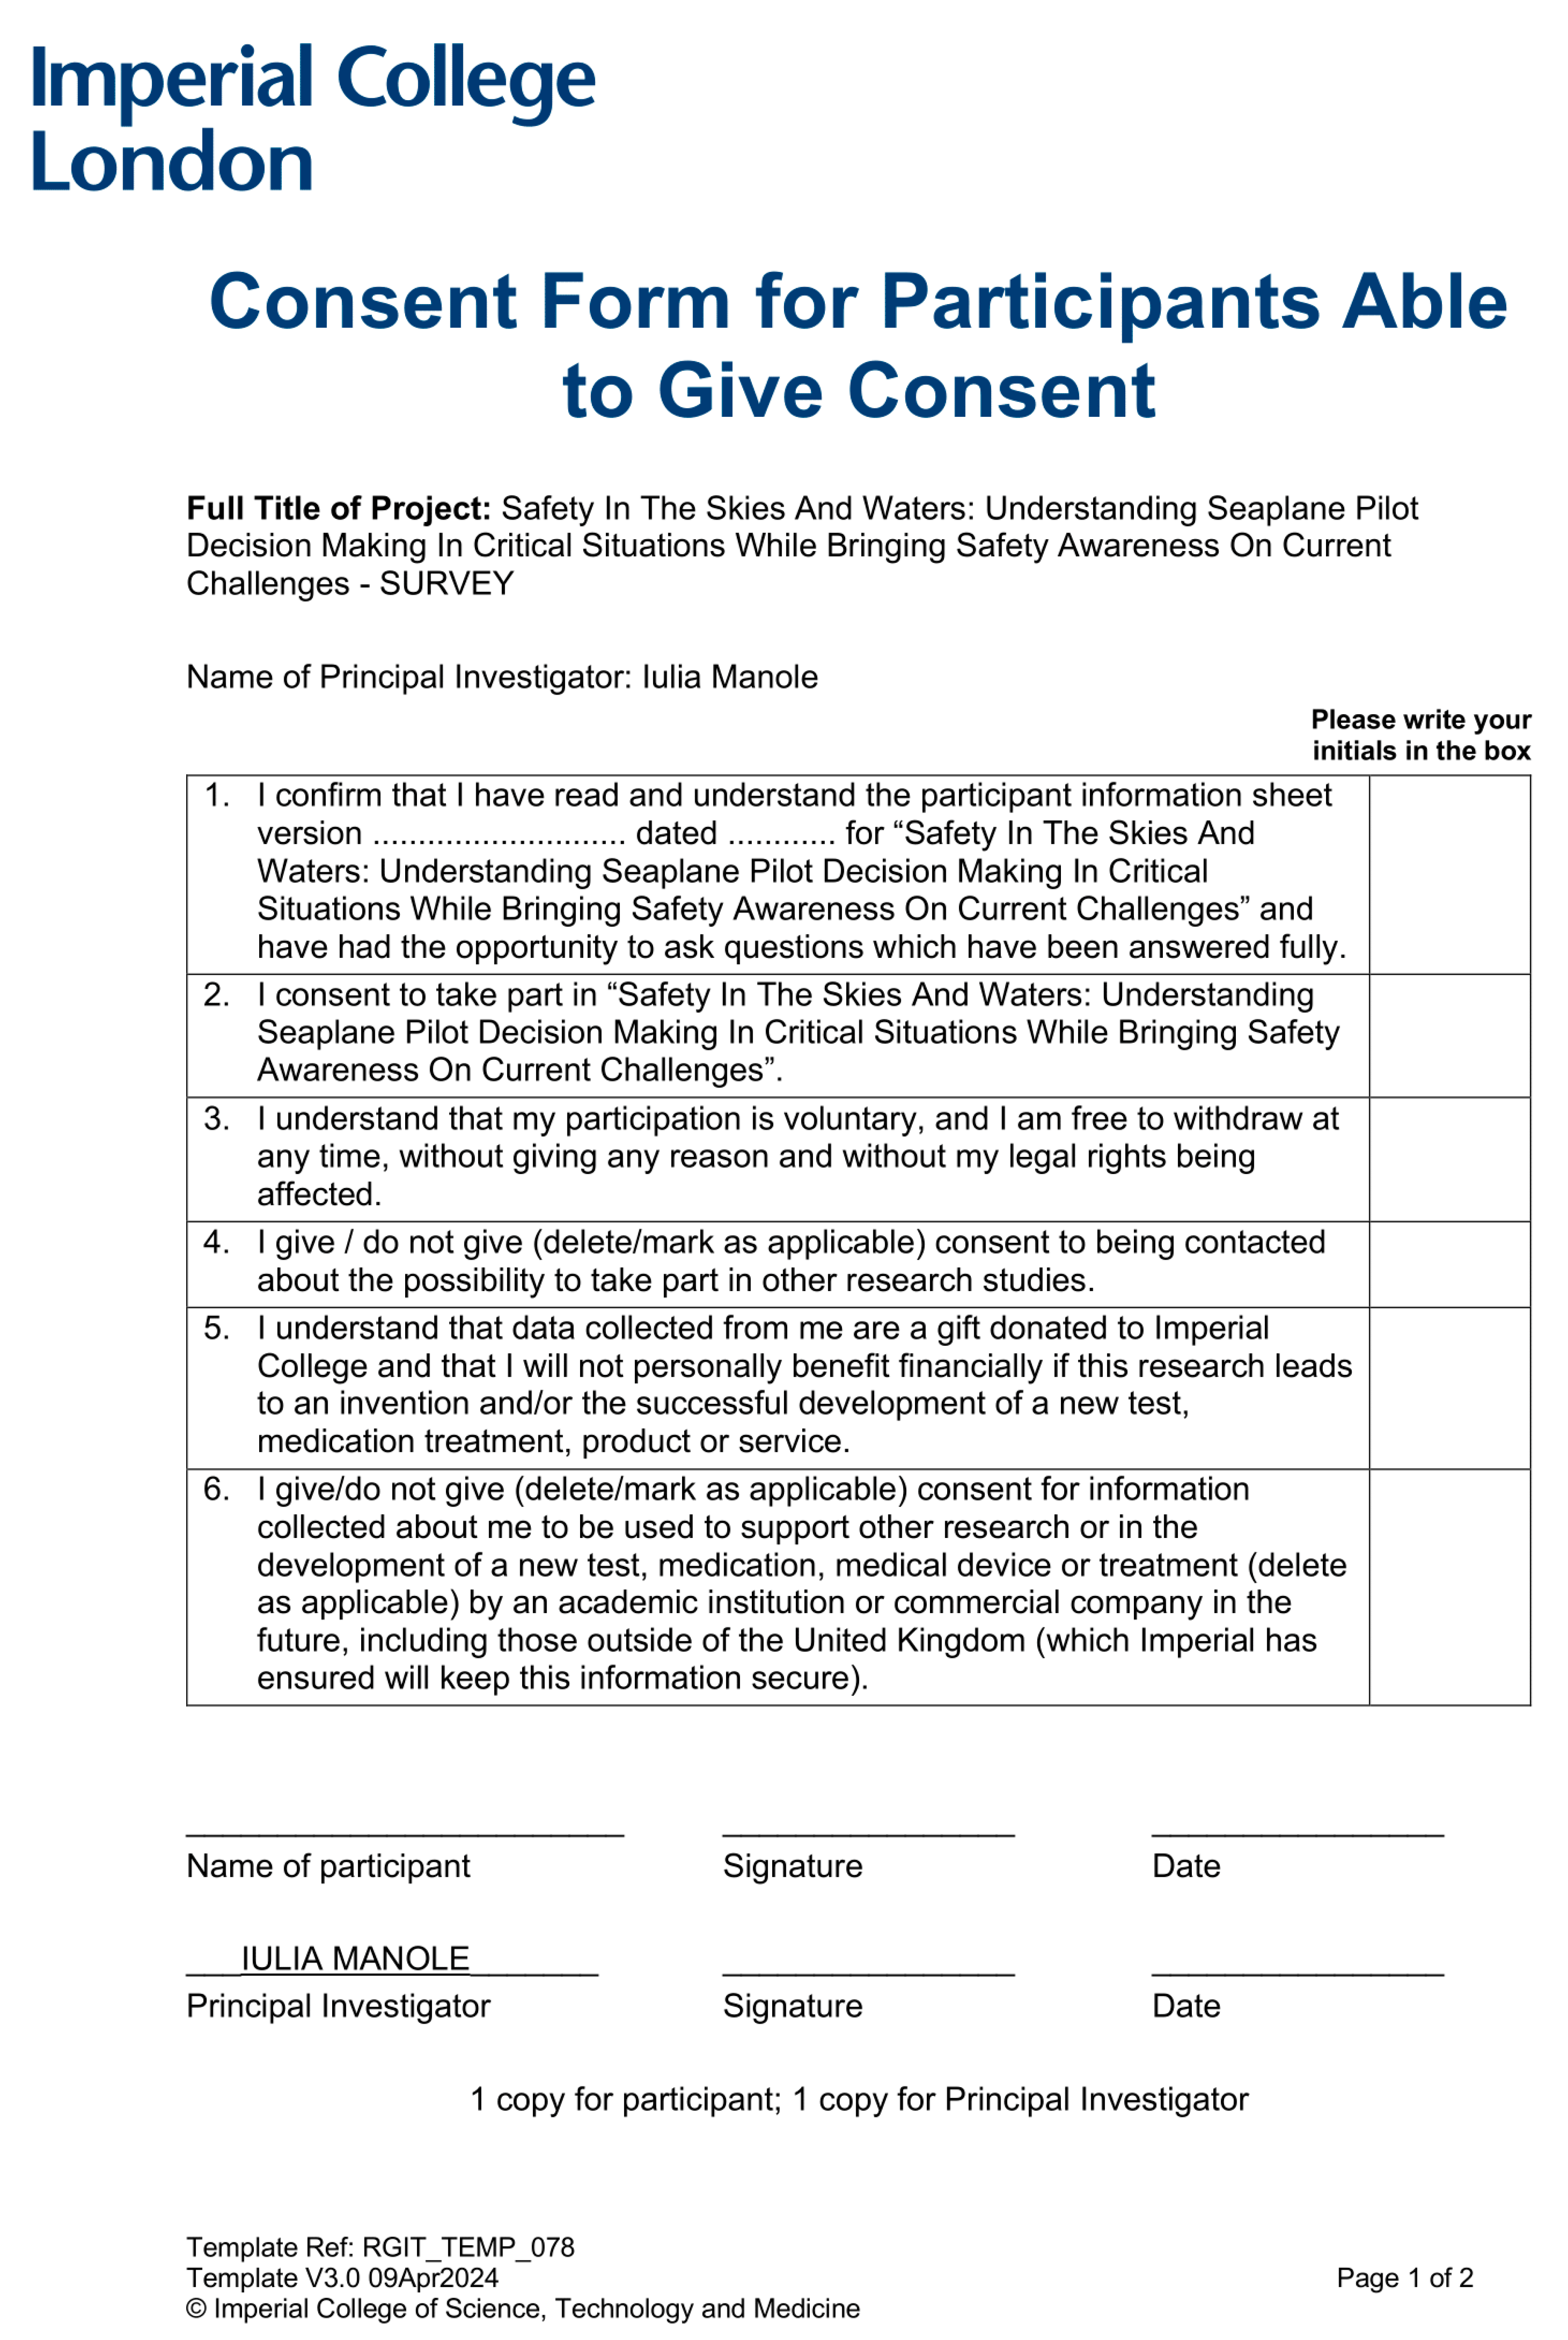
The confidentiality of participants taking part in the study has been preserved, and the transparency requirements under the General Data Protection Regulation for health and care research were fulfilled. Additionally, approval from the Research Governance and Integrity Team (RGIT) has been obtained for this survey. The documents approved by the Imperial College ethics committee are attached in Appendix A. This study has been conducted in compliance with the protocol, Data Protection Act 2018 and General Data Protection Regulations (Europe) and other regulatory requirements as appropriate.
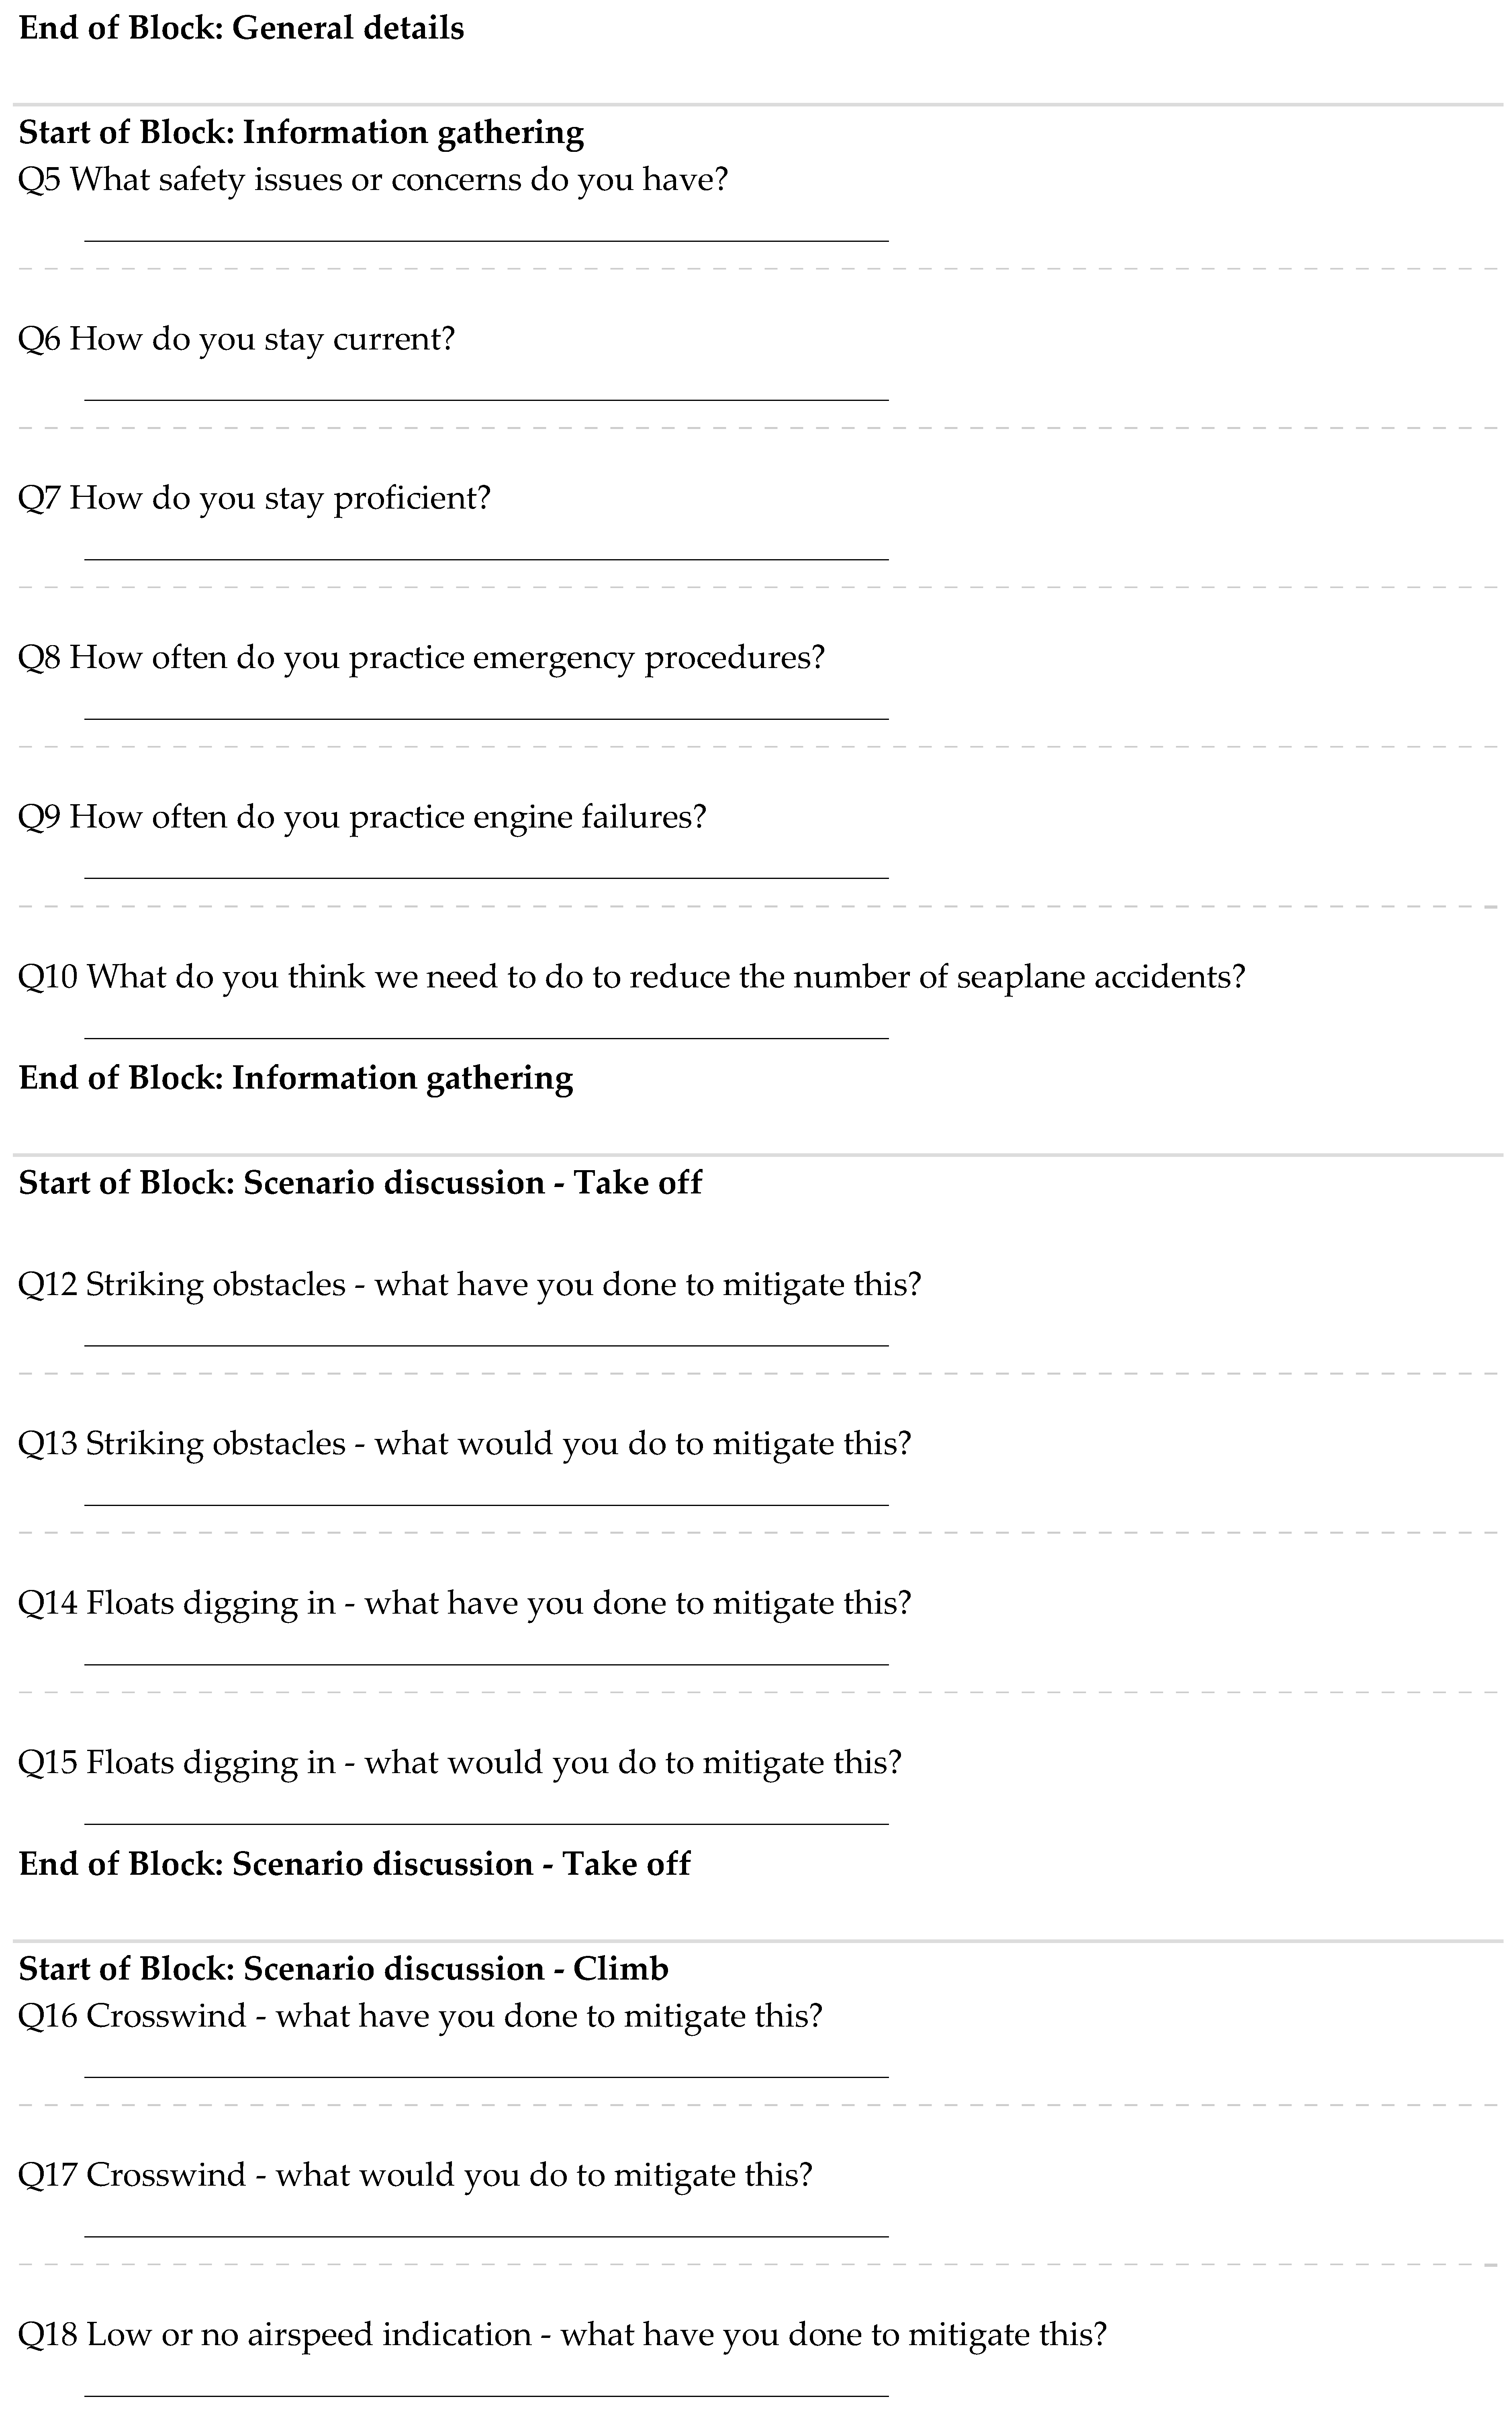
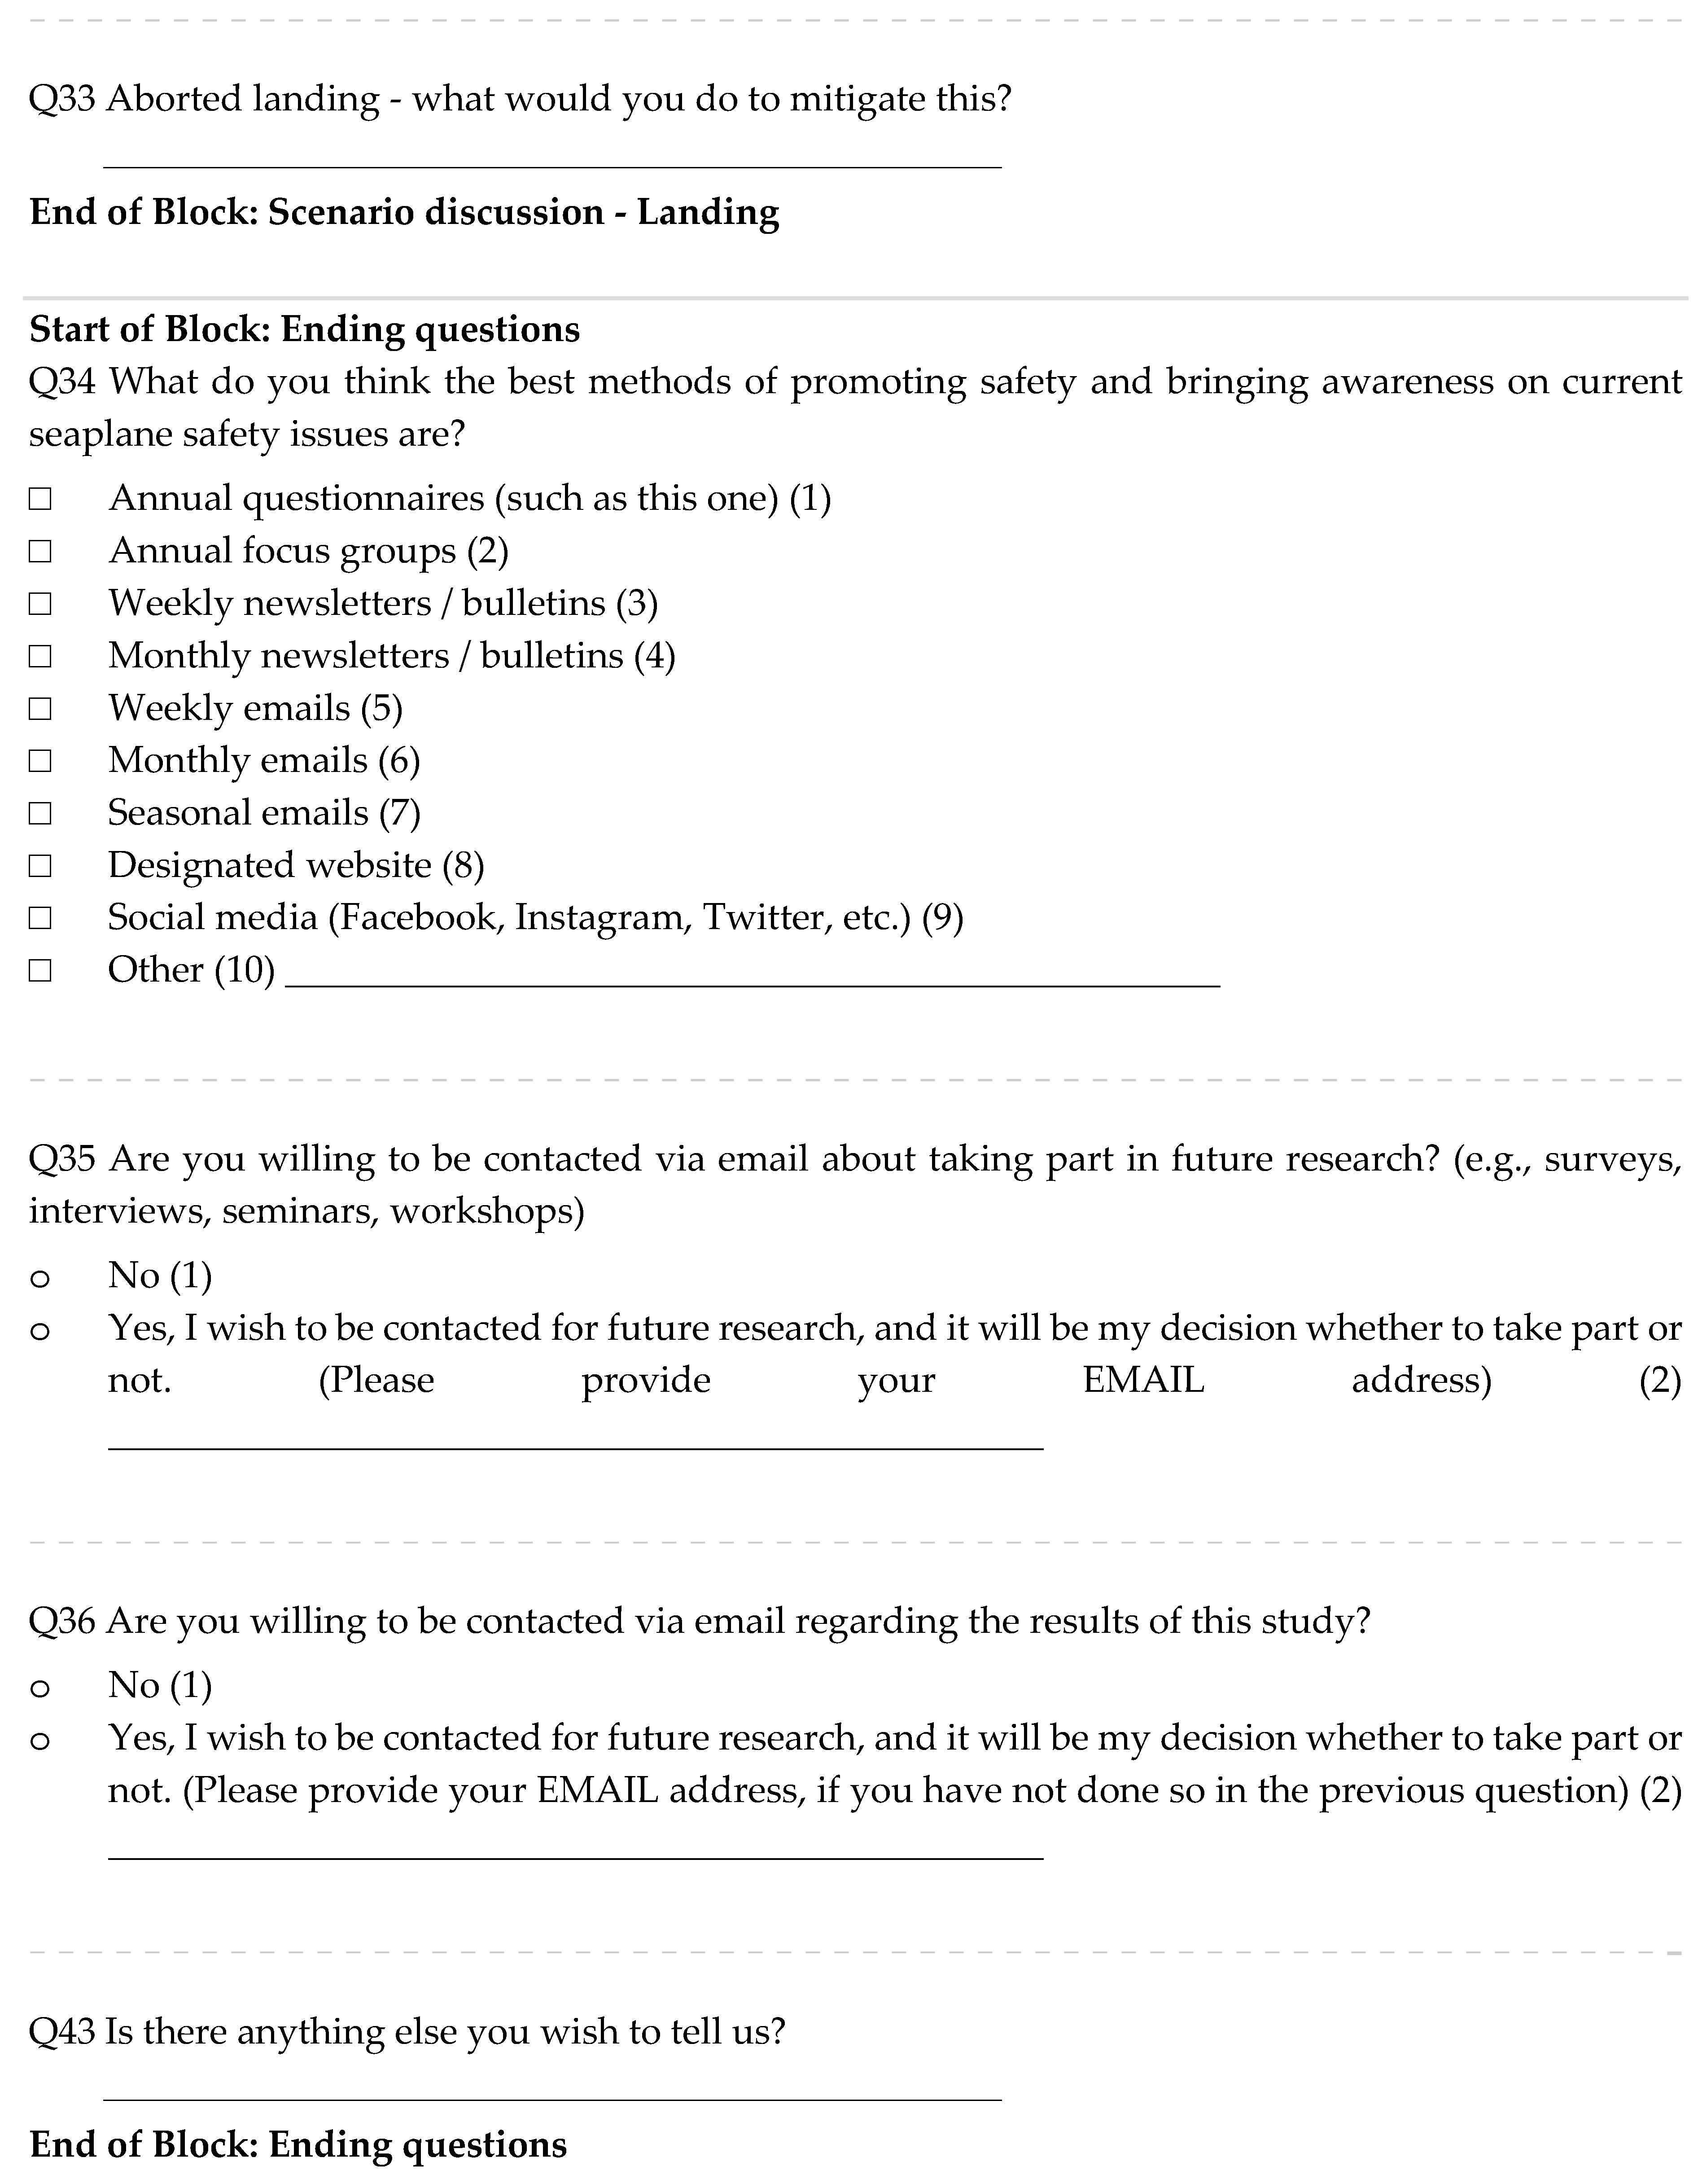
Multiple choice or open-ended questions have been used, which have been structured into six parts. These are a subset of the questions asked that relate to seaplane operations on waters only:
- Participant information & Consent
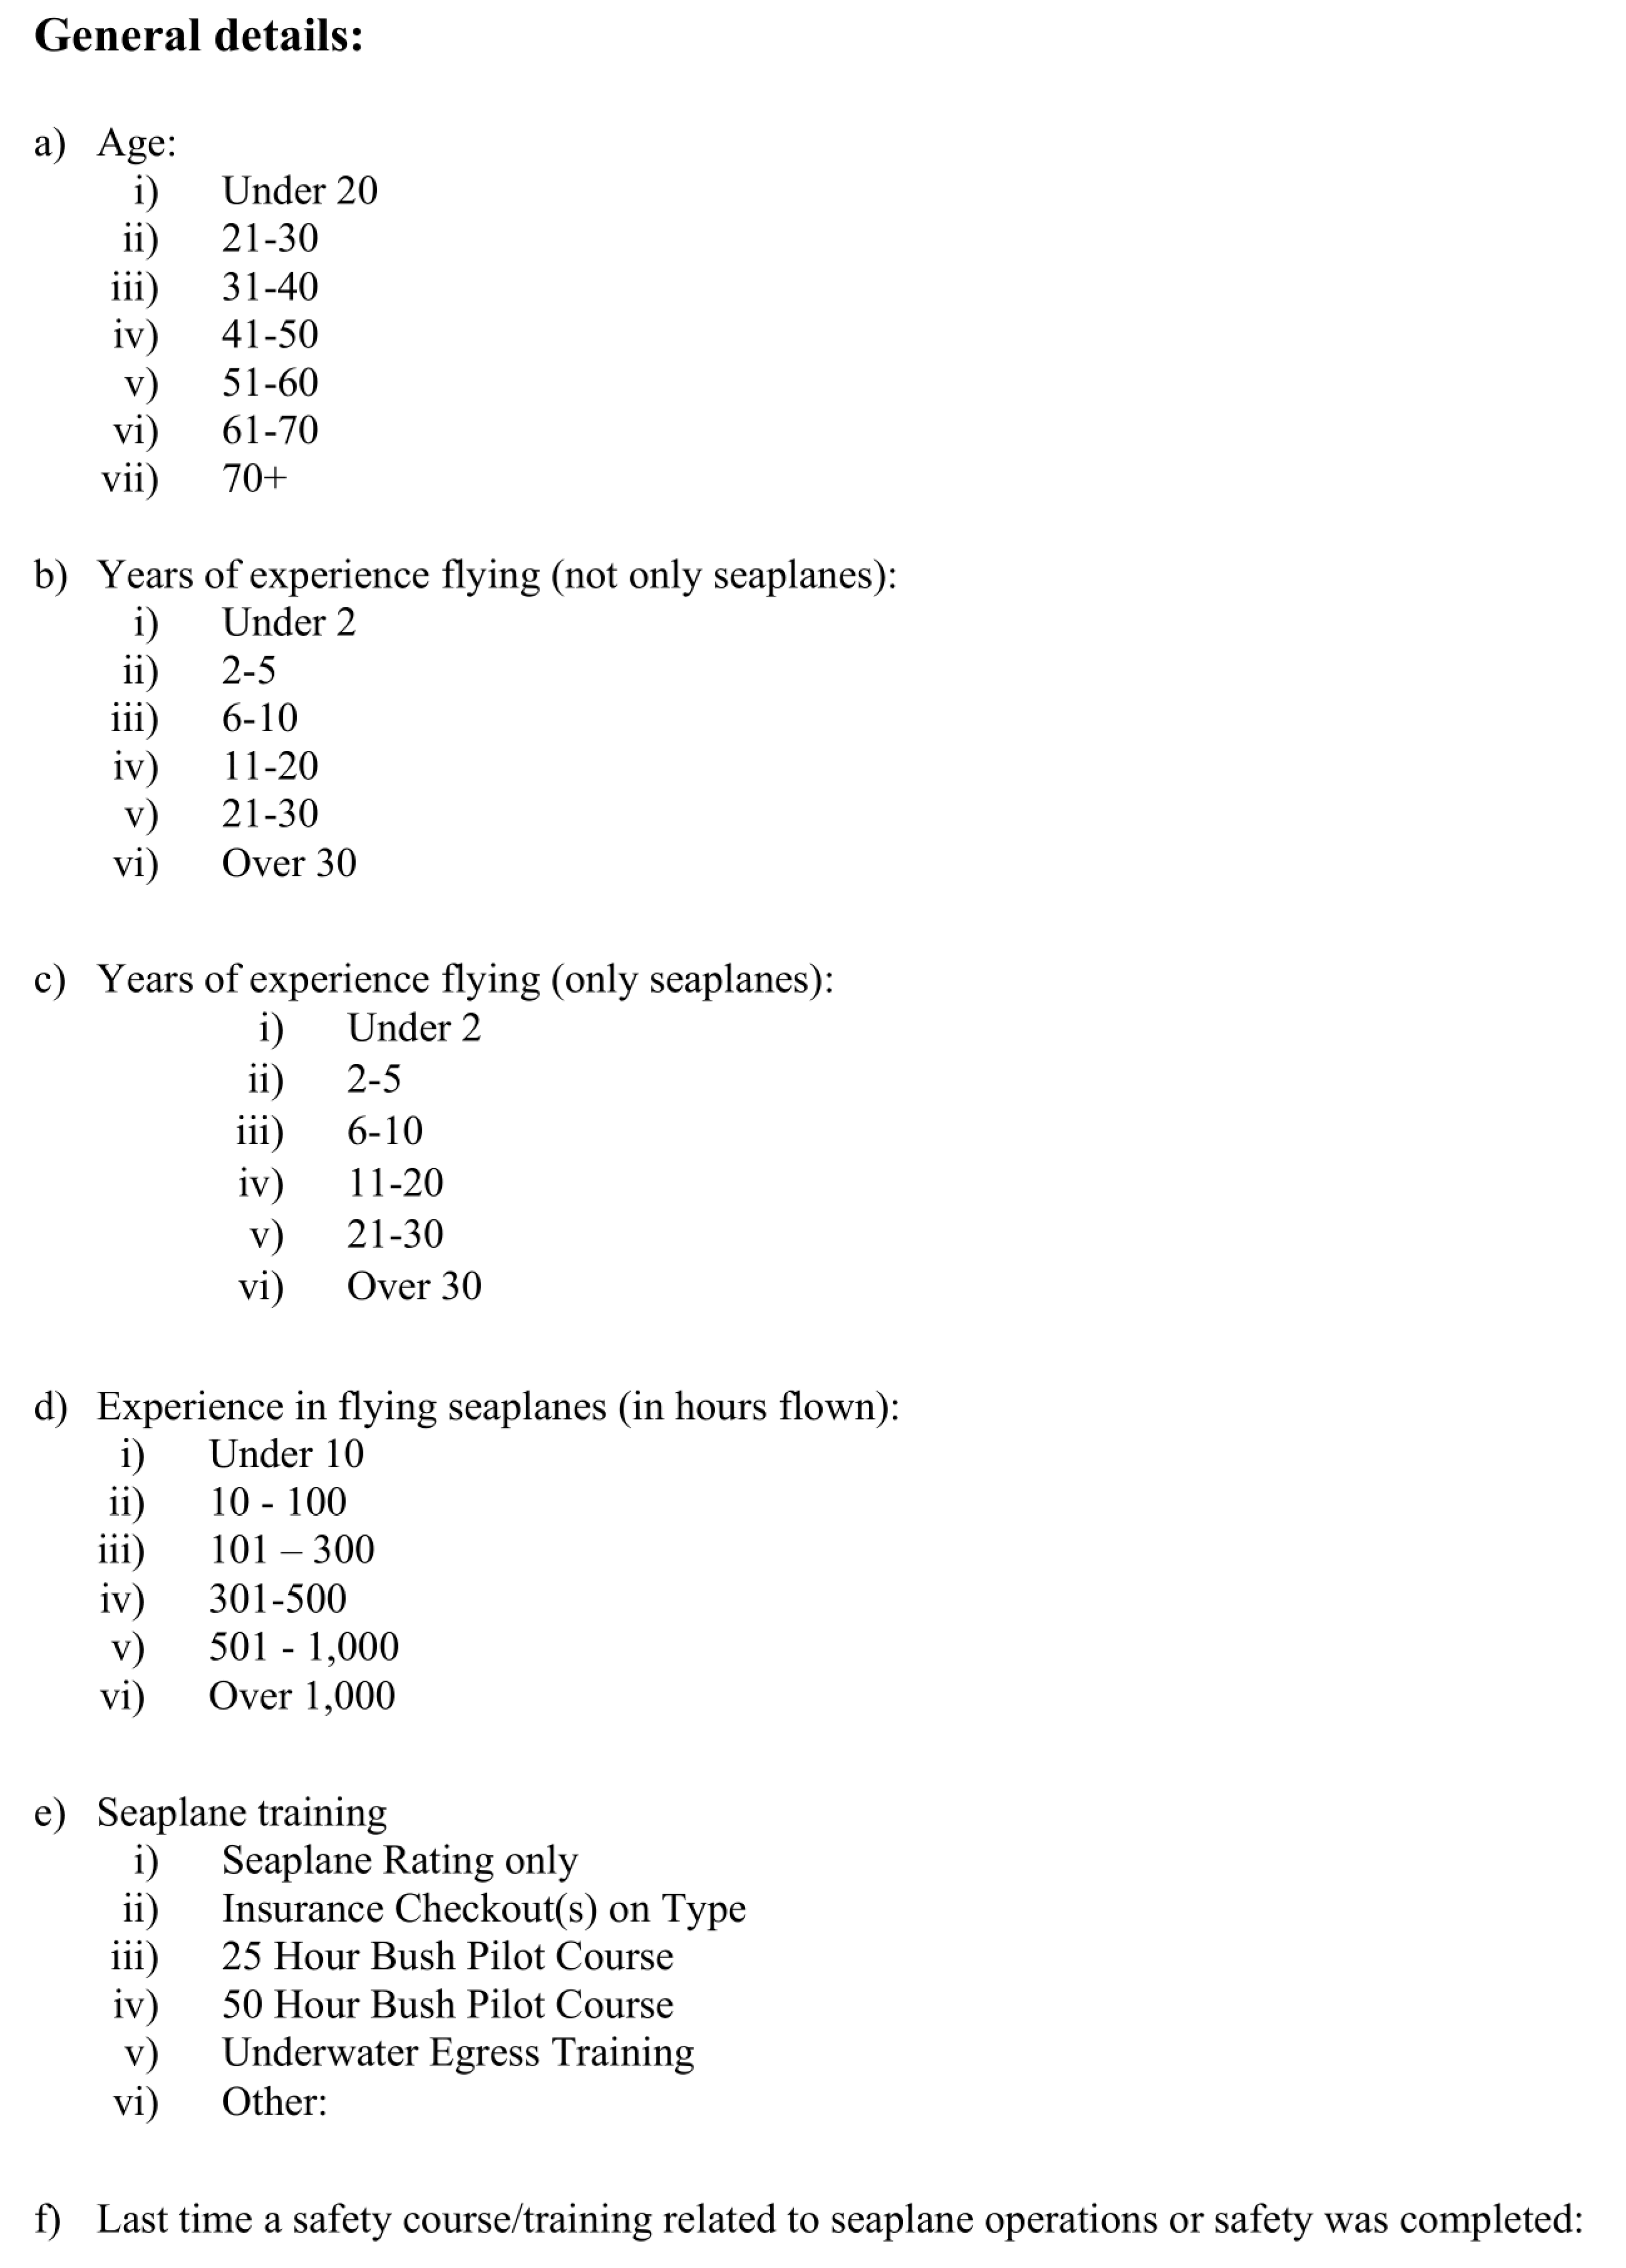
- General details
- Information gathering – Safety training and concerns
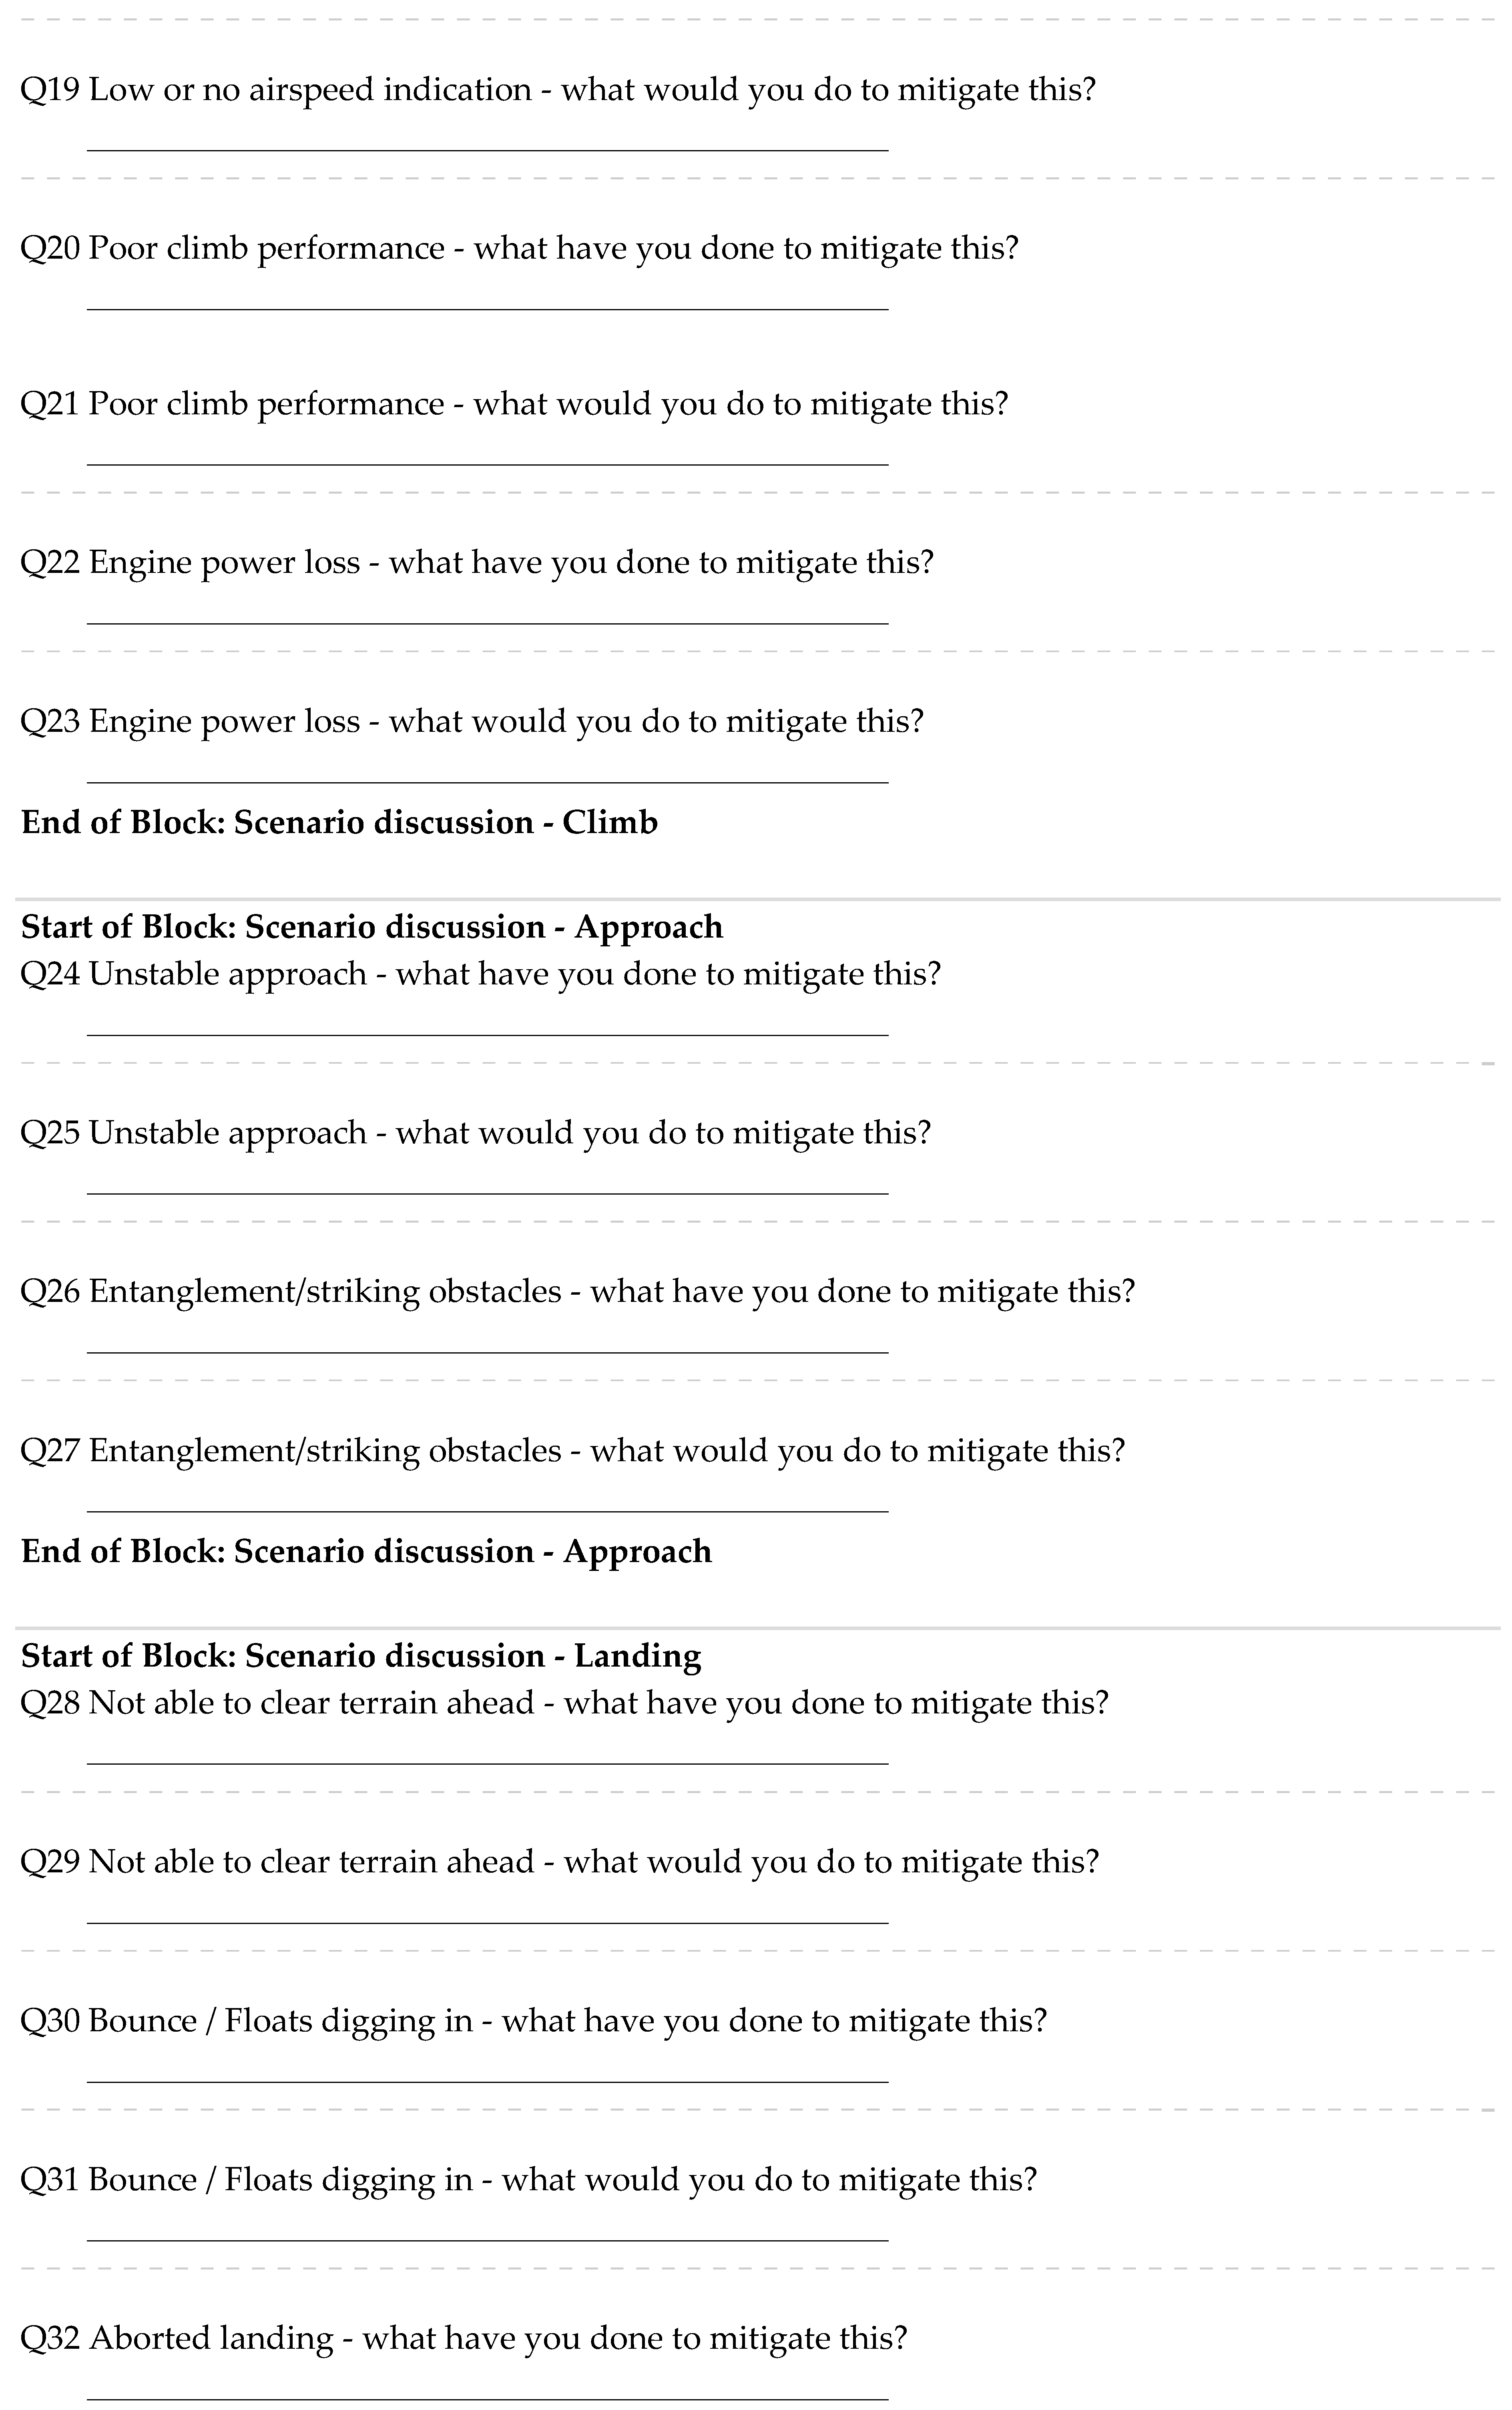
- Scenario discussion – Take-off
- Scenario discussion – Landing
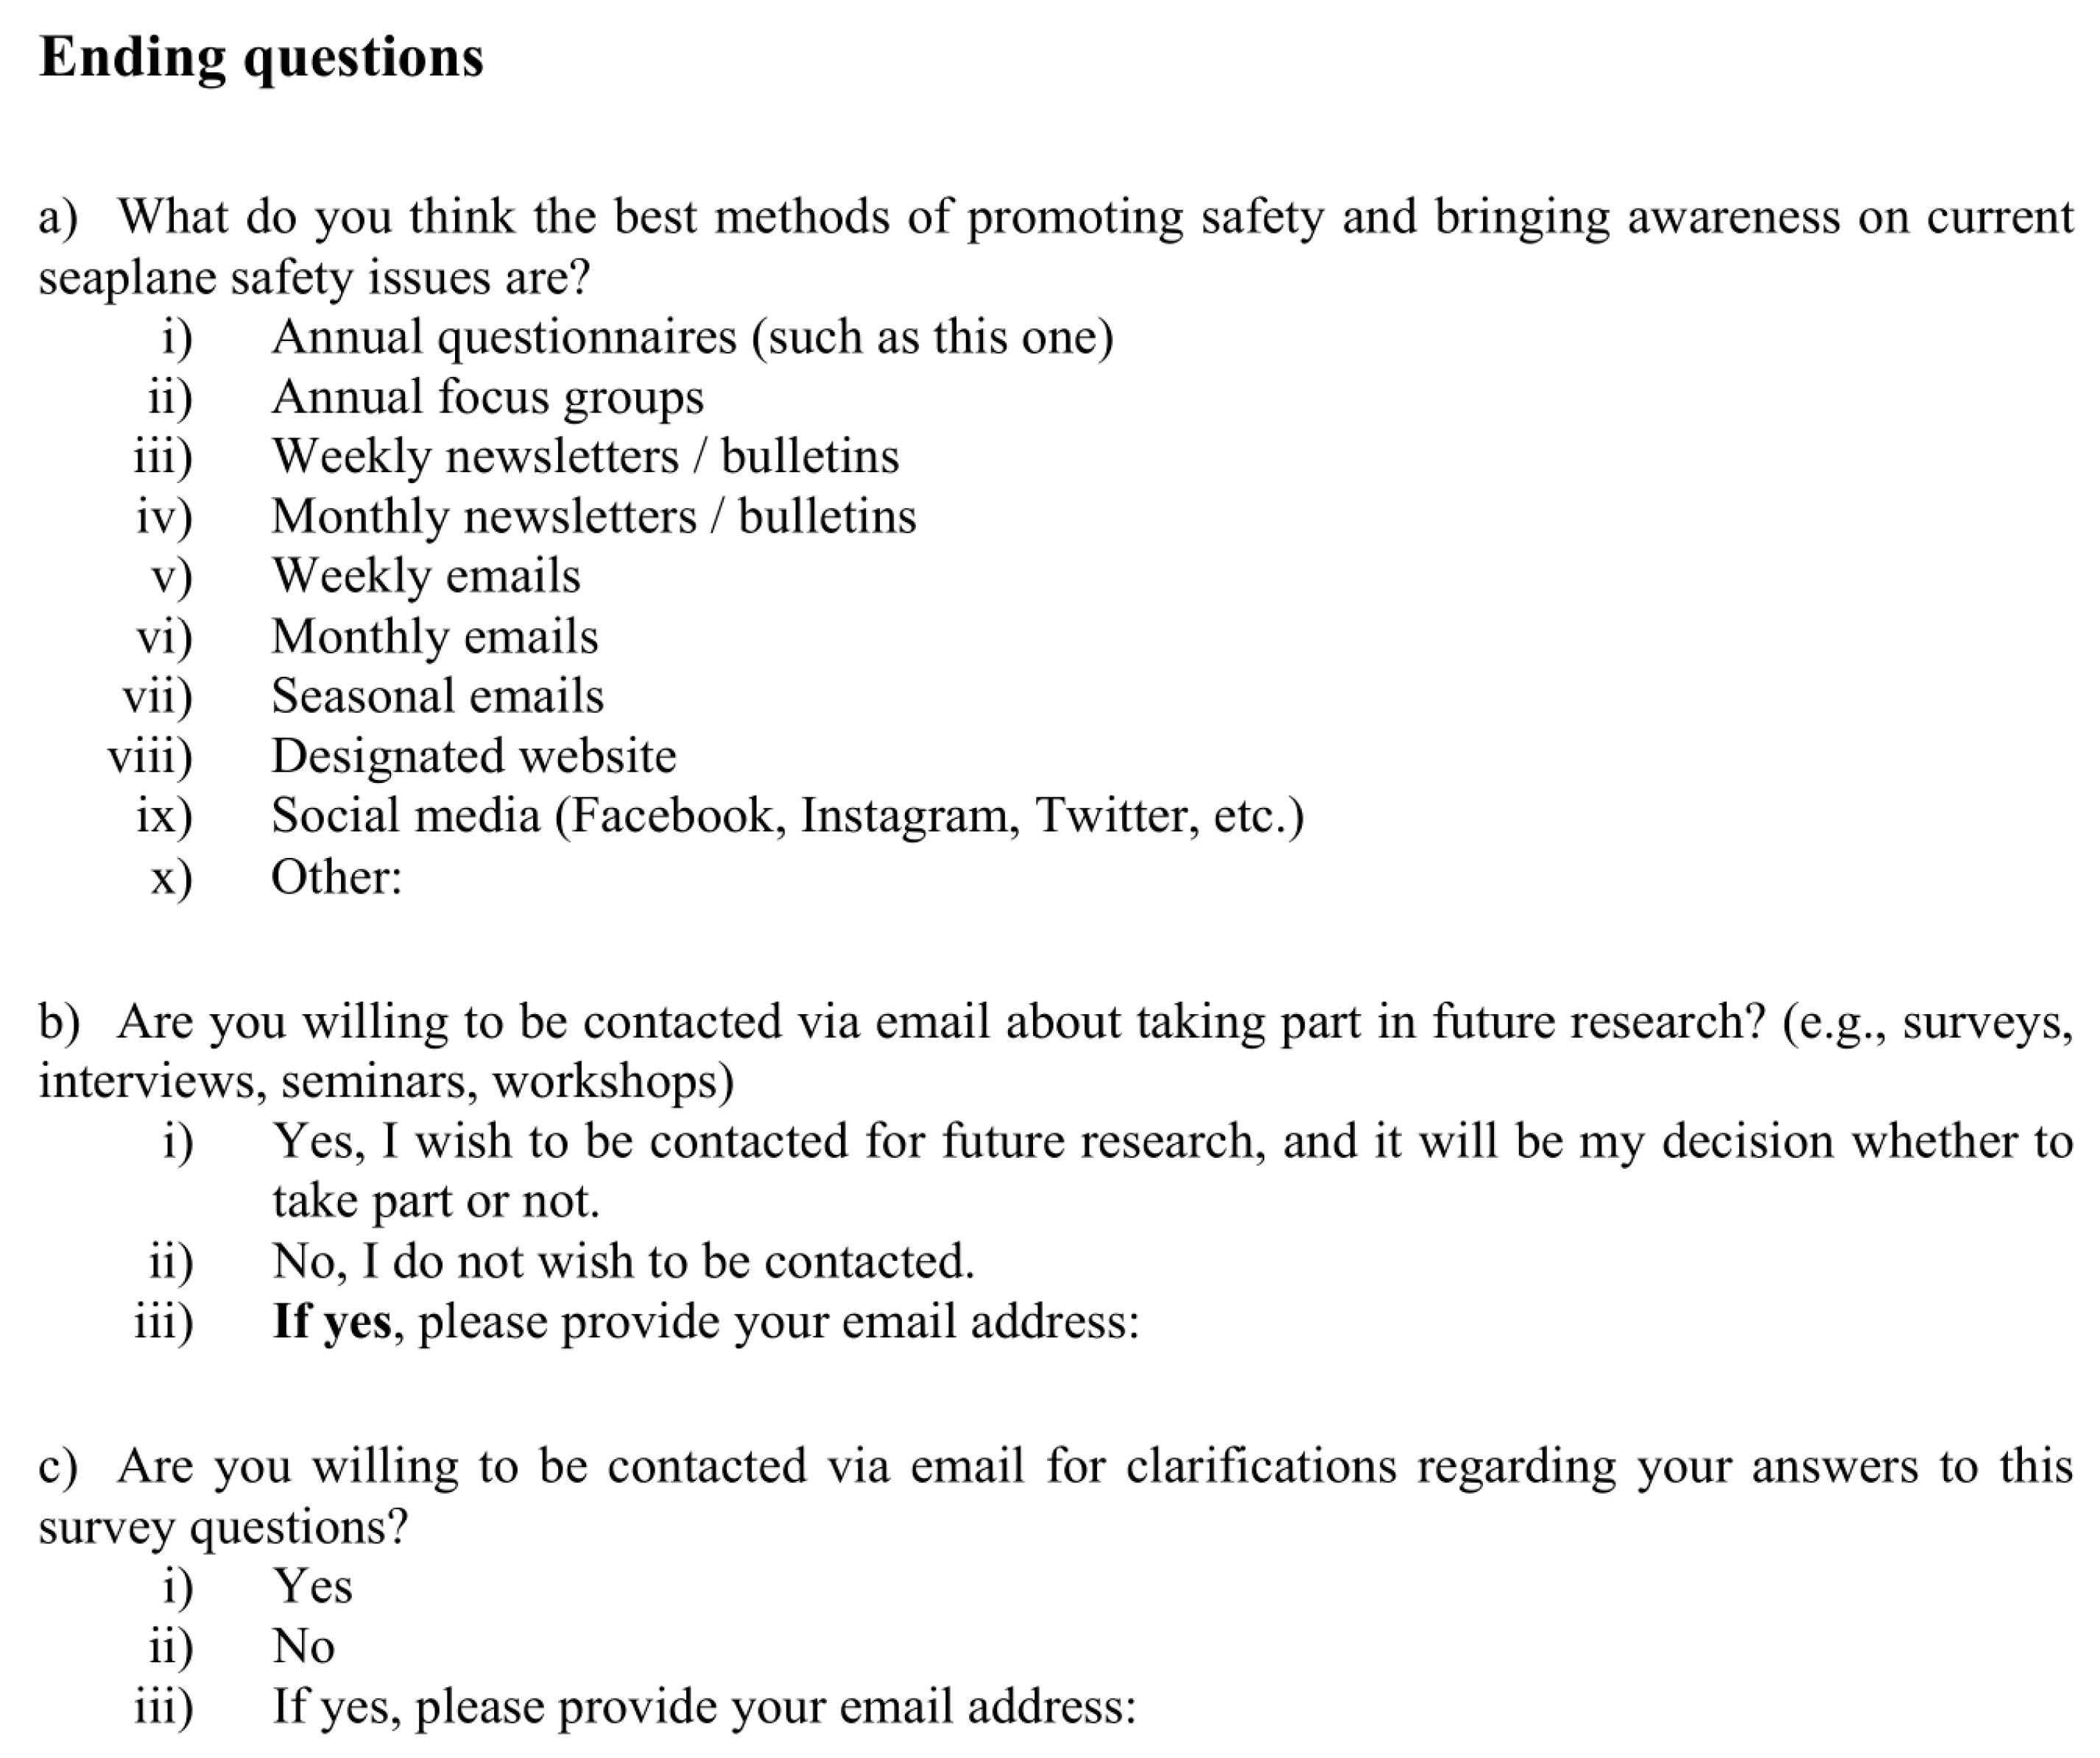
- Ending questions
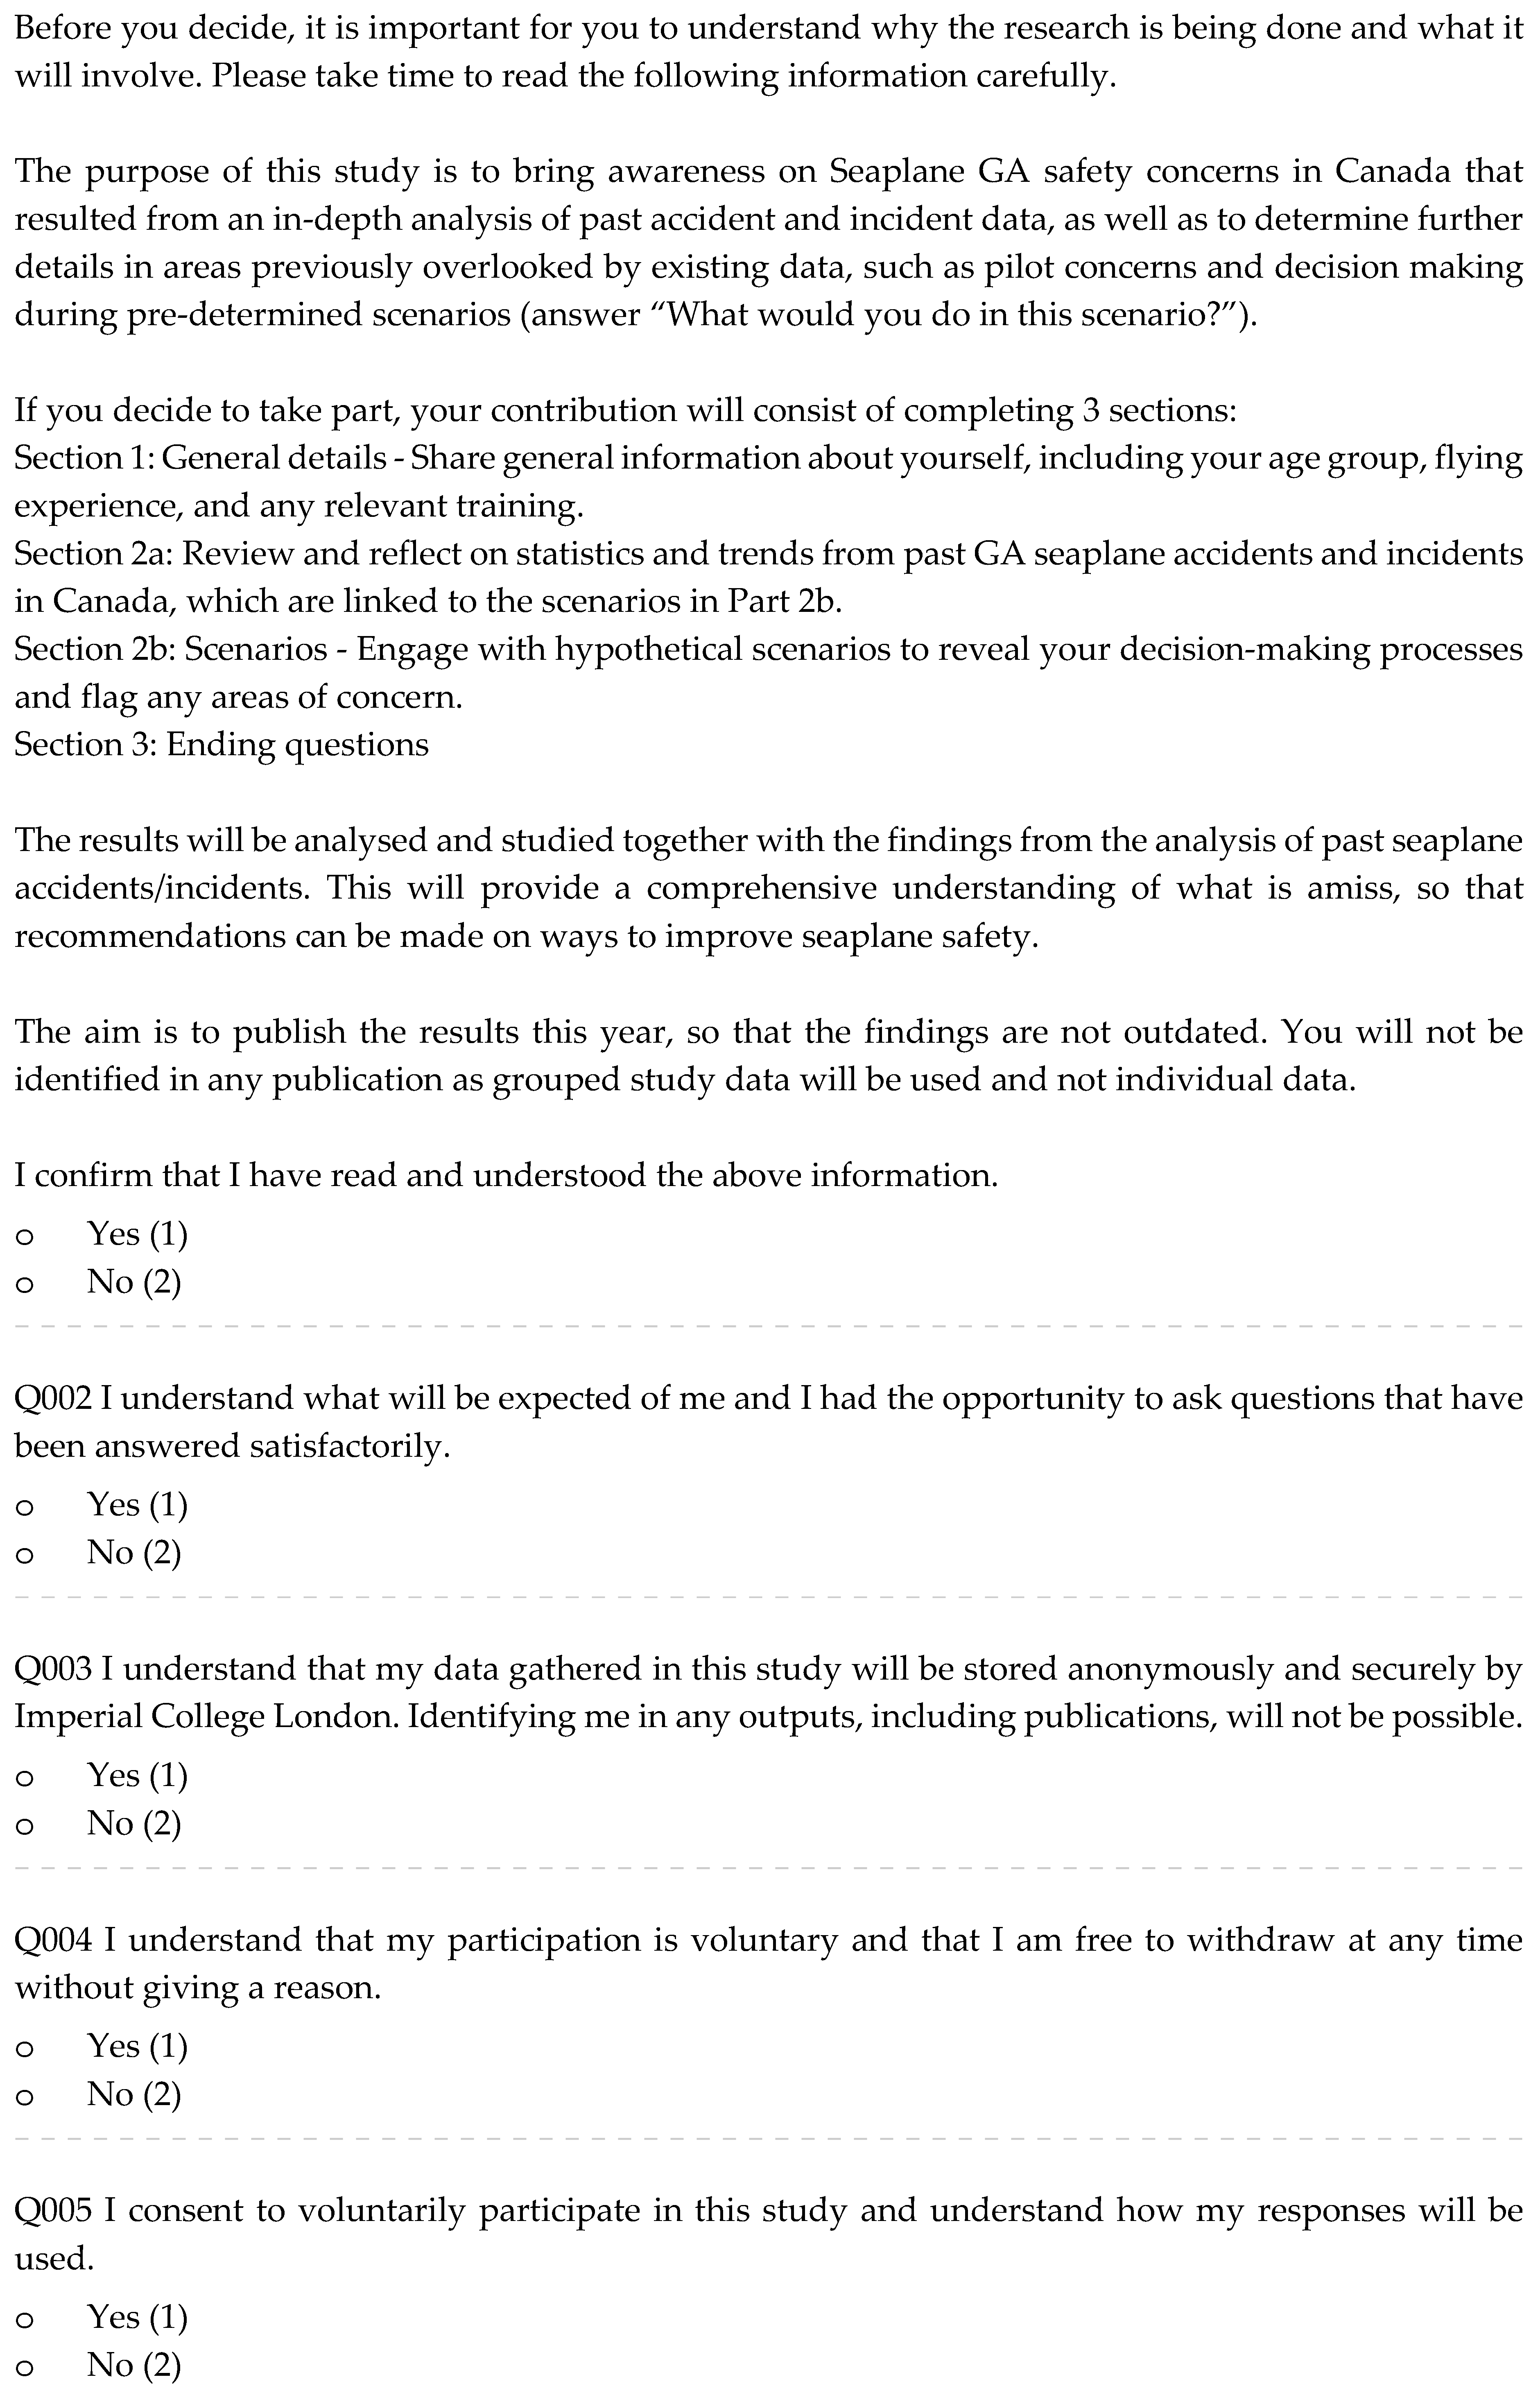
The questionnaire, focus groups and interviews are based on the same questions and begin with a short description of its purpose, then the participants are assured of confidentiality and explained their freedom to withdraw without giving a reason (Part 1). Informed consent is obtained from all participants, prior to proceeding with the questions. Parts 2 and 6 contain questions about participants’ age group, experience, seaplane ratings, safety training and methods of safety awareness preferred. Section 4 and Section 5 consist of scenarios which include the questions “What have you done to mitigate this?” and “What would you do to mitigate this?”, regarding different hazardous situations that may happen during take-off and landing.
This survey aims to gain information related to pilot decision making during different scenarios, as well as other details about safety training and practices, and ways in which pilots stay current and proficient. Pilots can express current safety concerns and propose ways for safety prevention and awareness. All answers are anonymous, increasing the chance pilots answer truthfully.
3. Results
Mixed methods of quantitative and qualitative analysis have been used to analyze the safety of seaplanes on Canadian waters, as previously presented in Section 2. This section presents and interprets the results of the accident/incident data analysis (Section 3.1), as well as the responses obtained through the survey (Section 3.2). Table 3 summarizes the accident/incident dataset and the methods of analysis used.
3.1. Analysis of Previous Accidents and Incidents
This section provides the quantitative analysis of the accident/incident dataset of past seaplane occurrences on Canadian waters. It includes an assessment of the narratives (Section 3.1.1), trend analysis (Section 3.1.2), contingency analysis and three-way associations (Section 3.1.3) and a summary of the results in Section 3.1.4.
3.1.1. Narrative Analysis
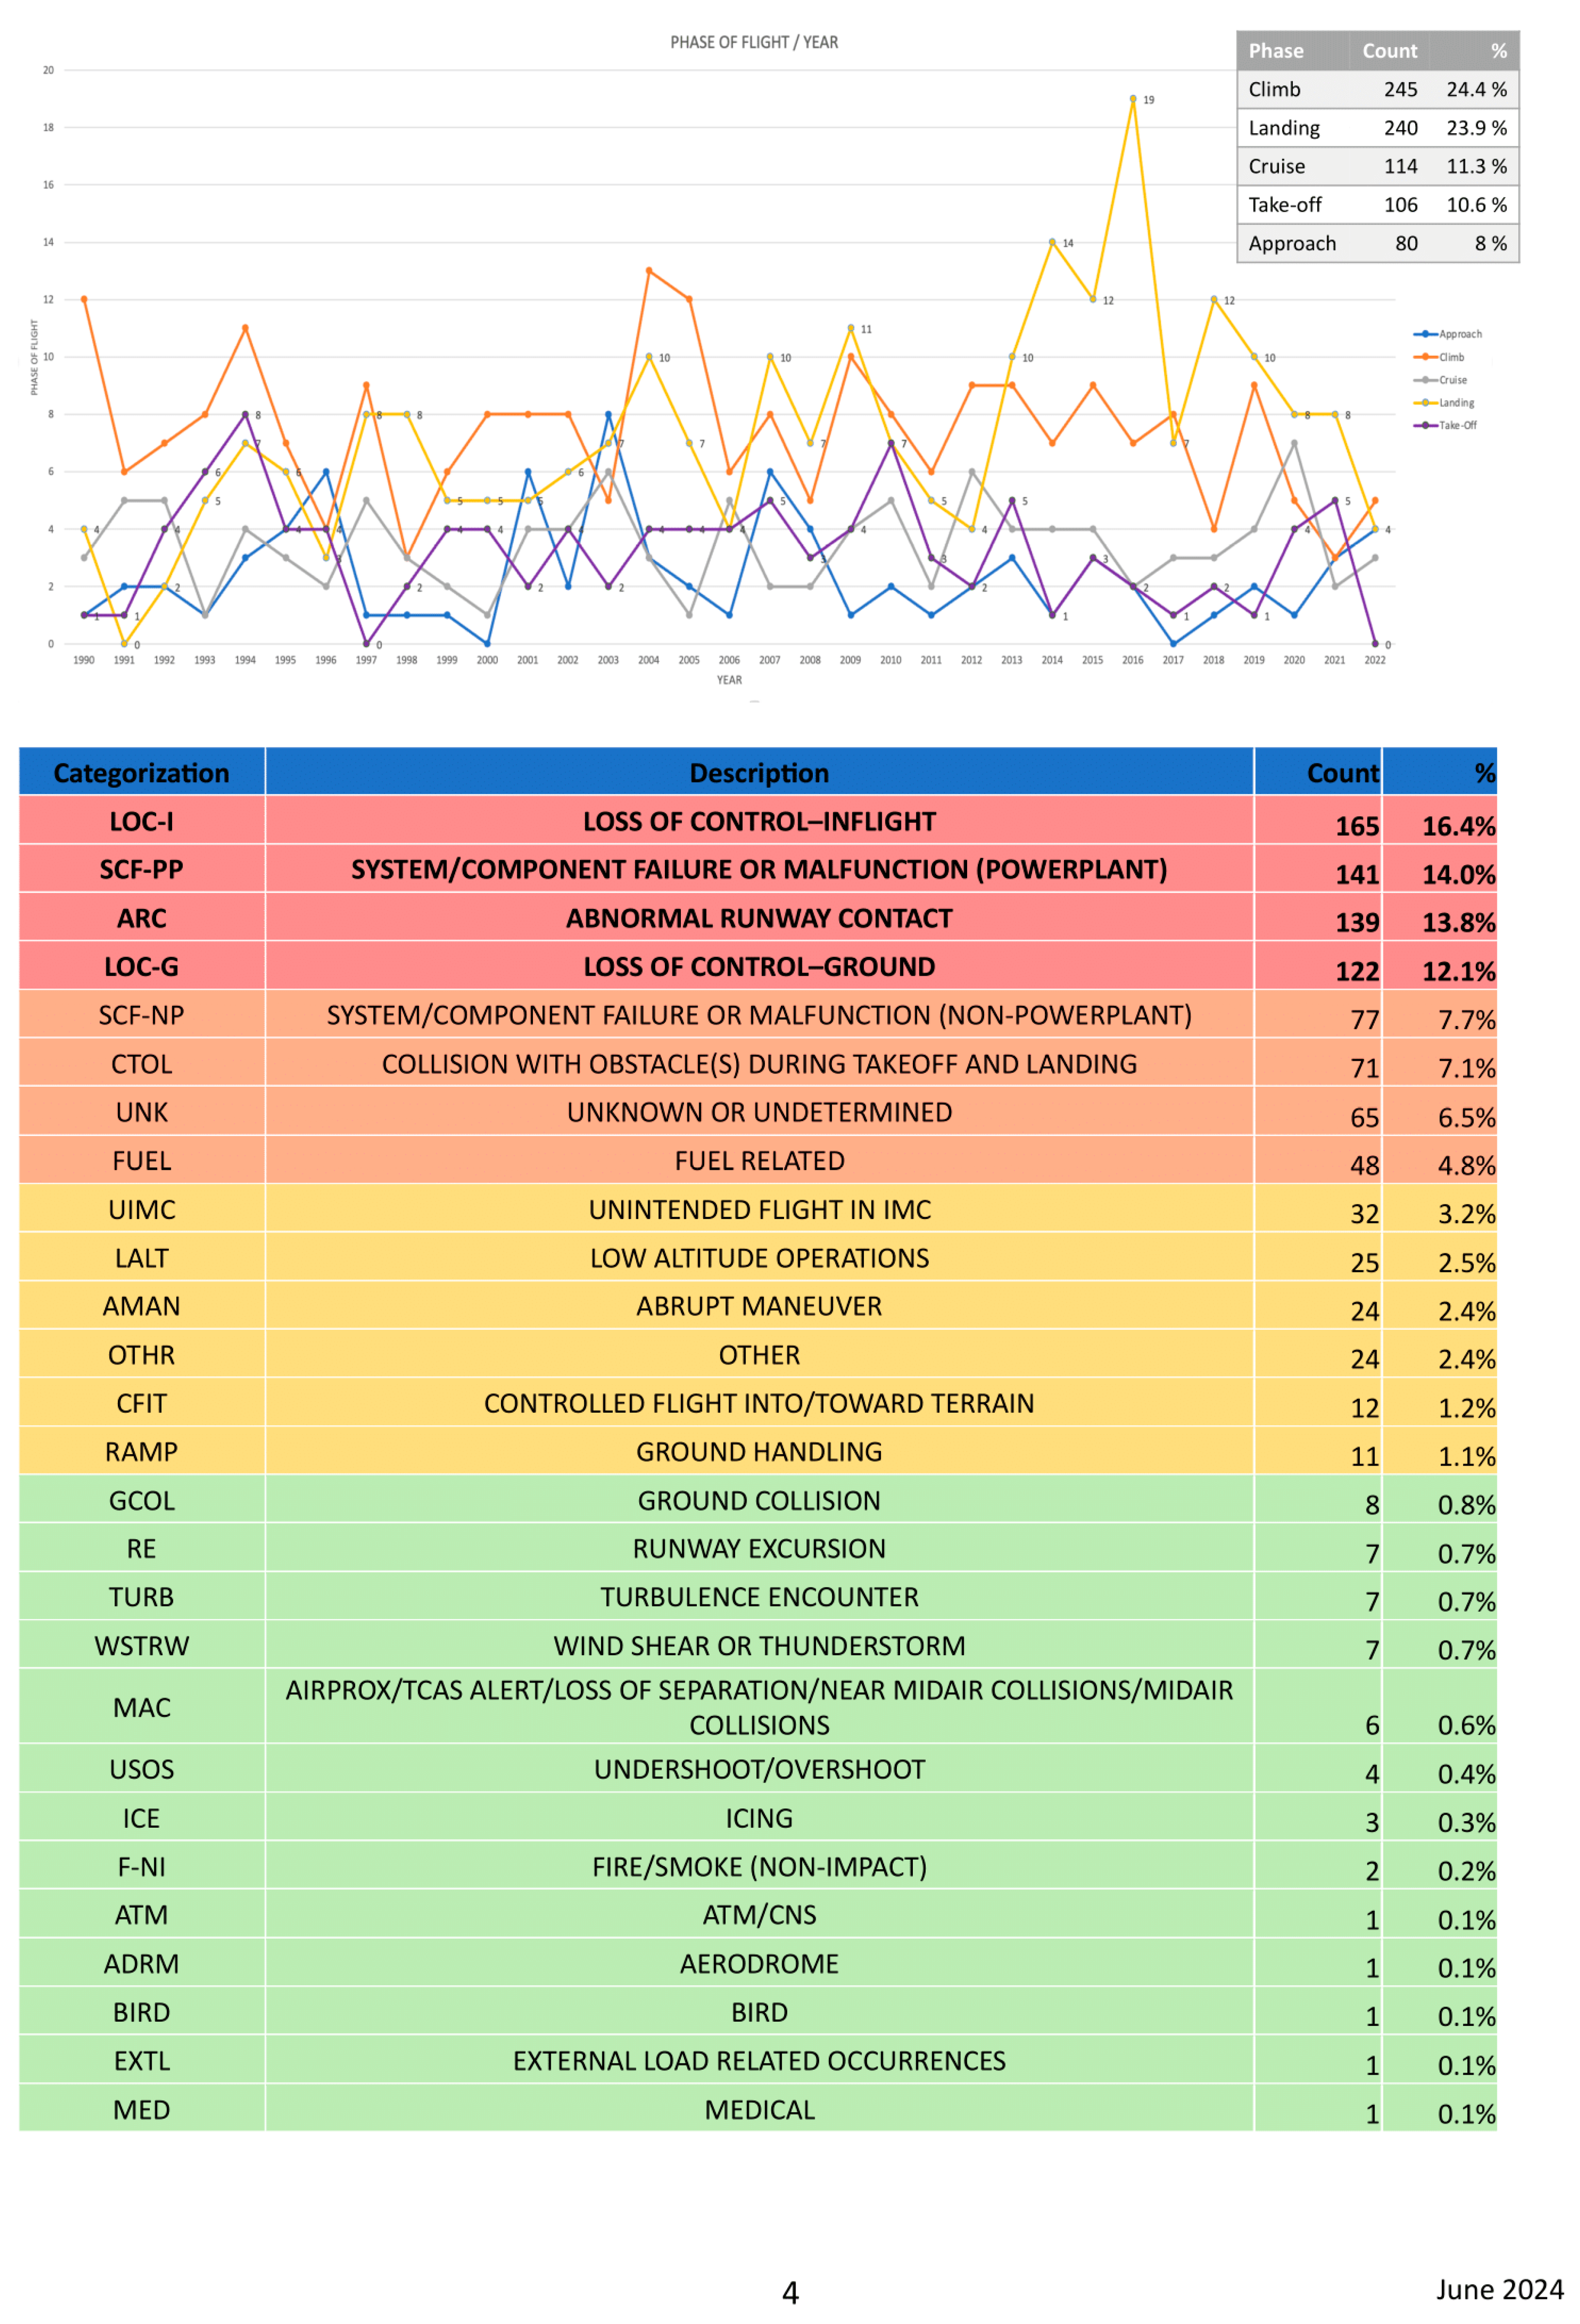
The occurrence narratives have been used to identify their root causes from the following categories: airborne, ground operations, take-off and landing, aircraft-related, non-aircraft-related, weather conditions and miscellaneous. Within these categories, factors such as visibility, wind, loss of control, mechanical errors, human errors in making decisions or in operating the plane, the reason for pilots making certain decisions (such as abrupt maneuvers), missing emergency etc. have been considered. This particularly timely task revealed that loss of control and abnormal runway contact led to the majority (59.23%) of seaplane occurrences on the water (Table 4).
3.1.2. Trend Analysis
The dataset of seaplane occurrences was analyzed around the following variables:
- Year
- Landing Gear
- Phase of Flight
- Aircraft Damage Level
- Injuries and Fatalities
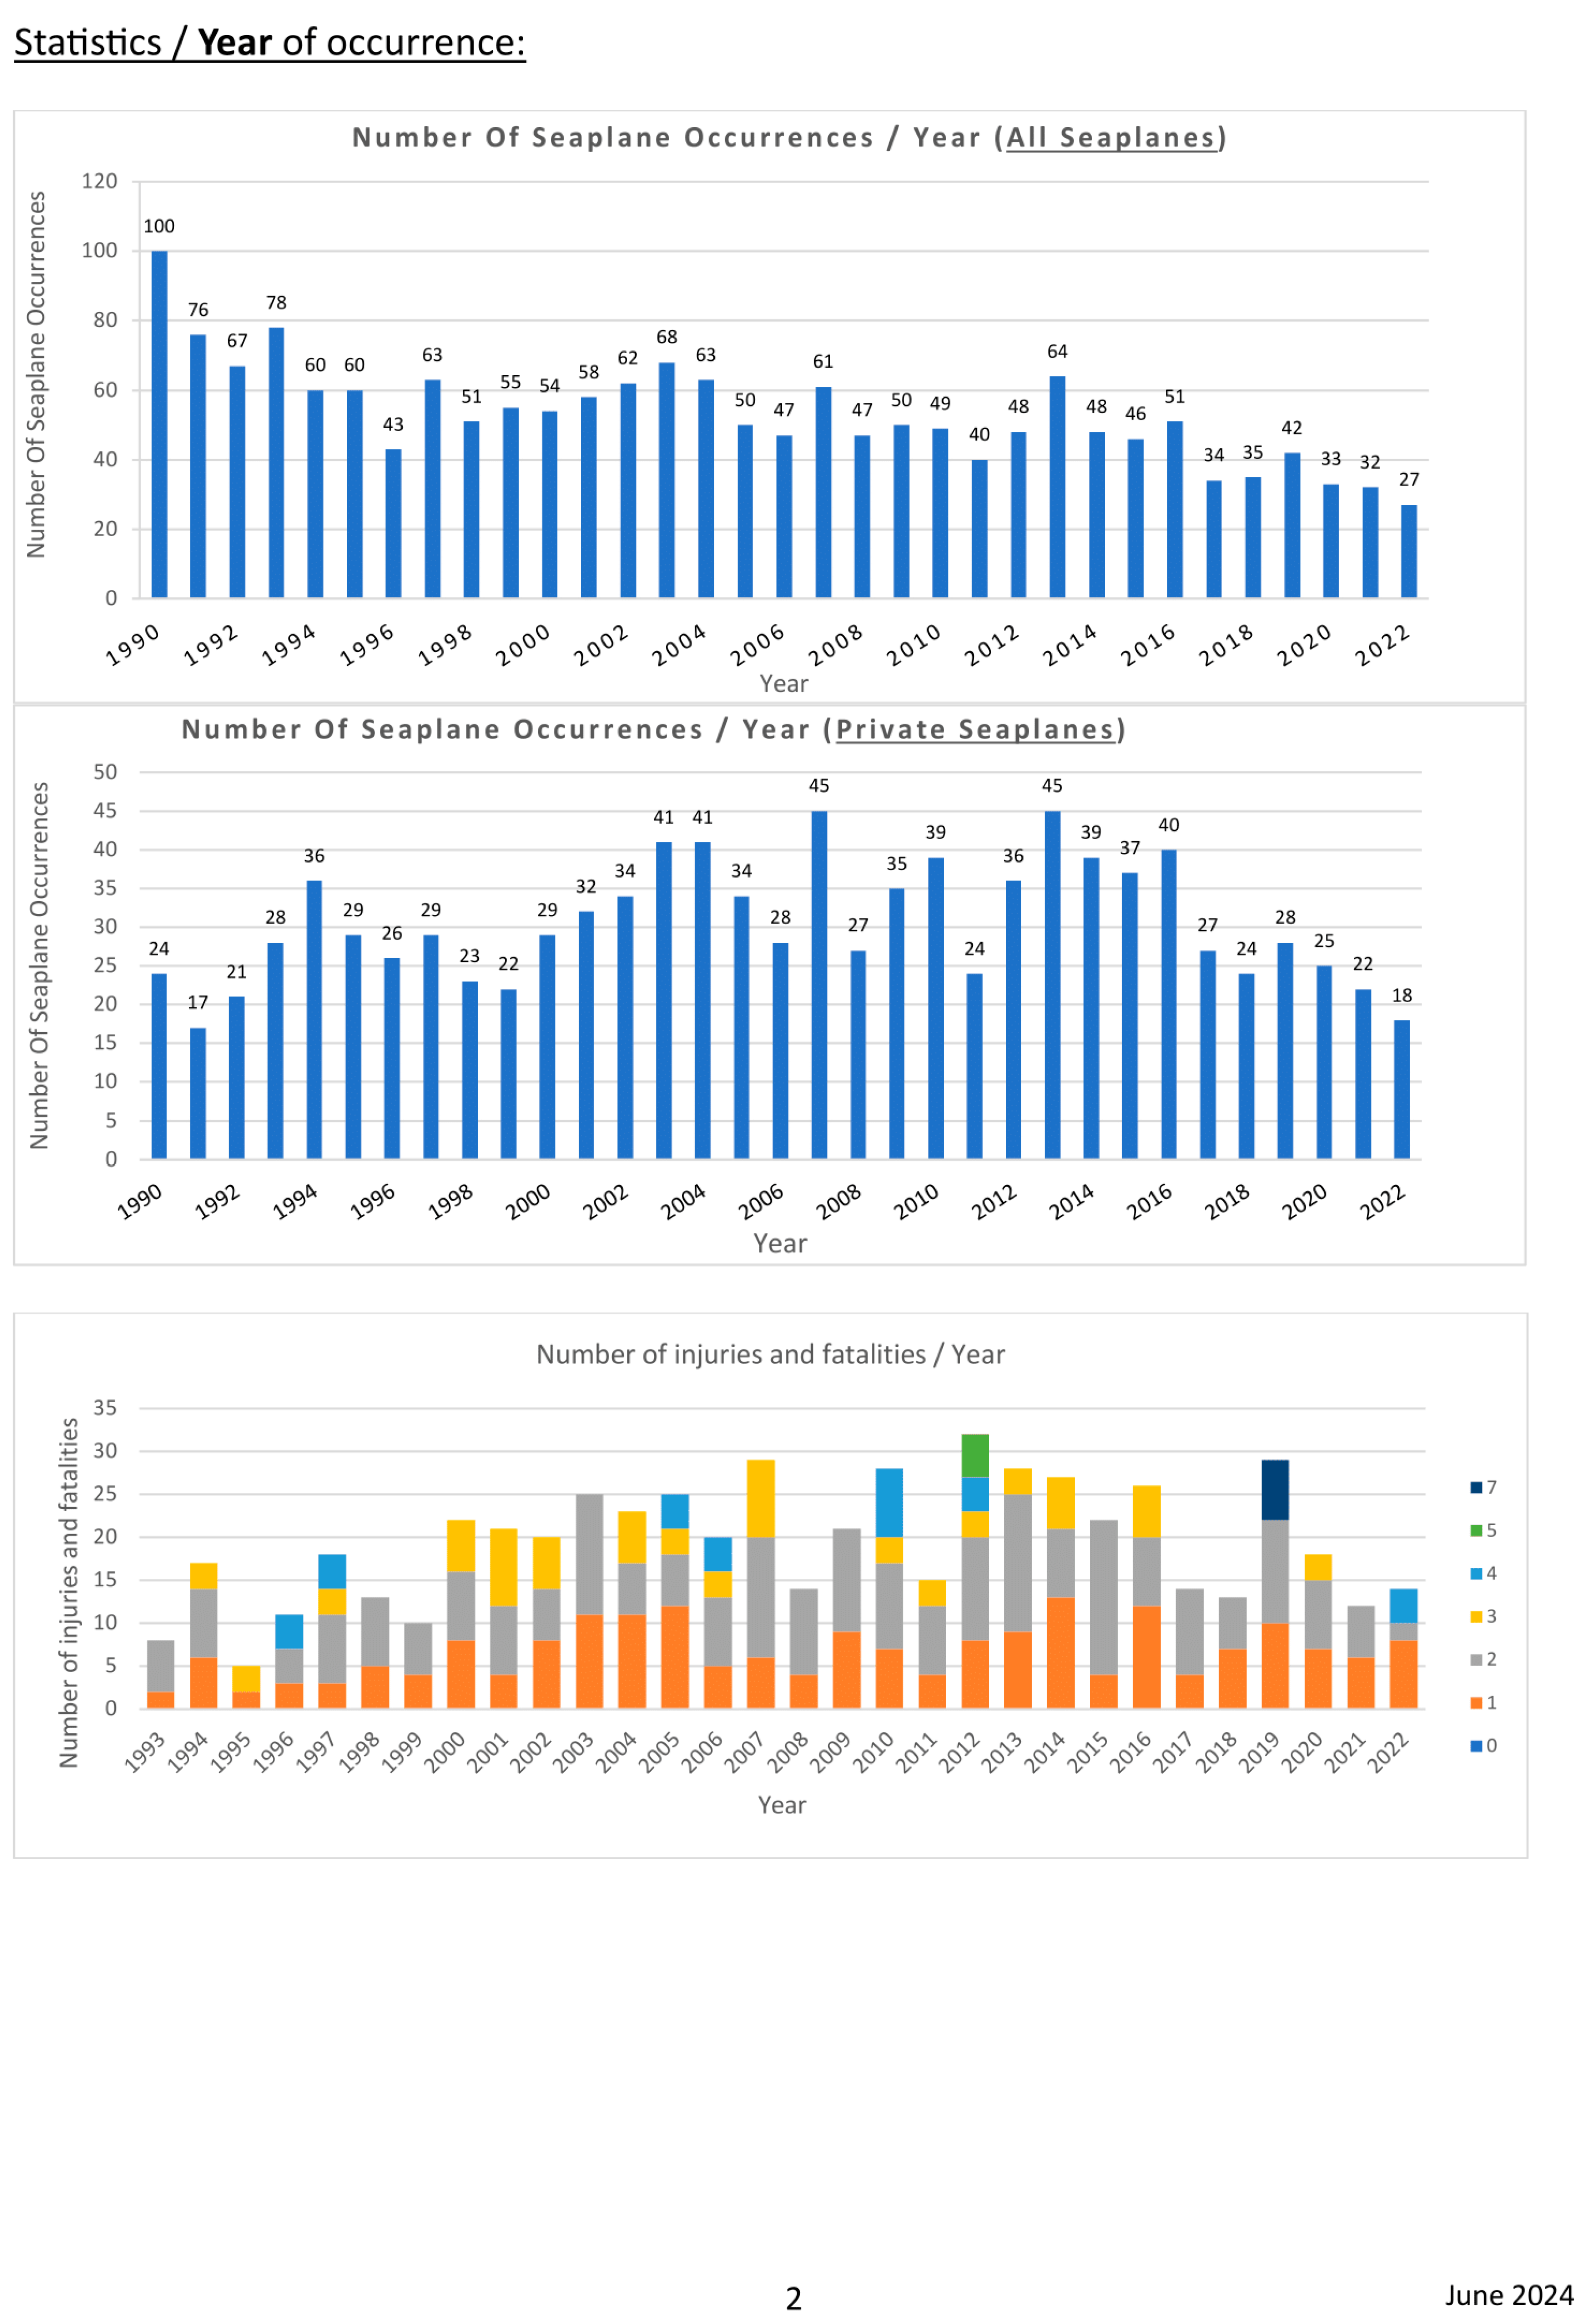
In Canada, the number of seaplane occurrences has gradually decreased over the years (Figure 3). However, considering private, recreational seaplane operations on the water in particular, the number of occurrences is showing an increase over the years (Figure 4). This indicates that, while general seaplane safety may be improving, especially in the commercial world, there are unique challenges and risks associated with private, recreational, on-water seaplane operations that need to be addressed. This subset of data is used for the subsequent analysis in this article. It should also be noted that Covid restrictions impacted the number of flights in 2020-2021.
The accurate calculation of occurrence rates for seaplanes presented a significant challenge due to the deficiency of data on seaplane movements, or on the yearly number of hours flown by seaplane pilots. This issue is particularly relevant in the context of private recreational seaplanes in Canada, where specific data is not available. One of the primary issues highlighted by Ison [16] is the lack of detailed data on the seaplane fleet and the cadre of seaplane pilots in the US, which makes it difficult to calculate accurate accident rates because comprehensive records of flight hours, pilot experience and operational contexts are often incomplete or unavailable. This is also the case for Canada.
Figure 5. shows how the number of injuries and fatalities fluctuates over the period, with the trendline ascending for the number of injuries and constant for the number of fatalities. The probable impact of Covid restrictions on the number of flights in 2020-2021 should be noted. Also, it was not possible to determine the number of injuries and fatalities between 1990-1992 for a large number of narratives, so these three years have been removed.
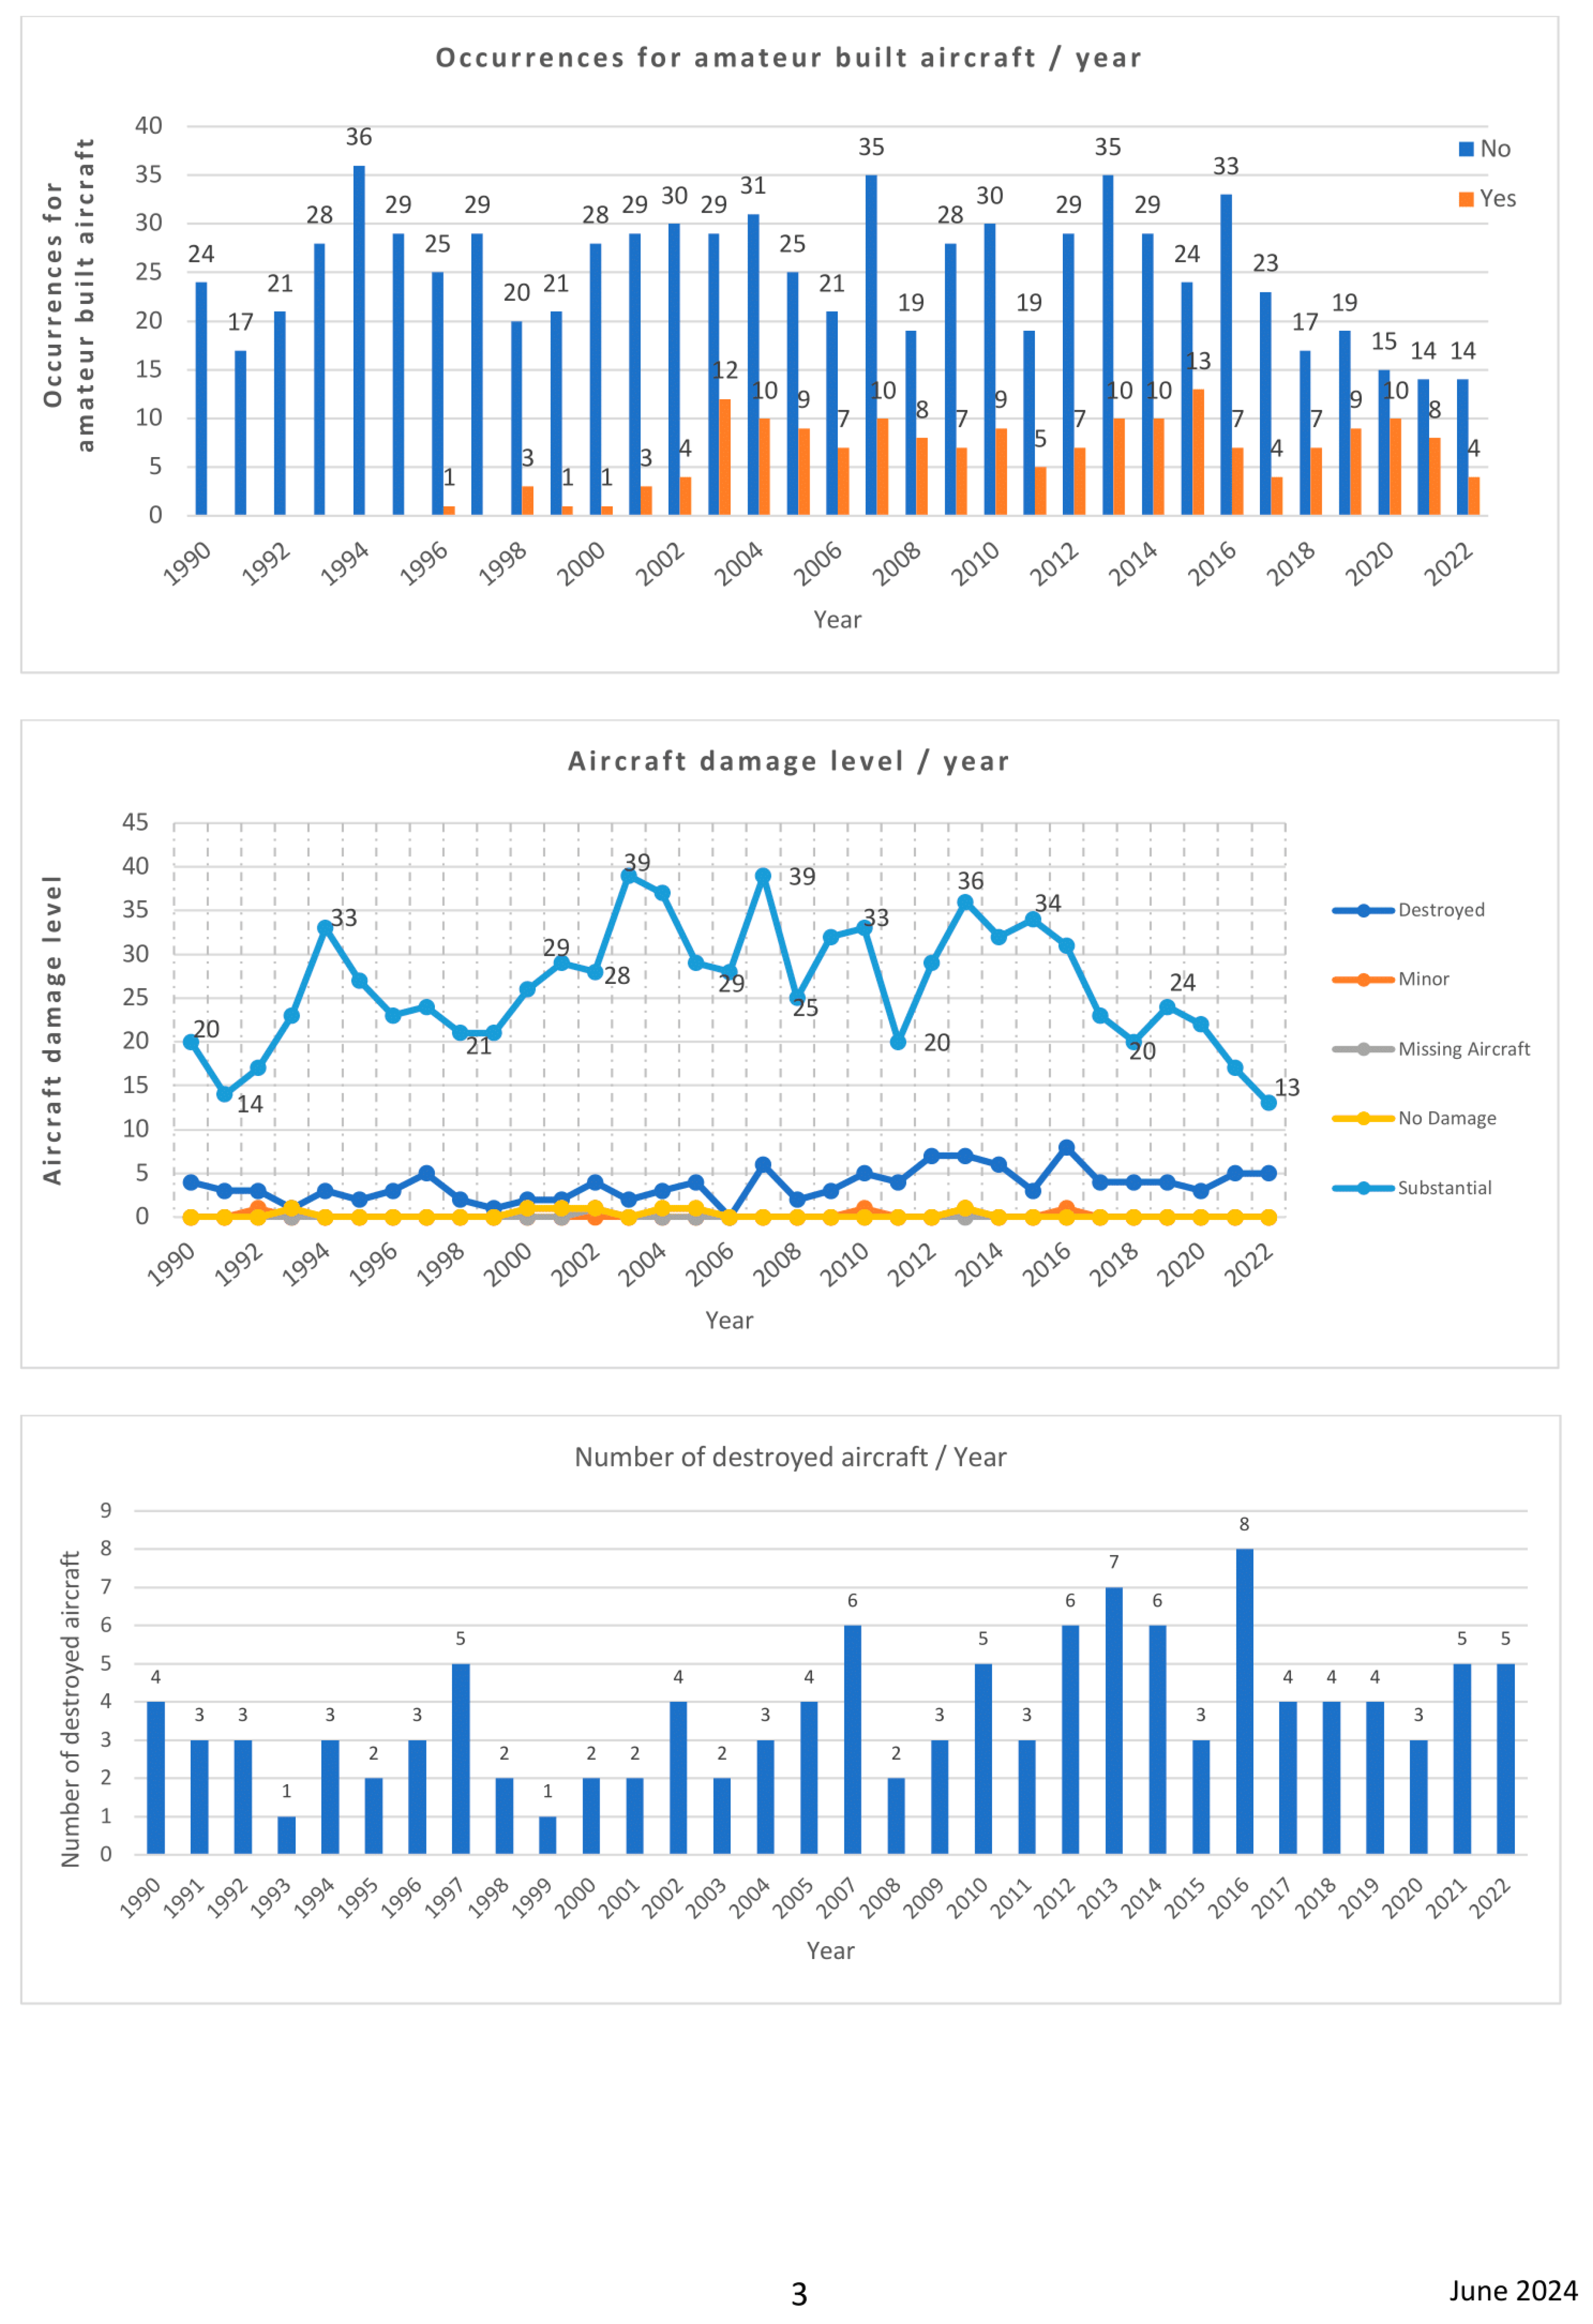
The number of occurrences annually for private, recreational seaplane operations on water involving amateur built aircraft shows an increasing trend over the period, as shown in Figure 6, with the first amateur built occurrence in 1998. From 2003, the numbers stabilize around a consistent average, which can be attributed to improved safety and a more experienced and knowledgeable community, along with regulatory enhancements. However, in recent years, a considerable percentage of occurrences involve amateur built aircraft. This highlights the importance of maintaining improvements so that, in the future, amateur built aircraft become safer to ensure a decreasing trend int heir occurrences.
Exploring the relationship between different accident causes and the level of damage of the aircraft reveals whether there are significant differences in the degree of damage suffered by seaplanes under different accident causes, thereby providing information for safety management and flight operations.
Figure 7 illustrates the severity of aircraft damage resulting from the occurrences with 94.62% leading to substantial aircraft damage, while 3.44% resulted in the aircraft being destroyed. These figures show that irrespective of accident cause, serious serious damage or even destruction of the seaplane is the likely result. The most notable trend is the fluctuation in the number of substantially damaged aircraft, which, in the past six years, while showing a gradual decline, nonetheless has an increasing trendline over the period. Since occurrences with less than major structural problems with the aircraft are not required to be reported, unless there has been a death, injury, missing aircraft or collision [17], which is reflected in the low numbers of occurrences where the aircraft had minor or no damage.
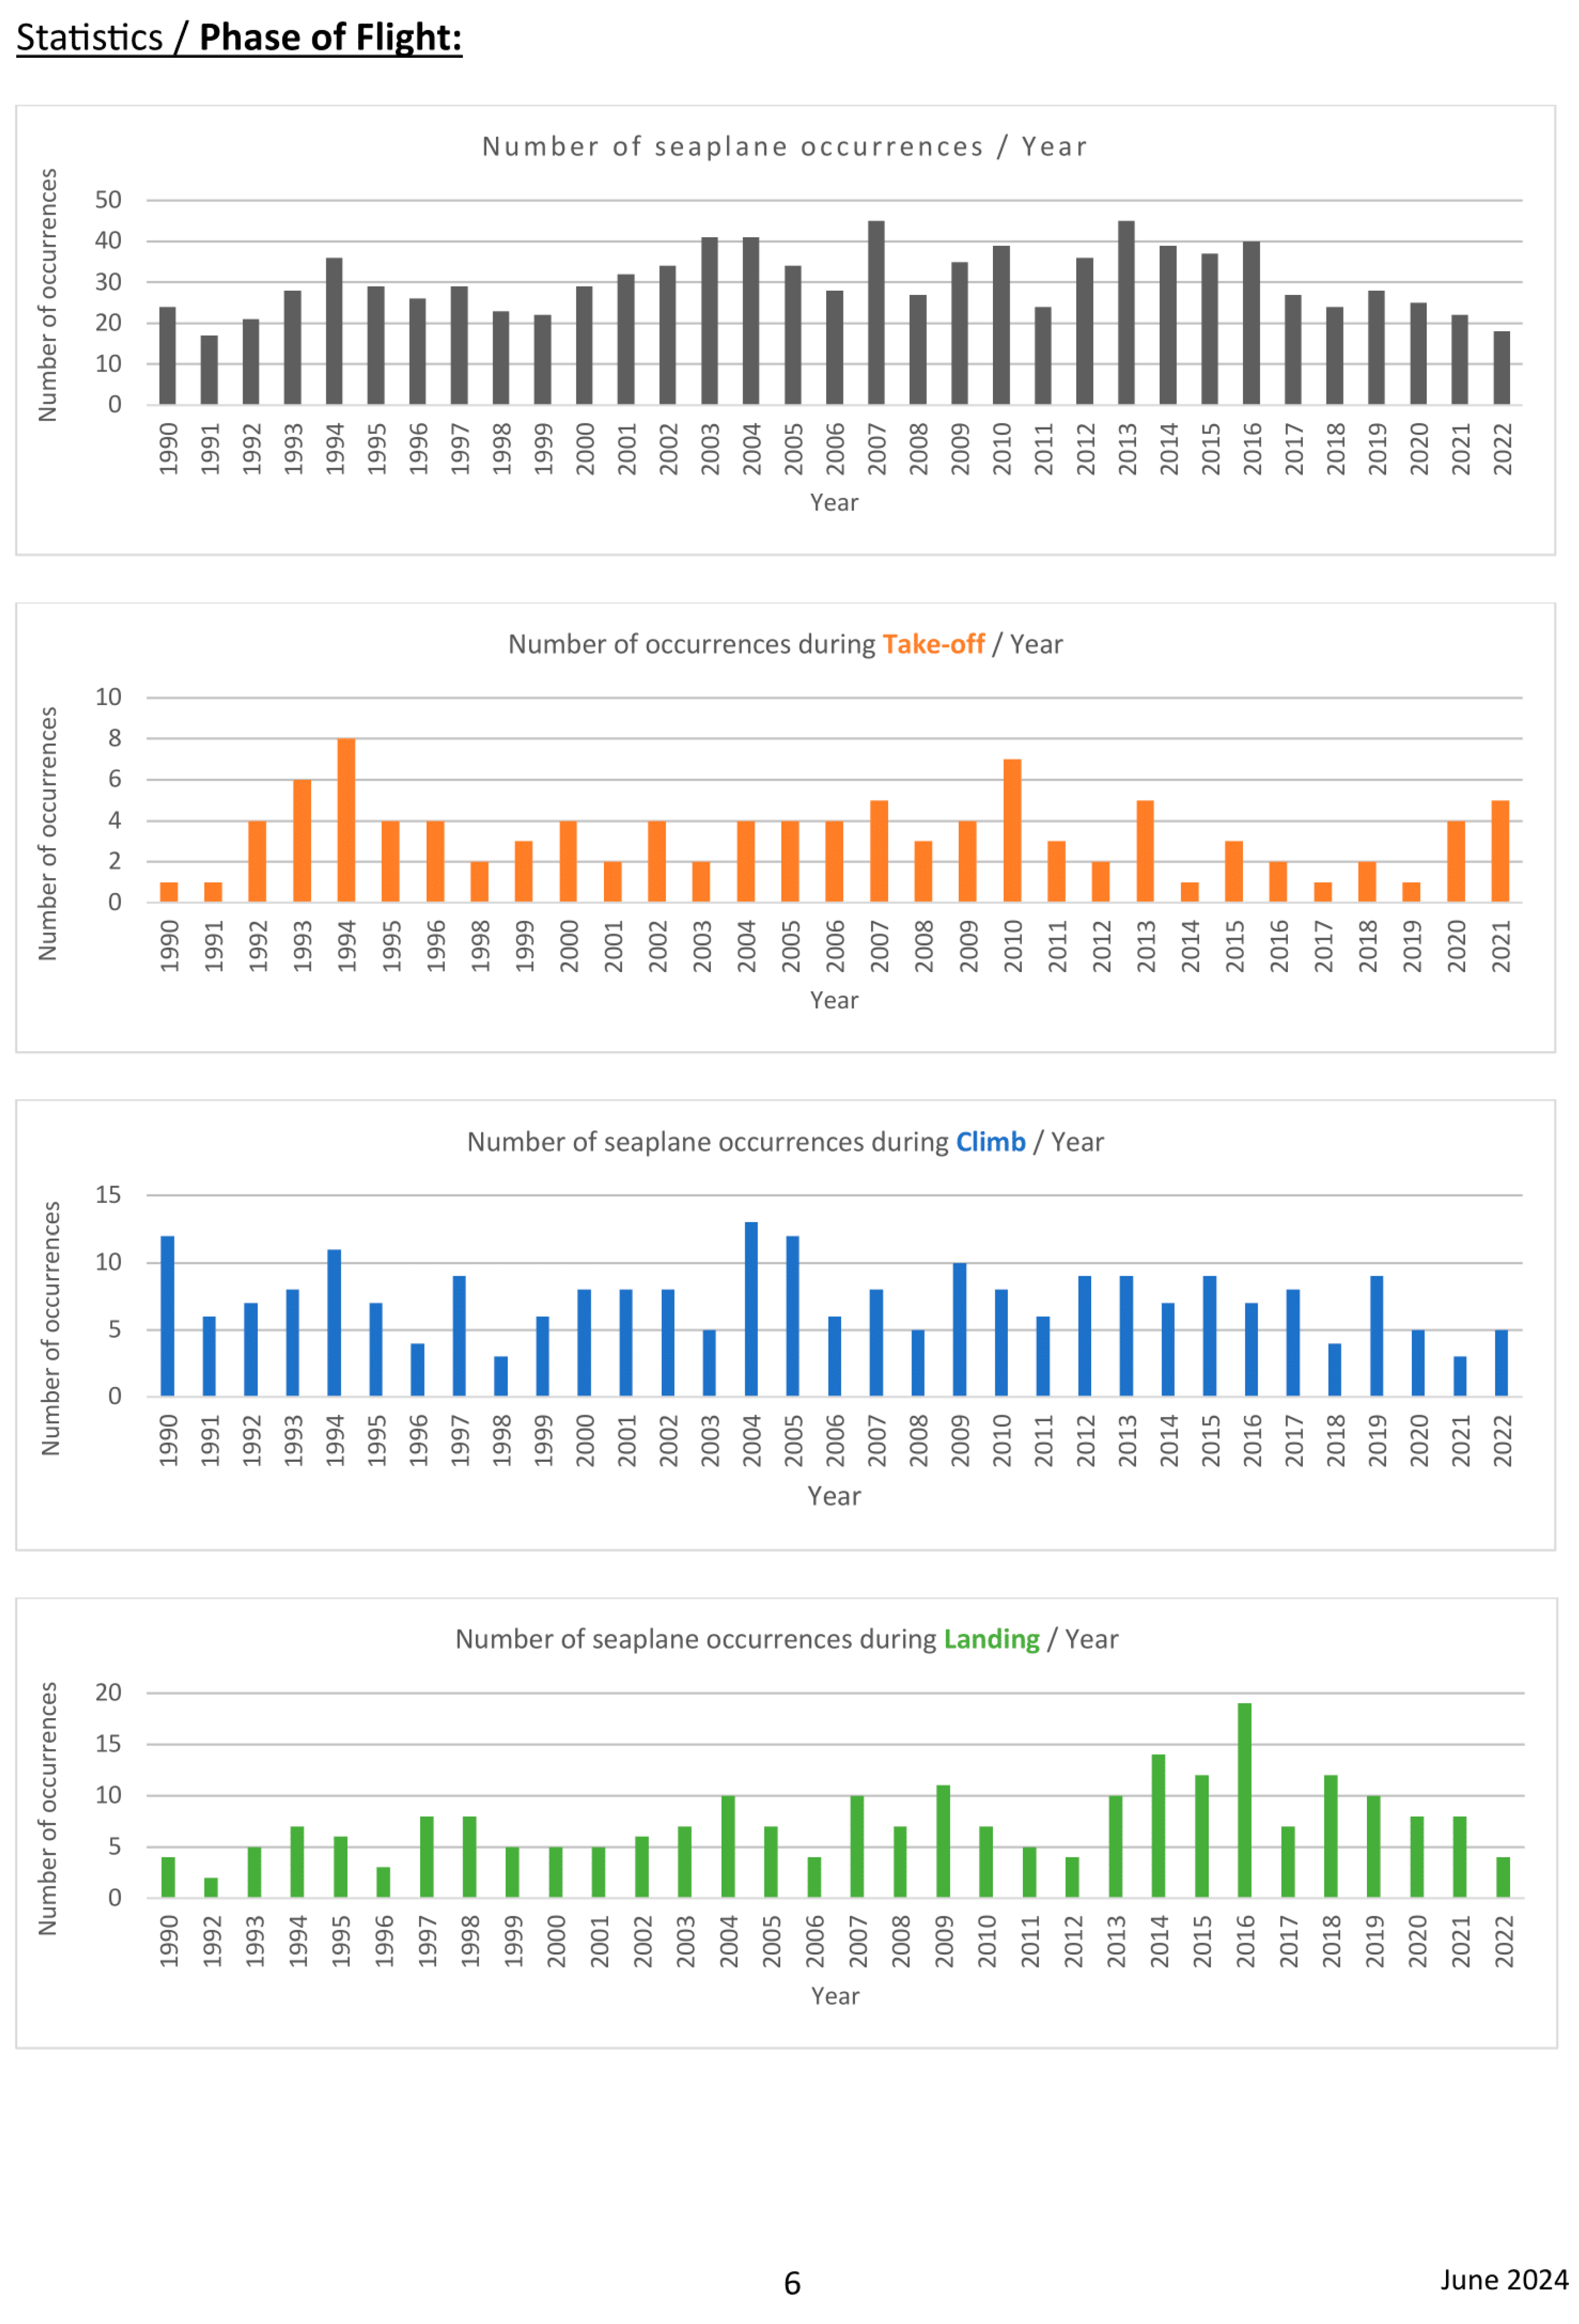
Figure 8 indicates that the landing phase is the most hazardous for private, recreational seaplane operations on water in Canada, accounting for 51.5% of occurrences. It has an increasing trend, with an average increase in the past decade, following a peak period between 2013 and 2019. The trendline for take-off (accounting for 22.75% of the occurrences) is slightly decreasing, with an increase in 2020-2021.
Figure 9 shows the number of occurrences during take-off for the studied period. It shows several peaks, indicating intermittent periods of increased risk. Despite a low profile for take-off in 2014-2019, the years 2020 and 2021 show the highest number of occurrences in the past decade years, despite restrictions on the general population due to the Covid-19 pandemic in those years. The data for landing shows an increasing trend in occurrences from around 2013 onwards, peaking notably in 2016. This indicates a possible shift in the underlying factors contributing to landing incidents, such as changes in operational procedures, increased seaplane activity, or variations in reporting practices.
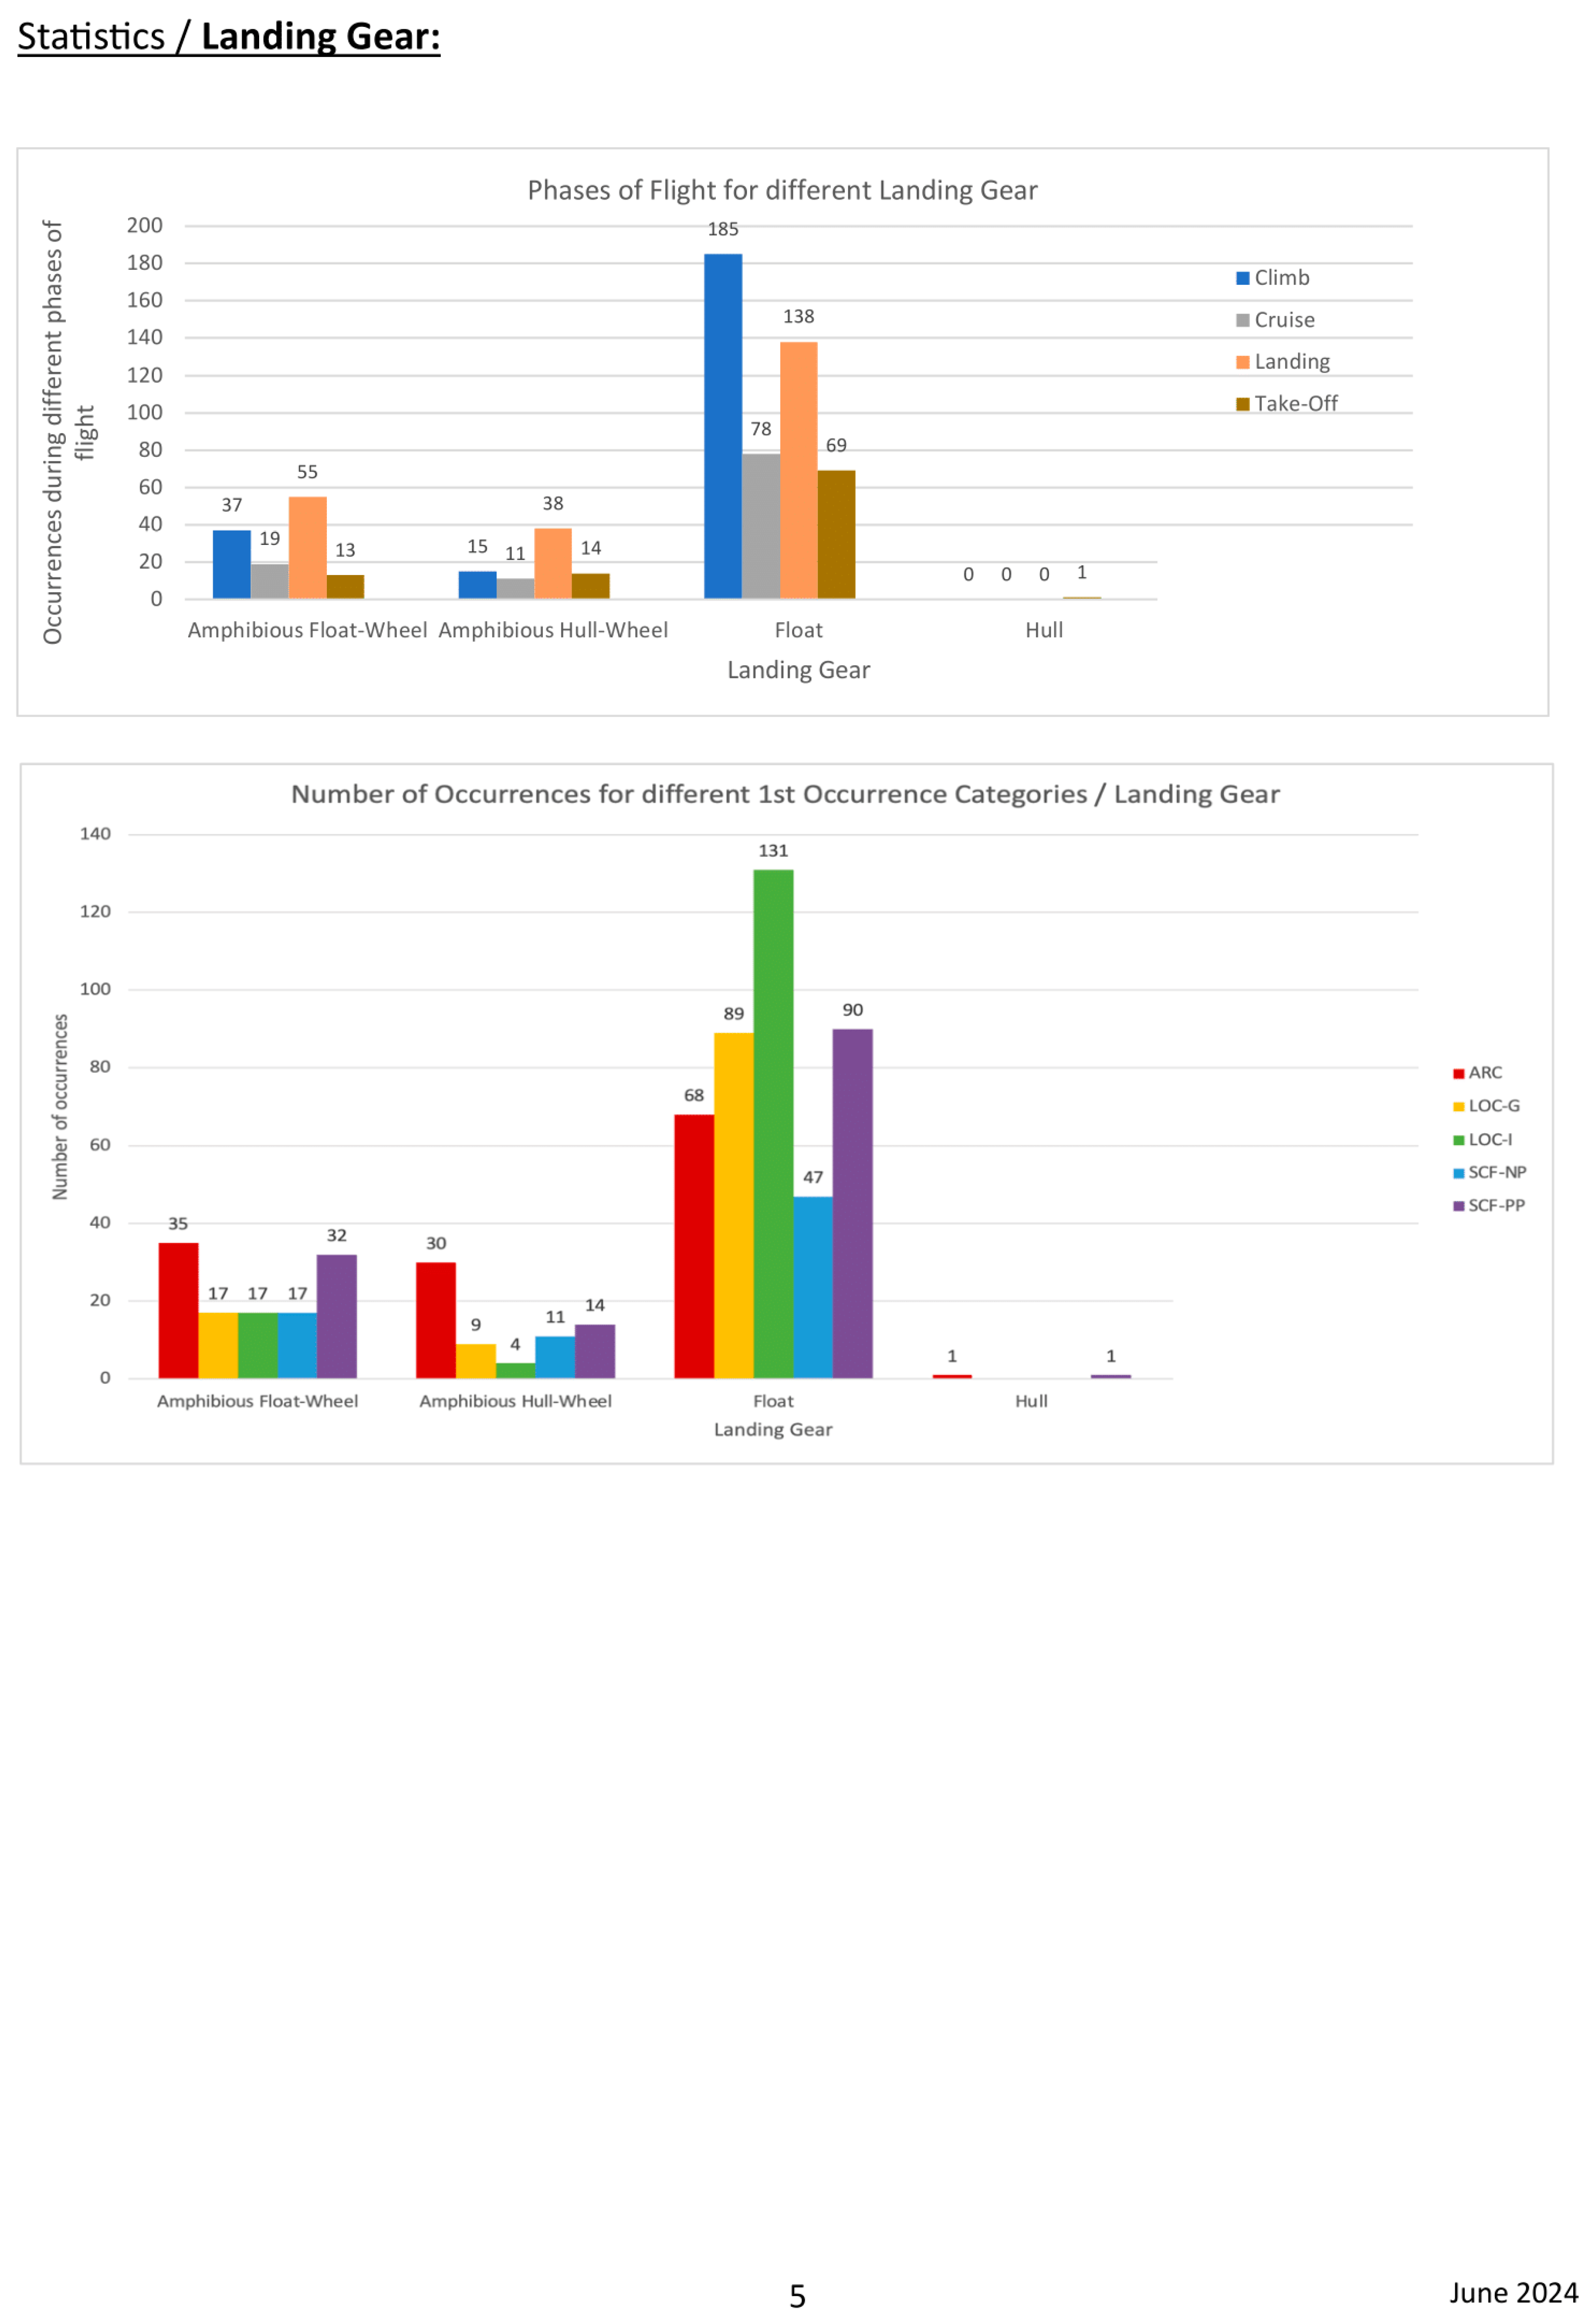
The distribution of the type of landing gear of the seaplanes involved in occurrences is 62.23% float and 32.83% amphibious (float-wheel and hull-wheel). The number of float seaplanes in Canada is expected to be higher than amphibious aircraft, though exact numbers could not be obtained, hence the difference in the number of occurrences for these categories. Figure 10 illustrates the number of occurrences for different occurrence categories, per different landing gear. It shows that float-equipped seaplanes have the highest number of occurrences across all categories, particularly in "LOC-G" (Loss of Control on Ground) with 28.62% of float occurrences. Amphibious float-wheel and hull-wheel configurations also show significant numbers of occurrences, albeit to a lesser extent. The most frequent types of occurrences for amphibious aircraft are: “ARC” (Abnormal Runway Contact) with 37.25% of amphibious occurrences.
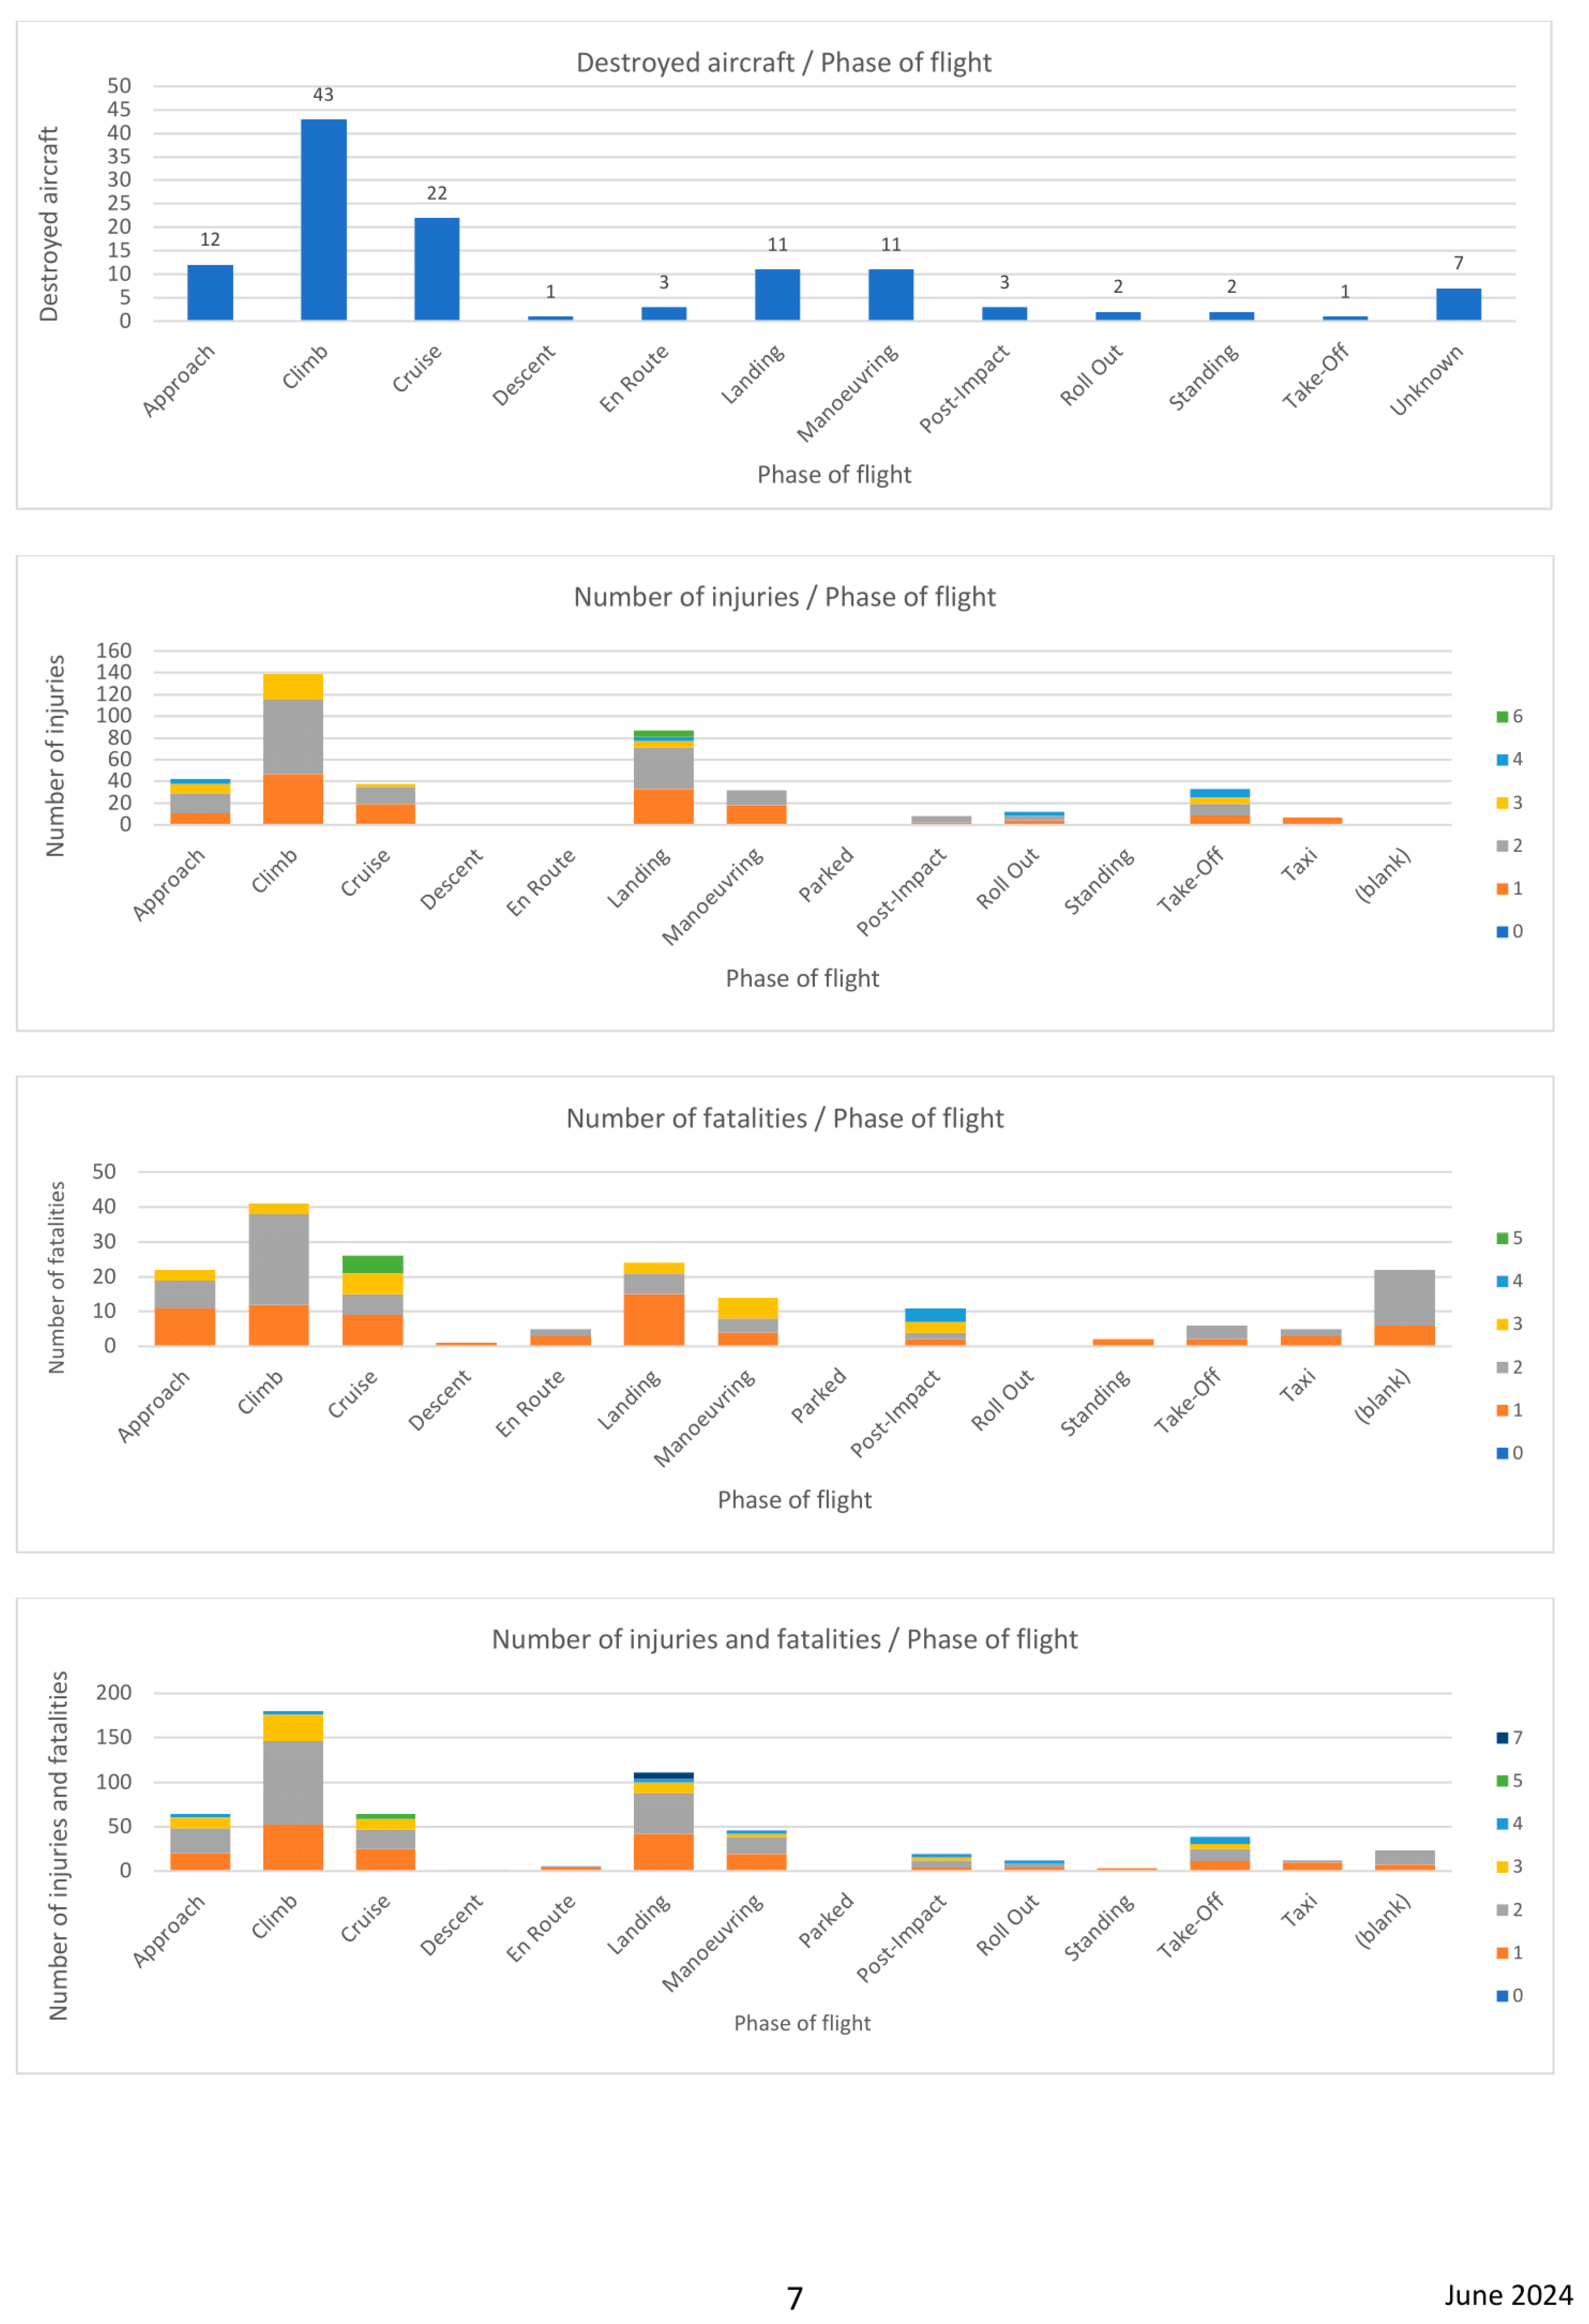
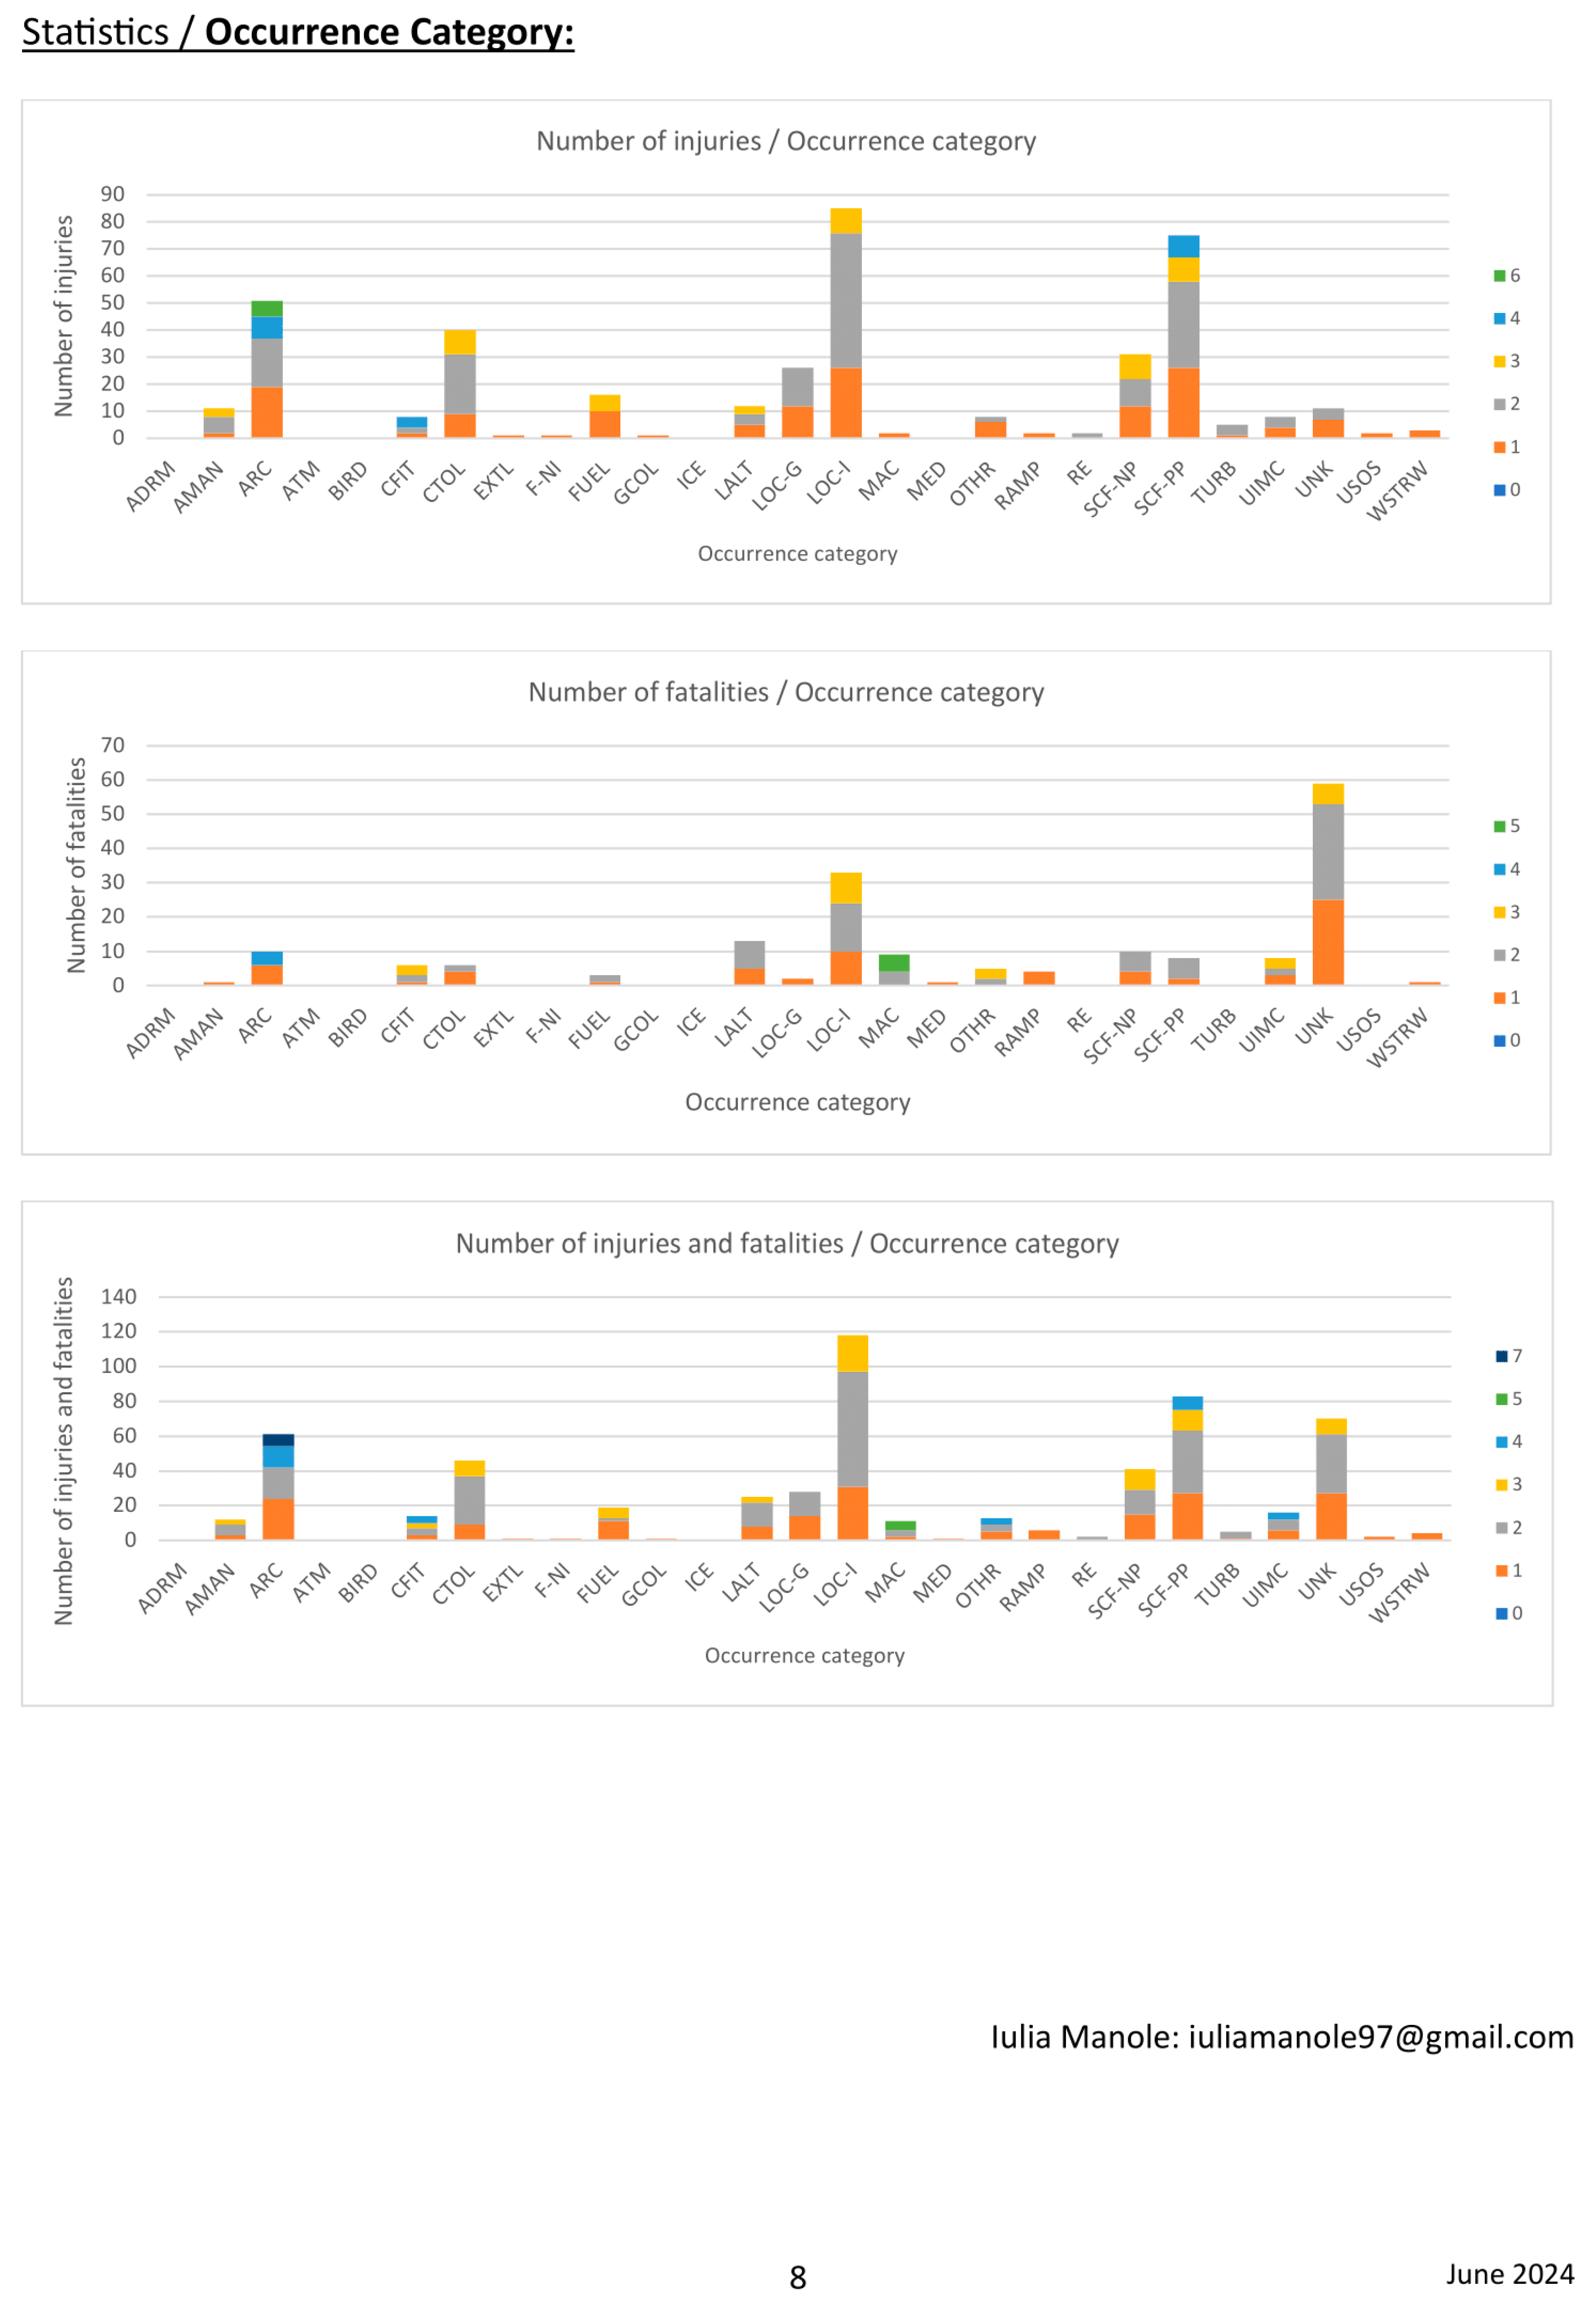
Between 1993 and 2022, private, recreational seaplane occurrences in Canada led to 179 fatalities and 401 injuries, out of which the on-water occurrences led to 37 fatalities and 140 injuries. Most injuries occurred after abnormal runway contact (31.43%), followed by loss of control on ground (15.71%) and engine failures (10%). When considering the number of fatalities, the majority occurred during unknown circumstances (35.14%), followed by abnormal runway contact and loss of control in flight (13.51% each).
The landing phase shows the highest number of injuries (62.14%) and fatalities (64.86%), followed by the take-off phase (23.57% of injuries and 16.22% of fatalities).
Figure 11 outlines the changes in the number of injuries and fatalities over the studied period, showing an increasing trendline in the number of injuries and a constant one for fatalities. Despite low numbers in 2021-2022, this figure indicates peak values every decade, each higher than the time period before, which is concerning for the safety of seaplanes on the water.
3.1.3. Contingency Analysis and Three-Way Associations
Results are obtained for 95% confidence level, for permutations of two or three of the parameters in Table 5. These have been recoded and converted into binary variables, as shown in Table 7.5-B, to help understand the meaning of the associations. In some cases, such as for the “Time” parameter which had many possible outcomes, these were grouped to reflect the part of the day (morning & evening, daytime and night-time) and therefore have only 3 possible outcomes. In other cases, such as for the “Phase of Flight” parameter, some possible outcomes were grouped into a “Other” binary variable, so that the focus can be on the phases of flight deemed of interest during the trend analysis. This was done in general for the least frequent outcomes, to avoid binary parameters with a low expected count, as those would not provide accurate results.
The results of this analysis are presented in Figure 12, which represents a heatmap of the relevant associations with 95% confidence level. The blue shades indicate moderate relationships, while the red shades indicate strong relationships.
Some findings that are similar to the findings already presented in the previous sections are excluded. Moreover, the associations where one of the parameters was daytime, May-October or non-amateur built were excluded, as it was previously determined that the majority of accidents and incidents happen then. Moreover, the “Other” categories have also been removed as they include combinations of less frequent variables.
Taking these into account, the main findings for strong relationships with a 95% confidence level are shown in Figure 12. As an example, there is a strong associations between amphibious aircraft being destroyed after occurrences during take-off or landing, or having substantial damage. However, occurrences of amphibian seaplanes during taxi are likely to not cause serious damage to the aircraft.
3.1.4. Summary of Quantitative Analysis
This section presented the analysis of private, recreational seaplane occurrences on water in Canada, based upon the methods outlined in Table 3. The dataset and its limitations have been defined, and data quality checks employed. For example, such limitations include the correlation between the number of occurrences and pilot experience, the inability to calculate accident rates, or factors such as pilot experience, decision making and critical thinking in adverse scenarios which are not captured by the dataset.
Despite these insights from safety data analysis, it is still insufficient if we wish to understand why such accidents happen in order to enhance the safety of this sector. The following section (Section 3.2) expands on this analysis and uses the results as the basis for collecting additional qualitative data from GA pilots.
3.2. Analysis of the Survey Responses
To supplement the quantitative analysis of the previous section, a mixed-methods approach based on qualitative data from interviews, focus groups and a questionnaire is analyzed in this section.
This study recruited 80 recreational seaplane pilots with varying degrees of experience (both in terms of years and hours flown). They range from under 20 to over 70 years in age, with the majority below the 50+ age range. A possible explanation for this could be that the population of seaplane pilots is decreasing, while at the same time they are currently likely to be working and thus unable to attend the interviews or focus groups. Moreover, their experience in flying seaplanes is not directly proportional to their age and has a better distribution: 32% of participants have over 30 years of experience flying seaplanes, indicating a highly experienced group. Other categories of seaplane flying experience include: 20% of participants with 6–10 years, 18% with under 2 years, 12% with 21–30 years, and smaller groups with 2–5 years (9%) and 11–20 years of experience (9%). This reflects a broad range of experience levels among participants, with a notable concentration of experienced pilots.
Data collection methods included online questionnaires, interviews, and focus groups, both in-person (22 participants) and online (29 participants). The study also engaged representatives from Canadian seaplane associations and Transport Canada, ensuring diverse stakeholder representation. Ethical considerations excluded minors and vulnerable populations to prioritize participant safety and consent.
This qualitative data was analyzed using thematic analysis [18,19]. This method was employed to identify safety concerns by refining and analyzing codes and themes (patterns) within the data, with the themes redefined to be consistent for all three methods of data collection used. By identifying and analyzing these themes, the concerns and experiences of seaplane pilots can be better understood and specific recurring issues can be addressed [20].
Before the start of the scenarios, the participants of the questionnaire were asked about personal safety concerns. The notable responses include concern over too many aircraft crashing and people killed, amphibious safety including landing gear configuration on landing, and concerns about pilot attitudes in general. The identified themes related to seaplane safety on the water are:
- i)
- training issues;
- ii)
- overreliance on technology;
- iii)
- hazards from boats and jet skis;
- iv)
- misuse of radios during private, recreational operations;
- v)
- environmental and fauna awareness;
- vi)
- mechanical reliability and safety.
Pilots emphasized the importance of real-world experience, citing it as a critical complement to theoretical knowledge in preparing them for unexpected situations. However, concerns were raised about overreliance on advanced systems like the G1000 avionics system, which was perceived to erode fundamental flying skills. Participants highlighted the need for training programs to strike a balance between teaching traditional piloting techniques and incorporating modern technologies, as excessive dependence on technology could lead to problems if it fails. The interplay of these themes points to a decline in basic flying skills, with a call to adapt training methods to address this challenge effectively.
Regarding the hazards imposed by boats and jet skis, seaplane pilots expressed significant concerns about their unpredictable movements, with jet skis and boats towing tubes often changing direction erratically, creating dangerous situations during take-off and landing. Pilots recounted near collisions and emphasized that many boat operators are unaware of the risks they pose to seaplanes, particularly during critical flight phases. To mitigate these hazards, pilots often delay landings or choose less congested areas, though these strategies are not always feasible. The presence of boats and jet skis adds considerable stress and anxiety to seaplane operations, leading to calls for regulatory adjustments to prioritize aircraft during take-off and landing. Additionally, pilots highlighted the importance of understanding maritime regulations to navigate busy waterways safely.
For seaplane operations on water, the lack of consistent radio use among pilots poses significant risks. Pilots often fail to announce their intentions and positions, leading to missed communications and increasing the likelihood of misunderstandings and accidents. This issue is exacerbated by a culture of "silent operations," particularly among older pilots unaccustomed to relying on radios. The absence of proper radio communication heightens the risk of collisions, especially in areas with mixed traffic, as it becomes difficult to coordinate with other seaplanes and watercraft. Furthermore, the lack of radio use reduces situational awareness, with pilots recounting incidents where unannounced aircraft suddenly appeared during critical flight phases, endangering operations.
Environmental awareness also plays a critical role in ensuring safety of seaplanes on the water. Unpredictable weather conditions pose significant challenges, requiring pilots to have strong forecasting skills and the ability to adapt to sudden changes. Wildlife hazards, including birds and marine animals, are another notable concern during take-off and landing, as wildlife strikes can be dangerous and demand constant vigilance. Additionally, glassy water conditions present unique difficulties, such as misjudging distances and visual references, which can lead to errors during landing. These environmental factors emphasize the need for heightened awareness, thorough training, and careful planning to mitigate risks in seaplane operations.
Finally, for mechanical reliability and safety, pilots highlighted that engine failures, especially during take-off, represent a significant hazard, emphasizing the importance of dependable engines. Maintenance lapses exacerbate safety risks, underscoring the need for diligent upkeep. Reliable equipment is essential, as failures can lead to severe consequences. To ensure safety and instill pilot confidence, the participants emphasized that operators must prioritize regular maintenance and invest in high-quality, dependable equipment.
4. Discussion
The findings of this study highlight critical safety challenges associated with private, recreational seaplane operations on Canadian waters, incorporating both quantitative data analysis and qualitative survey responses. By employing this mixed-methods approach, a nuanced understanding of the risks and contributing factors associated with seaplane occurrences has been provided. The implications of these findings are discussed in the context of previous studies and broader safety management systems (SMSs), emphasizing the need for targeted safety interventions and future research.
4.1. Interpretation of Results in Context of Previous Studies
The analysis revealed that loss of control and abnormal runway contact are the predominant causes of seaplane occurrences on Canadian waters, accounting for over half of the recorded occurrences. This aligns with findings from Gao [6] and Vidan et al. [7], which emphasized operational and environmental challenges unique to seaplanes. Unlike commercial seaplane operations, which benefit from rigorous regulatory oversight and advanced training protocols, private recreational activities often operate in less controlled environments with diverse pilot experience levels, increasing the risk of such incidents.
The data also indicate that landing remains the most hazardous phase of on-water seaplane operations, accounting for over half of all accidents and incidents. This corroborates international studies, including those focusing on Croatian seaplane operations, which identified landing as a critical phase due to its reliance on both waterway conditions and pilot proficiency [7]. However, this paper uniquely highlights an increasing trend in landing-related incidents in recent years, suggesting that additional factors such as operational changes or reporting practices may play a role.
The persistent challenge of obtaining detailed data, particularly for private recreational seaplanes, is consistent with Ison’s [16] observations regarding the lack of comprehensive records on flight hours, pilot experience, and seaplane operations. This gap underscores the need for enhanced data collection mechanisms to support more accurate risk assessments and safety interventions.
4.2. Broader Implications
From a broader perspective, the study highlights the intersection of maritime and aviation safety, where dual operational environments create unique challenges for seaplane operations. The increasing trend in private recreational occurrences, particularly involving amateur-built aircraft, raises concerns about regulatory oversight and safety education in this sector. Addressing these gaps requires collaboration between aviation and maritime authorities to establish integrated safety management systems (SMS) that consider the dual nature of seaplanes. The findings also underscore the importance of reporting near-misses and minor incidents, which often go unreported but provide valuable insights into potential hazards. Enhanced reporting frameworks could significantly improve the understanding of seaplane safety and inform the development of targeted interventions.
Mitigating risks from boats and jet skis requires raising boater awareness about seaplane operations through community outreach and collaboration with maritime authorities. Regulatory adjustments giving aircraft priority during take-off and landing, along with clear right-of-way rules communicated to both pilots and boaters, can reduce conflicts. Education on maritime regulations is essential for safer shared waterways. Thus, pilots should be trained to recognize high-traffic water areas and apply effective avoidance tactics using standardized protocols.
To address the issue of insufficient training quality, the minimum mandatory course durations could be extended, and mandatory proficiency checks could be implemented, as well as using detailed checklists to ensure pilots meet required standards before flying solo. To combat any decline in skills due to over-reliance on technology, training programs should balance advanced system use with manual flying techniques, emphasizing hands-on experience. Updating the Seaplane Rating document to cover unsafe scenarios and spreading training over diverse conditions will better prepare pilots. Incorporating real-world flying exercises, simulated emergencies, and theoretical-practical integration should be mandatory as they can further enhance pilot readiness. Additionally, offering insurance discounts for pilots completing extra safety-related courses can incentivize further training and improve overall safety standards.
4.3. Future Research Directions
While this study provides critical insights, several areas warrant further exploration. Future research on seaplane safety should prioritize comprehensive data collection, focusing on seaplane movements, pilot experience and operational contexts, particularly in private, recreational activities. Incorporating GPS tracking and automated reporting systems could enhance data accuracy.
Studies relating to amateur-built aircraft are also essential, exploring design, construction, and operational practices through collaborations with manufacturers and pilot associations. Furthermore, expanding this research to other countries could provide a comparative analysis across different regions with established seaplane industries. Additionally, deeper exploration of human factors, including pilot decision-making, cognitive biases, and stress management is crucial to address the role of human error in seaplane occurrences.
5. Conclusions
This study has emphasized the unique safety challenges associated with seaplane operations on Canadian waters, particularly in the private and recreational sectors. Unlike their commercial counterparts, private seaplane pilots operate in less regulated environments, increasing exposure to risks related to pilot experience, water conditions, and interactions with maritime traffic. The findings underscore the need for a holistic approach to safety management that integrates both aviation and maritime principles.
Raising safety awareness within the seaplane community requires active engagement through in-person events like seminars, workshops, and focus groups, which have proven effective based on positive participant feedback. Encouraging community involvement in safety initiatives fosters a strong safety culture, supported by awareness programs sharing practical tips through social media, newsletters, and seasonal emails. Additionally, collaboration with industry stakeholders, including regulatory bodies, training organizations, and seaplane operators, is essential for developing standardized safety protocols and sharing resources to enhance safety education.
Ultimately, addressing seaplane safety on water requires ongoing research, policy adjustments, and proactive engagement with all stakeholders. By implementing targeted safety interventions and fostering a culture of awareness and preparedness, future efforts can contribute to safer waterways for seaplane pilots, passengers, and the broader maritime community.
Author Contributions
Conceptualization, I.M. and A.M.; methodology, I.M.; software, I.M.; validation, I.M. and A.M; formal analysis, I.M.; investigation, I.M.; resources, I.M.; data curation, I.M.; writing—original draft preparation, I.M.; writing—review and editing, I.M. and A.M.; visualization, I.M.; supervision, I.M. and A.M.; project administration, I.M.; funding acquisition, I.M. All authors have read and agreed to the published version of the manuscript.
Funding
This research was funded by Lloyd’s Register Foundation NEST Fund, grant number N21\100025.
Institutional Review Board Statement
The study was conducted in accordance with the Declaration of Helsinki, and approved by the Institutional Review Board (or Ethics Committee) of Imperial College London.
Informed Consent Statement
Informed consent was obtained from all subjects involved in the study.
Data Availability Statement
The seaplane accident/incident data has been made available by the collaborators in Transport Canada.
Acknowledgments
The authors would like to thank Simon Garrett from Transport Canada and the Seaplane Working Group of Transport Canada for their invaluable help with the facilitation of interviews, focus groups and their support in shaping the online questionnaire. The authors would also like to thank Lloyd’s Register Foundation for sponsoring this research.
Conflicts of Interest
The authors declare no conflicts of interest. The funders had no role in the design of the study; in the collection, analyses, or interpretation of data; in the writing of the manuscript; or in the decision to publish the results.
Appendix A
Figures, Tables, etc. should be labeled starting with “A”—e.g., Figure A1, Figure A2, etc.
This appendix presents the documents approved by the Imperial College ethics committee through the Research Governance and Integrity Team (RGIT). It includes:
- Research protocol
- Participant information sheets (for interviews and survey)
- Consent forms (for interviews and survey)
- Booklets (one to provide information related to data analysis which is kept by the participant and another with multiple choice questions kept by the investigator)
- Online questionnaire.
1. Research protocol
2. Participant Information Sheet – Interviews


3. Participant Information Sheet – Survey


4. Consent Form – Interviews
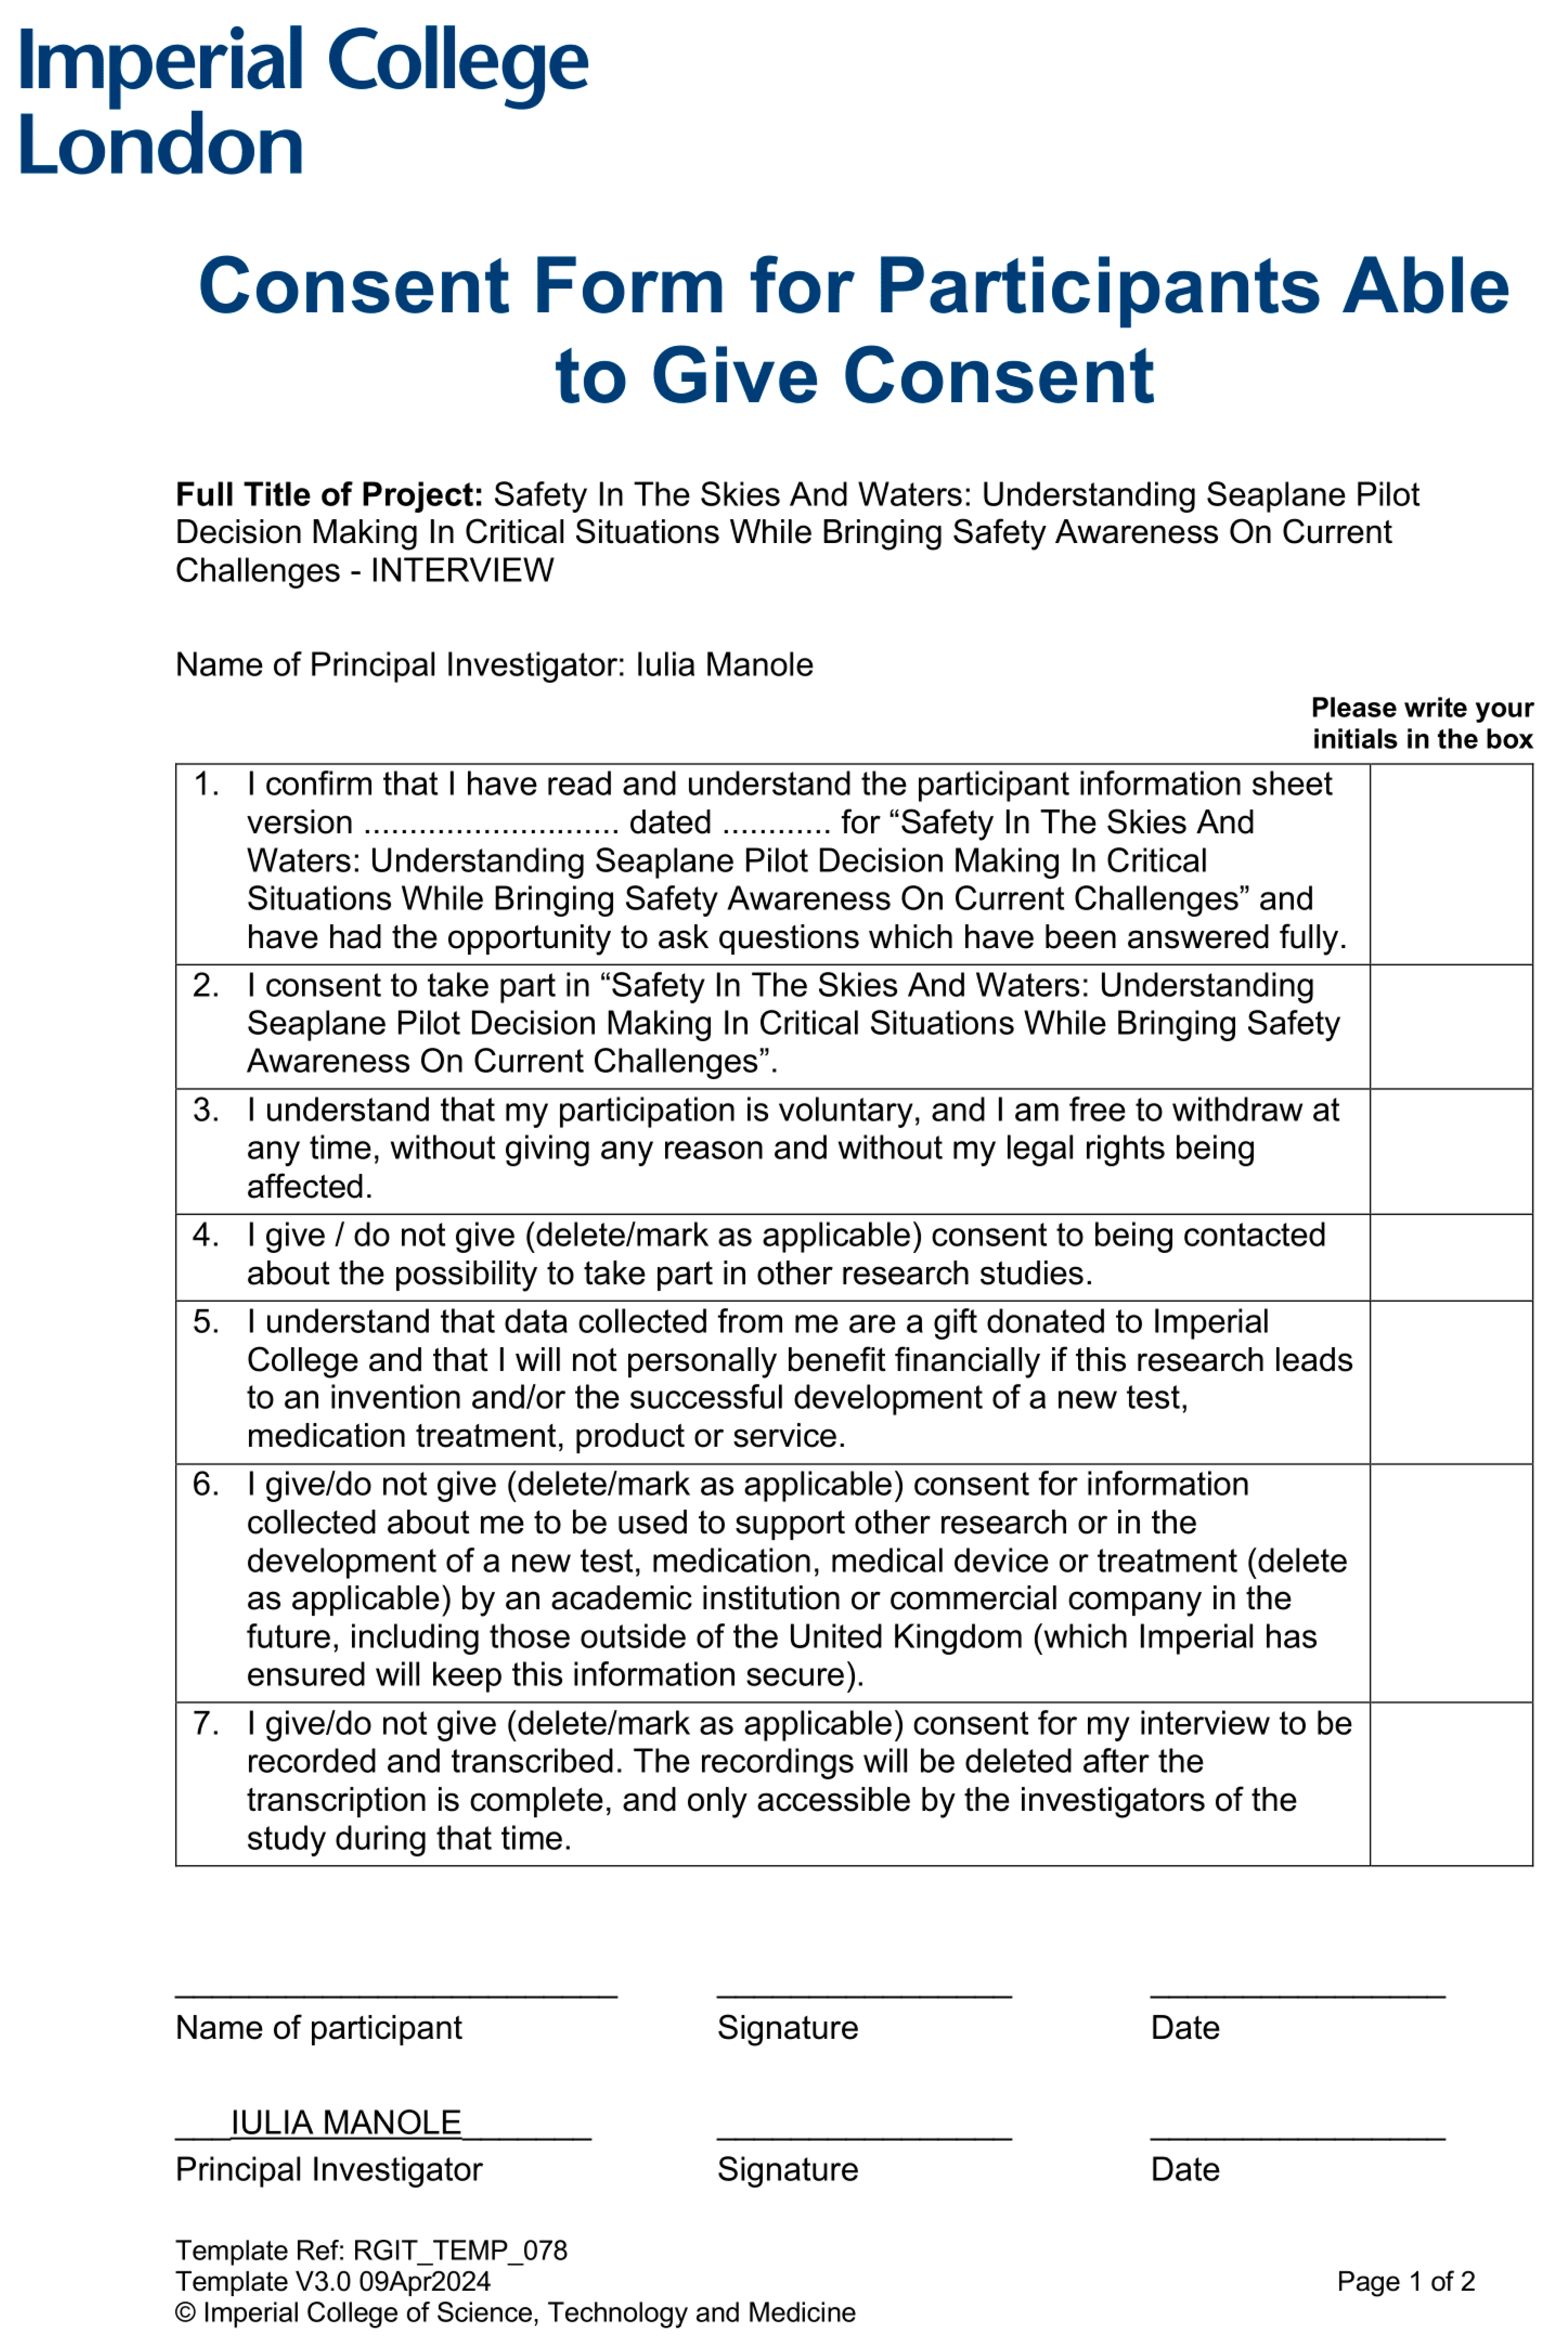

5. Consent Form – Survey
6. Booklet 1 (to provide information related to data analysis which is kept by the participant)
7. Booklet 2 (multiple choice questions kept by the investigator)
8. Online questionnaire

References
- Department for Transport (DfT)., (2016a). Guidance: Port Marine Safety Code. United Kingdom. https://www.gov.uk/government/publications/port-marine-safety-code.
- Celik, M., Selcuk, C., (2009). Analytical HFACS for Investigating Human Errors in Shipping Accidents. Accident Analysis & Prevention, 41(1), 66-75. [CrossRef]
- Hetherington, C., Flin, R., Mearns, K., (2006). Safety in shipping: the human element. Journal of Safety Research, 37(4), 401-411. [CrossRef]
- International Civil Aviation Organization (ICAO)., (2015). Asia Pacific Regional Guidance on Requirements for the Design and Operations of Water Aerodromes for Seaplane Operations. https://www.icao.int/APAC/Documents/edocs/APAC%20Guidance%20on%20WA%20for%20Seaplane%20Operations.pdf.
- International Maritime Organisation (IMO)., (1972). Convention on the International Regulations for Preventing Collisions at Sea, 1972 (COLREGs). https://www.imo.org/en/About/Conventions/Pages/COLREG.aspx.
- Gao, L. (2014). Research on risk analysis of seaplane in Sanya Port and countermeasures. Master of Science in Maritime Affairs. Maritime Safety & Environment Management. Dalian, China.
- Vidan, P., Slišković, M., & Očašić, N. (2016). Seaplane Traffic in the Republic of Croatia.
- Goblet, V., Fala, N., Marais, K., (2015). Identifying Phases of Flight in General Aviation Operations. 15th AIAA Aviation Technology, Integration, and Operations Conference. [CrossRef]
- CAST/ICAO Common Taxonomy Team (CICTT)., (2013). Definitions and Usage Notes – Phase of Flight. https://www.intlaviationstandards.org/Documents/PhaseofFlightDefinitions.pdf.
- Irwin, A., Sedlar, N., Hamlet, O., (2019). Flying solo: General aviation pilot risk perception and decision-making. doi:10.31234/osf.io/7buv4.
- CAST/ICAO Common Taxonomy Team (CICTT)., (2014). Definitions and Usage Notes – Hazard. https://www.intlaviationstandards.org/Documents/HazardDefinitions.pdf.
- CAST/ICAO Common Taxonomy Team (CICTT)., (2011). Definitions and Usage Notes - Aviation Occurrence Categories. https://www.icao.int/SAM/Documents/2017-SSP-BOL/CICTT%20Occurrence%20Category.pdf.
- Wilke, S., Majumdar, A., & Ochieng, W. Y. (2015). The impact of airport characteristics on airport surface accidents and incidents. National Safety Council, 53, 63-75. http://doi.org/10.1016/j.jsr.2015.03.006.
- Uebersax, D. (2014). Assumptions and Limitations of Chi-Squared Tests.
- Plummer, K. (2014). What is a phi coefficient?. https://www.slideshare.net/plummer48/what-is-a-phi-coefficient.
- Ison, D.C., (2024). A Quantitative Analysis of Seaplane Accidents from 1982-2021. International Journal of Aviation, Aeronautics, and Aerospace, 11(2). [CrossRef]
- Transport Canada (TC). (2023). Report an incident affecting airport or aerodrome safety. Date modified: 2023-06-08. https://tc.canada.ca/en/aviation/operating-airports-aerodromes/report-incident-affecting-airport-aerodrome-safety.
- Savin-Baden, M., & Howell Major, C. (2013). Qualitative Research: The Essential Guide to Theory and Practice (1st ed.). Routledge. [CrossRef]
- Major, C.H., Savin-Baden, M., Haynes, S., (2022). A Practical Guide to Qualitative Research. Routledge.
- Glaser, B.G., Strauss, A.L., (1967). Discovery of grounded theory: Strategies for qualitative research. New York: Aldine De Gruyter.
Figure 1.
Methodology used for the study of seaplane safety on Canadian waters.
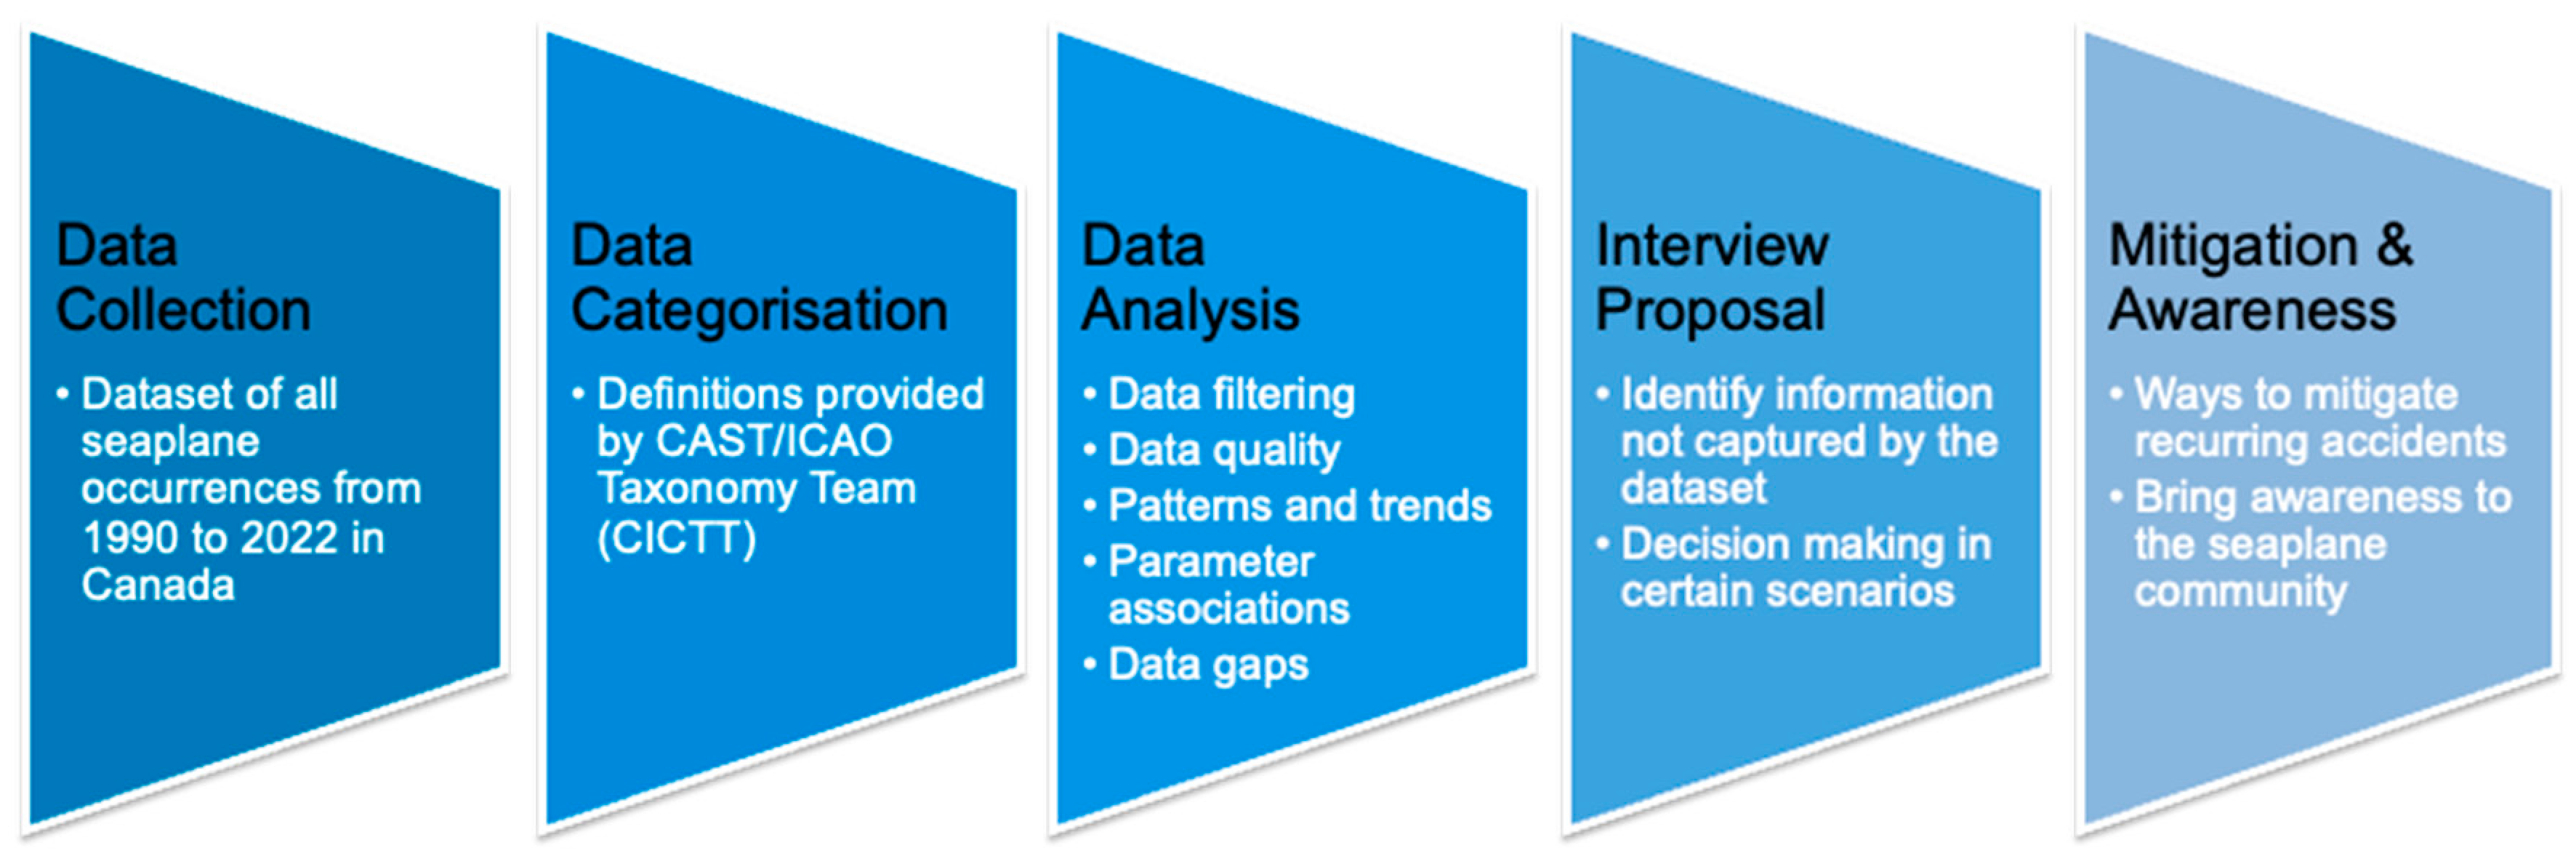
Figure 2.
Illustration of the typical phases of flight of a seaplane, excluding Maneuvering, En Route, Post-Impact and Unknown.
Figure 2.
Illustration of the typical phases of flight of a seaplane, excluding Maneuvering, En Route, Post-Impact and Unknown.
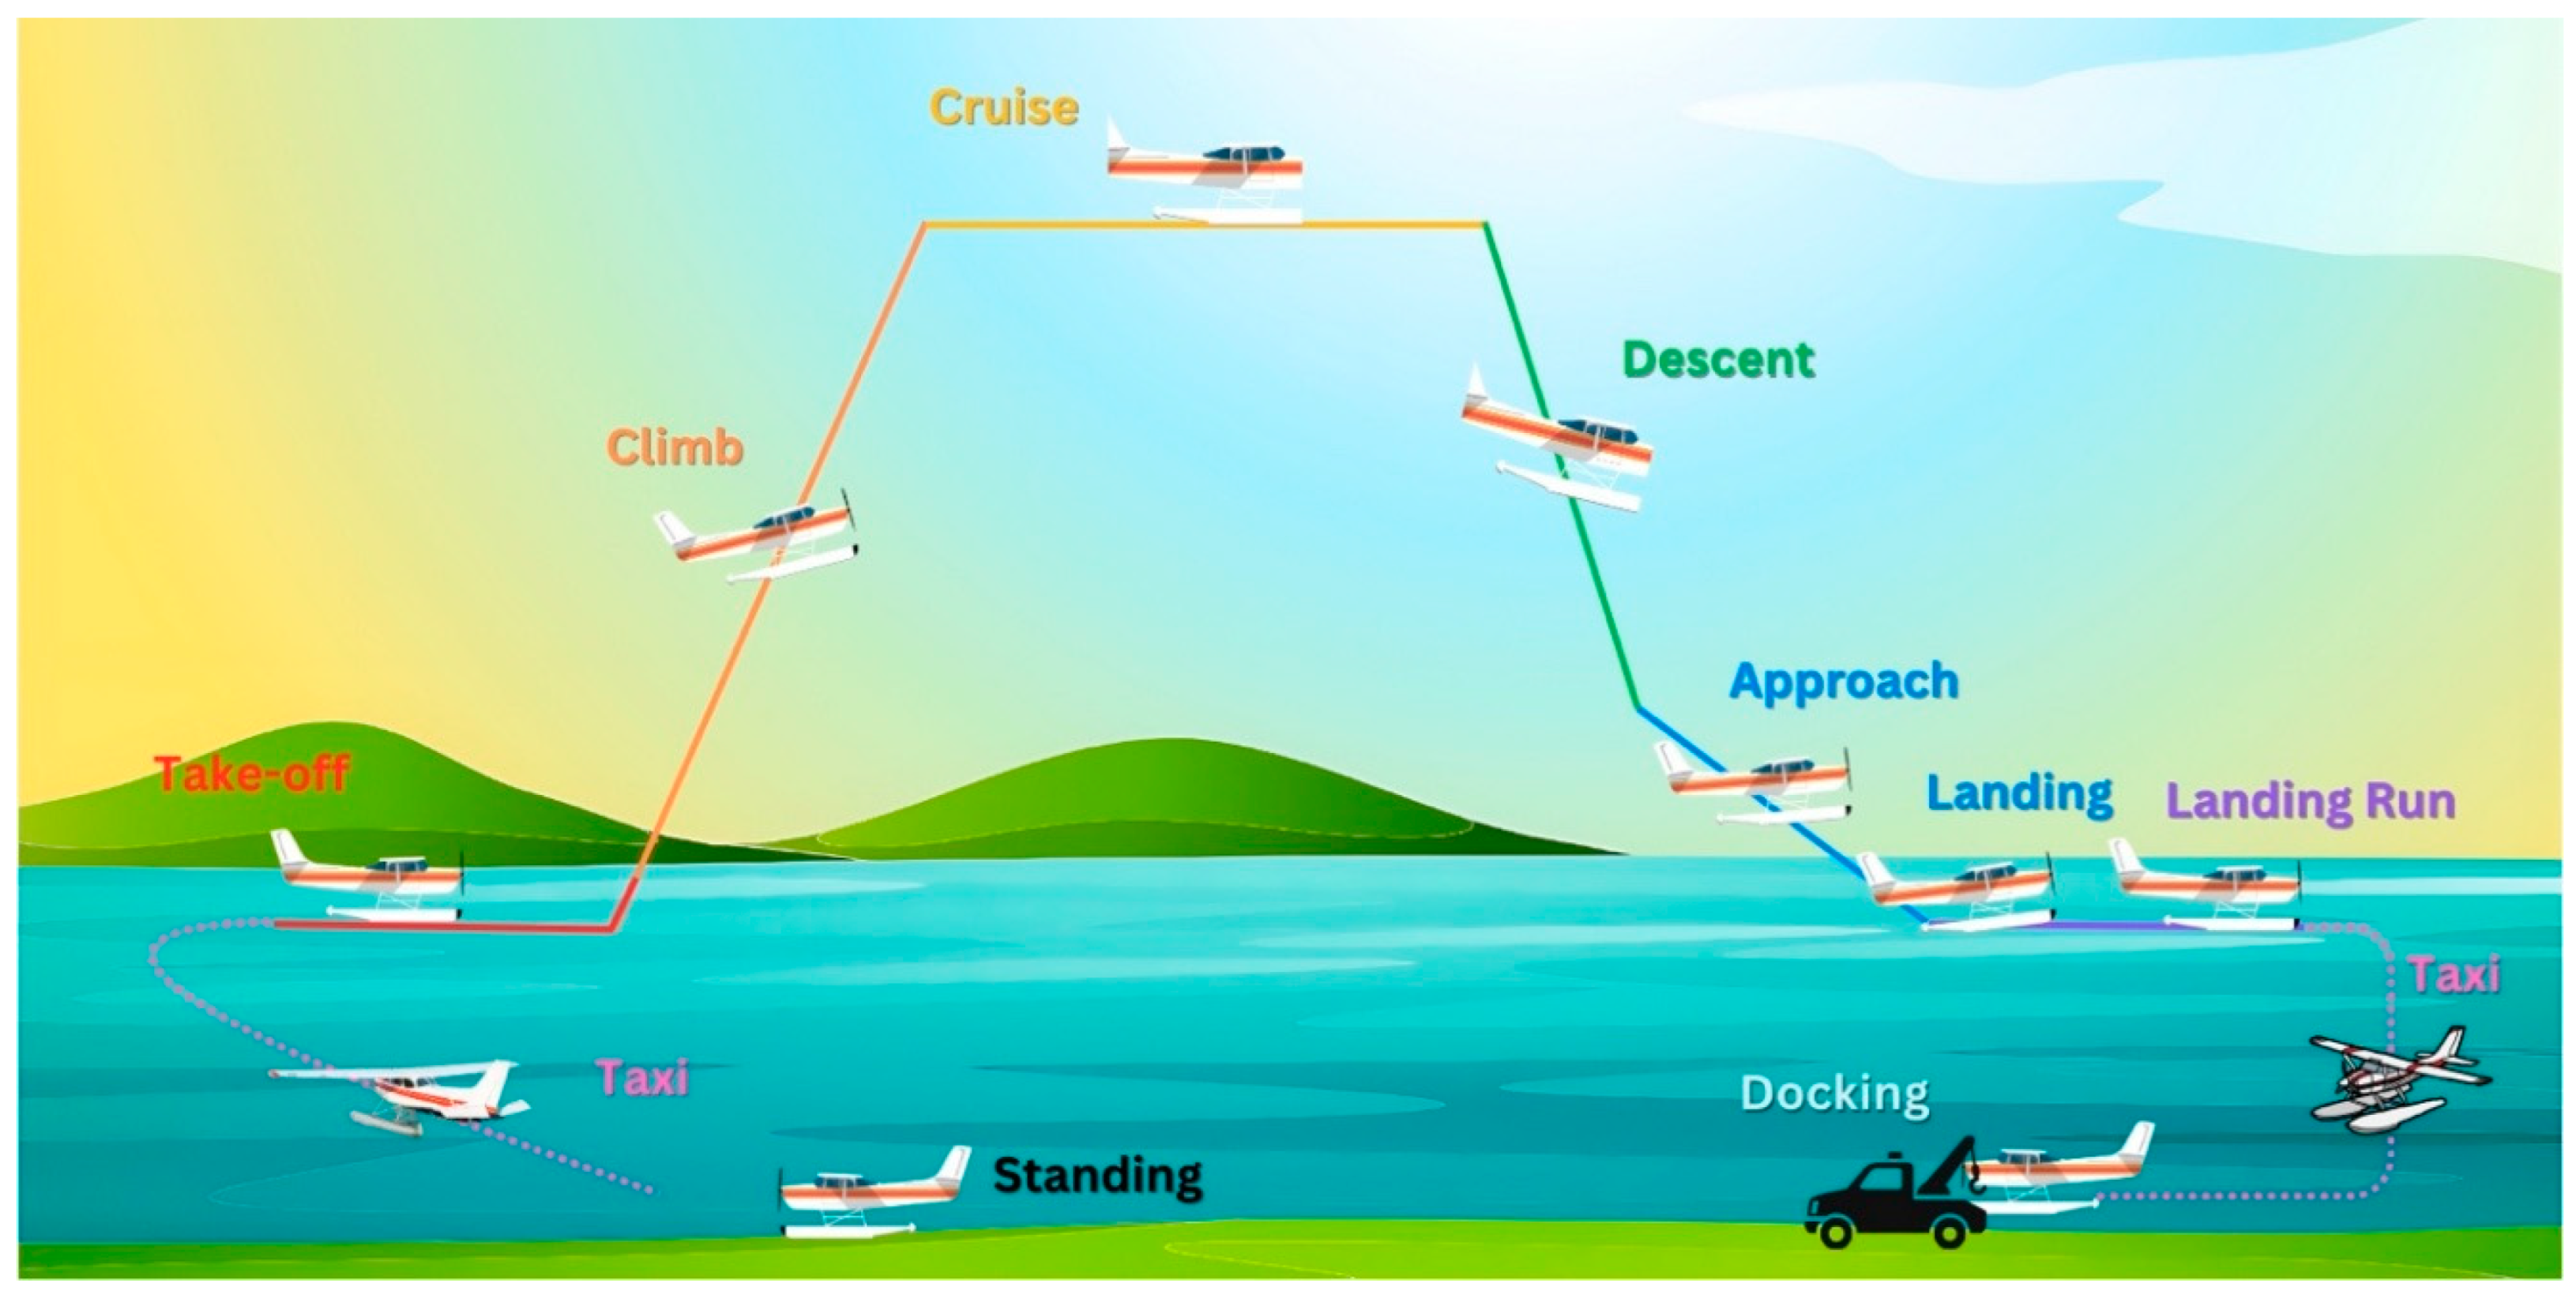
Figure 3.
Distribution of the yearly number of seaplane occurrences in Canada.
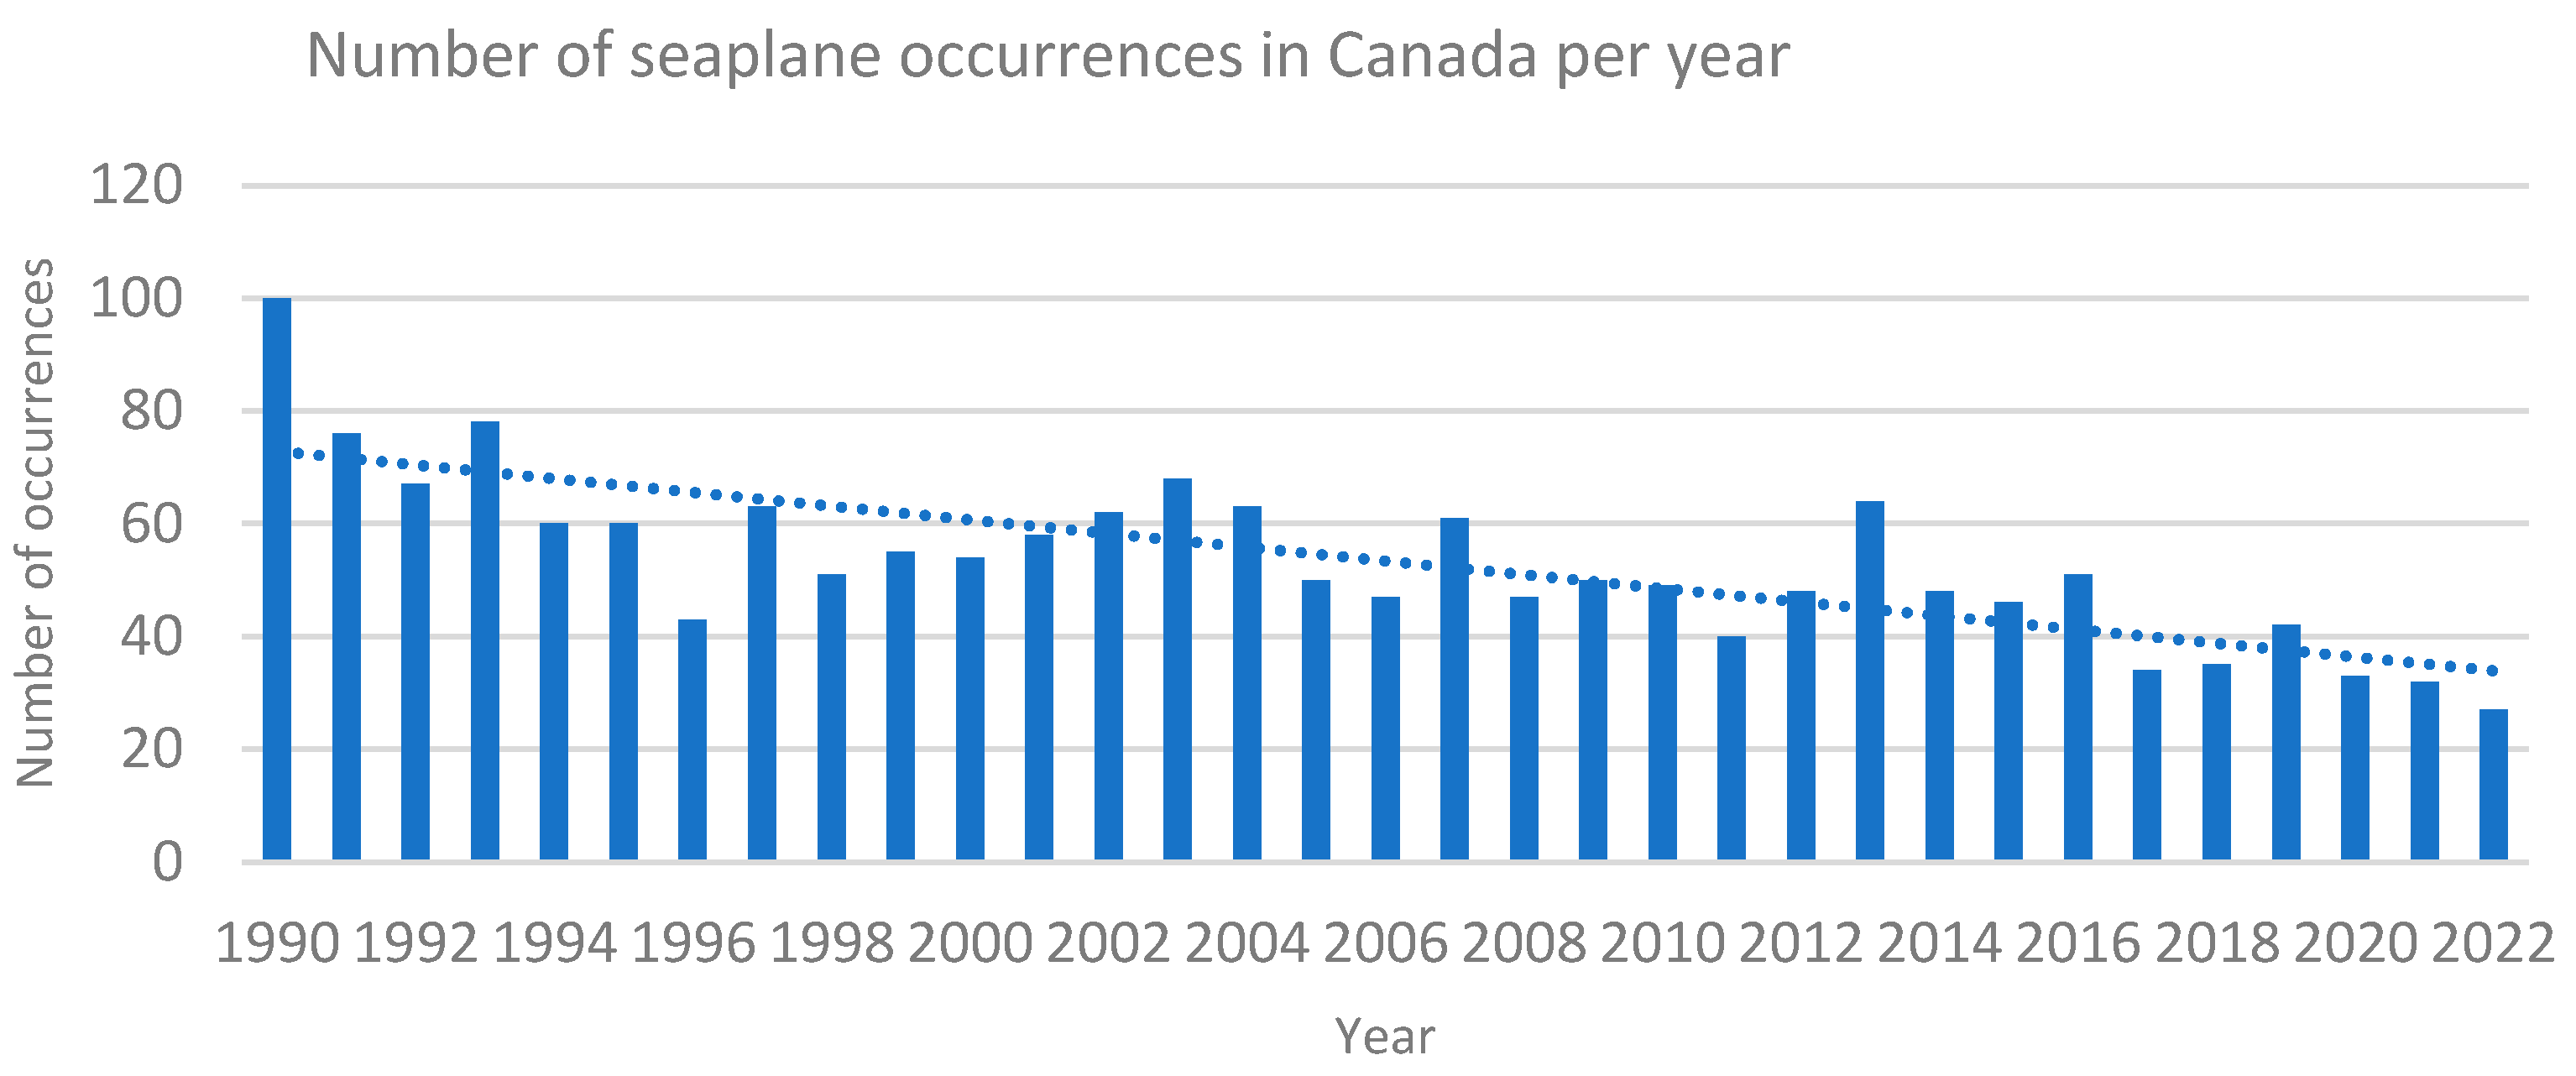
Figure 4.
Distribution of the yearly number of seaplane occurrences in Canada for private, recreational on-water operations.
Figure 4.
Distribution of the yearly number of seaplane occurrences in Canada for private, recreational on-water operations.
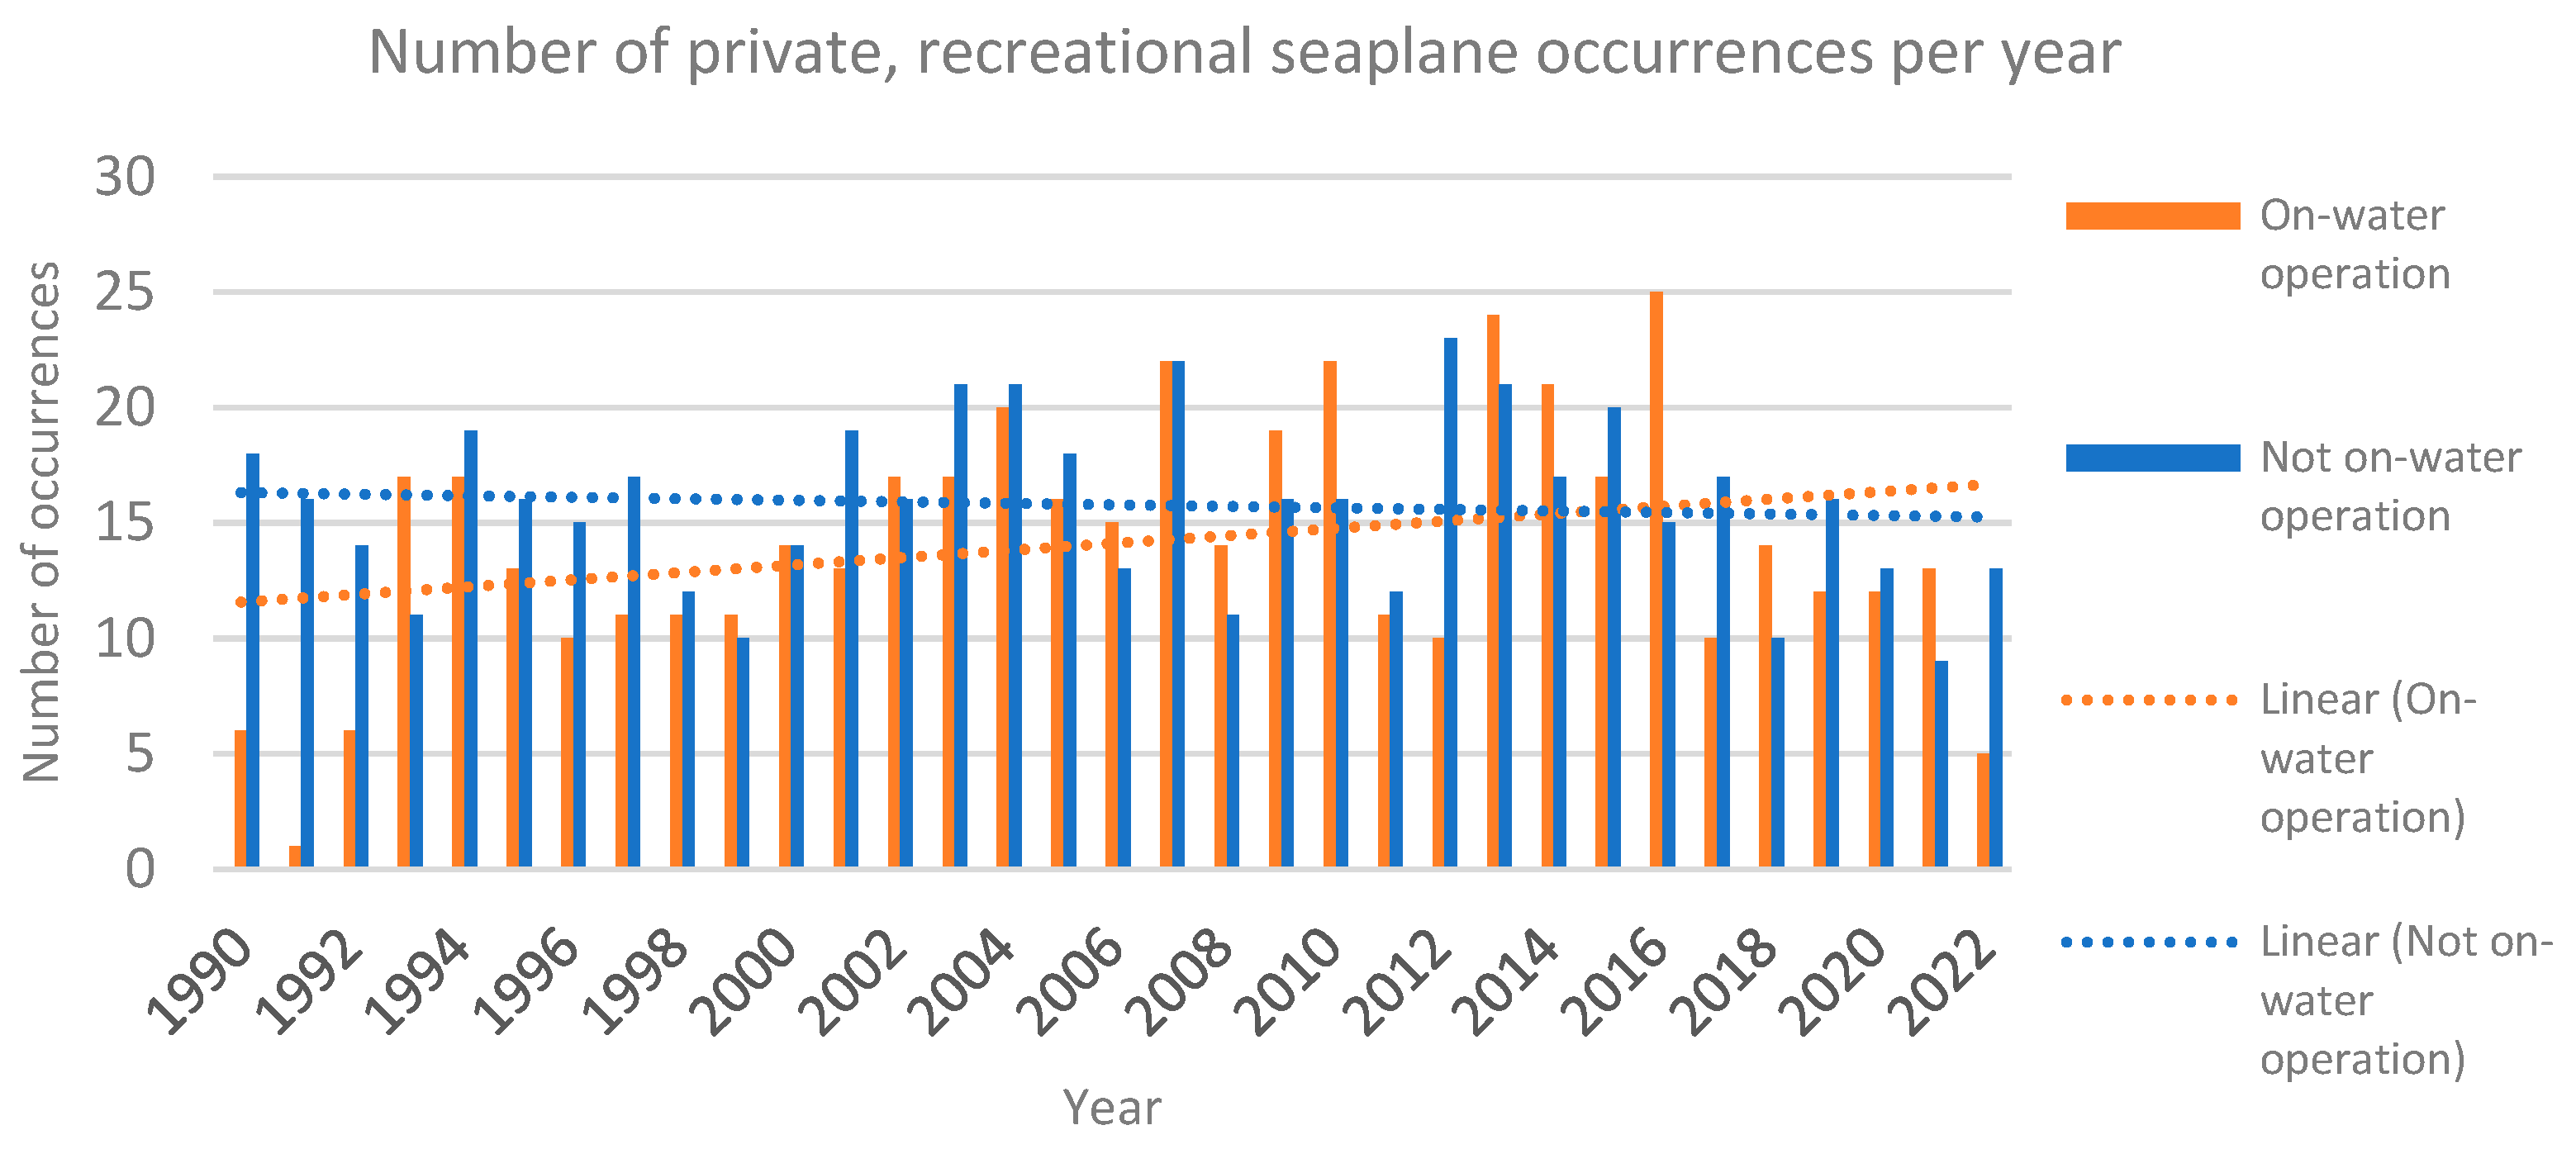
Figure 5.
Number of injuries and fatalities per year, for private, recreational, on-water seaplane operations in Canada.
Figure 5.
Number of injuries and fatalities per year, for private, recreational, on-water seaplane operations in Canada.
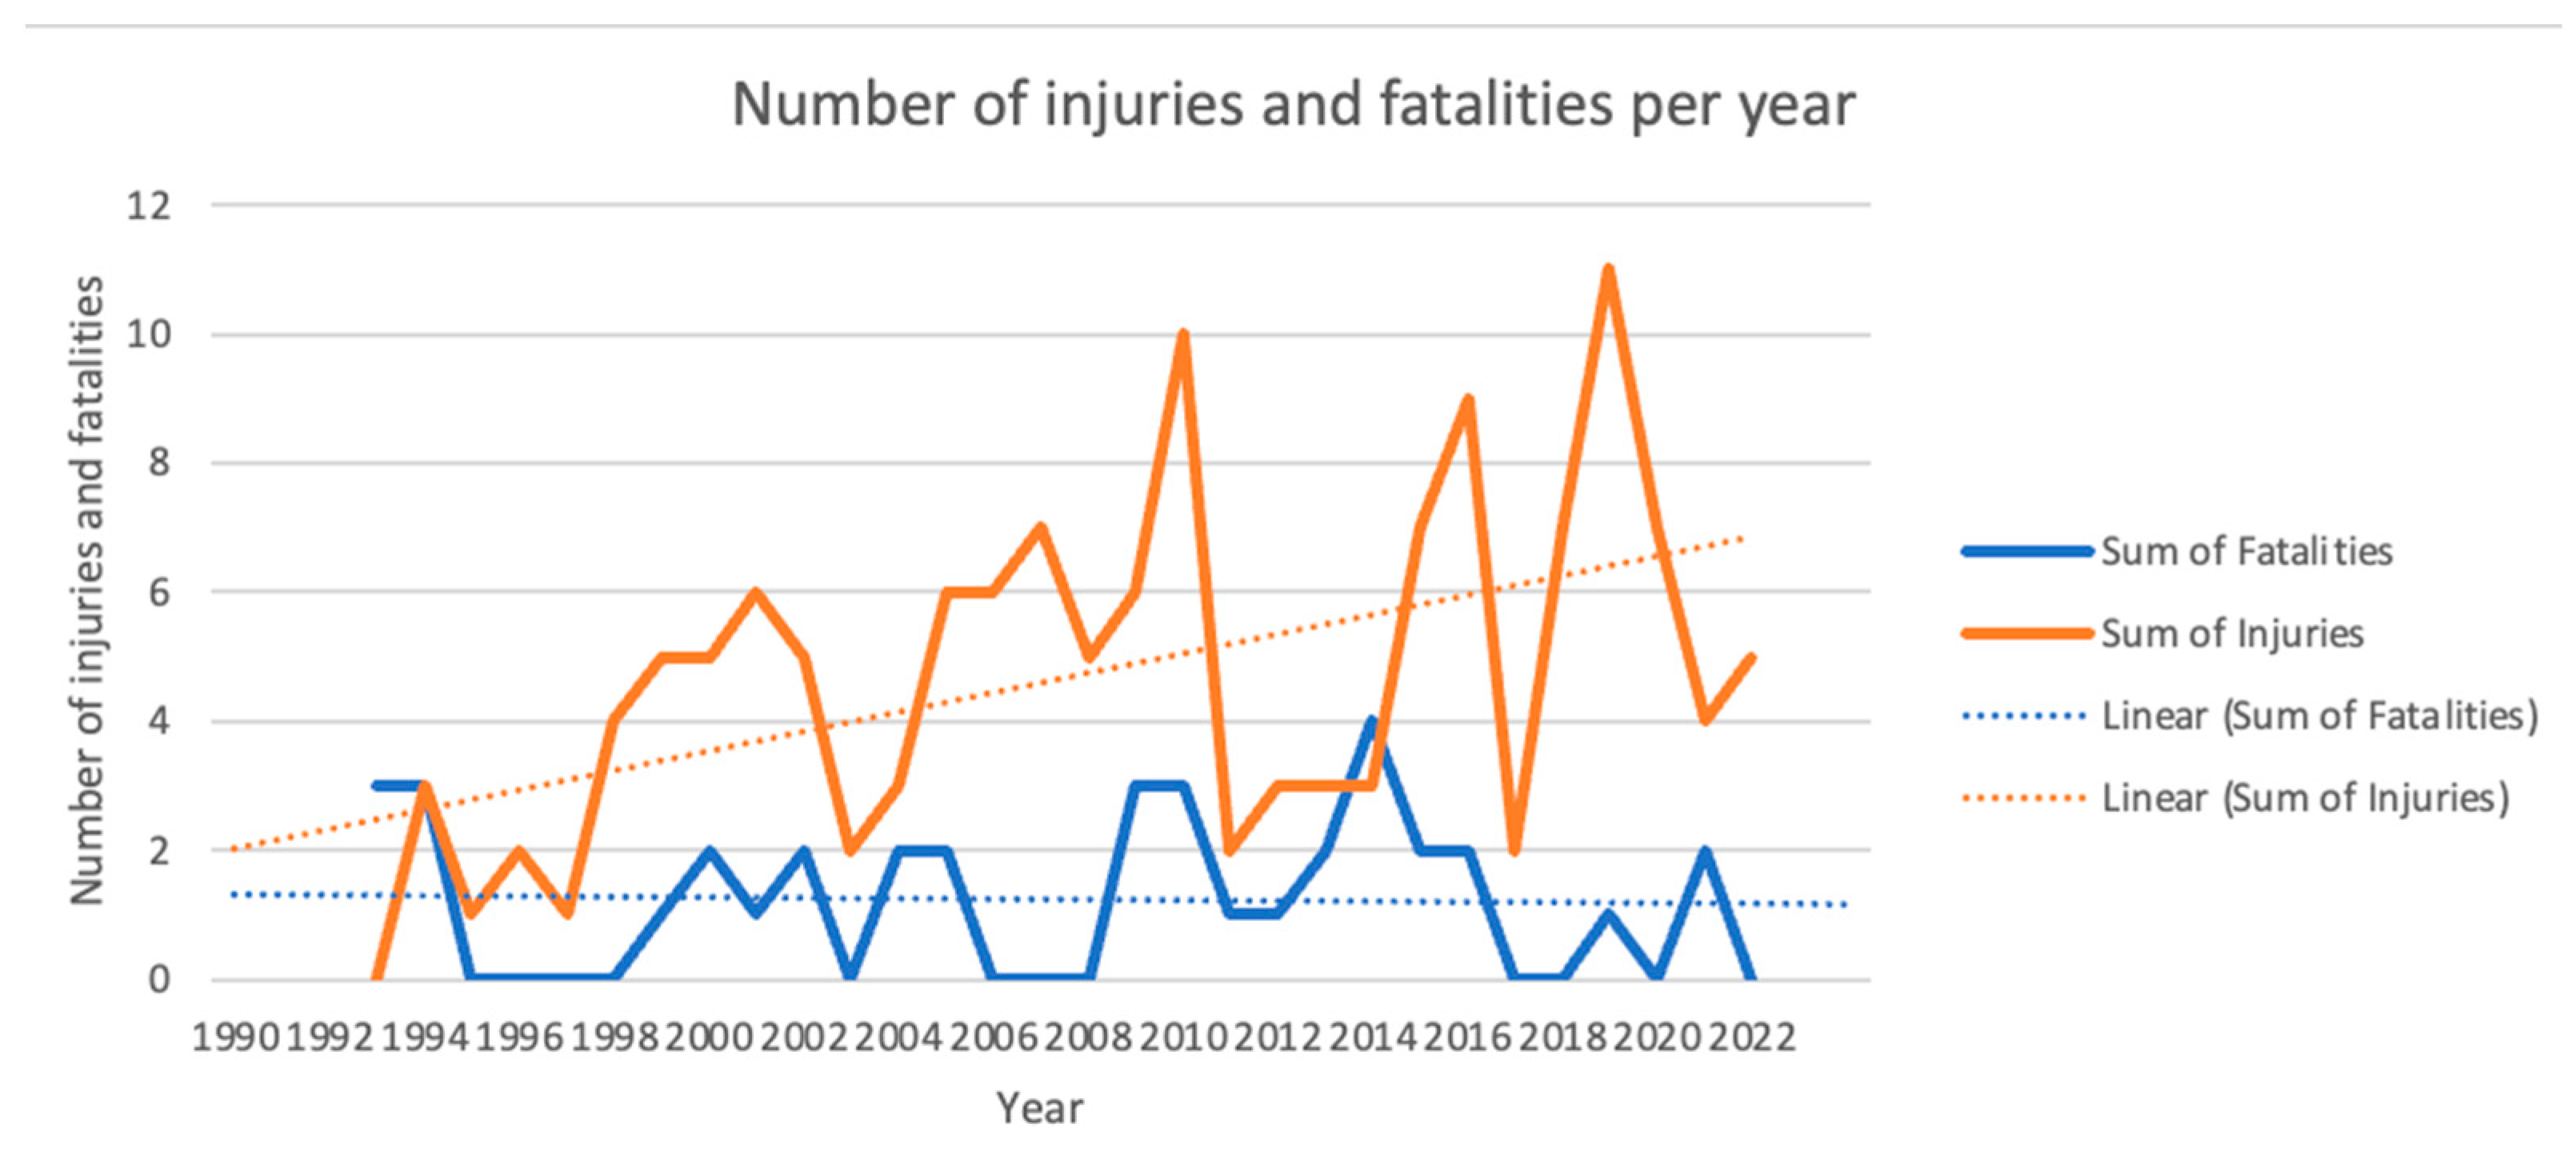
Figure 6.
Number of occurrences per year for private, recreational on-water seaplane operations using amateur built aircraft, in Canada.
Figure 6.
Number of occurrences per year for private, recreational on-water seaplane operations using amateur built aircraft, in Canada.
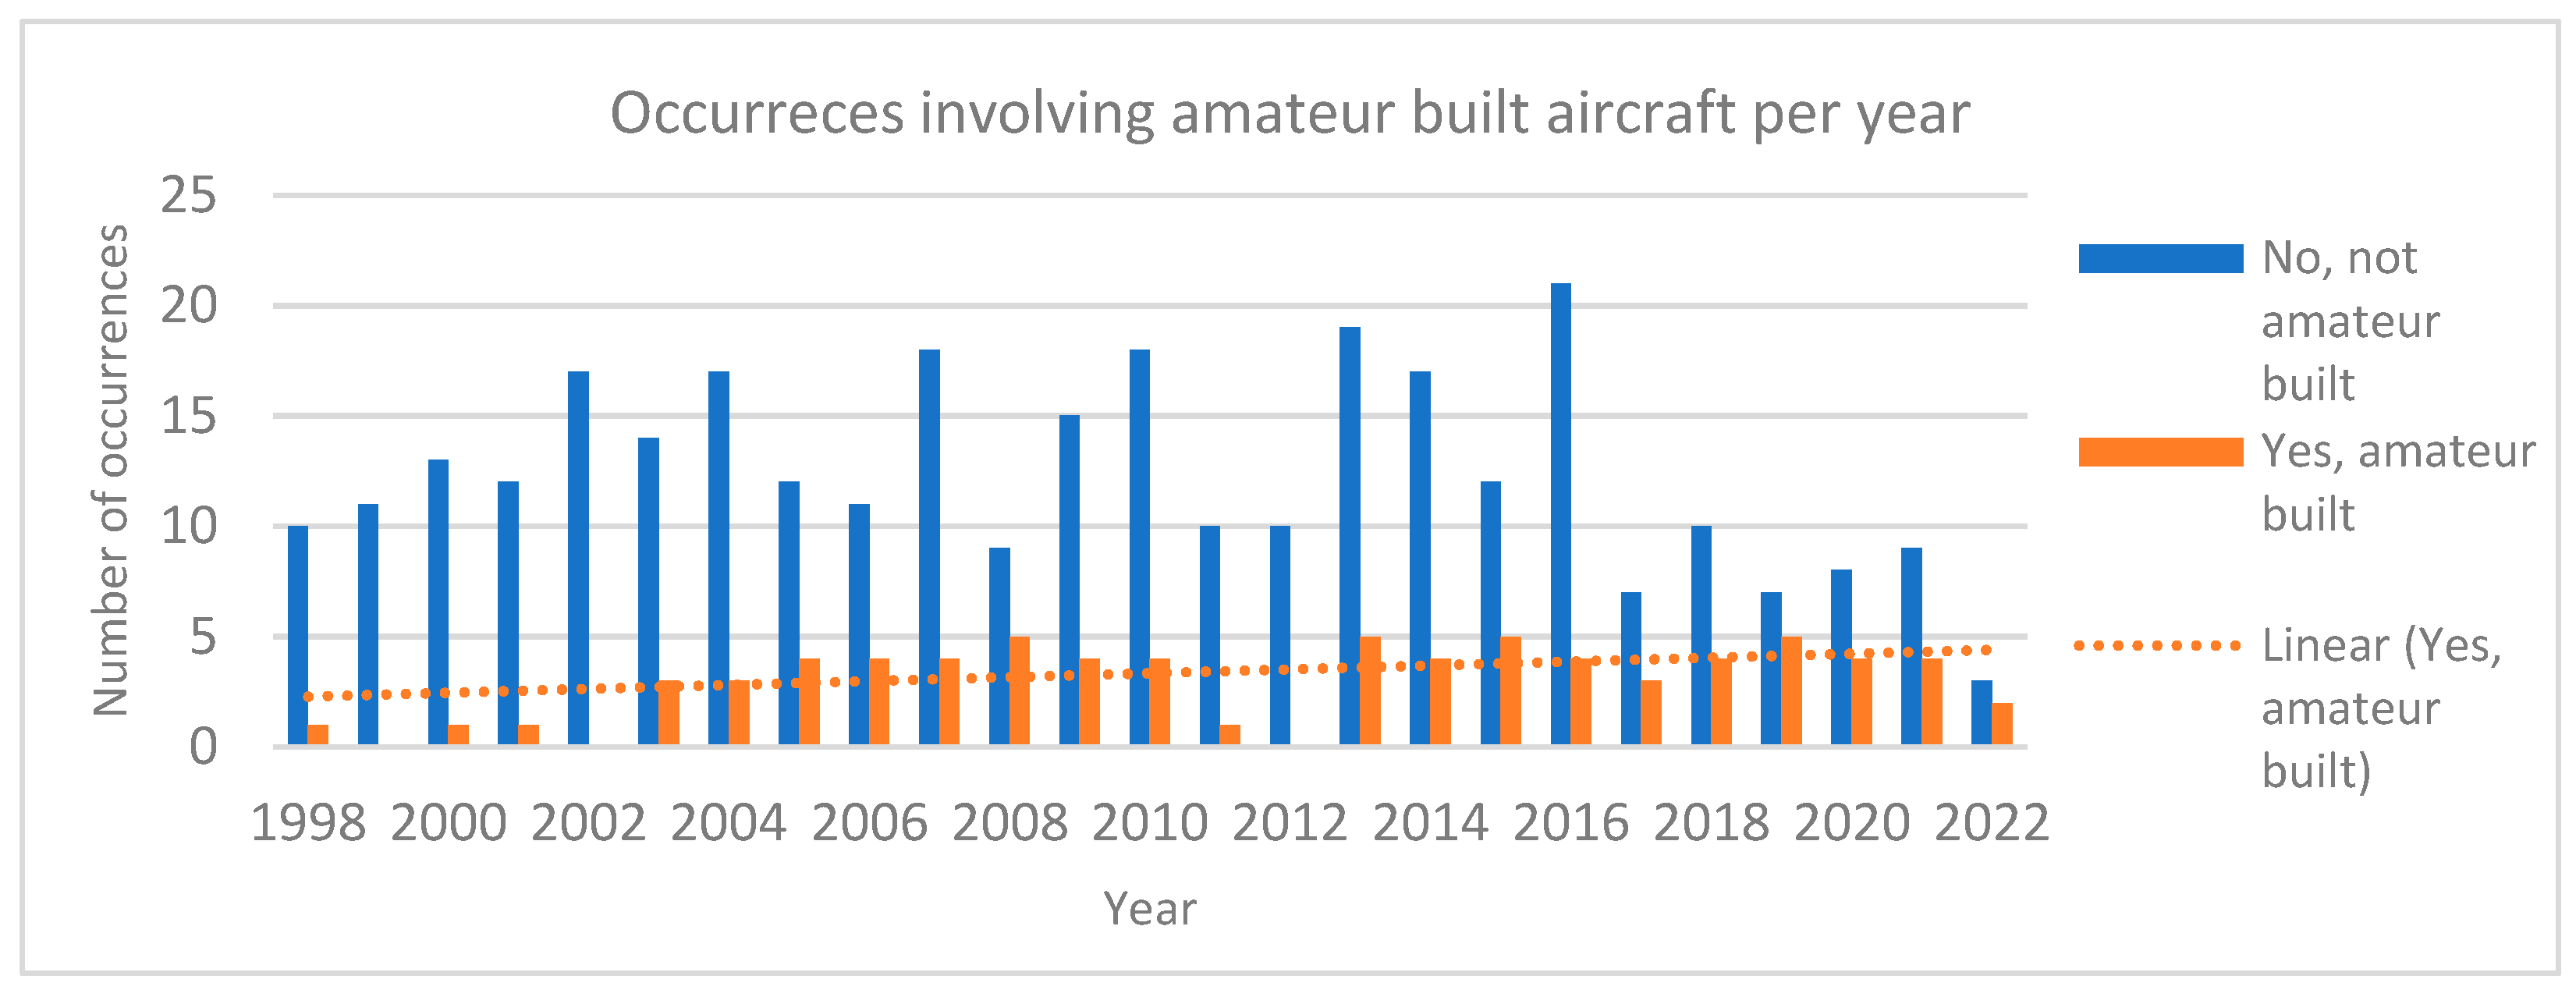
Figure 7.
Aircraft damage level per year, for private, recreational, on-water seaplane operations in Canada.
Figure 7.
Aircraft damage level per year, for private, recreational, on-water seaplane operations in Canada.
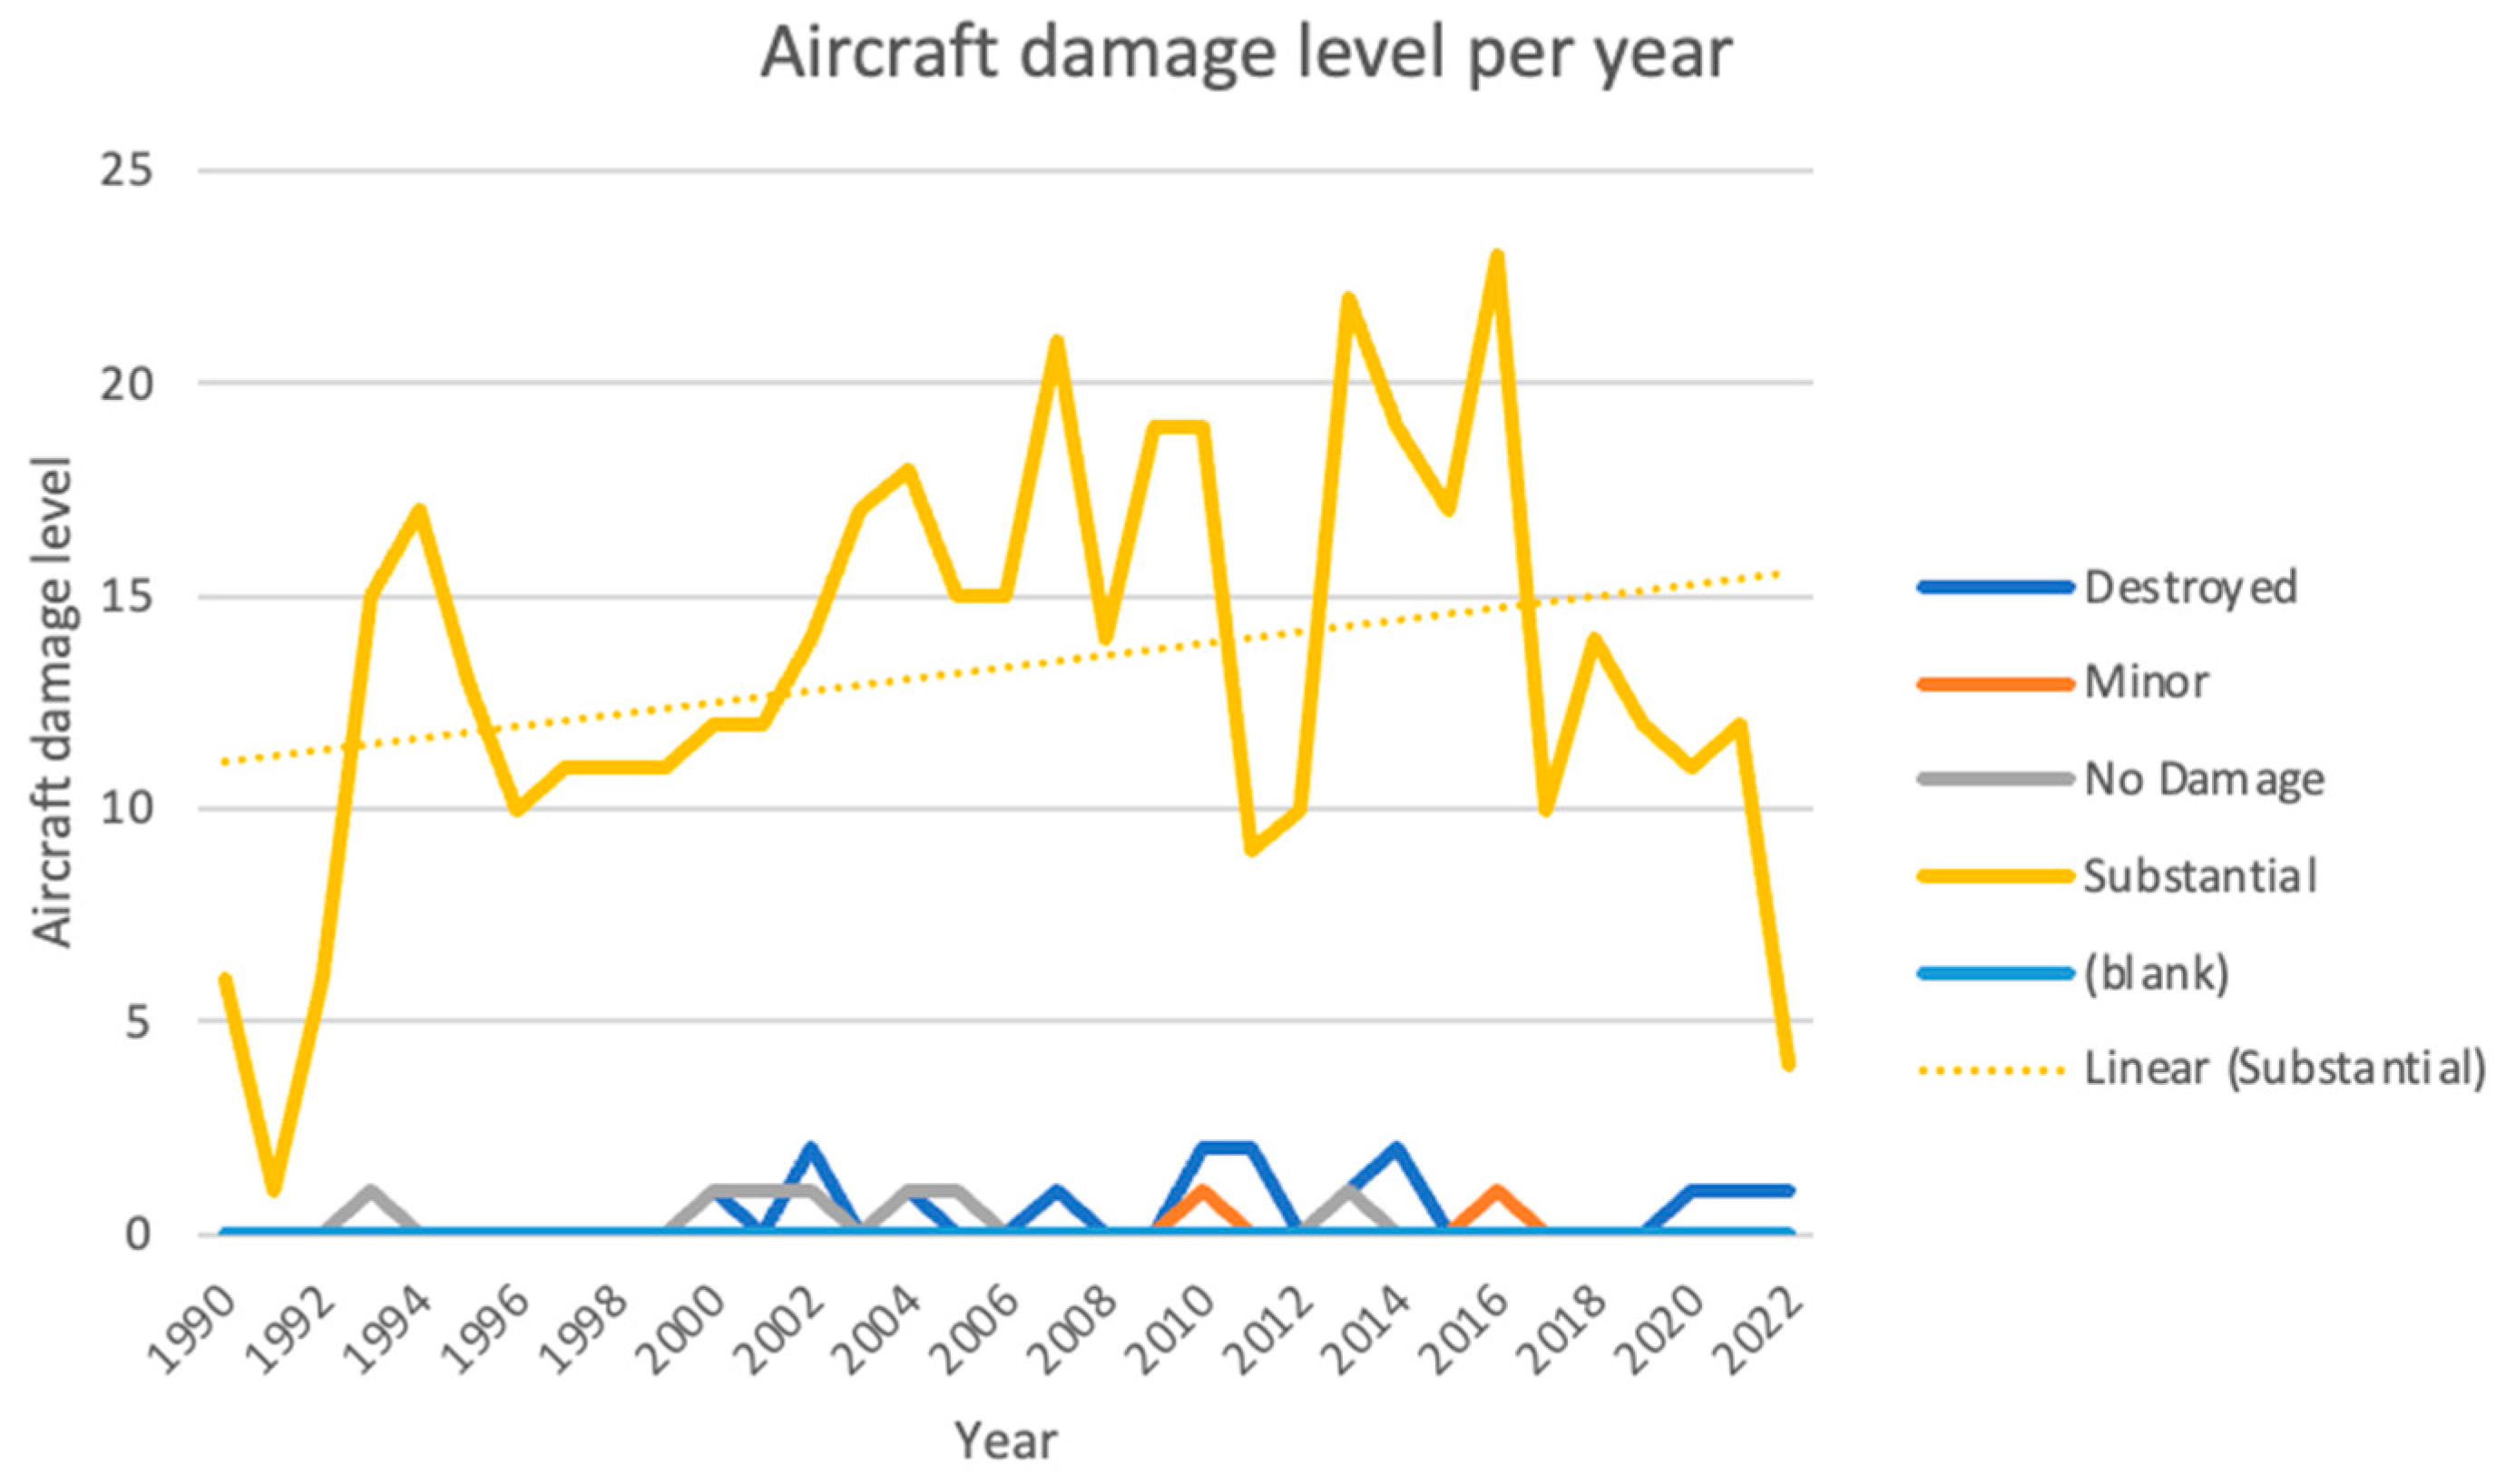
Figure 8.
Number of occurrences during the top 5 phases of flight, for private, recreational seaplane operations in Canada.
Figure 8.
Number of occurrences during the top 5 phases of flight, for private, recreational seaplane operations in Canada.
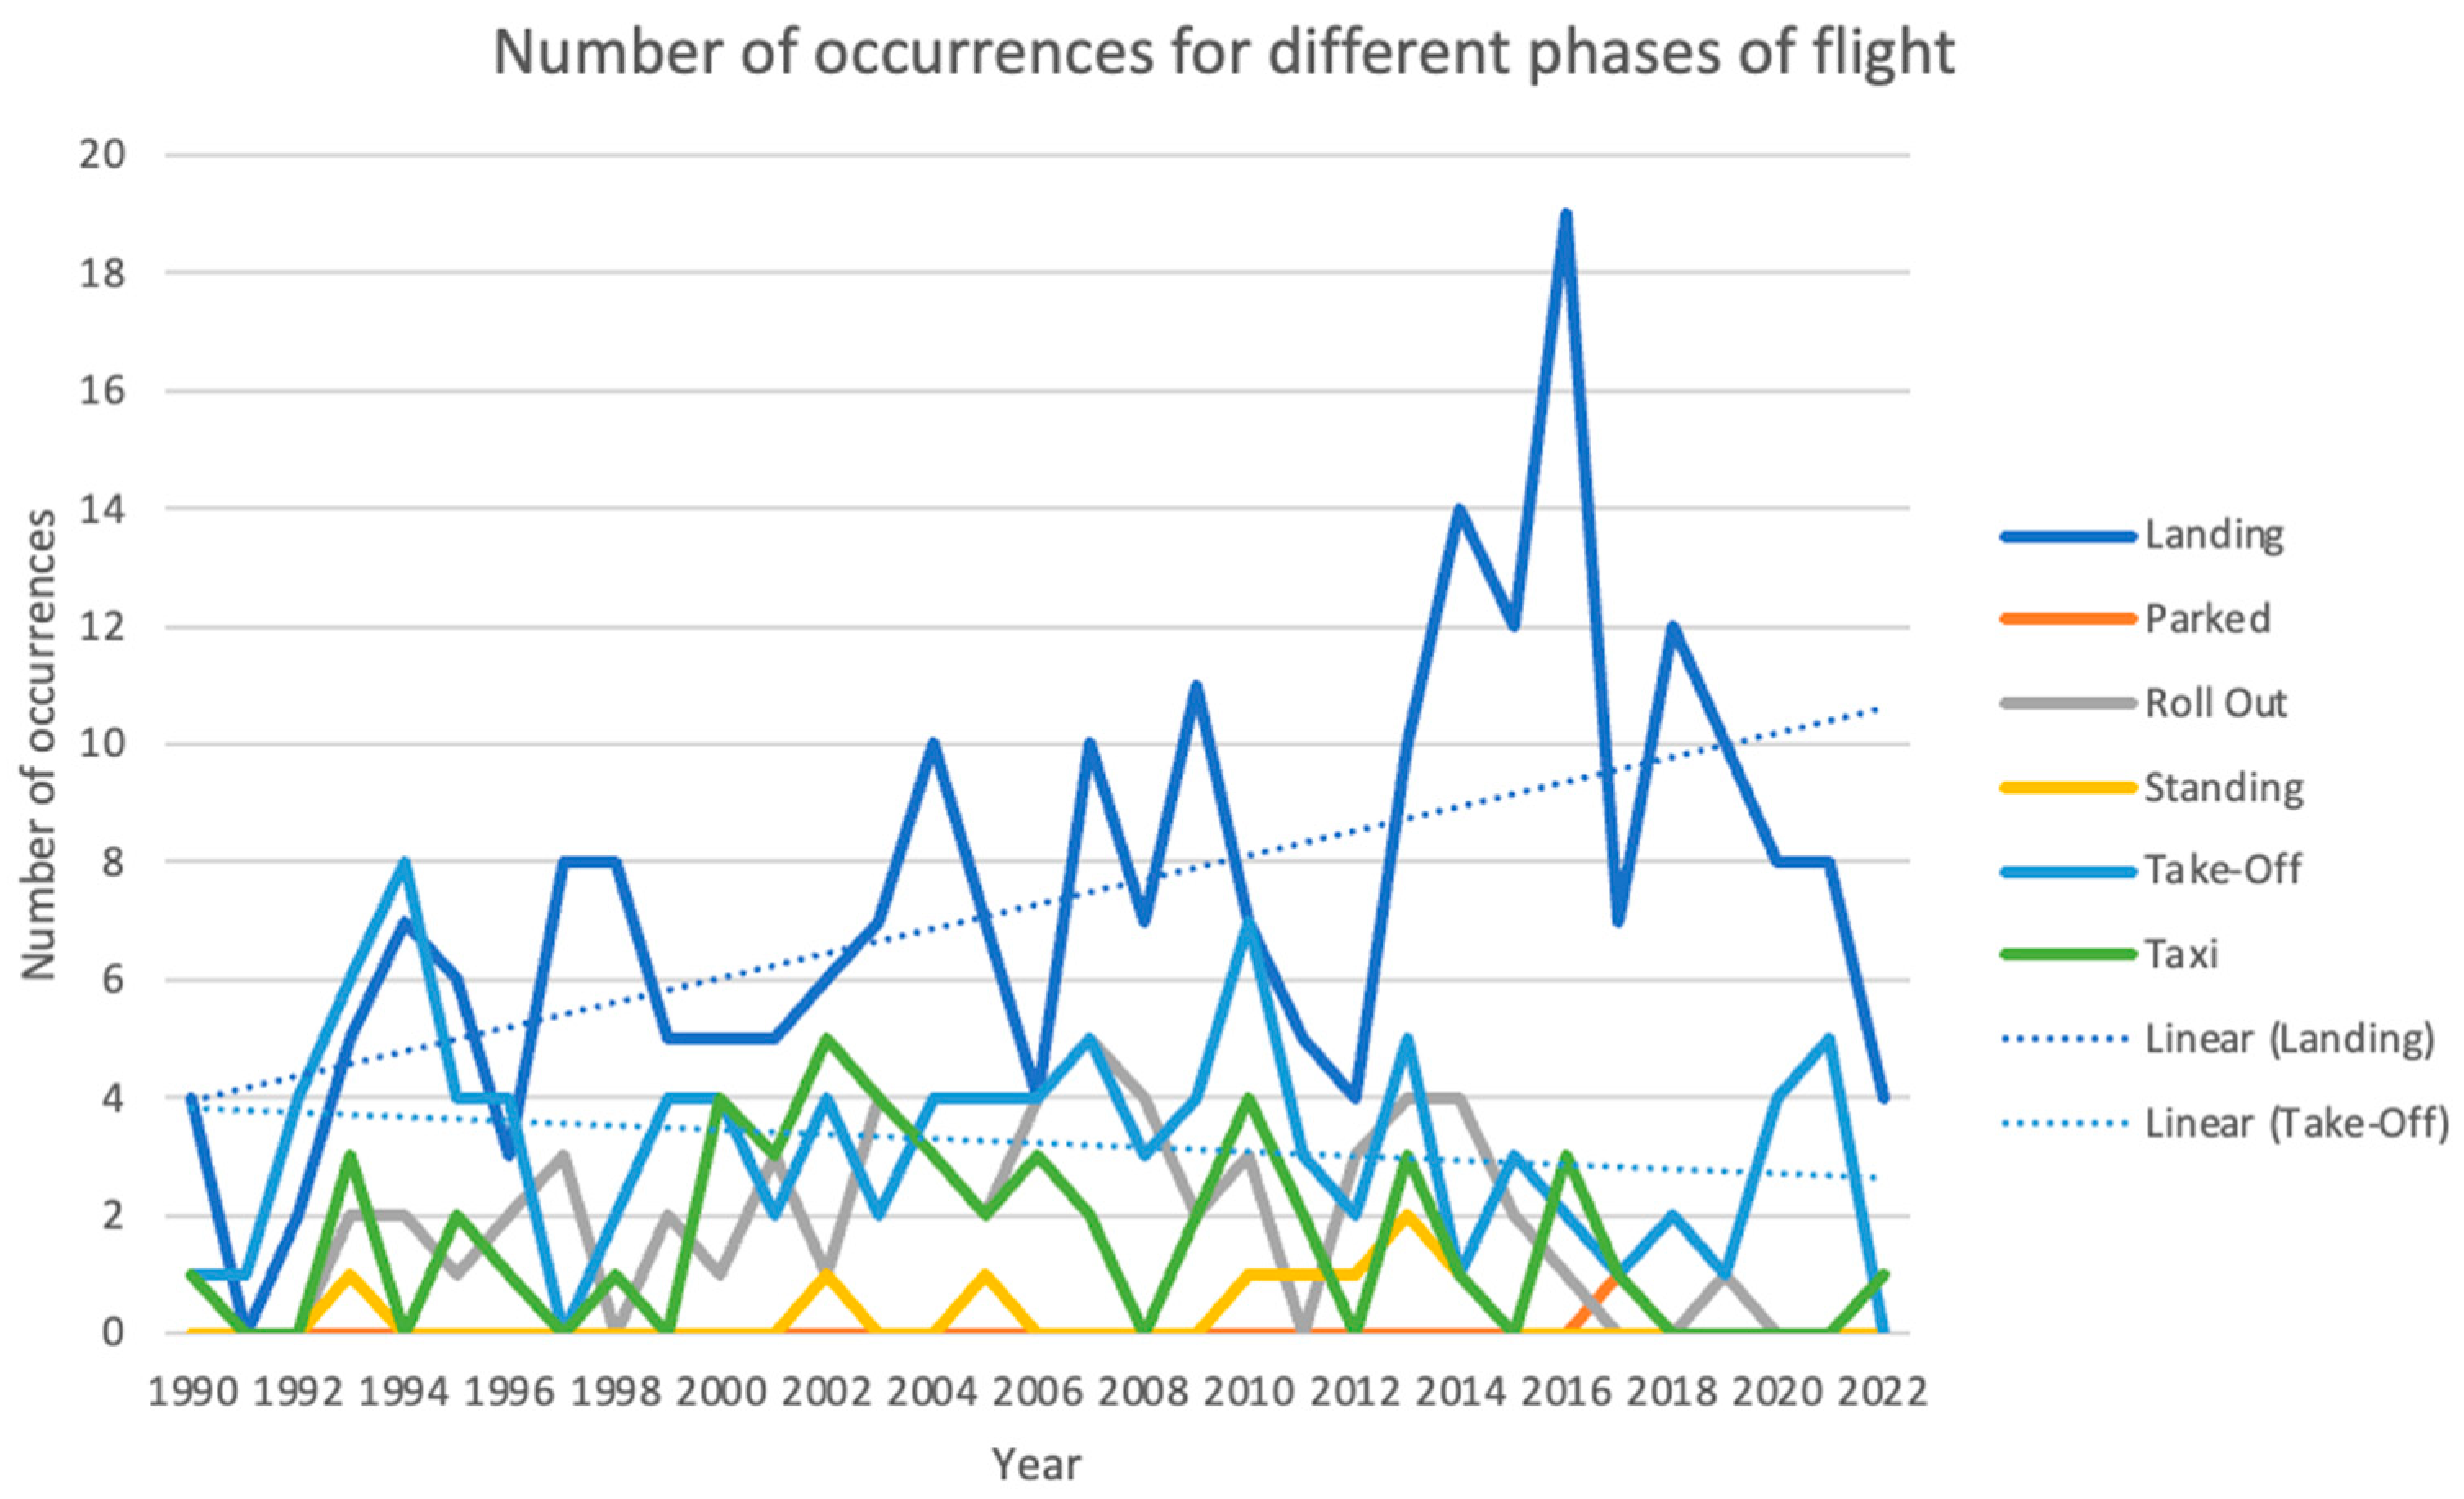
Figure 9.
Number of occurrences during take-off per year, for private, recreational seaplane operations in Canada.
Figure 9.
Number of occurrences during take-off per year, for private, recreational seaplane operations in Canada.
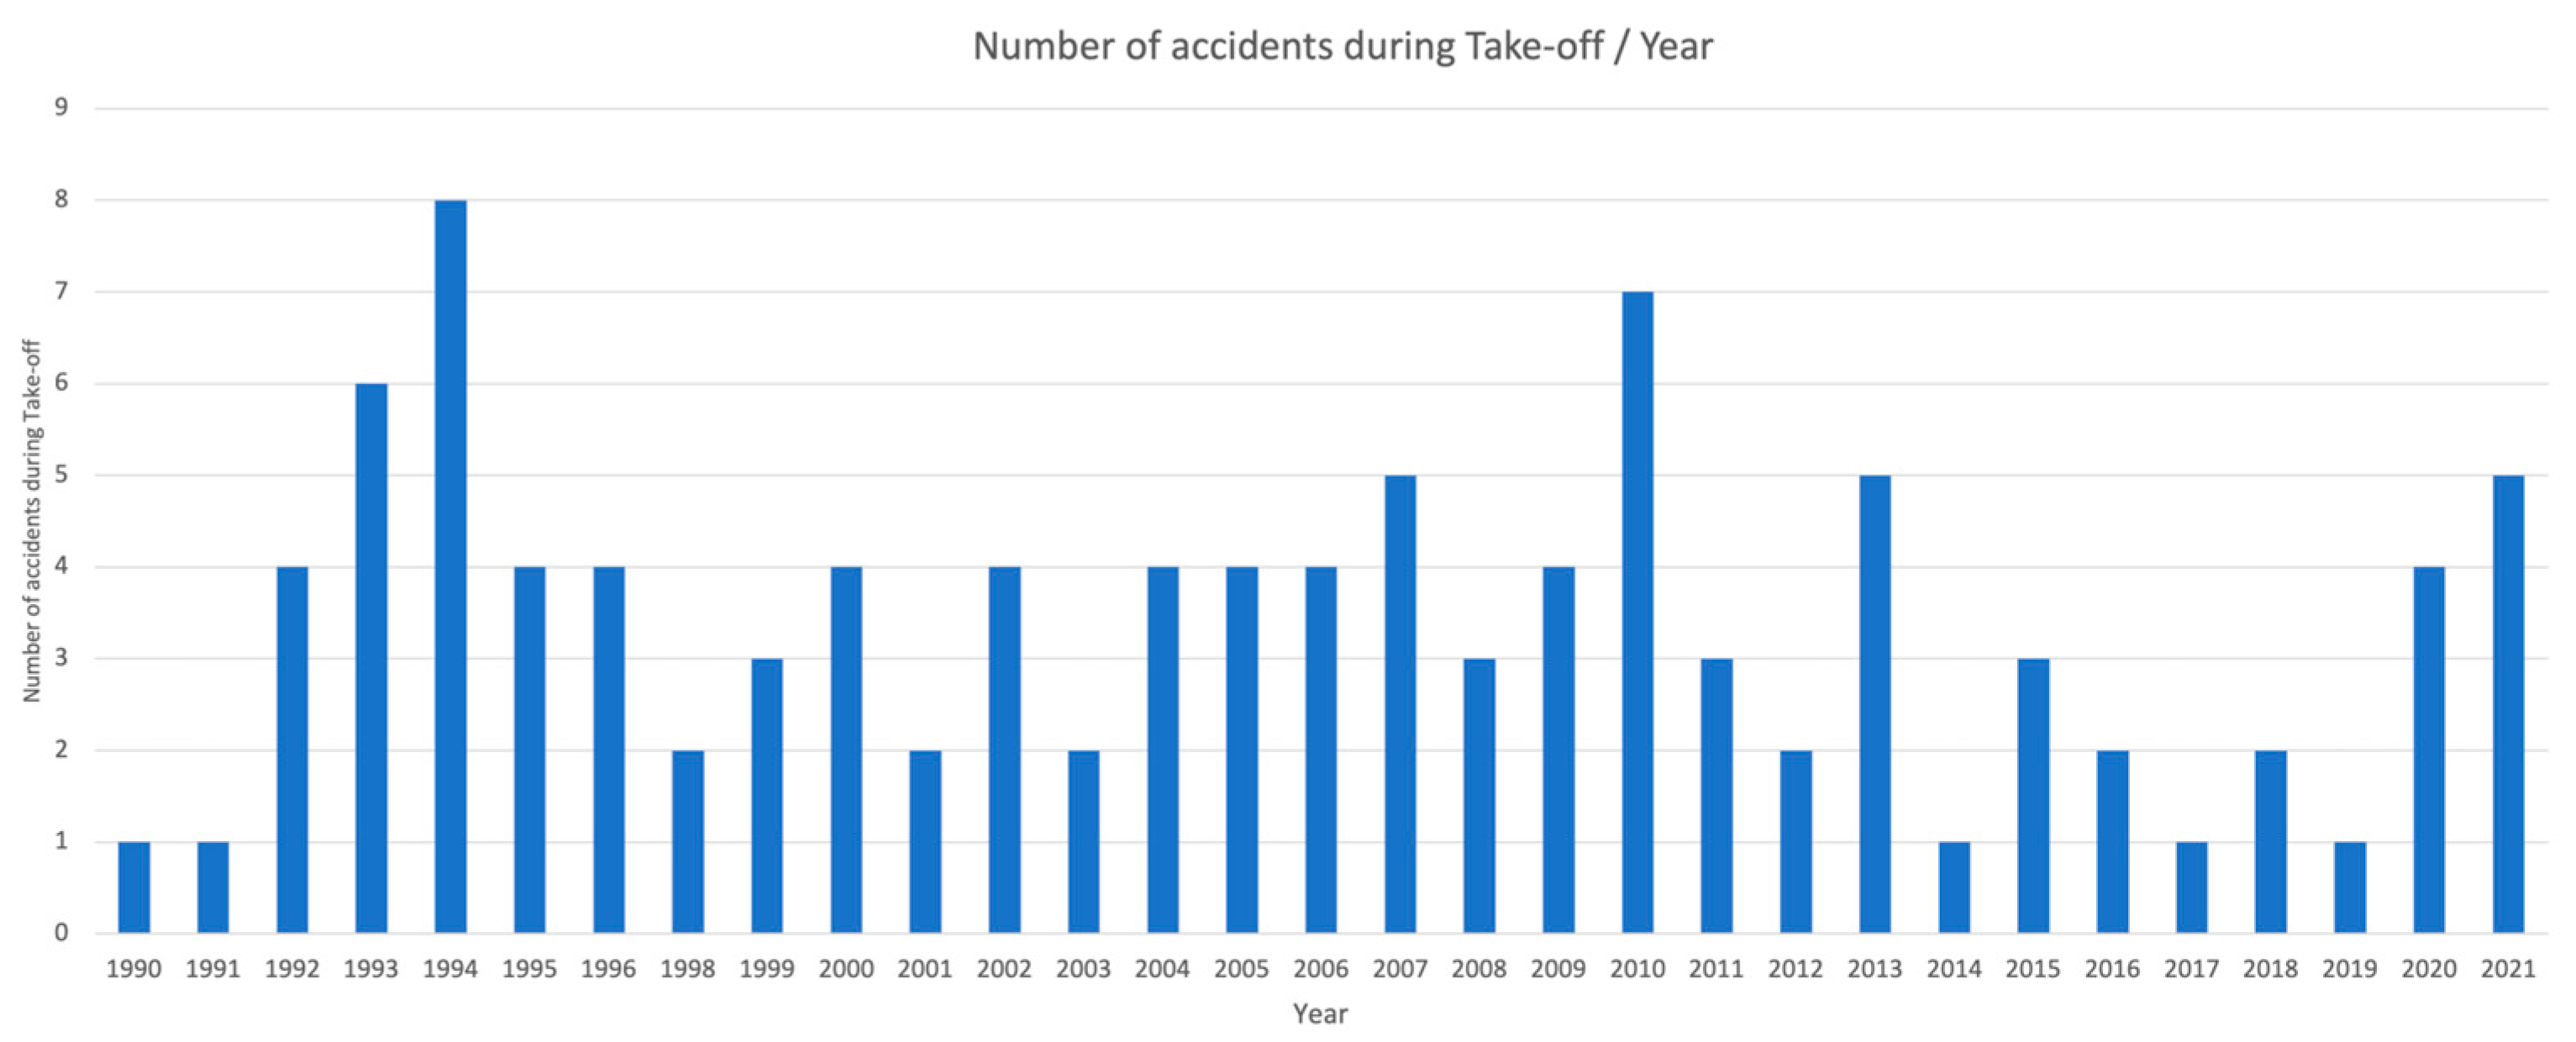
Figure 10.
Number of occurrences for different categorization, per different landing gear, for private, recreational, on-water seaplane operations in Canada.
Figure 10.
Number of occurrences for different categorization, per different landing gear, for private, recreational, on-water seaplane operations in Canada.
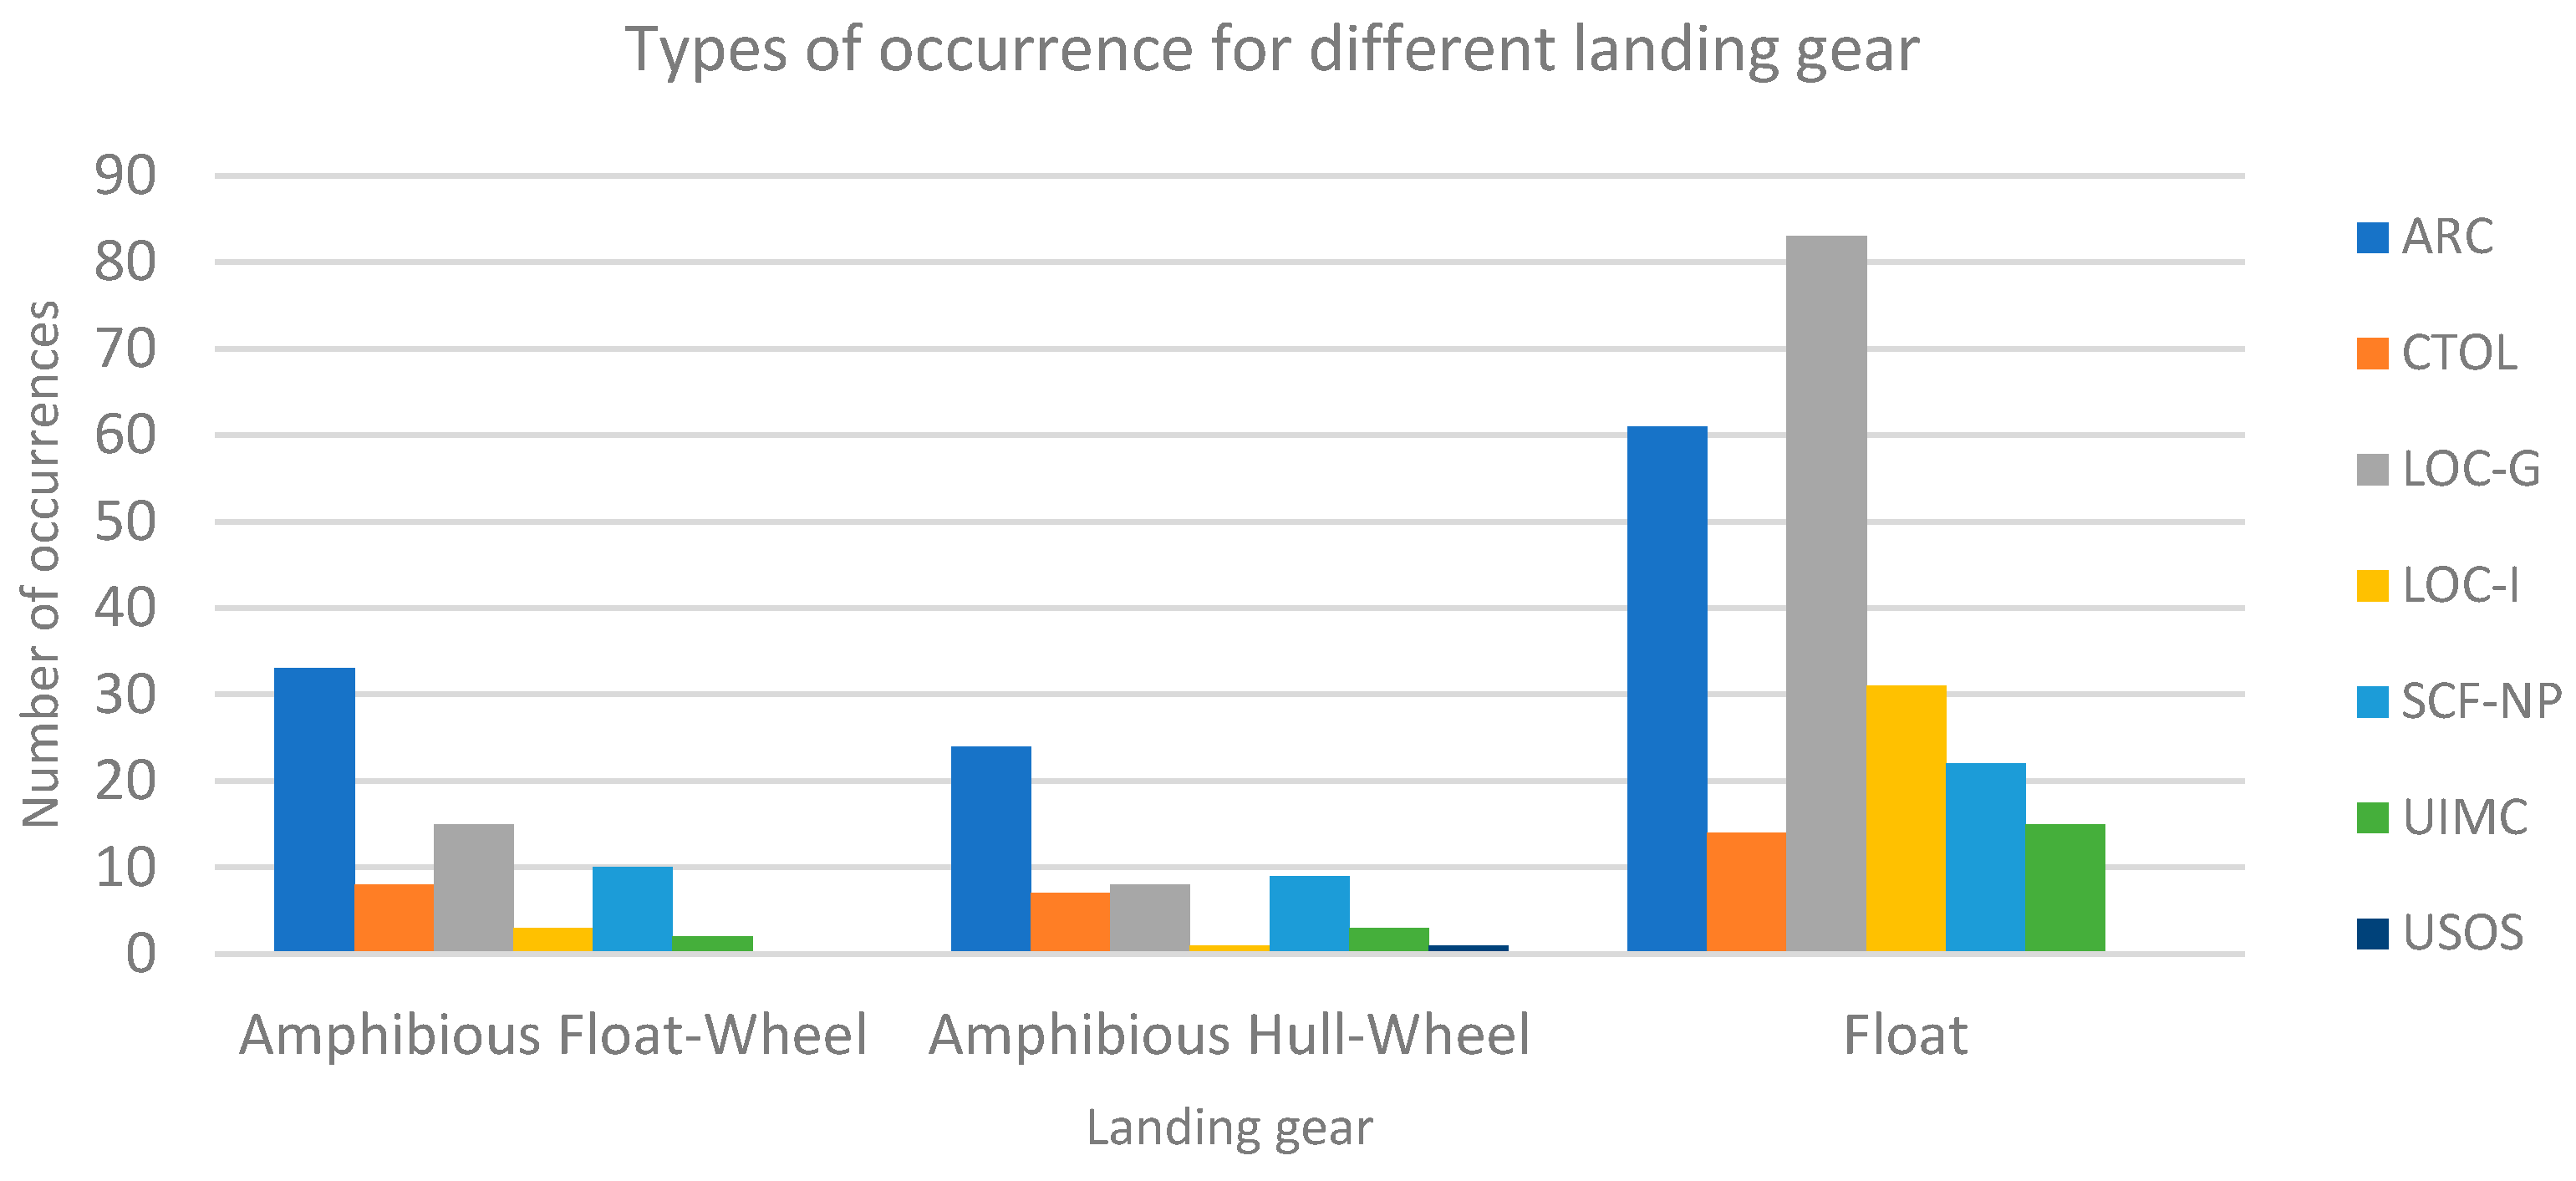
Figure 11.
Number of injuries and fatalities per year, for private, recreational seaplane operations on water in Canada.
Figure 11.
Number of injuries and fatalities per year, for private, recreational seaplane operations on water in Canada.
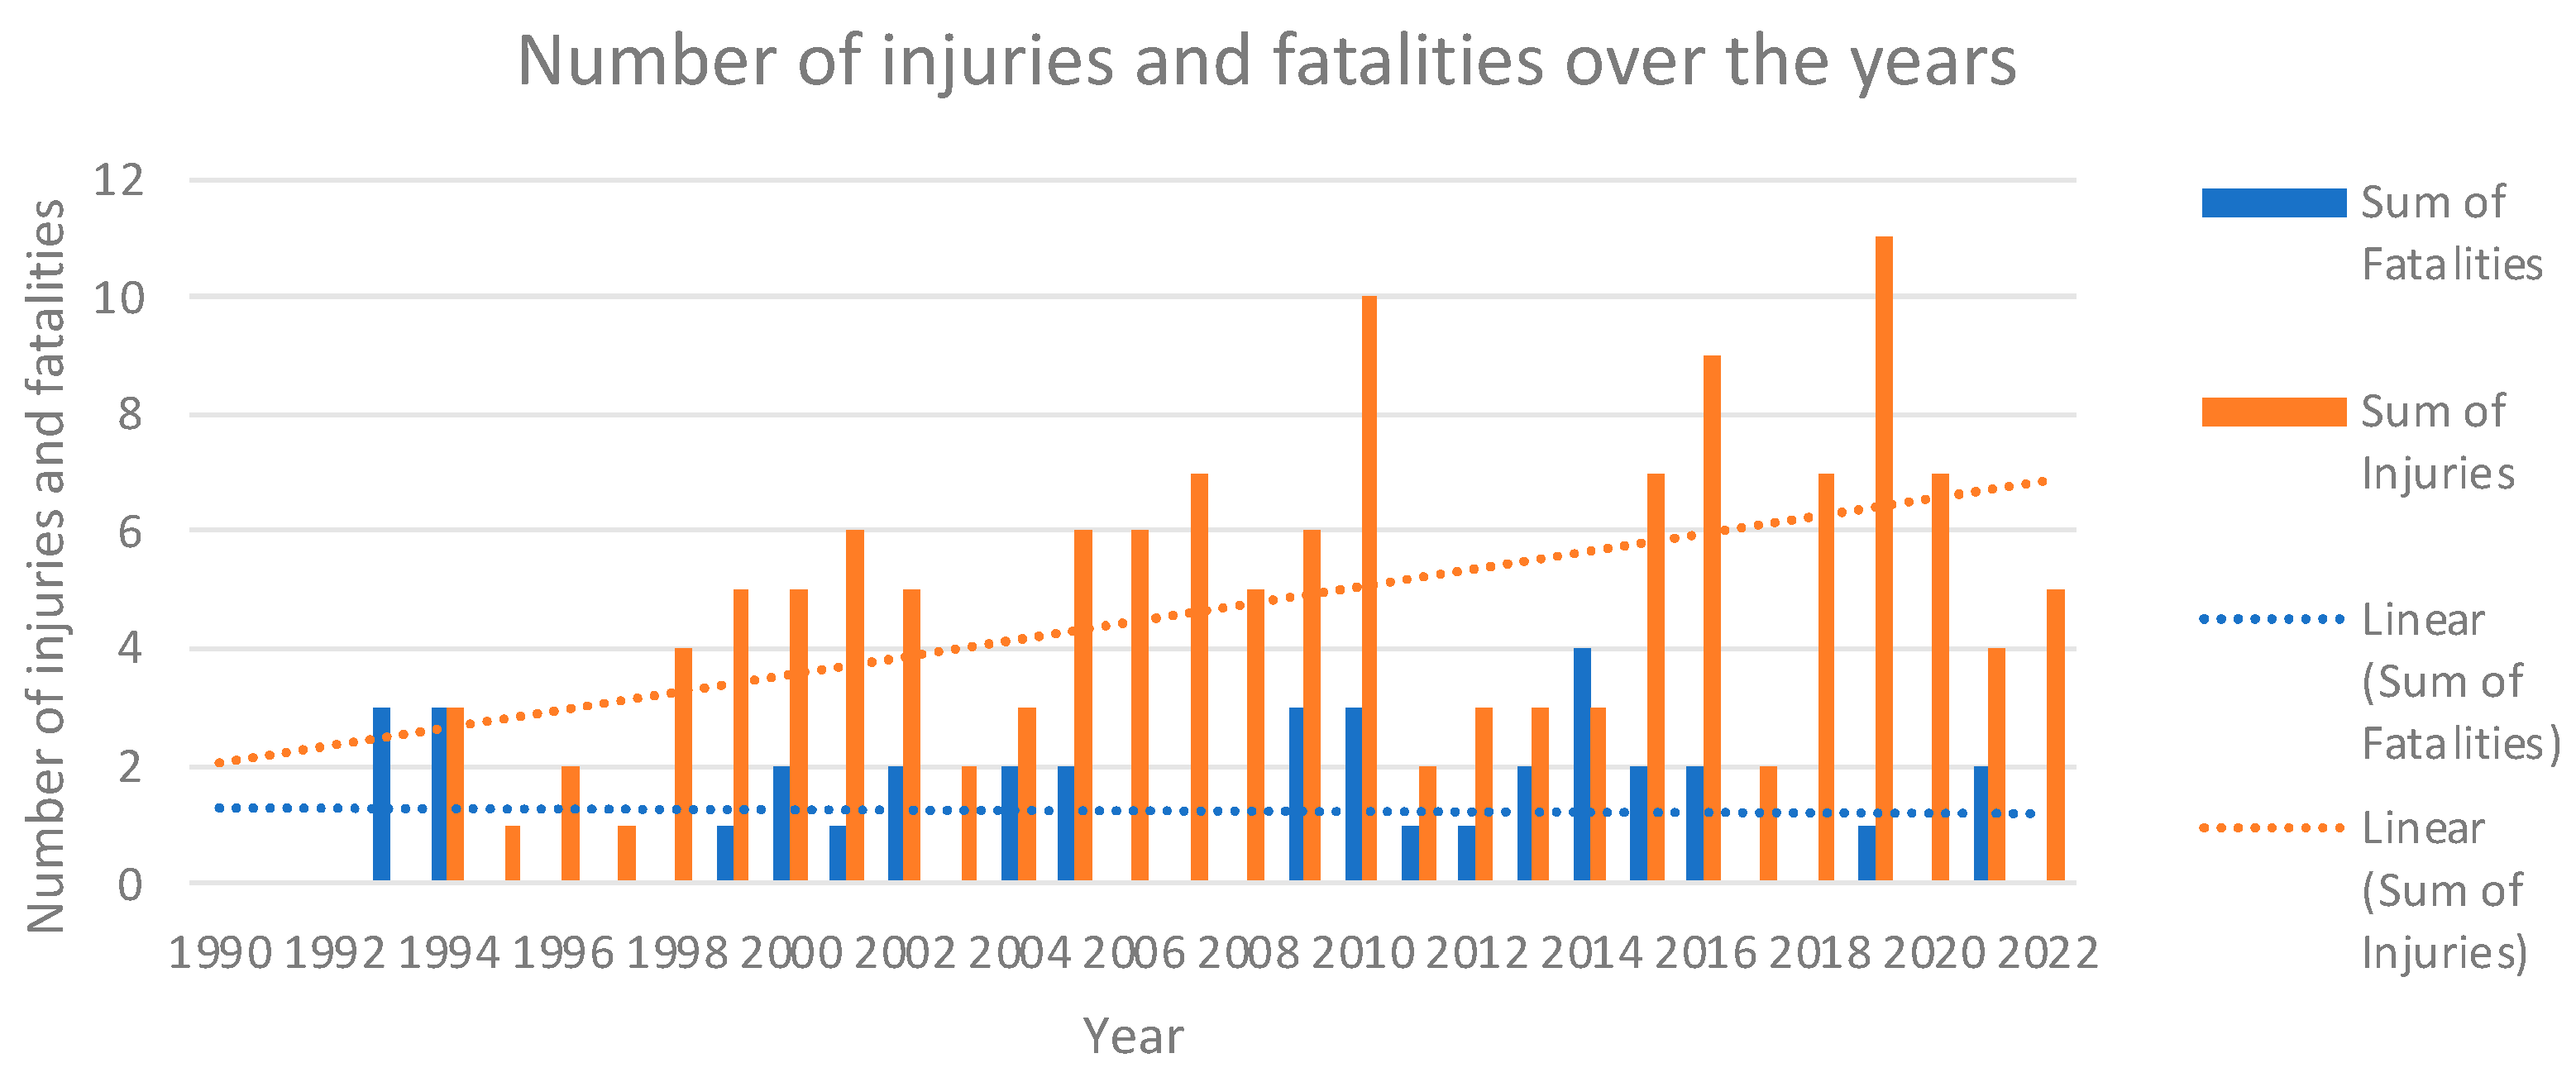
Figure 12.
Three-way associations between 9 parameters for on-water occurrences of private, recreational seaplanes on the water.
Figure 12.
Three-way associations between 9 parameters for on-water occurrences of private, recreational seaplanes on the water.


Table 1.
Definitions for phases of flight during seaplane operations by adapting CICTT [9] definitions of phases of flight.
Table 1.
Definitions for phases of flight during seaplane operations by adapting CICTT [9] definitions of phases of flight.
| Phase of flight | Definition |
| Standing | Stationary aircraft at dock before taxi. |
| Taxi | Aircraft unassisted in moving before take-off or after landing. |
| Take-off | Starts when take-off power is applied, until either being airborne above 35 feet from the runway/water elevation, or when the gear is up. This includes rejected take-offs. |
| Climb | |
| Initial Climb | After take-off, until the aircraft either reduces prescribed power for the first time or reaches 1,000 feet above the runway/water elevation. |
| Cruise Climb | Subcategory added to account for the period after the initial climb and prior to level off at cruise altitude. |
| Cruise | Level flight segment between the end of climb and the beginning of descent for landing. |
| Maneuvering | Intentional altitude changes during low altitude (not associated with take-off and landing). |
| Descent | Descent between level flight and 1,000-2,000 feet above the runway/water elevation. It includes emergency and uncontrolled descent. |
| Approach | Constant altitude decrease in preparation for landing, from 1,000-2,000 feet above the runway/water elevation until the beginning of the landing flare. It includes Missed Approaches and Go-Arounds for up to 200 feet above the runway/water elevation. |
| Landing | The phase that immediately follows the approach, where the aircraft transitions to the landing attitude enabling the airplane to touch down on the landing surface at the slowest speed possible commensurate with safety. This transition is known as the flare. The flare is normally executed at 50 feet or less above the runway/water elevation. For touch-and-go’s, this phase ends the moment power is applied for take-off. Landing includes flare, touchdown, and aborted landings after touchdown. |
| Landing Run | The phase that immediately follows the water landing, when the aircraft slows down to taxi speed (normally with the engine at idle), until reaching the end of the landing runway or coming to a stop on the runway. |
| Docking | The transition from idle taxi to the safe securing of the seaplane to a permanent structure fixed to the shore. Docking is normally executed with the engine stopped. |
| Other | |
| En Route | After initial climb, through cruise and controlled descent, until the initial approach. Often used when it is not clear in which of the airborne phases of flight the occurrence took place. |
| Post-Impact | Considers the segment of flight after impacting terrain, obstacles, people or objects. |
| Unknown | For accident and incident data, when the phase of flight of the occurrence could not be determined. |
Table 2.
Interpretation of Phi value [15].
Table 2.
Interpretation of Phi value [15].
| Phi value | Strength of relationship |
|---|---|
| -1.0 to -0.5 and 0.5 to 1.0 | Strong |
| -0.5 to -0.3 and 0.3 to 0.5 | Moderate |
| -0.3 to -0.1 and 0.1 to 0.3 | Weak |
| -0.1 to 0.1 | None or very weak |
Table 3.
Summary of the accident/incident dataset and the reasons of employing different methods of analysis.
Table 3.
Summary of the accident/incident dataset and the reasons of employing different methods of analysis.
| Dataset Description | Method of Analysis | Reason |
|---|---|---|
| - Canada - 1990 to 2022 - 466 private, recreational GA on-water seaplane occurrences - source: Transport Canada |
Narrative analysis | To extract further information and improve the quality of the analysis. It includes the occurrence categorization. |
| Trend analysis | Calculate trends and determine patterns. | |
| Contingency analysis | To detect potential associations and relationships between two and three variables. | |
| Three-way associations | ||
| Interviews | Engagement with industry professionals to discuss the data analysis results and assess mitigation methods. | |
| Focus groups | Engagement with seaplane pilots and industry professionals to determine potential factors not included in the database and bring awareness on current areas of concern. | |
| Questionnaire |
Table 4.
Five most recurrent types of seaplane accidents and incidents on the water.
| Category Name | Category ID | Count | Percentage |
|---|---|---|---|
| Loss of Control – Ground & Inflight | LOC-G & LOC-I | 152 | 32.62% |
| Abnormal Runway Contact | ARC | 124 | 26.61% |
| System/Component Failure or Malfunction (Non-Powerplant) | SCF-NP | 42 | 9.01% |
| Collision with Obstacle(s) During Take-off and Landing | CTOL | 29 | 6.22% |
| Unintended Flight in IMC | UIMC | 20 | 4.29% |
| System/Component Failure or Malfunction (Powerplant) | SCF-PP | 18 | 3.86% |
| Abrupt Maneuver | AMAN | 15 | 3.22% |
| Unknown | UNK | 15 | 3.22% |
| Ground Handling | RAMP | 10 | 2.15% |
| Other | OTHR | 9 | 1.93% |
Table 5.
Parameters used for the contingency analysis and three-way associations.
| Parameter | Binary variables | Count | Description / Reasoning |
|---|---|---|---|
| Year | 1990-2000 | 117 | Separated the years into 3 groups of equal number of years. |
| 2001-2011 | 186 | ||
| 2012-2022 | 163 | ||
| Month | May-October | 432 | Grouped into flying season (May-October) and outside flying season (November-April). |
| November-April | 34 | ||
| Time | Daytime (11:00-17:59) | 277 | Grouped to reflect the part of the day. |
| Morning & Evening (05:46-10:59 & 18:00-21:59) | 168 | ||
| Night-time (10pm-05:45am) | 21 | ||
| Aircraft Amateur Built Flag | Yes Amateur Built | 75 | Unchanged. |
| Not Amateur Built | 391 | ||
| Aircraft Landing Gear | Amphibious | 153 | “Amphibious Float-Wheel” and “Amphibious Hull-Wheel” were grouped into “Amphibious”. Categories grouped into the “Other” category: “Hull” and “Water Landing Aircraft”. |
| Float | 290 | ||
| Other (landing) gear | 23 | ||
| Aircraft Damage Level | Substantial | 440 | Categories grouped into the “Other” category: “Minor”, “No Damage”, “Missing Aircraft”. |
| Destroyed | 16 | ||
| Other damage (level) | 10 | ||
| Phase of Flight | Landing | 240 | Categories grouped into the “Other” category: “Parked”, “Standing”. |
| Roll-Out | 59 | ||
| Take-Off | 106 | ||
| Taxi | 51 | ||
| Other Phase (of Flight) | 10 | ||
| Type of Occurrence (Occurrence Category) | ARC | 124 | Categories grouped into the “Other” category: “AMAN”, “ATM”, “BIRD”, “CFIT”, “FUEL”, “GCOL”, “LALT”, “MAC”, “MED”, “OTHR”, “RAMP”, “RE”, “TURB”, “UNK”, “USOS”, “WSTRW”. |
| CTOL | 29 | ||
| LOC-G | 113 | ||
| LOC-I | 39 | ||
| SCF-NP | 42 | ||
| SCF-PP | 18 | ||
| UIMC | 20 | ||
| Other (1st Occurrence) Category | 81 |
Disclaimer/Publisher’s Note: The statements, opinions and data contained in all publications are solely those of the individual author(s) and contributor(s) and not of MDPI and/or the editor(s). MDPI and/or the editor(s) disclaim responsibility for any injury to people or property resulting from any ideas, methods, instructions or products referred to in the content. |
© 2025 by the authors. Licensee MDPI, Basel, Switzerland. This article is an open access article distributed under the terms and conditions of the Creative Commons Attribution (CC BY) license (http://creativecommons.org/licenses/by/4.0/).
Copyright: This open access article is published under a Creative Commons CC BY 4.0 license, which permit the free download, distribution, and reuse, provided that the author and preprint are cited in any reuse.


