
Submitted:
22 March 2025
Posted:
24 March 2025
You are already at the latest version
Abstract
Modern sensing technologies used in the field of ground-based telescopes still have a lot of challenges. First of all, these challenges are associated with the development of the new-generation instruments for astronomical observations and with the influence of the Earth`s atmosphere on radiation in various ranges of the electromagnetic spectrum. The atmosphere is often the main factor determining the technical characteristics of the instruments, in both the optical and millimeter ranges. In particular, for millimeter/submillimeter telescopes, water vapor is the main gas that determines atmospheric opacity. Correct assessment of water vapor make it possible to estimate the optical opacity of the atmosphere, and on this basis, the capabilities of the millimeter/submillimeter telescope, the limitations of its use in the mode of Very-long-baseline interferometry. A lot of studies seek to effectively characterize water vapor content and dynamics for site-testing purposes in application to the ground-based millimeter and sub-millimeter telescopes. In the present article, we study water vapor content within a fairly large region, poorly covered in modern literature. Based on the ERA-5 reanalysis data as a site-testing oriented tool, we obtained spatial distributions of precipitable water vapor (PWV) within a large region (20∘N - 70∘N, 35∘E - 120∘E). These distributions of PWV were corrected with respect to the characteristic vertical scale of water vapor Heff and the relative height difference of grid nodes in the ERA-5. Calculated values of PWV are highly correlated with the Global Navigation Satellite System-derived PWV, with Pearson coefficients greater than 0.9. Using the refined estimations we determined the median values of atmospheric opacities corresponding to new perspective sites (Khulugaisha Peak and Tashanta) as well as the Special Astrophysical Observatory (the key astronomical observatory in Russia). Together with Ali in China, Khulugaisha Peak and Tashanta are considered by us as potential sites for the placement of a millimeter/submillimeter telescope within the framework of the project of the Eurasian Submillimeter Teselscopes. Results obtained in this paper suggest promising atmospheric conditions for astronomic observations, at least, in the millimeter range In particular, we believe that this study will be a basis for the Eurasian Submillimeter Telescopes (ESMT) project, within the framework of which it is assumed to create a number of ground-based millimeter/submillimeter telescopes.
Keywords:
millimeter astroclimate
; millimeter telescope
; atmospheric effects
; methods: data analysis
; site testing
1. Introduction
In the world, there are two most important fields of ground-based astronomy. The first field is adaptive optics, which increases the informativeness of astronomical images recorded with ground-based optical and infrared telescopes [1,2,3,4]. World experience shows that correction of phase turbulent distortions make it possible to minimize atmospheric negative effects (primarily, associated with atmospheric optical turbulence) and approach the ultimate resolution of the telescope. It should be noted that for infrared telescopes, the key atmospheric quantity, in addition to the characteristics of optical turbulence, is the content of water vapor within the atmospheric column.
The second area includes a key technology of astronomical observations, which is based on the use of interferometry principle. By linking together observation data, for example, on spaced radio telescopes, it is possible to achieve significant progress in increasing spatial resolution. In particular, very long base-line interferometry (VLBL) demonstrates high scientific potential. For example, for a wavelength of 2 mm and a base of 10,000 km, the potential resolution is about 41 microarcsec. With a decrease in wavelength to 1 mm, the resolution improves to values of about 20 microarcsec.
A certain range of scientific tasks based on VLBL data has been formed by now [5]. One of them is related to the expansion of the possibilities for observations of the innermost parts of accretion disks and jets around supermassive black holes. Another interesting scientific task is to obtain high-resolution images of bright maser sources, which is important for studying well-known regions of high-mass star formation containing these bright sources. For millimeter-wave observations, there are also many other compact sources that are potential targets for VLBI applications. These include transient sources such as supernovae, gamma-ray bursts, and microquasars. Such observations should be very interesting, since the highest frequencies correspond to the earliest phases of any eruption.
Improvements in our understanding of cosmic phenomena physics are associated with the development of ground-based astronomical infrastructure, the search for new sites on the Earth and the creation of next-generation astronomical instruments. The global community is increasingly involved in the process of organizing complex astronomical observations and creating new measuring instruments [6,7,8,9,10,11]. Studies of water vapor content, air temperature wind statistics are important for selection of new sites suitable for mm and submm wavelength astronomy [12]. There is the project of "Eurasian Submillimeter Telescopes" that proposes the creation of new millimeter/submillimeter telescopes, including the territory of Russia [13]. The technical characteristics of submillimeter and millimeter ground-based telescopes depend on atmospheric conditions and, above all, on the water vapor and oxygen content along the line of sight. Estimation of potential observation time on submillimeter and millimeter ground-based telescopes requires preliminary modeling of atmospheric conditions and conducting in-situ measurements in selected (or existing) best locations for astronomical observations.
In paper [14] the authors claimed "on Earth’s surface, there are only a handful of high-quality astronomical sites that meet the requirements for very large next-generation facilities". This expression, in our opinion, is not entirely fair. Indeed, internationally world-class sites are located in such regions as the Atacama Desert in northern Chile, Mauna Kea in the Hawaiian Islands, La Palma in the Canary Islands [15]. Results of other studies show that there are additional locations on the Earth suitable for installing new telescopes. For example, we can note Sanglokh, Maidanak, Suffa and Ali [16,17]. In this paper we focus on two new sites: Khulugaysha Peak and Tashanta. For comparative purposes, location of Big Telescope Alt-Azimuthal (BTA) of the Special Astrophysical Observatory (SAO) is also considered. BTA is one of the largest astronomical centers in Russia, which has a radio telescope RATAN-600 and optical reflector Big telescope Alt-azimuthal with a 605 cm diameter primary mirror. SAO is located near mount Pastukhova in the northern part of the Caucasus mountains at a height of 2070 m above sea level. The geographic coordinates of BTA are 43 ° 39 ′ 12 ″ N, 41 ° 26 ′ 30 ″ E. We should emphasize that prospects for developing the observational base at SAO for astrophysical research in the millimeter-wave range are discussed in [18]. In our opinion, Khulugaysha Peak (51 ° 44 ′55 ″ N,100 ° 59 ′ 7 ″ E) and Tashanta (49 ° 43 ′ 02 ″ N,89 ° 11 ′ 27 ″ E) are two new promising sites suitable for the millimeter telescope in the Sayan mountains and Altai, respectively.
2. Data Used
Water vapor is the main gas that leads to the absorption of millimeter and submillimeter radiation in the atmosphere. The study of its spatiotemporal variability, as well as the assessment of statistical characteristics of the water vapor content in the atmospheric column and at different heights are important tasks of millimeter and submillimeter astronomy. In solving these problems, reanalysis databases are becoming increasingly popular and represent one of the possible alternatives to measurements, due to the globality, easy accessibility, a certain universality and duration of the data [19].
For estimation of precipitable water vapor (PWV), we used a global set of publicly available periodically updated ERA-5 reanalysis data covering a time period from 1940 to the present. The temporal resolution of these data is 1 hour, the spatial resolution is 0.25 o. The data are provided by the European Center for Medium-Range Weather Forecast ReAnalysis [20]. In order to achieve accurate estimates of PWV, we correct the ERA-5 data using GNSS measurements. Examples of two-dimensional distributions of the ERA-5 reanalysis and GNSS values are shown in Figure 1. Table 1 gives the coordinates of GNSS stations. Analysis of the figure shows that the PWV values from the reanalysis and GNSS change synchronously. Especially, the values are closely related for the PWV < 10 mm. In this case, the Pearson coefficients are greater than 0.9. The areas with the highest point density correspond to the most typical observed atmospheric conditions for a given location. The dependencies obtained give a background for use of the reanalysis data to assess astroclimate, in particular, in calculation of precipitable water vapor statistics.
3. Atmospheric Characteristics Relevant for Millimeter Telescopes
3.1. Spatial Distributions of PWV Relevant for Placement of Millimeter Telescopes
Until now, the issue of site selection for new ground-based telescopes has not been resolved. At least, it has not been fully resolved for all sites on the Earth with high astroclimatic characteristics. Moreover, global climate change may contribute to the degradation of conditions for existing astronomical observatories. First of all, this degradation is related to the increase in atmospheric water vapor content in recent decades.
Despite the fact that a number of sites with high astroclimatic characteristics are known in the world, identification of new locations and assessing local atmospheric characteristics are key tasks. In this study, we used ERA-5 reanalysis data for estimation of spatial distributions of precipitable water vapor. We found, that the reanalysis data overestimate the PWV values, especially for mountain peaks. The ERA-5 data should be corrected. Correction of data based on its consistence with measurements is a common procedure [21]. To obtain more accurate estimations of PWV, we use an empirical method based on taking into account the characteristic vertical changes in the water vapor content, calculated from data from nearby radiosonde or GNSS stations. In particular, the PWV values for a given grid node are corrected taking into account the exponential function:
where is the value of PWV derived from ERA-5 reanalysis, is the average vertical scale of water vapor. is such height of the lower atmospheric layer within which the water vapor content decreases with height above surface proportionally to the factor . The value of for a selected grid node is defined as some mean difference in heights within the local area around this reference node. In particular, to estimate we used the following expression:
where is the height of the reference node, are the heights of adjacent nodes shifted in horizontal directions by a distance , M is the number of nodes around the reference node. The shifts and are typically about 100-120 km. The values are specified by minimizing the dispersion between the model and measured PWV values. Also, it should be noted that the PWV values have been corrected only for nodes with heights higher than 2000 m above sea level.
Figure 2 demonstrates the spatial distributions of median PWV averaged for the central months of seasons (January, April, July and October).
Analysis of this figure shows that the precipitable water vapor is distributed unevenly within the selected macroregion. Low PWV values are observed in mountainous regions. The most interesting region is Tibet. In this area, a deep minimum of PWV is observed. Median values of PWV are below 2 mm. This corresponds to the most favorable conditions for millimeter observations. A certain configuration of zones is preserved throughout the year. It can be noted that the well-known astronomical sites (Ali-1, MuztaghAta and Suffa) are located within these zones with low PWV. New sites (Khulugaysha Peak and Tashanta) are in stable locations throughout the year in terms of low PWV values.
In addition to PWV, the possibility of placing a new submillimeter/millimeter telescope is also determined by the surface wind field. In this regard, we also provide averaged spatial distributions of median PWV values taking into account the surface wind speed (Figure 3).
In particular, areas with high values of wind gusts in the atmospheric surface layer (at a height of 10 m above the underlying surface) are excluded from the distributions. These figures make it possible to specify the optimal sites, both in terms of low PWV values and surface winds, leading to mechanical impact on the telescope structure. Analyzing the figures, it can be noted that all the presented astronomical sites (including Khulugaysha Peak and Tashanta) are located within the zones characterized by low PWV values and the absence of significant amplitudes of surface wind gusts.
Analysis of PWV at the sites of Khulugaysha Peak and Tashanta shows that the seasonal variations are similar. The minimum PWV is observed in the cold period of the year, the maximum PWV corresponds to the warm period. Astronomical observations will be most effective in the period from October to April. The median PWV values in the cold period are 1.6 and 2.0 mm for Khulugaysha Peak and Tashanta, respectively. For SAO, the most favorable period corresponds to medians of 4 - 4.7 mm. In order to compare these results, we also estimated PWV for some of the best sites, Ali and Muztagh-Ata. Analysis of radiosonde data gives a slightly lower median value of 1.08 mm [17]. [22] showed that 5% of the PWV values at the Ali location are less than 0.96 mm, the median is 1.63 mm. Our calculations show that the daytime median value based on Era-5 reanalysis data from September to April is 1.40 mm. At night, the median remains virtually unchanged for the same period and is 1.41 mm. At Muztagh-Ata, the PWV values determined for clear sky conditions by LHATPRO measurements in January-February 2018 were 0.52 mm. [22]. The calculated annual average median PWV value based on Era-5 data is 1.98 mm and decreases to 0.79 mm in January-February. The best conditions at Muztagh-ata site with daily median PWV less than 2 mm correspond to the period from October to March [23]. We will also provide some data for Suffa Observatory. Here, seasonal changes in PWV values are smoother. The PWV peak is in July-August and reaches 9.5 mm. Minimum values of PWV are also observed in winter. In January, the median PWV decreases to 2.5-2.7 mm.
3.2. Vertical Integrals of Water Vapour Fluxes
Another interesting characteristic of atmospheric water vapor content is the vertical integral of water vapour flux. This quantity is a certain derivative function of PWV. Figure 4 and Figure 5 show eastward and northward water vapour fluxes for different months.
It characterizes the horizontal rate of flow of water vapour per metre across the flow, for a column of air extending from the surface of the Earth to the top of the atmosphere. Analysis of the figures shows that the selected locations are in areas with low and moderate (positive or negative values) of water vapour fluxes. Specifically, Khulugaysha Peak corresponds to areas of negative values of northward water vapour flux associated with colder and drier air masses. Tashanta is also located in areas of negative values of northward water vapour flux, but of lesser intensity. Despite the fact that the figures show medians of fluxes, large amplitudes of its values (with a certain degree of probability) characterize the power of the cold air flow (the source is often located remotely). Considering the north-south orientation of the air flow, a definite exception among the sites under consideration is the Suffa Observatory (in January). At this time, the southern air transfer prevails over the observatory.
As for the power of the west-east air transfer, the figures show that the selected sites are in variable conditions. However, the locations are not subject to strong west-east air transfer. This indicates a greater contribution of local factors to astroclimatic conditions.
4. Machine Learning to Obtain More Accurate Values of PWV for Selected Astronomical Sites
Machine learning is a very useful tool in many scientific fields. In order to obtain more accurate estimates of precipitatable water vapor for the selected sites (Khulugaysha Peak and Tashanta), we propose to use the following approach. Considering that the GNSS measurement data are reference, in the first step we form an array of measurement data for a set of stations in the selected region. In our case, we have chosed Arti, Aruch-Yerevan, Kars, Kazan and Zelenchukskaya. For prediction of PWV, we have used the input variables from reanalysis ERA-5: vertical profiles of air temperature and humidity, dew point temperature at the Earth’s surface, and the height of the atmospheric boundary layer. Thus, the inputs of the neural network were meteorological characteristics from the reanalysis data, and the output was the measured value of PWV.
Using the Python, as well as the TensorFlow and Keras packages, we create a number of neural networks that predict variations of PWV. The structure of the neural network was set before training, using a different number of layers, from 4 to 30. At the same time, the structure of the neural network model that provides the best agreement between measured and model values of PWV contains 10 layers, the number of training epochs is 200. With an increase in the number of layers, the ability of the model to reproduce variations decreased, despite an increase in the number of training epochs. Figure 6 shows deviations between measured and model values of PWV. Analysis of the figure shows that the values of precipitable water vapor obtained with the neural network better correspond to the measured PWV. The root mean square (RMS) deviation of PWV values without using neural networks is 4.5 mm. With a neural network, the RMS is reduced to 2.8 mm.
5. Atmospheric Opacities with Millimeter-Wave Propagation Models
One of the key atmospheric characteristics for ground-based radio astronomy observations at short millimeter and submillimeter waves is opacity, primarily related to the water vapor and oxygen content in the atmosphere. Due to the limited measurements both in time and space, atmospheric models play a major role in estimation of atmospheric opacity. In particular, we used the well-known models (LIEBE, HITRAN/PARDO and JPL/PARDO) for calculation of atmospheric opacity above new sites (Tashanta, Hulugaisha) and the Special Astrophysical Observatory (SAO). Figure 7 shows the dependencies of atmospheric opacity on precipitable water vapor for three sites with high astroclimatic characteristics. For the best sites within Russia, seasonal changes in atmospheric opacities are shown in Table 2. Analyzing the presented data, we can conclude that the Khulugaysha Peak has better conditions for millimeter (and also submillimeter) observations in comparison with Tashanta.
6. Conclusions
The following is a summary of the conclusions. This paper focuses on determination of the distributions of PWV within a selected macroregion and estimation of optical opacity of the atmosphere for selected sites for the deployment of new submillimeter/millimeter telescopes. In particular, statistical analysis of PWV in the locations of interest allowed us to obtain the following conclusions:
i)Averaged spatial distributions of PWV for January, April, July and October are determined. Areas with high wind gust values within the surface layer of the atmosphere are excluded from these distributions. In perspective, these distributions will make it possible to identify new sites for ground-based millimeter/submillimeter telescopes.
ii) In order to improve the accuracy of estimations of PWV, it is proposed to use deep neural networks based on the ERA-5 reanalysis data. It is shown that the deviation decreases by 1.6 times.
iii) High absolute altitudes combined with low air temperatures in the locations of Khulugaysha Peak and Tashanta result in low water vapor content in the atmospheric column. This is especially pronounced during the cold period. The sites are located within areas with high astroclimatic characteristics. The dependencies of the optical opacity on PWV for Khulugaysha Peak, Tashanta and the Special Astrophysical Observatory are obtained. These dependencies can be used to estimate the average values of the optical opacity for different frequencies (100 GHz, 150 GHz, 225 GHz). The diagrams also make it possible to determine the inversion points where the opacity values estimated for different frequencies become equal to each other.
iv) Seasonal changes in absorption coefficients for water vapor and oxygen are estimated. These estimates, obtained from the modeling results, can be useful in organizing and planning field measurements in certain time intervals. We can conclude that the Khulugaysha Peak has better conditions for placing millimeter telescope in comparison with Tashanta.
Author Contributions
Investigation, visualization, writing—review and editing: A.Y.S. and P.G.K.; methodology: A.Y.S., P.G.K. and P.B.L.; formal analysis, investigation, visualization: A.Y.S.; software, visualization: A.Y.S and P.B. All authors have read and agreed to the published version of the manuscript.
Funding
This research was funded by the RSF grant № 24-72-10043.
Institutional Review Board Statement
Not applicable.
Informed Consent Statement
Not applicable.
Data Availability Statement
Data used are available on request from the corresponding author.
Acknowledgments
The approaches were previously tested using the Unique Research Facility "Large Solar Vacuum Telescope" (http://ckp-rf.ru/usu/200615/).
Conflicts of Interest
The authors declare no conflicts of interest.
References
- Antoshkin, L.V.; Botygina, N.N.; Bolbasova, L.A.; Emaleev, O.N.; Konyaev, P.A.; Kopylov, E.A.; Kovadlo, P.G.; Kolobov, D.Y.; Kudryashov, A.V.; Lavrinov, V.V.; et al. Adaptive optics system for solar telescope operating under strong atmospheric turbulence Atmos. Ocean. Opt. 2017, 30, 291–299.
- Wang, L.; Schöck, M.; Chanan, G. Atmospheric turbulence profiling with slodar using multiple adaptive optics wavefront sensors. Appl. Opt. 2008, 47, 1880–1892.
- Rochau, B.; Brandner W.; Stolte A.; Henning T.; Da Rio N.; Gennaro M.; Hormuth F.; Marchetti E.; Amico P. A benchmark for multiconjugated adaptive optics: VLT–MAD observations of the young massive cluster Trumpler 14 Monthly Notices of the Royal Astronomical Society 2011, 418, 2, 949–959. [CrossRef]
- Zhang, L.; Guo, Y.; Rao, C. Solar multi-conjugate adaptive optics based on high order ground layer adaptive optics and low order high altitude correction Opt. Express 2017, 25, 4356–4367. [CrossRef]
- Ramasawmy, J.; Klaassen, P.D.; Cicone, C.; Mroczkowski, T.K.; Chen, C.-C.; Cornish, T.; da Cunha, E.; Hatziminaoglou, E.; Johnstone, D.; Liu, D.; Perrott, Y.; Schmek, A.; Stanke, T.; Wedemeyer, S. The Atacama Large Aperture Submillimetre Telescope: key science drivers Proc. SPIE 2022, 12190, 1219007. [CrossRef]
- Rudakov, K.I.; Dmitriev, P.N.; Baryshev, A.M.; Khudchenko, A.V.; Hesper, R.; Koshelets, V.P. Low-Noise Sis Receivers for New Radio-Astronomy Projects Radiophysics and Quantum Electronics 2019, 63, 547–555. [CrossRef]
- Likhachev, S.F.; Rudnitskiy, A.G.; Andrianov, A.S.; Arkhipov, M. Yu.; Baryshev, A.M.; Vdovin, V.F.; Golubev, E.S.; Kostenko, V.I; Larchenkova, T.I.; Pilipenko, S.V.; Podobedov, Ya.G.; Razananirina, J.C.; Tretyakov, I. V.; Fedorchuk, S. D.; Khudchenko, A. V.; Cherniy, R. A.; Shchurov, M.A. Subterahertz Astronomy in the Russian Federation: Prospects and Directions Cosmic Res. 2024, 62, 117–131. [CrossRef]
- Zinchenko, I.I.; Lapinov, A.V.; Vdovin, V.F.; Zemlyanukha, P.M.; Khabarova, T.A. Measurements and Evaluations of the Atmospheric Transparency at Short Millimeter Wavelengths at Candidate Sites for Millimeter- and Sub-Millimeter-Wave Telescopes. Appl. Sci. 2023, 13, 11706. [CrossRef]
- Bubnov, G.M.; Abashin, E.B.; Balega, Y.Y.; Bolshakov, O.S.; Dryagin, S.Y.; Dubrovich, V.K.; Marukhno, A.S.; Nosov,V.I.; Vdovin, V.F.; Zinchenko I.I. Searching for New Sites for THz Observations in Eurasia. IEEE Trans. Terahertz Sci. Technol. 2015, 5, 64–72. [CrossRef]
- Bubnov, G.; Vdovin, V.; Khaikin, V.; Tremblin, P.; Baron, P. Analysis of variations in factors of specific absorption of sub-terahertz waves in the Earth`s atmosphere. In Proceedings of the 7th All-Russian Microwave Conference (RMC), Russia, Moscow, 25–27 November 2020; Volume 5, pp. 229–232. [CrossRef]
- Balega, Y.; Bataev, D.K.-S.; Bubnov, G.M.; Vdovin, V.F.; Zemlyanukha, P.M.; Lolaev, A.B.; Lesnov, I.V.; Marukhno, A.S.; Marukhno, N.A.; Murtazaev, A.K.; et al. Direct Measurements of Atmospheric Absorption of Subterahertz Waves in the Northern Caucasus. Dokl. Phys. 2022, 61, 1–4. [CrossRef]
- Otarola, A.; Breuck, C.D.; Travouillon, T.; Matsushita, S.; Nyman, L.A.; Wootten, A.; Radford, S.J.E.; Sarazin, M.; Kerber, F.; Perez-Beaupuits, J.P. Precipitable Water Vapor, Temperature, and Wind Statistics At Sites Suitable for mm and Submm Wavelength Astronomy in Northern Chile. PASP 2019, 131, 045001. [CrossRef]
- Khaikin, V.; Lebedev, M.; Shmagin, V.; Zinchenko, I.; Vdovin, V.; Bubnov, G.; Edelman, V.; Yakopov, G.; Shikhovtsev, A.; Marchiori, G.; et al. On the Eurasian SubMillimeter Telescopes Project (ESMT). In Proceedings of the 7th All-Russian Microwave Conference (RMC), Moscow, Russia, 25–27 November 2020; pp. 47–51. [CrossRef]
- Deng, L., Yang, F., Chen, X.; He, F.; Liu, Q.; Zhang, B.; Zhang, C.; Wang, K.; Liu, N.; Ren, A.; Luo, Z.; Yan, Z.; Tian, J.; Pan, J. Lenghu on the Tibetan Plateau as an astronomical observing site. Nature. 2021, 596, 353–356. [CrossRef]
- Zhang, J.; Zhao, Y.; Gao, J.; Esamdin, A.; Zhang, W.; Yuan, X.; Feng, G.; Niu, H.; Gu, W.; Zhang, X.; Bai, C.Characterizing long-term astroclimate parameters at the Muztagh-Ata site in the Pamir plateau with ERA5 and MERRA-2 data. Monthly Notices of the Royal Astronomical Society 2024, 535, 4, 3543–3549. [CrossRef]
- Tillayev, Y.; Azimov, A.; Ehgamberdiev, S.; Ilyasov, S. Astronomical Seeing and Meteorological Parameters at Maidanak Observatory. Atmosphere. 2023, 14, 199. [CrossRef]
- Qian, X.; Yao, Y.; Wang, X.; Zou, L.; Li, Y.; Yin, J. Validation of the WRF Model for Estimating Precipitable Water Vapor at the Ali Observatory on the Tibetan Plateau. Publications of the Astronomical Society of the Pacific. 2020, 132, 125003. [CrossRef]
- Stolyarov, V.A; Balega, Y.Y.; Mingaliev, M.G.; et al. Prospects of Millimeter Astronomy Development at the Special Astrophysical Observatory of the Russian Academy of Sciences (SAO RAS). Astrophys. Bull. 2024, 79, 321–339. [CrossRef]
- Valeria, L.; Martinez-Ledesma, M.; Reeves, R. Satellite-based atmospheric characterization for sites of interest in millimeter and sub-millimeter astronomy. Astronomy and Astrophysics. 2024, 684, A186. [CrossRef]
- Hersbach, H.; Bell, B.; Berrisford, P.; Hirahara, S.; Horányi, A.; Muñoz-Sabater, J.; Nicolas,J.; Peubey, C.; Radu, R.; Schepers, D.; et al. The ERA5 global reanalysis. Q. J. R. Meteorol. Soc. 2020, 146, 1999–2049. [CrossRef]
- Bai, J.; Lou, Y; Zhang, W.; Zhou, Y.; Zhang, Z.; Shi, C. Assessment and calibration of MODIS precipitable water vapor products based on GPS network over China. Atmospheric Research 2021, 254, 105504. [CrossRef]
- Feng, L.; Hao, J.-X.; Cao, Z.-H.; Bai, J.-M.; Yang, J.; Zhou, X.; Yao, Y.-Q.; Hou, J.-L.; Zhao, Y.-H., Liu, Y. Site testing campaign for the Large Optical/infrared Telescope of China: overview. Atmospheric Research 2020, 20, 080. [CrossRef]
- Xu, J.; Li, M.; Esamdin, A.; Wang, N.; Pu, G.; Wang, L.; Feng, G.; Zhang, X.; Ma, S.; Lv, J.; Zheng, X. Site-testing at Muztag-Ata site. IV. Precipitable Water Vapor. PASP 2022, 134, 015006. [CrossRef]
- Nosov, V.V.; Lukin, V.P.; Nosov, E.V.; Torgaev, A.V.; Afanas’ev, V.L.; Balega, Y.Y; Vlasyuk, V.V.; Panchuk, V.E.; Yakopov, G.V. Astroclimate Studies in the Special Astrophysical Observatory of the Russian Academy of Sciences. Atmos. Ocean. Opt. 2019, 32, 8–18. [CrossRef]
Figure 1.
2D distributions of PWV from GNSS and ERA-5
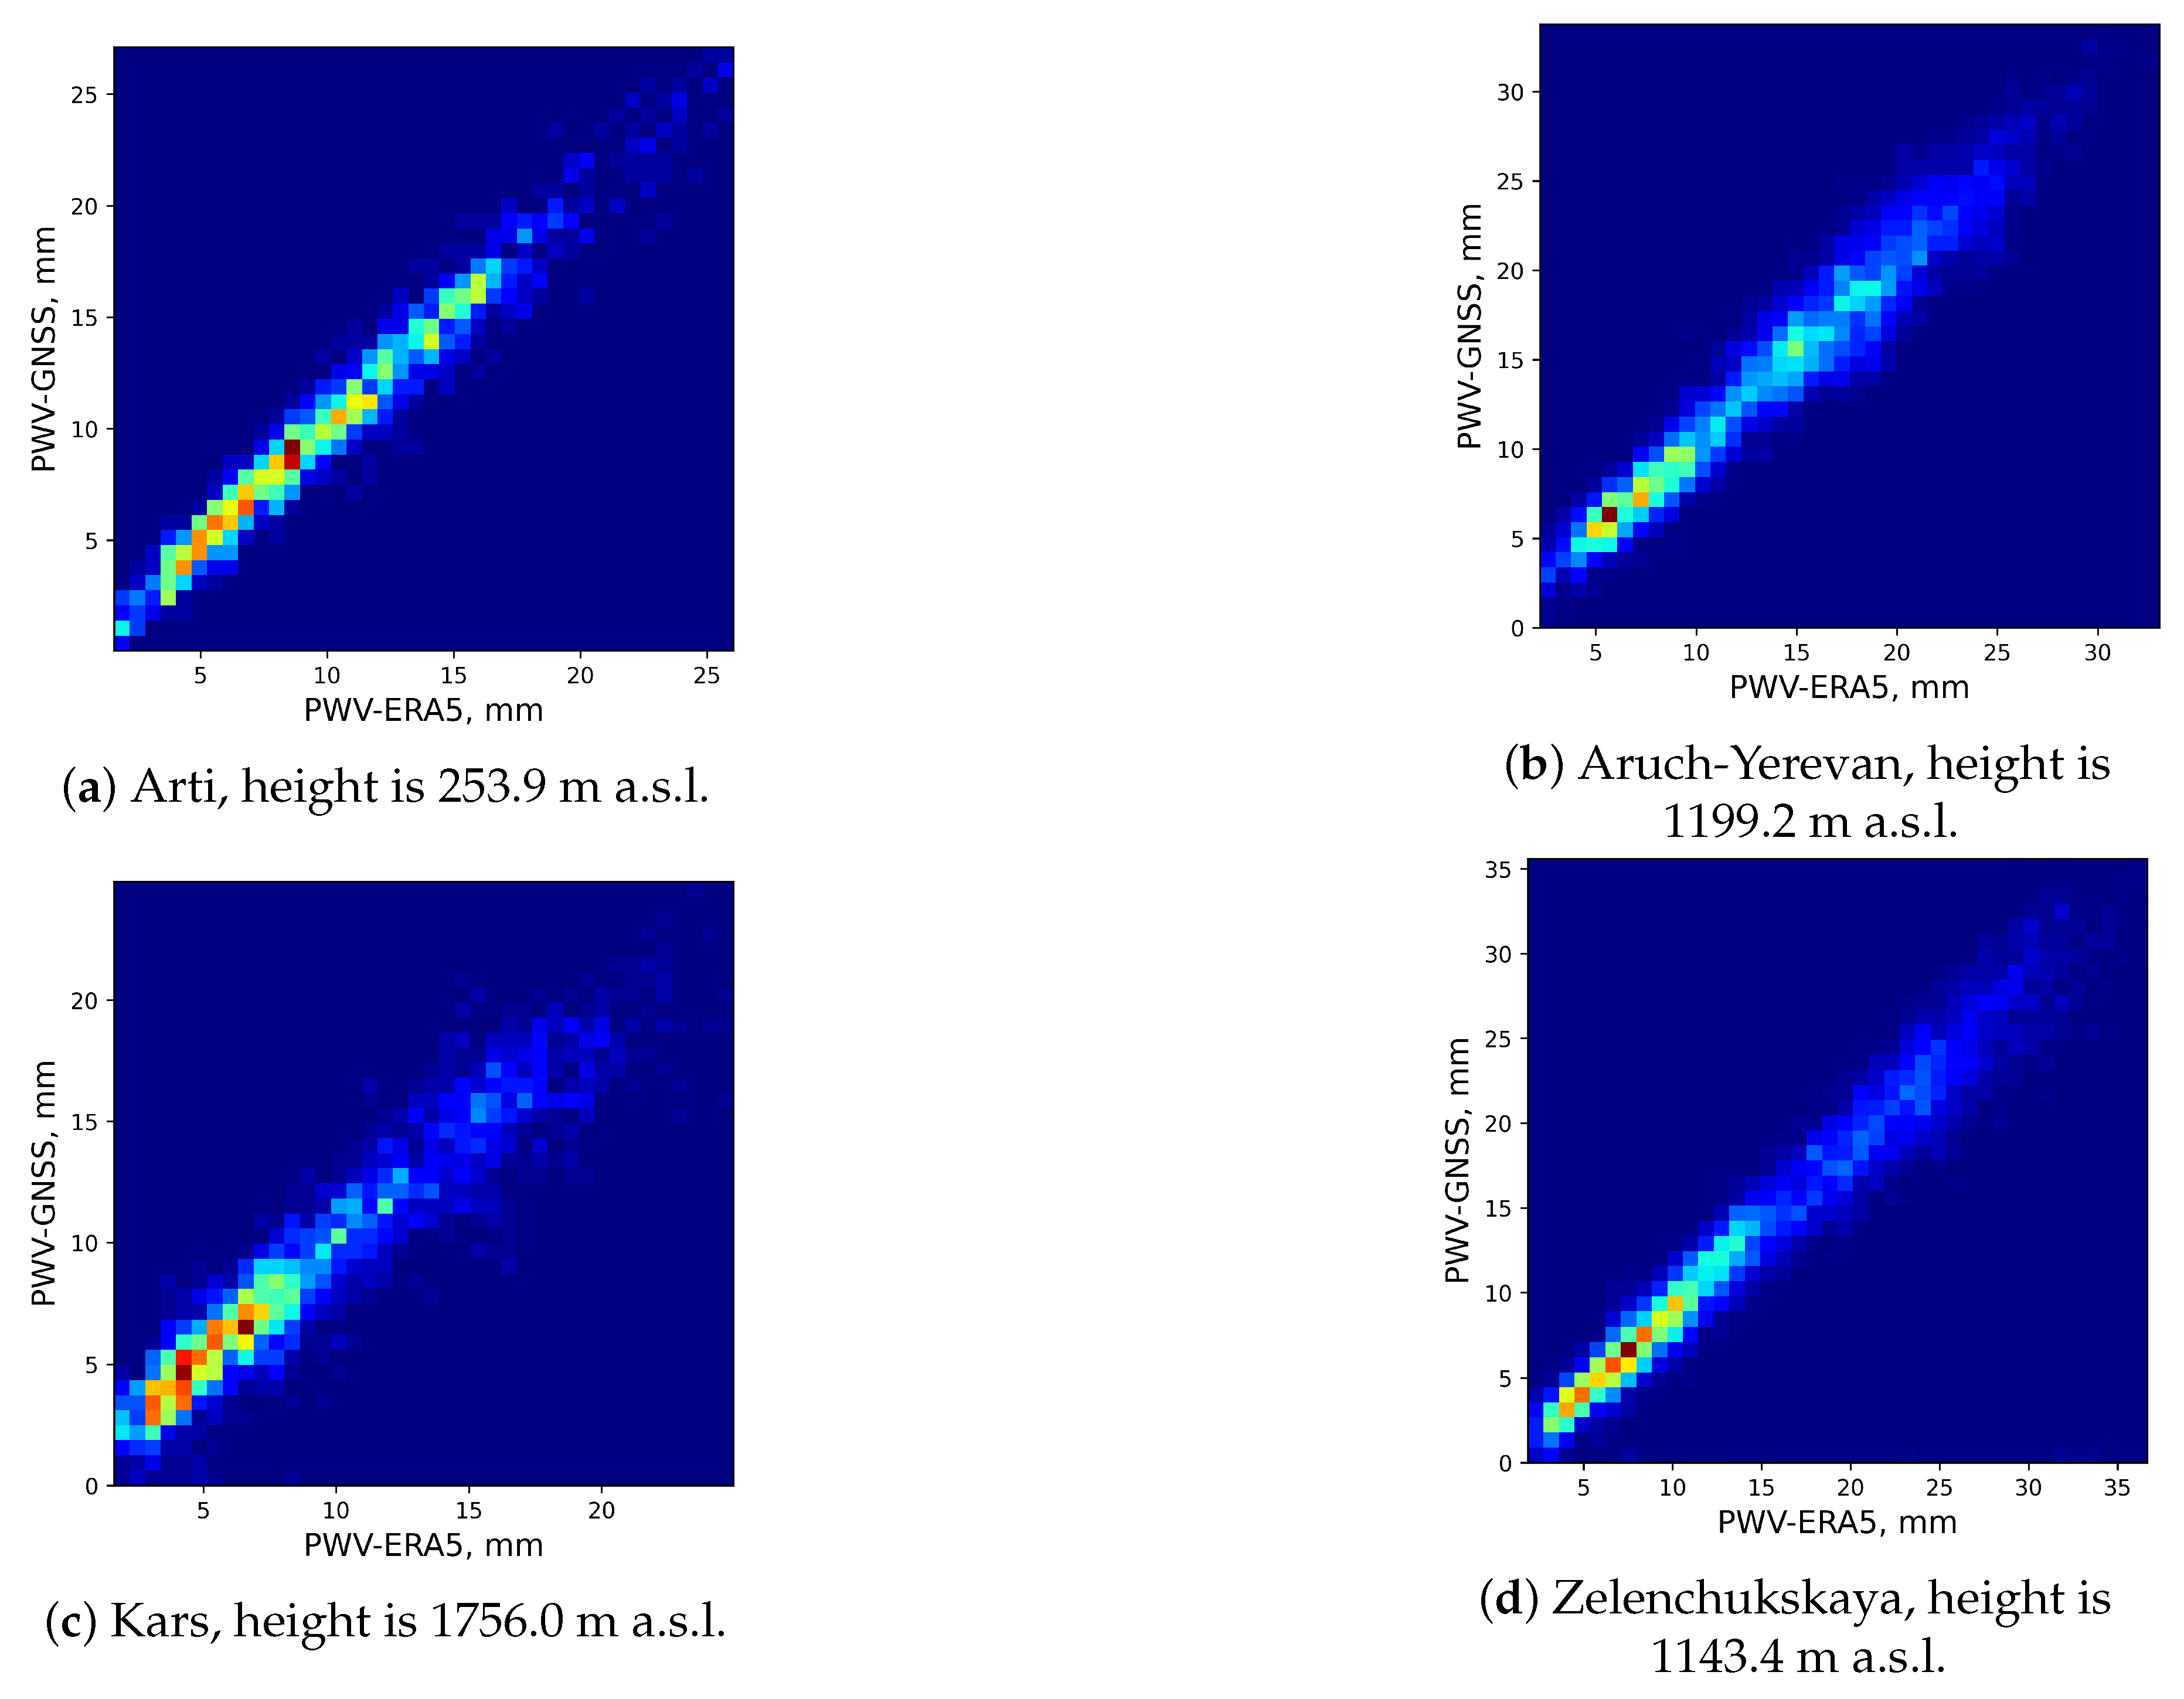
Figure 2.
Spatial distributions of PWV medians for different months
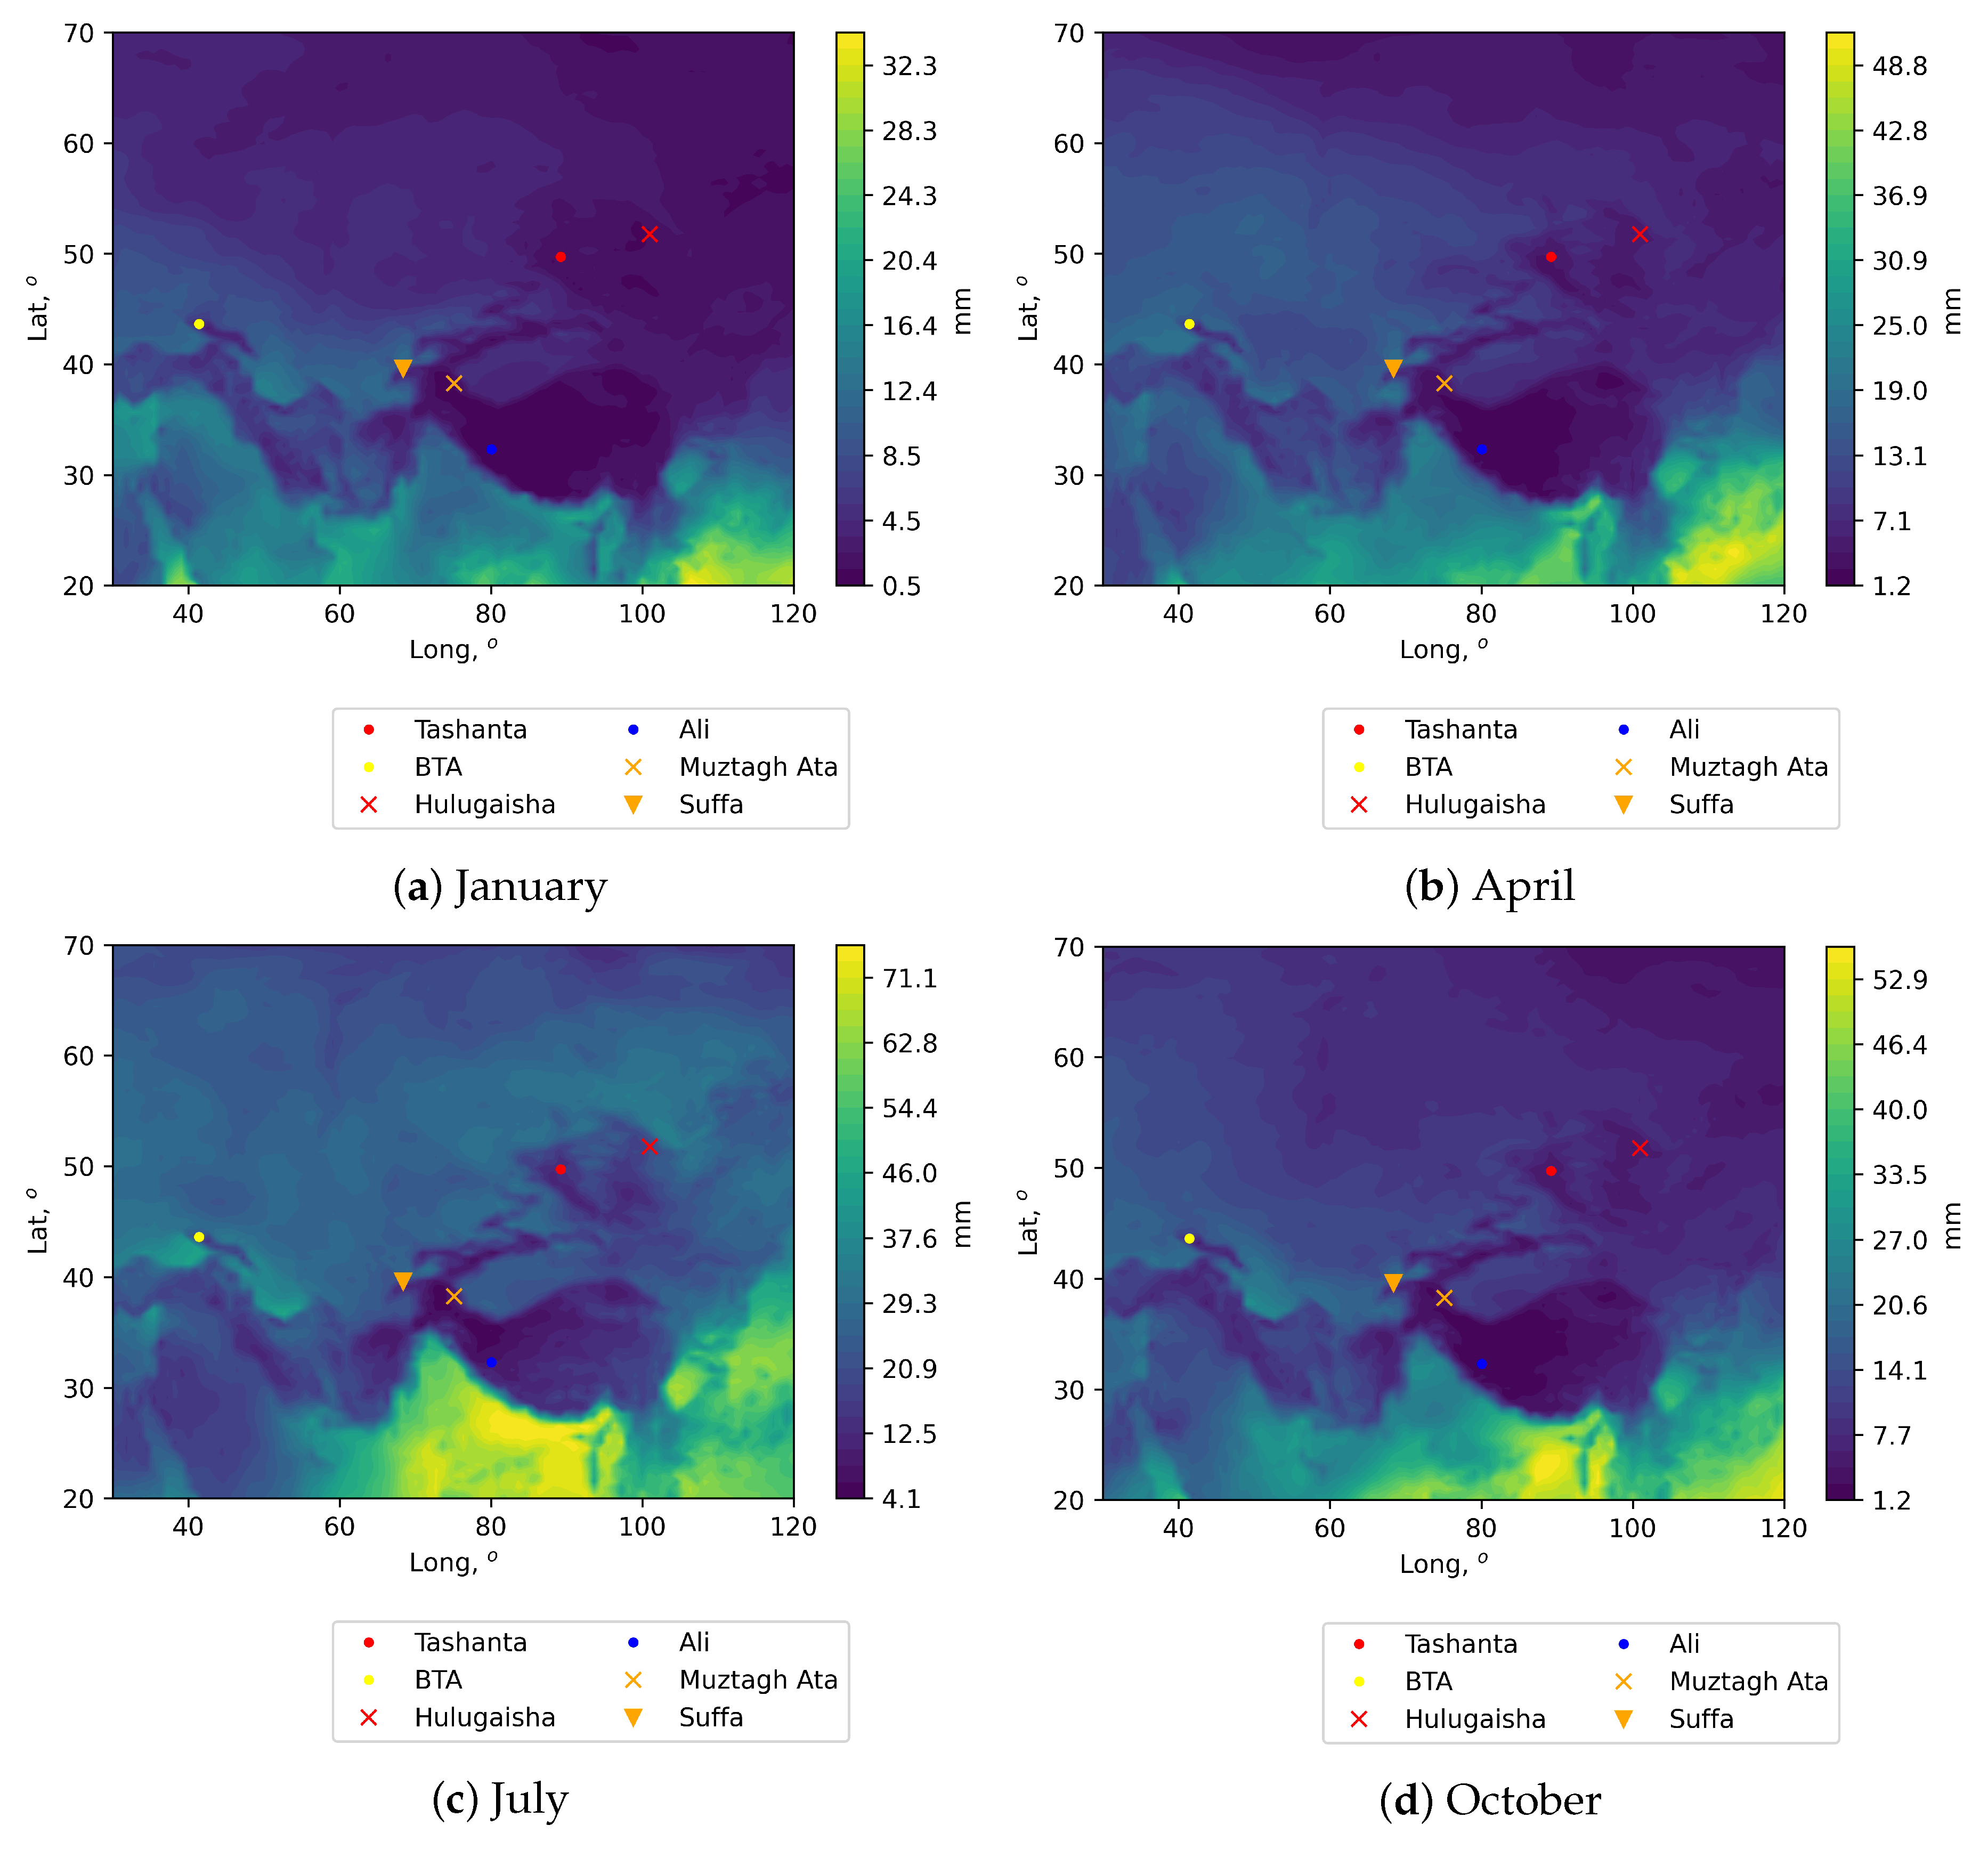
Figure 3.
Spatial distributions of PWV medians for different months. Areas with strong wind gusts within the surface layer are excluded
Figure 3.
Spatial distributions of PWV medians for different months. Areas with strong wind gusts within the surface layer are excluded
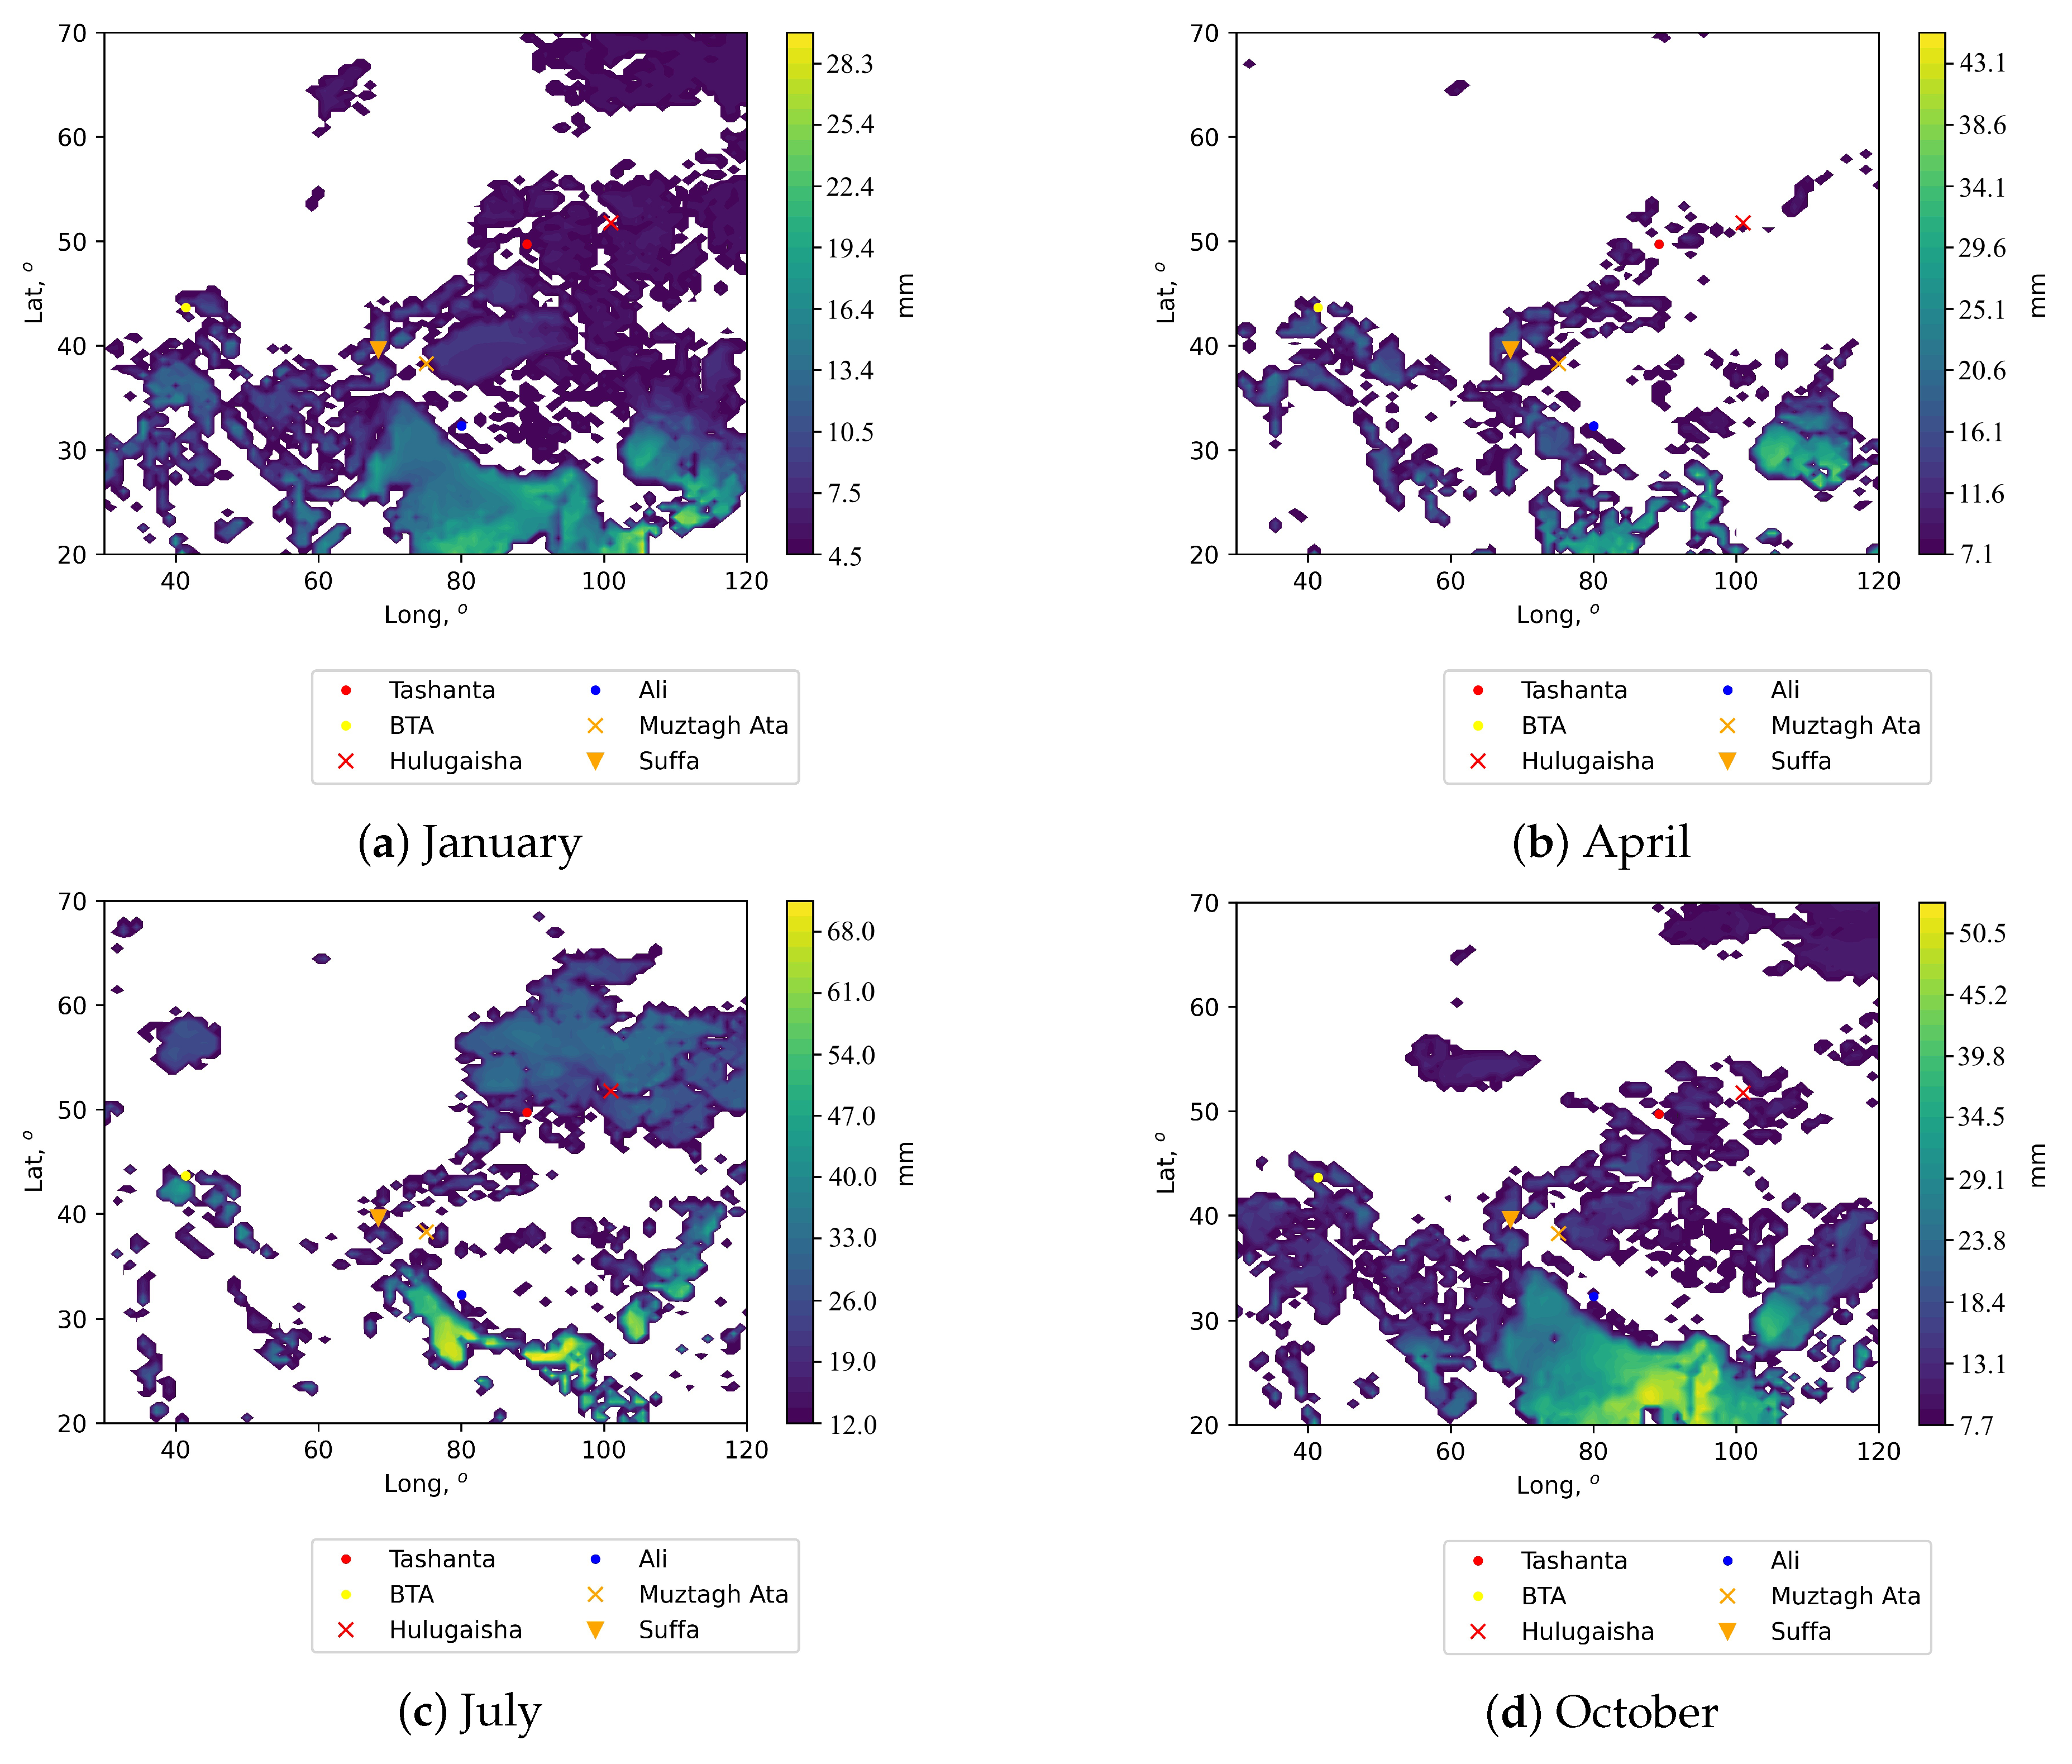
Figure 4.
Spatial distributions of vertical integral of northward water vapour flux for different months.Positive values indicate a flux from south to north.
Figure 4.
Spatial distributions of vertical integral of northward water vapour flux for different months.Positive values indicate a flux from south to north.
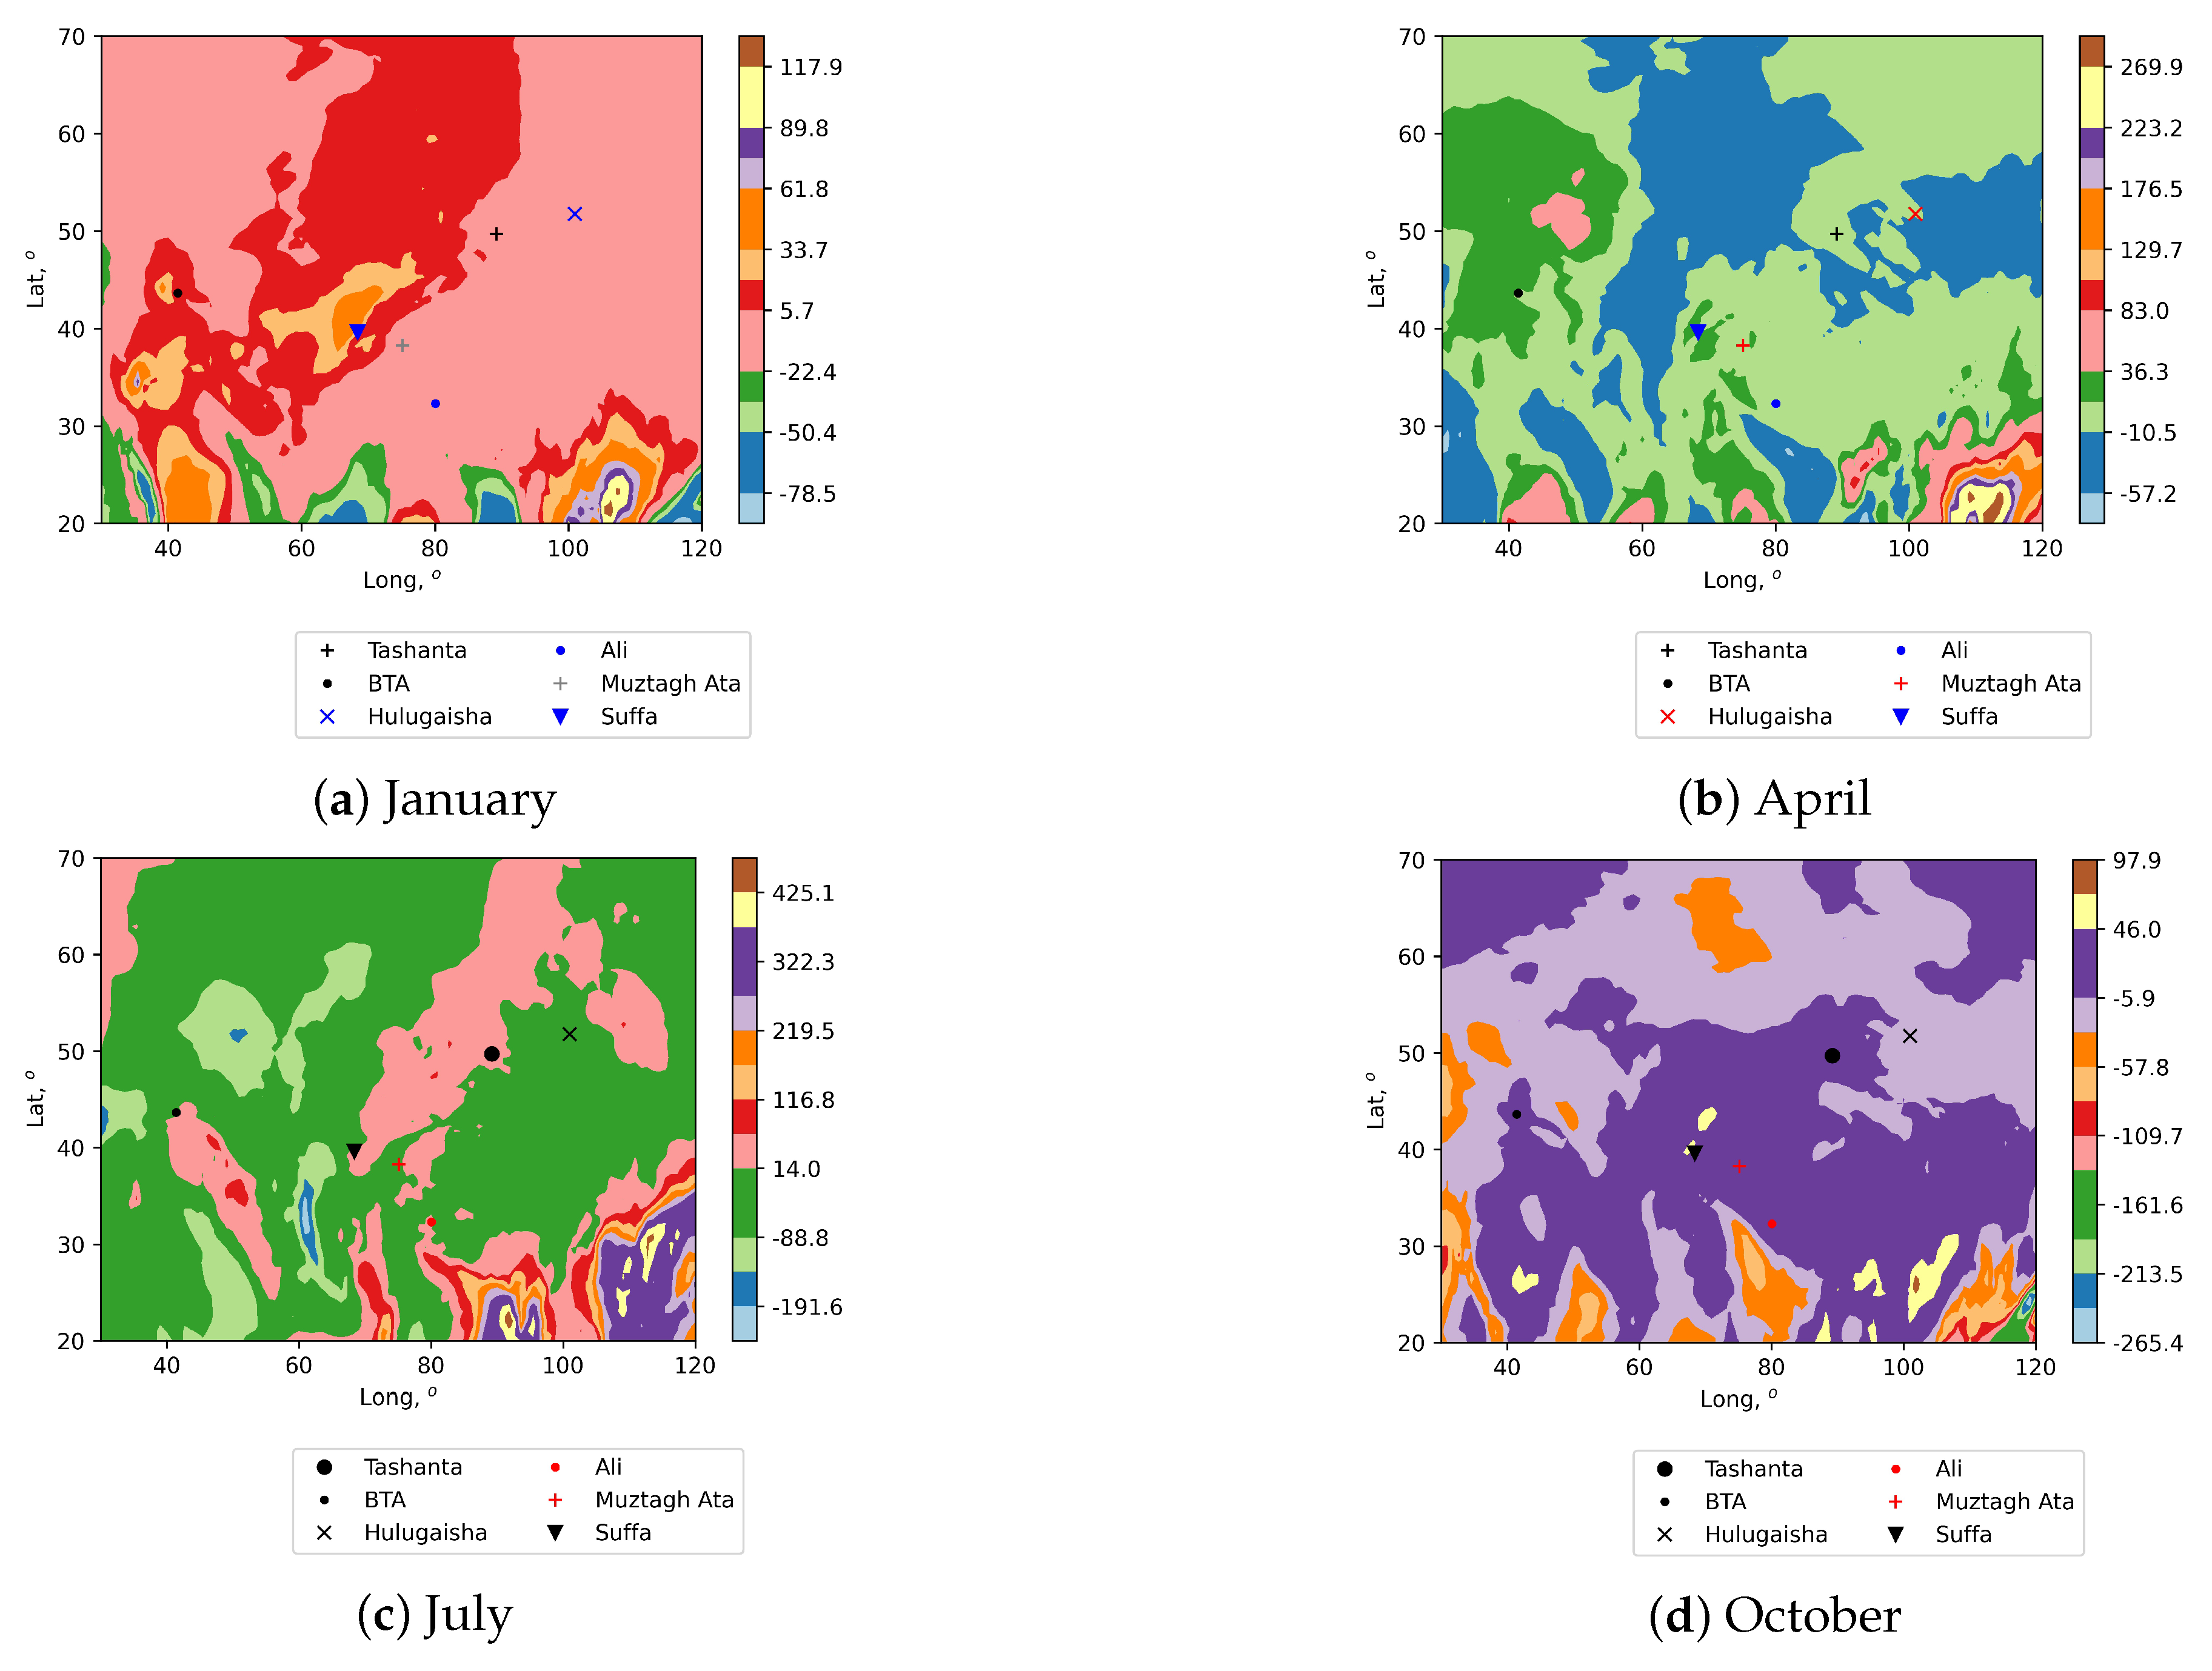
Figure 5.
Spatial distributions of vertical integral of eastward water vapour flux for different months. Positive values indicate a flux from west to east.
Figure 5.
Spatial distributions of vertical integral of eastward water vapour flux for different months. Positive values indicate a flux from west to east.
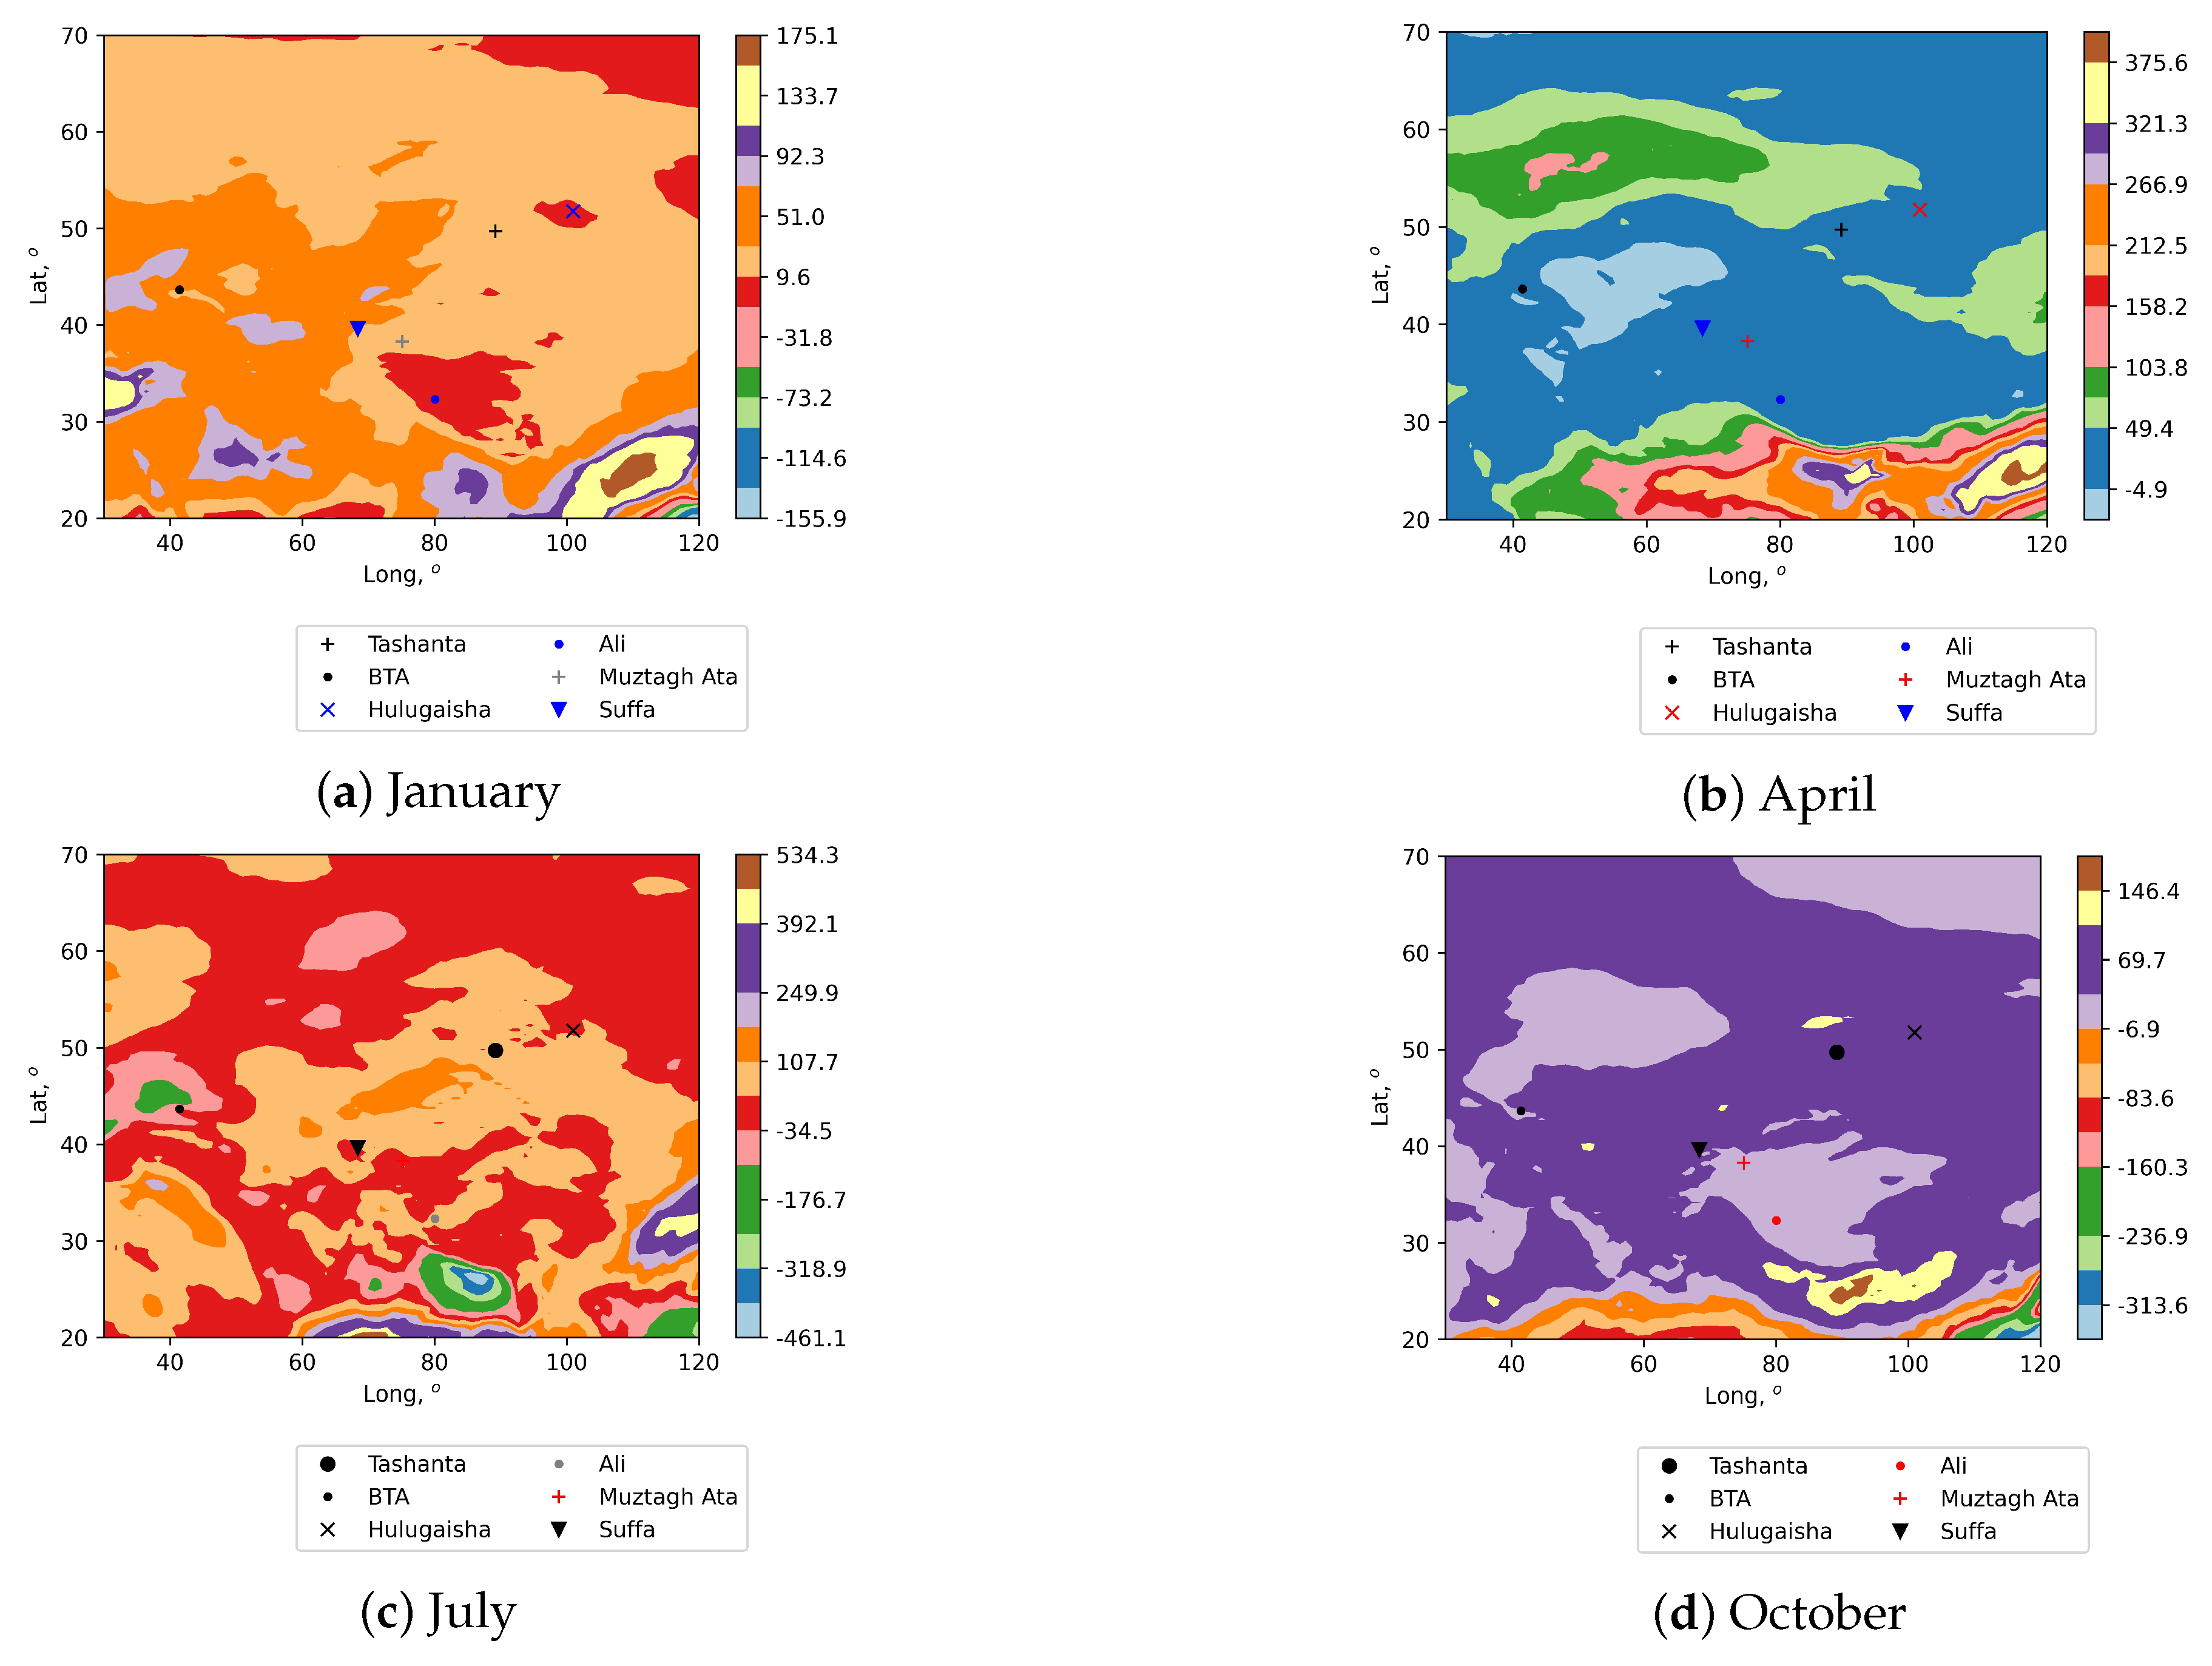
Figure 6.
Deviations between measured and predicted values of PWV (Neural Network)
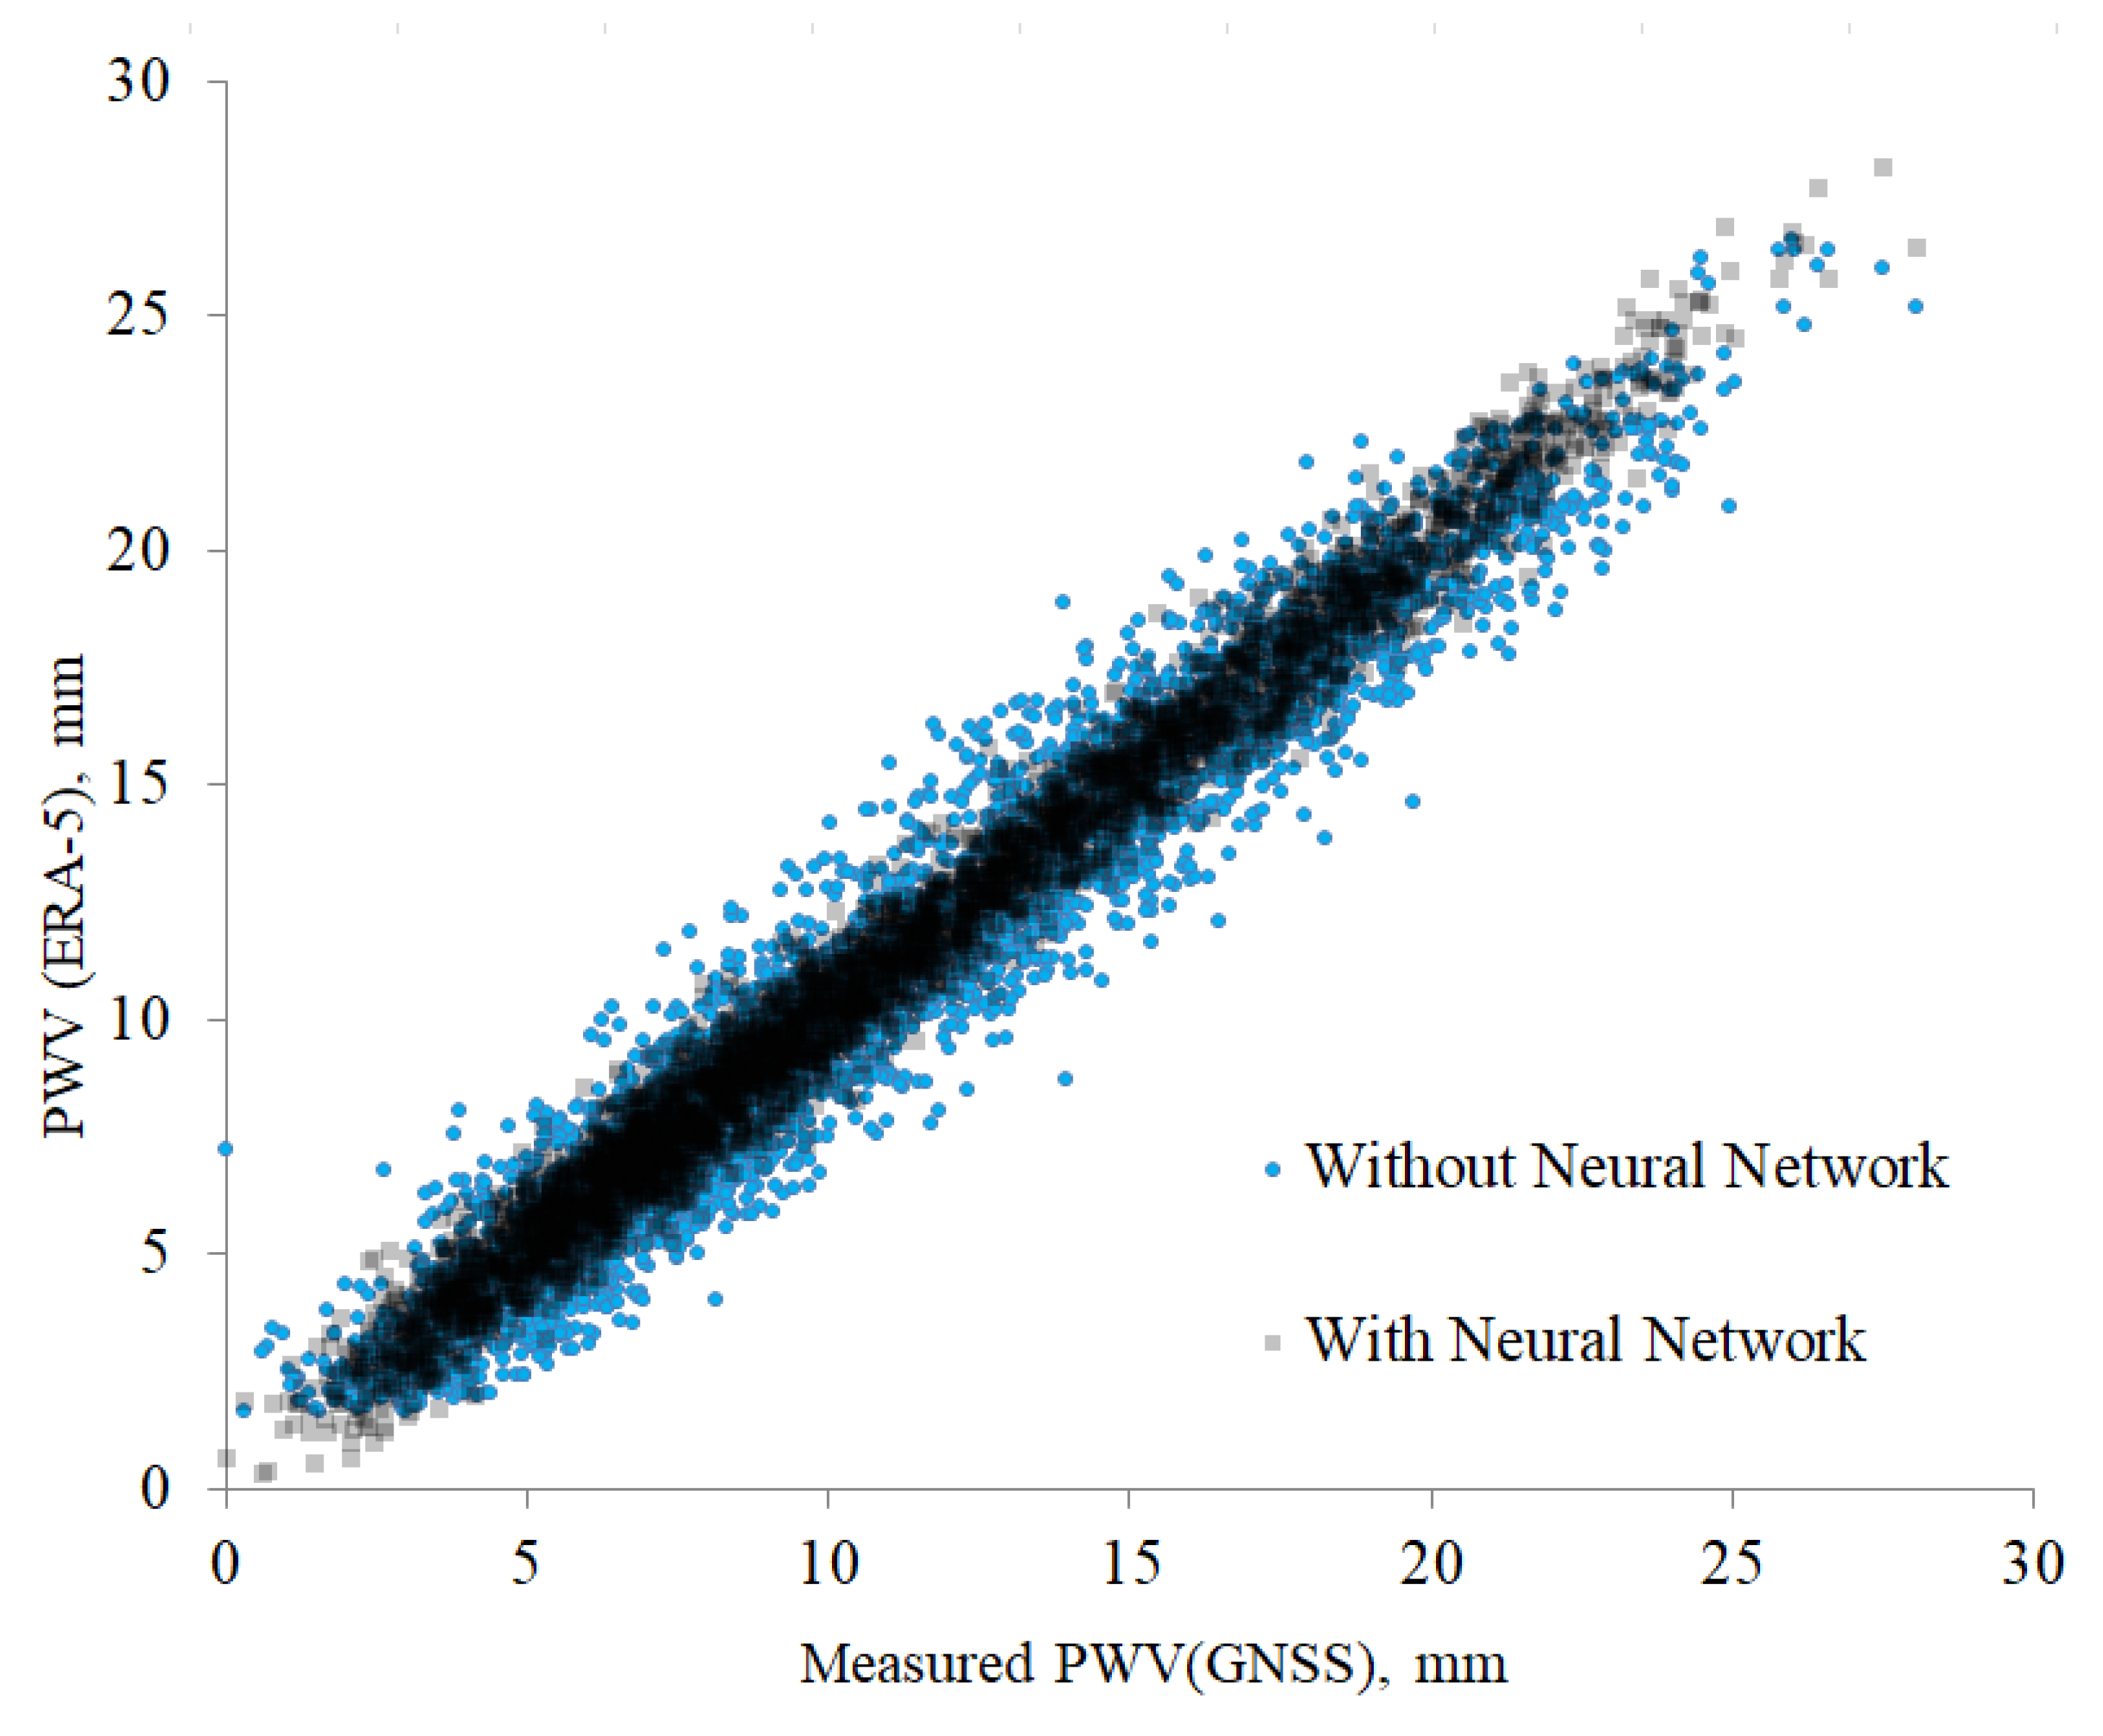
Figure 7.
Atmospheric opacities at the sites suitable for millimeter observations
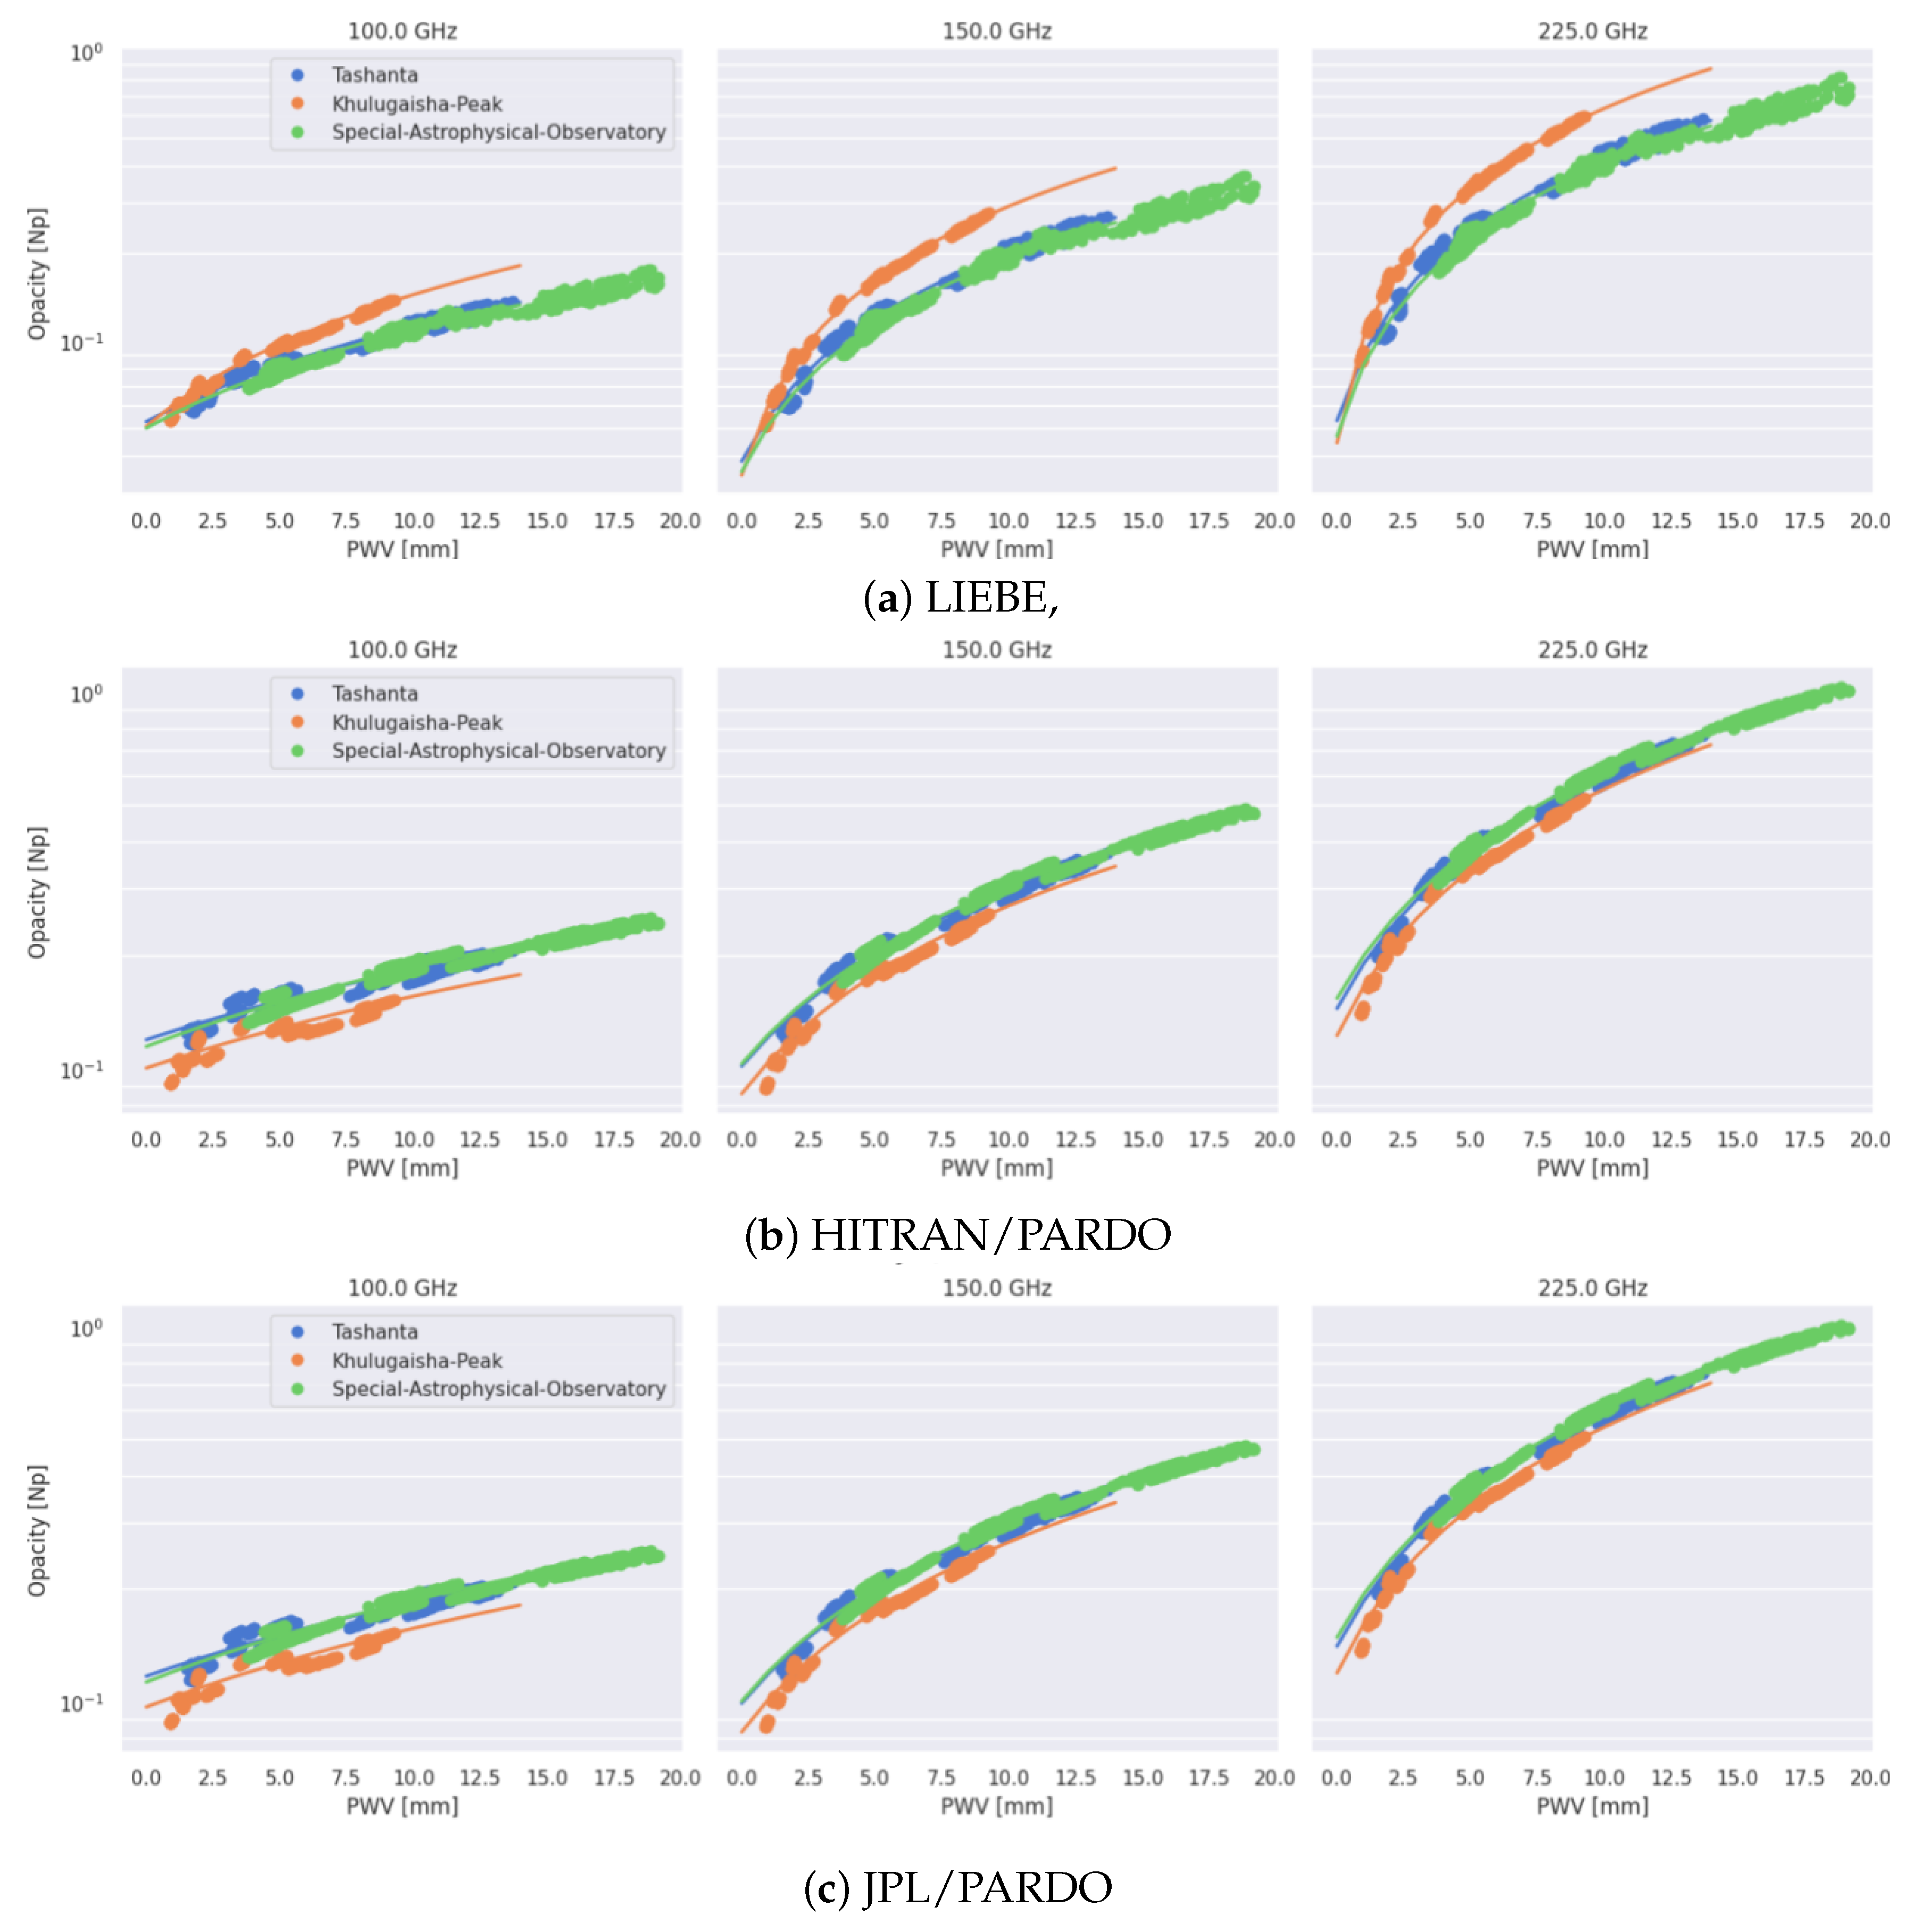

Table 1.
Coordinates of GNSS stations.
| Station | Coordinates |
|---|---|
| Arti | 58° 33 ′ 37 ″ N,56 ° 33 ′ 47 ″ E |
| Aruch-Yerevan | 44° 5 ′ 8 ″ N,40 ° 17 ′ 9 ″ E |
| Kars | 43° 5 ′ 36 ″ N,40 ° 35 ′ 18 ″ E |
| Zelenchukskaya | 41° 33 ′ 54 ″ N,43 ° 47 ′ 18 ″ E |
Table 2.
Atmospheric opacities at the sites suitable for millimeter observations. Khulugaisha Peak and Tashanta.
Table 2.
Atmospheric opacities at the sites suitable for millimeter observations. Khulugaisha Peak and Tashanta.
| Khulugaisha Peak | Tashanta | |||||
|---|---|---|---|---|---|---|
| 100 GHz | 150 GHz | 225 GHz | 100 GHz | 150 GHz | 225 GHz | |
| Month | Opacity | Opacity | Opacity | Opacity | Opacity | Opacity |
| LIEBE | ||||||
| 1 | 0.06 | 0.07 | 0.12 | 0.07 | 0.08 | 0.14 |
| 2 | 0.06 | 0.06 | 0.11 | 0.06 | 0.06 | 0.10 |
| 3 | 0.07 | 0.09 | 0.17 | 0.08 | 0.10 | 0.18 |
| 4 | 0.09 | 0.14 | 0.28 | 0.09 | 0.12 | 0.25 |
| 5 | 0.10 | 0.16 | 0.34 | 0.12 | 0.21 | 0.46 |
| 6 | 0.13 | 0.24 | 0.52 | 0.12 | 0.22 | 0.48 |
| 7 | 0.12 | 0.24 | 0.51 | 0.12 | 0.22 | 0.48 |
| 8 | 0.10 | 0.19 | 0.40 | 0.11 | 0.20 | 0.42 |
| 9 | 0.10 | 0.17 | 0.35 | 0.10 | 0.16 | 0.33 |
| 10 | 0.07 | 0.10 | 0.19 | 0.08 | 0.11 | 0.23 |
| 11 | 0.07 | 0.08 | 0.15 | 0.07 | 0.09 | 0.18 |
| 12 | 0.05 | 0.05 | 0.09 | 0.06 | 0.06 | 0.11 |
| HITRAN | ||||||
| 1 | 0.10 | 0.10 | 0.17 | 0.13 | 0.14 | 0.23 |
| 2 | 0.11 | 0.10 | 0.17 | 0.13 | 0.13 | 0.20 |
| 3 | 0.12 | 0.13 | 0.22 | 0.15 | 0.17 | 0.30 |
| 4 | 0.13 | 0.17 | 0.30 | 0.16 | 0.21 | 0.38 |
| 5 | 0.13 | 0.18 | 0.35 | 0.19 | 0.32 | 0.64 |
| 6 | 0.14 | 0.23 | 0.47 | 0.20 | 0.34 | 0.69 |
| 7 | 0.14 | 0.23 | 0.45 | 0.19 | 0.34 | 0.70 |
| 8 | 0.13 | 0.19 | 0.37 | 0.18 | 0.31 | 0.63 |
| 9 | 0.12 | 0.18 | 0.35 | 0.17 | 0.26 | 0.51 |
| 10 | 0.11 | 0.13 | 0.23 | 0.15 | 0.19 | 0.36 |
| 11 | 0.11 | 0.11 | 0.19 | 0.14 | 0.17 | 0.29 |
| 12 | 0.09 | 0.09 | 0.14 | 0.12 | 0.12 | 0.20 |
| JPL | ||||||
| 1 | 0.10 | 0.10 | 0.17 | 0.12 | 0.14 | 0.23 |
| 2 | 0.10 | 0.10 | 0.16 | 0.12 | 0.12 | 0.20 |
| 3 | 0.12 | 0.13 | 0.21 | 0.15 | 0.17 | 0.29 |
| 4 | 0.13 | 0.16 | 0.29 | 0.16 | 0.20 | 0.37 |
| 5 | 0.13 | 0.18 | 0.34 | 0.20 | 0.32 | 0.63 |
| 6 | 0.14 | 0.23 | 0.46 | 0.20 | 0.34 | 0.68 |
| 7 | 0.14 | 0.22 | 0.44 | 0.20 | 0.34 | 0.69 |
| 8 | 0.12 | 0.19 | 0.36 | 0.18 | 0.31 | 0.62 |
| 9 | 0.12 | 0.18 | 0.34 | 0.17 | 0.26 | 0.50 |
| 10 | 0.11 | 0.13 | 0.22 | 0.15 | 0.19 | 0.35 |
| 11 | 0.10 | 0.11 | 0.19 | 0.14 | 0.16 | 0.29 |
| 12 | 0.09 | 0.09 | 0.14 | 0.11 | 0.12 | 0.19 |
Disclaimer/Publisher’s Note: The statements, opinions and data contained in all publications are solely those of the individual author(s) and contributor(s) and not of MDPI and/or the editor(s). MDPI and/or the editor(s) disclaim responsibility for any injury to people or property resulting from any ideas, methods, instructions or products referred to in the content. |
© 2025 by the authors. Licensee MDPI, Basel, Switzerland. This article is an open access article distributed under the terms and conditions of the Creative Commons Attribution (CC BY) license (http://creativecommons.org/licenses/by/4.0/).
Copyright: This open access article is published under a Creative Commons CC BY 4.0 license, which permit the free download, distribution, and reuse, provided that the author and preprint are cited in any reuse.


