
Submitted:
13 March 2025
Posted:
21 March 2025
You are already at the latest version
Abstract
This study compares the growth rates of brown trout (Salmo trutta) and rainbow trout (Oncorhynchus mykiss) under controlled conditions using bioenergetic modeling. Both species were subjected to identical environmental parameters, including water temperature, feeding rates, and diet composition. Growth trajectories were analyzed over short (35-day) and long (365-day) periods based on published body composition and metabolic data. Results indicate that brown trout exhibit superior growth at lower temperatures (optimal up to ~10–12°C), whereas rainbow trout outperform brown trout in warmer conditions, particularly above 12°C. The findings highlight the influence of thermal preference on species distribution and aquaculture dominance, with rainbow trout being better suited for higher temperature environments. These insights contribute to a deeper understanding of species-specific growth efficiencies and their implications for aquaculture and fisheries management.
Keywords:
brook trout
; brown trout
; rainbow trout
; bioenergetics
; growth rate
; aquaculture
; temperature preference
1.1. Introduction
Brown trout is a native fish species in Europe, whereas rainbow trout and brook trout (Salvelinus fontinalis) were introduced from North America in the late 1800s for aquaculture purposes (Rasmussen et al. 2019). By the early 1900s, rainbow trout had largely replaced brown trout in European aquaculture, with an annual production of approximately 190,000 metric tons (FAOSTAT). In contrast, brown trout are now primarily cultivated for restocking rivers as fry, fingerlings, and smolt.
Brook trout in Denmark is known to have spawned up to ten small populations in several rivers in Jutland, Denmark. However, today brook trout is only found in self-sustaining populations in two rivers in cold-water (constant water temperature 7-8 °C) stream sections above brown trout sections (varying water temperature 2-15 °C). This is probably because of the different temperature preference between the two species, and interspecific competition (Scott Crossman 1973, Waters 1999, Rasmussen 2012).
The results here were presented at the Salmonids Symposium 2023 in Mallorca.
1.2. The Streams with Brook Trout, Brown Trout and Rainbow Trout
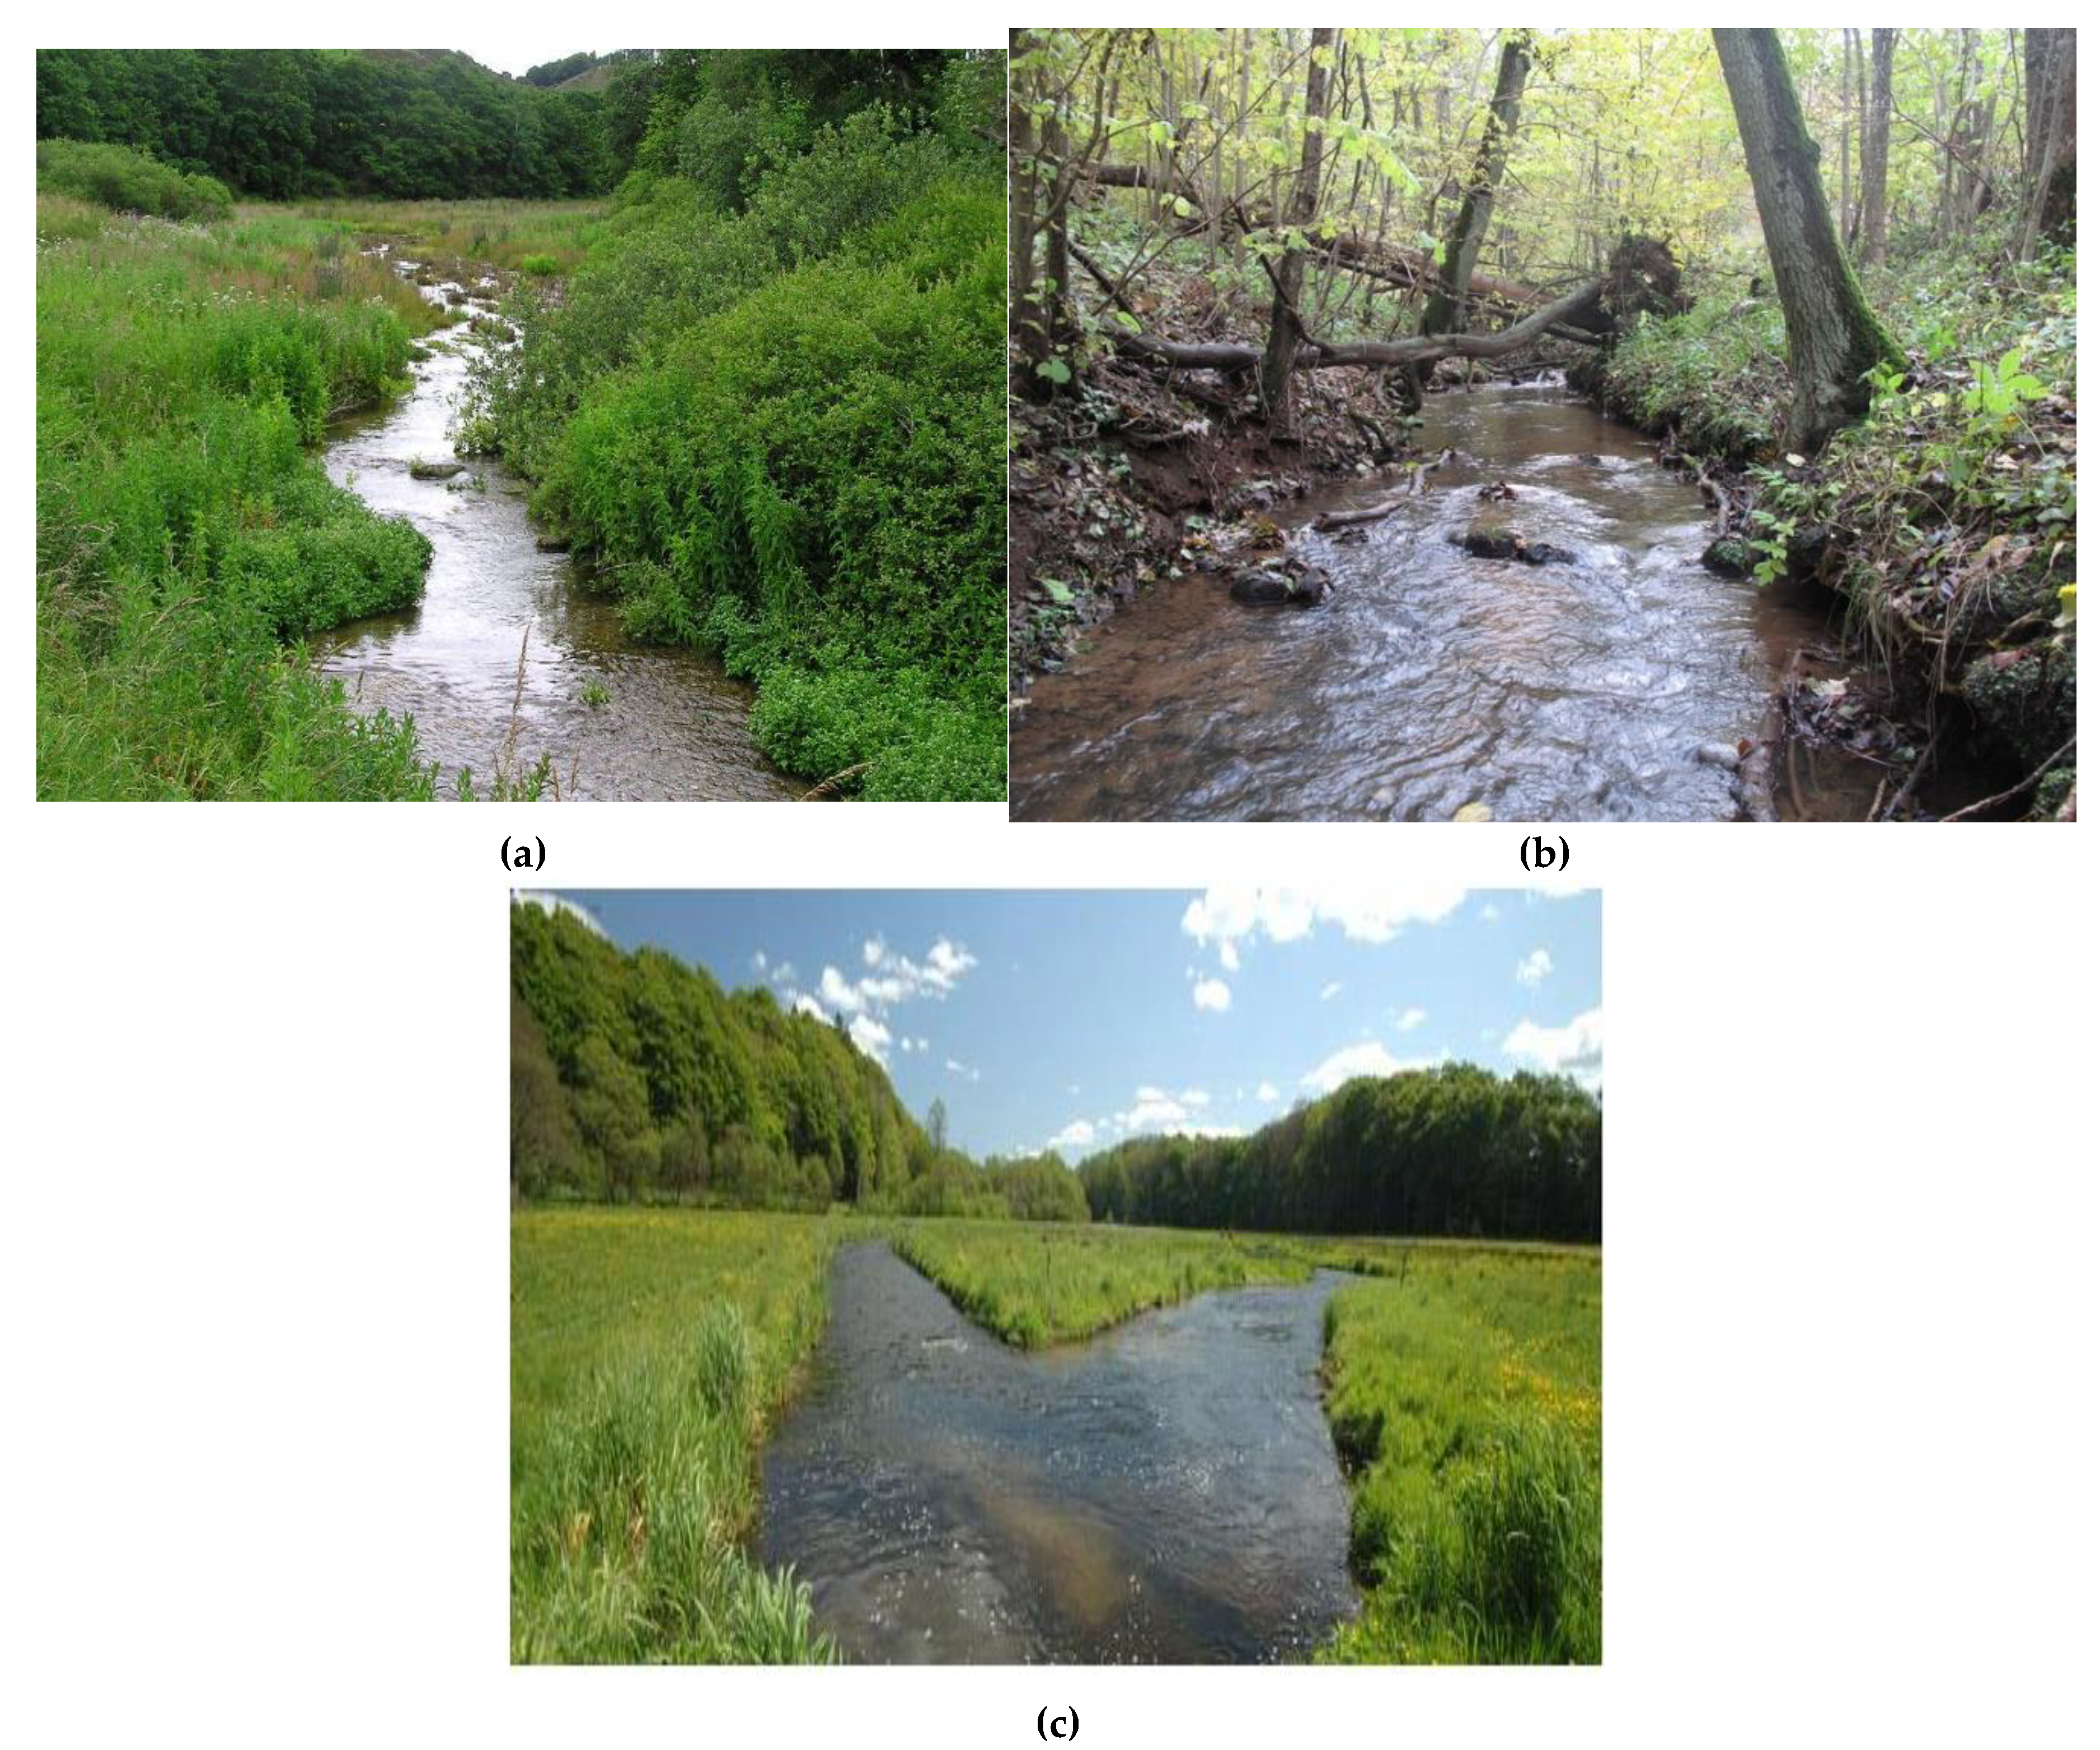
Figure 1.
(a) Brook trout stream in River Lindenborg in Jutland, Denmark. (b) Brown trout stream in Brook Tjaerbaek, Jutland, Denmark. (c) Rainbow trout stream in River Villestrup, Jutland, Denmark
Figure 1.
(a) Brook trout stream in River Lindenborg in Jutland, Denmark. (b) Brown trout stream in Brook Tjaerbaek, Jutland, Denmark. (c) Rainbow trout stream in River Villestrup, Jutland, Denmark
In Denmark brown trout can be found in most small and medium sized baecks and rivers, whereas rainbow trout only spawn in few rivers, probably because of interspecific competition between rainbow trout and brown trout (Rasmussen 2012).
2. The Popularity of Rainbow Trout in Aquaculture
A key question arises: why has rainbow trout become the preferred species for aquaculture in Denmark? One potential explanation is its preference for warmer water, as observed in river monitoring studies. Aquaculture facilities for rainbow trout are typically located in the lower sections of rivers, where water temperatures tend to be higher. In contrast, brown trout spawns and grows in the colder upper and medium stretches of rivers.
In Denmark, systematic research on this topic is lacking. However, routine river monitoring suggests a pattern: the invasive brook trout thrives in cold-water spring sections, the anadromy brown trout are found in slightly warmer mid-sections, and the invasive rainbow trout dominate the warmest lower sections. This pattern supports the hypothesis that rainbow trout perform better in warmer water compared to brook and brown trout (Waters, 1983, 1999).
4. Methodology: Comparing Growth Rates Under Controlled Conditions
To determine the comparative growth rates of brown and rainbow trout, an ideal approach involves maintaining both species under identical environmental conditions, same water temperature, feeding rates, feed composition, and fish size. Tagging studies in natural waters are less effective, as the two species typically inhabit different temperature zones, making direct comparisons difficult.
A more precise method involves using bioenergetic data from controlled experiments to compare growth rates under identical conditions. This study utilizes published findings from Elliott (1975), Elliott (1976a+b) on brown trout and From & Rasmussen (1984) and Rasmussen & From (1991) on rainbow trout.
4.1. Bio-Energetical Model
The basic growth equation (From & Rasmussen 1984) is:
dw/dt Weight change per unit time
wt body mass of fish to time t, a variable
dR/dt mass of food consumed per unit time t, a variable
H(dR/dt) the anabolic term, (the “build up term”)
K(wt, H(dR/dt)) the catabolic term (“the break down term”)
The growth equation can be written as:
∆B = C – F – U – R
Where:
∆B = total change in energy values of materials of body mass (i.e. growth)
C = energy value of food consumed
F = energy values of faeces (solid + soluble)
U = energy values of nitrogen excretion
R = total energy of metabolism, Rstandard + Rsda + Ractivity
Daily growth rate (∆w/dt) was calculated using models for feeding rate, fecal output, total urine excretion, and total respiration (specific dynamic action and routine metabolism), all of which are functions of fish body mass and water temperature. All calculations were based on energy (Kcal) rather than wet weight, as energy content per gram of wet weight varies with feeding rate and fish mass (Elliott, 1976a; From & Rasmussen, 1984; Rasmussen & From, 1991).
Elliott’s experiments fed brown trout with freshwater shrimp (Gammarus pulex) containing 1.061 Kcal per gram wet weight and 4.438 Kcal per gram dry weight. Rainbow trout, on the other hand, were fed moist pellets (minced marine fish with added binder) with a higher energy content of 3.413 Kcal per gram wet weight and 5.450 Kcal per gram dry weight. All growth, food intake, fecal output, excretion, and respiration values were standardized to Kcal (From and Rasmussen 1984).
4.2. Experimental Parameters
Elliott’s experiments covered temperatures from 3.8 to 21.7°C, with brown trout weighing between 12g and 281g. From & Rasmussen’s experiments examined rainbow trout within a temperature range of 5 to 24.3°C, with fish sizes between 3g and 2000g.
Elliott found that feeding, fecal production, excretion, and total respiration were best described by exponential functions up to approximately 17.8°C. Beyond this temperature, results became less reliable. For consistency, brown trout of 50g wet weight (equivalent to 71.5/69.4 Kcal) were used in the calculations, and From and Rasmussen (1984) matched this for rainbow trout.
4.3. Growth Trajectories Over Time
Growth was modeled over a 35-day or 365-day period, starting at 71.5 Kcal. Daily growth (∆w/dt) was added iteratively, recalculating fish mass each day. Three modeling approaches were applied:
- Mass specific rate Ω% (Ostrovsky 1995) using data in Elliott (1975 Table 1) and From & Rasmussen (1984 Appendix) for fish feeding at maximum feeding level f = 1 and varying water temperatures given in Elliott (1975) and From & Rasmussen (1984).
- Fixed Food Intake: Brown trout were fed at feeding level f = 1, a specific daily amount of Kcal over 35 days, and rainbow trout received the same caloric intake. Differences in growth were thus solely attributable to species-specific metabolic differences and temperature dependence.
- Variable Food Intake: Growth of both species was projected over a full year (365 days) based on water temperatures in River Brøns Å and Brook Tjærbæk, Denmark. Both species started with the same initial body mass 71.5 Kcal and food intake on day 1, but subsequent feeding followed species-specific temperature growth rates.
5. Results
5.1. Standardized Mass Specific Growth Rate Ω%; Feeding Level f = 1
Standardized mass specific growth rates (Ostrovsky 1995) for wet body mass and Kcal were calculated for brown trout and rainbow trout as a function of water temperature, Figure 2a,b.
5.2. Growth Over 35 Days
The following water temperatures were used in the calculations: 3.8, 5.6, 7.1, 9.5, 12.8, 15.0, and 17.8°C (Elliott 1975). The starting body mass was 71.5 Kcal for both species.
| °C | Brown Trout (Final Kcal) | Rainbow Trout (Final Kcal) |
| 3.8 | 72.5 | 67.2 |
| 5.6 | 77.9 | 72.6 |
| 7.1 | 85.5 | 80.3 |
| 9.5 | 92.6 | 90.5 |
| 12.8 | 100.8 | 116.5 |
| 15.0 | 100.5 | 126.7 |
| 17.8 | 96.9 | 156.4 |
- Brown trout outperformed rainbow trout at temperatures up to ~10°C.
- Growth remained positive for brown trout up to ~13–15°C before declining.
- Rainbow trout lost weight at the lowest temperature but grew more rapidly than brown trout above ~10°C.
5.3. Growth Over One Year
5.3.1.
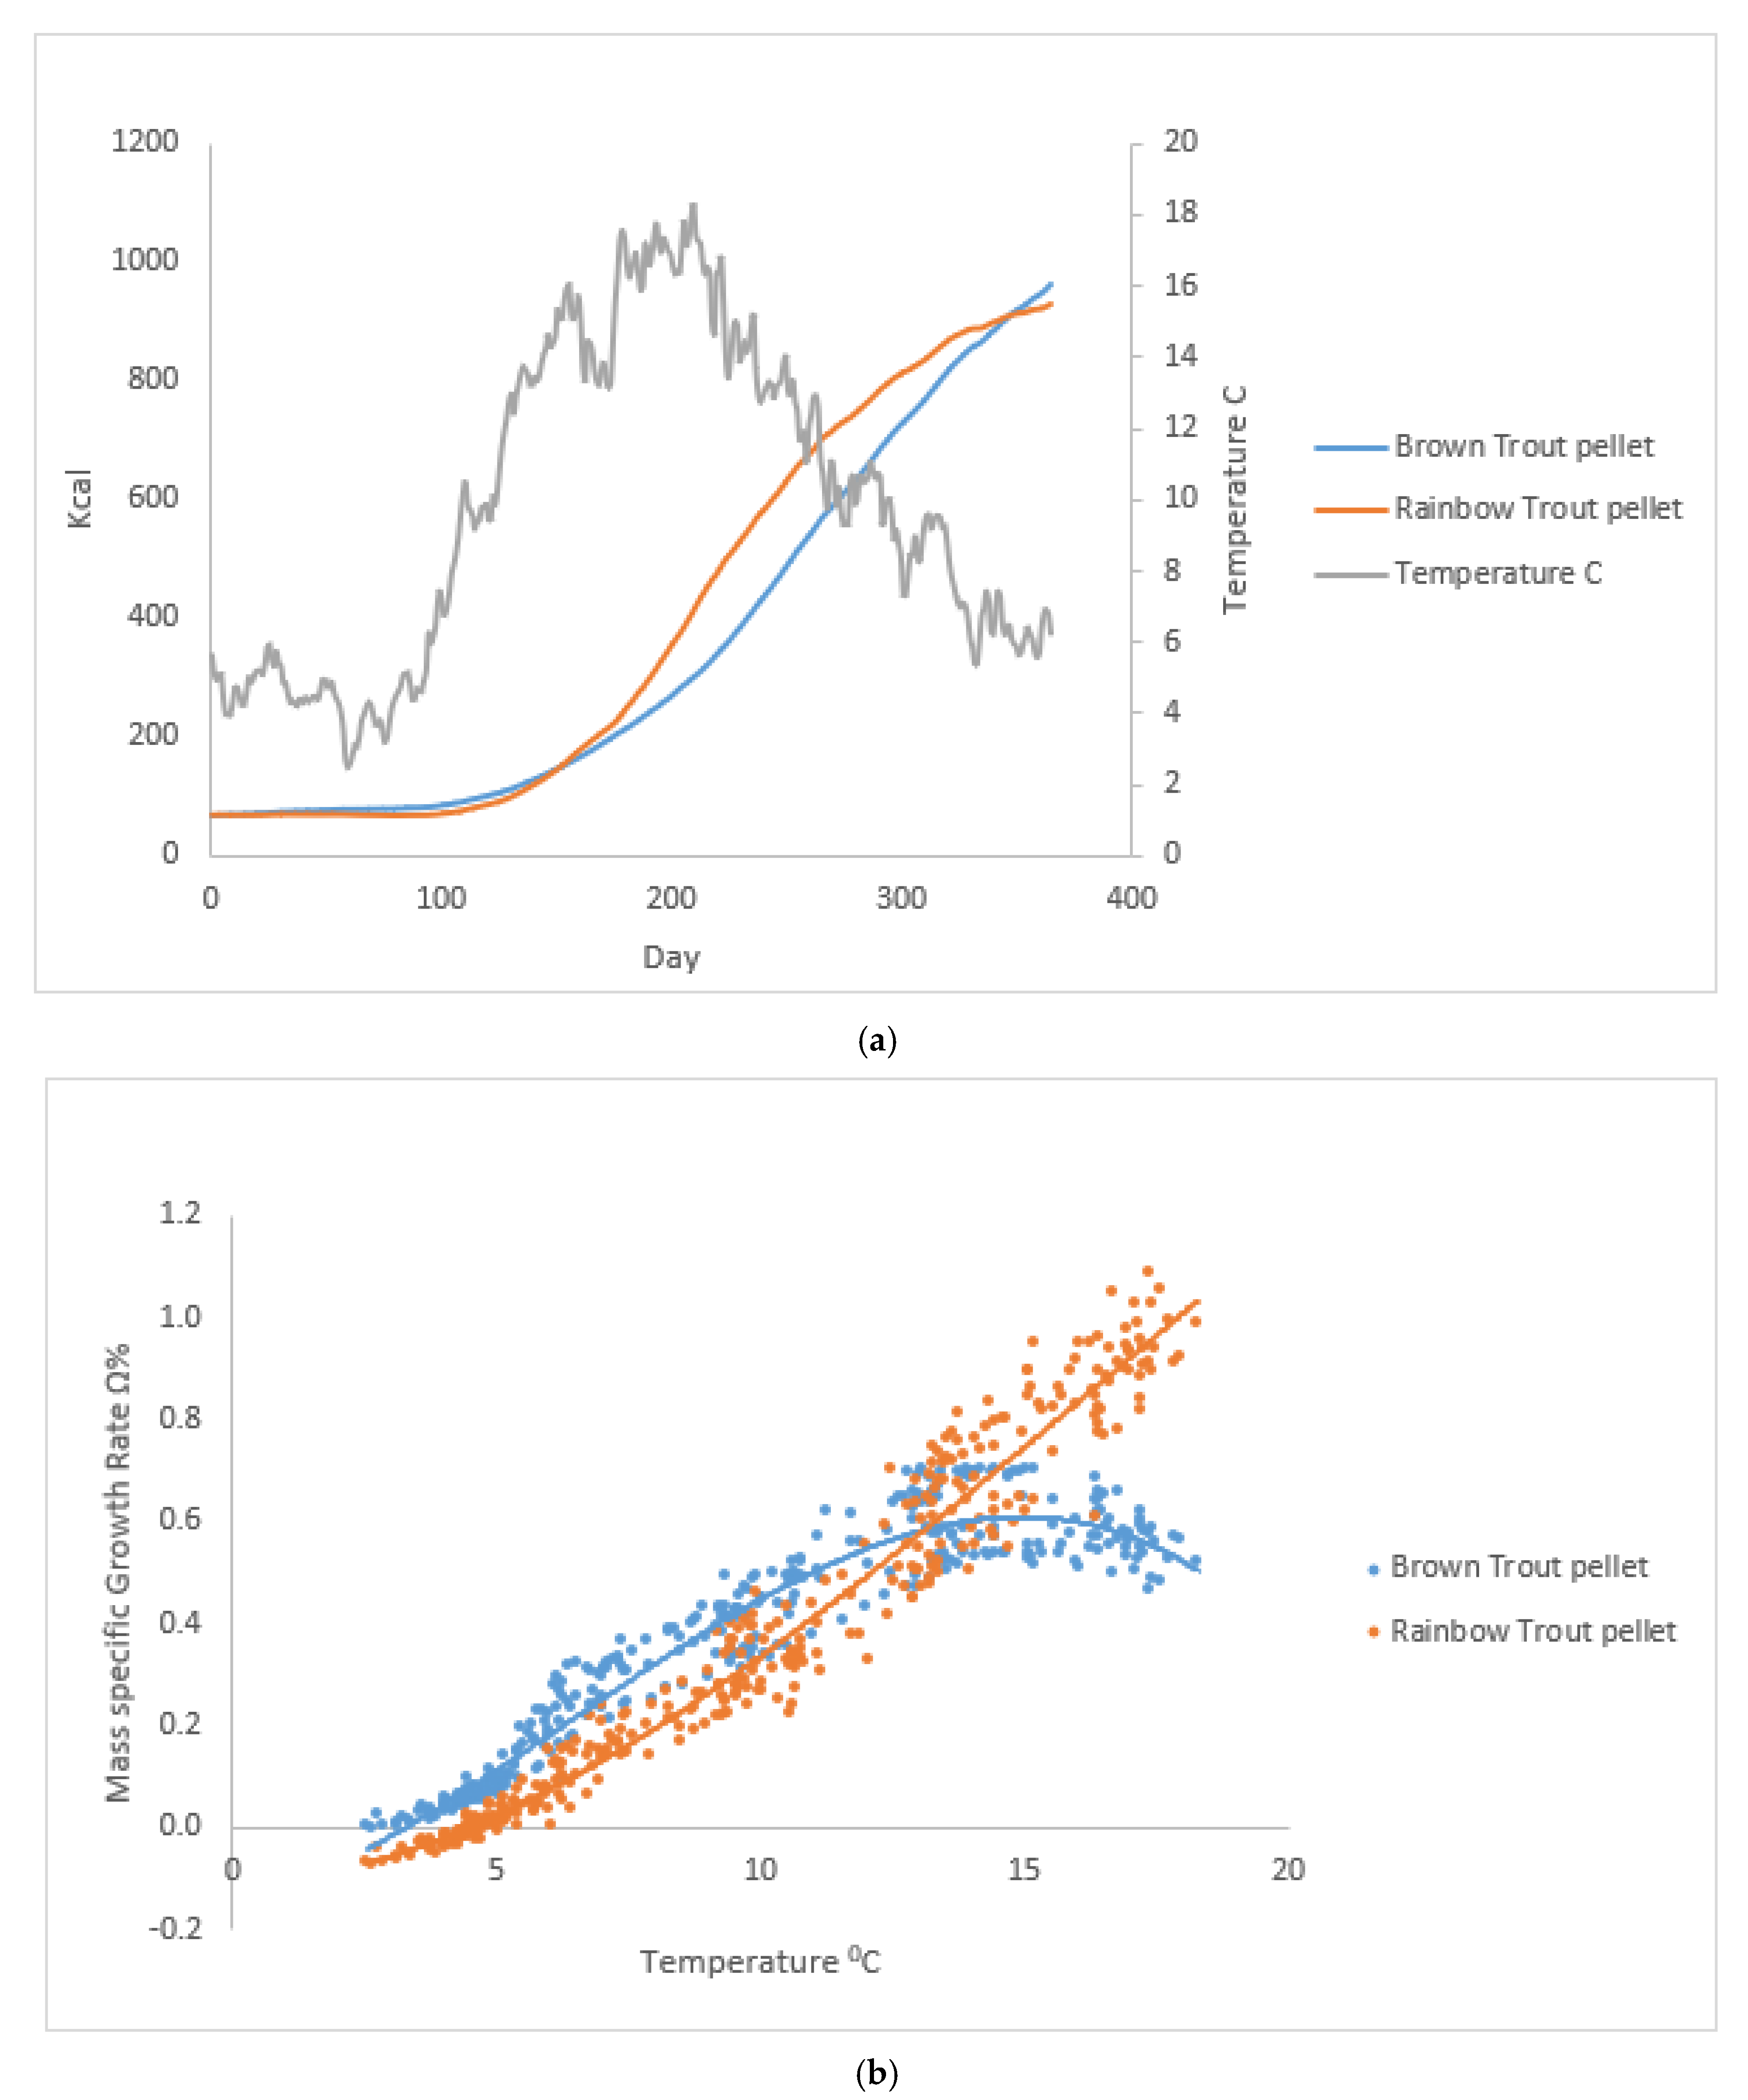
Brown trout food was recalculated to same energy as pellets. The starting body mass of both species was 50 g wet wt or 69.4 Kcal. Water temperature was from River Brøns Å and peaked up to 18.3 0C. The total food consumed over 365 days was 2,249 Kcal.
Figure 3.
(a) Growth of brown trout and rainbow trout over 365 days, Jan - Dec. (b) Daily mass specific growth rate Ω% of brown trout and rainbow trout as a function of water temperature (ref Figure 3a).
Figure 3.
(a) Growth of brown trout and rainbow trout over 365 days, Jan - Dec. (b) Daily mass specific growth rate Ω% of brown trout and rainbow trout as a function of water temperature (ref Figure 3a).
5.3.2.
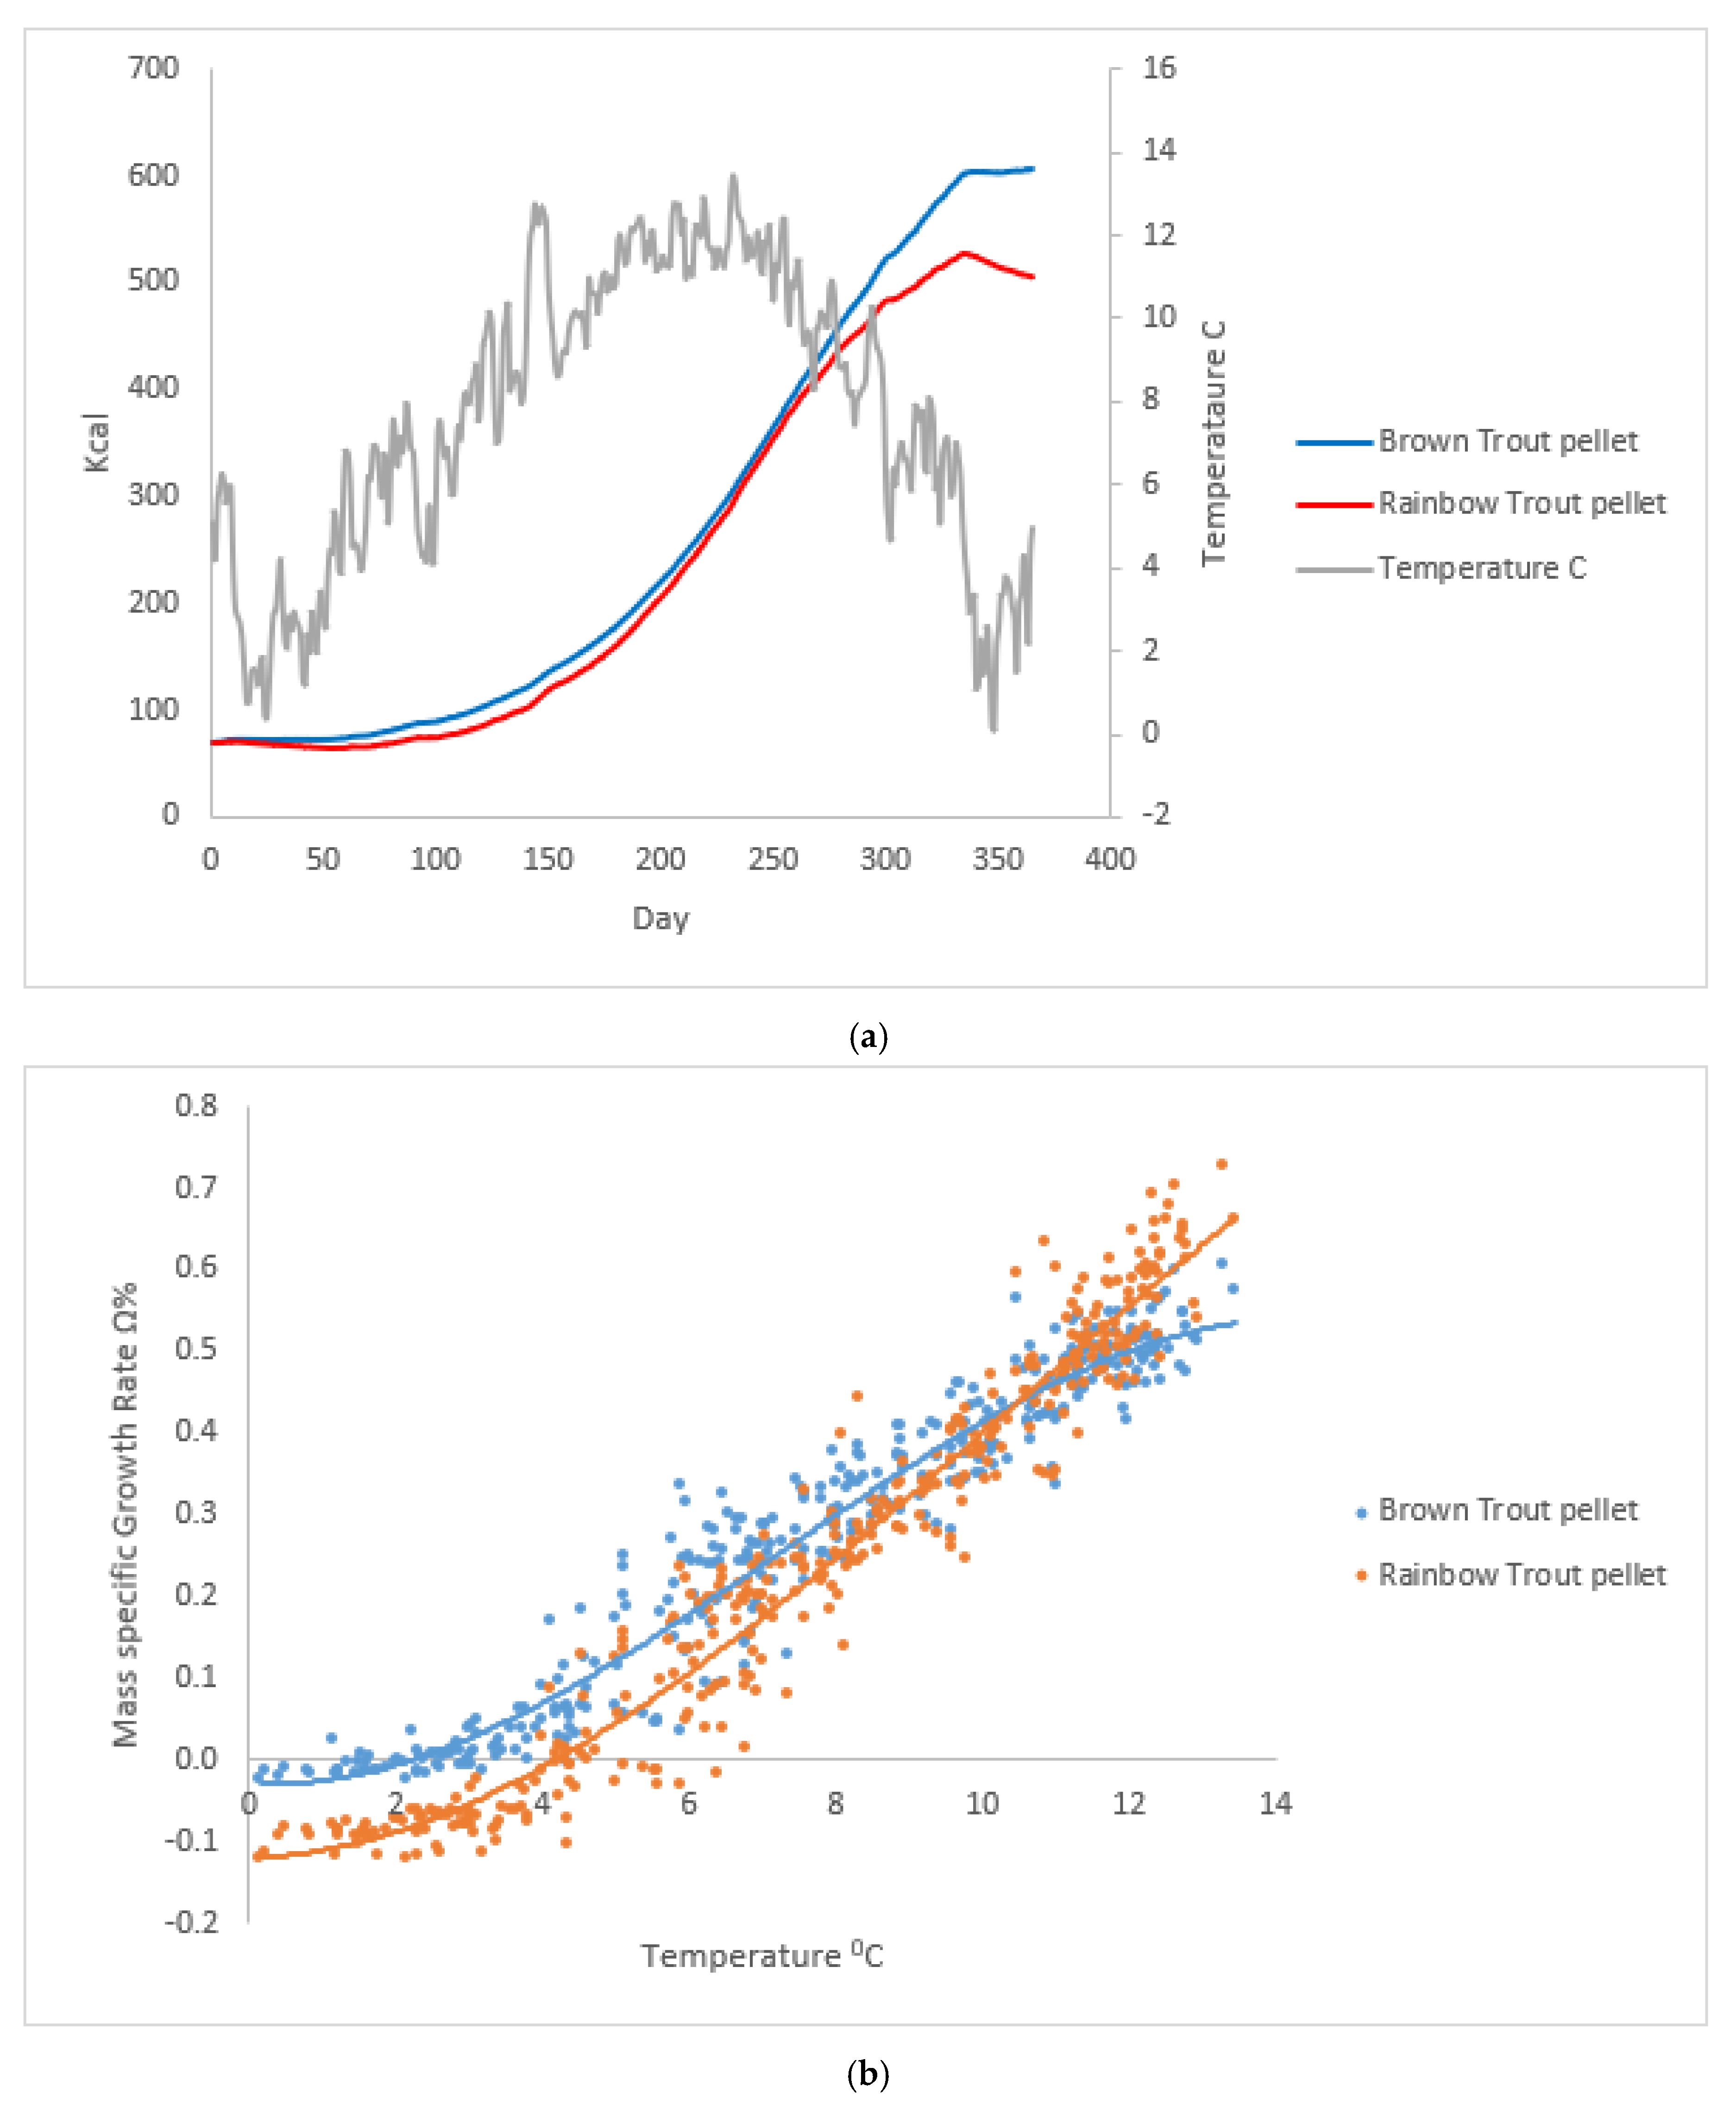
Brown trout food was recalculated to same energy as pellets. The starting body mass of both species was 50 g wet wt or 69.4 Kcal. The water temperature was from Tjaerbaek Brook and peaked up to 13.5 0C. The total food consumed over 365 days was 1,489 Kcal.
Figure 4.
(a) Growth of brown trout and rainbow trout over 365 days, Jan - Dec. (b) Daily mass specific growth rate Ω% of brown trout and rainbow trout as a function of water temperature (ref Figure 4a).
Figure 4.
(a) Growth of brown trout and rainbow trout over 365 days, Jan - Dec. (b) Daily mass specific growth rate Ω% of brown trout and rainbow trout as a function of water temperature (ref Figure 4a).
5.3.3.
Brown trout food was Gammarus pulex or pellets. The starting body mass of both was 50 g wet wt or 69.4 Kcal. The brown trout eats maximum feeding level f = 1. The water temperature was from Tjaerbaek and peaked up to 13.5 0C. The total food consumed over 365 days of brown trout feed Gammarus pulex was 1,246 Kcal and the total food consumed over 365 days of brown trout feed pellets was 1,489 Kcal.
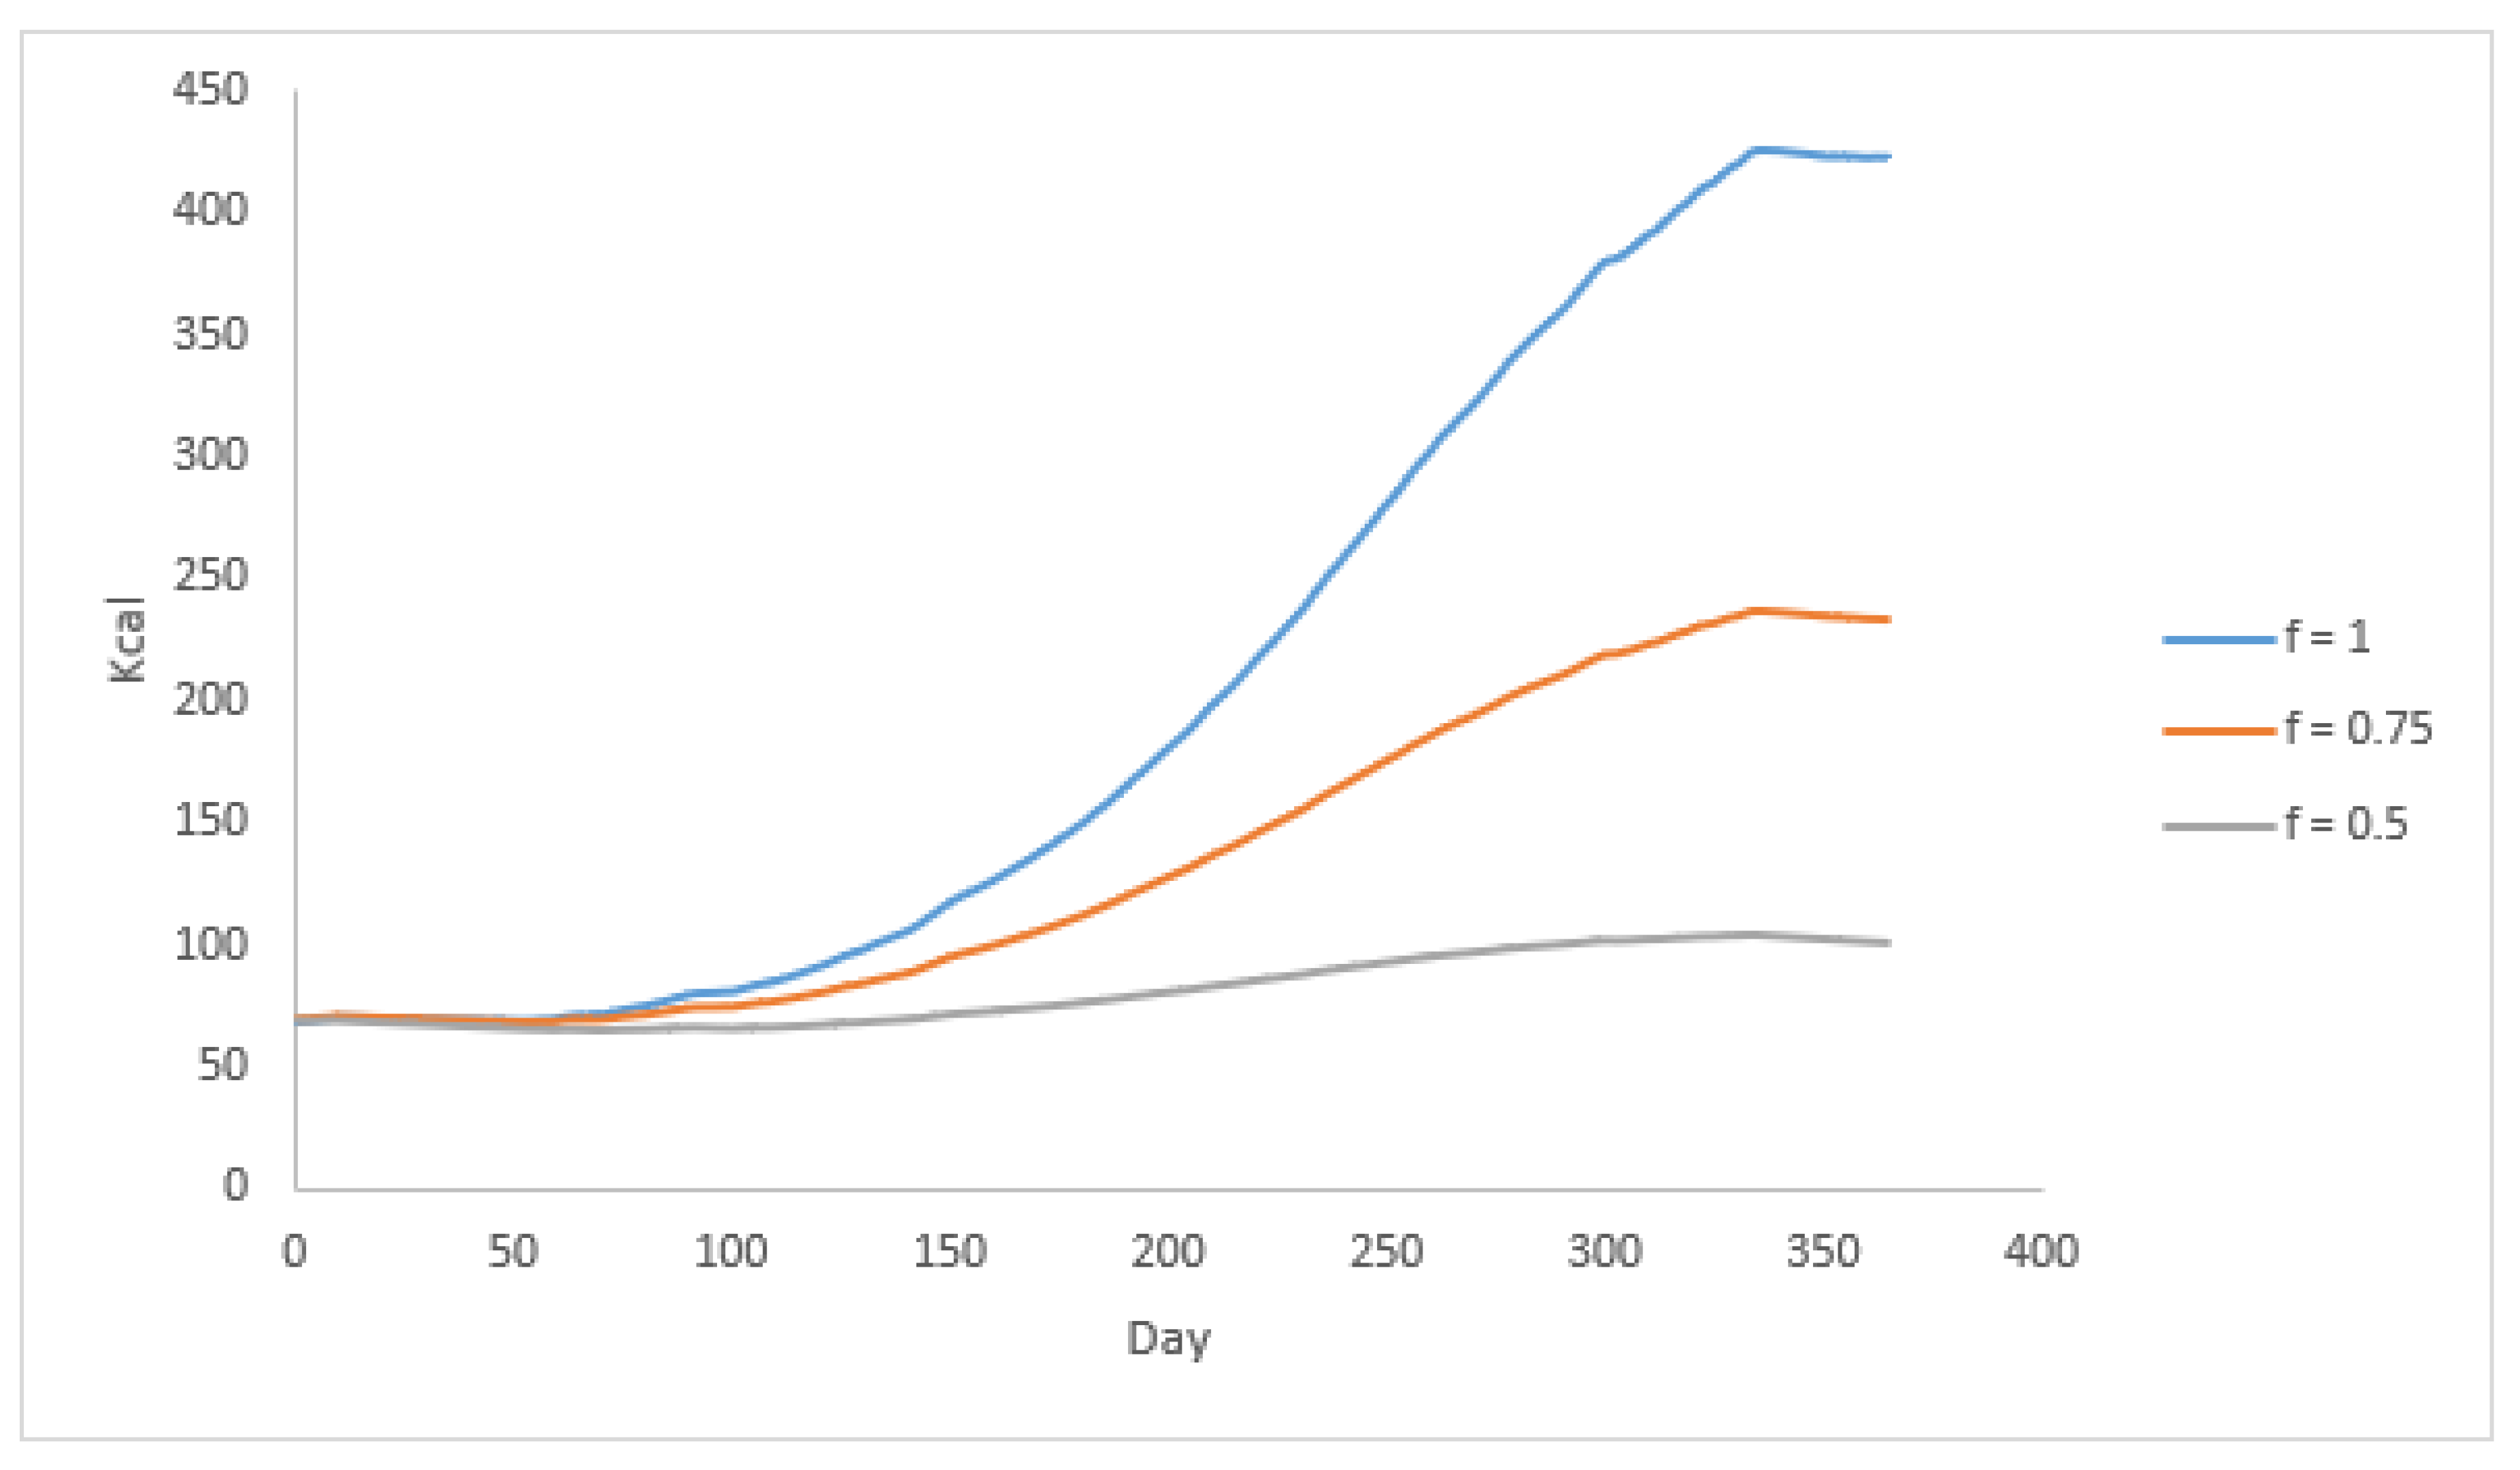
5.3.4.
Brown trout food was Gammarus pulex. The starting body mass of both was 50 g wet wt or 69.4 Kcal. The brown trout eat at feeding levels f = 0.5, 0.75 and 1 respectively. The water temperature was from Tjaerbaek and peaked up to 13.5 0C (ref Figure 5a).
0.5, 0.75 and 1.0. The water temperature was from Tjaerbaek and peaked up to 13.5 0C (ref Figure 5a).
• Brown trout grew better at low temperatures (up to ~12.5°C on day 175).
• Rainbow trout surpassed brown trout’s growth beyond this point.
• As autumn temperatures dropped, both species' growth slowed, but brown trout adapted better to cooler conditions, ultimately reaching a similar final weight to rainbow trout.
• Brown trout eating pellets or Gammarus pulex respectively have a significant difference in growth rate.
• The feeding rate of f has a significant effect on the growth rate, with a decreasing value of feeding level f, a relatively large proportion of the feed is used for activity and basal respiration and less for growth.
6. Conclusion
The study confirms that brown trout thrive in cold water (optimal growth up to 10–12°C), whereas rainbow trout prefer warmer conditions and grow significantly better in temperatures above 12°C. In aquaculture settings where summer water temperatures exceed 10°C, rainbow trout is the superior choice. This thermal preference likely explains why rainbow trout dominate aquaculture production today.
References
- Cresswell, and J. Lobon-Cervia (editors). Trout and Char of the World. American Fisheries Society, Bethesda, Maryland.
- Elliott, J.M. (1975). The growth rate of brown trout (Salmo trutta L.) fed on maximum rations. Journal of Animal Ecology, 44, 805-821.
- Elliott, J.M. (1976a). Body composition of brown trout (Salmo trutta L.) in relation to temperature and ration size. Journal of Animal Ecology, 45, 273-89.
- Elliott, J.M. (1976b). The energetics of feeding, metabolism, and growth of brown trout (Salmo trutta L.) in relation to body weight, water temperature, and ration size. Journal of Animal Ecology, 45(3), 923-948.
- From, J. & Rasmussen, G. ( 3, 61–139.
- Ostrovsky, I. (1995). The parabolic pattern of animal growth: determination of equation parameters and their temperatures dependencies. Freshwater Biology,33, 357-371.
- Rasmussen, G. & From, J. ( 9, 15–30.
- Rasmussen, G. (2012). Rainbow trout, 413-428 in Carl, H & Møller, P.R. (editors) Atlas over Danske Ferskvandsfisk.
- Rasmussen, G. (2012). Brook trout, 479-490 in Carl, H & Møller, P.R. (editors) Atlas over Danske Ferskvandsfisk.
- Rasmussen, G., J. H. L’Abée-Lund, E. Degerman, J. Birzaks, P. Dębowski, J. Hammar, T. Hesthagen, A. Huusko, M. Kesler, A. Kontautas, C. Petereit, S. Titov, T. Vehanen, Ø. Aas. (2019). Trout and Char of Northern Europe, 351-378 in J. L. Kershner, J. E. Williams, R. E.
- Scott, W.B. and Crossman, E.J. (1973). Freshwater Fishes of Canada. Fisheries Research Board of Canada. Bulletin 184.
- Waters, T.F. (1983). Replacement of brook trout by brown trout over 15 years in a Minnesota stream: Production and abundance. Transactions of the American Fisheries Society, 112(2A), 137-146.
- Waters, T.F. (1999). Long-term trout production dynamics in Valley Creek, Minnesota. Transactions of the American Fisheries Society, 128, 1151-1162.
Figure 2.
a. Mass specific rate Ω% for brown trout on wet mass and Kcal, R2 = 0.96 and R2 = 0.97 respectively. b. Mass specific rate Ω% for rainbow trout on wet mass and Kcal, R2 = 0.57 and R2 = 0.60 respectively.
Figure 2.
a. Mass specific rate Ω% for brown trout on wet mass and Kcal, R2 = 0.96 and R2 = 0.97 respectively. b. Mass specific rate Ω% for rainbow trout on wet mass and Kcal, R2 = 0.57 and R2 = 0.60 respectively.
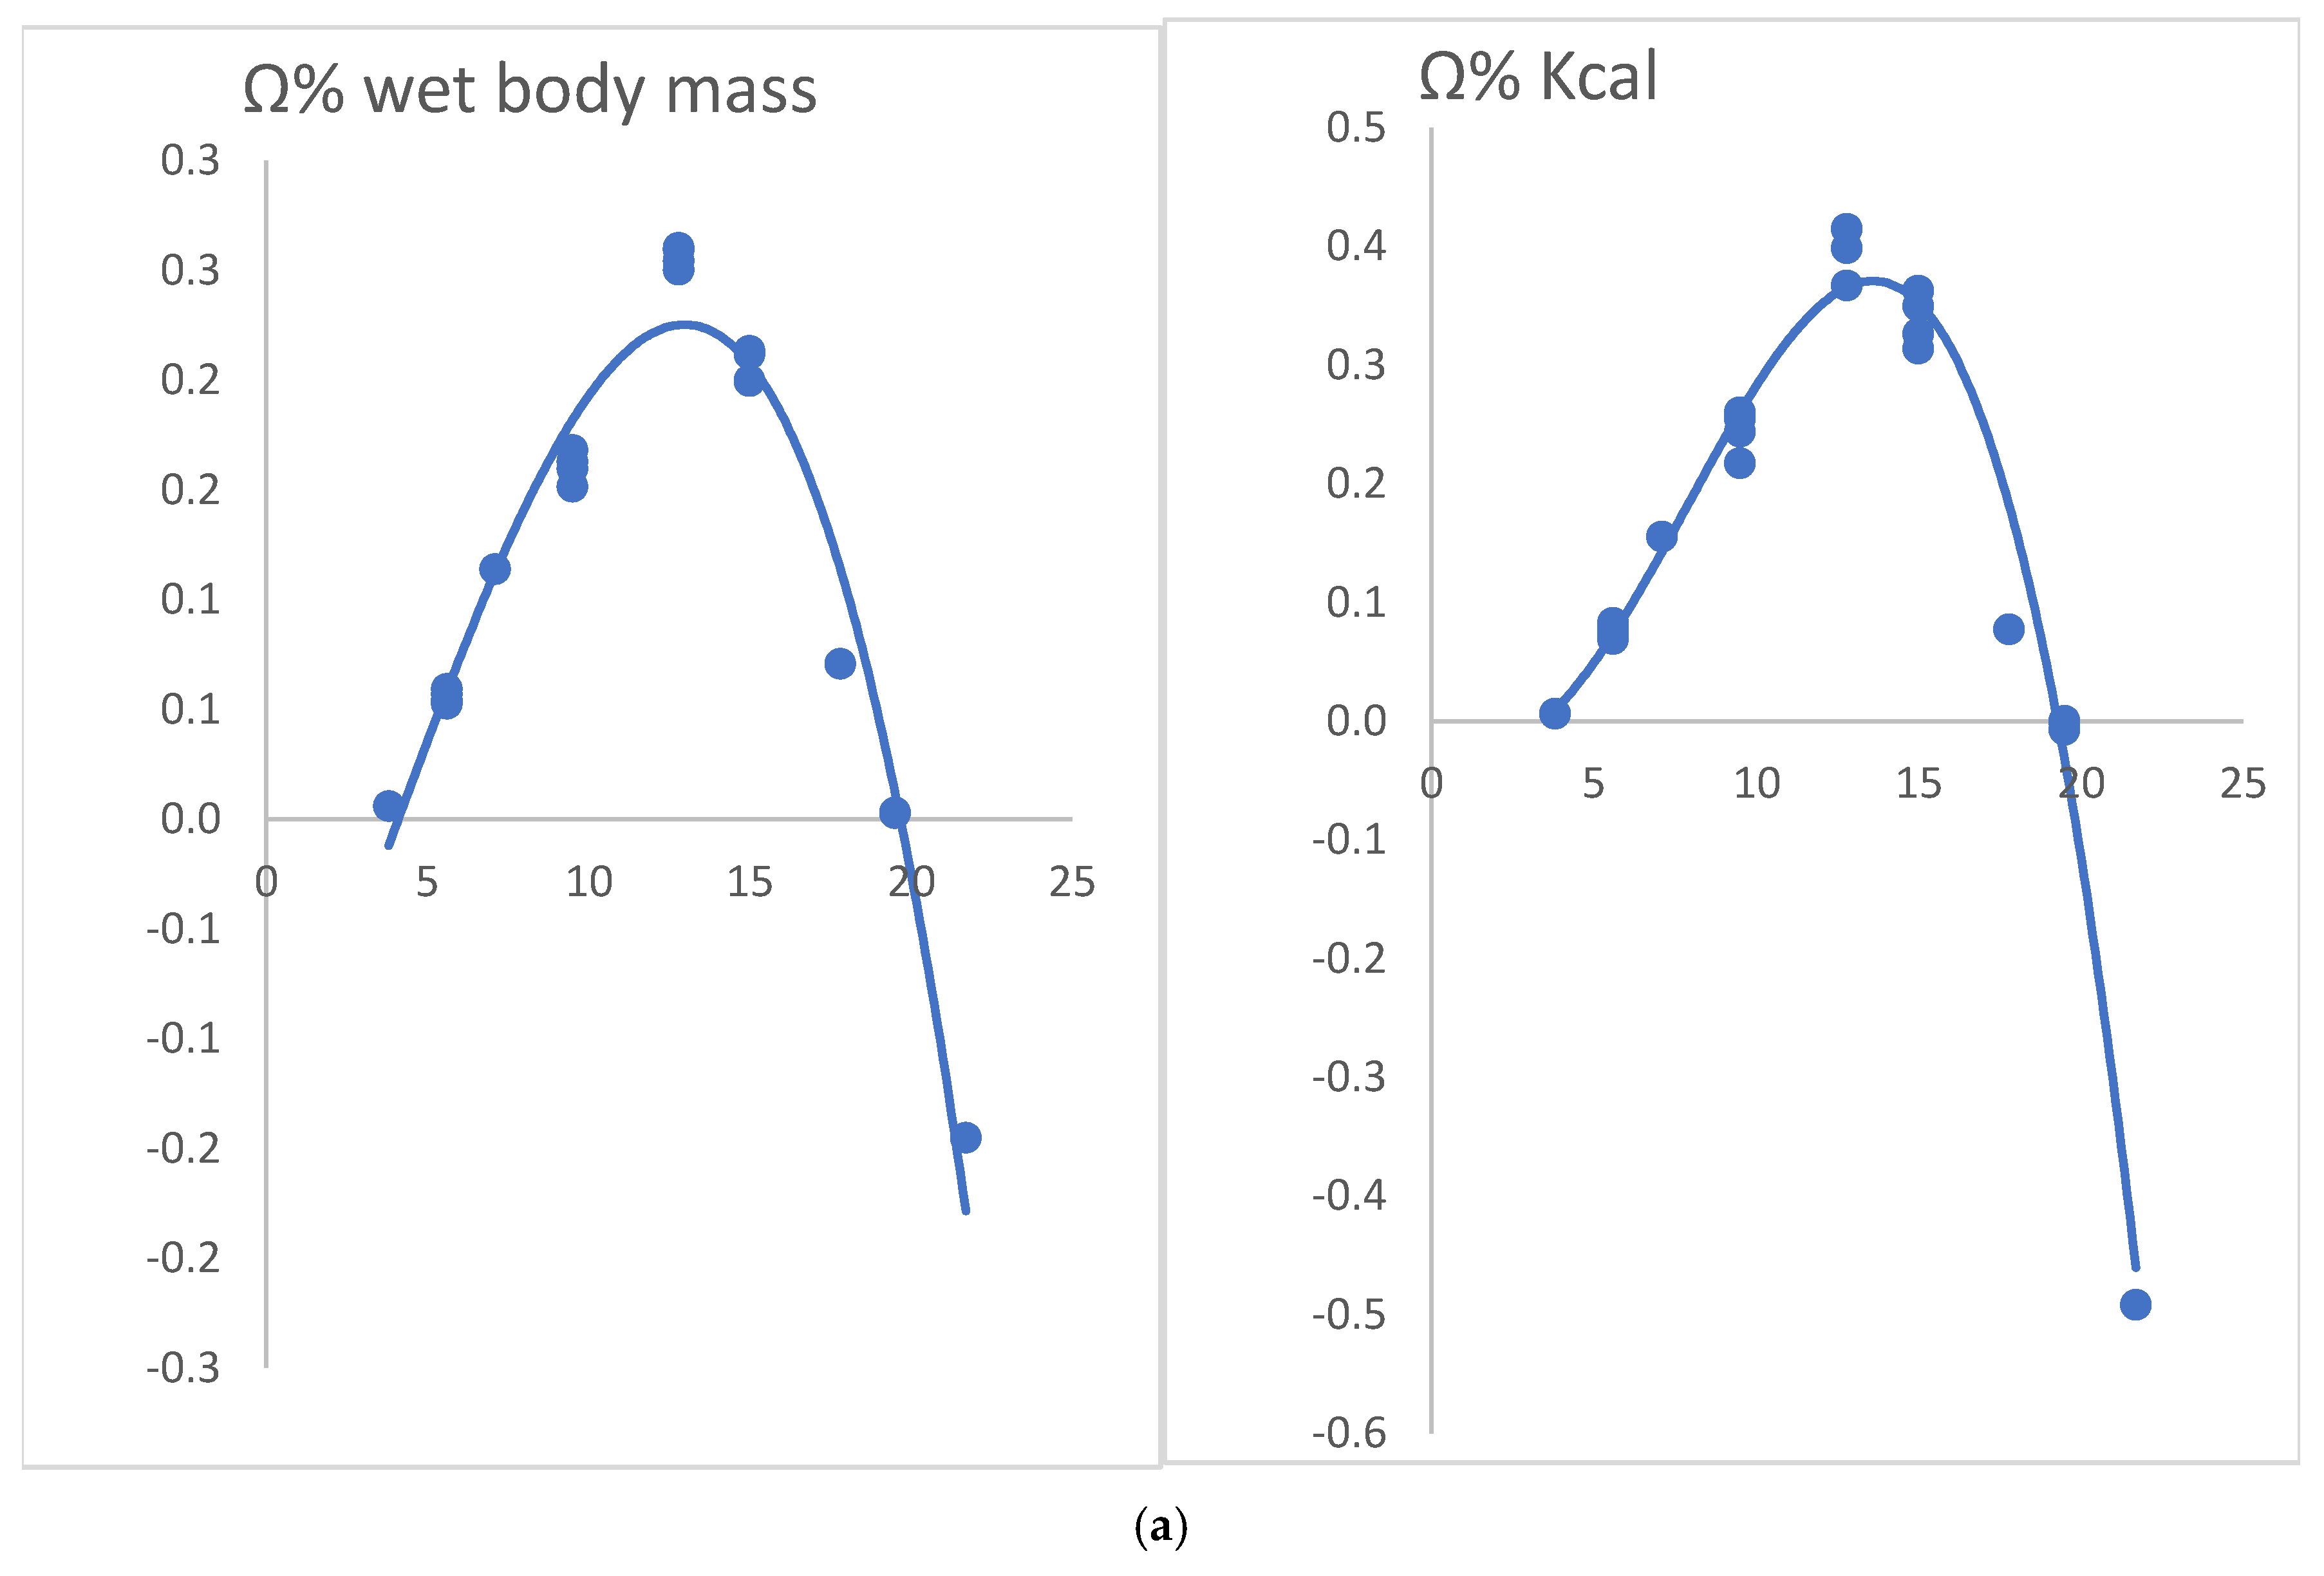
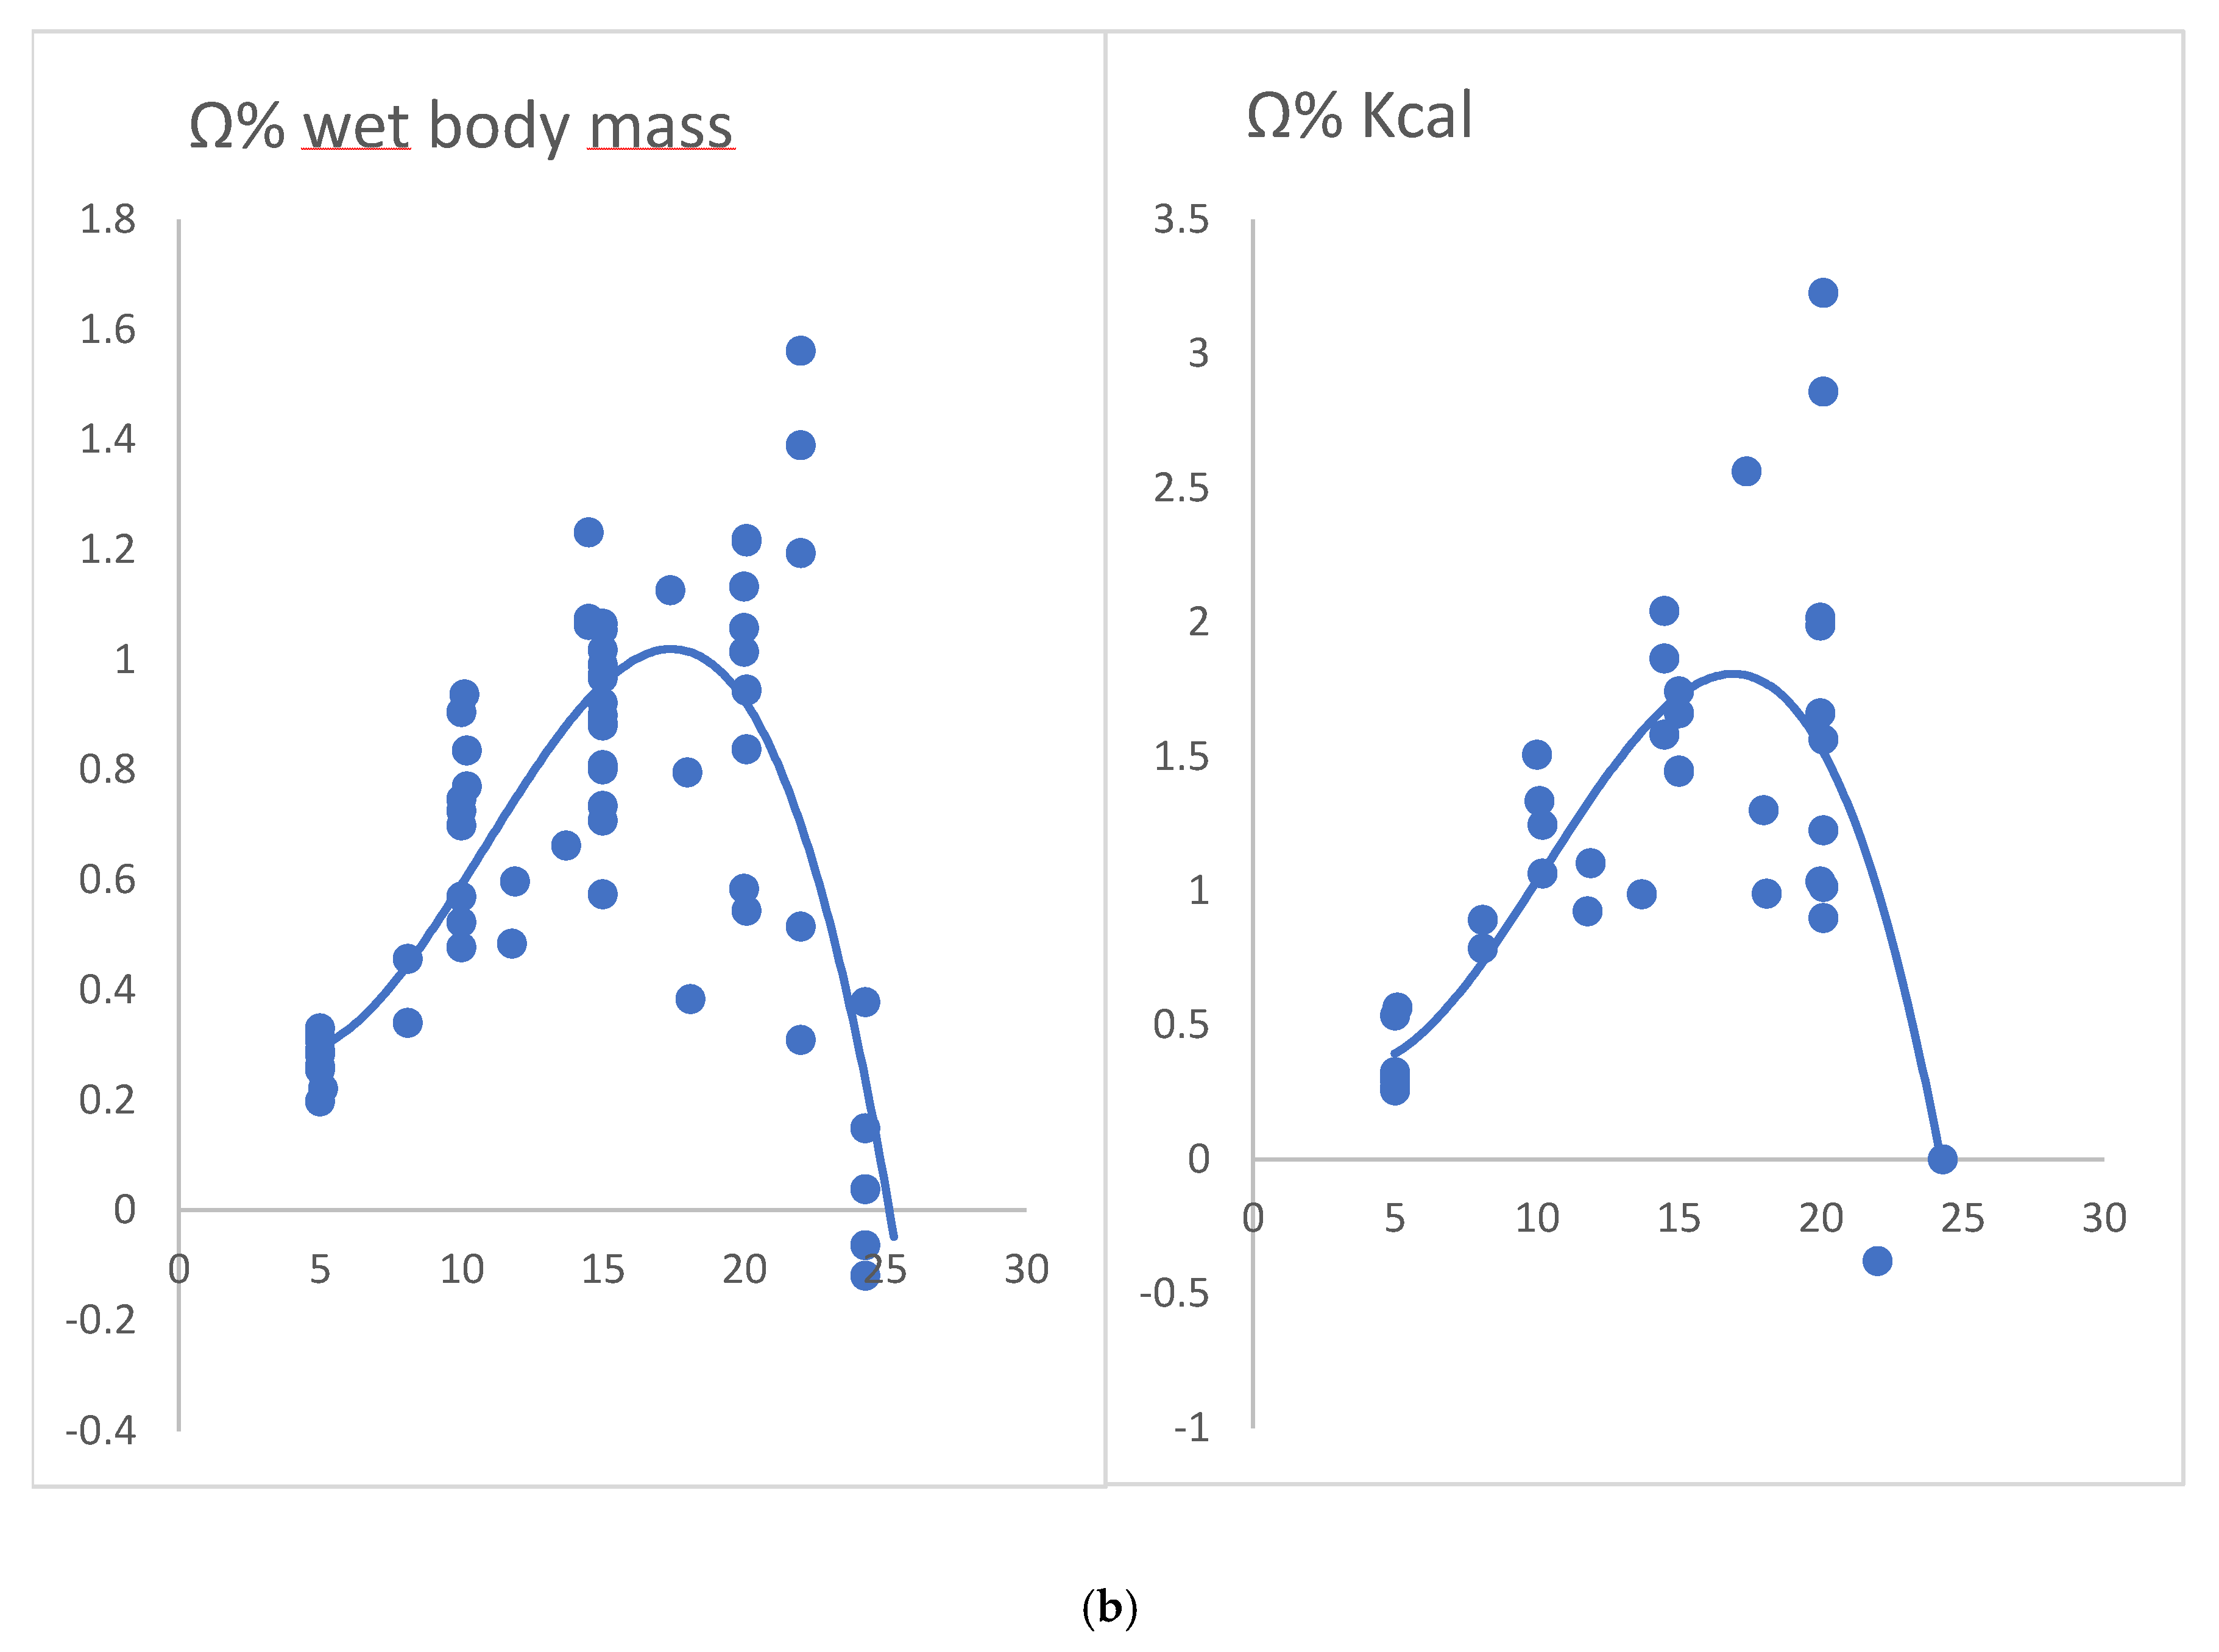
Figure 5.
(a) Growth of brown trout over 365 days, Jan - Dec. (b) Daily mass specific growth rate Ω% of brown trout fed pellets or Gammarus pulex as a function of water temperature (ref Figure 5a).
Figure 5.
(a) Growth of brown trout over 365 days, Jan - Dec. (b) Daily mass specific growth rate Ω% of brown trout fed pellets or Gammarus pulex as a function of water temperature (ref Figure 5a).
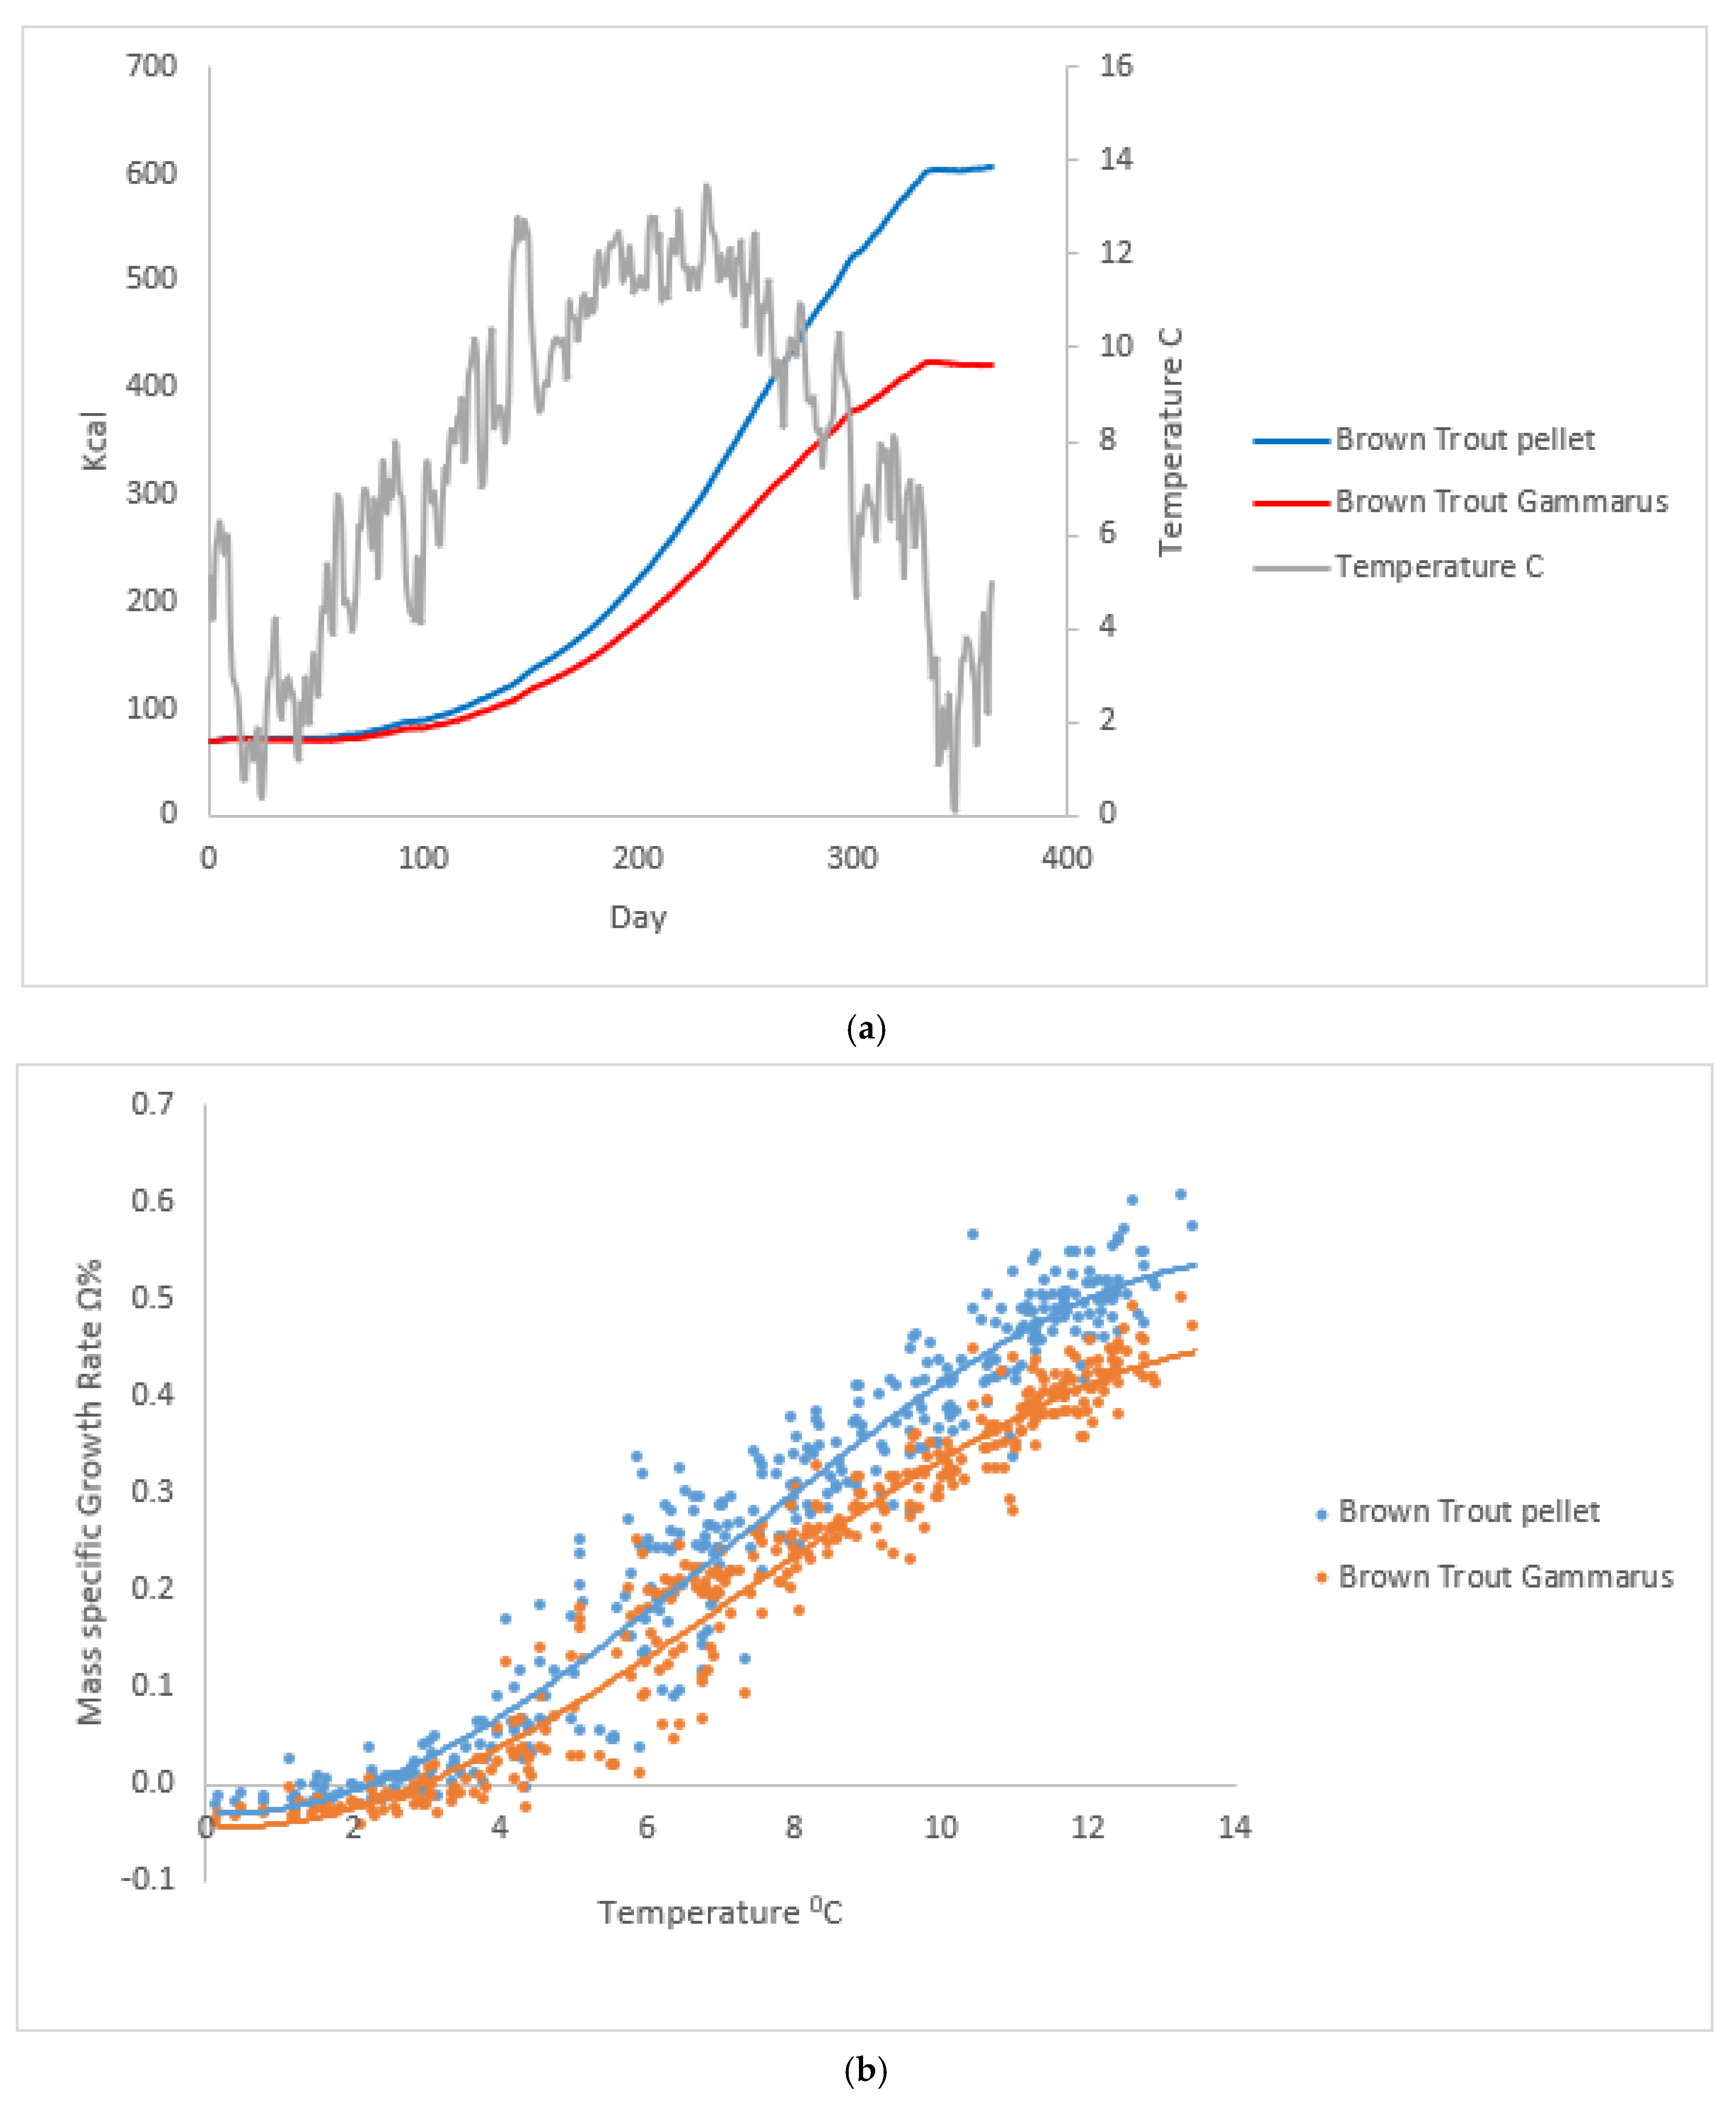
Figure 6.
Growth of brown trout fed Gammarus pulex over 365 days with different feeding levels f.
Disclaimer/Publisher’s Note: The statements, opinions and data contained in all publications are solely those of the individual author(s) and contributor(s) and not of MDPI and/or the editor(s). MDPI and/or the editor(s) disclaim responsibility for any injury to people or property resulting from any ideas, methods, instructions or products referred to in the content. |
© 2025 by the authors. Licensee MDPI, Basel, Switzerland. This article is an open access article distributed under the terms and conditions of the Creative Commons Attribution (CC BY) license (http://creativecommons.org/licenses/by/4.0/).
Copyright: This open access article is published under a Creative Commons CC BY 4.0 license, which permit the free download, distribution, and reuse, provided that the author and preprint are cited in any reuse.


