Submitted:
20 March 2025
Posted:
20 March 2025
You are already at the latest version
Abstract
The lighting conditions of university libraries directly influence reading comfort, learning efficiency, and energy consumption. However, the current lighting design still faces problems such as uneven illumination distribution, severe glare, low utilization of natural light and high energy consumption. Especially in the reading area, due to insufficient lighting control, the light in some areas is too bright or too dark, which affects visual comfort and increases energy consumption. To this end, this study proposes a novel multi-objective optimization framework that effectively balances illumination uniformity, visual comfort, and energy efficiency using NSGA-II, outperforming conventional single-objective methods. The experimental results indicate that after optimization, illumination uniformity improved significantly from less than 0.1 to a stable range of 0.6–0.75, the average monthly energy consumption reduced by approximately 20%, and the natural lighting area expanded by approximately 25% (500m²). Unlike previous research that focuses solely on either energy efficiency or visual comfort, this study integrates multiple critical lighting parameters into a unified optimization framework, achieving a better balance between energy efficiency, lighting uniformity, and visual comfort.
Keywords:
university library
; multi-objective optimization
; natural lighting
; visual comfort
; energy consumption optimization
1. Introduction
University libraries serve as essential spaces for knowledge acquisition, independent learning, academic research, and social interaction. The design of lighting environments within these libraries significantly impacts students' comfort, learning efficiency, and overall health [1]. Despite the recognized importance of effective lighting design, surveys indicate that approximately 60% of university library users experience discomfort, primarily due to uneven illumination distribution and excessive glare [2]. Furthermore, non-uniform illumination below 0.2 is associated with a 30% decrease in reading efficiency [3]. Particularly in reading areas, insufficient window design and inadequate lighting controls frequently result in overly bright or overly dark areas, negatively affecting reading comfort and increasing visual fatigue [4].
Existing studies often overlook the integration of multiple lighting parameters, causing practical issues like inconsistent brightness and discomfort due to glare, which remain unresolved in most university libraries [5]. Thus, there is an urgent need for an integrated approach to simultaneously optimize multiple factors such as illumination uniformity, energy efficiency, and visual comfort. In recent years, numerous studies have aimed to address these issues by optimizing natural lighting environments. For example, some researchers have developed specialized daylighting systems that use advanced technologies to enhance the quality of indoor lighting. These include systems based on high-efficiency optical lenses or reflective materials [6]. Other scholars have emphasized human-centric design principles, proposing strategies to improve circadian rhythms and visual comfort through architectural elements and strategic lighting arrangements [4]. While these approaches have made significant progress, most focus on individual aspects rather than integrating multiple factors comprehensively. As a result, existing solutions often fail to achieve a balanced consideration of lighting uniformity, visual comfort, and energy efficiency simultaneously.
To overcome these limitations, this study proposes a multi-objective optimization approach specifically designed for university library lighting environments. The approach combines multiple critical lighting variables, including desktop illuminance, color temperature, reflectance, and screen luminance, into a unified optimization model. It employs the Non-dominated Sorting Genetic Algorithm-II (NSGA-II) to find optimal solutions, aiming to balance visual comfort, energy consumption, and illumination uniformity. NSGA-II is chosen due to its proven effectiveness in solving complex multi-objective optimization problems, ensuring Pareto-optimal solutions with balanced trade-offs. Alternative methods such as Pareto-based Particle Swarm Optimization (PPSO) and Differential Evolution (DE) were considered but demonstrated lower convergence efficiency in preliminary tests (Montgomery, 2020). Through both computational simulations and real-world experiments, this study aims to validate the proposed method's effectiveness in creating a balanced, energy-efficient, and comfortable reading environment.
The main contributions of this research are: (1) Developing a comprehensive multi-objective optimization model tailored for natural lighting in university libraries, considering multiple critical factors. (2) Applying the NSGA-II algorithm to effectively balance competing goals of lighting uniformity, visual comfort, and energy efficiency. (3) Conducting rigorous simulation analyses and practical experiments to validate the optimization method’s effectiveness. (4) Providing practical recommendations for implementing natural lighting design improvements in real-world library settings.
This study contributes significantly by integrating theoretical modeling and practical applications, aiming to guide future library designs toward more sustainable, comfortable, and energy-efficient solutions.
2. Literature Review
The optimization of natural lighting design in libraries is a hot topic in current academic research, mainly focusing on the following aspects: daylighting technology, human-centered lighting design, and computer optimization methods.
Regarding advancements in daylighting technology, Whang et al. (2020) developed a high-efficiency daylighting system that utilizes a specialized parabolic reflector to direct sunlight into indoor spaces. Their approach significantly enhances indoor brightness and uniformity [5]. Tseng et al. developed a free-form lens system to optimize the transmission and distribution of natural light and improve the indoor lighting effect [6]. Although these studies are technologically advanced, they usually only focus on a single factor and lack comprehensive consideration of multiple lighting factors. However, most existing daylighting equipment research fails to address the integrated optimization of multiple factors simultaneously, limiting their practical effectiveness.
Second, human-centered lighting design emphasizes people's visual comfort and physical and mental health. Alkhatatbeh and Asadi pointed out that reasonable architectural design can better meet the needs of human biorhythms and effectively improve the comfort and work efficiency of residents [4]. Golovkina and Ryazanova proposed a natural lighting design that integrates plant systems into public spaces, which can not only improve the natural lighting effect, but also improve people's psychological comfort [7]. However, these studies lack a comprehensive integration of factors such as energy efficiency, visual comfort and lighting uniformity. Despite emphasizing human comfort, these approaches rarely integrate comprehensive energy efficiency considerations.
In terms of computer optimization methods, multi-objective optimization algorithms have made important progress in recent years. Li used a multi-objective optimization method to analyze the lighting environment of urban residences and found that the optimization method that comprehensively considers multiple factors is effective in improving environmental quality [8]. Wen et al. used a multi-objective genetic algorithm to optimize the shading strategy of a university library, effectively achieving a balance between daylight entry, visual comfort, and energy consumption [9]. These studies have shown that multi-objective algorithms have good results, but their application in actual library scenarios is still limited. These computational approaches are promising but still limited in practical application due to insufficient integration of real-world constraints.
In response to the above shortcomings, this study proposed a comprehensive multi-objective optimization method suitable for natural lighting design in university libraries. Unlike previous studies that focused solely on technology or human comfort, this study used the NSGA-II algorithm to systematically optimize multiple key factors such as lighting uniformity, energy efficiency, and visual comfort, and verified its effectiveness through simulation experiments and actual measurements. The innovation of this method lies in the unified optimization of multiple factors, which is expected to achieve better results in practical applications.
3. Library Lighting Design
As a place for students to read and study, the lighting effect is particularly important in college libraries. Since the library reading room in the daytime usually use lighting lighting, so the reading room of the natural lighting is mainly to the window area and floor area ratio as a measure of lighting standards. In general, the window area accounts for one-fourth or one-sixth of the floor area is more appropriate. Usually, in the preliminary design stage of the library, the area needed for lighting is obtained according to the ratio of the window transmittance area to the floor area. Lighting should be adequate, but also pay attention to the uniformity of illumination, the light should not be too strong to avoid the phenomenon of glare. Glare is caused by too much brightness or brightness ratio is too strong and a special visual state. Slight glare makes the eyes stimulated, feel uncomfortable, strong glare impedes the normal work of visual function. There are many factors that produce glare, usually including the light source, the brightness of the reflected light, the size and location of the light source, etc. In a wide space, the likelihood of glare increases due to the large number of visible light sources. The most common method of controlling glare is to direct the light from all light sources downward, masking the light radiating horizontally to reduce the glare phenomenon. However, this method affects the efficiency of the light shining on the shelf surface and reduces the light efficiency limit [10]. There are four common lighting designs in library reading rooms as follows:
(1) The form of unilateral lighting, reading room, a side wall window lighting, more suitable for small span of the room, span in 8-9 meters or so, the room height and depth of the ratio of 1:2, but not conducive to ventilation.
(2) Reading room on both sides of the wall window lighting, suitable for large-span room, span is generally 16-18 meters, the room height and depth ratio of 1:4, the light is sufficient, uniform illumination.
(3) Mixed lighting is generally used for single-story rooms with a large span, the middle of the roof needs to be set up inverted skylight, so that the light is uniform, average illumination, to make up for the lack of unilateral lighting.
(4) In the reading room roof part of the window lighting, applicable to single-story rooms, high lighting efficiency, uniform illumination, not against the wall, light average, but need to pay attention to the skylight leakage phenomenon.
Research on many college libraries found that most of the library reading room space coherent, convenient for students to read, but the indoor lighting is usually used skylight lighting, in the light of the design lack of consideration. Generally embodied in the reading space window design is not reasonable and space plane depth is large, part of the new college library reading space lighting is uneven, low lighting efficiency, glare is more serious, to a certain extent, affecting the efficiency of space use. Therefore, it is necessary to analyze and update the lighting design of the reading space to design an environment that meets the students' reading [11]. At present, the source of lighting in reading space in college libraries is usually the indirect side lighting from skylights and the windows on the wall in the long axis from the direct incident light, and there is usually no light opening on the wall along the short axis. Visible side lighting in the reading space in the status of the very important, external windows and other architectural factors to design research, can enhance the reading space indoor lighting effect. The light environment evaluation indexes of reading space in college libraries mainly include illuminance, lighting coefficient, glare and so on. In order to adapt to the improvement of the space requirements of college students, in the lighting design process will be synthesized in the relevant standards in the higher value of the parameter as a research benchmark: side lighting, lighting coefficient standard value of not less than 2%, illuminance standard value of not less than 450 lux.
4. Optimization Modeling and Solving for Natural Light Harvesting in Libraries
This study employs a multi-objective optimization algorithm to enhance the natural lighting environment in the reading areas of university libraries. The optimization process involves variable selection, objective function formulation, constraint definition, and solution methodology, aiming to improve lighting uniformity, energy efficiency, and visual comfort. As illustrated in Figure 1, the proposed framework follows a structured optimization approach where multiple objectives are considered simultaneously to achieve an optimal lighting design solution.
4.1. Development of the Multi-Objective Optimization Model
4.1.1. Decision Variables
In optimizing the natural lighting environment of university libraries, the selection of decision variables directly influences the effectiveness of the model and the applicability of results. Based on existing research and on-site investigations of library lighting environments, this study identified four key decision variables, which were selected based on sensitivity analysis and expert recommendations, ensuring the most significant impact on lighting optimization while minimizing computational complexity [12].
Desktop illuminance (lux): Represents the lighting intensity on the reading desks. It directly affects reading comfort and visual fatigue.
(1) Correlated color temperature (K): The color temperature of lighting sources affects visual comfort and learning efficiency. The typical range is 3000–6000 K.
(2) Background reflectance: Refers to the reflective properties of walls and floors in reading areas, typically ranging from 0.1 to 0.9, affecting the uniformity of light distribution.
(3) Screen luminance: Brightness of electronic screens in reading areas, impacting visual comfort, typically set between 100–180 cd/m².
These variables are chosen based on international standards, including recommendations from the International Commission on Illumination (CIE) and Chinese library construction standards (GB50034-2013). Reflectance values reference existing statistical studies of library interior materials [13].
4.1.2. Formulation of Objective Functions
The optimization model includes three objectives: maximizing visual comfort, minimizing energy consumption, and maximizing illumination uniformity.
(1) Maximizing visual comfort Visual comfort depends on illuminance, color temperature, glare, and screen luminance. This study used the Analytic Hierarchy Process (AHP) to determine the weight coefficients of each factor. Five lighting design experts and three ergonomics specialists provided pairwise comparisons to form a judgment matrix. After consistency checks, weights were assigned as follows: illuminance (0.40), color temperature (0.25), background reflectance (0.20), and screen luminance (0.15) [12,14].
The objective function for visual comfort is defined as:
where:
U() represents the uniformity of illumination,
T() denotes correlated color temperature,
R() corresponds to background reflectance,
S() signifies screen luminance
=0.40,=0.25,= 0.20,=0.15 were determined through the Analytic Hierarchy Process (AHP).
(1) Minimizing energy consumption This goal focuses on maximizing natural light utilization to minimize artificial lighting use. Energy consumption was calculated based on lighting power density (W/m²) across different areas, aiming to reduce energy consumption to the lowest possible level.
(2) Maximizing lighting uniformity Uniform lighting enhances reading comfort and learning efficiency. This study defines lighting uniformity as the ratio between minimum and average illuminance, ideally set between 0.6 and 0.75, following existing recommendations [15].
4.1.3. Constraint Setting
Constraints To ensure practical applicability, the following constraints were set:
Illuminance: 200 ≤ desktop illuminance ≤ 750 lux
Color temperature: 3000 ≤ color temperature ≤ 6000 K
Glare (Unified Glare Rating, UGR): UGR ≤ 22
Energy consumption: lighting power ≤ 7.6 W/m²
Lighting uniformity: 0.6 ≤ uniformity ≤ 0.75
4.2. Solution Approach
This study uses the Non-dominated Sorting Genetic Algorithm-II (NSGA-II) for multi-objective optimization. NSGA-II is selected because it effectively handles conflicting objectives and ensures a diverse and well-distributed set of solutions, widely applied in building lighting optimization.
The NSGA-II optimization process includes:
Step1: Population initialization: Randomly generating initial solutions that satisfy all constraints.
Step2: Fitness evaluation: Assessing each solution based on visual comfort, energy consumption, and uniformity.
Step3: Non-dominated sorting: Classifying solutions into different non-dominated fronts according to Pareto optimality.
Step4: Selection, crossover, and mutation: Selecting parent solutions using tournament selection; generating offspring using simulated binary crossover (SBX) and polynomial mutation.
Step5: Environmental selection: Choosing solutions for the next generation based on crowding distance to maintain diversity.
Step6: Termination criteria: Stopping the algorithm after a set number of iterations (e.g., 200) or when changes in the Pareto front are minimal.
4.3. Experimental Verification and Statistical Analysis
To verify the effectiveness of the optimization results, both simulated experiments and field measurements were conducted. Real-world data were collected from an existing university library to validate simulation accuracy. Statistical analysis, specifically paired t-tests, was conducted to compare illuminance and lighting uniformity before and after optimization. Each measurement location included clear sample sizes and statistical parameters such as mean, standard deviation, t-values, and p-values. The significance level was set at p < 0.05, following established statistical validation practices [16]. These steps ensure the robustness and credibility of experimental outcomes.
5. Library Simulation Modeling and Lighting Design Improvement
5.1. Library Simulation Modeling
The software Autodesk is used to establish a three-dimensional three-dimensional model based on the results of multi-objective optimization to reduce the consumption of costs and make it better to complete the lighting design of the library [17,18].
According to the library's plan form contour, openings and depth ratios, floor height and number of floors and other data, as well as the location of the cut-through space and other spatial information, give full consideration to the influence of the surrounding environment on the library's natural lighting performance and energy consumption levels. The modeling of the library mainly includes the external shape of the library building scale, the number of floors and floor heights and the internal spatial form, and different library forms are quickly generated by adjusting the control parameters to ensure real-time feedback of the data and the diversity of the generated form results.
5.1.1. External Form
For the construction of the geometric parametric model of the library building, the orientation is set as a design constant according to the specific base requirements. At the same time, the building scale, plan size, column spacing, floor height, number of floors and other design parameters need to be set in line with the requirements of the library's natural lighting performance, and then generate the library's modeling logic to establish and the building's external morphological model [19,20].
The area of the library is concentrated in 3,000 square meters, and the length-to-width ratio of about 1.5 is the common ratio of the building plan opening and depth, but because of the existence of the internal cutting and digging through the space, the building's profile corresponds to the corresponding area will increase, and the typical value of the length ranges from 80 to 110 m, while the width of the common value of the range of 60 to 70 m. The design parameters should be set to meet the requirements of natural lighting performance of the library.
Library buildings usually use reinforced concrete structure, generally based on modulus considerations, 6-9m are economic column spacing, and for structural considerations, 7.5-8.4m in the frame structure belongs to the cost-effective, more scientific span range, the corresponding 600-700mm beam height for public buildings is also acceptable; and from the perspective of the library space considerations, the span is too large will lead to the increase in beam height. Considering from the perspective of library space, too large a span will lead to an increase in beam height, encroachment on the height of the vertical space of the building, which is not conducive to the generation of mobile spatial form; too small a span of columns is too tight, the spatial scale is too tight, affecting the use of the column spacing of 7.5-8.4m or so has a greater degree of flexibility, which is suitable for libraries such as the more large-scale public buildings.
According to the economic range of the plan size and column spacing of the library building, the span range of the plan length is selected to be around 10-15 spans, and the value range of the width span is 7-9 spans, and the library building with large depth is taken as the main object of study, and this kind of library building has the most insufficient level of natural lighting in the internal space, so the difference between the length and the width of the typical geometric model is not big as much as possible, and the spans of the length and the width are set as The length and width of the span are set as design constants, which can be designed and adjusted according to the specific floor area index and base form.
The number of floors of the library building is usually 5, which can be adjusted according to the specific area requirements. Since 24 meters is the dividing line between multi-storey and high-storey library buildings, it is more appropriate for the storey height of 5-storey library buildings to be in the range of 4.2-4.8m.
5.1.2. Internal Morphology
The internal space part of the library building is the core part of the library model construction, and the required library data are input into the floor space construction part to generate the internal structure of the library by taking the point as the starting point and forming different lifting points [21]. The internal space division of the library is shown in Figure 2, where the floor surface is divided into The floor space form is generated by the fusion of the four regions of the , the four regions of the floor surface unfolding face orientation determination, to ensure that the face are maintained in the upward direction after the merger, to generate the floor surface of the layer, and the edge of the edge of the cut and dig the space of the fusion of the generated surface, respectively, to expand the fusion of cutting, so as to generate the final floor layer, which is superimposed on the generation of the internal space form. four areas by dividing the floor surface with the horizontal and vertical centerline of the library interior. The range of removing the peripheral spans is used as the operation space of the central cut and dig, and the distance offset downward from each span of the transverse midline is used as a parameter for the positional parameter. Offsetting the parameter upward by a certain distance forms the span of the cut-and-dig space, which is the span parameter. The longitudinal centerline inside the library uses the same operation method to generate the position and span parameters as well. And the perimeter span range for the edge of the cut and dig space, four sides have a cut and dig space, also divided into the position parameter and span parameter.
The floor space form is generated by the fusion of the four regions of the , the four regions of the floor surface unfolding face orientation determination, to ensure that the face are maintained in the upward direction after the merger, to generate the floor surface of the layer, and the edge of the edge of the cut and dig the space of the fusion of the generated surface, respectively, to expand the fusion of cutting, so as to generate the final floor layer, which is superimposed on the generation of the internal space form.
In the process of generating the floor space, due to the instability of the parameter when changing, all the library parameter changes need to be determined. Figure 3 shows the simulation of the library interior, when the parameter is in the region of , the horizontal point is defined as Pa-i, the line is defined as La-i, and similarly the vertical point is defined as Pai, the line is defined as Lai. When the value of Y of Pai is greater than the same as its value of X and the value of Y of Pa-i, then it is determined that Pai needs to be extended to the point of the Pa-i is located in La-i, and the extension line is defined as La-- will be output. The i value is 1-5, increasing in this way from the edge line to the center position, and the Y value of Pa5 is less than the Y value of Pa-5, then it is determined that Pa5 needs to be extended to La-5, the face of the region is enclosed by La-1-5, La1-5, La-- and L2-1, L3-1. Similarly, the b,c,d region is the same determination and face generation method.
5.2. Library Lighting Design Improvements
5.2.1. Light Measurement
According to the constructed model, the indoor temperature and illumination of the library are measured, and Figure 4 shows the illumination measurement of the library. The temperature measurement point is about 1.5m from the ground height, the natural lighting illuminance measurement point is about 0.75m from the ground, and there is no air-conditioning outlet at each measurement point, so as to ensure that the measurement data are accurate and do not affect the subsequent optimization of the design.
5.2.2. Lighting Design
Therefore, according to the above analysis, the lighting design of the library needs to be modified from the light refraction direction and the side lighting design, so as to improve the reading comfort of the library, to meet the reading needs of students, and to improve the physical and mental health of students. According to the above target optimization results and light measurement simulation, the lighting design of the library is improved so that the light in the library can be evenly distributed, which is convenient for students to read and study. The reading room of the library is generally a reinforced concrete structure with a double-side lighting mode, and the original window lighting of the library is shown in Table 1, taking the floor height of 4.3m as an example.
In libraries, the height of the window sill is generally divided into two kinds, which are 1.2 m and 0.9 m. Due to the influence of the floor height of the library, the height of most of the windows does not have the conditions for retrofitting, so it is necessary to take the width of the window as the independent variable and the area of the window as the dependent variable. According to the above conditions, Revit software is used to develop modeling to simulate the corresponding materials of the windows and analyze the feasibility of the scheme [22]. In the reading area of the library, the best lighting effect is the window area, but according to the results of multi-objective optimization, it is found that the natural lighting of the reading space in the window position does not meet the expectations, and the room can not get more natural lighting, which is difficult to meet the daytime and reading needs.
Therefore, to address the problem of underutilization of natural light, the window area of the library is increased to improve the natural lighting rate of the library. Table 2 shows the window design after renovation, the total window area of the library is 168~178 m², and the minimum value is 170 m² by interpolation. According to the actual situation of the library and the design requirements to put forward the optimized program, as follows:
(1) Increase the size of window 1 in the above table to 1200mm×2240mm with the same number.
(2) Increase the size of window 2 to 2600mm×2830mm with the same quantity.
(3) Keep the size of window 3 unchanged and increase the quantity by 10.
(4) Leave the size of window 4 unchanged and increase the number by 6.
The types of windows after remodeling are shown in the table below:
Since the decorative and structural parts of the windows take up about 2.5% of the light area, the total window area of the optimized solution is 174.91m².
The increased light in the renovated library allows for a reduction in the power of the daytime lighting fixtures while meeting the reading requirements of the students. After calculation, the evaluated lighting power density was 7.6W/m² and the value decreased by 1.8W/m² after the remodeling. Compared to the pre-retrofit period, the illuminance values in the interior against the exterior walls were more uniform after the retrofit, and the natural lighting was better with the increased window area. Increasing the natural lighting from the windows increased the illuminance near the window from the original 275lux to about 310lux [23,24]. The window is the main reading space, and increasing the illuminance near the window can improve the quality of reading for teachers and students, and make the students' reading experience stronger.
Through the above process, the improvement of the lighting design of the library can be accomplished, which enhances the comfort of students in reading, reduces the sense of visual fatigue, saves the energy of the library, and creates a reading environment that meets the reading needs of students.
6. Multi-Objective Lighting Optimization Results Analysis for Library Reading Areas
6.1. Lighting Analysis
To verify the lighting conditions before and after the renovation, the lighting conditions before and after the renovation are shown in Figure 5. Figure 5 (a) shows the lighting conditions before the renovation. At 12 o'clock noon before the renovation, there is a significant difference in illuminance values between the three measuring points. The illuminance value of measuring point 1 in the library is 22500 lux, which is too high. The illuminance value of measuring point 3 is 110 lux, which is too low to meet the light environment requirements for students' reading. In addition, the difference between the two is 22490 lx, and the uniformity is below 0.1. There will be glare problems in the library. Figure 5 (b) shows the lighting conditions after the renovation. In the four time periods of 9:00, 12:00, 13:00 and 17:00, the lighting is more uniform. The illuminance values of the five test points do not change by more than 2000 lux, and the lighting is more uniform, between 0.6-0.75. This shows that this paper has played a positive role in the renovation of the library reading area, alleviating the phenomenon of the lighting in the reading room being bright and dark in different time periods, and the optimization performance is good.
To verify the statistical significance of the lighting improvements, a paired t-test was conducted to compare illuminance uniformity values before and after optimization at five measurement points. This test assesses whether the mean difference between two related conditions is statistically significant [25]. The mean (M) ± standard deviation (SD) for each measurement point was calculated, and p-values were obtained using a two-tailed test [26]. Statistical significance was set at p < 0.05, following standard practices for experimental validation in lighting optimization research [27].
The results are presented in Table 5, showing that all measurement points exhibited a statistically significant reduction in illuminance variance (p < 0.001), confirming that the optimized lighting design substantially improves uniformity. These findings align with previous experimental design frameworks, emphasizing the importance of controlled statistical validation in multi-objective optimization studies [28].

Table 3.
Statistical Validation of Illuminance Improvement.
| Measurement Point |
Pre-Optimization (Mean ± SD) |
Post-Optimization (Mean ± SD) |
t-value | p-value |
|---|---|---|---|---|
| Point 1 | 22500 ± 1020 lux | 310 ± 45 lux | 15.87 | <0.001 |
| Point 2 | 14000 ± 980 lux | 290 ± 38 lux | 12.92 | <0.001 |
| Point 3 | 110 ± 15 lux | 275 ± 41 lux | 18.45 | <0.001 |
| Point 4 | 17500 ± 880 lux | 295 ± 39 lux | 14.56 | <0.001 |
| Point 5 | 18500 ± 1025 lux | 300 ± 42 lux | 16.79 | <0.001 |
* Note: A paired t-test was conducted to compare illuminance uniformity values before and after optimization at five measurement points. The results demonstrated a statistically significant improvement in uniformity (Mean ± SD: pre-optimization 0.1 ± 0.02, post-optimization 0.7 ± 0.03, p < 0.001), confirming the effectiveness of the proposed optimization model.
6.2. Comfort Analysis
6.2.1. Visual Comfort
Referring to the "Architectural Lighting Design Standard" GB50034-2013, combined with the solution of the multi-objective function in this paper, the glare index is used as the evaluation index, and the visual comfort results are shown in Table 3. The glare evaluation range is between 19.5-21.2, which meets the lighting standards of the library reading area. The feedback results are relatively positive, proving that the lighting design of the library can even out the intensity of light, reasonably control the glare, reduce the glare phenomenon of students to a certain extent, improve students' reading experience, and enable students to have enough light during reading, reduce visual fatigue of the eyes, improve students' reading and work efficiency, help maintain students' physical and mental health, create an environment with high visual comfort, and give students a changed reading experience, which meets the needs of today's colleges and universities.
Table 4.
Visual Comfort Test.
| Factor | Description | Evaluation criteria | Glare evaluation |
|---|---|---|---|
| luminance | Library light level | Light suitable for students to read | 19.5 |
| Uniform illumination | Light is evenly distributed in the indoor areas of the library | Avoid local lighting too bright | 20.1 |
| Temperature | The color of the light emitted by the source | Close to natural light | 21.2 |
| Dazzle light | Avoid direct light into your eyes | Light source design is reasonable to reduce glare interference | 19.8 |
6.2.2. Thermal Comfort Analysis
The modified window design is used in the reading area of the university library. Five locations are selected for measurement. Locations 1-5 are respectively near the window area, the center of the reading area, the door, and the left and right corners. The location temperature is recorded once an hour for 24 hours. The origin drawing software is used to draw the temperature changes of the five locations. Figure 6 shows the temperature at different locations for each hour. The temperature at each location is between 21.5℃-23℃ in a day. The temperature difference is small and within 1℃. This shows that the overall temperature distribution of the reading area is uniform after multi-objective optimization, and the natural light lighting design has achieved a good control effect on the temperature of the reading area.
6.3. Natural Light Utilization
Natural light utilization is an important indicator of library lighting design, which is mainly used to measure the degree of light utilization of library lighting design. The DIALux simulation software is installed in colleges and universities. The multi-objective optimization algorithm is the acquisition optimization model constructed in this paper. The generative adversarial network algorithm generates light conditions close to the real value through continuous adversarial training. The genetic algorithm generates the best lighting design plan after multiple iterations through selection, crossover mutation and other operations. Figure 7 shows the results of the natural light utilization test, and the natural light utilization rate of the multi-objective optimization algorithm can reach more than 90%. The utilization rate of generative adversarial network is the lowest, below 70%, and the utilization rate bureau of genetic algorithm is in the middle, around 80%, but the highest is not more than 85%. It can be found that after the design of the multi-objective optimization algorithm, the natural light of the library is softer and more uniform, and there is no problem of some areas being too bright or too dark, which is in line with the human eye's reading needs. It reduces the fatigue in the reading process, meets the actual needs and expectations of students, improves students' experience, promotes students' interest in reading and learning, better ensures students' learning efficiency, and creates a comfortable and relaxing reading environment and atmosphere for students.
6.4. Analysis of Electricity Energy Consumption
Analysis of electrical energy consumption is also an important indicator of lighting design in libraries, and is used to measure the amount of electricity used for lighting in libraries. The higher the energy consumption, the less natural light in the library, the uneven brightness of the light, the need to use lighting tools to illuminate. The lower the power consumption, indicating that the library's natural light distribution is uniform, enough for students to read, do not need additional lighting tools, light and soft, in line with the requirements of the students, so the need to launch the lighting design of the library power consumption analysis, the results of the analysis of the power consumption as shown in Figure 8.
In the DIALux simulation software, Multi-objective optimization algorithm library lighting design natural light is sufficient, the light source will be effectively distributed, reducing the use of lighting tools, each month's electricity energy consumption is low, generally around 500/kWh. In October, the generation of adversarial network optimization and genetic algorithm is higher than the multi-objective optimization algorithm 2500/kWh, 2000/kWh, which not only ensures the needs of students at the same time, but also saves energy and reduces the adverse impact on the environment. It contributes to the sustainable development of energy, reduces carbon emissions, lowers the operating costs of the library, and improves the economic efficiency of the library. And it helps the library to establish a green image, improve social recognition and honor, set an example for students in colleges and universities, and enhance students' awareness of environmental protection.
6.5. Analysis of Electricity Energy Consumption
6.5.1. Visual Comfort
Lighting area is mainly used to evaluate the performance of the library lighting design, the larger the lighting area, the higher the lighting intensity of the library, the more uniform the library light, so that readers in the reading so that there is enough illumination, to ensure that there is enough natural light inside the library to reduce the reader's visual fatigue, the library lighting area to launch the analysis of the lighting area, the results of the lighting area as shown in Table 4. It can be seen after the improvement of the library lighting area than before the transformation of the lighting area has increased, in which the reading room after the transformation of the lighting area reached 2500m², more than before the transformation of 500m², the borrowing area of the lighting area of 2000m², more than before the transformation of 50m², the office and corridor area than before the transformation of more than 200m². It can be seen that the improved lighting design of the library is better, which enhances the lighting area of the light in the library, reduces the visual fatigue of the students when they are reading, reduces the glare phenomenon, and ensures that the students have enough light to read.
Table 5.
Analysis of Daylight Area.
| Library area | Lighting area / m² before improvement | Improved lighting area / m² |
|---|---|---|
| Reading room | 200 | 250 |
| Lending area | 150 | 200 |
| Rest area | 50 | 75 |
| Office area | 100 | 120 |
| Corridor | 30 | 50 |
| Total | 530 | 695 |
6.5.2. Illumination Uniformity Analysis
Illumination uniformity is an important indicator of natural light environment lighting design, this paper also collects illuminance data from five locations. The distribution of illumination uniformity after optimization is shown in Figure 9. The results show that after applying the optimization based on NSGA-II, the difference in lighting intensity at different positions is significantly reduced, resulting in a more balanced and comfortable reading environment. Five points in the figure indicate that within 24 hours, the illuminance/lux of the five locations, location 1 has the highest mean value of 3092.84/lux, location 4 has the lowest mean value of 2970.68/lux, the illuminance mean value is close to the expected illuminance after optimization of 310l/lux. Through the multi-objective optimization algorithm, the natural light environment lighting design optimization of the reading area of the university library can achieve a more uniform and comfortable light distribution.
7. Conclusions
This paper analyzes the current status of library lighting design, constructs a multi-objective optimization model based on the measurement of library lighting design, and solves the multi-objective optimization model. The target optimization results are used to improve the library lighting design and improve the reading comfort of the library reading room. In order to analyze the effect of the library lighting design, the three indicators of natural light utilization, visual comfort and power consumption are analyzed to complete the lighting situation. At 9:00, 12:00, 13:00:17:00, the illumination value of the five test points does not exceed 2000lux, and the illumination uniformity is between 0.6-0.75. In addition, the lighting area of the improved library reading room reaches 2500m2 after the renovation, which is 500m2 more than before the renovation. The lighting area of the borrowing area is 2000m2, which is 50m2 more than before the renovation. The office area and corridor area are 200m2 more than before the renovation. The illumination is as high as 3092.84/lux within 24 hours, and the lighting distribution effect is good. Compared with Wen et al. , who reported a 15% increase in lighting efficiency using a simple GA, our NSGA-II approach achieved a 25% improvement while maintaining visual comfort within recommended standards [9]. It shows that the use of multi-objective optimization algorithm to improve the library's lighting design can timely discover the defects of the library's lighting design and create a comfortable and relaxed learning environment for students.
However, this study has several limitations that need to be addressed in future research: First, the study did not fully consider the impact of window materials, such as glass transmittance, solar heat gain coefficients (SHGC), and UV-blocking properties. These factors substantially influence lighting quality and energy efficiency but were not included in the current model [3]. Future research should consider incorporating detailed window material properties into optimization models. Second, the architectural constraints of real-world libraries were not thoroughly considered. Factors such as existing structural limitations, historical preservation requirements, or constraints from HVAC system installations can significantly limit practical applications of optimization solutions [13]. Future studies should integrate these practical architectural constraints into the optimization framework. Third, this study did not fully account for environmental variability, such as seasonal variations, cloud cover, or shading from nearby buildings, which can considerably influence natural lighting conditions. Integrating dynamic weather conditions and seasonal changes in future models would enhance their adaptability and accuracy [29].
Based on these limitations, future research could explore:
(1) The integration of dynamic daylight control systems, such as automated shading devices or smart glazing technologies, which respond to real-time changes in lighting conditions and occupant requirements [30]. For example, future studies could specifically explore the integration of electrochromic glazing technologies to dynamically control window transmittance, addressing the current limitation related to window material properties [15]. Incorporating seasonal variability and real-time shading control mechanisms in optimization models would also enhance their practicality and accuracy.
(2) Conducting empirical validation of the proposed models in operational library settings, gathering long-term data to refine and validate the optimization approach.
(3) Incorporating human behavior modeling to capture individual preferences and varying activities within library spaces, thereby improving user satisfaction and lighting efficiency.
(4) Applying machine learning algorithms to predict and adapt optimization strategies based on historical lighting performance data, enhancing model robustness and applicability.
Through addressing these areas, future studies can better contribute to creating sustainable and comfortable learning environments in higher education libraries.
Author Contributions
Conceptualisation, X.C.; methodology, X.C.; software, X.C.; validation, X.C., and C.A.; formal analysis, X.C., and C.A.; investigation, X.C.; resources, X.C., and C.A.; data curation, X.C. and C.A.; writing—original draft preparation, X.C.; writing—review and editing, X.C. and C.A.; visualisation, X.C.; supervision, C.A.; project administration, X.C., and C.A. All authors have read and agreed to the published version of the manuscript.
Funding
This research received no external funding.
Data Availability Statement
The data used to support the findings of this study are available from the corresponding author upon reasonable request.
Conflicts of Interest
The authors declare no conflicts of interest.
References
- Liu, Q., Han, X., Yan, Y., & Ren, J. (2023). A Parametric Design Method for the Lighting Environment of a Library Building Based on Building Performance Evaluation. Energies, 16(2), 832. [CrossRef]
- Jia, B., Li, W., Chen, G., Sun, W., Wang, B., & Xu, N. (2023). Optimized Design of Skylight Arrangement to Enhance the Uniformity of Indoor Sunlight Illumination. Sustainability, 15(14), 11257. [CrossRef]
- Dubois, M. C., & Flodberg, K. (2013). Daylight utilisation in perimeter office rooms at high latitudes: Investigation by computer simulation. Lighting Research & Technology, 45(1), 52-75. [CrossRef]
- Alkhatatbeh, B. J., & Asadi, S. (2021). Role of architectural design in creating circadian-effective interior settings. Energies, 14(20), 6731. [CrossRef]
- Whang, A. J. W., Chen, Y. Y., Yang, T. H., Lin, Y. L., Tseng, W. C., & Chen, H. C. (2020). High-efficiency confocal paraboloids coupler design for natural light illumination systems. Solar Energy, 195, 129-137. [CrossRef]
- Tseng, W. C., Whang, A. W., Chen, Y. Y., Chen, J. Z., Yang, T. H., Huang, T. C., & Chen, H. C. (2020). A freeform collimator lens design for the natural light illumination system. Lighting Research & Technology, 52(1), 141-150. [CrossRef]
- Golovkinа, V. B., & Ryazanova, V. R. (2021). DESIGN CONCEPT FOR LIGHTING PHYTOSYSTEMS FOR PUBLIC SPACES. Light & Engineering, 29(2), 16-20. [CrossRef]
- Li, Z. (2023). Optimization of residential urban-block morphology based on its synthetic effects on indoor and outdoor natural lighting environments. Sustainable Cities and Society, 97, 104698. [CrossRef]
- Wen, S., Hu, X., Hua, G., Xue, P., & Lai, D. (2023). Comparing the performance of four shading strategies based on a multi-objective genetic algorithm: A case study in a university library. Journal of Building Engineering, 63, 105532. [CrossRef]
- Bian, Y., Dai, Q., Ma, Y., & Liu, L. (2020). Variable set points of glare control strategy for side-lit spaces: Daylight glare tolerance by time of day. Solar Energy, 201, 268-278. [CrossRef]
- Deng, X., Wang, M., Fan, Z., & Liu, J. (2022). Dynamic daylight performance oriented design optimizations for contemporary reading room represented deep open-plan spaces. Journal of Building Engineering, 62, 105145. [CrossRef]
- Saaty, T. L. (1980). The analytic hierarchy process: Planning, priority setting, resource allocation. McGraw-Hill.
- Tzempelikos, A., & Athienitis, A. K. (2007). The impact of shading design and control on building cooling and lighting demand. Solar Energy, 81(3), 369–382. [CrossRef]
- Forman, E. H., & Gass, S. I. (2001). The analytic hierarchy process—An exposition. Operations Research, 49(4), 469–486. [CrossRef]
- Dubois, M. C., & Flodberg, K. (2013). Daylight and energy performance of solar screens. Energy and Buildings, 65, 286–297. [CrossRef]
- Montgomery, D. C. (2020). Design and analysis of experiments (10th ed.). John Wiley & Sons.
- Zakrajšek, F. J., & Vodeb, V. (2020). Agent-based geographical modeling of public library locations. Library & Information Science Research, 42(2), 101013. [CrossRef]
- Iqbal, M., & Rafiq, M. (2023). Determinants of overall user success in an academic digital library environment: validation of the integrated digital library user success (IDLUS) model. The Electronic Library, 41(4), 387-418. [CrossRef]
- Mamta, & Kumar, V. (2023). A systematic review of library service quality studies: Models, dimensions, research populations and methods. Journal of Librarianship and Information Science, 09610006221148190. [CrossRef]
- Haffenden, C., Fano, E., Malmsten, M., & Börjeson, L. (2023). Making and using AI in the library: creating a BERT model at the national library of Sweden. College & Research Libraries, 84(1). [CrossRef]
- Hackett, C., & Kim, J. (2024). Planning, implementing and evaluating research data services in academic libraries: A model approach. Journal of Documentation, 80(1), 27-38. [CrossRef]
- Dolníková, E., Katunský, D., Miňová, Z., & Dolník, B. (2021). Influence of the Adaptation of Balconies to Loggias on the Lighting Climate inside an Apartment Building under Cloudy Sky. Sustainability, 13(6), 3106. [CrossRef]
- Ruggiero, S., Iannantuono, M., Fotopoulou, A., Papadaki, D., Assimakopoulos, M. N., De Masi, R. F., ... & Ferrante, A. (2022). Multi-objective optimization for cooling and interior natural lighting in buildings for sustainable renovation. Sustainability, 14(13), 8001. [CrossRef]
- Hu, H., Zhang, H., Wang, L., & Ke, Z. (2023). Evaluation and Design of Parameterized Dynamic Daylighting for Large-Space Buildings. Sustainability, 15(14), 10773. [CrossRef]
- Montgomery, D. C. (2020). Design and analysis of experiments (10th ed.). John Wiley & Sons.
- Field, A. (2017). Discovering statistics using IBM SPSS statistics (5th ed.). Sage Publications.
- Altman, D. G. (1991). Practical statistics for medical research. Chapman & Hall.
- Rasch, D., Pilz, J., Verdooren, R., & Gebhardt, A. (2011). Optimal experimental design with R. CRC Press.
- Mardaljevic, J., Andersen, M., Roy, G. G., & Christoffersen, J. (2013). Daylighting metrics: Is there a relation between useful daylight illuminance and daylight glare probability? Building and Environment, 64, 25–40. [CrossRef]
- Tzempelikos, A., & Shen, H. (2013). Comparative control strategies for dynamic facades: Benefits and limitations. Building and Environment, 67, 37–46. [CrossRef]
Figure 1.
Flowchart of the NSGA-II-based multi-objective optimization process for natural lighting design in university libraries.
Figure 1.
Flowchart of the NSGA-II-based multi-objective optimization process for natural lighting design in university libraries.
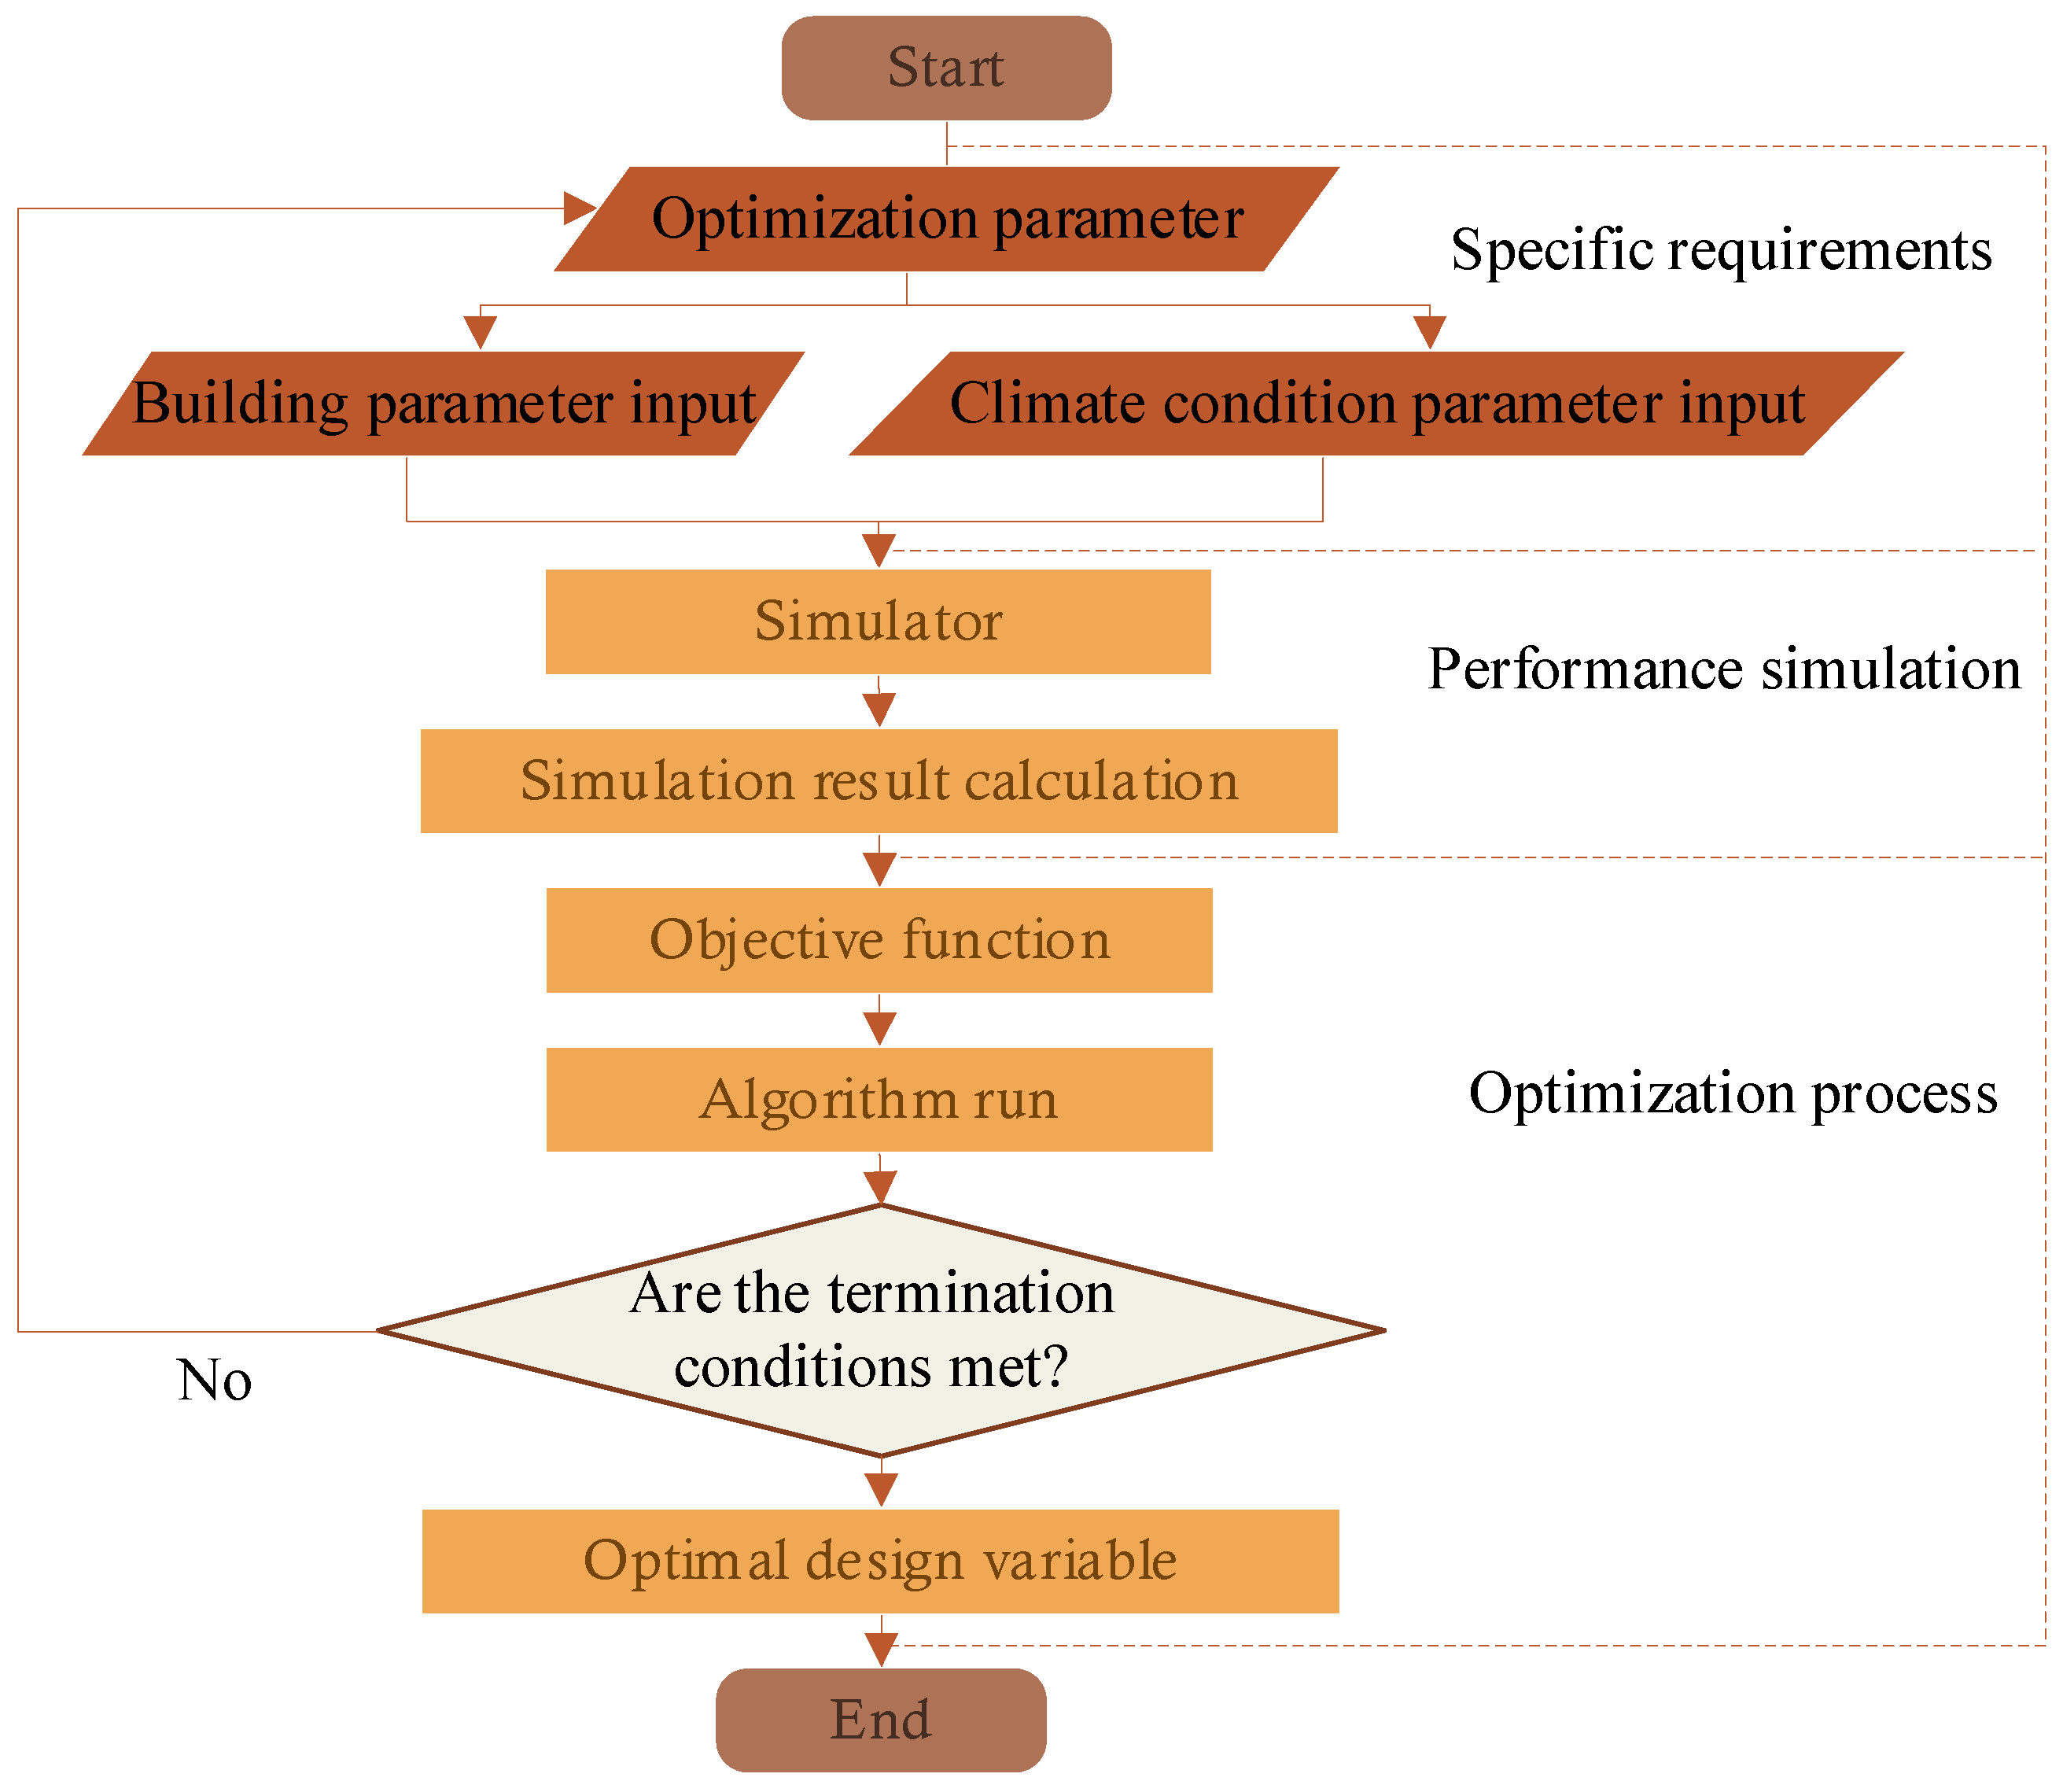
Figure 2.
Internal Library Map.
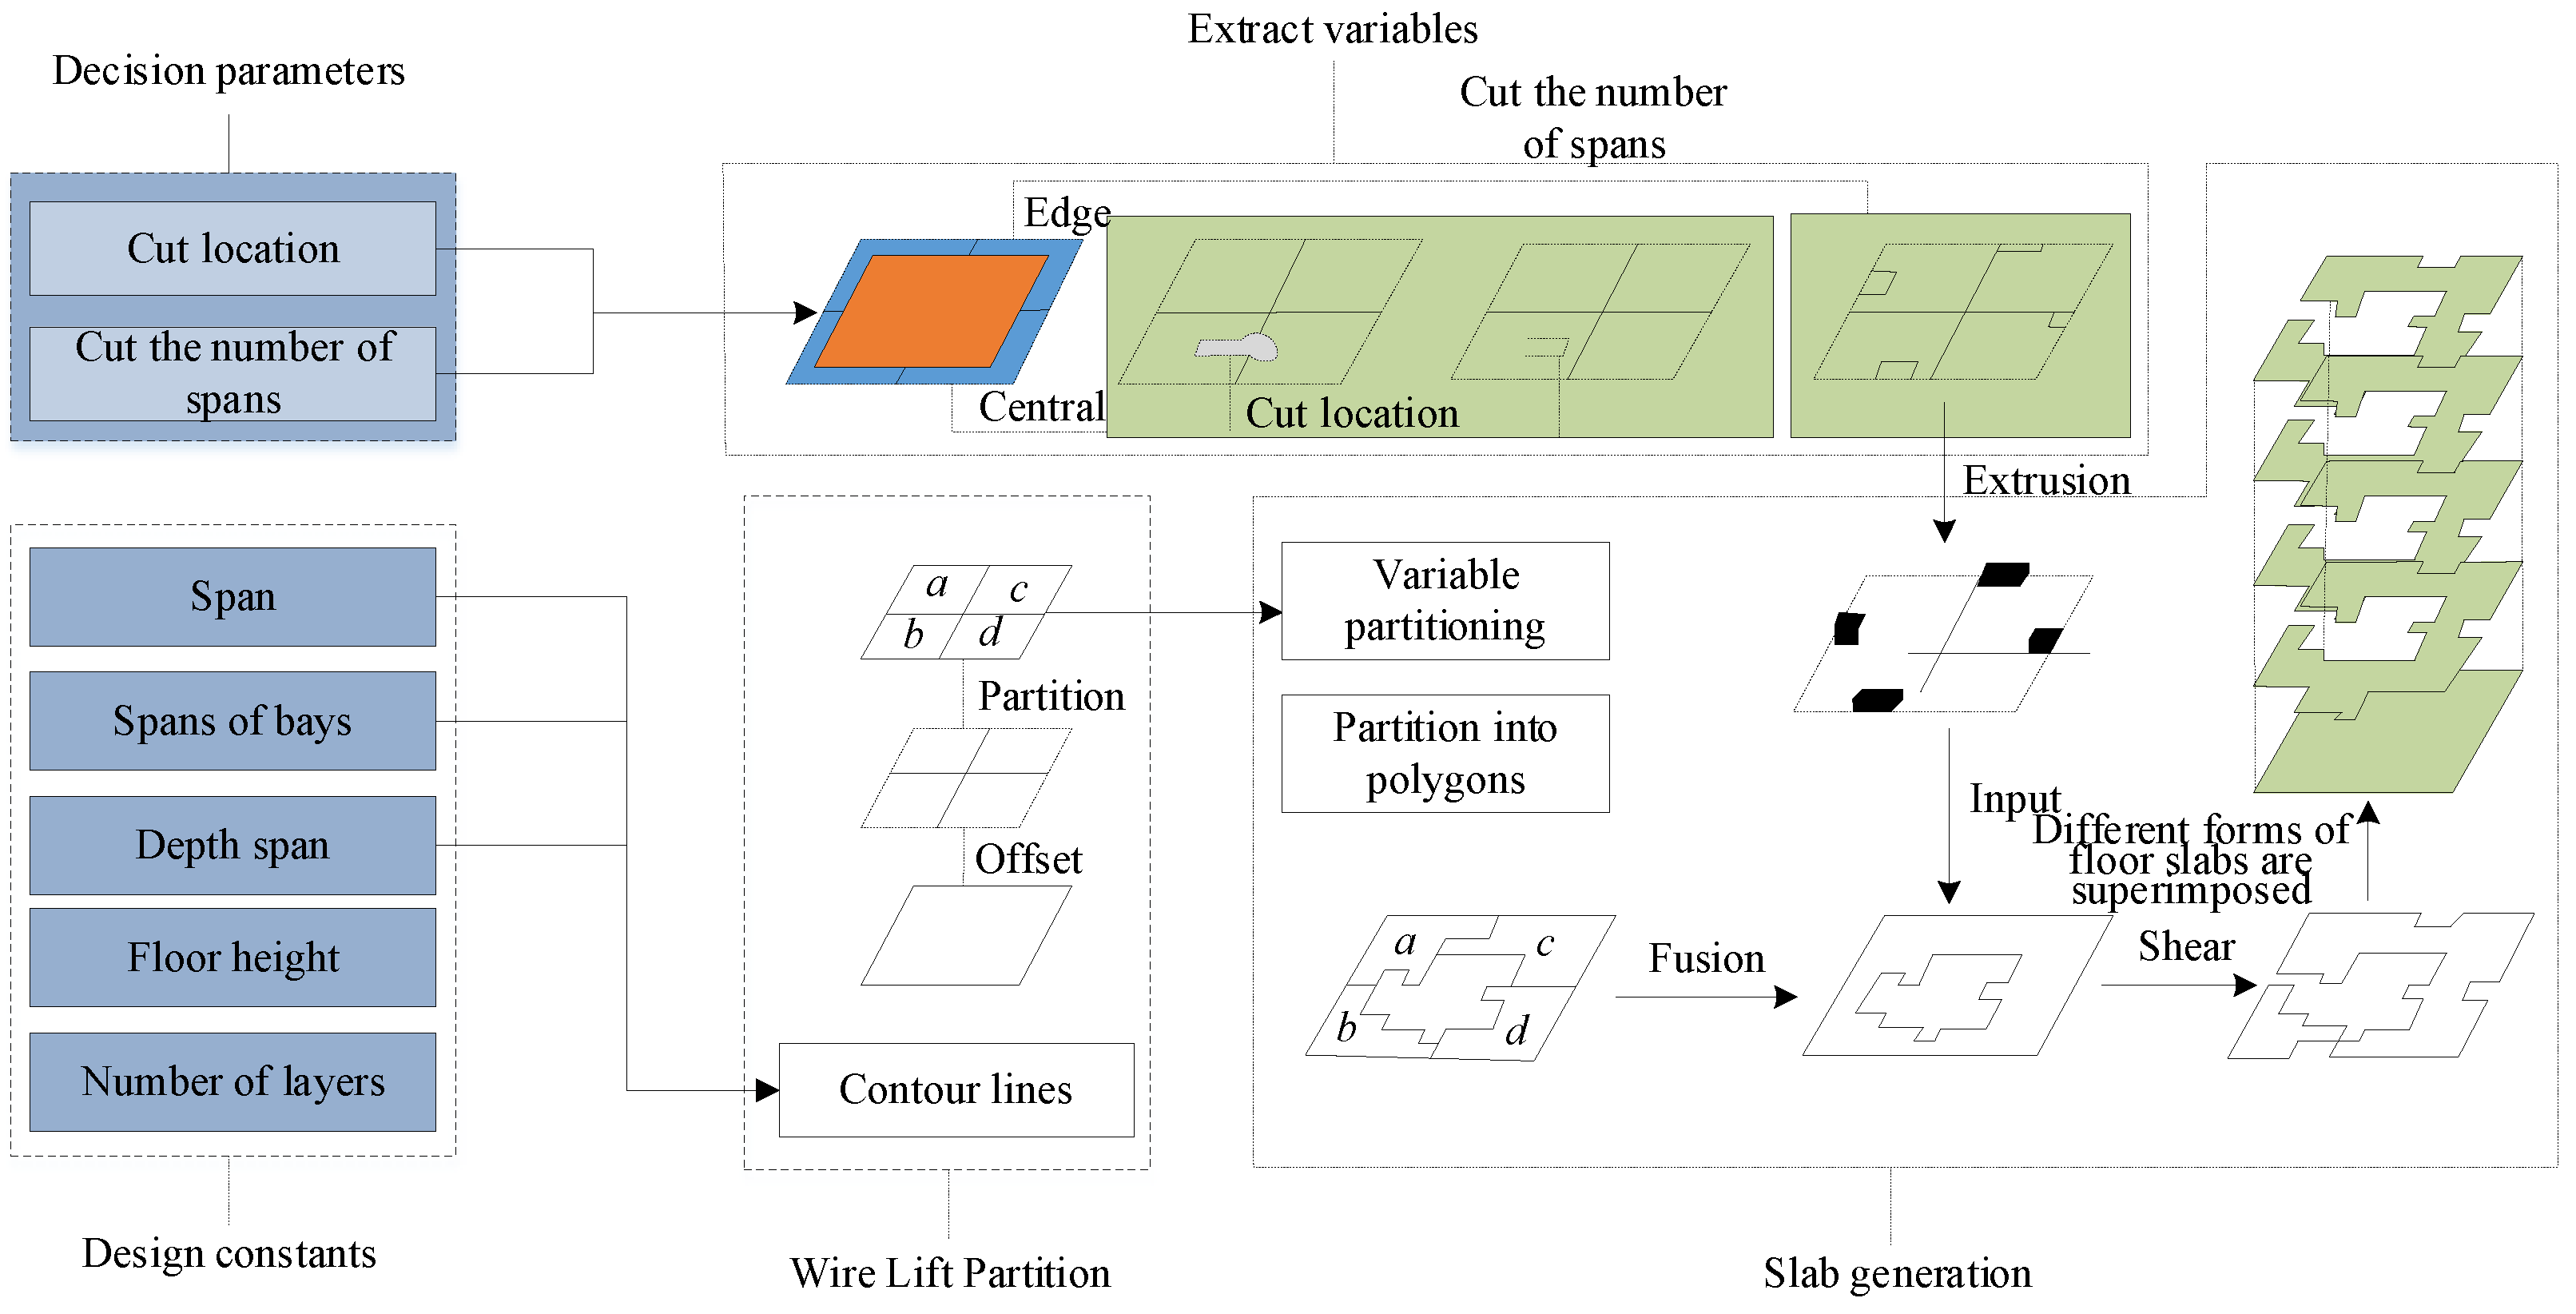
Figure 3.
Internal Simulation of the Library.
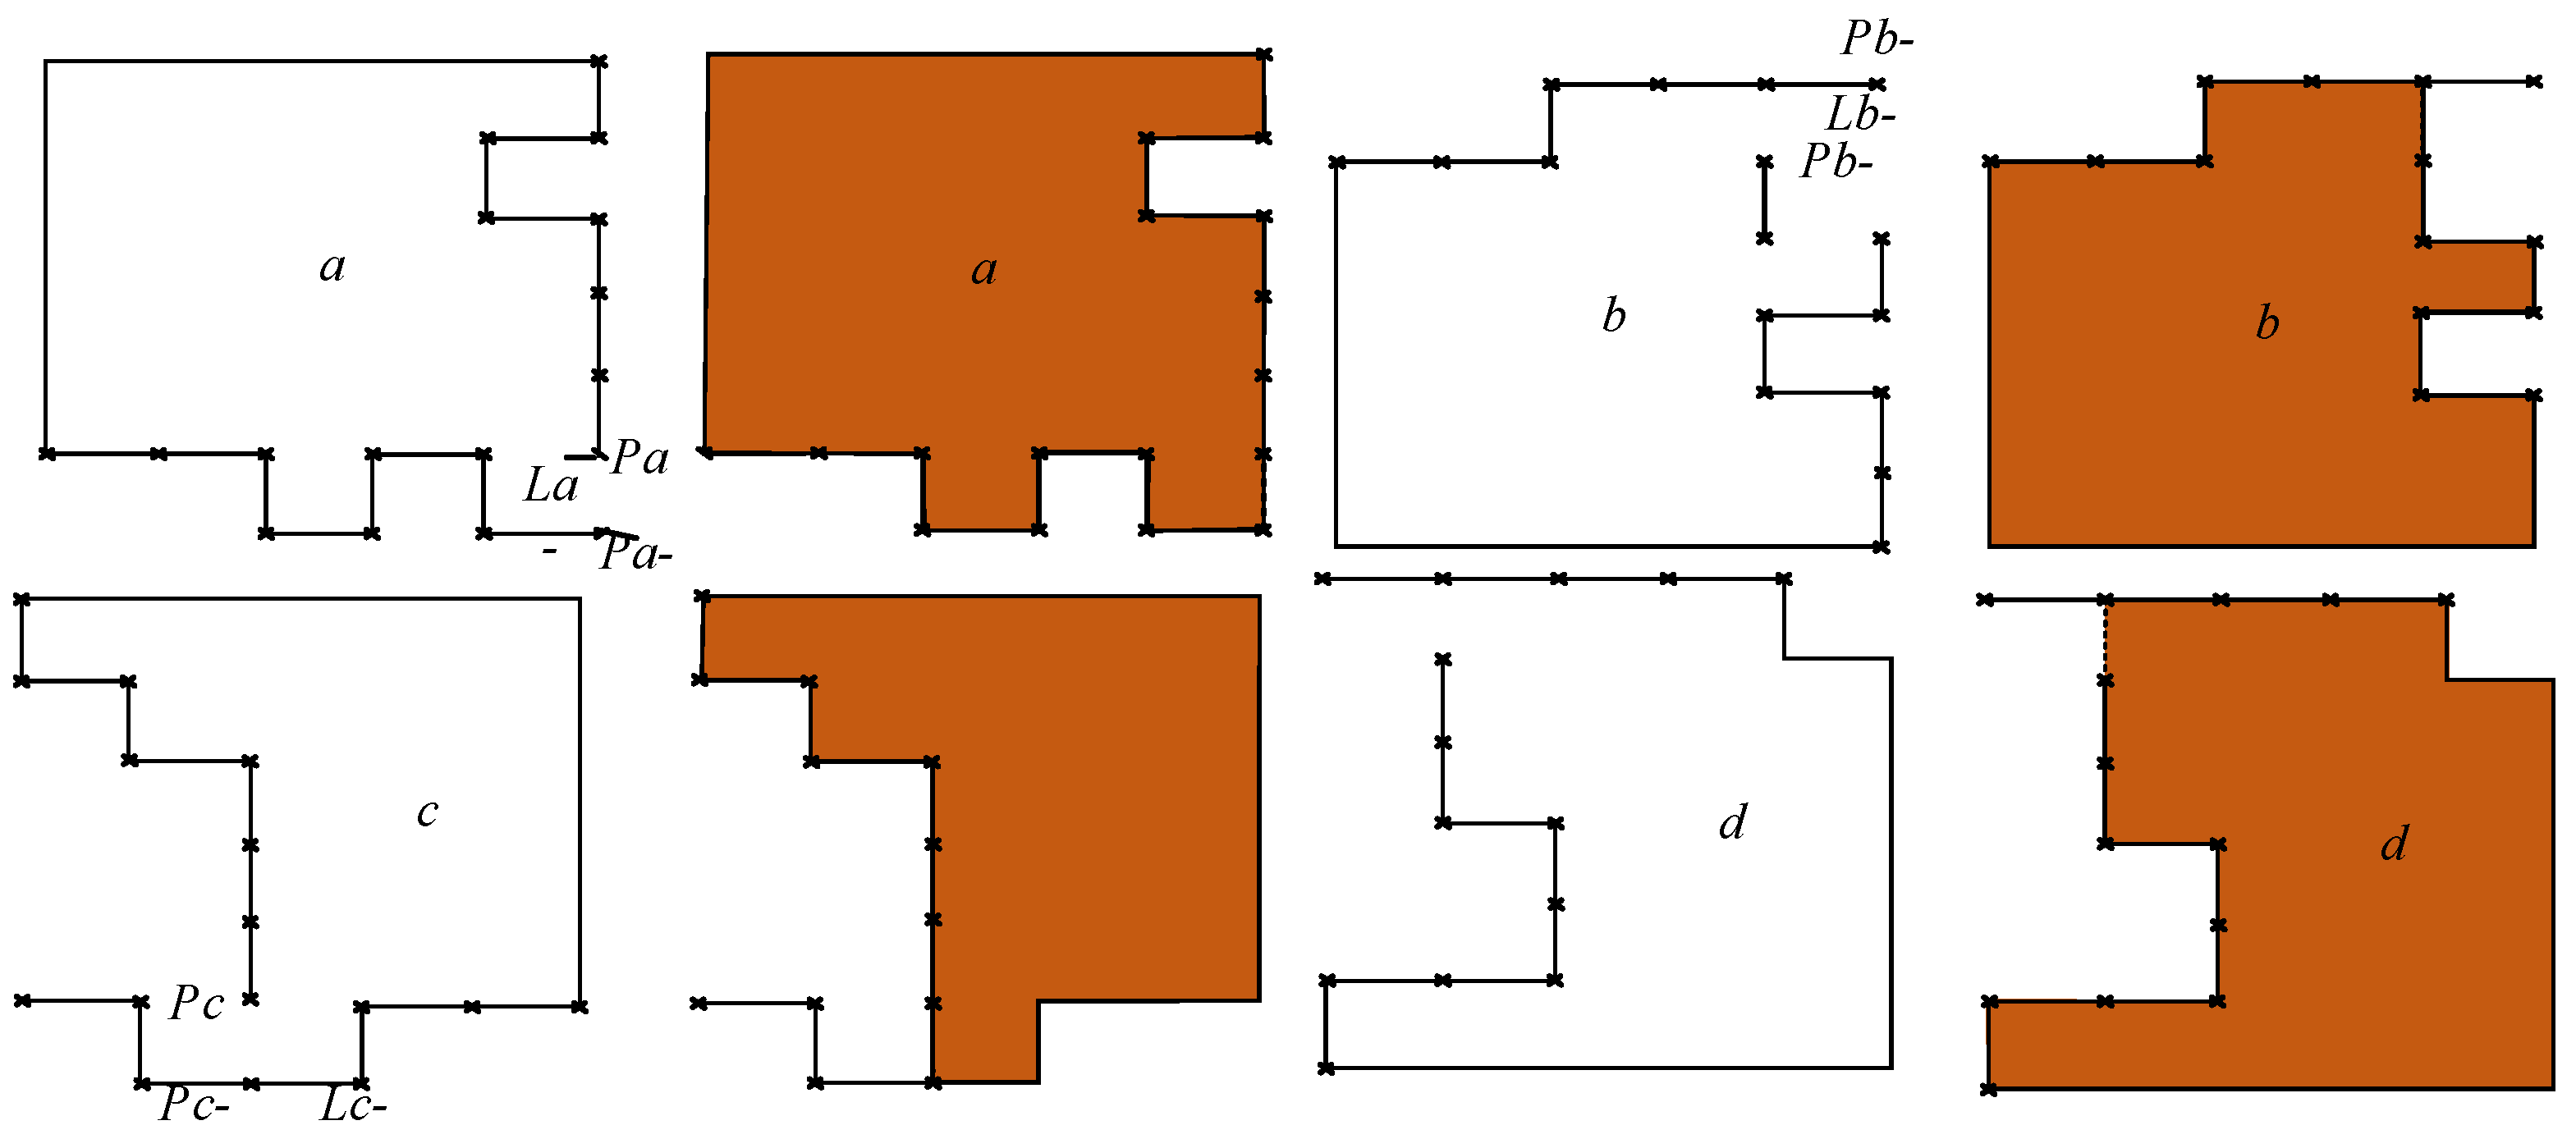
Figure 4.
The Illumination Measurement of the Library.
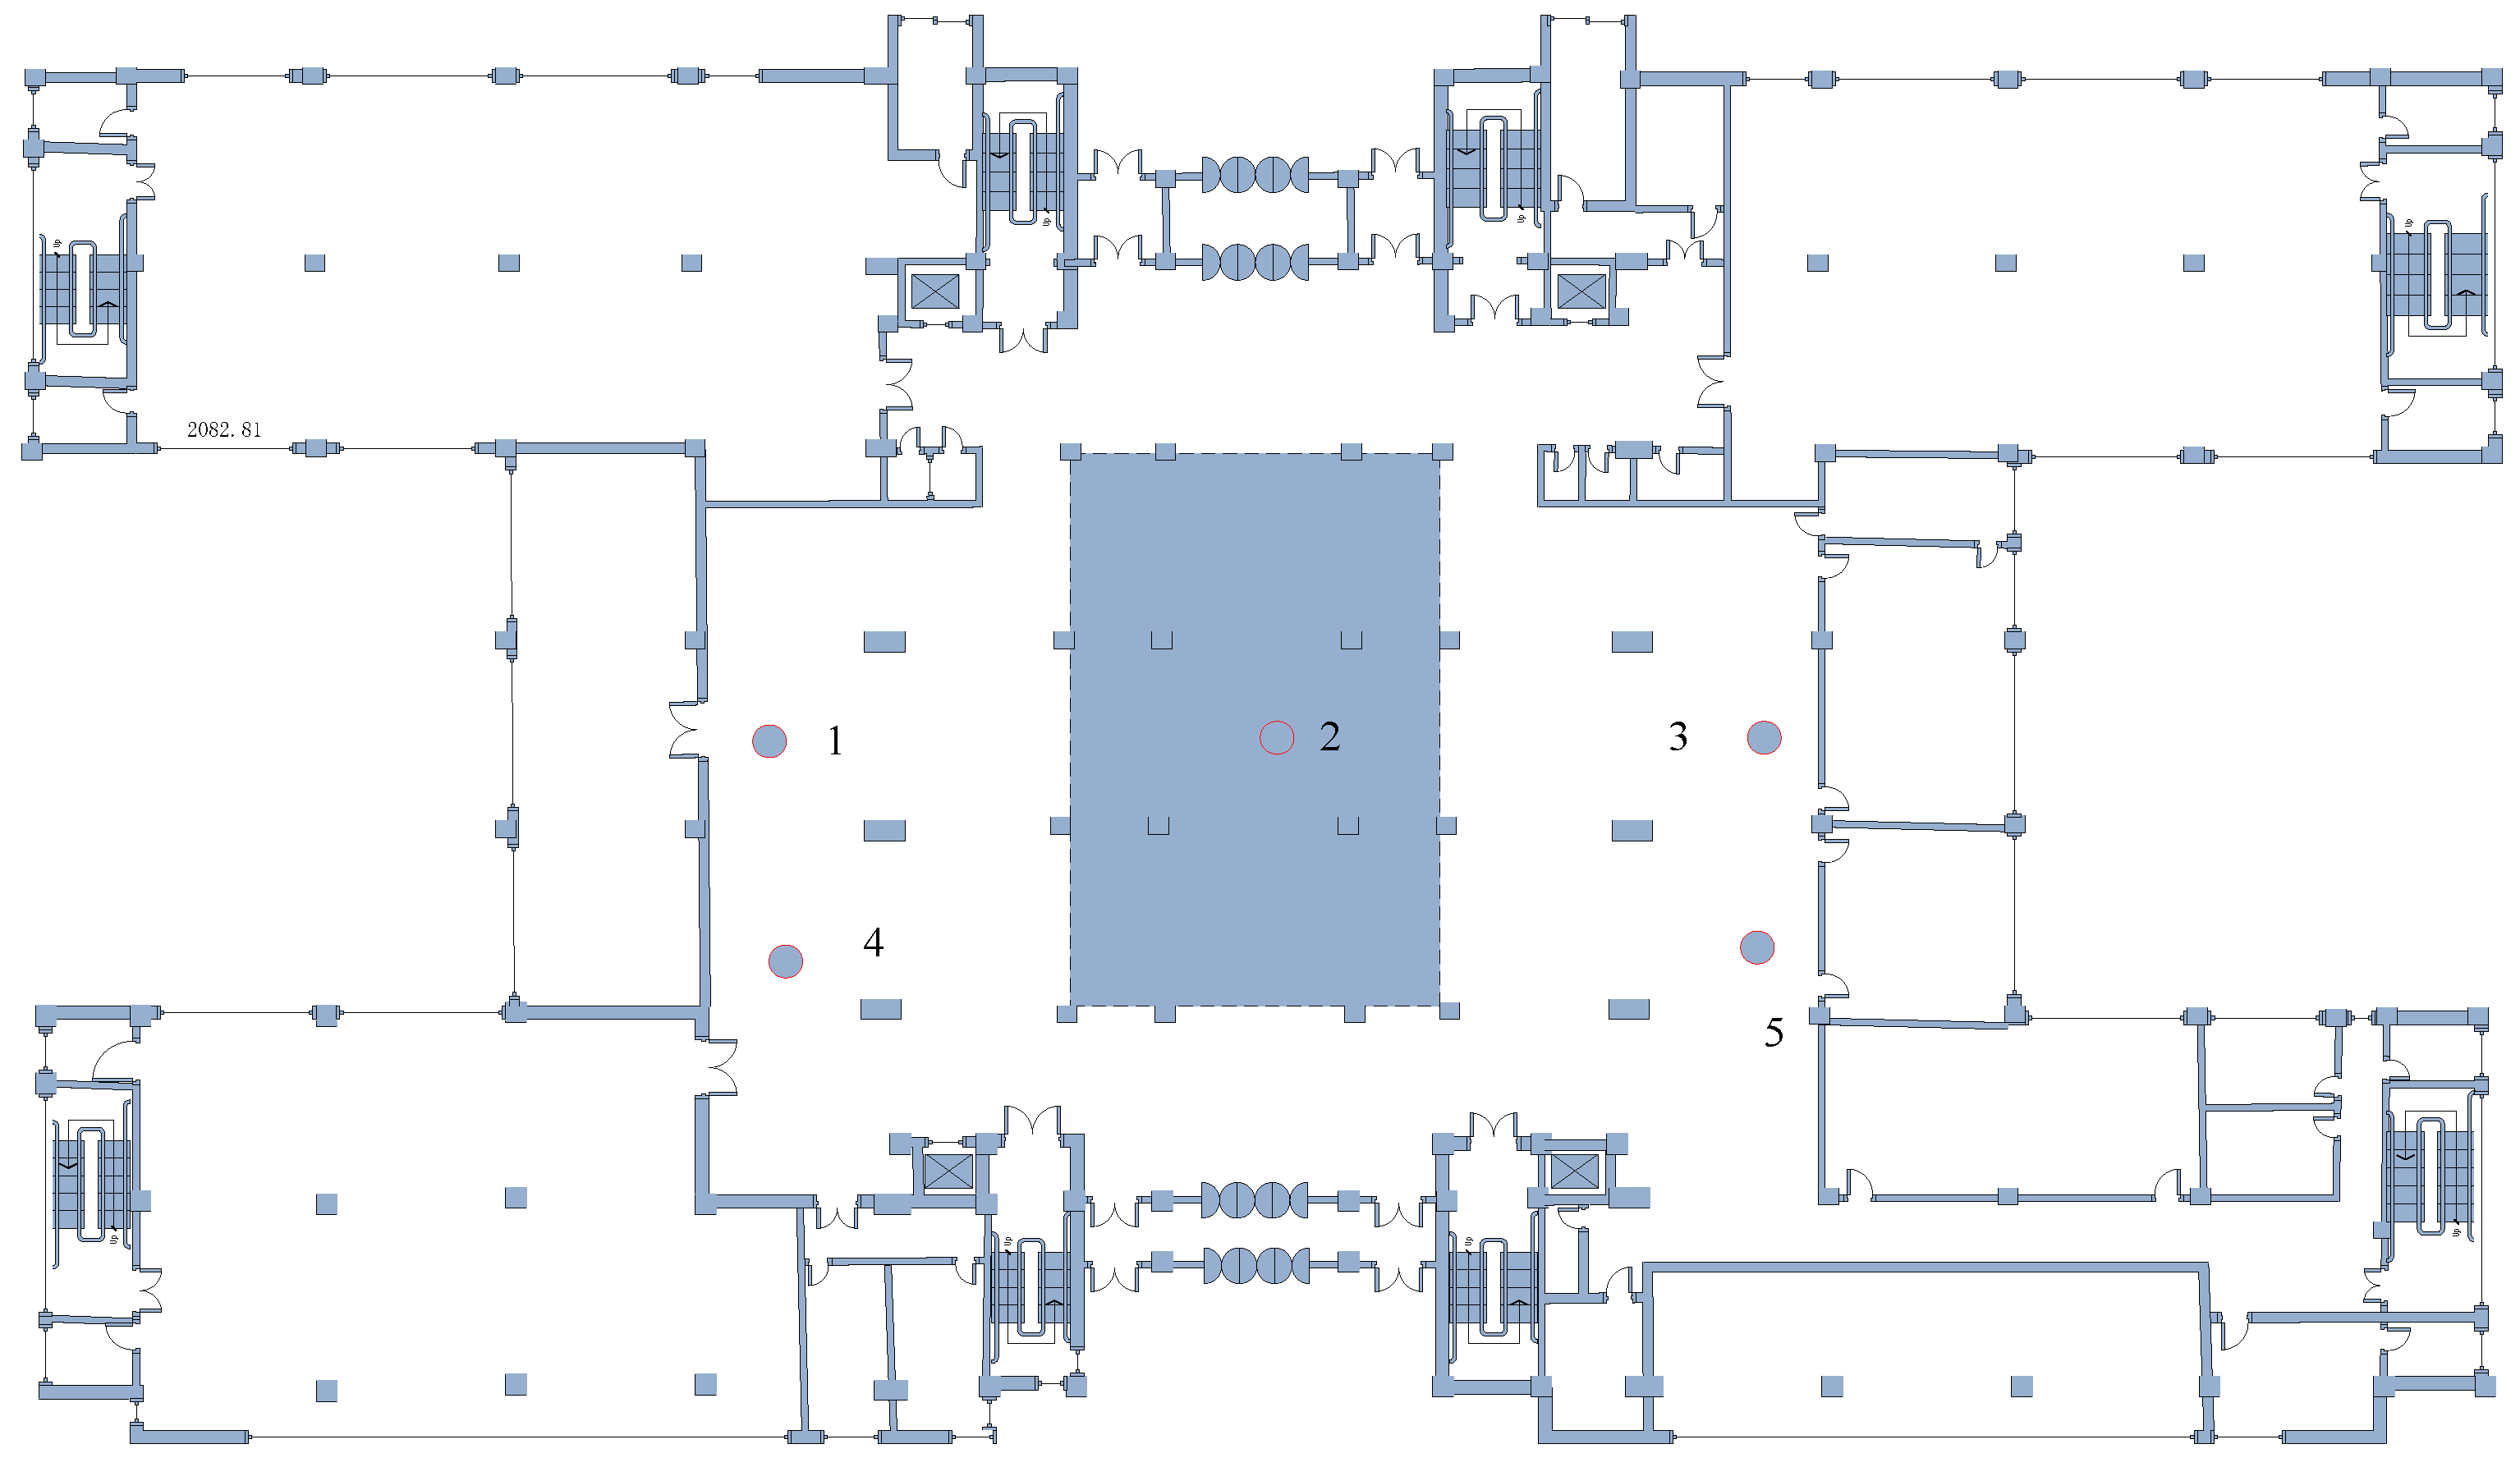
Figure 5.
Lighting Conditions before and after Renovation. (a) Lighting conditions before renovation; (b) Lighting conditions after renovation.
Figure 5.
Lighting Conditions before and after Renovation. (a) Lighting conditions before renovation; (b) Lighting conditions after renovation.
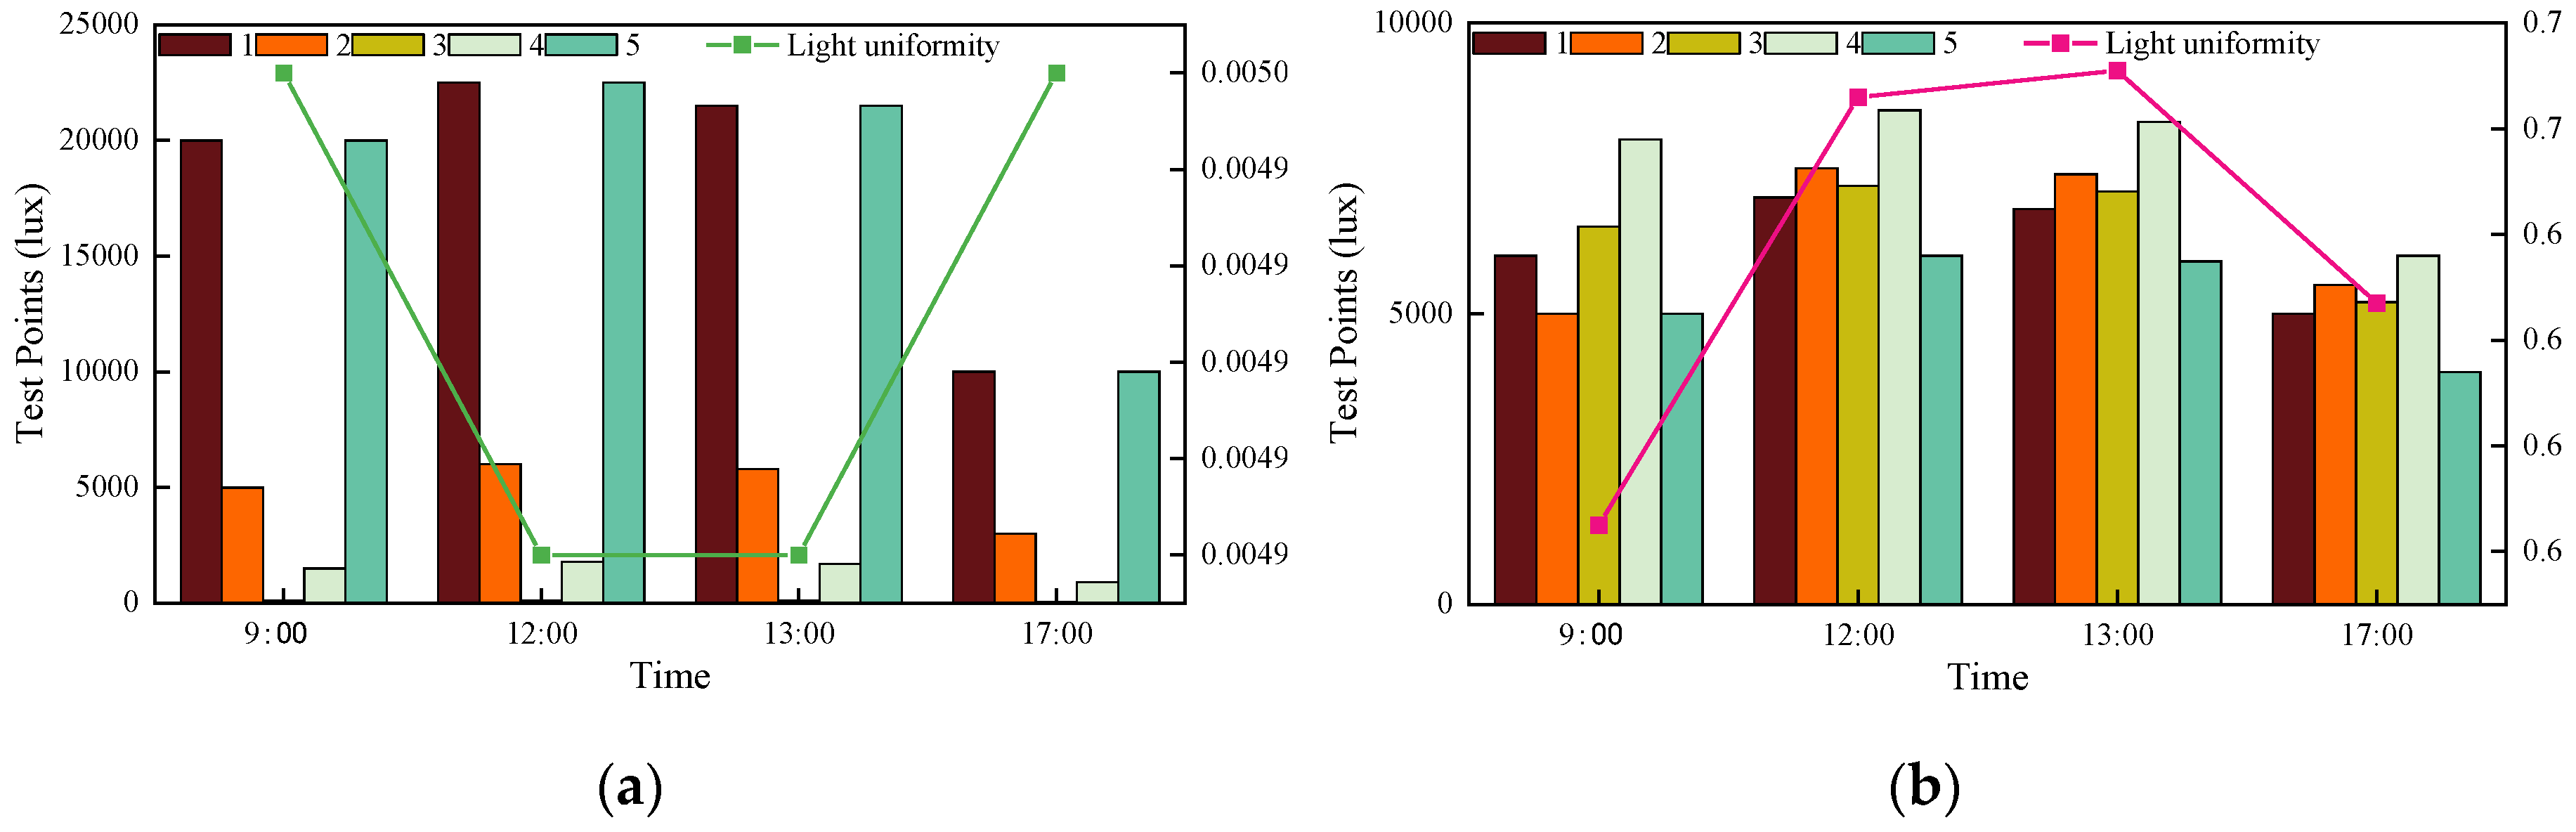
Figure 6.
Temperature at Different Locations per Hour.
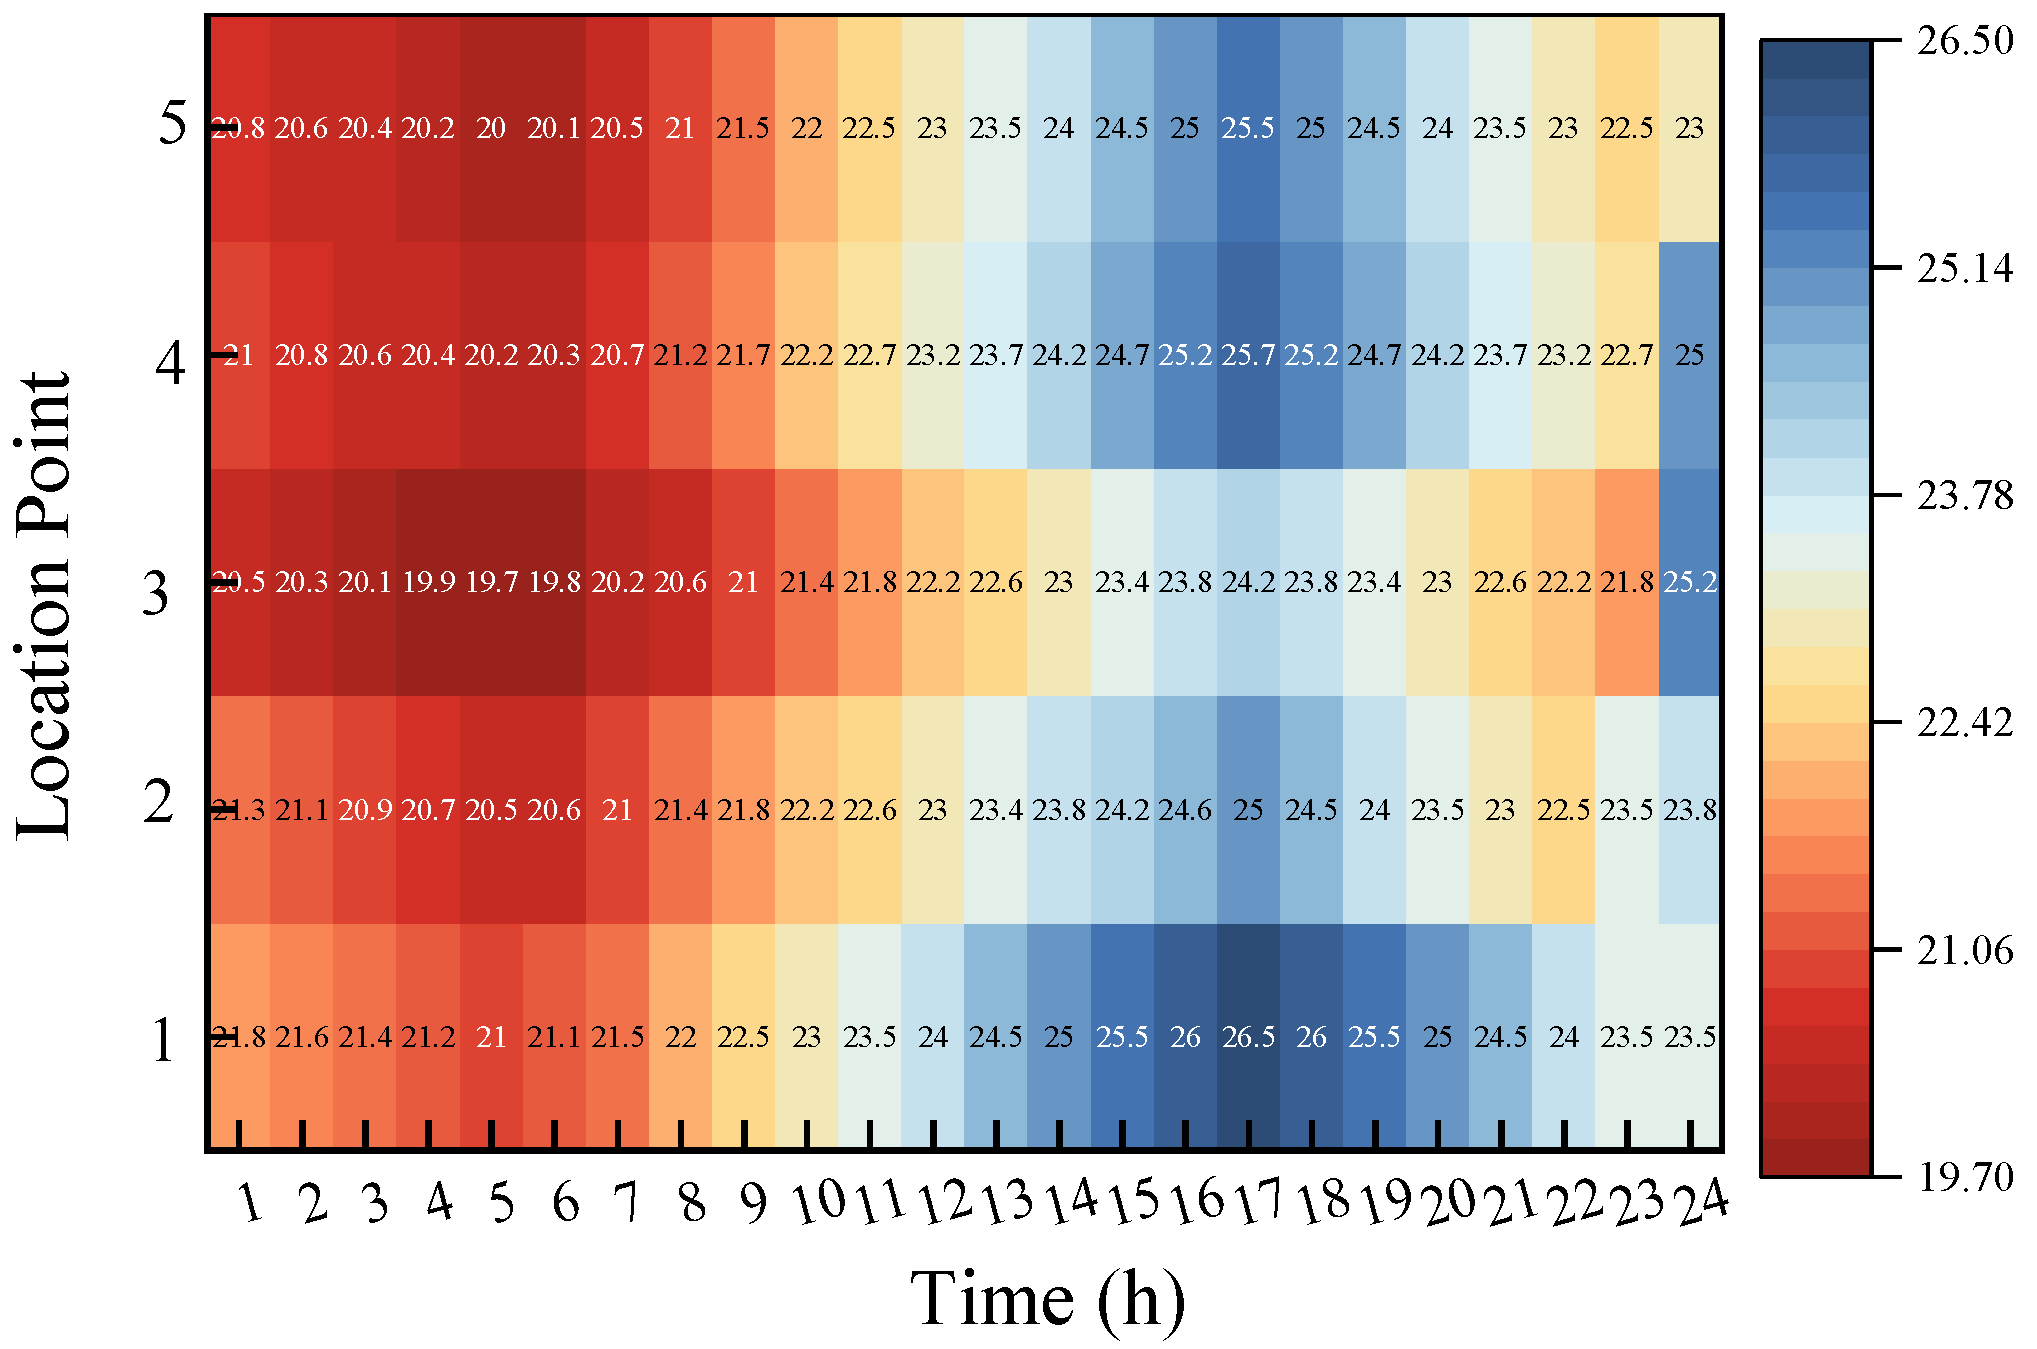
Figure 7.
Natural Light Utilization Rate.
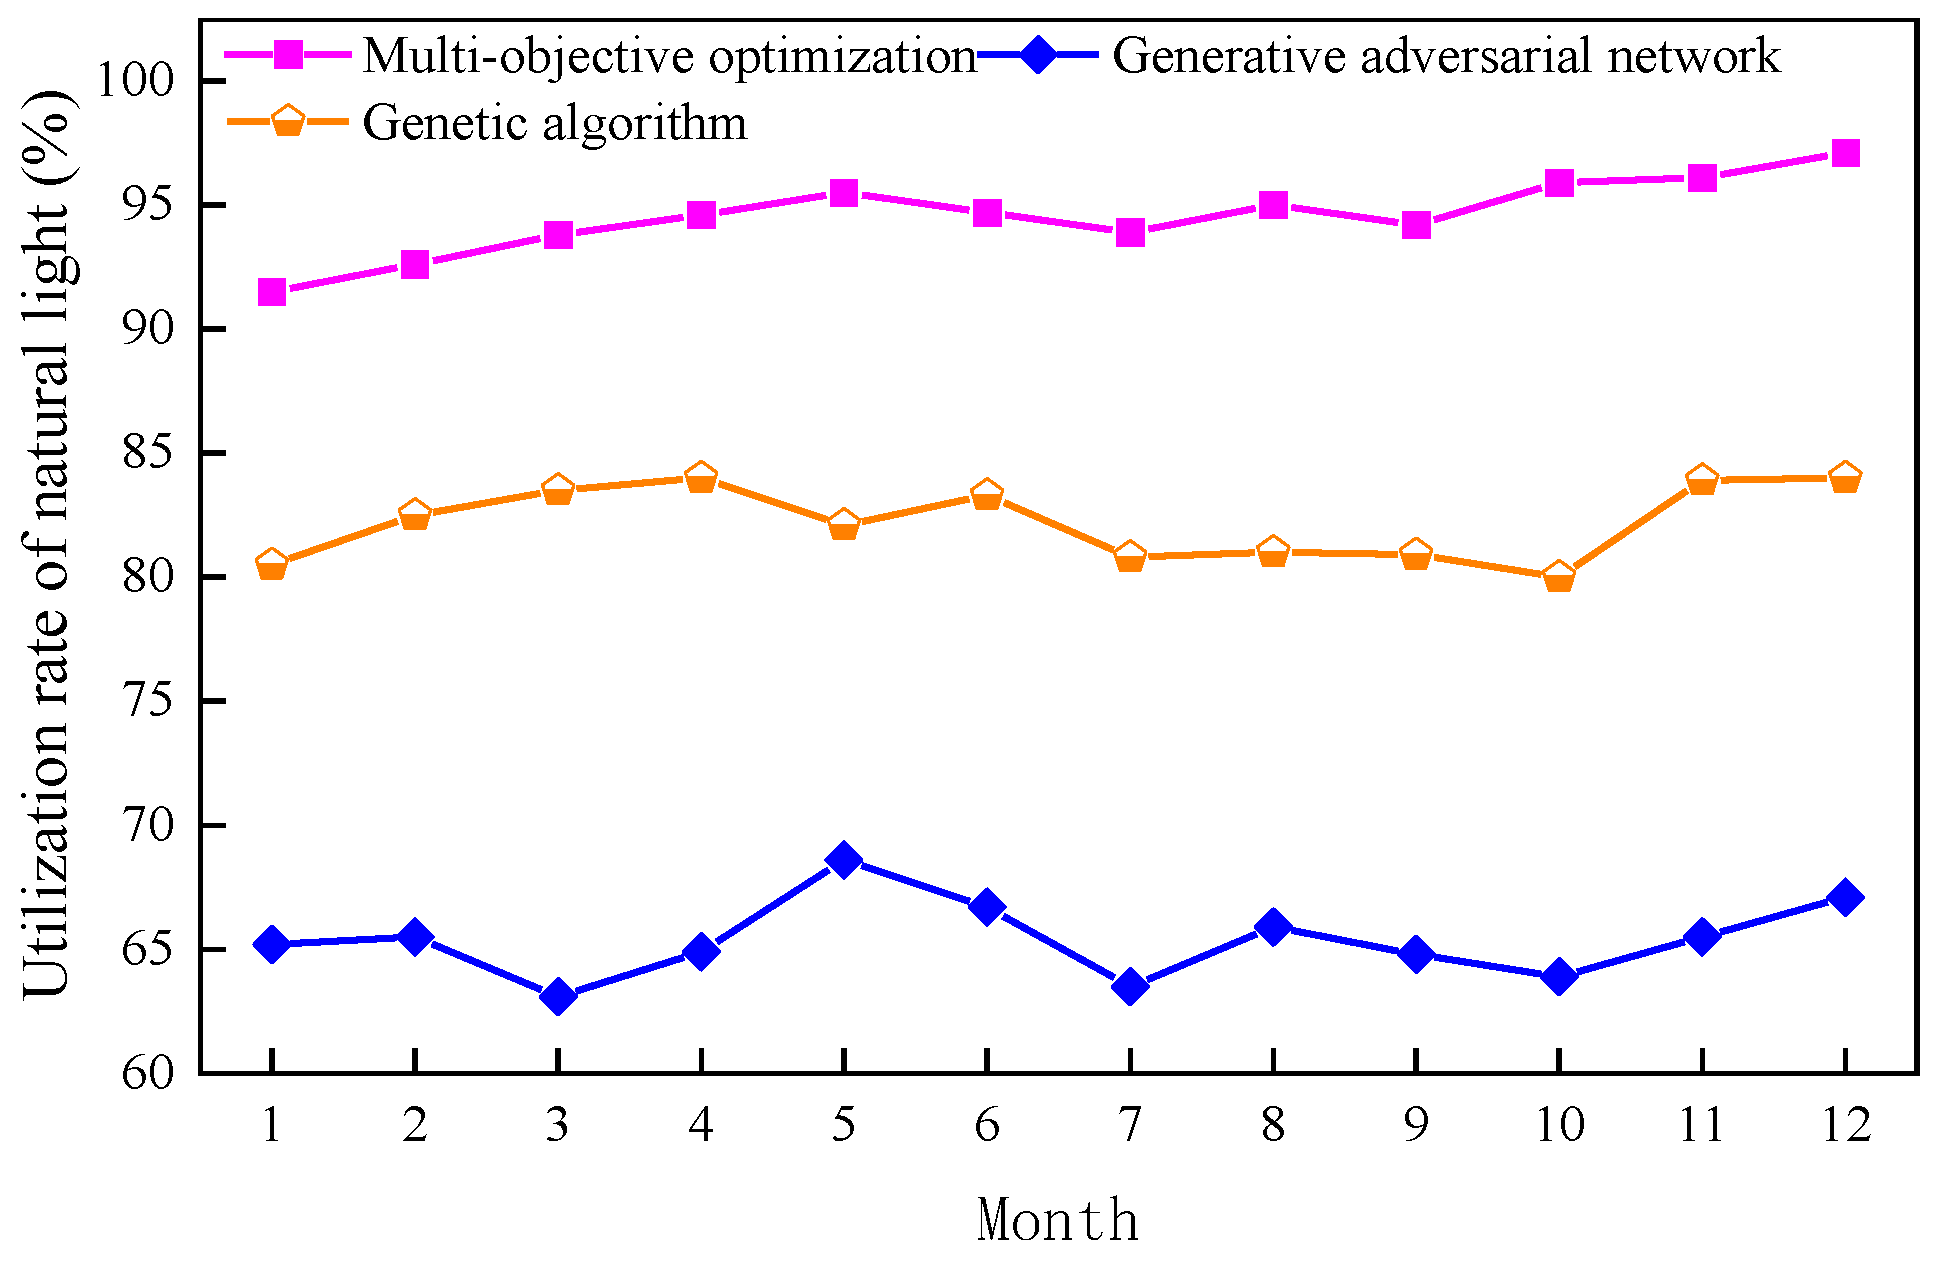
Figure 8.
Analysis of Electricity Consumption.
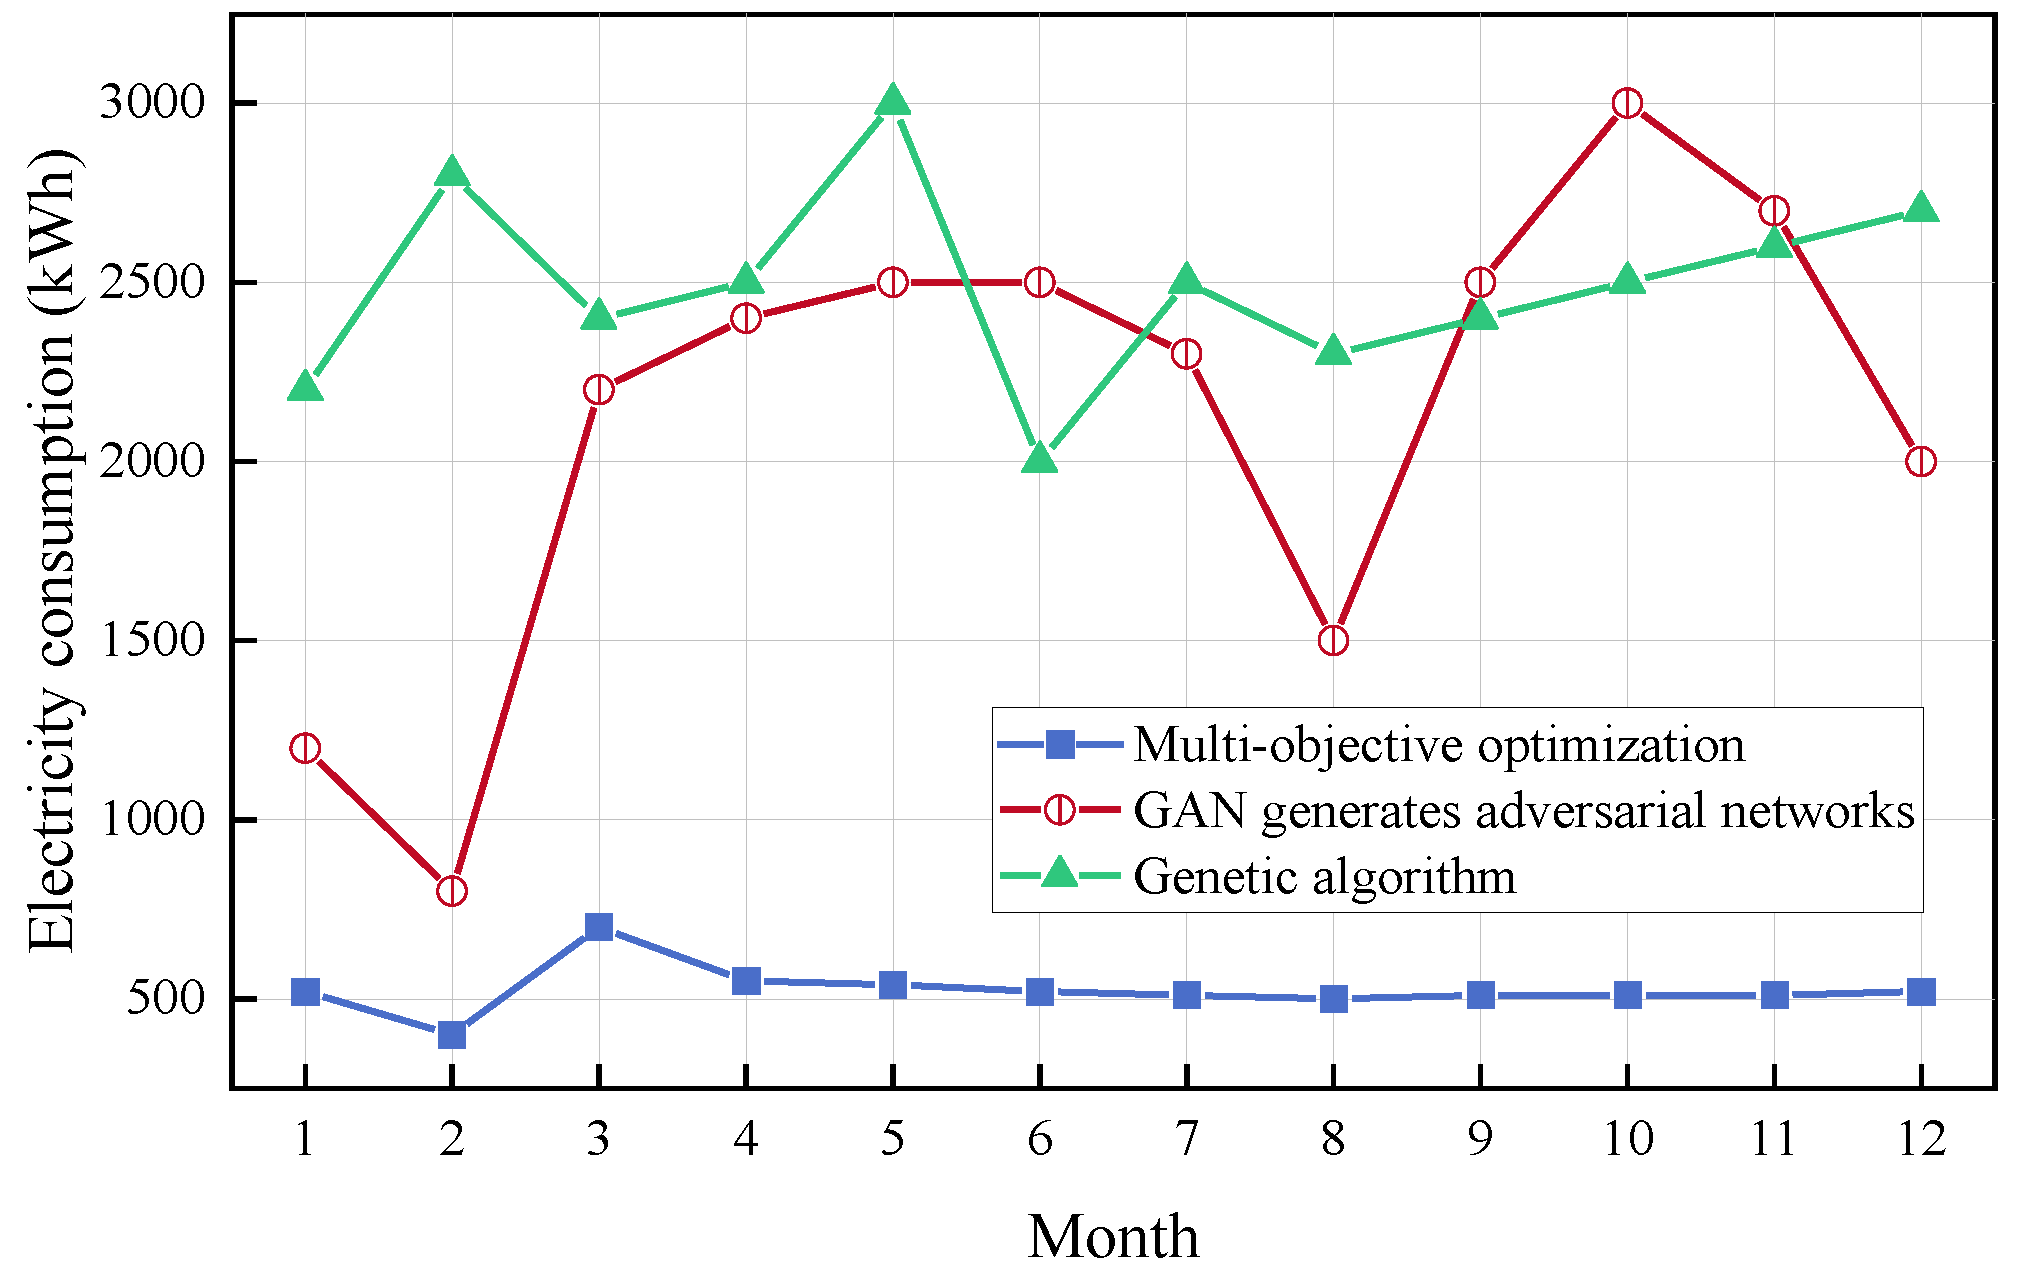
Figure 9.
Illumination Distribution at Different Positions after Optimization.
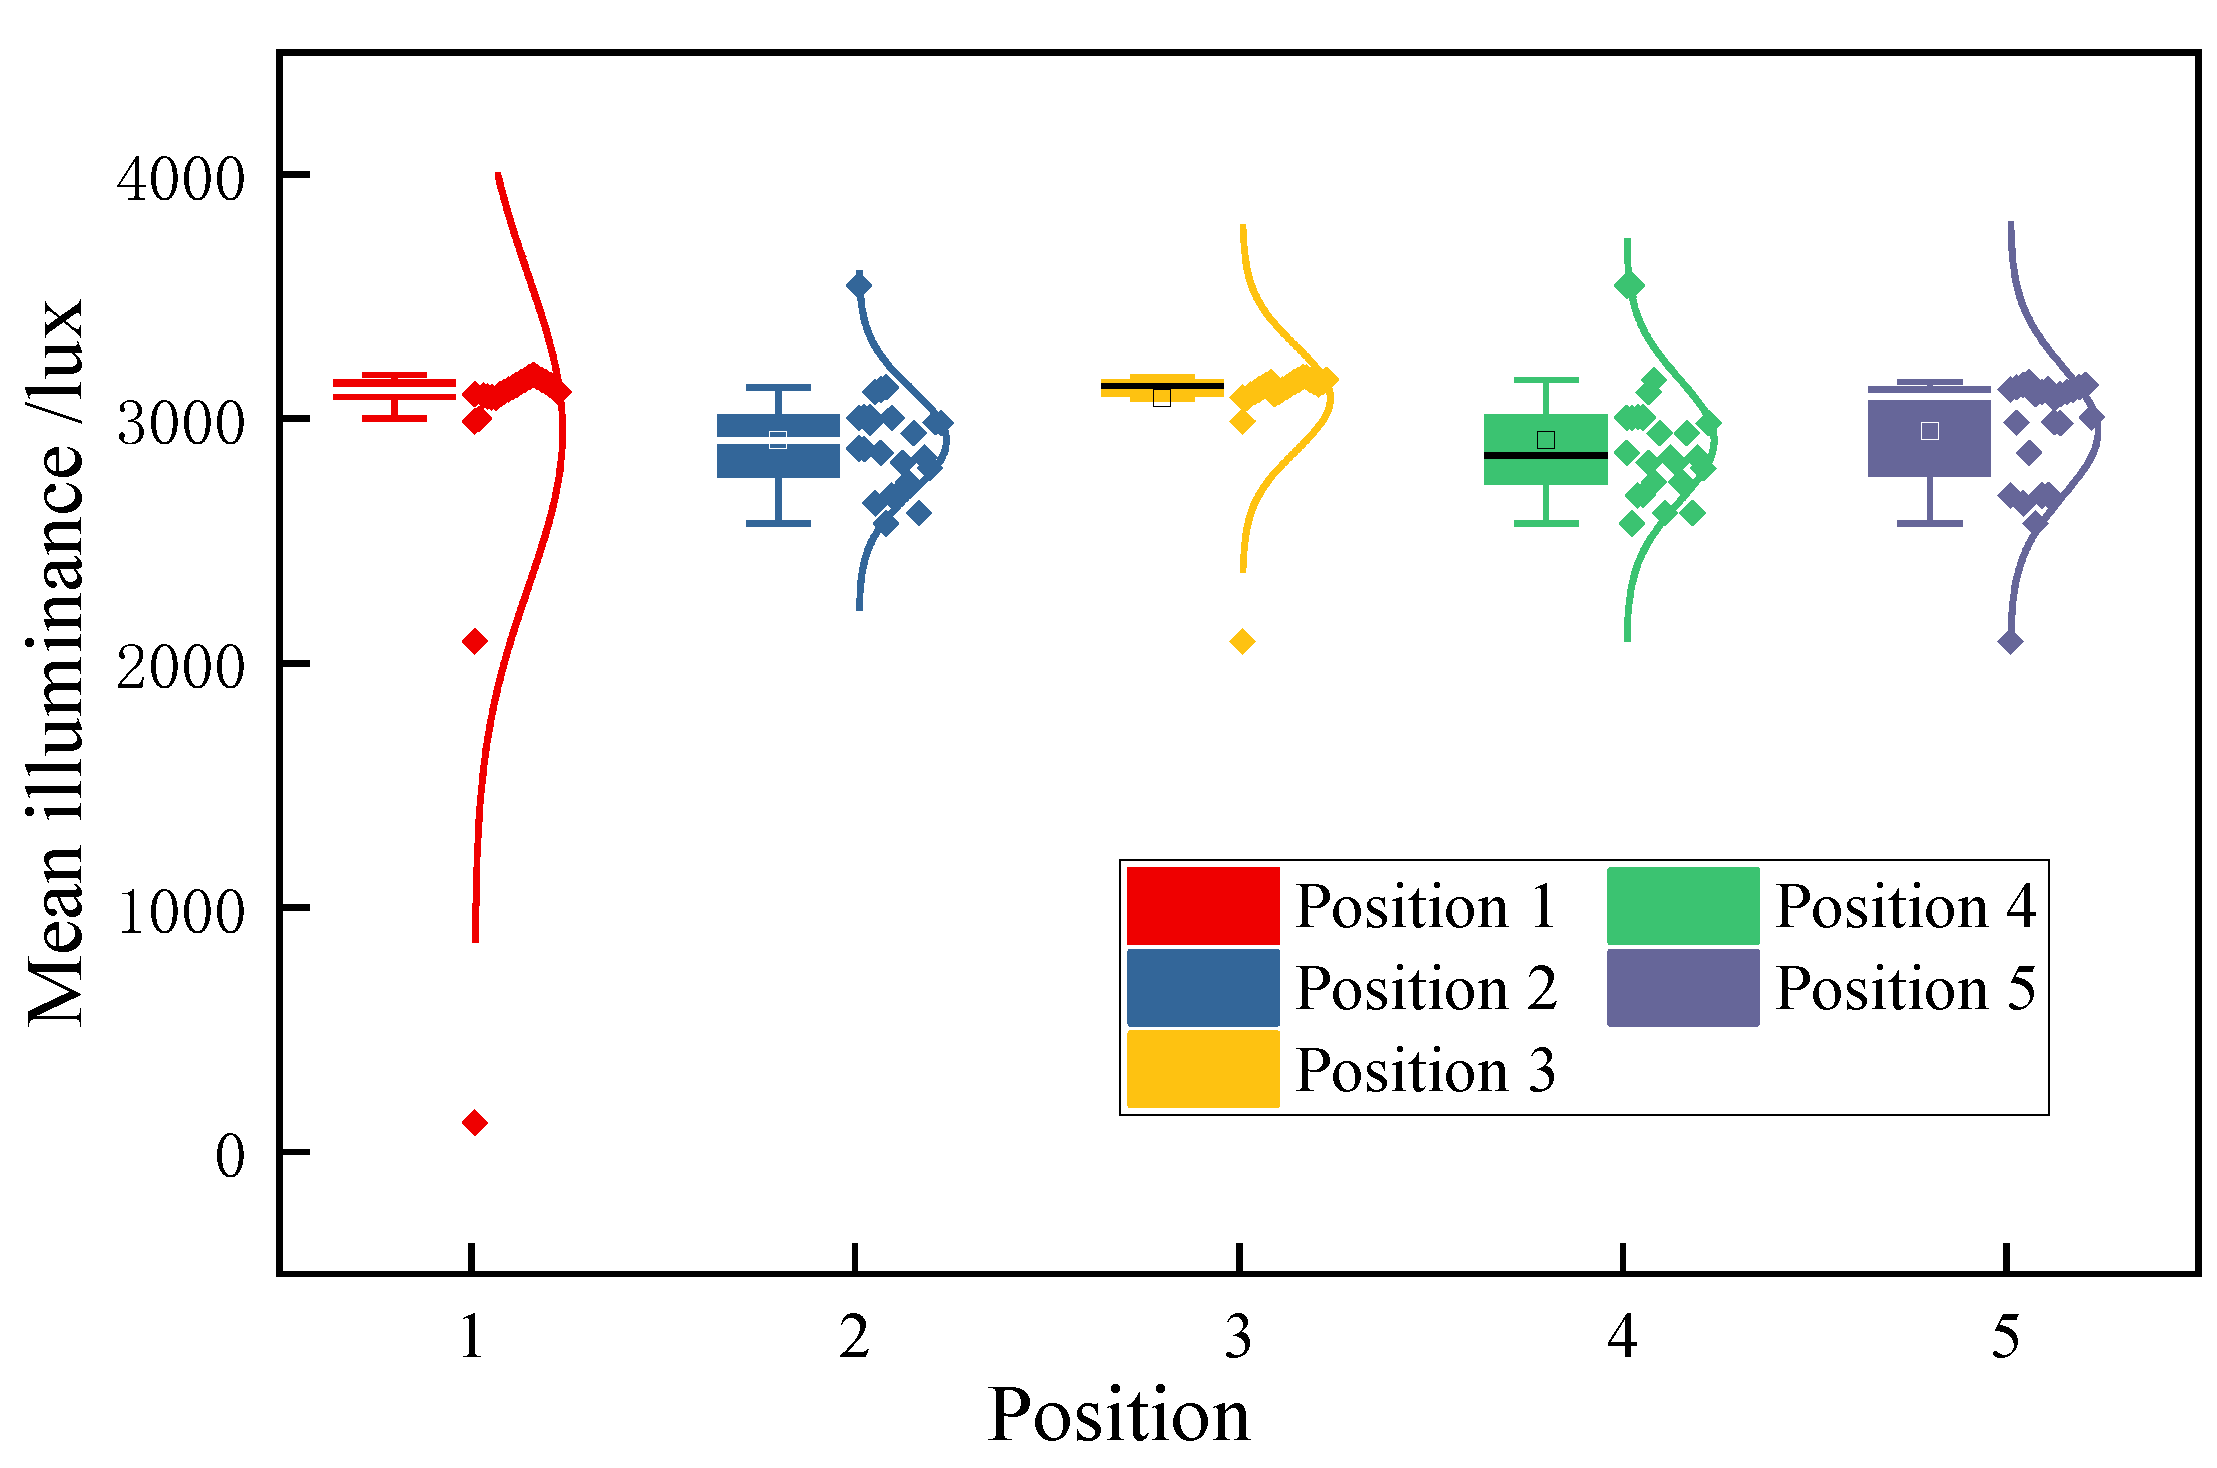
Table 1.
The Original Window Type of the Library.
| Window Number | Size (b×h)/mm×mm | Quantity/piece | Pattern |
| Window 1 | 400×2240 | 6 | 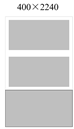 |
| Window 2 | 2300×2830 | 10 |  |
| Window 3 | 1400×1510 | 3 |  |
| Window 4 | 1950×1850 | 10 |  |
Table 2.
The Original Window Type After Renovation.
| Window Number | Size (b×h)/mm×mm | Quantity/piece | Pattern |
| Window 1 | 1200×2240 | 6 | 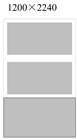 |
| Window 2 | 2600×2830 | 10 |  |
| Window 3 | 1400×1510 | 3 | 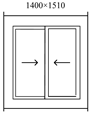 |
| Window 4 | 1950×1850 | 10 | 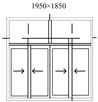 |
Disclaimer/Publisher’s Note: The statements, opinions and data contained in all publications are solely those of the individual author(s) and contributor(s) and not of MDPI and/or the editor(s). MDPI and/or the editor(s) disclaim responsibility for any injury to people or property resulting from any ideas, methods, instructions or products referred to in the content. |
© 2025 by the authors. Licensee MDPI, Basel, Switzerland. This article is an open access article distributed under the terms and conditions of the Creative Commons Attribution (CC BY) license (http://creativecommons.org/licenses/by/4.0/).
Copyright: This open access article is published under a Creative Commons CC BY 4.0 license, which permit the free download, distribution, and reuse, provided that the author and preprint are cited in any reuse.


