Submitted:
19 March 2025
Posted:
20 March 2025
You are already at the latest version
Abstract
This study addresses sustainable boil-off gas (BOG) management at liquefied natural gas (LNG) terminals, offering a solution to traditional methods like flaring and venting, which pose environmental risks. It proposes using excess BOG as fuel for compressed natural gas (CNG)-powered vehicles. Through simulations, BOG recovery during LNG regasification, ship unloading, and holding modes was quantified. Recovery rates varied by LNG type: 0.39% (lean), 0.338% (medium), and 0.337% (rich) during regasification; 0.27%, 0.2%, and 0.21% of offloaded LNG mass during ship unloading; and 0.028%, 0.026%, and 0.021% of the initial LNG mass in holding mode. Lean, medium, and rich LNG supported 361, 383, and 406 hours of regasification, respectively, at 200,000 kg/hour. Tanks reached 95% capacity in approximately 15.25 hours during unloading. Heat ingress, impacted by solar radiation and pump activity, caused significant heat leaks, mitigated by additional BOG storage tanks. Excess BOG, converted via a multistage compressor, produced CNG meeting conventional standards for lean and medium LNG, though rich LNG required blending. A 200,000 m³ LNG storage tank could fuel 35 to 489 vehicles with 25 kg storage capacity per hour. This innovative approach highlights BOG’s potential as a sustainable energy source, improving LNG terminal efficiency and reducing environmental harm.
Keywords:
liquefied natural gas
; boil-off gas
; compressed natural gas
; lng receiving terminal
; natural gas vehicles
1. Introduction
Energy consumption continues to grow worldwide as a result of progressive humankind’s development. As energy needs rise, the world has evolved from burning wood, wind, waterfalls, coal, fossil fuels, solar and nuclear energy sources. Although it is big progress, energy sources are currently dominated by non-renewable sources with 80.45% nearly equal to 143,939 TWh in 2022. Thus, non-replenishable energy resources must be consumed with attention because they continually fade away. Natural gas held 22.03% of the non-renewable energy resources. From 2012 to 2022, natural gas consumption rose to 36.5% and is expected to continue to grow as it is deemed a cleaner than other fossil fuels [1]. Natural gas emits 50 to 60% less CO2 than coal [2]. In 2016, the transportation sector solely consumed 28.55% of the used energy resources [3]. While from 2010 to 2022, natural gas consumption in the transportation sector has increased by 27.3% [4] and it is expected to continually rise. This increase is associated with low cost and low greenhouse gas emission (GHG) than gasoline emitting about 15 to 20% [2]. Natural gas is mainly transported and stored in its cryogenic form, at atmospheric pressure, due to its shrinkage of less than 600 times its occupancy volume under standard conditions [5]. During cryogenic transportation and storage of natural gas, LNG boils off due to heat leakage from surroundings and generates boil-off gas (BOG) [6]. Continuous generation of BOG increases pressure inside LNG carriers, export and receiving terminals. For safety purposes, BOG is often resealed out of tanks for pressure relief [7]. At an LNG receiving terminal, generated BOG originates from heat leakage into terminal facilities, pumping, pressure drop and mixing two LNGs of different composition. The released BOG is burnt, vented and compressed to send-out pressure; then it is re-liquefied and used as LNG regasification fuel, or filled into unloaded LNG ship carriers to regulate carrier tank’s pressure and temperature [5,7]. For long distances, natural gas is most economically transported in liquid form through vessels across the whole world [8]. During the loading, transport or shipping, and unloading of the LNG, the natural gas evaporates due to the exchange of heat between LNG and the surrounding environment. The BOG is typically in the range of 0.022 to 0.05% of the LNG storage tank per day [7,9]. The flaring and venting of BOG are undesirable as it contributes to greenhouse gases emissions and environmental damage. In LNG supply chain, scholars have proposed that BOG can be recovered and used as fuel, or re-liquefied [7]. The thermodynamically based analysis study has shown that BOG flare optimal minimization at receiving terminal can be achieved in four stages BOG reliquefication system though the capital cost and operating cost remained higher beyond equilibrium line because of use of many compressors [10]. For proper implementation of the model made by [9], boil-off rate (BOR) can be reduced to 0.11% of LNG weight inside the tank per day which is 26.7% lower than the rate proposed by International Marine Organization (IMO). Although natural gas short live into the atmosphere after emission, its warming potential is 27 to 30 times per 100 years [11] and 84 times per 20 years [12] higher than CO2 because it is predominantly consisting of methane. Gas flaring has been reduced by 3% in 2022 to meet the global ambition of Zero Routine Flaring by 2030. However, in countries such as Algeria, Mozambique, Venezuela, Republic of Congo, India and Russia gas flaring has shown an increase [12]. BOG is one of the main issues facing LNG receiving terminals, as well as being harmful to the environment, it is also a waste of non-renewable energy resources. In a single tank, the BOG released is usually in the range of 0.02 to 0.05% of an LNG tank volume per day [13]. If BOG is recovered from a single LNG tank, approximately 0.2 billion m3 of natural gas can be saved from waste and harming the environment [14]. To tackle environmental concerns, resource wastage, and transportation fuel scarcity, BOG can be recovered and converted into natural gas fuel, i.e. compressed natural gas (CNG). According to [15], CNG fuel production is feasible from a natural gas resource capable of supplying 1 to 7 billion m3 per year which is suitable for BOG generally produced at LNG receiving terminal and supplied to consumers not far from 2000 km. suggested that natural gas composition should be containing methane with minimum 90%, Ethane of 4% as the maximum, propane not more than 1.7%, butane and heavier not more than 0.7%, carbon dioxide and nitrogen not more than 3%, hydrogen less or equal to 0.1%, carbon monoxide less or equal to 0.1% and oxygen not more than 0.5%. According to [16], the typical CNG combustive properties are MON of 120, molar mass of 16.04, carbon weight fraction of 75% mass, stoichiometric air/fuel ratio of 16.79 and mixture density of 1.24, lower heating value of 47.377 MJ/kg and stoichiometric lower heating value of 2.77 MJ/kg, flammability range between 5 and 15, and spontaneous ignition temperature of 6450C. According to [17], physicochemical CNG properties value for octane number range from 120 to 130, molar mass of 17.3, stoichiometric air/fuel mass of 17.2 and mixture density of 1.25, lower heating value of 47.5 MJ/kg and stoichiometric lower heating value of 2.62 MJ/kg, energy of combustion of 24.6 MJ/m3, flammability in air range from 4.3 to 15.2% vol. in air, speed of propagation of 0.41m/s, adiabatic flame temperature of 18900C, auto-ignition temperature of 5400C, and Wobbe index between 51 and 58 MJ/m3. The aim of this study is to recover excess the BOG released from the storage tank and use it as CNG fuel for vehicles operating around the LNG receiving terminal within a radius of 2000 km. The planet is facing severe climate change while it fears the nearing end of fossil resources; therefore, proper use of resources and sustainable innovative energy solutions are of vital concerns. BOG flaring and vent have been contributing adverse greenhouse gases through the result of CO2 and unburned methane. CO2 emission pollutes the atmosphere and BOG flaring is one of its sources. Methane is the major component of BOG. Despite the various uses of methane gas, its emission has a higher warming potential than CO2 though it short-lived [11,12,18]. Although CNG is less expensive than petrol and diesel, there is a problem of its shortage due to many factors including increase of consumers for it is gaining preference in many countries such as Pakistan, the third largest CNG consumer. Among the probable and sustainable ways to solve it, new gas resources are a preferred option [19]. It is of crucial importance to find a way to fully recover BOG and use it efficiently to sustainably and effectively use responsibly the natural gas resources. CNG fuel for natural gas vehicles (NGV) is believed to be one of the viable options for adding value to BOG. Therefore, the study attempts to unlock the potential use of BOG as CNG fuel while minimizing GHG emission and environmental damage. The main objective of this study is to evaluate and recover the excess BOG generated from LNG receiving terminal into CNG fuel for vehicles. To this end, this study evaluates the amount of BOG excess generated from each source at the LNG receiving terminal, the amount of BOG recoverable and is converted into CNG fuel. Finally, the energy consumed in the process of converting BOG into CNG fuel is evaluated, whether the conversion of BOG into CNG is technically feasible and the produced CNG fuel on specification. To this end, we aim to:
- develop a dynamic process model of LNG receiving terminal and BOG conversion into CNG;
- perform heat ingress analysis at LNG receiving terminal tank; and
- evaluate recoverable BOG, its management at the receiving terminal and analyse the resulted CNG fuel specifications.
2. Materials and Methods
2.1. Materials
2.1.1. Simulator
A numerical simulation model has been made and used to simulate the receiving terminal and BOG management with the inserted conditions and assumptions.
In this study, modelling and simulation focused on receiving terminal operations mainly for BOG generation and its conversion to CNG fuel as for efficient use of natural gas resources. The numerical simulator employed was Aspen HYSYS V11. The heat leakage in pipelines was evaluated using Begges and Brill (1979) correlation embedded in the simulator. Aspen HYSYS is a widely used simulator to simulate chemical processes from unit operations to full plant scale. It provides an opportunity to do chemical engineering calculations by employing mass and energy balance, vapour-liquid equilibrium, mass and heat transfer, chemical kinetics, fractionation, as well as pressure drops [20].
2.1.2. Equation of State
To model and simulate the LNG receiving terminal, Peng-Robinson cubic equation of state (PR-EOS) embedded in the simulator was used as a thermodynamic fluid package property. PR-EOS is among the most accurate and tuned better to liquid densities [21]. It can handle fluids properties calculations during production, transportation and processing of hydrocarbons with associated mixture. PR-EOS incurs good vapour pressure, molar volume, volumetric behaviour, upper retrograde regions, upper dew points, vapor-liquid equilibrium, critical properties, water content, and hydrates predictions [22]. Therefore, PR-EOS was selected for its suitability to the model.
2.1.3. Operational Conditions
This section is devoted to presenting the initial operating conditions and characteristics of the input data employed in this study. This includes LNG composition, weather conditions, and receiving terminal operational modes.
2.1.3.1. LNG Composition
LNG composition varies from one natural gas source to another, and it is hard to depict the constant composition for reference. The composition of LNGs used in this work is given in Table 1 and was obtained from [23].
The LNG composition and storage temperature in Table 1 above were used as the initial storage at the receiving terminal and as the unloaded LNG from ship cargo to the LNG receiving terminal storage tank.
2.1.3.2. Weather Conditions
To predict BOG generation, it is necessary to forecast the weather conditions at the LNG receiving terminal because these influence heat ingress into LNG pipelines and storage tank. Weather conditions which influence heat leakage are mainly ambient temperature and pressure, solar radiation, and soil temperature. In this study, the ambient pressure effects were neglected and the soil temperature assumed constant. The ambient temperature and solar radiations used were depicted from real data of Maputo weather conditions from 26th may to 13th June 2024 from [22] and solar radiation from [23], respectively. The depicted period is a transition period from the rainy season between October and April to dry season between June and September [24].
The mean annual soil temperature globally is ranging from -0.7 to 3.6°C depending on air temperature. Maputo annual soil temperature ranges from 2 to 8°C and vary from 4 to 6°C in the depicted months of May and June [25]. Therefore, a constant soil temperature of 5°C were used in this study.
According to Gomes et al. [24], the mean wind speed at 100m radius in Maputo varies from 5 to 6.4 m/s. Mozambique mean wind speed can be found in annexes. For the heat transfer calculations of the pipelines, an average wind speed of 5 m/s at the receiving terminal was assumed. This is because the pipes are close to the ground and face wind obstacles.
2.1.3.3. Operation Modes
The designed receiving terminal operation has been three repeatable operation modes: LNG regasification, ships unloading, and holding mode. Each mode has been studied independently but starting with the last parameters of the previous mode. The study has started with LNG regasification mode, followed by ships unloading, and ended up with holding mode. For each LNG compositional type depicted, all the operation modes were simulated with each mode occurring independently after the end of another.
2.1.3.3.1. LNG Regasification Mode
During this mode, the LNG receiving terminal was only subjected to the regasification of the stored LNG. The operations considered in this mode are the LNG regasification, BOG recovery and conversion into CNG. The heat leakage was solely subjected to the LNG storage tank through its roof, wall, and bottom. A schematic of the LNG regasification flowchart is presented in Figure 1.
2.1.3.3.2. Ships Unloading Mode
Ships unloading operation mode was solely the LNG unloading from ships via unloading arms and rundown lines and storing to the storage tank. During this mode, running operations are LNG ships unloading, LNG storing, BOG recovery, BOG return to the ship to maintain the tanker pressure and conversion into CNG. The heat leakage was subjected to unloading ship pumps, pipelines, and storage tank. A schematic of the Ships unloading mode flowchart is presented in Figure 2.
2.1.3.3.3. LNG Holding Mode
During LNG holding mode, LNG was kept stationary stored inside the storage tank for a period of 24 hours. BOG recovery and conversion into CNG were solely operating. The heat ingress considered was into the LNG storage tank. A schematic of the LNG holding mode flowchart is presented in Figure 3.
2.1.4. Designed LNG Receiving Terminal
The detailed aspects of the LNG receiving terminal were ships capacity at the jetty, unloading arms, pipelines, storage tank, and terminal vaporised LNG send-out capacity based on existing LNG receiving terminals.
2.1.4.1. Ship
LNG receiving terminals are designed for specific range of ship carriers they can accommodate based on capacity. This study suggested ship capacity with its pumping capacity and detailed below in this section. However, the ship carrier was assumed to supply LNG of constant composition during unloading hence heat ingress was neglected.
2.1.4.1.1. Ship Capacity
Currently, the LNG ship capacity varies from 1,000m3 to approximately 260,000m3 with a single to four tanks per ship base one their capacity [12]. The ship with 150,000m3 and 4 tanks capacity has been used in this work. It was designed to have a height of 32m, and the fabric and insulation specification given in Table 2.
2.1.4.1.2. Ship Pumps
Lembrechts et al. suggested that LNG cargo pumps’ capacity range from 1,350 to 2,000 m3/h with 150 to 240 m head [25]. However, HYUNDAI-JC CARTER-SNECMA LNG marine pump can deliver an LNG at 1,400 to 2,000 m3/h flowrate with 135 to 190 m range of head rise at different motor output power [26]. Eight ship unloading pumps have been used in the study with two pumps in each ship tank. For all LNG compositional types simulated, each pump was assigned 1,400 m3/h capacity with 138 m head and efficiency of 0.75.
2.1.4.2. Rundown Lines
LNG is transferred from unloading arms to the storage tank through pipeline. The length of pipeline from the jetty to the storage tank, either subsea or surface settled depends on the distance from unloading arms to the storage tank and length can range from 100m to tens of kilometres [27,28]. Depending on LNG receiving terminal, the number of pipelines, material fabric, the dimension, length, and pipe insulation vary as the receiving terminal is designed. Mainly pipe dimension, length and insulation determine how much BOG can be generated for a certain environmental condition. Three pipelines used in this work are made of mild steel with 30 and 30.1 inches inner and outer diameter respectively, insulated by urethane foam of 0.025 m thickness and 0.018 W/m.K thermal conductivity. Two pipelines were used as unloading lines for LNG and the remaining one as a BOG return loading to the ship during LNG unloading with 2 km of length. The effect of solar radiation in pipeline heat ingress was neglected, heat ingress was sourced from ambient temperature changes at a constant air speed of 5 m/s.
2.1.4.3. Storage Tank
An above-ground full containment storage tank with capacity of 200,000 m3 was used in simulation; it was designed based on existing receiving terminal storage tanks. The referred tank was designed to have 40 m height and 79.79 m diameter with all connections at the roof. The LNG storage tank used material fabric, thermal conductivity, thickness, and absorptivity are detailed in Table 3 below. The tank was simulated maintaining the cryogenic temperature and pressure not exceeding 117 kPa for safety concern.
2.1.4.4. Send-out Capacity
According to Lu et al., the designed Samcheok LNG receiving terminal of 12 tanks of 200,000 m3 capacity each, the gasification capacity was designed to be 2340 ton/h [27]. The study used a single tank of the same LNG storage tank capacity as Samcheok LNG receiving terminal and designed to vaporise 200,000 kg of LNG per hour and send-out into gas distribution lines.
2.2. Methodology
This section presents the research methodology used to evaluate heat ingress into storage tank, pipes and pumps to manage BOG recovered, safety and control measure taken, and LNG, BOG and CNG properties.
2.2.1. Heat Ingress
Heat ingress in storage tank, pipes and pumps was calculated via the simulator and manually before being inserted into simulator. Simulator were used for heat ingress into pumps and pipes while for LNG storage tank, it was manually calculated hourly.
2.2.1.1. Heat Ingress into LNG Storage Tank
Heat leakage inside the storage tank ingresses through the tank roof, wall, and bottom. Heat leakage in each section of the tank was analysed independently to get the actual heat that leaks through the tank insulation due to climate conditions changing hourly. The sum of the heat ingress in all three sections of the tank is given by equation (1). This sum was used to find the actual BOG generation per hour in all LNG receiving terminal operation modes.
The thermal resistance of each material in all three sections of the tank was calculated using equation (2):
The BOG layer inside the tank above the LNG implies thermal resistance, while the heat that ingresses from through the roof and wall in this layer is directed towards the stored LNG. Therefore, thermal resistance was also calculated.
To calculate the BOG thermal resistance, a measure of how quickly heat spreads into the BOG or BOG thermal diffusivity was calculated using equation (3).
The BOG thermal resistance was calculated by using the following equation (4).
Whereby, the BOG convective heat transfer coefficient (h) was calculated by using the following equation (5).
The characteristic length of the tank and BOG Nusselt number were calculated using equations (6) and (7).
The dimensionless Prandtl number (Pr) and Grashof number (Gr) were calculated using equations (8) and (9).
2.2.1.1.1. Heat Input Through the Roof
The calculations of heat ingress through the roof include the tank material, ambient air and the topmost BOG layer thermal resistance to get the actual heat leaked. The thermal resistance of the tank roof was given by equation (10).
In equation (10), R is the thermal resistance for the respective material and medium where the heat passed through to reach LNG.
As the total thermal resistance at roof section was available, the heat transfer coefficient was calculated using equation (11).
Then, the heat ingress through the roof were calculated using the equation (12):
Where Q ambient temperature and Q solar radiation are heat ingress from ambient temperature and solar radiation through the roof and BOG layer respectively. These heats have been calculated by using equation (13) and (14).
Where the T tank is the temperature in tank.
Whereby the roof absorptivity was calculated by using the following equation (15).
2.2.1.1.2. Heat Input Through the Wall
The calculations of the heat ingress through the wall included the tank material, and ambient air to get the actual heat leaked. The thermal resistance of the tank wall was given by equation (16).
As the total thermal resistance at the wall section was available, the heat transfer coefficient was calculated following equation (17).
Then, the heat ingress through the wall was calculated by using the equation (18) below.
Where Q ambient temperature and Q solar radiation are heat ingress from ambient temperature and solar radiation through the wall layers. These heats have been calculated by using the following equation (19) and (20).
Whereby the wall absorptivity was calculated by using the following equation (21).
2.2.1.1.3. Heat Input Through the Bottom
The heat ingress through the bottom was calculated including the tank bottom materials to get the actual heat leaked using equation (22).
As the total thermal resistance at the bottom section was available, the heat transfer coefficient was calculated as well through the following equation (23).
Then, the heat ingress through the bottom was calculated by using the equation (24) below.
Where the T bottom is the temperature at the bottom of the tank.
2.2.1.2. Heat Ingress into Pipes
During unloading and recirculation of LNG to cool down the unloading arm and pipeline, ambient heat ingress into pipeline. In this study, our discussions did not include calculations of the heat ingress during recirculation for it can be also done by primary unloading ship BOG to cool rundown lines and unloading arms. Also, the heat ingress from solar radiation has been neglected for it is not significant due to short duration of the unloading and the continuous LNG movement while it is being unloaded. To evaluate properly for the heat leakage into pipelines, the pipeline fabric and insulation with their thermal conductivity and dimension, hourly ambient temperature, settling medium, and wind speed detailed in the Rundown lines subsection were insulted in simulator to calculate actual heat ingress.
2.2.1.3. Heat Ingress into Pumps
Ship pumps and storage tank LP pump do leak part of the pumping energy into LNG during unloading and recirculation of LNG into unloading arms and pipelines. Since LNG recirculation has been omitted in the study, only the heat transferred into LNG by ship pumps during LNG unloading have been calculated and inserted into the simulator to provide BOG generation. The heat ingress from pumps were calculated by using equation (25) for all LNGs.
Where the Q pump is the heat transferred from the pump, is the pump capacity, g is the gravity acceleration, H is the pump head, and η is the pump efficiency.
The pump capacity has been given by the following equation (26).
The gravity acceleration was 9.81 m/s, density was calculated into simulator, and other coefficient and pump capacity was provided in designed receiving terminal section.
To maintain the pressure and temperature in ship tanks, the volume of the LNG being unloaded must always be equal to BOG being returned from LNG storage tank. This BOG is excluded from the BOG recovered because it must be returned to the ship.
2.2.2. BOG Management
BOG management is different as the operational modes are. During LNG regasification mode, the BOG generated inside the tank was continually replacing the LNG sent out for regasification. In case of BOG excess generation due to large heat ingress, the BOG was kept inside the tank until the tank pressure reached 117 kPa and released out of the tank to maintain safety of the tank.
During ships unloading mode, the BOG generated in pumping and piping system, and storage tank were partially kept in the storage tank and partially returned to the ship to maintain temperature and pressure at the ship. In case of BOG excess generation due to large heat ingress, the BOG was kept inside the tank until the tank pressure reached 117 kPa and released out of the tank to maintain safety of the tank.
During LNG holding mode, BOG generated inside the tank was kept inside the storage tank until the pressure inside the tank built up to 117 kPa. Then, the BOG was progressively released out of the storage tank to avoid overpressure for safety of the facilities, people and environment.
2.2.2.1. BOG Recovery
BOG excess released out of the storage tanks in each mode for all LNG were kept in another storage tank. BOG excess generated was continually recovered into the storage tank before converting it into CNG to avoid the compressor running with an empty pump chamber throughput. Although BOG is generated continually but BOG excess release is not a continuous process. Thereby, the compressor was safe from sudden stopping and damage.
2.2.2.2. BOG Compression into CNG
The recovered BOG stored into the tank was continually compressed into CNG. The process was done using multistage compressor with three stages of compressors and coolers. The compressors operated in reciprocating operating mode with 6.055 compression ratio for each compressor. The cooler dynamically changed the cooling rate to achieve the ambient temperature of 25°C.
2.2.3. Safety and Control
This study also covered the safety and control of the process. Safety and control of the process differ from one operation mode to another.
During LNG regasification mode, a pressure controller was used in storage tank to dynamically regulate the pressure inside the storage tank to ensure its safety. The pressure was regulated to a set point value of 117 kPa by opening and closing a valve (VLV-B) to release BOG excess out to the BOG storage tank (BOG_storage) and avoiding tank pressure from getting lower than one atmospheric pressure.
During ships unloading mode, three controllers were employed to ensure the safety of the process. A pressure controller was used to keep the ship pressure constant by dynamically opening and closing valve (VLV-100) to return BOG into ship to replace the unloading LNG which avoids creation of vacuum, regulate temperature and pressure in inside the ship. This was done to maintain pressure and temperature inside the ship. Another pressure controller to control pressure inside the LNG storage tank was also employed. This pressure controller served to open and close dynamically the valve (VLV-B) to release or hold BOG inside the storage tank to avoid tank pressure from being over 117 kPa or below 1 atmospheric pressure. The released BOG was partially returned to the ship and stored into BOG storage tank. In the study, a level controller has been used to avoid tank overfilling above 95% of the storage tank capacity by closing the valve (VLV-A) when the tank is at the 95% of its capacity.
During LNG holding mode, a pressure controller ensured safety pressure inside the tank by dynamically opening and closing the valve (VLV-B) to release or hold BOG inside the tank. This was done to avoid the tank pressure from being out of the range between 1 atmospheric pressure and 117 kPa.
2.2.4. LNG, BOG and CNG Properties
The CNG properties were analysed in this study. CNG composition and properties were taken from simulation result. The stoichiometric air to fuel ratio in mass per mass and volume per volume, and specific gravity relative to air were analysed by using CAT® Methane number calculator, methane number by Wärtsilä methane number calculator through inserting resulted CNG composition. Wobbe index, and octane number were calculated by using the following equation (27) and (28).
Although the real MON can be provided by the experiment, equation (28) was used to provide a rough estimation of MON in this work.
3. Results and Discussions
3.1. Recoverable BOG
BOG continuously forms because of heat ingress through piping, pumping and storage tank. BOG formation is a way the LNG cools itself by evaporating a small LNG portion. However, not all BOG formed can be retrieved from the storage tank. Although the BOG forms continuously due to the continual heat ingress, the storage tank at the LNG receiving terminal can hold BOG until a set-point pressure is reached inside the tank. Above which, portion of the BOG namely as BOG excess is vented to prevent tank overpressure, which can cause accidents. In this work, the storage tank pressure was set to 117 kPa. Although the volume of the LNG was the same initially and finally in all modes for lean, medium and rich LNG, the mass was totally different as the LNG are. The richer the LNG is, the heavier it is and the leaner it is, the lighter it is.
During LNG pumping and piping from the ship to the storage tank, the portion of the released BOG is sent back to the ship to maintain pressure and temperature in the ship tank during storage tank filling mode and the remaining portion is recovered. Unlike, in the LNG regasification and holding modes, the BOG released is fully recovered.
During LNG regasification mode, the initial volume of the LNG in the storage tank was simulated at 95% of the total storage tank volume for all LNGs, i.e. 190,000 m3. The LNG gasification mode was simulated to evaporate 200,000 kg of LNG per hour until the LNG volume in storage tank reaches 10% of storage tank volume. Regasification process was simulated to start at the same time for all LNGs at 00:00’ AM, 26th June 2024 and lasted differently. The LNG regasification mode lasted for 15 days and 1 hour, 15 days and 22 hours, and 16 days and 21 hours for lean, medium and rich, respectively. The differences are attributed to the heaviness of the LNG; the heavier the LNG, the longer it will last during regasification. The BOG recovered from the storage tank is 315,913.51 kg, 290,373.34 kg, and 307,147.70 kg from the lean, medium and rich LNG storage tank, respectively. Lean LNG evaporates more preferentially than the rest, since it is made up of large quantity of lighter components. Rich LNG releases more BOG because it lasts longer, thus making it prone to heat ingress; in addition, it contains large amounts of nitrogen which is very light and more prone to evaporate than for medium LNG.
During LNG storage tank loading mode, the initial volume of the LNG was simulated to occupy 10% of the total storage tank volume for all LNGs which is equivalent to 20,000 m3. In this mode, the loading capacity simulated is 1400 m3/h of LNG per hour for each of the eight pumps submerged into LNG cargo ship and through two run-down lines with four pumps feeding each until the LNG volume in storage tank reached 95% of storage tank volume.
Storage tank loading or ships unloading was simulated to start after reaching 10% of the LNG storage tank volume; this simulation lasted for 15.25 hours and for all LNGs but with small volume of LNG loaded in the last hour to fill up to 95% the storage tank volume. LNG storage tank loading mode started at 1:00’ AM on 10th June, 11:00’ PM on 10th June, and 11:00’ PM on 11th June 2024 for lean, medium and rich, respectively. Not all of the pumped LNG reached the storage tank in liquid state due to heat ingress in the pumps and pipes. During LNG pumping and piping into storage tank from ships, about 168,628.30 kg, 140,249.76 kg, and 159,199.1 kg of BOG was formed from lean, medium and rich LNG. The other part of BOG is produced from heat ingress inside the storage tank during pumping and loading of LNG. The BOG recoverable from the storage tank during pumping and piping, after diverting portion of it to stabilize temperature and pressure inside ships’ tanks, was 186,482.32 kg, 156,570.73 kg, and 173,210.30 kg, respectively, for the lean, medium and rich LNG. The lean LNG produced more BOG excess than other LNGs because it is lighter and constitutes of large quantity of lighter components. Rich LNG produced more BOG than medium LNG, despite being heavier; it contains more nitrogen than medium LNG and nitrogen is lighter and tends to evaporate faster than hydrocarbon components of LNG.
During LNG storage tank holding mode, the initial volume of the LNG in the storage tank was simulated at 95% of the total storage tank volume for all LNGs. The LNG storage tank holding mode was simulated for a storage tank at receiving terminal to hold LNG without loading and unloading for one day. The holding mode was simulated to after the end of the storage tank loading mode, in which the storage tank was filled to approximately 95% of its total volume for all LNGs. It started at 05:00’ PM of 10th June, 03:00’ PM of 11th June, and 02:00’ PM of 12th June 2024 for lean, medium and rich LNG respectively and lasted for 24 hours. The recoverable BOG from the storage tank during the holding mode was 22,462.53 kg, 22,370.38 kg and 19,279.79 kg from lean, medium and rich LNG storage tank respectively. As expected, lean LNG evaporated more than the others because it contains large quantities of lighter components, followed by the medium LNG, and rich LNG is the least to produce BOG because it is heavier than others.
Therefore, during LNG ships unloading mode, the LNG pumping and piping generated 9.4, 8.6, and 11.4 times the BOG generated in the lean, medium and rich LNG storage tank. These results are in agreement with Backhaus and K. Friedrichs [28]for different LNG compositions, where BOG generation during LNG ships unloading mode is as much as 8 to 10 or more than during LNG holding mode.
3.2. BOG Conversion into CNG
In this work, the main objective of recovering excess BOG is to assess its conversion efficiency into CNG. Both the literature and industrial operations indicate that CNG is produced at 250 bars at ambient temperature. Each LNG type was simulated independently throughout all modes, i.e. LNG regasification, ships unloading, and LNG holding mode.
The recovered BOG was first sent to the storage tank before being compressed by multistage compressors. The tank served as intermediate BOG storage because BOG excess is not always released. This prevents compressors from operating without BOG and as a knockout drum of liquids that may be released with BOG. Three successive compressors and coolers have been used. The compression ratio for each compressor was set to be 6.055 and the cooling was independent for each LNG towards the final resulted CNG at ambient temperature (i.e., ideally assumed to be 25°C).
In each of the three stages, the recovered excess BOG from lean, medium, and rich LNG during LNG regasification, ships unloading mode and holding mode were compressed and cooled independently. The CNG pressure was increased by 8.5 kPa to compensate for the pressure loss that can occur when loading the CNG into the storage tanks. Table 4 shows the energy consumed to convert BOG into CNG, the pressure and temperature produced for each case.
The simulation results in Table 5 show that for different modes, different amount of BOG can be recovered for each type of LNG. The energy consumption differs although the resulted CNG is at the same pressure and temperature. The energy used for BOG conversion to CNG via multistage compressor is summarised in Table 5. The energy consumption increased with an increase in number of stages of compression and cooling. This is because the gas needs to be pressurised higher and be cooled as it heats up due to compression. Excess BOG from lean LNG consumes a lot more energy than the others although it is rich in lighter components but has large quantity.
Over the simulated lean, medium, and rich LNG modes, the BOG conversion performance given in Table 5 reveals that the ships unloading mode for lean and rich LNG consumed a lot of energy per CNG mass produced, while for medium LNG, it was BOG conversion during the LNG holding mode. BOG conversion from lean LNG ships unloading mode has consumed a lot of energy per CNG mass produced. This is due to LNG composition, mainly the presence of nitrogen and heavier hydrocarbons content which added more compression and cooling energy requirement.
Moreover, Table 5 shows that the ships unloading mode produced large quantity of CNG per hour, especially for lean LNG. This can be attributed to the formation of large volumes of excess BOG per hour during ships unloading, especially for lean LNG from ship pumps, rundown lines and storage pumps. While LNG storage tank is the only point where excess BOG forms for other modes. The lean LNG constitutes of large quantities of lighter components, hence the large BOG excess is formed. Ships unloading mode for all LNGs generated less BOG excess as well as CNG for large BOG quantity generated do not get released out of the tank but rather continually replaced the withdrawn LNG from ship tanks.
For a single storage tank of 200,000 m3, at least 35 CNG-powered vehicles of 25 kilograms storage capacity can be supplied per hour during LNG holding mode and up to 489 vehicles per hour during ships unloading mode can be fed based on CNG produced hourly from Table 5.
3.3. CNG Properties
The resulting CNG fuel composition and properties from each LNG type in each simulated mode are summarized in Table 6 and Table 7. CNG properties include Wobbe number, methane number (i.e., using GasCalc), and rough estimation of MON based on empirical formulas.
The produced CNG in each LNG differs from one mode to the other. CNG produced from lean LNG vaporised BOG had a high methane content, low heavier hydrocarbons and nitrogen content as its LNG source is. The rich LNG vaporised BOG is lean in methane and rich in heavier hydrocarbon, and nitrogen content while CNG from BOG of medium LNG displayed medium value of the methane, heavier hydrocarbons and nitrogen. The ships unloading mode produced CNG rich in hydrocarbons mainly methane and low in nitrogen content among other modes for all LNG sources. This was due to the BOG contribution of fresh LNG being from unloaded ships. Typical CNG is made up of methane of 85-95%, ethane of 1-10%, propane of 0-2%, traces of heavier hydrocarbon, and nitrogen of 1-3%. Results of CNG shown in Table 6 show some deviation in CNG composition from lean and rich LNG’s BOG. This is due to the methane and nitrogen components. Unlike CNG composition from medium LNG’s BOG show agreement with the typical CNG composition range.
Produced CNG properties have been summarized in Table 7. The CNG produced from BOG of rich LNG is out of range due to its very low methane content (< 85%), which severely limit its performance as a fuel [29,30]. This is also due to its high content of nitrogen. Thus, the CNG produced from BOG of rich LNG cannot be an option to be used as fuel unless blended to increase its methane content. The CNG from BOG of lean and medium LNG have shown good properties compared to typical CNG properties whereby the CNG from lean LNG’s BOG is far better as a fuel with good heating value. Therefore, the CNG from lean and medium LNG’ BOG can be good fuel.
3.4. Validation
This simulation results were validated by comparing the current results with those obtained by Adom and Ji [38]. The authors used LKP and BWRS models to assess BOG generation and the methane percentage of the LNG in various LNG storage tanks with different sizes [31]. The LKP and BWRS model focused on the effect of methane percentage in LNG on the amount of BOG produced per day for various LNG storage tank sizes. For validation purposes, a 200,000 m3 the LNG storage tank size and two LNGs with different methane content (i.e. lean and medium) within the studied scope were used. However, the model showed discrepancies in the heat leakage, an out of the box methane percentage of 98.6 % was added in comparison, and only LNG holding operational mode was validated. The resulting data of 200,000m3 storage tank was extracted and plotted with the current simulation results in Figure 4 below for comparison purposes.
Both models show similar trends, and the generation of BOG is a function of methane content regardless different operating conditions. As the methane content increases, the BOG generation increases as well. Since they all have linear behaviour, the BOR estimation was calculated by using their chart slopes. The BOR obtained by using the LKP and BWRS models and from the current study was 0.029% and 0.03%, respectively for the same storage tank size.
4. Conclusions
The excess boil-off gas (BOG) generated at the LNG receiving terminal is assessed in this study. Specifically, the study evaluates the amount of excess BOG produced from various sources within the terminal, the portion of BOG that can be recovered, and its conversion into compressed natural gas (CNG) fuel. Additionally, the energy consumption involved in the BOG-to-CNG conversion process is analysed to determine its technical feasibility and whether the resulting CNG meets specification standards.
The following conclusions can be drawn from this work:
- The heat ingress depends on climate, operating conditions, LNG receiving terminal fabric material and size. The analysis has shown that large heat leakage occurs during ships unloading mode mainly from pumps and pipes rather than ambient temperature and solar radiation. Although ships unloading mode does not occur very often, this operation produces larger amounts of BOG than other operational modes with almost 10 times that of other modes. This is due to the additional heat leakage in pumps and pipes.
- The chosen BOG management used were to store excess BOG into a tank and convert it into CNG. Excess BOG was recovered fully and converted into CNG at the depicted season transition period independently. The BOG conversion studied and applied to the studied receiving terminal was found suitable for it does not flare any BOG.
- BOG conversion was studied, and a multistage compressor was used to convert BOG into CNG. Energy consumption at each stage by compressing and cooling were calculated, it was found out that energy consumption is lower during LNG regasification mode and higher during ships unloading mode.
- CNG retrieved from BOG of lean and medium LNG proved to be on specification while the CNG retrieved from BOG of rich LNG is off-specifications due to its low lower heating value. The CNG from rich LNG’s BOG may need to be blended to be used as vehicle fuel or used for other purposes rather than vehicle fuel.
Author Contributions
Conceptualization, Emmanuel.NGIRUWONSANGA; methodology, software, validation, formal analysis, investigation, resources, data curation, writing—original draft preparation, writing—review and editing, and visualization, Alberto.Bila and João.Fernando.Chidamoio; supervision.
Funding
This research received no external funding.
Data Availability Statement
Data sharing is applicable to this article
Conflicts of Interest
The authors declare no conflicts of interest.
Abbreviations
The following abbreviations are used in this manuscript:
| LNG | Liquified Natural Gas |
| BOG | Boil-Off Gas |
| CNG | Compressed Natural Gas |
| PR-EOS | Peng-Robinson cubic equation of state |
| VLV | Valve |
| IMO | International Marine Organization |
| LKP | Lee-Kesler-Plöckner |
| BWRS | Benedict-Webb-Rubin-Starling |
| GHG | Greenhouse Gas |
| NGV | Natural Gas Vehicle |
References
- R. Hannah, R. R. Hannah, R. Pablo, and R. Max, “Energy Production and Consumption,” Our World in Data, Jan. 2024.
- S. Z. S. Al Ghafri et al., “Advanced boil-off gas studies for liquefied natural gas,” Appl Therm Eng, vol. 189, May 2021. [CrossRef]
- NEED, “Forms of Energy What Is Energy?,” 2018. [Online]. Available: www.NEED.org.
- International Energy Agency, “World Energy Outlook 2023,” 2023. [Online]. Available: www.iea.org/terms.
- Đ. Dobrota, B. Lalić, and I. Komar, “Problem of Boil - off in LNG Supply Chain,” Transactions on Maritime Science, vol. 2, no. 2, pp. 91–100, Oct. 2013. [CrossRef]
- Rahmania and W., W. Purwanto, “Simulation of boil-off gas effect along LNG supply chain on quantity and quality of natural gas,” in AIP Conference Proceedings, American Institute of Physics Inc., Apr. 2020. [CrossRef]
- T. Włodek, “Analysis of boil-off rate problem in Liquefied Natural Gas (LNG) receiving terminals.,” in IOP Conference Series: Earth and Environmental Science, Institute of Physics Publishing, Jan. 2019. [CrossRef]
- M. M. Foss, “INTRODUCTION TO LNG An overview on liquefied natural gas (LNG), its properties, the LNG industry, and safety considerations,” 2012. [Online]. Available: www.beg.utexas.edu/energyecon/lng.
- Y.-M. Yang, “DEVELOPMENT OF THE WORLD’S LARGEST ABOVE-GROUND FULL CONTAINMENT LNG STORAGE TANK,” 2006.
- C. Liu, J. Zhang, Q. Xu, and J. L. Gossage, “Thermodynamic-analysis-based design and operation for boil-off gas flare minimization at LNG receiving terminals,” Ind Eng Chem Res, vol. 49, no. 16, pp. 7412–7420, Aug. 2010. [CrossRef]
- EPA, “Importance of Methane,” Global Methane Initiative. Accessed: Dec. 07, 2023. [Online]. Available: https://www.epa.gov/gmi/importance-methane.
- The World Bank, “Global Gas Flaring Tracker Report,” 2023. [Online]. Available: www.worldbank.org.
- Kaplan and, C. Yang, “Design Considerations for an LNG Receiving Terminal,” Denver: SPE International, Oct. 2003, pp. 1–9. [CrossRef]
- Y. Li and Y. Li, “Dynamic optimization of the Boil-Off Gas (BOG) fluctuations at an LNG receiving terminal,” J Nat Gas Sci Eng, vol. 30, pp. 322–330, Mar. 2016. [CrossRef]
- S. Mokhatab, J. Y. Mak, J. V. Valappil, and D. A. Wood, Handbook of Liquefied Natural Gas, 1st ed. Oxford: Gulf Professional Publishing, 2014. [Online]. Available: http://elsevier.
- M. U. Aslam, H. H. Masjuki, M. A. Kalam, H. Abdesselam, T. M. I. Mahlia, and M. A. Amalina, “An experimental investigation of CNG as an alternative fuel for a retrofitted gasoline vehicle,” Fuel, vol. 85, no. 5–6, pp. 717–724, Mar. 2006. [CrossRef]
- M. I. Khan, T. Yasmin, and A. Shakoor, “Technical overview of compressed natural gas (CNG) as a transportation fuel,” Jul. 21, 2015, Elsevier Ltd. [CrossRef]
- The World Bank, “2022 Global Gas Flaring Tracker Report,” 2022. [Online]. Available: www.worldbank.org.
- Ahmed, A. G. Chaudhry, H. Farooq, and A. Riaz, “Short Fall of Compressed Natural Gas (CNG) and Issues Of Affected Community; An Anthropological Perspective,” Sci.Int(Lahore), vol. 25, no. 3, pp. 623–626, 2013.
- S. Z. Naji, A. A. Abd, and A. S. Hashim, “Tracking boil off gas generation into liquefied natural gas supply chain using HYSYS simulator,” in IOP Conference Series: Materials Science and Engineering, Institute of Physics Publishing, Aug. 2019. [CrossRef]
- B. E. Poling, G. H. Thomson, D. G. Friend, R. L. Rowley, and W. V. Wilding, Perry’s Chemical Engineers’ Handbook. The McGraw-Hill Companies, 2008.
- D. B. Robinson, D. Y. Peng, and H. J. Ng, “APPLICATIONS OF THE PENG-ROBINSON EQUATION OF STATE.,” in ACS Symposium Series, Am Chem Soc, 1977, pp. 200–220. [CrossRef]
- E. Querol, B. Gonzalez-Regueral, J. García-Torrent, and M. J. García-Martínez, “Boil off gas (BOG) management in Spanish liquid natural gas (LNG) terminals,” Appl Energy, vol. 87, no. 11, pp. 3384–3392, 2010. [CrossRef]
- J. Gomes et al., “The effect of season and temperature variation on hospital admissions for incident stroke events in Maputo, Mozambique,” Journal of Stroke and Cerebrovascular Diseases, vol. 23, no. 2, pp. 271–277, Feb. 2014. [CrossRef]
- J. J. Lembrechts et al., “Global maps of soil temperature,” May 01, 2022, John Wiley and Sons Inc. [CrossRef]
- Hyundai, “HYUNDAI-JC CARTER-SNECMA LNG marine pumps,” May 09, 2007, Motralec. [Online]. Available: www.motralec.com.
- H. Lu, G. Ma, X. Li, and S. Wu, “Stress analysis of LNG storage tank outlet pipes and flanges,” Energies (Basel), vol. 11, no. 4, Apr. 2018. [CrossRef]
- H. W. Backhaus and K. Friedrichs, “A NEW CONCEPT OF AN OFFSHORE LNG-TANKER LOADING AND UNLOADING SYSTEM,” in Underwater Technology, Elsevier, 1980, pp. 93–108. [CrossRef]
- J. P. Graham, R. T. Stockwell, and A. M. Montez, “A New CNG Engine Test for the Evaluation of Natural Gas Engine Oils Author(s): Wim van Dam,” 1998.
- D. Kouroussis and S. Karimi, “Alternative Fuels in Transportation,” Bull Sci Technol Soc, vol. 26, no. 4, pp. 346–355, Aug. 2006. [CrossRef]
- E. Adom and X. Ji, “Modelling of Boil-Off Gas in LNG Tanks: A Case Study,” 2010.
Figure 1.
LNG regasification flowchart.
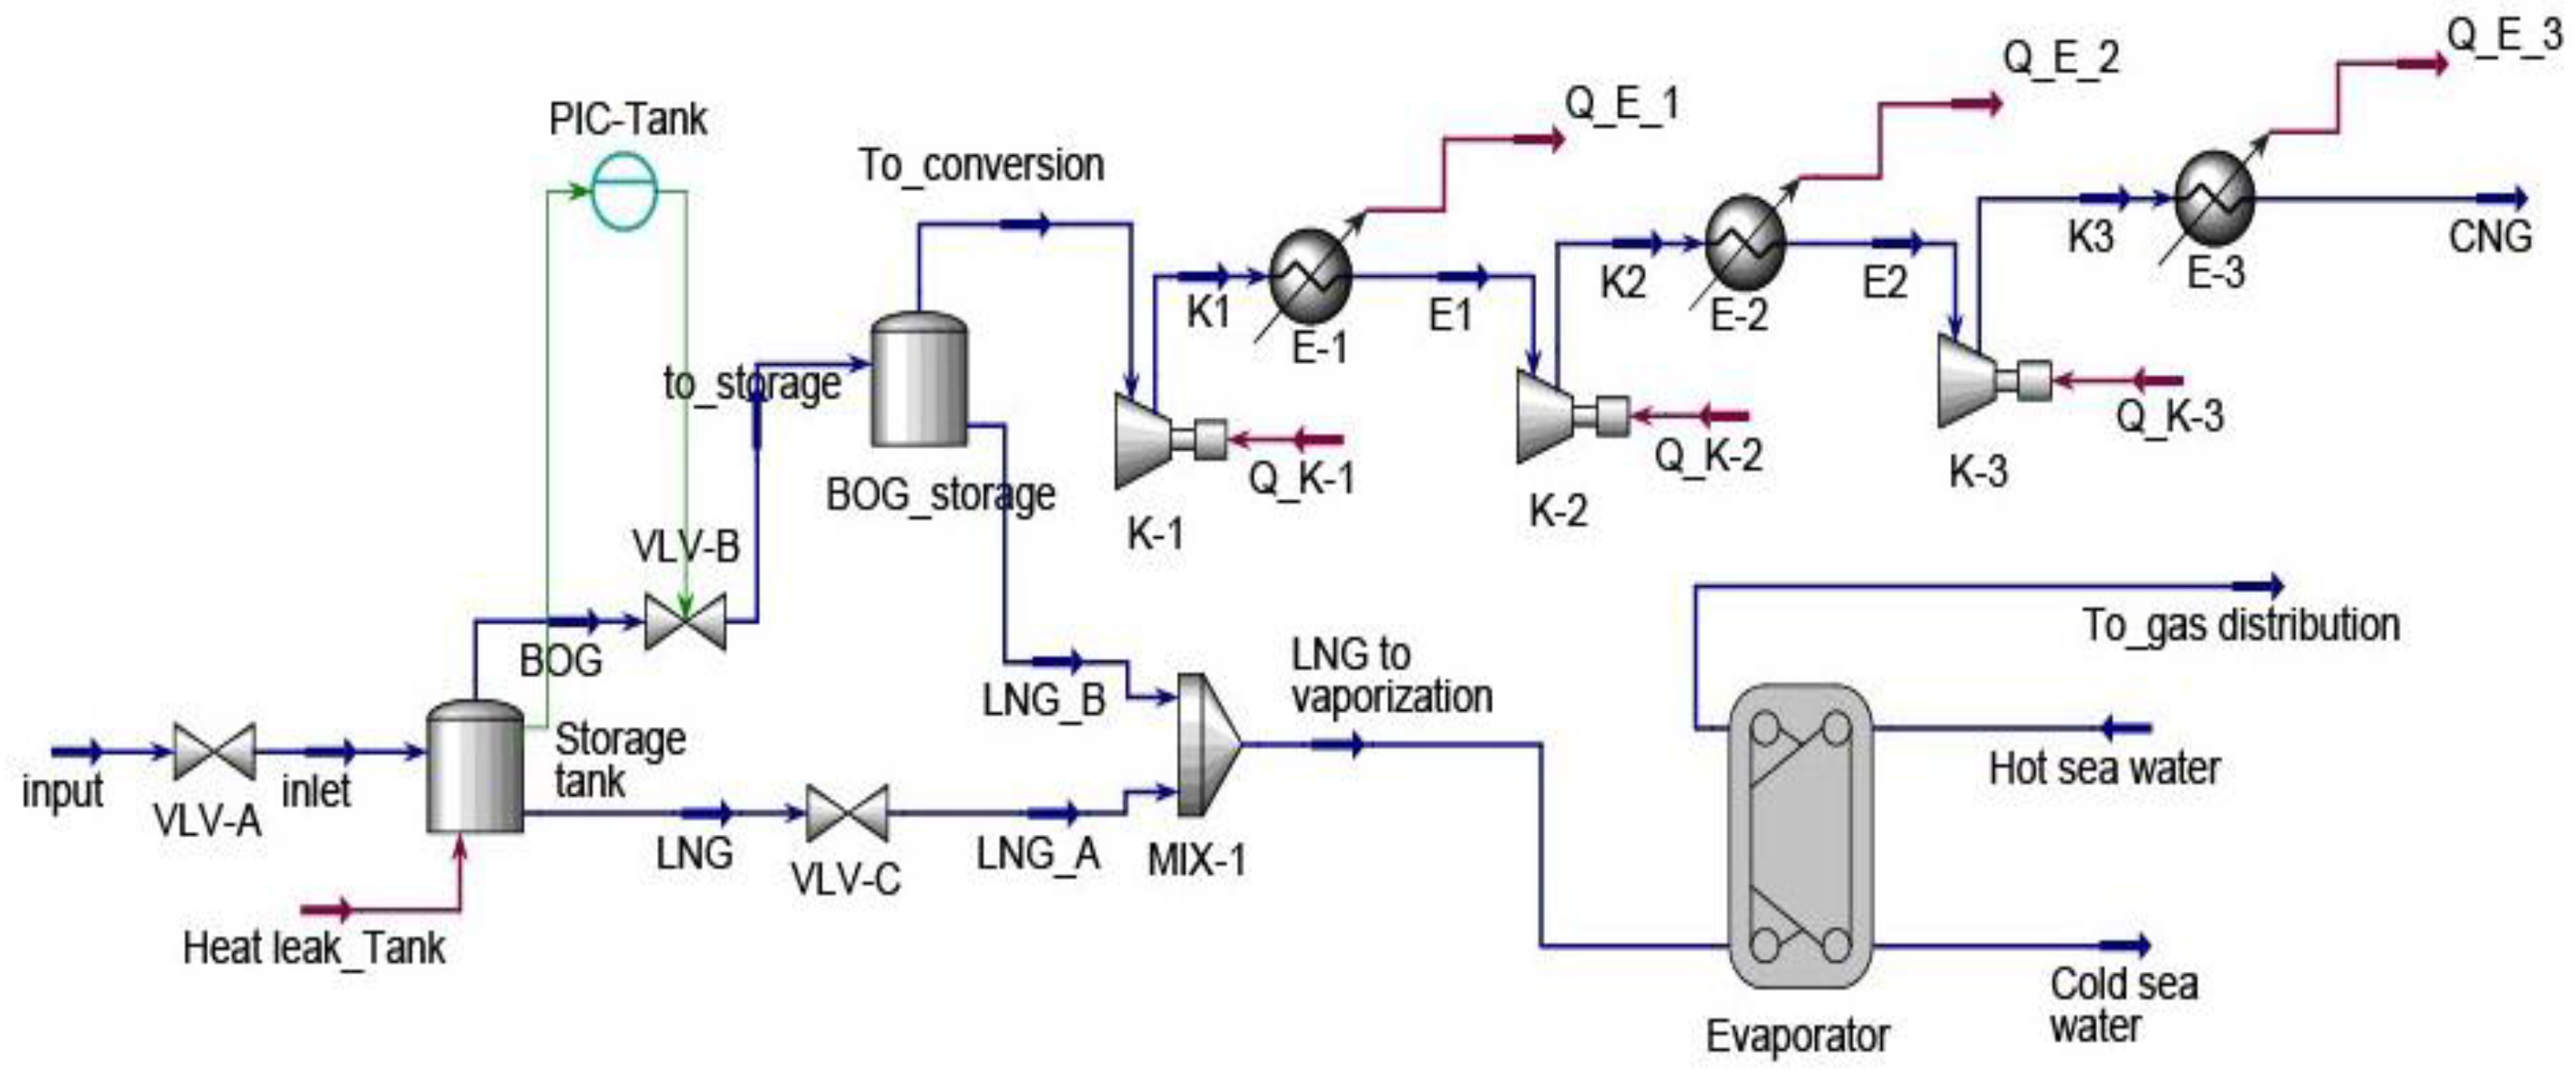
Figure 2.
Ships unloading mode flowchart.
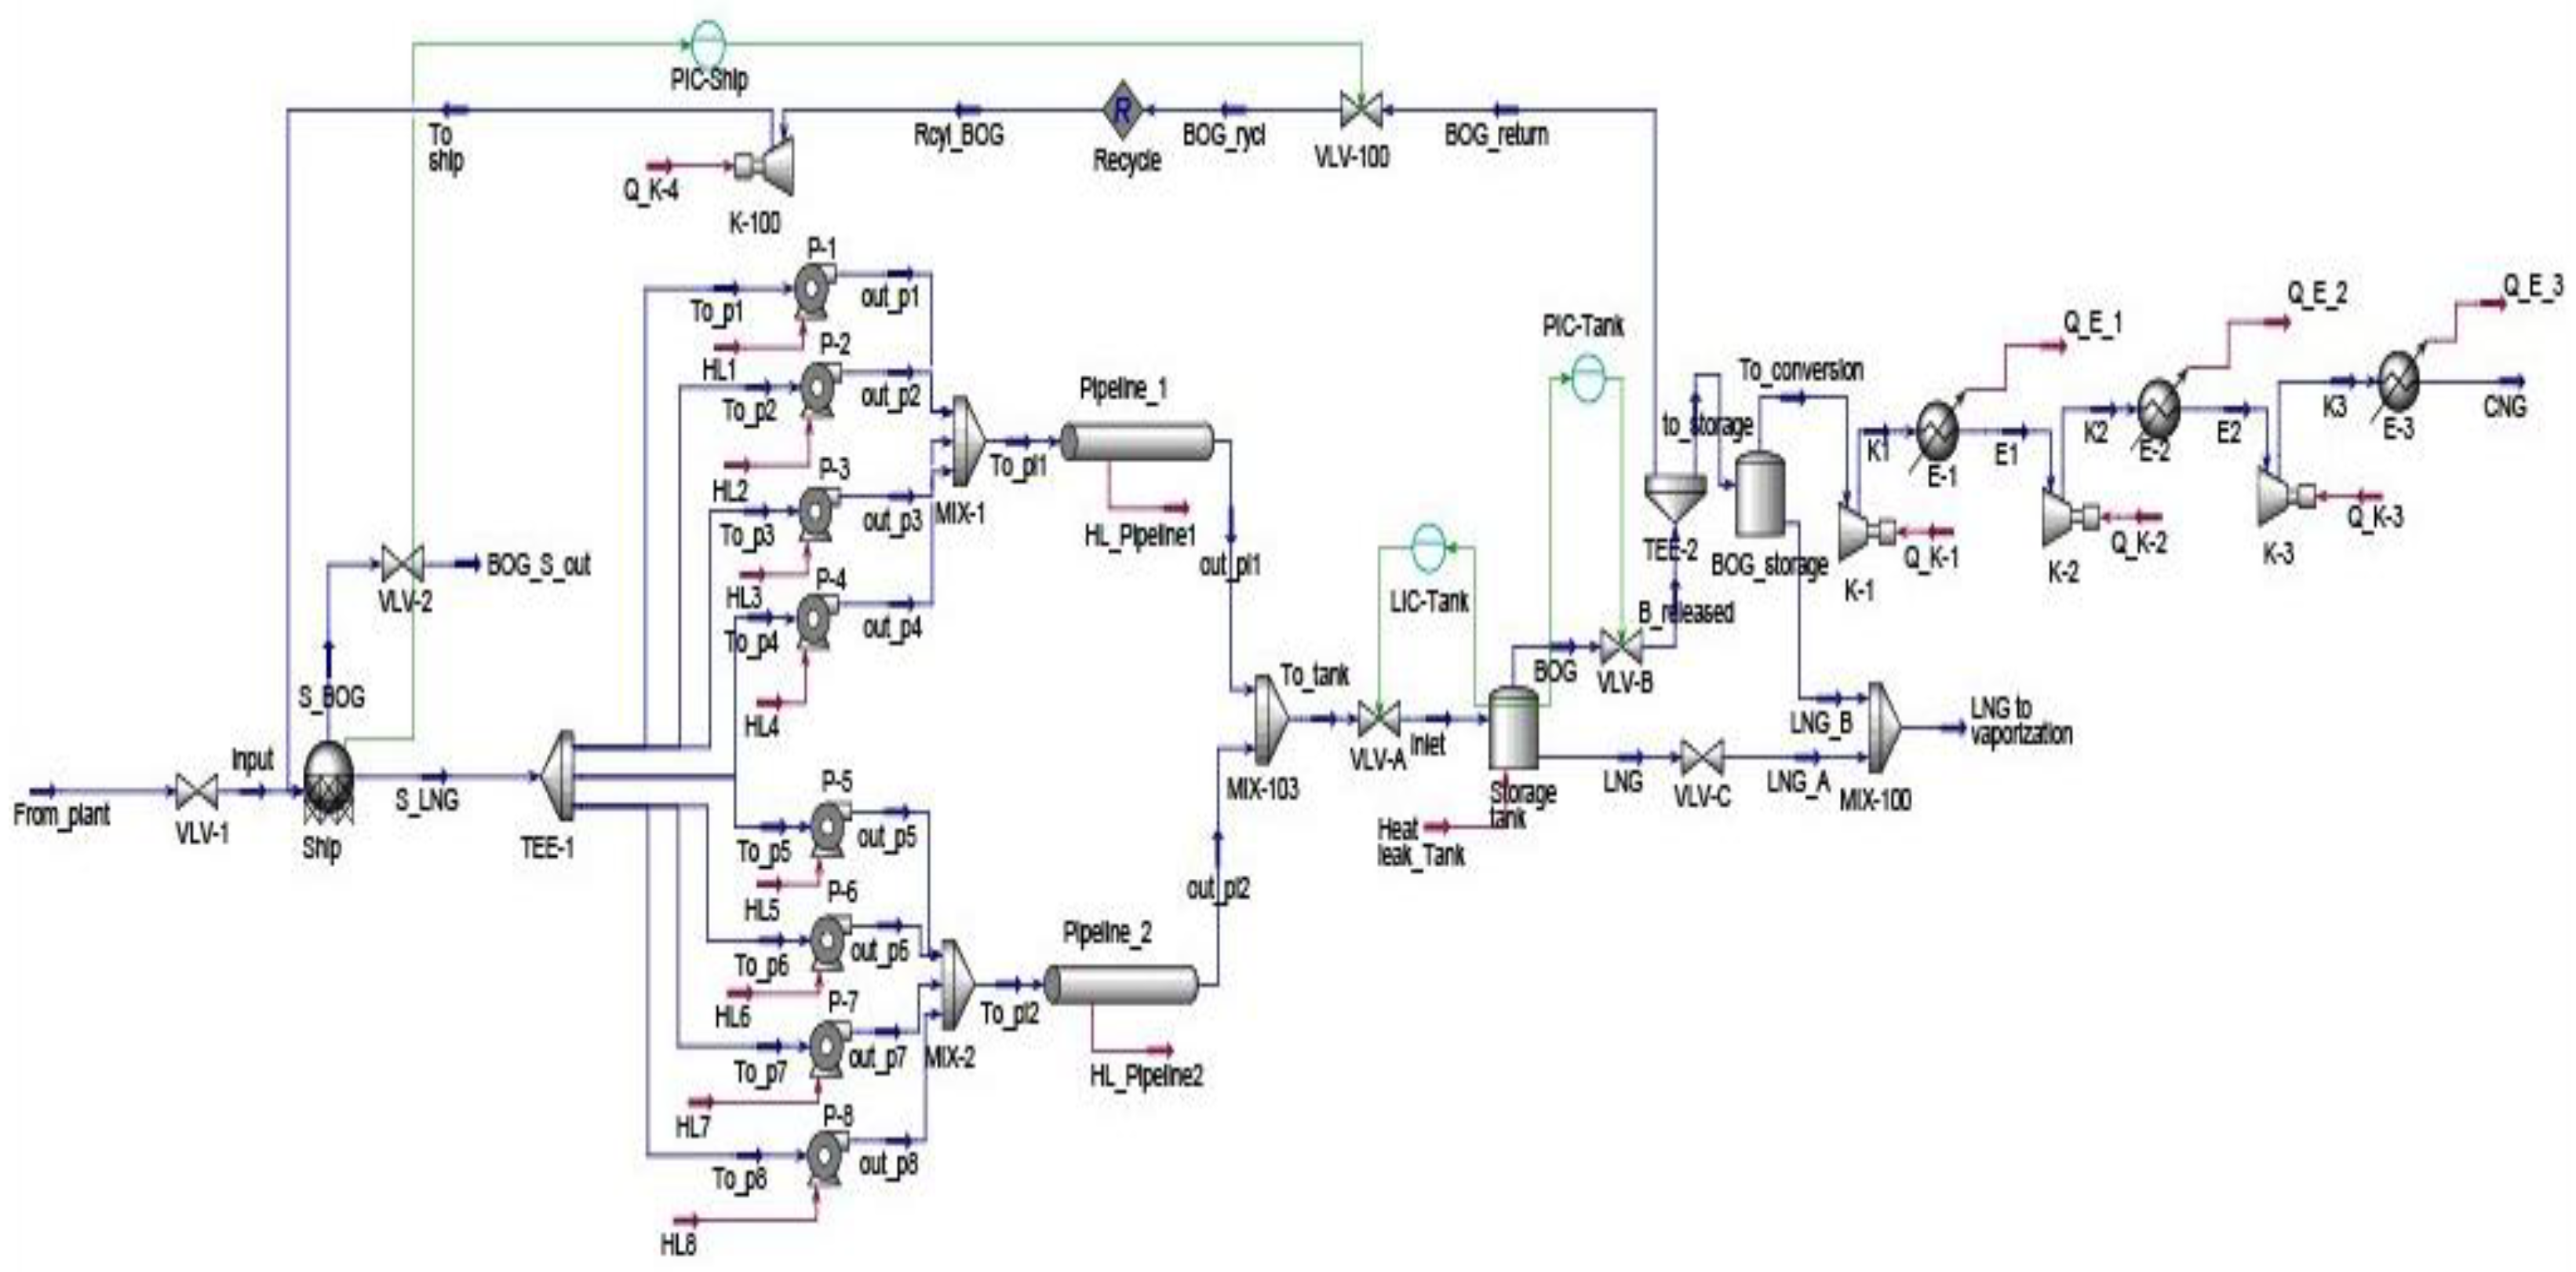
Figure 3.
LNG holding mode flowchart.
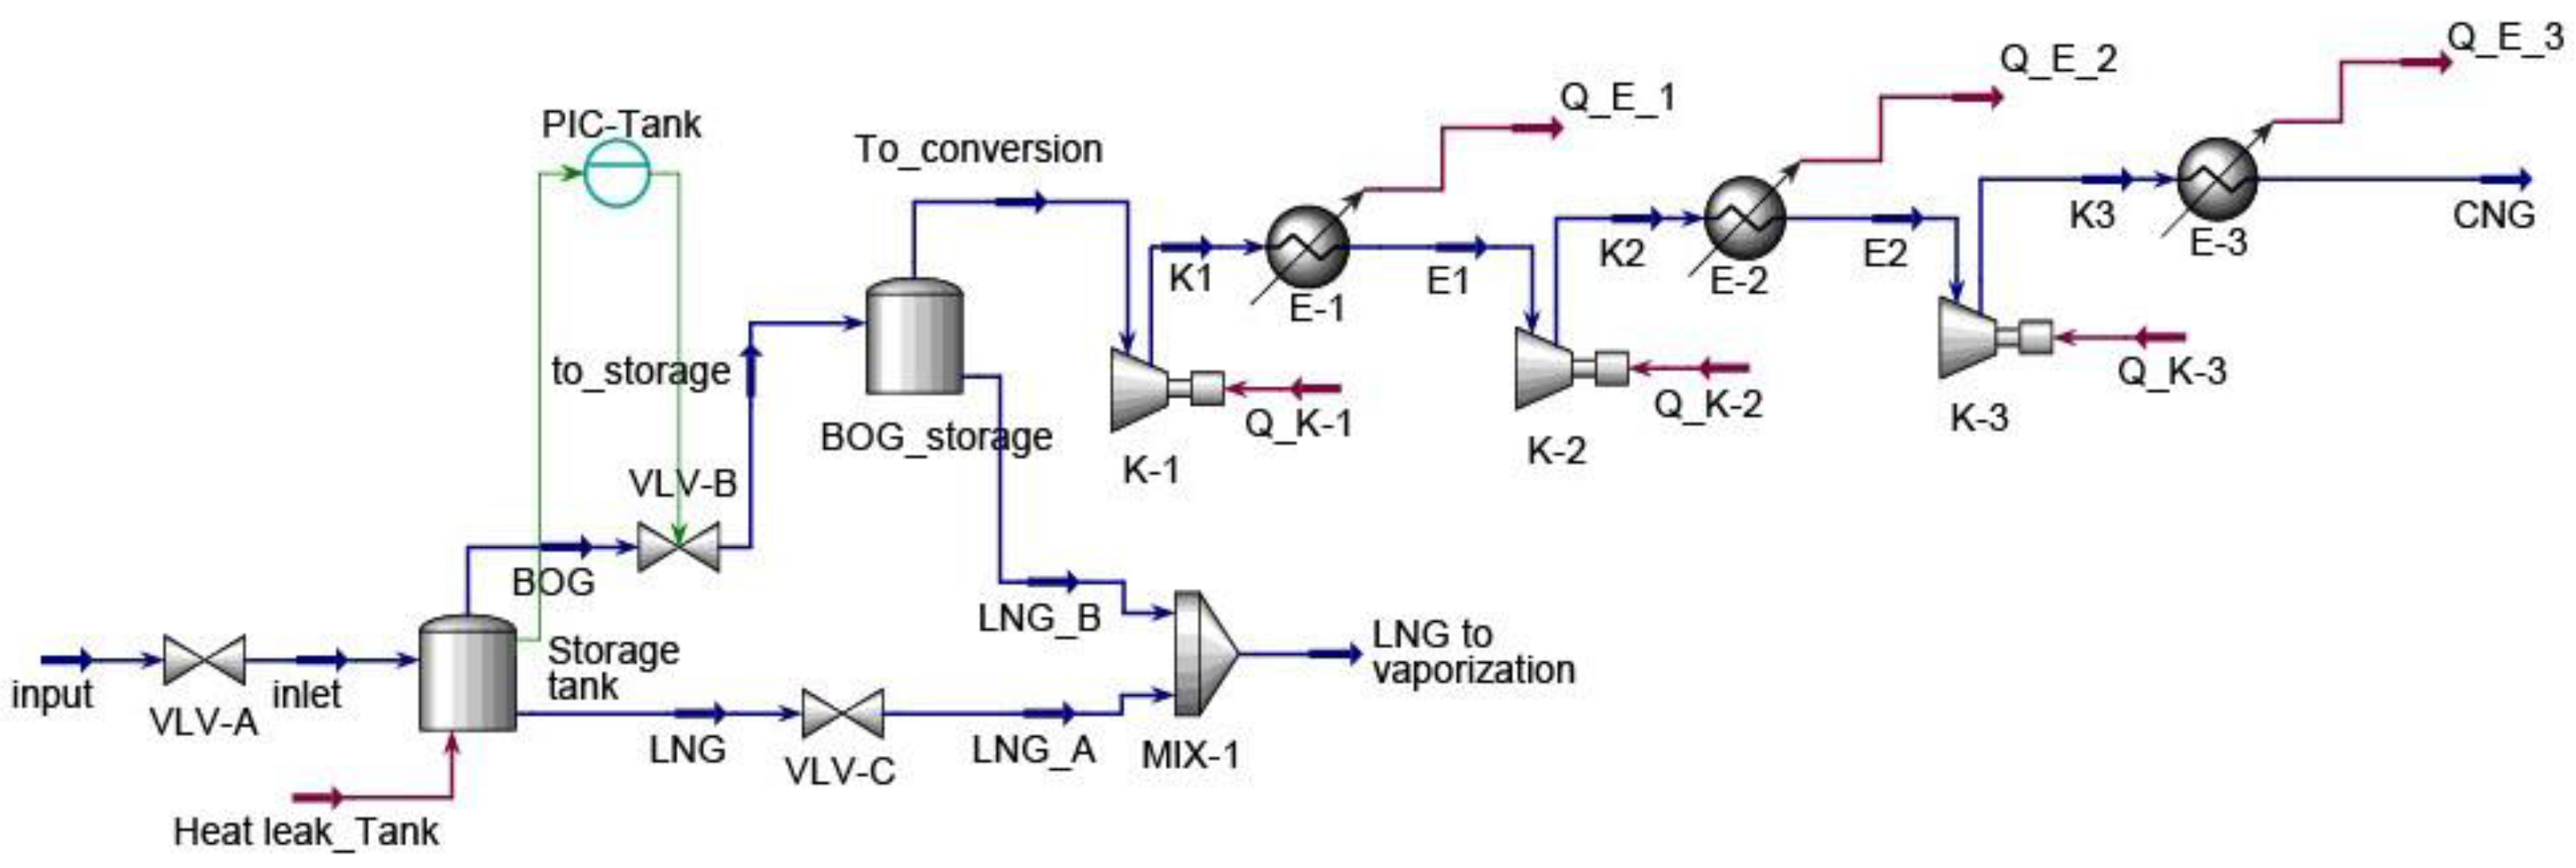
Figure 4.
Study results comparison of BOG generation and methane content relationship during holding mode.
Figure 4.
Study results comparison of BOG generation and methane content relationship during holding mode.
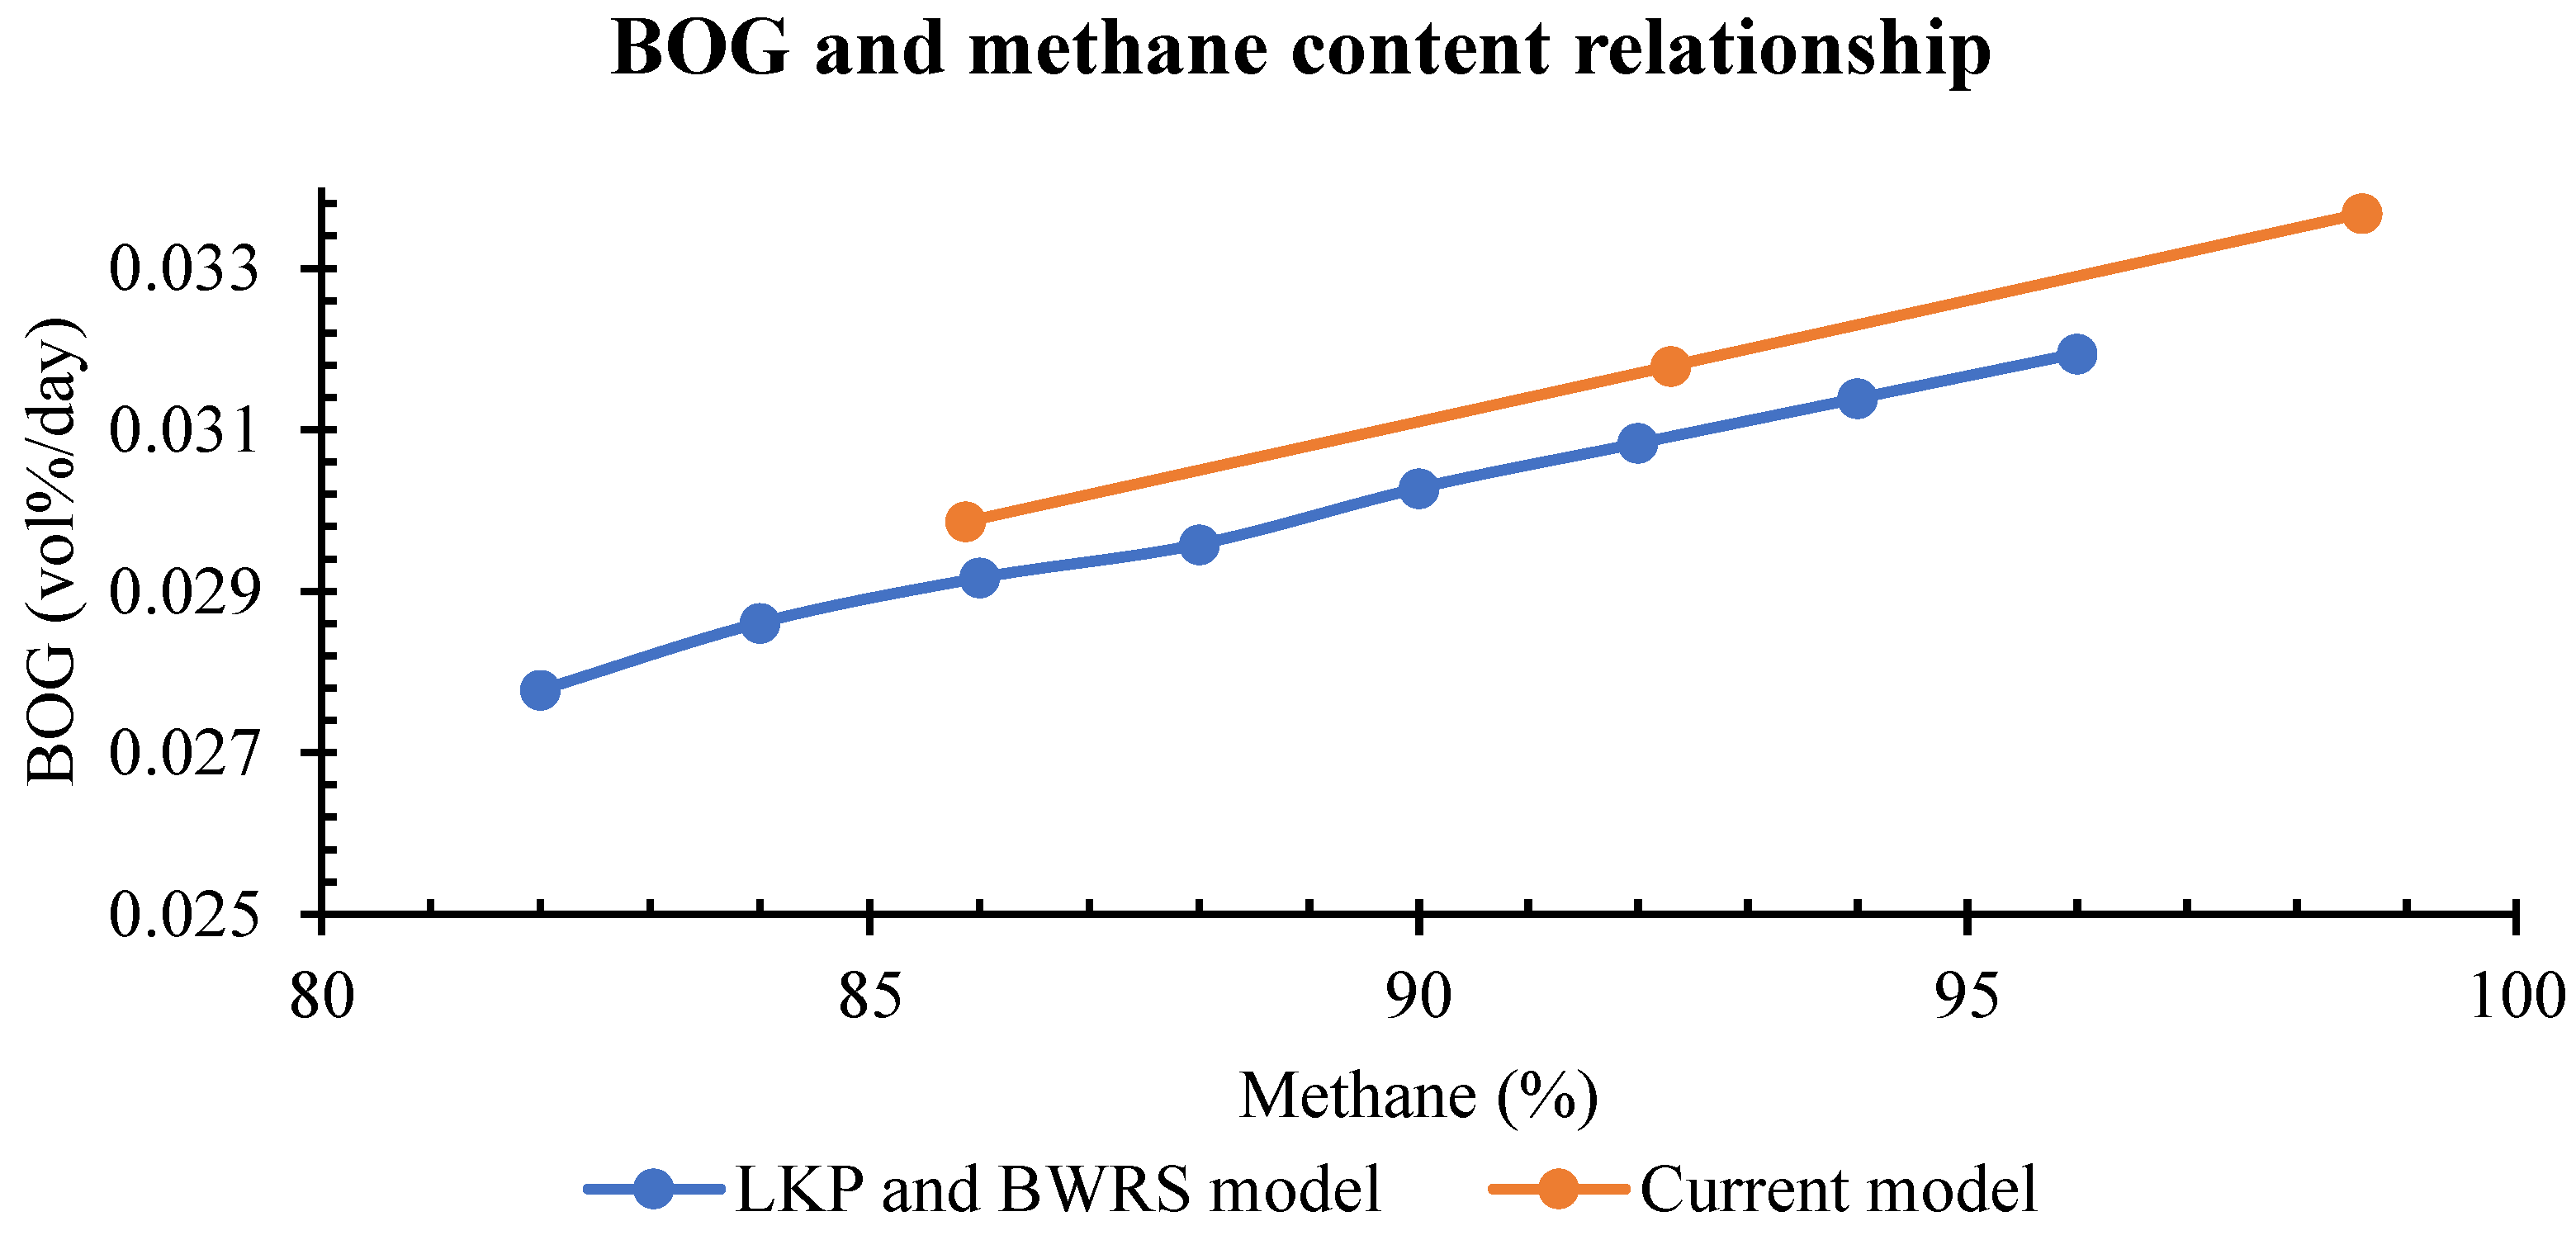

Table 1.
LNG composition and initial storage temperature used [23].
Table 1.
LNG composition and initial storage temperature used [23].
| Component | Lean LNG (%) | Medium LNG (%) | Rich LNG (%) |
|---|---|---|---|
| Methane | 98.6 | 92.3 | 85.87 |
| Ethane | 1.18 | 5 | 8.4 |
| Propane | 0.1 | 1.5 | 3 |
| Butane | 0.02 | 0.6 | 1.2 |
| Pentane | 0 | 0.1 | 0.23 |
| Nitrogen | 0.1 | 0.5 | 1.3 |
| Storage temperature (°C) | -160 | -160.7 | -163.1 |
Table 2.
LNG ship carrier fabric, insulation and thickness.
| Material | Thermal conductivity (W/m.K) | Thickness (cm) | |
|---|---|---|---|
| Inner layer | 9% Ni steel | 18.3 | 5 |
| insulation | Polyurethane | 0.025 | 30 |
Table 3.
LNG storage tank material, thermal conductivity, thickness, and absorptivity.
| Section | Material | Thermal conductivity (W/m.K) | Thickness (m) | Absorptivity (-) |
|---|---|---|---|---|
| Wall | 9% Ni steel | 18.3 | 0.02 | 0.8 |
| Glass wool | 0.0329 | 0.15 | 0.8 | |
| Perlite | 0.026 | 0.9 | 0.3 | |
| Concrete | 1 | 0.525 | 0.6 | |
| Roof | Aluminium | 235 | 0.003 | 0.075 |
| 9% Ni steel | 18.3 | 0.02 | 0.8 | |
| Glass wool | 0.0329 | 0.15 | 0.8 | |
| Perlite | 0.026 | 0.9 | 0.3 | |
| Concrete | 1 | 0.3 | 0.6 | |
| Steel liner | 45 | 0.005 | 0.45 | |
| Air cavity | 0.01 | |||
| Bottom | 9% Ni steel a | 18.3 | 0.02 | - |
| Load bearing glass wool a | 0.03 | 0.5 | - | |
| Load bearing glass wool b | 0.03 | 0.5 | - | |
| 9% Ni steel b (Sub-floor) | 18.3 | 0.02 | - | |
| Carbon steel liner | 45 | 0.001 | - | |
| Plywood | 0.012 | 0.13 | - | |
| Sand layer | 0.15 | 0.005 | - | |
| Concrete slab heater | 1 | 2 | - | |
Table 4.
Energy used for BOG conversion into CNG and produced CNG temperature and pressure.
| Mode | Total BOG mass inlet (kg) | Total energy (kW) | Overall CNG pressure (kPa) | Overall CNG temperature (°C) | ||||||
| Compressor | Cooler | |||||||||
| 1st stage | 2nd stage | 3rd stage | 1st stage | 2nd stage | 3rd stage | |||||
| Lean LNG | LNG regasification | 315913.51 | 14699.08 | 21197.63 | 24517.66 | 5651.56 | 18265.96 | 20289.17 | 25008.5 | 25 |
| Ships unloading | 186482.32 | 8678.81 | 12515.32 | 14474.09 | 3336.95 | 10785.69 | 11980.77 | 25008.5 | 25 | |
| LNG holding | 22462.53 | 1045.18 | 1507.25 | 1743.31 | 401.85 | 1298.80 | 1442.67 | 25008.5 | 25 | |
| Medium LNG | LNG regasification | 290373.34 | 12638.19 | 18483.34 | 22225.05 | 4770.69 | 15094.82 | 16563.76 | 25008.5 | 25 |
| Ships unloading | 156570.73 | 6819.06 | 9971.84 | 11987.40 | 2574.28 | 8146.36 | 8940.12 | 25008.5 | 25 | |
| LNG holding | 22370.38 | 973.24 | 1423.46 | 1711.89 | 367.36 | 1162.27 | 1423.32 | 25008.5 | 25 | |
| Rich LNG | LNG regasification | 307147.70 | 11704.45 | 17535.40 | 22315.35 | 4315.05 | 13257.98 | 18123.86 | 25008.5 | 25 |
| Ships unloading | 173210.30 | 6617.51 | 9910.26 | 12600.91 | 2440.23 | 7500.89 | 10259.13 | 25008.5 | 25 | |
| LNG holding | 19279.79 | 734.91 | 1100.98 | 1400.97 | 270.94 | 832.51 | 1138.12 | 25008.5 | 25 | |
Table 5.
BOG conversion performance assessment.
| Mode | Total CNG mass produced (kg) | Energy used (kW) | Energy per CNG mass produced (kW/kg) | CNG mass produced (kg/h) | ||
|---|---|---|---|---|---|---|
| Lean LNG | LNG regasification | 315913.51 | 104621.08 | 0.331169994 | 875.10668 | |
| Ships unloading | 186482.32 | 61771.63 | 0.331246575 | 12228.3491 | ||
| LNG holding | 22462.53 | 7439.07 | 0.331177018 | 935.938543 | ||
| Medium LNG | LNG regasification | 290373.34 | 89775.84 | 0.309173829 | 758.154945 | |
| Ships unloading | 156570.73 | 48439.07 | 0.309374975 | 10266.9332 | ||
| LNG holding | 22370.38 | 7061.55 | 0.315665082 | 932.099345 | ||
| Rich LNG | LNG regasification | 307147.70 | 87252.10 | 0.284072119 | 756.521425 | |
| Ships unloading | 173210.30 | 49328.93 | 0.284792114 | 11358.05246 | ||
| LNG holding | 19279.79 | 5478.43 | 0.284153858 | 803.3247742 |
Table 6.
The resulted CNG composition for each LNG in all simulated modes.
| Lean LNG | Medium LNG | Rich LNG | |||||||
|---|---|---|---|---|---|---|---|---|---|
| Mole fraction | Mole fraction | Mole fraction | |||||||
| Component | LNG regasification mode | Ships unloading mode | LNG holding mode | LNG regasification mode | Ships unloading mode | LNG holding mode | LNG regasification mode | Ships unloading mode | LNG holding mode |
| Methane | 0.9782 | 0.9785 | 0.9782 | 0.8817 | 0.8825 | 0.8811 | 0.6888 | 0.692433 | 0.6892 |
| Ethane | 2.6E-05 | 2.6E-05 | 2.6E-05 | 9.2E-05 | 9.2E-05 | 9.2E-05 | 9.8E-05 | 9.91E-05 | 9.81E-05 |
| Propane | 2.5E-08 | 2.5E-08 | 2.5E-08 | 2.8E-07 | 2.8E-07 | 2.8E-07 | 2.9E-07 | 2.99E-07 | 2.95E-07 |
| n-Butane | 6.1E-11 | 6.2E-11 | 6.2E-11 | 1.3E-09 | 1.3E-09 | 1.3E-09 | 1.1E-09 | 1.13E-09 | 1.11E-09 |
| n-Pentane | 0.0E+00 | 0.0E+00 | 0.0E+00 | 2.7E-12 | 2.7E-12 | 2.7E-12 | 2.3E-12 | 2.33E-12 | 2.29E-12 |
| Nitrogen | 0.0218 | 0.0215 | 0.0217 | 0.1183 | 0.1174 | 0.1188 | 0.3111 | 0.307468 | 0.310702 |
Table 7.
Produced CNG fuel properties.
| Mode | |||||||||
|---|---|---|---|---|---|---|---|---|---|
| Properties | LNG regasification | Ships unloading | LNG holding | ||||||
| Lean | Medium | Rich | Lean | Medium | Rich | Lean | Medium | Rich | |
| Molecular Weight | 16.304 | 17.460 | 19.768 | 16.300 | 17.449 | 19.725 | 16.303 | 17.466 | 19.763 |
| Molar Density (kgmole/m3) | 11.995 | 11.597 | 10.930 | 11.997 | 11.603 | 10.949 | 11.995 | 11.594 | 10.932 |
| Mass Density (kg/m³) | 195.559 | 202.488 | 216.077 | 195.550 | 202.465 | 215.960 | 195.557 | 202.504 | 216.061 |
| Act. Volume (m³) | 1615.441 | 1434.024 | 1421.472 | 953.631 | 773.321 | 802.047 | 114.865 | 110.469 | 89.233 |
| Specific Heat Capacity (kJ/kgmole.C) | 55.451 | 53.097 | 48.821 | 55.460 | 53.121 | 48.908 | 55.452 | 53.081 | 48.831 |
| Mass Heat Capacity (kJ/kg.C) | 3.401 | 3.041 | 2.470 | 3.402 | 3.044 | 2.480 | 3.401 | 3.039 | 2.471 |
| LHV Molar Basis (Std) (kJ/kgmole) | 785259.898 | 707840.243 | 553036.409 | 785490.033 | 708538.123 | 555959.847 | 785279.252 | 707402.875 | 553363.367 |
| HHV Molar Basis (Std) (kJ/kgmole) | 865496.959 | 780165.067 | 609543.274 | 865750.608 | 780934.251 | 612765.404 | 865518.291 | 779683.012 | 609903.639 |
| HHV Mass Basis (Std) (kJ/kg) | 53086.137 | 44683.817 | 30834.392 | 53112.872 | 44754.536 | 31065.858 | 53088.385 | 44639.540 | 30860.229 |
| LHV Mass Basis (Std) (kJ/kg) | 48164.715 | 40541.425 | 27975.932 | 48188.972 | 40605.589 | 28185.941 | 48166.754 | 40501.253 | 27999.374 |
| Molar Volume (m³/kgmole) | 0.083 | 0.086 | 0.091 | 0.083 | 0.086 | 0.091 | 0.083 | 0.086 | 0.091 |
| Thermal Conductivity (W/m. K) | 0.073 | 0.068 | 0.060 | 0.073 | 0.068 | 0.060 | 0.073 | 0.068 | 0.060 |
| LHV (MJ/Nm³) | 35.870 | 31.640 | 24.720 | 35.870 | 31.680 | 24.840 | 35.870 | 31.600 | 24.720 |
| HHV (MJ/Nm³) | 39.850 | 35.130 | 27.440 | 39.850 | 35.170 | 27.580 | 39.850 | 35.110 | 27.460 |
| Compressibility factor |
0.998 | 0.998 | 0.999 | 0.998 | 0.998 | 0.999 | 0.998 | 0.998 | 0.999 |
| Stoichiometric air/fuel ratio (Vol/Vol) | 9.530 | 8.400 | 6.560 | 9.530 | 8.410 | 6.600 | 9.530 | 8.400 | 6.570 |
| Stoichiometric air/fuel ratio (Mass/Mass) | 17.200 | 13.940 | 9.620 | 17.200 | 13.960 | 9.690 | 17.200 | 13.920 | 9.630 |
| Specific gravity (relative to air) | 0.554 | 6.030 | 0.683 | 0.554 | 0.602 | 0.681 | 0.554 | 0.603 | 0.682 |
| Wobbe index (MJ/Nm³) | 48.190 | 40.750 | 29.930 | 48.190 | 40.810 | 30.100 | 48.190 | 40.690 | 29.930 |
| Methane number | 100.000 | 103.000 | 102.000 | 100.000 | 103.000 | 102.000 | 100.000 | 103.000 | 102.000 |
| Motor octane number ≈ | 825.000 | 849.000 | 841.000 | 825.000 | 849.000 | 841.000 | 825.000 | 849.000 | 841.000 |
Disclaimer/Publisher’s Note: The statements, opinions and data contained in all publications are solely those of the individual author(s) and contributor(s) and not of MDPI and/or the editor(s). MDPI and/or the editor(s) disclaim responsibility for any injury to people or property resulting from any ideas, methods, instructions or products referred to in the content. |
© 2025 by the authors. Licensee MDPI, Basel, Switzerland. This article is an open access article distributed under the terms and conditions of the Creative Commons Attribution (CC BY) license (http://creativecommons.org/licenses/by/4.0/).
Copyright: This open access article is published under a Creative Commons CC BY 4.0 license, which permit the free download, distribution, and reuse, provided that the author and preprint are cited in any reuse.


