
Submitted:
18 March 2025
Posted:
19 March 2025
You are already at the latest version
Abstract
Perfluoropropionic acid (CF₃CF₂C(O)OH) will be investigated with a focus on its complex structural properties. As a formal derivative of propanoic acid, the incorporation of fluorine atoms imparts unique structural features, including three distinct monomeric conformations and a dimeric structure. This study presents experimental findings, supported by computational modeling, to explore these characteristics. The analysis includes an FTIR study of the isolated species in an Ar-cryogenic matrix and the low-temperature determination of its crystalline structure using single-crystal X-ray diffraction.
Keywords:
Perfluoropropionic Acid
; Low-Temperature Crystal Structure
; Cryogenic Ar-Matrix Study
; Conformers
; Monomers
; Dimer
; Computational Calculations
1. Introduction
The chemistry of fluorine has long been, and continues to be with renewed momentum, one of the most captivating fields for chemists worldwide. Fluorine, in its compounds, cannot be simply regarded as either a "larger hydrogen" or a "smaller chlorine." The properties of its compounds often prove to be unexpected, unpredictable, fascinating, and truly unique. For example, the energy transition has once again positioned fluorine at the forefront of the discipline. It is a key component of the salt used in lithium battery electrolytes, LiPF₆, and in its elemental form plays a vital role in chemically eliminating trace water by oxidizing it into OF₂ and HF [1].
In particular, fluoro- and perfluoro-organic compounds have found a wide range of applications. Specifically, perfluoroorganic compounds, one of which is the focus of this work, exhibit remarkable stability due to the presence of C-F bonds within their molecular structure. This stability—thermal, chemical, biological, and, to some extent, photochemical—confers upon them a significant degree of environmental persistence [2,3,4,5,6,7,8,9,10,11,12,13].
Perfluoropropionic acid, CF3CF2C(O)OH (PFPA), the title compounds, may not accumulate in the environment to the same extent as the longer chain perfluorinated carboxylic acids [7,8]; neither have its natural sources been identified so far. That it has been detected in rainwater [14,15,16], however, stresses its role as an environmentally active molecule. To fully understand how this and other long-lived products are formed under the complex environmental conditions present in a given reactive matrix, it is essential to acquire a detailed knowledge of the photochemical evolution of the species, their association equilibria at various temperatures, and to experimentally determine the existence of all conformers present at room temperature.
In the context of the anhydride molecule central to this study, it is worth noting that, from a structural perspective, the hydrate and dihydrate of perfluoropropionic acid were investigated using Chirped-Pulse Fourier Transform Microwave (CP-FTMW) Spectroscopy. The study revealed that the complexation of the −OH group of the acid with one or two water molecules occurs in the plane of the carboxylic acid group, resulting in the formation of a six- or eight-membered ring structure [17].
Important for this work is a vibrational study of CF3CF2C(O)OH published by Crowder in 1972, in which he detailed the partial and total association of the species in the vapor and liquid states, respectively. The use of fundamental vibrational concepts, such as evaluating group electronegativity, allowed him to understand, for example, the shift to higher wavenumbers of the carbonyl stretch when a CF3CF2- group is formally replaced by a CF3- group, and its connection with the hydrogen bonding comparison between the two species [18,19].
Another study explored the far-infrared spectra of a set of 27 carboxylic acids in aqueous solution, including the compound examined in this work. The analysis of the spectra, particularly in the OH stretching region, enables the determination of conformational isomerism [20]. Computational studies using DFT-B3LYP/6-311+G** and ab initio MP2/6-311+G** calculations on perfluoropropionic acid revealed the existence of an equilibrium between two conformations: the cis form (where the C=O group eclipses the C-C bond) and the gauche conformer. The calculations predict the gauche-conformer to be the lower-energy form at ambient temperature, with an abundance of 76% gauche and 24% cis at 298.15 K [21]. The structural properties of perfluoropropionic acid have been resolved through the study of its rotational spectrum using a pulsed nozzle, chirped-pulse Fourier transform microwave spectrometer in the frequency range of 8–14 GHz. According to the quantum-chemical calculations and spectral analysis, we conclude that the observed rotational isomer is the gauche-form, with the C−C−C=O dihedral angle predicted to be 106–107°, depending on the level of approximation used [22].
In another work, the chemistry of perfluoropropionic acid and its close derivatives was studied, described, and compared [23]. Perfluoropropionic acid was also included in an early study utilizing neutron spectroscopy to examine its vibrational spectrum, alongside a broader group of related organic acids [24]. The title compound was also investigated using gas-phase mid-IR, near-IR, and visible vibrational spectroscopy, alongside perfluorooctanoic and perfluorononanoic acid, employing Fourier transform and cavity ring-down spectroscopy. The authors of this work concluded that these compounds exhibit more harmonic O-H bonds, lower transition wavenumbers, and reduced intensities compared to shorter-chain hydrocarbon acids, alcohols, and peroxides [25]. The vibrational spectra of the title compound have also been presented in the range of 11,000–1,000 cm⁻¹ and compared with those of its hydrocarbon homolog, propionic acid [26]. Perfluoropropionic acid was one of the compounds used to study a simple drop-coating deposition using Raman spectroscopy methods to concentrate perfluoroalkyl substances and subsequently design an accessible and reliable spectral library [27].
The family of polyfluorinated compounds, including CF3CF2C(O)OH, was analyzed from the perspective of the fragmentation process of the deprotonated species. It was indicated that the relative energy of the transition state of the formed CCFC ring, which leads to the FCO2− anion, is directly linked to the subsequent dissociation observed [28]. In another previous work we also employed perfluoropropionic acid to study details related to its photoexcitation, photoionization, and photofragmentation using synchrotron light energies in the range between 11.7 and 715.0 eV. At low energies, the detected fragments were COH+, C2F4+, and the parent M+ ion. In this work, and in line with the experimental variables used—for instance, very low pressures on the order of 10⁻⁶ mm Hg—there was no evidence of the existence of a dimer of perfluoropropionic acid [29].
CF3CF2C(O)OH has also been part of a very recent study that evaluates the decomposition products of this family of compounds in research aimed at providing more information about the thermal evolution process [30]. In this context, and in connection with this evidence, the degradation of perfluoropropionic acid and related compounds was investigated using an argon plasma under various conditions [31].
A previous analysis of this type reports that after decomposition in an N₂ atmosphere at temperatures between 200 and 780 °C, the identified products are CF₂=CF₂, CF₃CF₂H, and CF₃C(O)F. In an O₂ atmosphere below 400 °C, the main product is OCF₂, accompanied by the inevitable formation of SiF₄ due to the use of a quartz reactor [32]. From a computational perspective, and to understand the transport behavior over considerable distances of relatively stable substances such as perfluoroalkyl and polyfluoroalkyl compounds, this work aims to comparatively determine the gas-phase thermochemical properties of the compounds, which includes perfluoropropionic acid [33]. The use of perfluoropropionic acid in studying its role in driving the nucleation of atmospheric molecules under ambient conditions is computationally analyzed to understand, at a molecular level, the composition and formation mechanism of secondary organic aerosols [34].
To fully comprehend how this and other long-lived products are formed under the intricate environmental conditions present in a given reactive matrix, it is crucial to gain a detailed understanding of the photochemical evolution of the species, their association equilibria at various temperatures, and to experimentally confirm the existence of all conformers present at room temperature. This comprehensive approach ensures a deeper insight into the mechanisms and interactions that drive the formation and stability of these products.
2. Results and Discussion
2.1. Quatum-Chemical Calculations
2.1.1. Monomer
With the aim of determining which conformations of CF3CF2C(O)OH coexist in the gas phase at room temperature, a potential energy surface was calculated as a function of the dihedral angles φ(C−C−C=O) and φ(O−C−O−H) using the B3LYP/6-311+G(D) approximation (Figure S1).
The gauche−syn, gauche−anti, and syn−syn conformations (Figure 1) correspond to minima on the aforementioned potential energy surface, while the syn−anti structure corresponds to a saddle point. This represents a notable difference between CF3CF2C(O)OH and its hydrogenated analog, which admits four stable conformations. Despite the stability of three CF3CF2C(O)OH conformations, only one (gauche−syn) has been properly detected experimentally and studied.
The structures corresponding to the three mentioned conformers were optimized, and their harmonic vibrational frequencies were calculated using different approximations. Table 1 presents the values of the dihedral angles φ(C−C−C=O) and φ(O−C−O−H) for the different conformations, their relative energies, and their populations determined using the Boltzmann equation at room temperature, taking into account the double degeneracies for the gauche species due to symmetric considerations.
2.1.2. Dimer
The structure of the CF3CF2C(O)OH dimer (Figure 2) was calculated using the MP2/6-311+G(D) approximation, taking into account that the structure determined by X-ray diffraction reproduces these data (see X-ray diffraction section). The dimer consists of two enantiomeric monomeric units (gauche−syn) properly oriented and linked to each other through two hydrogen bonds.
2.2. Experimental Results
2.2.1. Gas-Phase FTIR Spectra
In 1972, Crowder reported for the first time the infrared spectrum of the gas and liquid phases of CF3CF2C(O)OH [18]. The FTIR spectrum of CF3CF2C(O)OH in the gas phase shows evidence of the coexistence of three monomeric and one dimeric species (Figure 3 and Figure 4). However, despite the good resolution of the acquired spectra (0.5 cm−¹), the different conformational contributions of the monomers remain unclear. The infrared spectrum assignment is detailed in Table S1.
Next, the coexistence of monomers and a dimer of CF3CF2C(O)OH will be confirmed through experiments conducted in the vapor phase. It is important to have this information to ensure that, during the preparation of the CF3CF2C(O)OH matrix in Ar for deposition and measurement at cryogenic temperature, the dimer concentration is minimized. Figure 3 shows a selected section of the FTIR spectra in the vapor phase for CF3CF2C(O)OH samples measured at different temperatures. In this region, two distinct bands clearly appear: one at 714 cm⁻¹, corresponding of the dimer, and another at 676 cm⁻¹, corresponding to the O-C=O bending of the gauche-syn-monomer. Figure 5 and Figure 6 describe the results of experiments conducted with the vapor phase of the species, aiming to determine the optimal experimental conditions for ensuring that monomeric species predominate over the dimer in the matrix isolation experiments of perfluoropropionic acid.
2.2.2. FTIR Spectrum of CF3CF2C(O)OH Isolated in Solid Ar
The study of species isolation using cryogenic matrices enhances the resolution of infrared spectra by eliminating the contributions of rotational broadening at low temperatures, typically around 15 K. Thus, the infrared spectrum of the CF3CF2C(O)OH:Ar (1:500) matrix reveals the contributions of the gauche−syn- and syn−syn-conformers of CF3CF2C(O)OH, which coexist in the gas phase, but does not show the contribution of the gauche−anti-conformer, which is less abundant. This represents a difference between propionic acid, CH3CH2C(O)OH, and its perfluorinated counterpart: the matrix FTIR spectrum of the propionic acid at low temperatures only shows the existence of a single conformer [35]. Figure 4 compares the FTIR spectra of CF3CF2C(O)OH in the gas phase and in the matrix, highlighting the respective conformational contributions in the latter.
2.2.3. Matrix FTIR Spectra of CF3CF2C(O)OH after Broadband UV-VIS Irradiation
The matrix of CF3CF2C(O)OH diluted in argon in a 1:500 ratio at cryogenic temperatures was exposed to UV-vis broadband irradiation in the range of 200 ≤ λ ≤ 800 nm. Spectra were acquired before irradiation and at different irradiation times (0.5, 1.5, 3, 6, 12, 30, and 60 min). The irradiation resulted in a decrease of the population of the lowest energy and most abundant conformer in the gas phase, the gauche-syn-conformer, and an increase in the syn-syn-conformer and the dimeric species. A significant finding was that after 30 min of irradiation, signals of the gauche-anti form appeared in the spectrum. This conformer had previously been elusive due to its relatively low concentration in the gas phase at room temperature. Thus, we obtained the first experimental evidence for the existence of this conformer. Figure 7 depicts the FTIR spectra of CF₃CF₂C(O)OH isolated in Ar, recorded immediately after deposition and after 60 min of broad-band irradiation in the carbonyl stretching vibrational region, which is highly sensitive to conformation. For clarity, the spectra were normalized to the carbonyl absorption of the lowest-energy conformer, the gauche-syn-rotamer.
Figure 8 shows the variation in absorbance, measured as the integrated area of the IR bands, as a function of irradiation time. The features assigned to the syn-syn-form increase at the expense of the bands corresponding to the gauche-syn-rotamer. Additionally, the absorptions of the dimer also increase upon photolysis, presumably due to some monomer diffusion during irradiation.
2.2.4. Solid State Structure
The solid-state structure of CF3CF2C(O)OH has been studied from an in situ grown crystal. CF3CF2C(O)OH crystallizes in the space group P21/c, forming dimers in which both monomers adopt a gauche-syn conformation, related to each other by a crystallographic center of inversion (Figure 9). Table S2 presents crystallographic information obtained from the structural analysis and refinement of CF3CF2C(O)OH.
The geometric parameters of CF3CF2C(O)OH obtained by X-ray diffraction are listed below in Table 2, where they are compared with the values obtained by quantum-chemistry calculations showing that the calculated values reproduce the experimentally obtained fairly well, even though the computational values would be closer to those determined in the gas phase due to their intrinsic nature.
According to NBO quantum-chemical calculations at the B3LYP/6-311+G(D) level of the theory, the aforementioned hydrogen bonds, which are responsible for dimer formation, arise from electronic transfer from a lone pair of the carbonyl oxygen to the anti-bonding molecular orbital σ*(O−H). This interaction leads to a second-order perturbation stabilization energy E(2) of 9.20 kcal/mol.
The hydrogen bond H11···O5' (symmetry code -X,1-Y,-Z) has a length of 1.70(3) Å, and the distance O1···O5' is 2.665(2) Å. Additionally, the only appreciable distance below the van der Waals distance (rvdW) [36] is the contact F6···C2' (symmetry code: +X,3/2-Y,1/2+Z) with 3.113(2) Å. However, the stabilization energy calculated for these interactions is not appreciable.
3. Materials and Methods
3.1. CF3CF2C(O)OH
The CF3CF2C(O)OH 97 % was purchased from Sigma Aldrich and subsequently purified by distillation through a series of U-shaped cold traps immersed in cold baths at −50, −80, and −110°C, respectively.
3.2. Quantum-Chemical Calculations
The Gaussian 03 program [37] was used to perform quantum-chemical calculations, including the calculation of the potential energy function potential energy function for a specific dihedral angle, followed by geometry optimization of the corresponding minima and the calculation of their harmonic frequencies. For these purposes, the DFT [38] and MP2 [39] methods were chosen in conjunction with the 6-311+G(D) basis set. NBO [40] calculations were performed with the NBO 5.G package [41] incorporated in Gaussian 03. Additionally, the dimeric structure was computed using Gaussian 03. In this case, a potential energy curve was generated, followed by the optimization of the obtained minimum, employing the B3LYP/6-311+G(D) level of approximation.
3.3. Infrared Spectroscopy
Infrared spectra were recorded using a Nicolet™ 6700 spectrometer with a double-wall cell featuring a 10 cm optical path length and 0.5 mm thick Si windows. The spectral resolution was 0.5 cm⁻¹, and each spectrum was obtained by averaging 64 scans. To optimize the equilibrium between monomers and dimers of perfluoropropionic acid in the matrix study at cryogenic temperatures, spectra were recorded at various temperatures (5.0, 9.9, 15.6, 20.4, and 38.0°C) to determine the best experimental conditions.
3.4. Matrix Isolation Experiments
The gas mixture was deposited on a 15 K CsI window using the pulse deposition technique [42,43,44]. Low temperatures were achieved using a Displex closed-cycle refrigerator (SHI-APD Cryogenics, model DE-202). The corresponding FTIR spectra were acquired with the previously described instrument. A Spectra-Physics Hg-Xe arc lamp operating at 1000 W was used to irradiate the matrix within the 200–800 nm broad band range. To prevent matrix heating, a water filter was placed between the lamp and the matrix. Several spectra were recorded at different irradiation times.
3.5. X−Ray Diffraction Analysis
A single crystal of CF3CF2C(O)OH was grown in situ within a capillary. The sample was filled into a capillary, cooled with liquid nitrogen forming a polycrystalline material. At 180 K a solid-liquid equilibrium near the melting point was established by melting the solid, leaving only a tiny crystal seed intact, using a thin copper wire as an external heat source. The temperature was then gradually lowered with 1 K/h to 176 K where the entire capillary was filled with crystalline specimen, followed by cooling to 146 K at a rate of 44 K per hour.
The crystal was maintained at 146.0(1) K during data collection, which was performed using an Agilent SuperNova diffractometer at Bielefeld University. Using Olex2 [45] the structure was solved by direct methods with SHELX-97 [46], and the refinement was carried out using Olex2.refine [47] and spherical scattering factors calculated with NoSpherA2 [48].
3. Conclusions
The evaluation of the results obtained through various spectroscopic techniques—vibrational IR, matrix IR spectra with UV-Vis broad band irradiation, as well as X-ray diffraction analysis—provide complementary data that allow for the study of conformations and equilibria in different families. It is worth noting that conformational properties are crucial for understanding the chemical behaviour of macromolecules and are responsible for the fundamental chemical behaviour of biological molecules [49,50].
In the present case, and in relation to the above-mentioned, the structure of CF3CF2C(O)OH, its dimer, and the existence of three conformations in equilibrium in the vapor phase have been conclusively determined. It is worth noting that the accurate assessment of the number of real conformers is a key tool for precisely approximating the electronic spectra of molecules. A purely computational approach requires evaluating thousands of geometries. In the recently published study, this computational effort is drastically reduced by using effective conformers for the calculation of UV-Vis spectra [51].
Supplementary Materials
The following supporting information can be downloaded at the website of this paper posted on Preprints.org, Figure S1: Potential energy surface of CF3CF2C(O)OH as a function of the dihedral angles φ(O−C−O−H) and φ(C−C−C=O), displayed from different perspectives.; Table S1: Comparison between experimental and computed IR vibrational modes for CF3CF2C(O)OH and their proposed assignment; Table S2: Crystallographic information for CF3CF2C(O)OH.
Author Contributions
All authors contributed to the results presented in this manuscript. In particular, H.-G.S. was responsible for the crystal structure resolution of the studied species.
Funding
This article was supported by Consejo Nacional de Investigaciones Científicas y Técnicas (CONICET), PIP 0352 and PUE-2017-22920170100053, Agencia Nacional de Promoción Científica y Tecnológica (ANPCyT), PICT-2018-04355 and PICT-2020-03746, and Universidad Nacional de La Plata, UNLP-11/X971. The German authors acknowledge the Deutsche Forshungsgemeinschaft (DFG) for financial support.
Data Availability Statement
The original contributions presented in this study are included in the article/supplementary material. Further inquiries can be directed to the corresponding author.
Acknowledgments
The authors thank Dr. Yanina Berrueta Martínez for her contribution to the manuscript. This time, as she is working in a different area, she prefers not to be included as part of the group of authors.
Conflicts of Interest
The authors declare no conflicts of interest.
References
- Susarla, N.; Ahmed, S. Estimating cost and energy demand in producing lithium hexafluorophosphate for Li-ion battery electrolyte. Ind. Eng. Chem. Res. 2019, 58, 3754–3766. [Google Scholar] [CrossRef]
- Moody, C.A.; Martin, J.W.; Kwan, W.C.; Muir, D.C.G.; Mabury, S.A. Monitoring perfluorinated surfactants in biota and surface water samples following an accidental release of fire-fighting foam into Etobicoke Creek. Environ. Sci. Technol. 2002, 36, 545−551. [Google Scholar] [CrossRef]
- Zhang, C.; Yan, H.; Li, F.; Zhou, Q. Occurrence and fate of perfluorinated acids in two wastewater treatment plants in Shanghai, China. Environ. Sci. Pollut. Res. 2015, 22, 1804–1811. [Google Scholar] [CrossRef] [PubMed]
- Yamashita, N.; Kannan, K.; Taniyasu, S.; Horii, Y.; Petrick, G.; Gamo, T. A global survey of perfluorinated acids in oceans. Mar. Pollut. Bull. 2005, 51, 658–68. [Google Scholar] [CrossRef]
- So, M.K.; Miyake, Y.; Yeung, W.Y.; Ho, Y.M.; Taniyasu, S.; Rostkowski, P. Perfluorinated compounds in the Pearl River and Yangtze River of China. Chemosphere. 2007, 68, 2085–2095. [Google Scholar] [CrossRef]
- Ellis, D.A.; Mabury, S.A.; Martin, J.W.; Muir, D.C.G. Thermolysis of fluoropolymers as a potential source of halogenated organic acids in the environment. Nature. 2001, 412, 321–324. [Google Scholar] [CrossRef]
- Tian, Y.; Yao, Y.; Chang, S.; Zhao, Z.; Zhao, Y.Y.; Yuan, X.J.; Wu, F.C.; Sun, H.W. Occurrence and phase distribution of neutral and ionizable per- and polyfluoroalkyl substances (PFASs) in the atmosphere and plant leaves around landfills: A case study in Tianjin, China. Environ. Sci. Technol. 2018, 52, 1301–1310. [Google Scholar] [CrossRef]
- Martin, J.W.; Mabury, S.A.; Solomon, K.R.; Muir, D.C.G. Dietary accumulation of perfluorinated acids in juvenile rainbow trout (Oncorhynchusmykiss). Environ. Tox. Chem. 2003, 22, 189–195. [Google Scholar] [CrossRef]
- Martin, J.W.; Mabury, S.A.; Solomon, K.R.; Muir, D.C.G. Bioconcentration and tissue distribution of perfluorinated acids in rainbow trout (Oncorhynchusmykiss). Environ. Tox. Chem 2003, 22, 196–204. [Google Scholar] [CrossRef]
- U.S. Environmental Protection Agency. Preliminary risk assessment of the developmental toxicity associated with exposure to perfluorooctanoic acid and its salts. Office of Pollution Prevention and Toxics, RiskAssessment Division, 2003.
- Berthiaume, J.; Wallace, K.B. Perfluorooctanoate, perflourooctanesulfonate, and N-ethyl perfluorooctanesulfonamido ethanol; peroxisome proliferation and mitochondrial biogenesis. Toxicol. Lett. 2002, 129, 23–32. [Google Scholar] [CrossRef]
- Upham, B.L.; Deocampo, N.D.; Wurl, B.; Trosko, J.E. Inhibition of gap junctional intercellular communication by perfluorinated fatty acids is dependent on the chain length of the fluorinated tail. Int. J. Cancer. 1998, 78, 491–495. [Google Scholar] [CrossRef]
- Biegel, L.B.; Hurtt, M.E.; Frame, S.R.; Connor, J. O.; Cook, J.C. Mechanisms of extrahepatic tumor induction by peroxisome proliferators in male CD rats. Toxicol. Sci. 2001, 60, 44−55. [Google Scholar] [CrossRef]
- Jackson, D.A.; Young, C.J.; Hurley, M.D.; Wallington, T.J.; Mabury, S.A. Atmospheric degradation of perfluoro-2-methyl-3-pentanone: Photolysis, hydrolysis and hydration. Environ Sci. Technol. 2011, 45, 8030–8036. [Google Scholar] [CrossRef]
- Scott, B.F.; Spencer, C.; Mabury, S.A.; Muir, D.C.G. Environ. Poly and perfluorinated carboxylates in North American precipitation. Sci. Technol. 2006, 40, 7167–7174. [Google Scholar] [CrossRef]
- Young, C.J.; Hurley, M.l.D.; Wallington, T.J.; Mabury, S.A. Atmospheric chemistry of CF3CF2H and CF3CF2CF2CF2H: Kinetics and products of gas-phase reactions with Cl atoms and OH radicals, infrared spectra, and formation of perfluorocarboxylic acids. Chem. Phys. Lett. 2009, 473, 251–256. [Google Scholar] [CrossRef]
- Grubbs, G.S. II; Obenchain, D.A.; Frank, D.S.; Novick, S.E.; Cooke, S.A.; Serrato, A. III; Lin, W. A study of the monohydrate and dihydrate complexes of perfluoropropionic acid using Chirped-Pulse Fourier Transform Microwave (CP-FTMW) spectroscopy. J Phys Chem A. 2015, 119, 10475–80. [Google Scholar] [CrossRef]
- Crowder, G.A. Infrared and Raman spectra of pentafluoropropionic acid. J. Fluorine Chem. 1972, 1, 385–389. [Google Scholar] [CrossRef]
- Kagarise, R.E. Relation between the electronegativities of adjacent substitutents and the stretching frequency of the carbonyl group, J. Am. Chem. Soc. 1955, 77, 1377–1379. [Google Scholar] [CrossRef]
- Statz, G.; Lippert, E. Far infrared spectroscopic studies on carboxylic acid solutions. Ber. Bunsen-Ges 1967, 71, 673–679. [Google Scholar] [CrossRef]
- Badawi, H. M.; Al-Khaldi, M. A. A.; Al-Sunaidi, Z. H. A.; Al-Abbad, S. S. A. Conformational properties and vibrational analyses of monomeric pentafluoropropionic acid CF3CF2COOH and pentafluoropropionamide CF3CF2CONH2, Can. J. Anal. Sci. Spectrosc. 2007, 52, 252–269. [Google Scholar]
- Grubbs, G.S. II; Serrato, A. III; Obenchain, Cooke, S.A.; D.A.; Frank, D.S.; Novick, S.E.; Lin W. The rotational spectrum of perfluoropropionic acid. J. Mol. Spectrosc. 2012, 275, 1–4. [Google Scholar] [CrossRef]
- Husted, D.R.; Ahlbrecht, A.H. The chemistry of the perfluoro acids and their derivatives. V. Perfluoropropionic acid. J. Am. Chem. Soc. 1953, 75, 1605–1608. [Google Scholar] [CrossRef]
- Collins, M.F.; Haywood, B.C. Vibration spectra of carboxylic acids by neutron spectroscopy, J. Chem. Phys. 1970, 52, 5740–5745. [Google Scholar] [CrossRef]
- Rontu, N.; Vaida, V. Vibrational spectroscopy of perfluorocarboxylic acids from the infrared to the visible regions, J. Phys. Chem. B 2008, 112, 276–282. [Google Scholar] [CrossRef]
- Rontu, N.; Vaida, V. Vibrational spectroscopy of perfluoropropionic acid in the region between 1000 and 11000 cm-1, J. Mol. Spectros. 2006, 237, 19–26. [Google Scholar] [CrossRef]
- Cho, S.; Remucal, C.K. ; We,i H. Common and distinctive Raman spectral features for the identification and differentiation of per- and polyfluoroalkyl substances. ACS EST Water 2025, 5, 300–309. [Google Scholar] [CrossRef]
- Lee, E.; Featherstone, J.; Martens, J.; McMahon, T.B. ; Hopkins; W.S. Fluorinated propionic acids unmasked: Puzzling fragmentation phenomena of the deprotonated species. J. Phys. Chem. Lett. 2024, 15, 3029–3036. [Google Scholar] [CrossRef]
- Berrueta Martínez, Y.; Bava, Y.B.; Cavasso Filho, R.L.; Erben, M.F.; Romano, R.M.; Della Védova, C.O. Valence and inner electronic excitation, ionization, and fragmentation of perfluoropropionic acid, J. Phys. Chem. A 2018, 122, 9842–9850. [Google Scholar] [CrossRef]
- Litvanová, K.; Klemetsrud, B.; Xiao, F.; Kubátová, A. Investigation of real-time gaseous thermal decomposition products of representative per- and polyfluoroalkyl substances (PFAS), J. Am. Soc. Mass Spectrom. 2025, 36, 108–118. [Google Scholar] [CrossRef]
- Wiens, J.P. ; Miller; T.H., Ard, S.G.; Viggiano, A.A.; Shuman, N.S. Elementary reactions leading to perfluoroalkyl substance degradation in an Ar+/e− Plasma. J. Phys. Chem. A 2022, 126, 9076–9086. [Google Scholar] [CrossRef]
- Wang, W.; Song, M.; Abusallout, I.; Hanigan, D. Thermal decomposition of two gaseous perfluorocarboxylic acids: Products and mechanisms. Environ. Sci. Technol. 2023, 57, 6179–6187. [Google Scholar] [CrossRef]
- Melin, T.R.L.; Harell, P. ; Ali, B; Loganathan, N.; Wilson A.K. Thermochemistry of per- and polyfluoroalkyl substances. J Comput Chem. 2023, 44, 570–580. [Google Scholar] [CrossRef]
- Medeiros F.S., Jr.; Jr. ; Mota C.; Chaudhuri, P. Perfluoropropionic acid-driven nucleation of atmospheric molecules under ambient conditions. J. Phys. Chem. A 2022, 126, 8449–8458. [Google Scholar] [CrossRef]
- Sablinskas, V.; Pucetaite, M.; Ceponkus, J.; Kimtys, L. Structure of propanoic acid dimers as studied by means of MIR and FIR spectroscopy. J. Mol. Struct. 2010, 976, 263–269. [Google Scholar] [CrossRef]
- Alvarez, S. A cartography of the van der Waals territories. Dalton Trans. 2013, 42, 8617–8636. [Google Scholar] [CrossRef]
- Frisch, M.J.; Trucks, G.W.; Schlegel, H.B.; Scuseria, G.E.; Robb, M.A.; Cheeseman, J.R.; Montgomery, J.A. Jr.; Vreven, T.; Kudin, K.N.; Burant, J.C.; Millam, J.M.; Iyengar, S.S.; et al. Gaussian 03, rev C.02; Gaussian, Inc., Wallingford CT, 2004.
- Parr, R.G.; Yang, W. Density-Functional Theory of atoms and molecules; Oxford University Press: USA, 1989. [Google Scholar]
- Møller, C.; Plesset, M.S. Note on an approximation treatment for many-electron systems, Phys. Rev. 1934, 46, 618–622. [Google Scholar]
- Foster, J.P; Weinhold, F. Natural hybrid orbitals. J. Am. Chem. Soc. 1980, 102, 7211–7218. [Google Scholar] [CrossRef]
- Glendening, E.D.; Badenhoop, J.K.; Reed, A.E.; Carpenter, J.E; . Bohmann, J.A.; Morales, C.M.; Weinhold, F. NBO 5.G, Theoretical Chemistry Institute, University of Wisconsin, Madison, WI 2004.
- Almond, M. J.; Downs, A. J. Spectroscopy of matrix isolated species. Adv. Spectrosc. 1989, 17, 1–505. [Google Scholar] [CrossRef]
- Dunkin, I.R. Matrix-Isolation Techniques: A Practical Approach; Oxford University Press: New York, 1998. [Google Scholar]
- Perutz, R. N.; Turner, J. J. Pulsed matrix isolation. A comparative study. J. Chem. Soc., Faraday Trans. 2. 1973, 69, 452–461. [Google Scholar] [CrossRef]
- Dolomanov, O.V.; Bourhis, L.J.; Gildea, R.J.; Howard, J.A.K.; Puschmann, H. OLEX2: a complete structure solution, refinement and analysis program. J. Appl. Cryst. 2009, 42, 339–341. [Google Scholar] [CrossRef]
- Sheldrick, G. M. A short history of SHELX. Acta Cryst. 2008, A64, 112–122. [Google Scholar] [CrossRef] [PubMed]
- Bourhis, L.J. , Dolomanov, O.V., Gildea, R.J., Howard, J.A.K., Puschmann, H. The anatomy of a comprehensive constrained, restrained refinement program for the modern computing environment - Olex2 dissected. Acta Crystallogr. 2015, A71, 59–75. [Google Scholar]
- Kleemiss, F. , Dolomanov, O.V., Bodensteiner, M., Peyerimhoff, N., Midgley, L., Bourhis, L.J., Genoni, A., Malaspina, L.A., Jayatilaka, D., Spencer, J.L., White, F., Grundkoetter-Stock, B., Steinhauer, S., Lentz, D., Puschmann, H., Grabowsky, S, Accurate crystal structures and chemical properties from NoSpherA2. Chem. Sci., 2021, 12, 1675–1692. [Google Scholar]
- Hogg, P.J. Trends Biochem Sci. 2003, 28, 210–214.
- Hilal, R.; El-Aaser, A.M. A comparative quantum chemical study of methyl acetate and S-methyl thioacetate Toward an understanding of the biochemical reactivity of esters of coenzyme A. Biophys. Chem. 1985, 2, 145–150. [Google Scholar] [CrossRef]
- Beck, I.T.; Mitchell, E.C.; Webb Hill, A.; Turney, J.M; Rotavera, B.; Schaefer III, H.F. Evaluating the importance of conformers for understanding the vacuum-ultraviolet spectra of oxiranes: Experiment and theory, J. Phys. Chem. A 2024, 128, 10906–10920. [Google Scholar] [CrossRef]
Figure 1.
Optimized structures (MP2/6-311+G(D)) of the gauche−syn, syn−syn, and gauche−anti conformers of CF3CF2C(O)OH.
Figure 1.
Optimized structures (MP2/6-311+G(D)) of the gauche−syn, syn−syn, and gauche−anti conformers of CF3CF2C(O)OH.
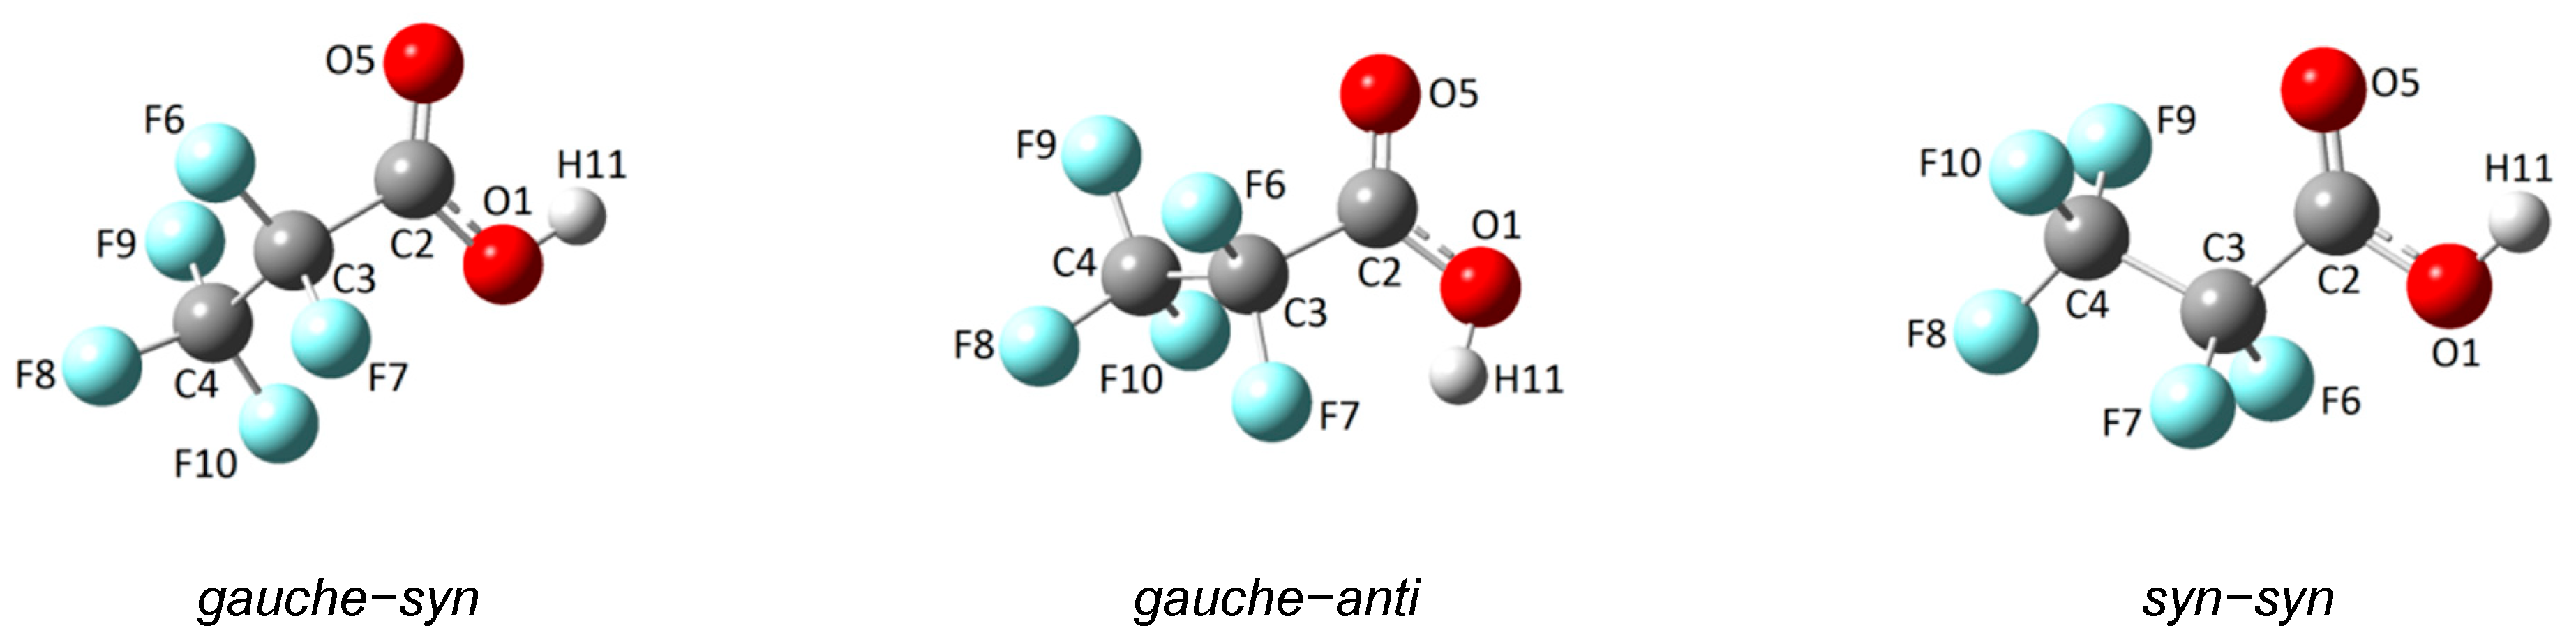
Figure 2.
Optimized structures (MP2/6-311+G(D)) of the dimer of CF3CF2C(O)OH.
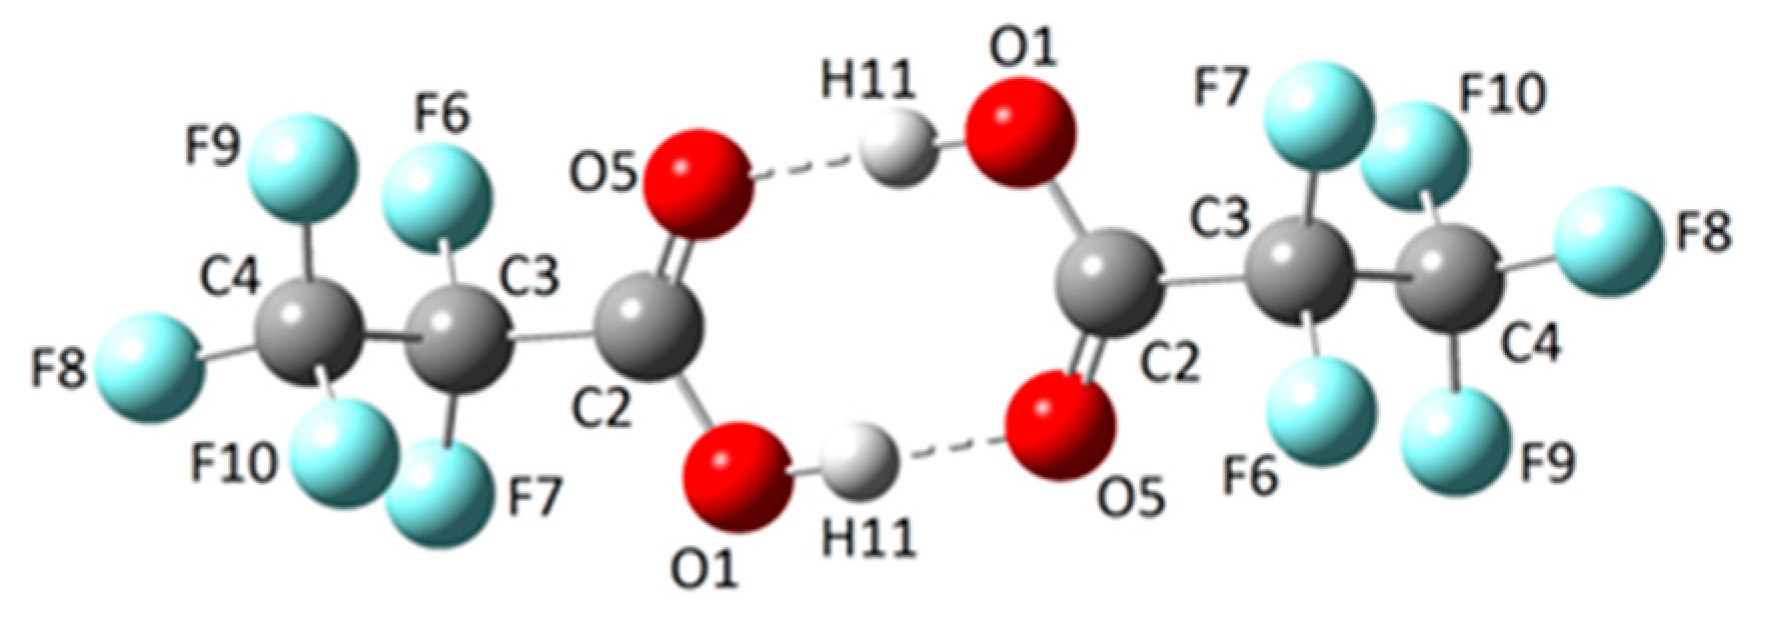
Figure 3.
Gas-phase FTIR spectra of CF3CF2C(O)OH (optical path 10 cm, resolution 0.5 cm−¹, pressure: 40 torr (top, green-trace) and 8 torr (middle, blue-trace) and Ar-matrix FTIR spectrum (bottom, red-trace) in CF3CF2C(O)OH:Ar 1:500 ration and resolution 0.5 cm−¹, in the 3740-400 cm⁻¹ wavenumber region. Some of the bands of monomer and dimer species are indicated by M and D, respectively.
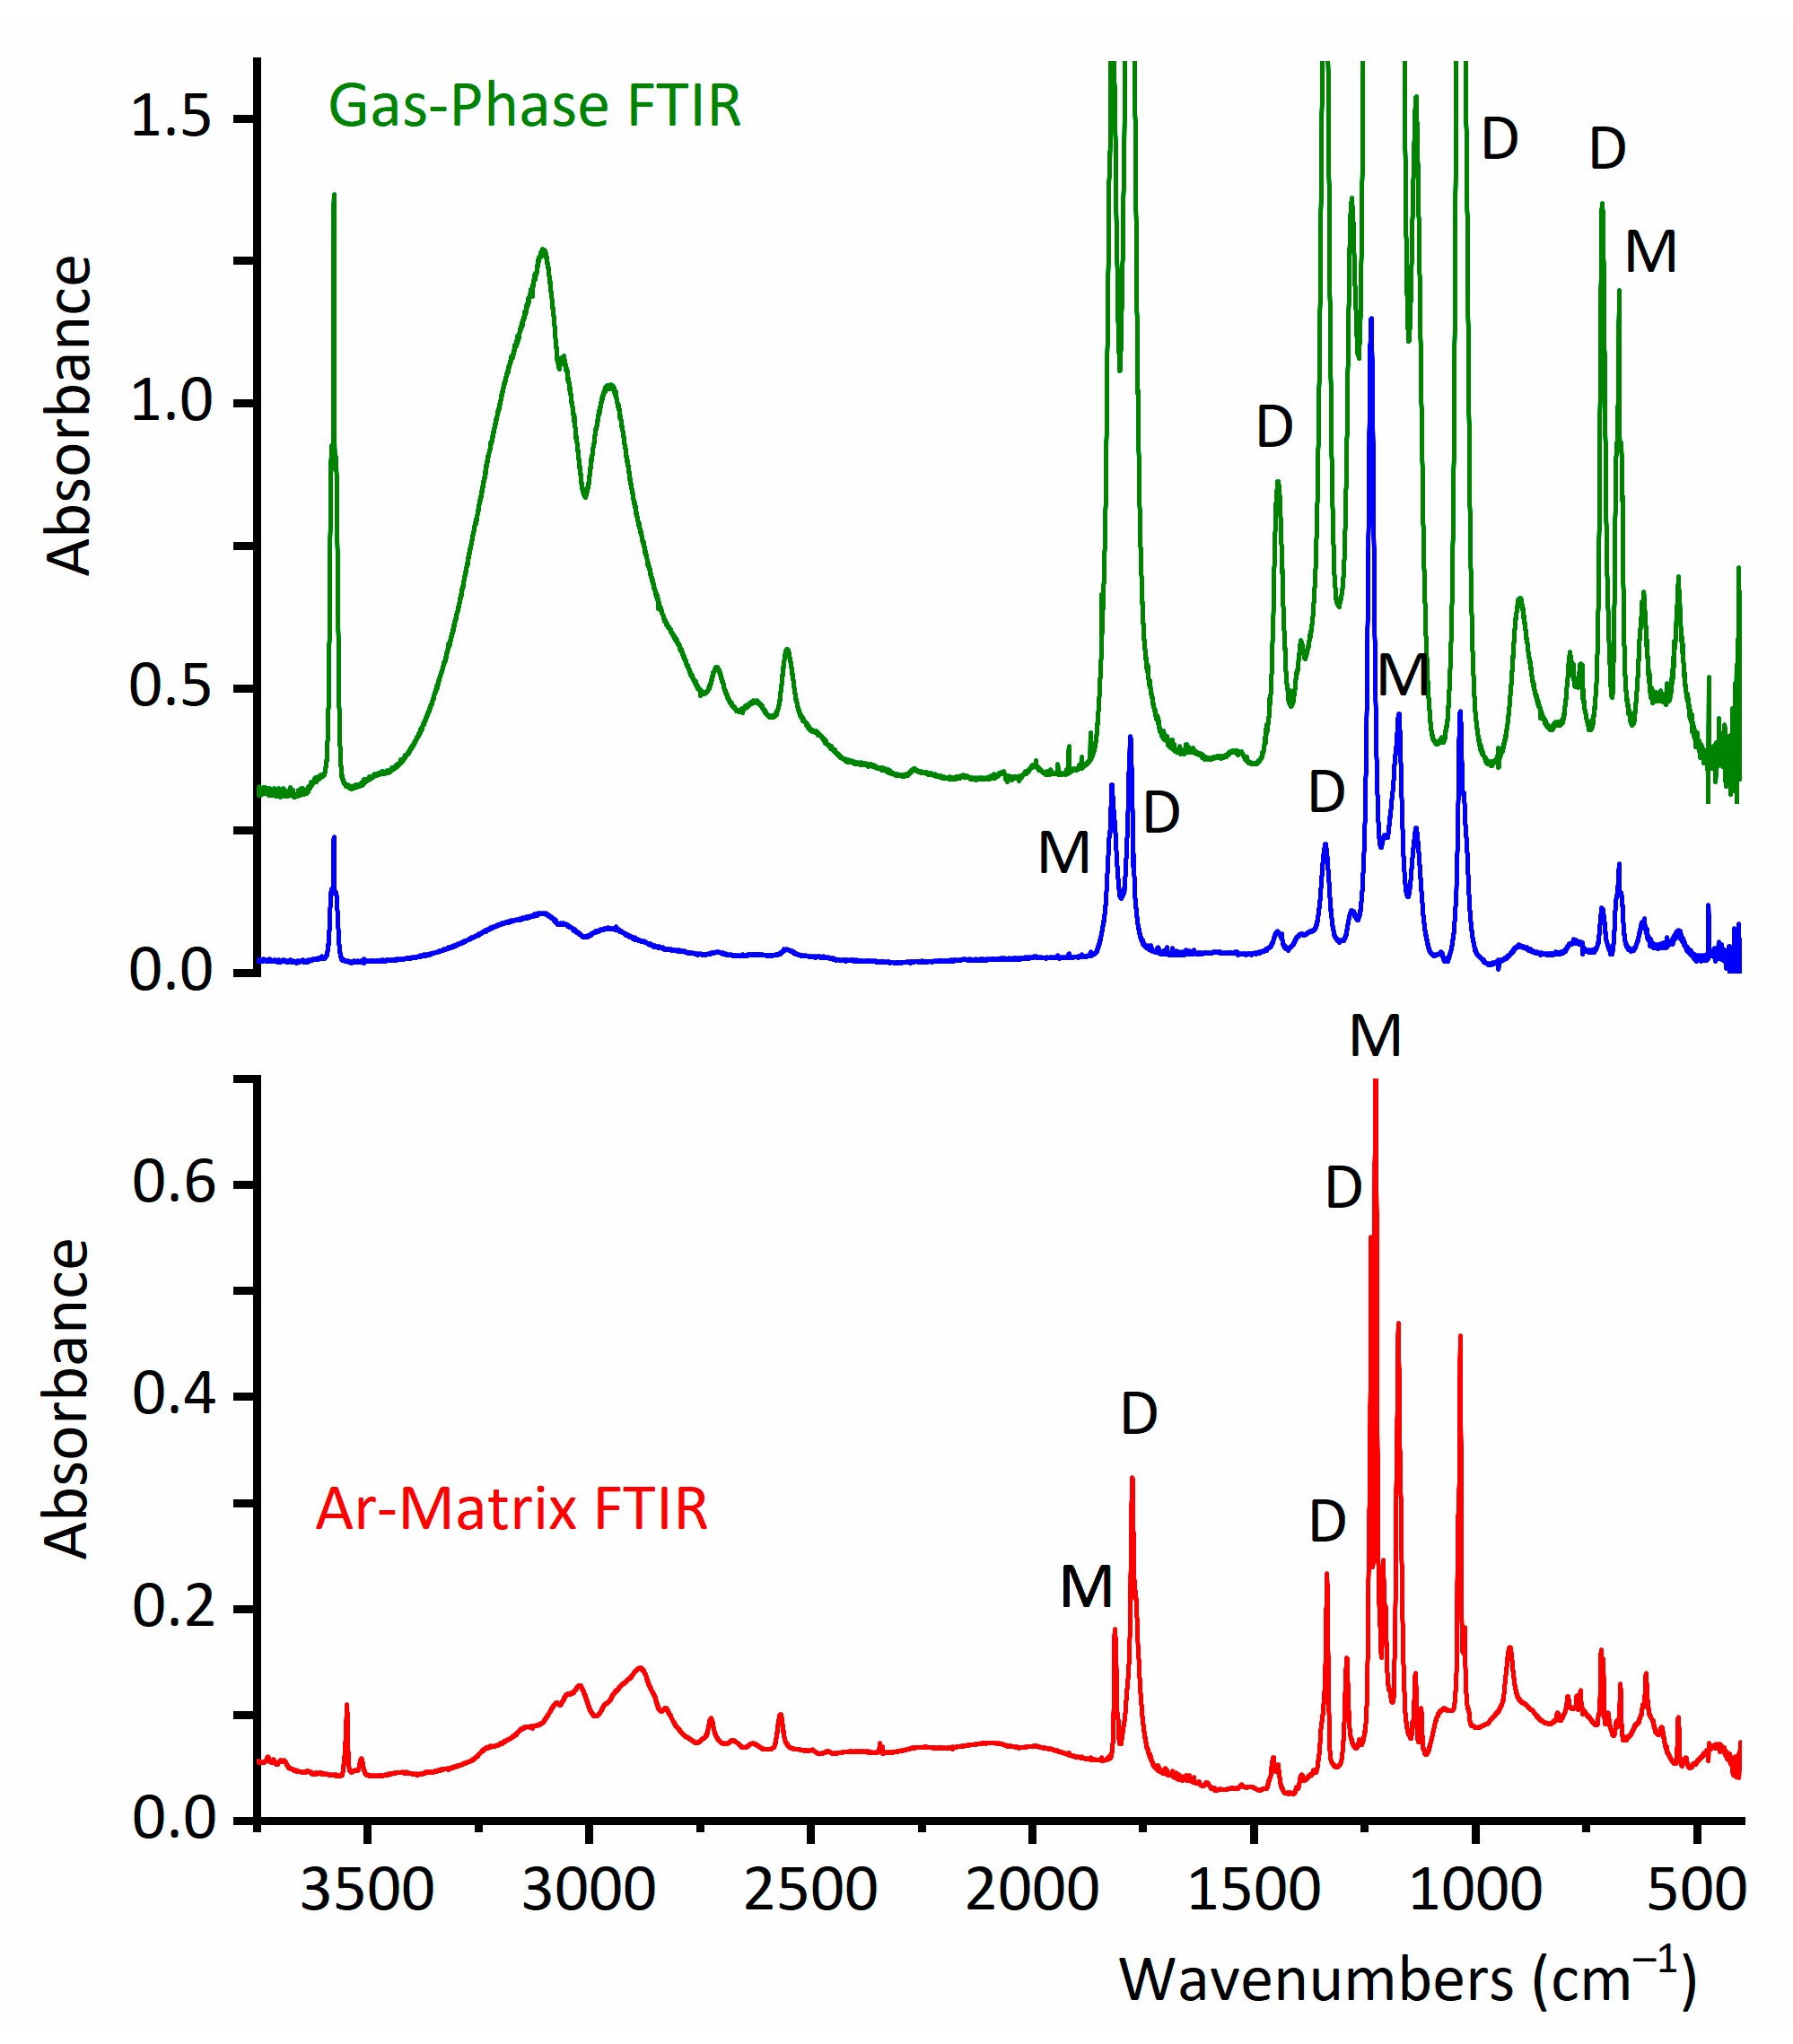
Figure 4.
Selected regions of the gas-phase FTIR spectrum of CF3CF2C(O)OH (optical path 10 cm, resolution 0.5 cm−¹, pressure: 8 torr (top, blue-trace) and Ar-matrix FTIR spectrum (bottom, red-trace) in CF3CF2C(O)OH:Ar 1:500 ratio and resolution 0.5 cm−¹. Some of the bands of monomer and dimer species are indicated by M and D, respectively.
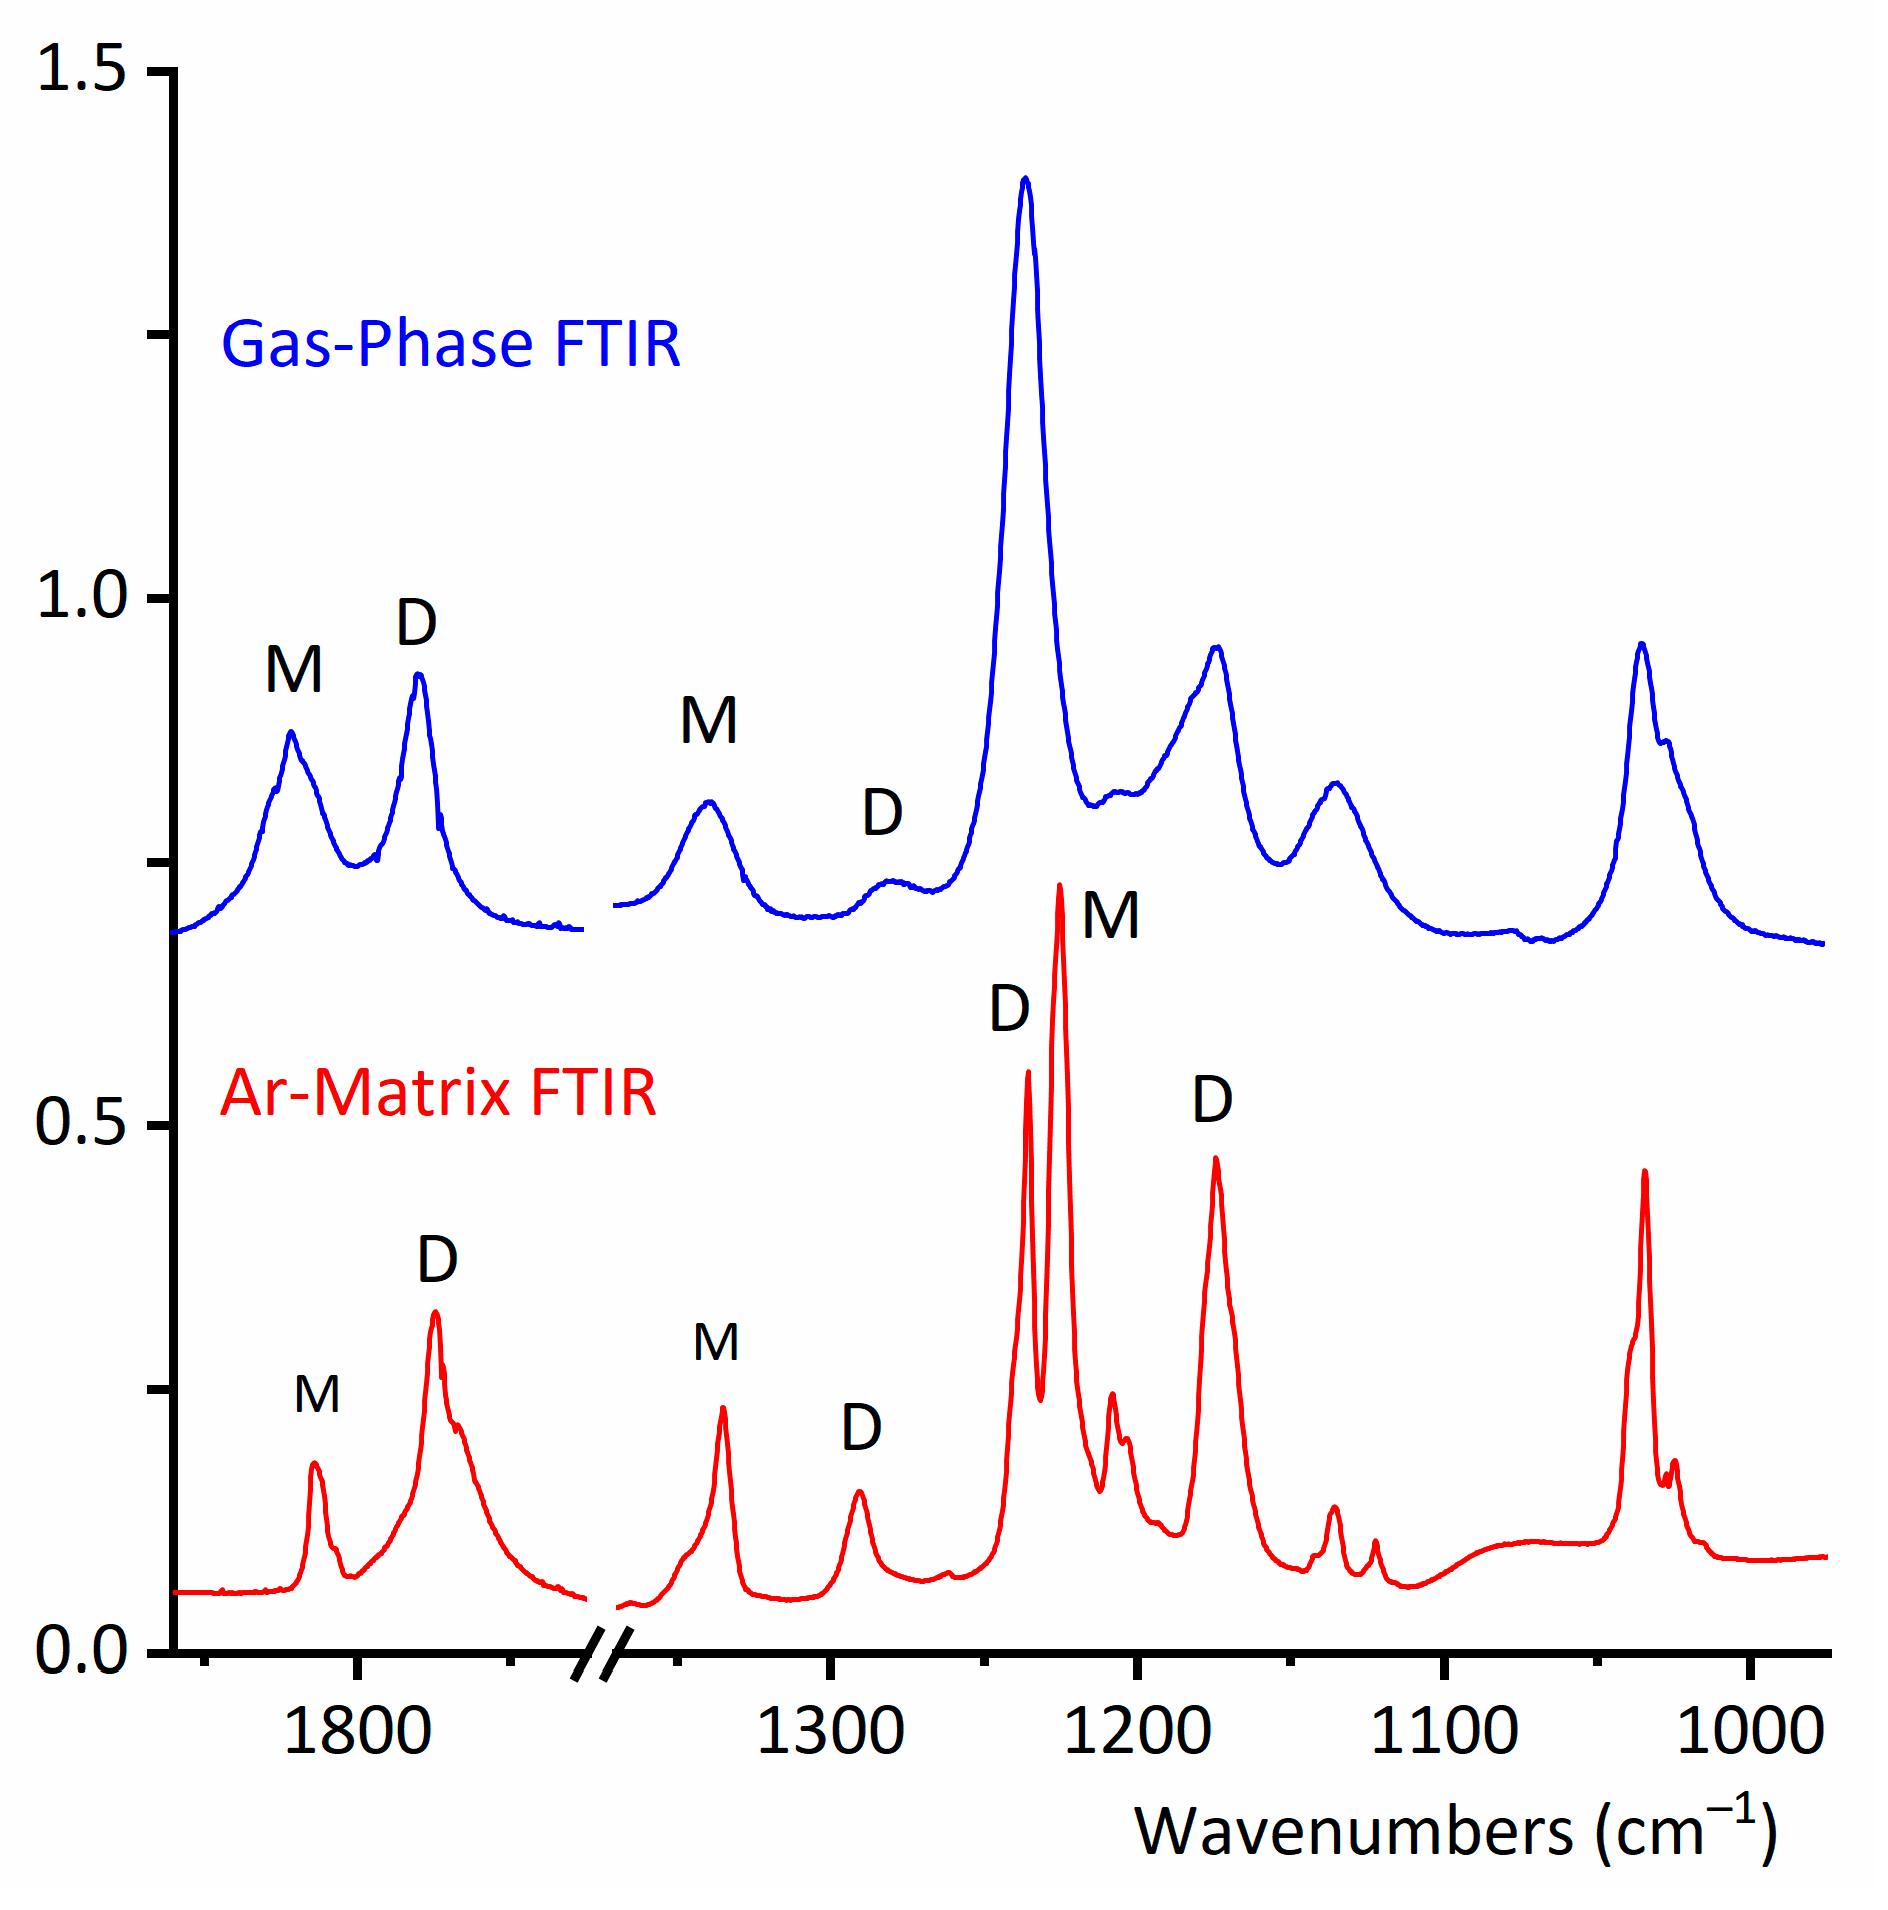
Figure 5.
Gas-phase FTIR spectra of CF₃CF₂C(O)OH (optical path: 10 cm, resolution: 0.5 cm⁻¹) recorded from the liquid phase at different temperatures.
Figure 5.
Gas-phase FTIR spectra of CF₃CF₂C(O)OH (optical path: 10 cm, resolution: 0.5 cm⁻¹) recorded from the liquid phase at different temperatures.

Figure 6.
Relative percentage areas of the IR bands at 714 cm⁻¹, arising from the bending vibration of the O−C=O group in the dimeric CF₃CF₂C(O)OH species, and at 676 cm⁻¹, corresponding to the same mode in the monomeric acid in its gauche-syn conformation, as a function of the liquid temperature in equilibrium with the vapor phase.
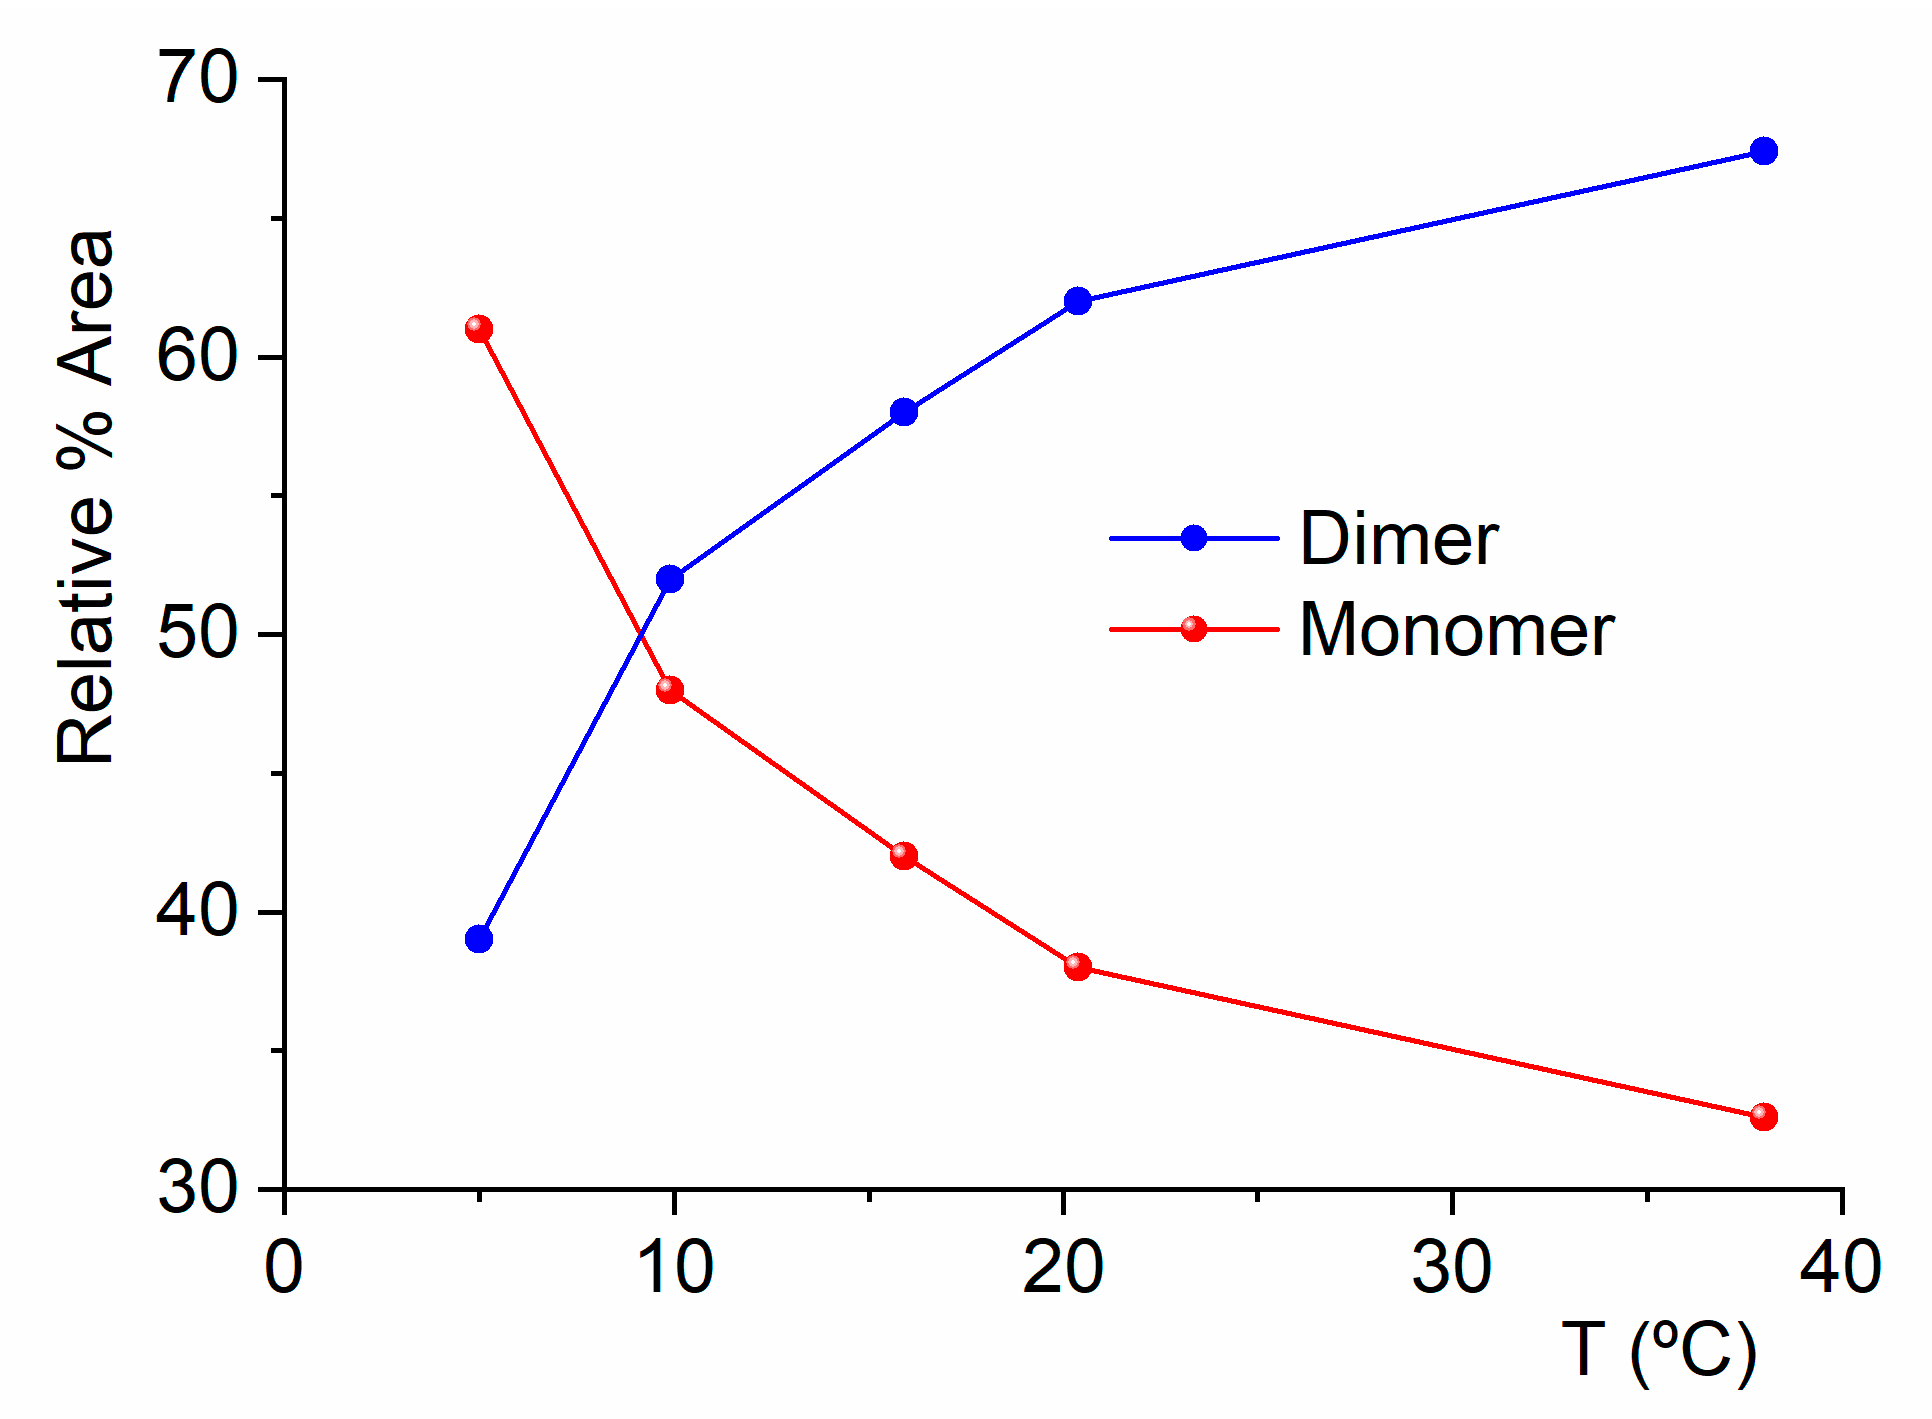
Figure 7.
Ar-matrix FTIR spectra of CF3CF2C(O)OH (resolution 0.5 cm−¹, CF3CF2C(O)OH:Ar 1:500 ratio) between 1840 and 1800 cm⁻¹ taken immediately after deposition (bottom, red-trace) and after 60 min of broad-band UV-vis irradiation (top, blue-trace).
Figure 7.
Ar-matrix FTIR spectra of CF3CF2C(O)OH (resolution 0.5 cm−¹, CF3CF2C(O)OH:Ar 1:500 ratio) between 1840 and 1800 cm⁻¹ taken immediately after deposition (bottom, red-trace) and after 60 min of broad-band UV-vis irradiation (top, blue-trace).
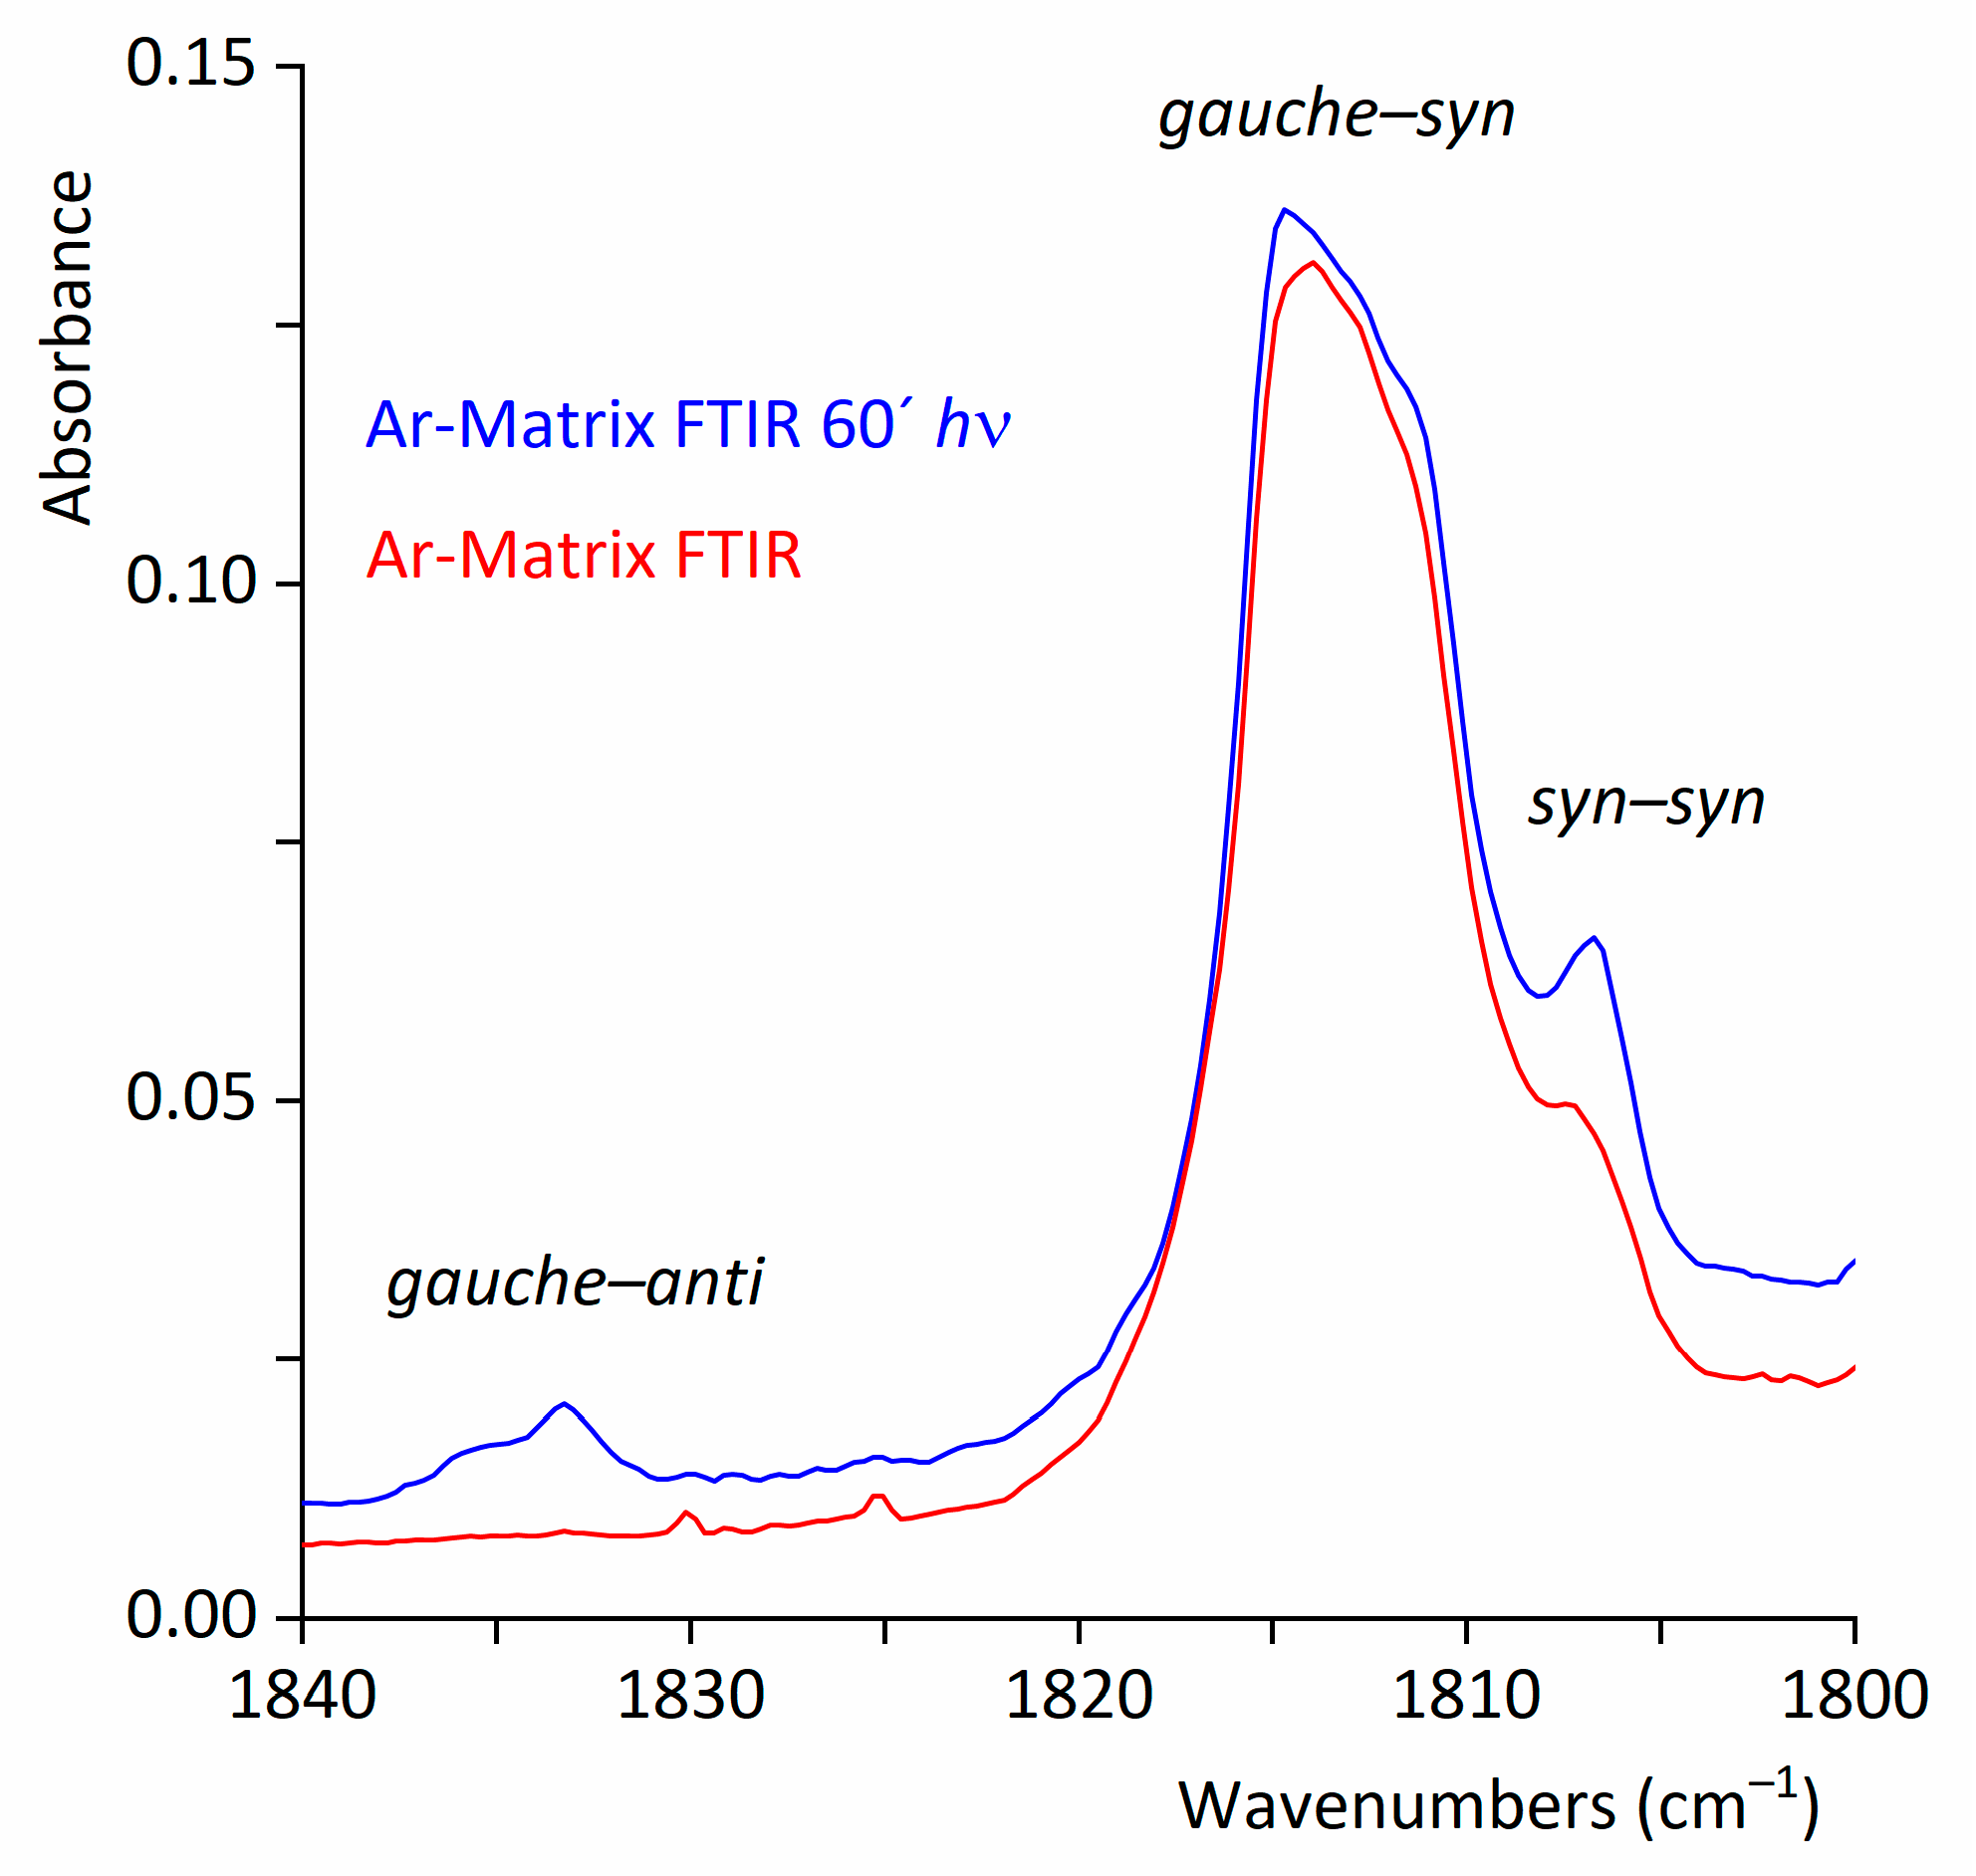
Figure 8.
Absorbances of the IR bands of the CF₃CF₂C(O)OH:Ar (1:500) matrix for the gauche-syn (top left) and syn-syn (top right) conformers, as well as for the dimer (bottom), as a function of irradiation time.
Figure 8.
Absorbances of the IR bands of the CF₃CF₂C(O)OH:Ar (1:500) matrix for the gauche-syn (top left) and syn-syn (top right) conformers, as well as for the dimer (bottom), as a function of irradiation time.
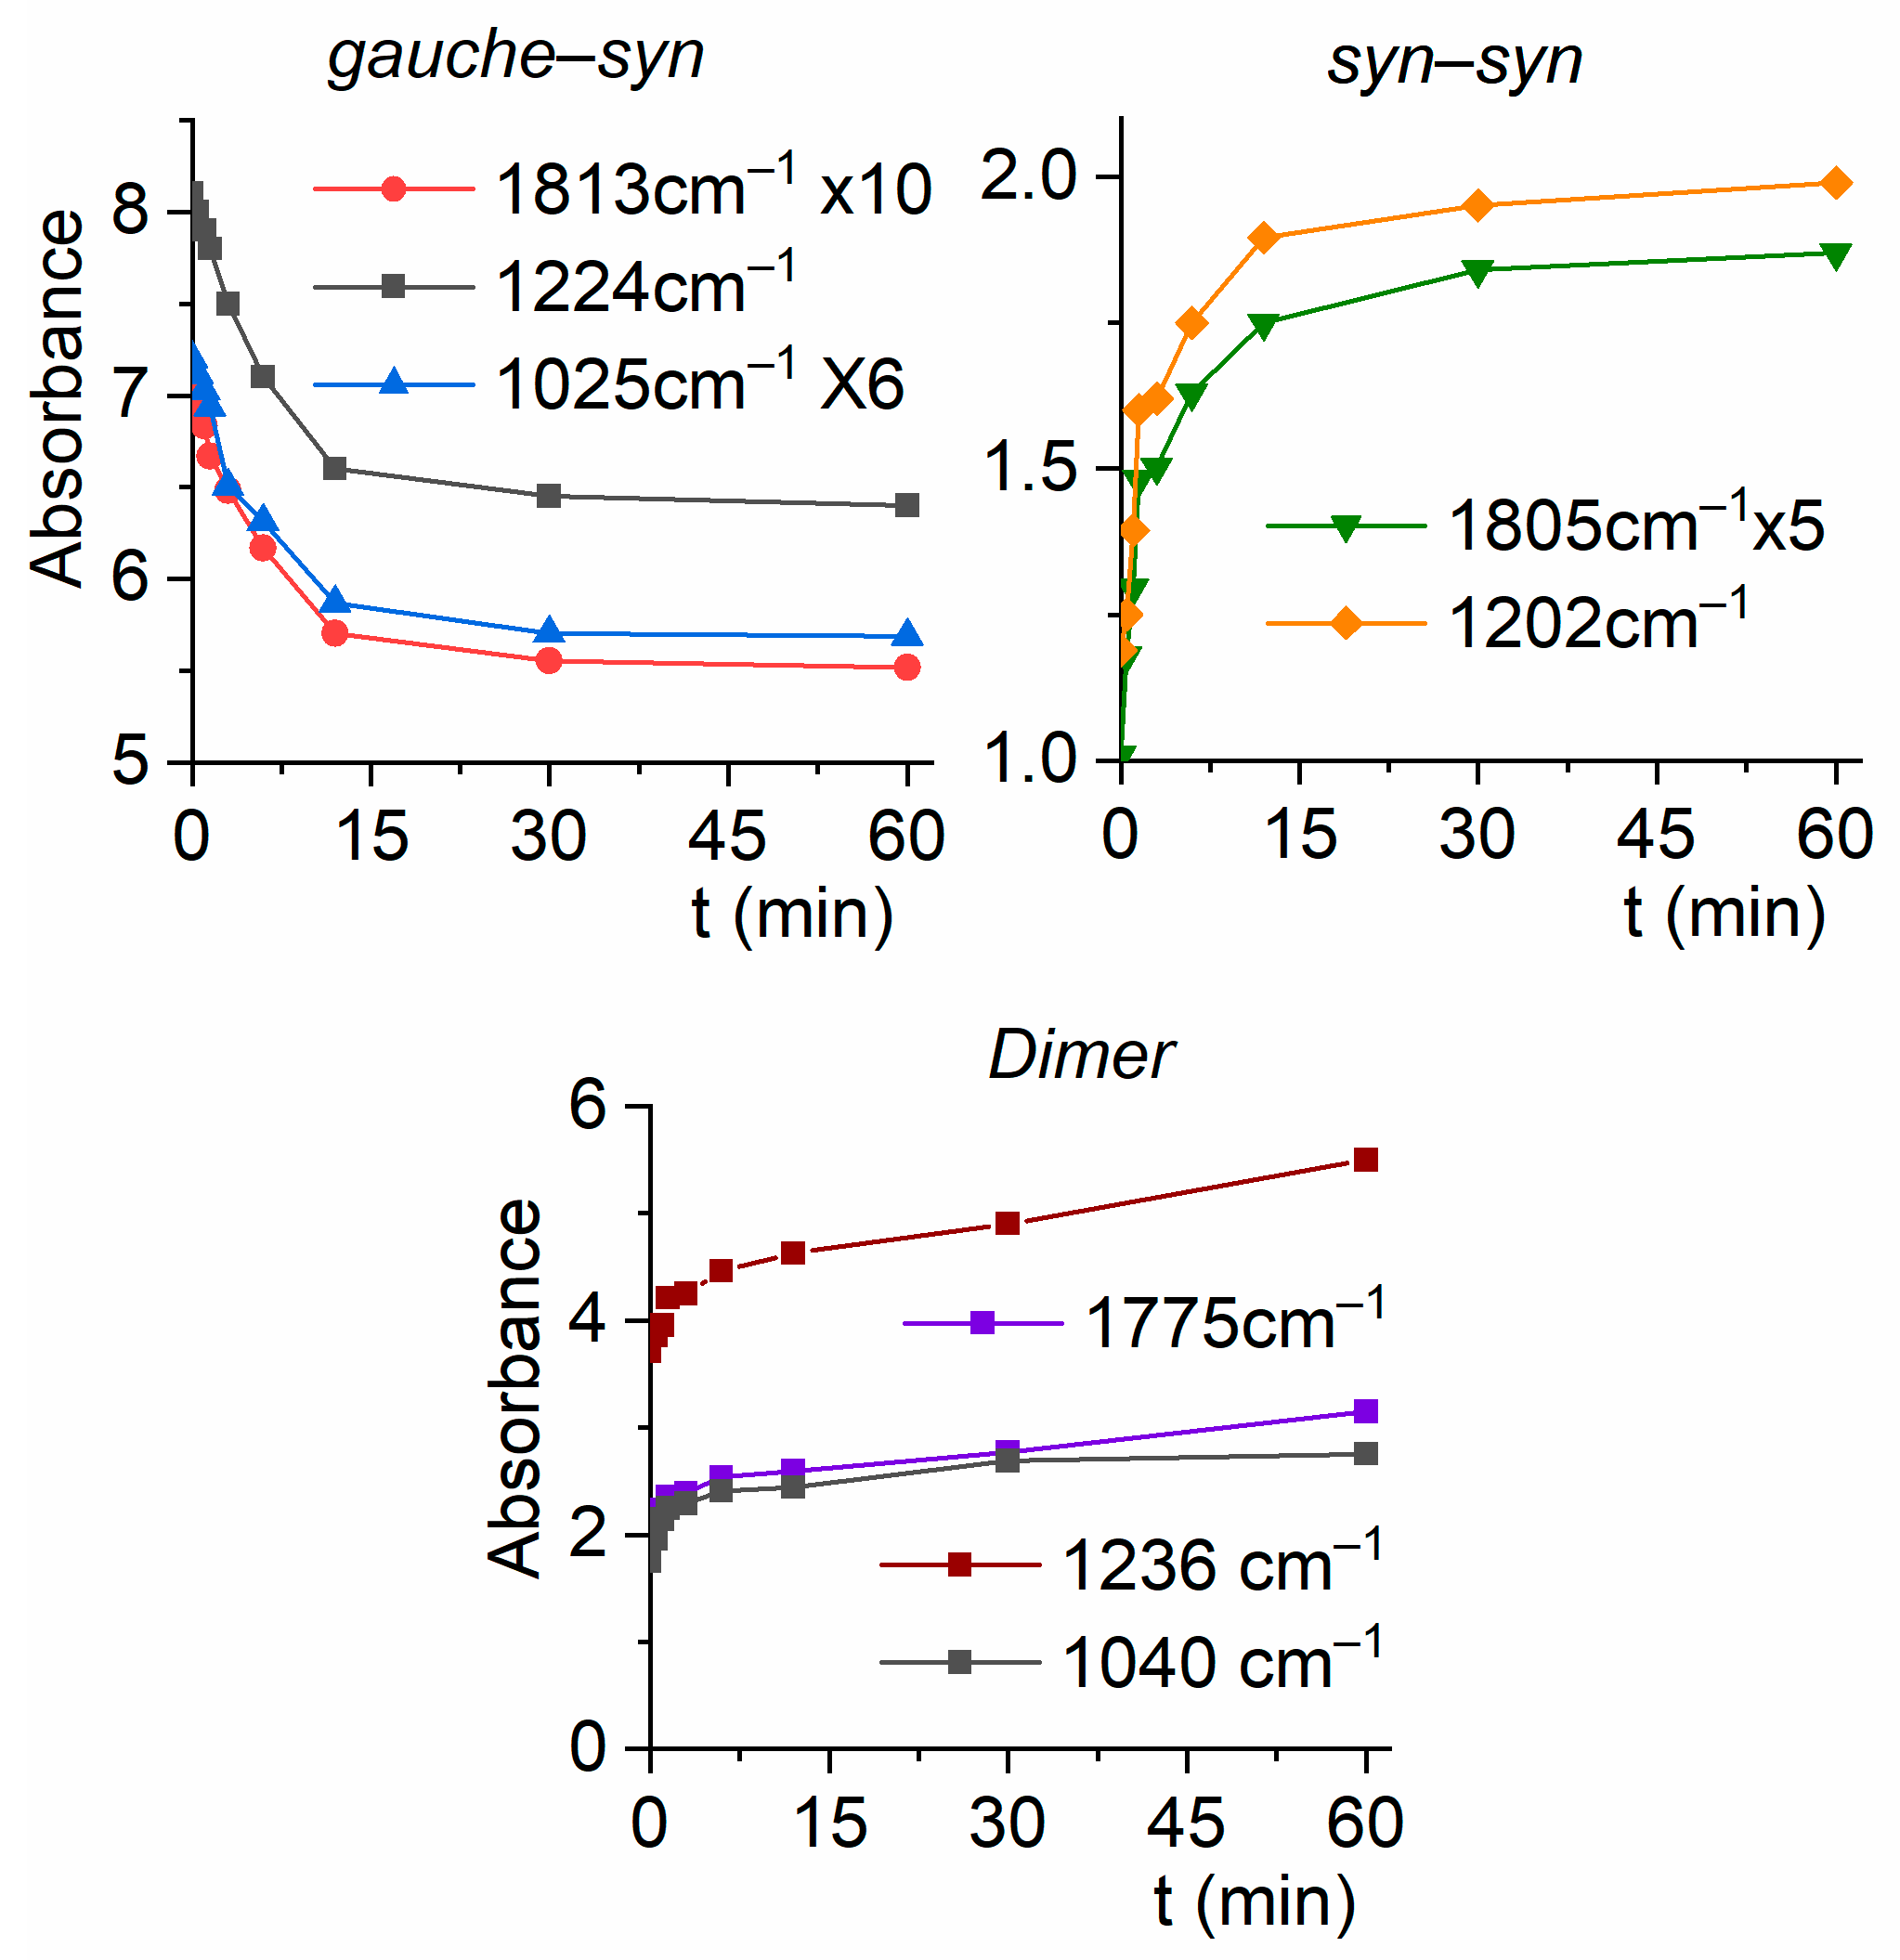
Figure 9.
Left: Structure of CF3CF2COOH in the solid state. Thermal ellipsoids are shown at a probability level of 50%. Right: Dimer of CF3CF2COOH, symmetry code used: -X,1-Y,-Z.
Figure 9.
Left: Structure of CF3CF2COOH in the solid state. Thermal ellipsoids are shown at a probability level of 50%. Right: Dimer of CF3CF2COOH, symmetry code used: -X,1-Y,-Z.
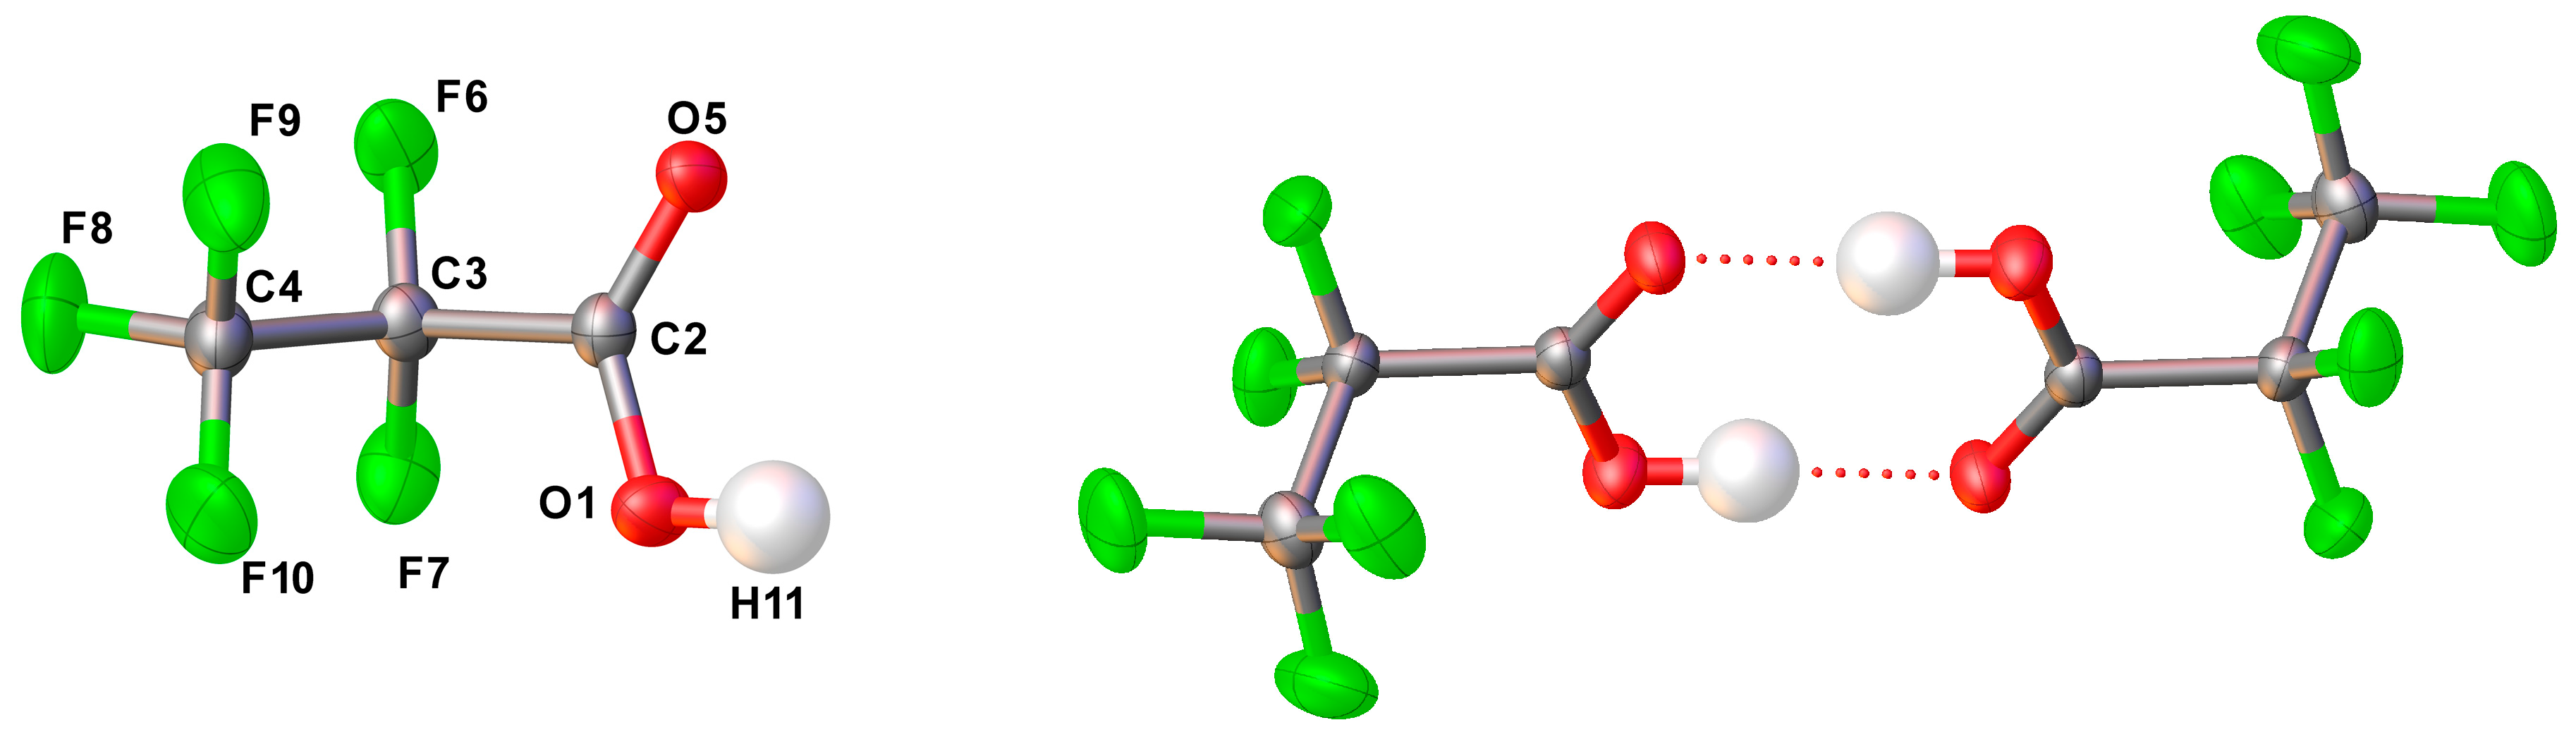

Table 1.
Energy and Gibbs free energy differences among gauche−syn, gauche−anti, and syn−syn conformers of CF3CF2C(O)OH, dihedral angles φ(C−C−C=O)) and φ(O−C−O−H), and conformational population χ calculated at 298 K using the MP2/6-311+G(D) approximation.
Table 1.
Energy and Gibbs free energy differences among gauche−syn, gauche−anti, and syn−syn conformers of CF3CF2C(O)OH, dihedral angles φ(C−C−C=O)) and φ(O−C−O−H), and conformational population χ calculated at 298 K using the MP2/6-311+G(D) approximation.
| Conformer | φ(C−C−C=O) | φ(O−C−O−H) | ΔE (kcal/mol) | ΔG (kcal/mol) | χ (%) |
|---|---|---|---|---|---|
| gauche−syn | 101.2 | −0.3 | 0.00 | 0.00 | 85.1 |
| syn−syn | −0.1 | 0.0 | 0.43 | 0.62 | 14.7 |
| gauche−anti | 82.3 | 176.6 | 3.37 | 3.64 | 0.2 |
Table 2.
Experimental parameters obtained by X-ray diffraction and computed parameters (distances in Å, angles in degrees) corresponding to the gauche−syn-conformer of CF3CF2C(O)OH.
Table 2.
Experimental parameters obtained by X-ray diffraction and computed parameters (distances in Å, angles in degrees) corresponding to the gauche−syn-conformer of CF3CF2C(O)OH.
| Parameter | X-ray diffraction | MP2/6-311+G(D) |
|---|---|---|
| r F6−C3 | 1.338(2) | 1.344 |
| r F7−C3 | 1.336(2) | 1.351 |
| r F9−C4 | 1.319(2) | 1.336 |
| r F8−C4 | 1.317(2) | 1.330 |
| r F10−C4 | 1.304(2) | 1.332 |
| r O5=C2 | 1.215(2) | 1.203 |
| r O1−H11 | 0.97(3) | 0.971 |
| r O1−C2 | 1.286(2) | 1.337 |
| r C2−C3 | 1.545(2) | 1.542 |
| r C4−C3 | 1.542(2) | 1.542 |
| α H11−O1−C2 | 112.6(17) | 108.3 |
| α O5−C2−O1 | 127.9(2) | 126.9 |
| α O5−C2−C3 | 120.0(2) | 123.0 |
| α O1−C2−C3 | 112.0(2) | 110.0 |
| α F9−C4−F8 | 108.9(2) | 109.0 |
| α F9−C4−F10 | 108.8(2) | 108.8 |
| α F9−C4−C3 | 109.4(2) | 109.4 |
| α F8−C4−F10 | 109.1(2) | 108.9 |
| α F8−C4−C3 | 110.1(2) | 110.1 |
| α F10−C4−C3 | 110.6(2) | 110.5 |
| α F6−C3−C7 | 108.7(2) | 108.9 |
| α F6−C3−C2 | 109.0(2) | 108.8 |
| α F6−C3−C4 | 108.1(2) | 107.7 |
| α F7−C3−C2 | 110.5(2) | 110.6 |
| α F7−C3−C4 | 107.9(2) | 108.0 |
| α C2−C3−C4 | 112.6(2) | 112.8 |
| τ H11−O1−C2−O5 | −0.5(18) | −0.3 |
| τ H11−O1−C2−C3 | −178.2(17) | 178.8 |
| τ O5−C2−C3−F6 | 21.2(2) | −18.2 |
| τ O5−C2−C3−F7 | 140.6(2) | −137.8 |
| τ O5−C2−C3−C4 | −98.7(2) | 101.2 |
| τ O1−C2−C3−F6 | −160.9(2) | 162.6 |
| τ O1−C2−C3−F7 | −41.5(2) | 43.1 |
| τ O1−C2−C3−C4 | 79.2(2) | −78.0 |
| τ F9−C4−C3−F6 | −65.5(2) | 65.1 |
| τ F9−C4−C3−F7 | 177.2(2) | −177.4 |
| τ F9−C4−C3−C2 | 54.9(2) | −54.9 |
| τ F8−C4−C3−F6 | 54.1(2) | −54.7 |
| τ F8−C4−C3−F7 | −63.3(2) | 62.8 |
| τ F8−C4−C3−C2 | 174.5(2) | −174.7 |
| τ F10−C4−C3−F6 | 174.7(2) | −175.0 |
| τ F10−C4−C3−F7 | 57.3(2) | −57.6 |
| F10−C4−C3−C2 | −64.9(2) | 65.0 |
Disclaimer/Publisher’s Note: The statements, opinions and data contained in all publications are solely those of the individual author(s) and contributor(s) and not of MDPI and/or the editor(s). MDPI and/or the editor(s) disclaim responsibility for any injury to people or property resulting from any ideas, methods, instructions or products referred to in the content. |
© 2025 by the authors. Licensee MDPI, Basel, Switzerland. This article is an open access article distributed under the terms and conditions of the Creative Commons Attribution (CC BY) license (http://creativecommons.org/licenses/by/4.0/).
Copyright: This open access article is published under a Creative Commons CC BY 4.0 license, which permit the free download, distribution, and reuse, provided that the author and preprint are cited in any reuse.


