
Submitted:
18 March 2025
Posted:
19 March 2025
You are already at the latest version
Abstract
Maritime safety is a critical concern for the transport sector and remains a key challenge for the international shipping industry. Recognizing that maritime accidents pose significant risks to both safety and operational efficiency; this study explores the application of Big Data analysis techniques to understand the factors influencing Maritime Transport Accidents (MTA). Specifically, using extensive datasets derived from vessel performance measurements, environmental conditions, and accident reports, it seeks to identify the key intrinsic and extrinsic factors contributing to maritime accidents. The research examines more than 90 thousand incidents for the period 2014–2022.
Keywords:
Maritime Transportation
; Maritime Accidents
; Big Data Analysis
; ANOVA
; Cross-Tabulation Analysis
; Safety Measures
; Environmental Conditions
1. Introduction
In recent decades, maritime transport has attracted much attention due to its critical role in the global supply chain and the persistent safety challenges it faces. Despite technological advances in shipping and improved safety protocols, maritime accidents continue to cause significant economic, environmental, and human costs. These incidents, which usually result from a mixture of operational failures and adverse environmental conditions, require an advanced approach to risk analysis and accident prevention (Wu et al., 2021; Endrina et al., 2019).
Operational factors, such as vessel size, deadweight and speed, are determinants of safety at sea. Larger vessels, which inherently involve more complex operations and greater momentum, are more susceptible to serious accidents (Akten, 2006; Talley et al., 2005; Jin and Kite-Powell, 2008). Research highlights the importance of vessel characteristics, including size and deadweight, for assessing operational risks and predicting accident probabilities (Chang and Park, 2019). In addition, vessel speed is emerging as an important factor in predicting accident probability, especially under adverse weather conditions (Al-Behadili et al., 2023; Bao et al., 2020).
It is also a common finding of many scholars that environmental conditions actually have a significant impact on maritime safety. Strong winds, strong waves and limited visibility significantly increase the risk of maritime accidents. Previous studies have highlighted the impact of these environmental factors on maritime operations (see, among others, Acejo et al., 2018; Nedelcu and Rusu, 2022; Heij and Knapp, 2015; Brandt et al., 2024). Also, a number of other studies show that increased winds and significant waves are associated with higher accident rates, while highlighting the need for real-time monitoring and adaptive navigation strategies to mitigate these risks (Özdemir and Güneroğlu, 2015; Pilatis et al., 2024; Bye and Aalberg, 2018; Ventikos, Stavrou and Andritsopoulos, 2017).
A more modern approach to maritime safety research is the integration of big data analytics through which new dimensions have been introduced to understand and mitigate accident risks. Big data techniques enable the processing and analysis of extensive datasets from multiple sources, revealing patterns and correlations that traditional methods may overlook. This integrated approach incorporates operational variables, environmental conditions and vessel characteristics to provide a holistic view of factors affecting marine safety (Talley et al., 2008; Toffoli et al., 2005, Sadaharu, 2015; Jović and Edvard, 2019; Liu et al., 2023; Zhang et al., 2017; Ma et al., 2024).
Recent research has demonstrated the effectiveness of big data in enhancing forecasting models and improving decision-making processes. For example, the use of AIS data to analyze ship movements and environmental conditions has identified critical predictors of grounding and collision risks (Bao et al., 2020; Feng, 2019). In addition, machine learning algorithms have significantly improved the accuracy of accident risk estimates, offering more effective preventive measures (Xu et al., 2023; Maceiras et al., 2024).
While significant progress has been made in identifying the impact of operational, environmental and maritime factors on maritime safety, a comprehensive model combining all these variables is still lacking. Although the application of big data analytics has shown promise in improving maritime safety, its full potential in integrating real-time data streams and improving forecasting models has not yet been adequately explored. Many existing studies focus on single factors or limited data sets, without a holistic approach to marine accident prediction. This research aims to fill these gaps by integrating multiple variables, including environmental, operational and maritime characteristics, into a unified prediction framework.
Using Big Data techniques and real-time data, this study seeks to provide a more dynamic and accurate understanding of the factors influencing marine accidents, ultimately contributing to the development of more effective preventive measures. The objectives of this paper are: i) To investigate the contribution of Big Data analysis to maritime safety and accident prediction, ii) To examine the effect of environmental conditions, operational factors and vessel characteristics on the probability of maritime accidents, identifying the most important variables.
To achieve these goals, we analyze an extensive dataset spanning nine years (2014–2022) and examining over 90,000 observations. Using advanced Big Data techniques combined with statistical methods, we explore the complex relationships between ship characteristics, environmental conditions, and operational factors to uncover patterns and identify key variables that influence maritime accident risks. The findings show that while the associations between some variables and accidents are weak, patterns emerge, such as the increased risk associated with larger vessels, stronger winds, and higher speeds in adverse weather conditions. These insights highlight the value of Big Data in understanding complex maritime safety dynamics and emphasize the importance of integrating multiple factors into risk prediction and management models.
The rest of the paper is organized as follows. Section 2 provides the review of the literature, whereas section 3 describes the methodology, as well as the data and techniques used in the study. Section 4 analyzes the findings and section 5 is the discussion of the results. Section 6 concludes the study.
2. Literature Review
Maritime safety continues to be a critical area of study because of its integral role in global trade and the ongoing challenges posed by maritime accidents. Several scholars have focused on identifying and predicting the operational, environmental and technological factors that affect maritime safety, and relatively recently there has begun to emphasize the transformative potential of big data analytics in advancing safety frameworks and risk assessment models.
More specifically, operational factors, in particular the size, deadweight and speed of the ship, are consistently recognized as determinants of safety at sea. Analysis of maritime accidents and numerous studies over time have concluded that larger ships, which involve more complex operations and have greater momentum, are associated with greater accident severity. A typical example is the 2006 study by Akten, who examined the multifaceted nature of shipping accidents, focusing on the economic, environmental and operational consequences. His study concludes that the main contributors to shipping accidents are physical factors, including adverse weather and currents, as well as technical failures, human error and cargo-related hazards.
With regard to the latter factor in particular, he pointed out that, although the increasing size of ships undoubtedly optimizes transport costs, it nevertheless appears to exacerbate the risks of accidents at sea, due to reduced flexibility, while at the same time leading to worse consequences in the event of an accident. While, and Talley, Jin and Yin two years later, in 2008, examining the factors affecting the severity of accidents, particularly on cruise ships, concluded that factors such as the size of the ship, its age, weather conditions and the location of the accident make the greatest contribution. Analyzing accident data, their conclusions agree that larger cruise ships and adverse weather conditions increase the risk and tend to lead to more serious accidents. These findings are also consistent with the studies by Jin and Kite-Powell (2008) and the more recent study by Chang and Park in 2019, who highlight the importance of ship characteristics, including size and deadweight, in assessing operational risks and predicting accident probabilities.
Reviewing the existing literature, it becomes clear that adverse weather conditions not only hinder navigation but also increase the likelihood of accidents, even serious ones. Only in recent years have several scholars continued to provide empirical evidence that environmental conditions, such as wind strength, sea state, and visibility, play a key role in maritime accidents. One of these studies, that of Heij and Knapp, published in 2015, examines the effect of wind intensity and wave height on the risk of maritime accidents, considering regional trends and seasonality. A recurring recommendation in the literature is to incorporate real-time environmental data into forecasting models. Bye and Aalberg, in a 2018 article, presented the results of statistical analyses of maritime accident data and AIS data from Norwegian waters, with the aim of identifying conditions associated with navigation accidents, such as strandings and collisions, which could be used as risk indicators.
In particular, the authors analyzed data from the Norwegian Maritime Administration's accident database and historical AIS records, converting information related to ship behaviour before the accident, technical and organizational conditions, and characteristics of the area where the accident occurred into variables. Through correspondence analysis and multivariate logistic models, they found that specific vessel types, shorter vessel length, poor visibility conditions and flags of convenience increase the likelihood of navigation accidents. Also, Ventikos, Stavrou and Andritsopoulos, a year earlier, examined the characteristics and statistical patterns of maritime accidents in specific areas of the Aegean Sea. By studying decades of accident data, the authors analyzed the specific characteristics of the ships involved, such as their type and size, and presented specific results, providing valuable information on the accidents under consideration.
In addition, they also developed two models for risk assessment in Aegean shipping: a stochastic Poisson model to calculate the probability of accident occurrence in three sea zones and a model inspired by seismology, using the concept of energy release to predict maritime accidents. These models provide a systematic overview of the risk profile of shipping in the Aegean Sea, offering valuable insights for improving maritime safety. While Özdemir and Güneroğlu, in 2015, also analyzed the importance of the human factor in maritime accidents, underlining that the majority of them are caused by human error. The authors applied a hybrid multi-criteria decision-making methodology, combining DEMATEL and ANP methods, to quantitatively assess the importance of different human factors in maritime mishaps. The results of the study showed that the three most important factors, in descending order, were: competence, skills and knowledge at 8.94%, physical condition at 8.77% and weather - sea conditions at 8.21%, while the least important factor appeared to be cargo characteristics at 2.21%.
Indeed, they noted that quantitative assessment of human errors in maritime operations can significantly improve the decision-making process and reduce potential risks. Another very recent study, that of Pilatis et al. (2024) presents a comprehensive analysis of 213 maritime accidents that occurred between 1990 and 2020. The study focuses on collisions, groundings and hull failures, looking at parameters such as the type of ship, its main characteristics and the causes of the accidents.
The results underline the importance of understanding the factors contributing to such accidents, providing valuable information for improving maritime safety and developing preventive measures. On the other hand, Endrina et al, 2019 and Wu et al, 2021, highlight the need for sophisticated risk analysis and accident prevention strategies to address these multifaceted challenges. In addition, vessel speed becomes an important variable, especially under adverse environmental conditions. Among other studies, recent research by Bao et al. (2020) and Al-Behadili et al. (2023) demonstrate that higher speeds exacerbate accident risks, especially when strong winds or rough seas are present. These insights highlight the importance of adaptive navigation strategies that incorporate both vessel characteristics and real-time environmental data. Also, a common conclusion of the scholars is the need for enhanced safety measures and crew training to mitigate the risk and reduce the severity of maritime accidents.
The advent of big data analytics has transformed maritime safety research, enabling the analysis of huge datasets to reveal patterns and improve forecast accuracy. Big Data analysis is a new trend in quantitative methods encompassing extensive and intricate datasets that cannot be efficiently handled, processed, or analyzed with conventional data processing tools. A Big Data set amounts thousands of entries in several variables consisting a matrix of NxΜ dimensions which is a complicated task to deal with (O’Reilly, 2012). In many applications, data is produced in real-time or near real-time, requiring rapid processing to extract meaningful insights (Frisk et al., 2017).
Big Data variety refers to the diversity of data types and sources. Big Data encompasses a wide range of data formats, structures, and sources such as structured data, unstructured data and semi-structured data. Specifically, in the field of maritime safety and maritime accidents, examining the existing literature, we find that the early contributions of Talley et al. (2008) and Toffoli et al. (2005) laid the foundation for data-based risk assessments.
Whereas more recent developments by Sadaharu (2015), Jovic and Edvard (2019) and Liu et al. (2023) highlight the increasing importance of big data techniques in accident risk identification. In addition, the use of AIS (Automatic Identification System) data has proven to be particularly effective in maritime safety research. Indicatively, Bao et al. (2020) and Feng (2019) demonstrate their usefulness in collision and stranding prediction, while Xu et al. (2023) and Maceiras et al. (2024) demonstrate how machine learning algorithms enhance the accuracy of risk assessment and decision-making capabilities. These findings highlight the potential of integrating operational, environmental and technological variables into unified security frameworks.
However, examining the relevant literature, we find that despite the remarkable progress that has been made in the field of our research, certain limitations are identified. Many studies focus on individual factors or specific data sets, limiting their applicability to comprehensive accident prediction models. While big data analysis has introduced innovative approaches, its full potential - in particular regarding real-time data integration and advanced AI applications - remains untapped. Underexplored variables, such as ship maintenance and crew performance, also need to be further explored. The research of Dominguez-Péry et al., in 2023, and the more recent one by Bogalecka (2024) emphasize the important role of these factors, noting that inadequate maintenance and inadequate training significantly increase the risks of accidents.
In addition to the factors that we have already extensively mentioned, there are several scholars who focus on others, such as the human factor. For example, the study by Acejo et al. (2018) provides an in-depth analysis of maritime accident reports from 2002 to 2016, examining their causes and contributing factors. The study highlights the role of human error in maritime accidents, despite advances in technology and regulatory improvements, concluding that the most common direct causes include inadequate surveillance, poor judgment, and communication failures.
It is therefore evident that existing studies often focus on single factors or limited data sets, thus failing to provide a holistic approach to predicting maritime accidents. Thus, this research aims to address these gaps by integrating multiple variables into a unified predictive framework, leveraging Big Data techniques and real-time data to offer a more dynamic and accurate understanding of factors influencing maritime accidents. In particular, big data analysis was used in this article to enhance and evaluate the key factors that affect safety at sea and are respectively responsible for causing maritime accidents.
Through the analysis conducted, the research hypotheses were confirmed, showing that both internal and external factors are statistically significant in relation to maritime transport accidents (MTA) and this is in agreement with a number of studies, including the recent study by Stojanovic et al. (2019). Ship data includes extensive information about ships and marine vehicles that is essential for effective maritime management, while integrated weather data, including real-time conditions, forecasts and historical patterns, serve as a critical tool for maritime operations. In particular, accurate weather data is essential to optimize the route, avoid adverse conditions and ensure the safety of both crew and cargo. Overall, the use of this data helps to optimize operational efficiency and priorities the safety and well-being of those sailing the seas. Ultimately, this approach seeks to contribute to the development of more effective preventive measures and enhance maritime safety.
3. Materials and Methods
This study utilizes a Big Data analysis approach to investigate factors influencing maritime accidents. The methodology is structured in a way that integrates diverse data sources, allowing for the identification of correlations and patterns that influence maritime accident occurrence. Specifically, we focus on ship characteristics, environmental conditions, and operational variables, combining Big Data analysis with other statistical tools to draw conclusions.
3.1. Data Collection
The data used in this study were sourced from publicly available databases, official accident reports, and environmental datasets. Specifically:
- Accident Data: Maritime accident data were sourced from the Global Integrated Shipping Information System, a comprehensive database providing detailed records of accidents, including fatalities, vessel damage and causes of incidents.
- Environmental Data: Variables such as average ambient temperature, wind force, sea state and swell force were obtained from the National Oceanic and Atmospheric Administration and the European Centre for Medium-Range Weather Forecasts.
- Vessel Characteristics: Data on vessel characteristics, including deadweight, sizing, cargo type, and vessel state, were retrieved from maritime registries and performance tracking systems.
3.2. Data Description and Analysis
The variables examined in this study include:
- Accident Data: Maritime accident data were sourced from the Global Integrated Shipping Information System, a comprehensive database providing detailed records of accidents, including fatalities, vessel damage and causes of incidents.
- Environmental Data: Variables such as average ambient temperature, wind force, sea state and swell force were obtained from the National Oceanic and Atmospheric Administration and the European Centre for Medium-Range Weather Forecasts.
- Accident: Binary variable indicating the occurrence or non-occurrence of an accident.
- Sizing: Categorical variable representing vessel size categories (Aframax, Handymax, Panamax, Suezmax).
- Deadweight: Continuous variable measuring the vessel's weight in tons.
- Average Ambient Temperature: Continuous variable representing the temperature in degrees Celsius.
- Wind Force (BFT): This categorical variable takes values for wind force based on the Beaufort scale.
- Swell Force (DSS): This variable takes values based on the Douglas Sea Scale (categorical variable).
- Sea State (DSS): This categorical variable represents sea conditions.
- Average Speed (Knots): This is a continuous variable that measures the speed of the vessel in knots.
- Cargo: Binary variable indicating whether the vessel is laden or in ballast.
- Vessel State: This variable is categorical and takes values related to the operational status of the vessel.
3.3. Data Description and Analysis Statistical Techniques
In this study, we use a variety of analytical techniques to examine the factors that influence marine accidents. Each method provides unique insights into the data, helping to identify significant patterns and relationships. The techniques are listed below:
- Descriptive Statistics: Descriptive statistics provide a preliminary view of the data set, focusing, however, on central tendencies and distribution. Metrics such as the mean, median, and standard deviation give us a quick summary of the key characteristics of the data.
- Cross-Tabulation and Chi-Square Tests: Cross-tabulation is used to investigate the associations between two categorical variables, while Chi-Square tests assess whether there is a statistically significant relationship between these variables.
- Analysis of Variance (ANOVA): The ANOVA technique is used to test significant differences in the means of different groups or variables. This allows for a deeper understanding of whether operational factors such as vessel size or environmental conditions influence accident occurrence.
- Correlation Analysis (Pearson and Spearman): Correlation coefficients such as Pearson and Spearman are calculated to assess the strength and direction of correlations between continuous variables.
- Big Data Analytics: Big data analysis is essential in this study, as it allows for the handling and analysis of large amounts of data from different sources.
4. Findings and Empirical Analysis
Authors should discuss the results and how they can be interpreted from the perspective of previous studies and of the working hypotheses. The findings and their implications should be discussed in the broadest context possible. Future research directions may also be highlighted. According to the methodology developed above, it is clear that in addition to big data analysis, we used different statistical and econometric techniques to predict Maritime Transport Accidents (MTA). In the following, we present the findings from the tested methods in a comparative approach. In addition to the main conclusions drawn for the variables and methods tested, we also list the factors that lead to estimation weaknesses and need further investigation and improvement.
4.1. Preliminary Analysis and Descriptive Statistics
The table below (Table 1) provides summary statistics for several variables related to maritime transportation accidents (MTA), including Accident, Sizing, Deadweight, Average Ambient Temperature, Wind Force (BFT), Swell Force (DSS) and Average Speed in Knots.
A first basic interpretation of the main statistics follows:
- Accident: Binary coding (0 and 1) is used, representing the occurrence or non-occurrence of an accident, respectively. The mean and median, which is 1, indicate that the majority of observations do not involve an accident.
- Sizing: This variable has a mean value of 2.41, with most vessels hovering around this value, as shown by the median which is close to the mean. The standard deviation of 1.22 indicates moderate variability in vessel sizes with type 1 (i.e., Aframax) being the most common value.
- Deadweight: This variable has a relatively high mean and median, suggesting most ships have a deadweight between 105,102 and 112,949 tons. The large standard deviation indicates significant variability in the deadweight values, with some vessels being much heavier than others.
- Average Ambient Temperature: The average ambient temperature is 22.22 with values that vary considerably. This variable shows considerable variation, with extreme values reaching 255°C and -13°C. The large standard deviation and range suggest that some data points may be erroneous or reflect extreme environmental conditions and is also explained by the significant number of missing data for this variable.
- Wind Force (BFT) and Swell Force (DSS): As above, there is a significant amount of missing data for these two variables. However, the average wind force (measured on the Beaufort scale, BFT) is about 4.50, with a standard deviation of about 1.36, suggesting that the data tend to cluster relatively closely around this average, with moderate variability. In addition, the average wave strength (measured on the Douglas Sea Scale, DSS) is about 3.19, with a higher standard deviation of about 1.73, indicating a reasonable spread of data points. A maximum value of 9 indicates rare extreme wave conditions. This suggests that while the average wave force is lower compared to the wind force, the variability in wave force measurements is higher, with data points further away from the mean value.
- Average Speed, in Knots: The large standard deviation and range for the average speed suggest that while most vessels have an average speed closer to 3.5 knots, there are outliers with much higher speeds. A maximum of 490 knots is concerning and probably comes from outliers included in the sample.
In summarizing, from the above table we draw some first basic conclusions for specific variables. In particular, the variables Sizing, Deadweight and Wind Force (BFT) show moderate variation, and their value usually falls within the expected ranges for maritime transport. Also, Average Ambient Temperature shows extreme variability, as does Average Speed, which reveals significant variability, with some vessels exhibiting extremely high speeds, suggesting outliers or data inconsistencies. Finally, the variable 'Accident' shows an expected pattern for binary data, with most values indicating no accident. However, despite any limitations of the data (low statistical significance), these seem to suggest certain trends.
4.1.1. Frequency Analysis
This subsection presents the frequency analysis for the individual variables examined in our sample.
Table 2 and Figure 1 below present the results of the frequency analysis for the dependent variable "accident".
We observe that in this dataset we examined, the probability of causing an accident is extremely low, since accidents constitute only 0.024% of all observations. This very low percentage suggests that the shipping operations recorded in this dataset are generally safe. Consequently, any safety analysis or further investigation could focus on those few accident cases to identify patterns or causes in order to further improve safety measures.
The frequency analysis for the variable "sizing" follows.
As shown in Table 3 and Diagram 2 the dataset is diverse in vessel sizes, with Aframax being the most prevalent (35%), followed by Suezmax (27,4%), Panamax (21,6%), and Handymax (16%). There is a relatively even distribution among the different vessel sizes, but Aframax vessels form a clear plurality.
Figure 3.
Big Data Analysis: Deadweight. Source: Own study.
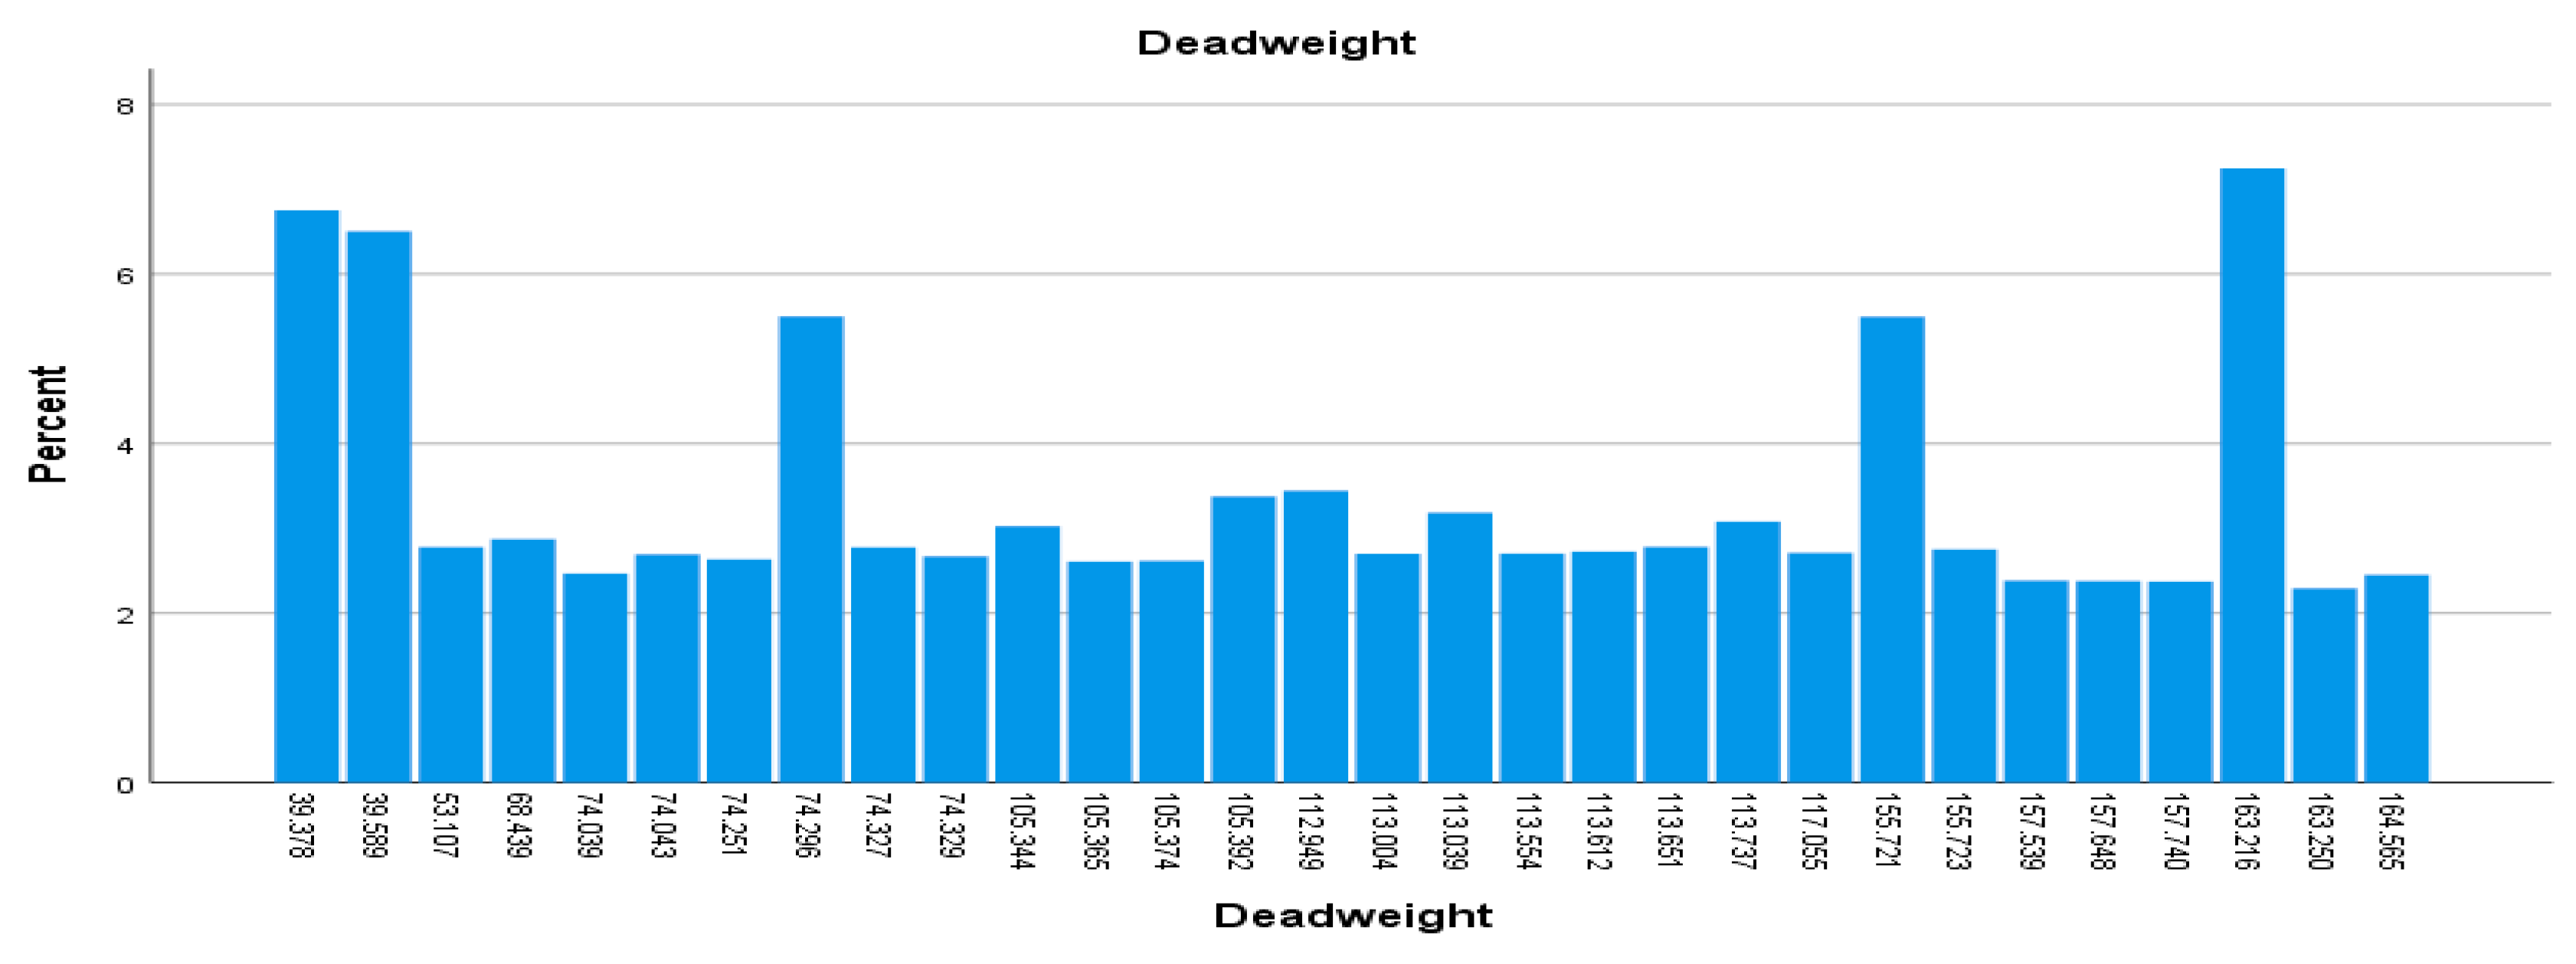
Figure 4.
Big Data Analysis: Deadweight in groups. Source: Own study.
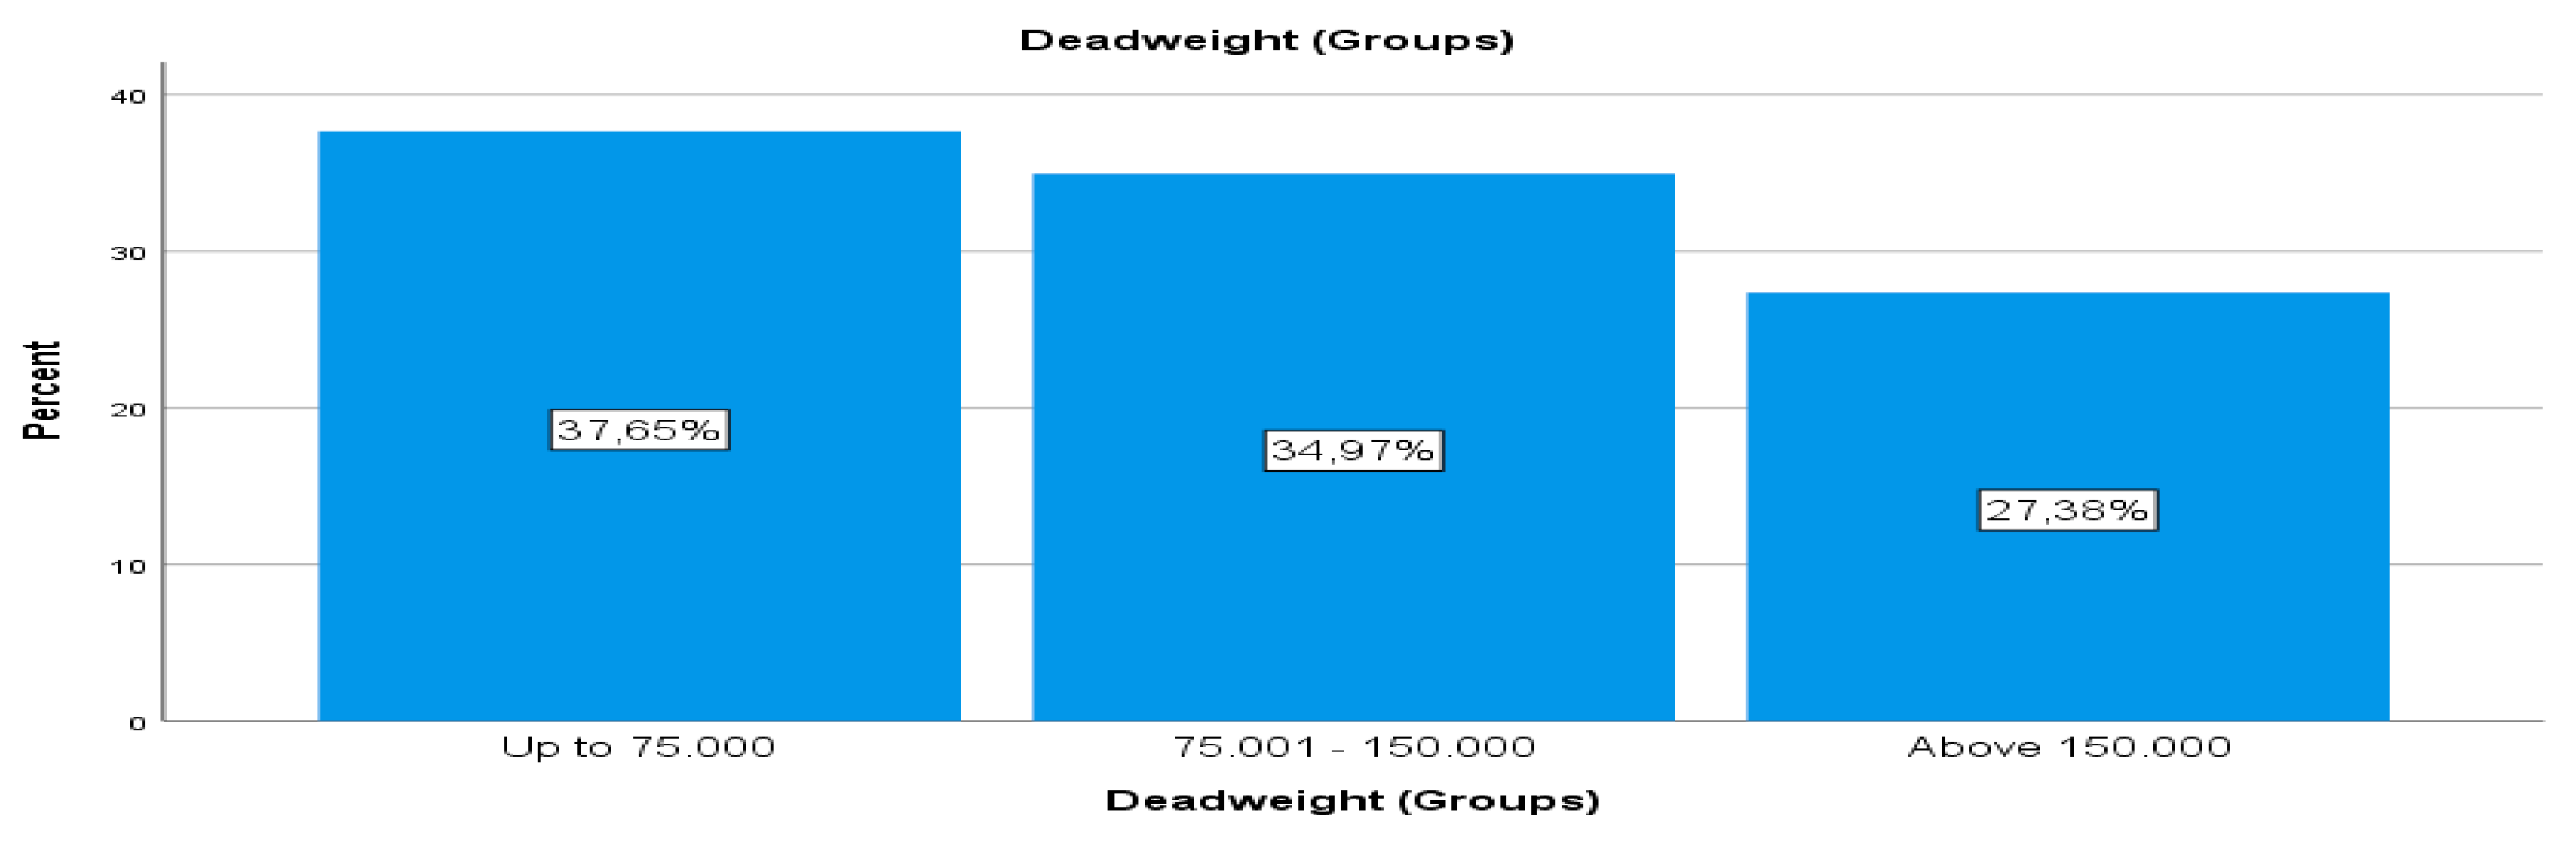
Figure 5.
Big Data Analysis: Average Ambient Temperate (Groups). Source: Own study.
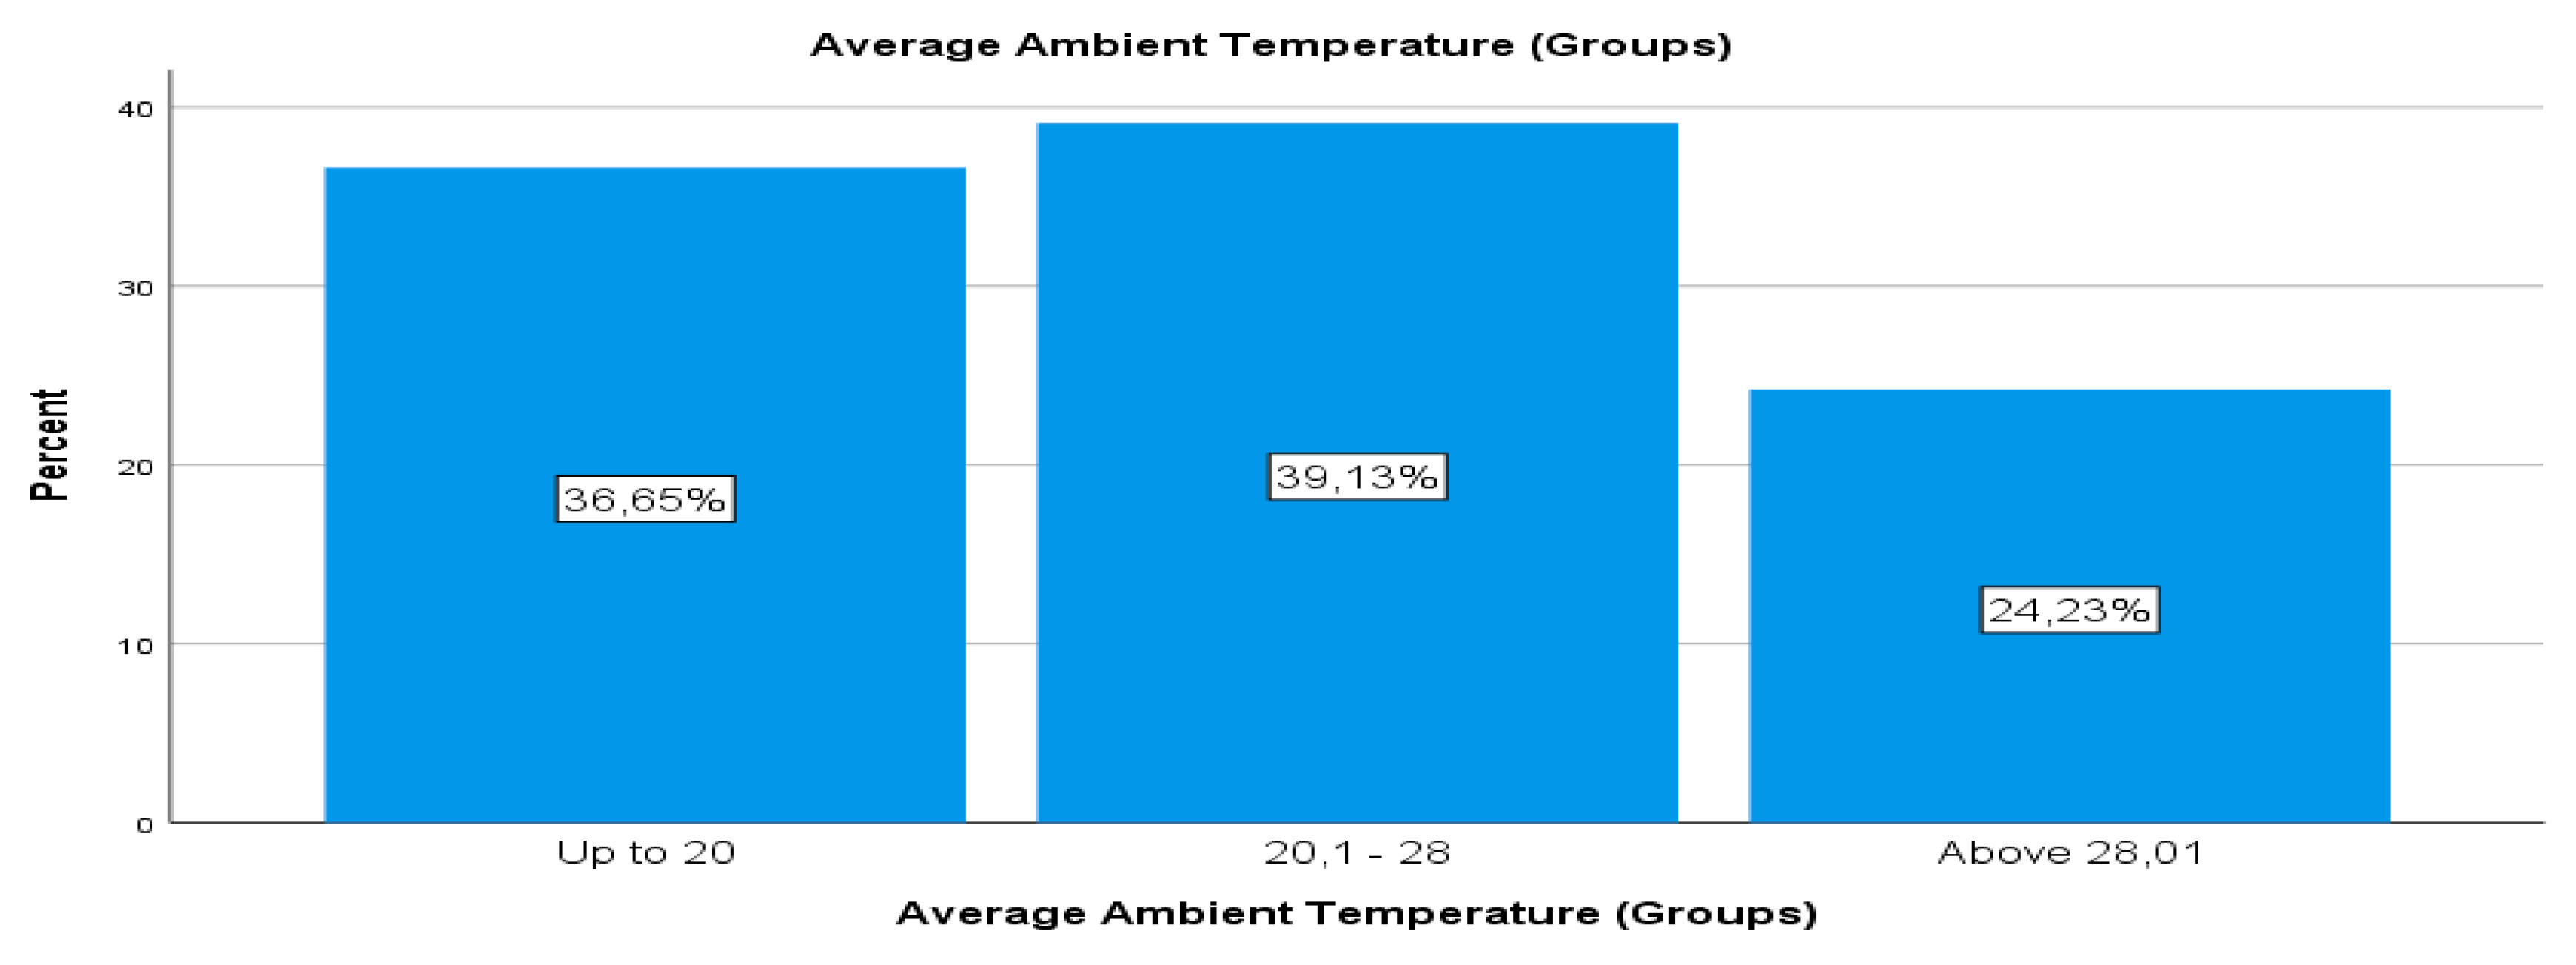
Figure 6.
Big Data Analysis: A Comprehensive Analysis of Wind Force Data Categorized According to the Beaufort Wind Force Scale. Source: Own study.
Figure 6.
Big Data Analysis: A Comprehensive Analysis of Wind Force Data Categorized According to the Beaufort Wind Force Scale. Source: Own study.
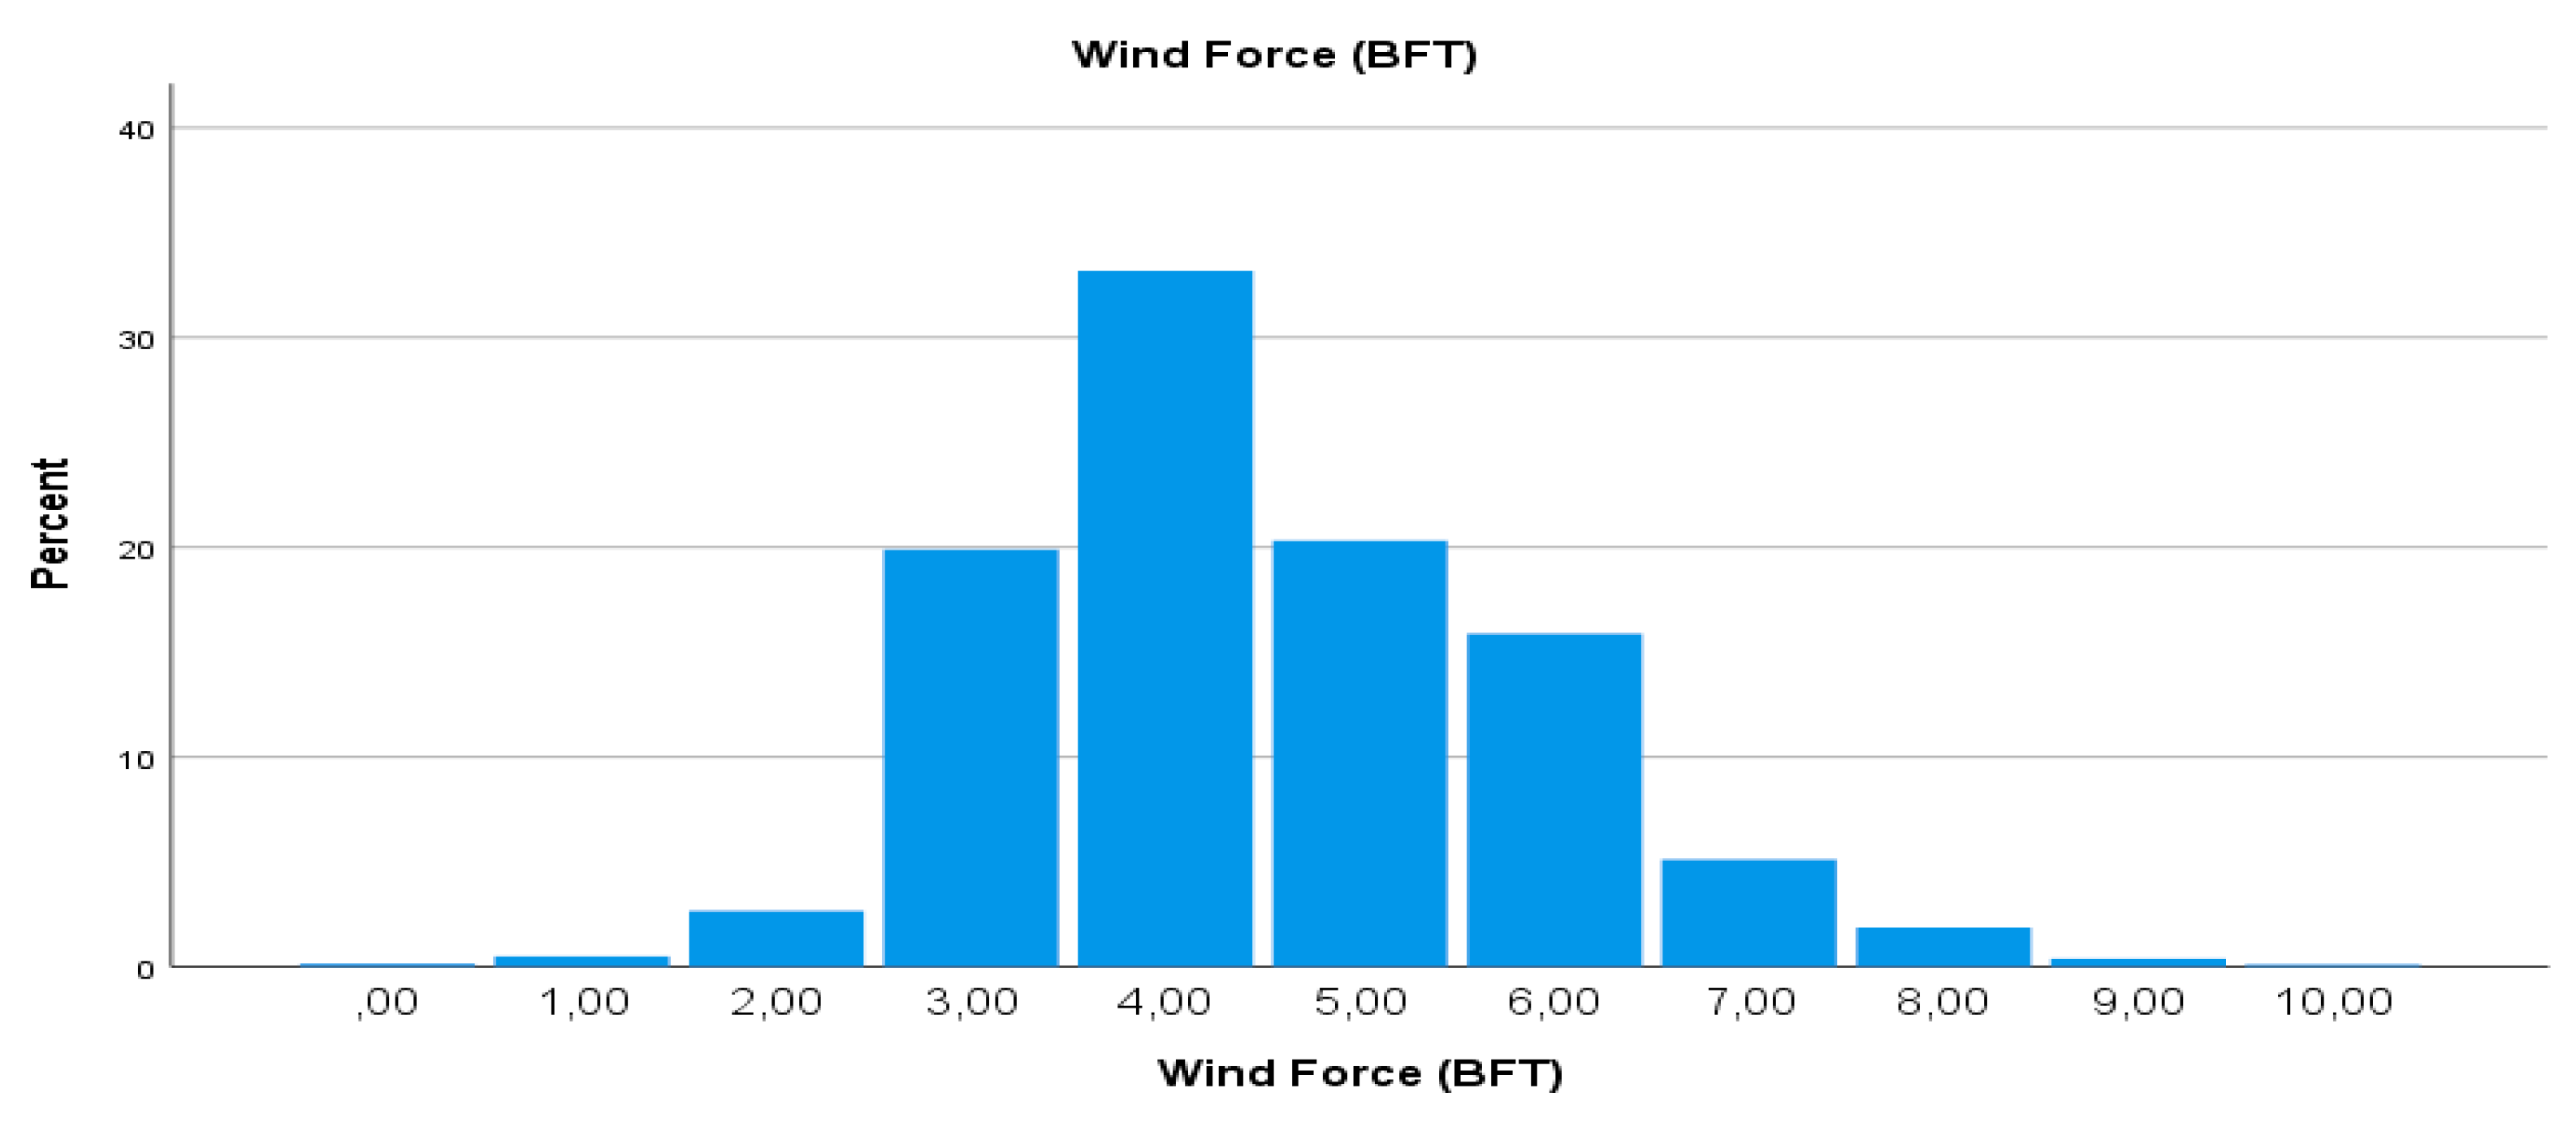
Figure 7.
Big Data Analysis: Swell Force Data Categorized by the DSS (Douglas Sea Scale). Source: Own study.
Figure 7.
Big Data Analysis: Swell Force Data Categorized by the DSS (Douglas Sea Scale). Source: Own study.
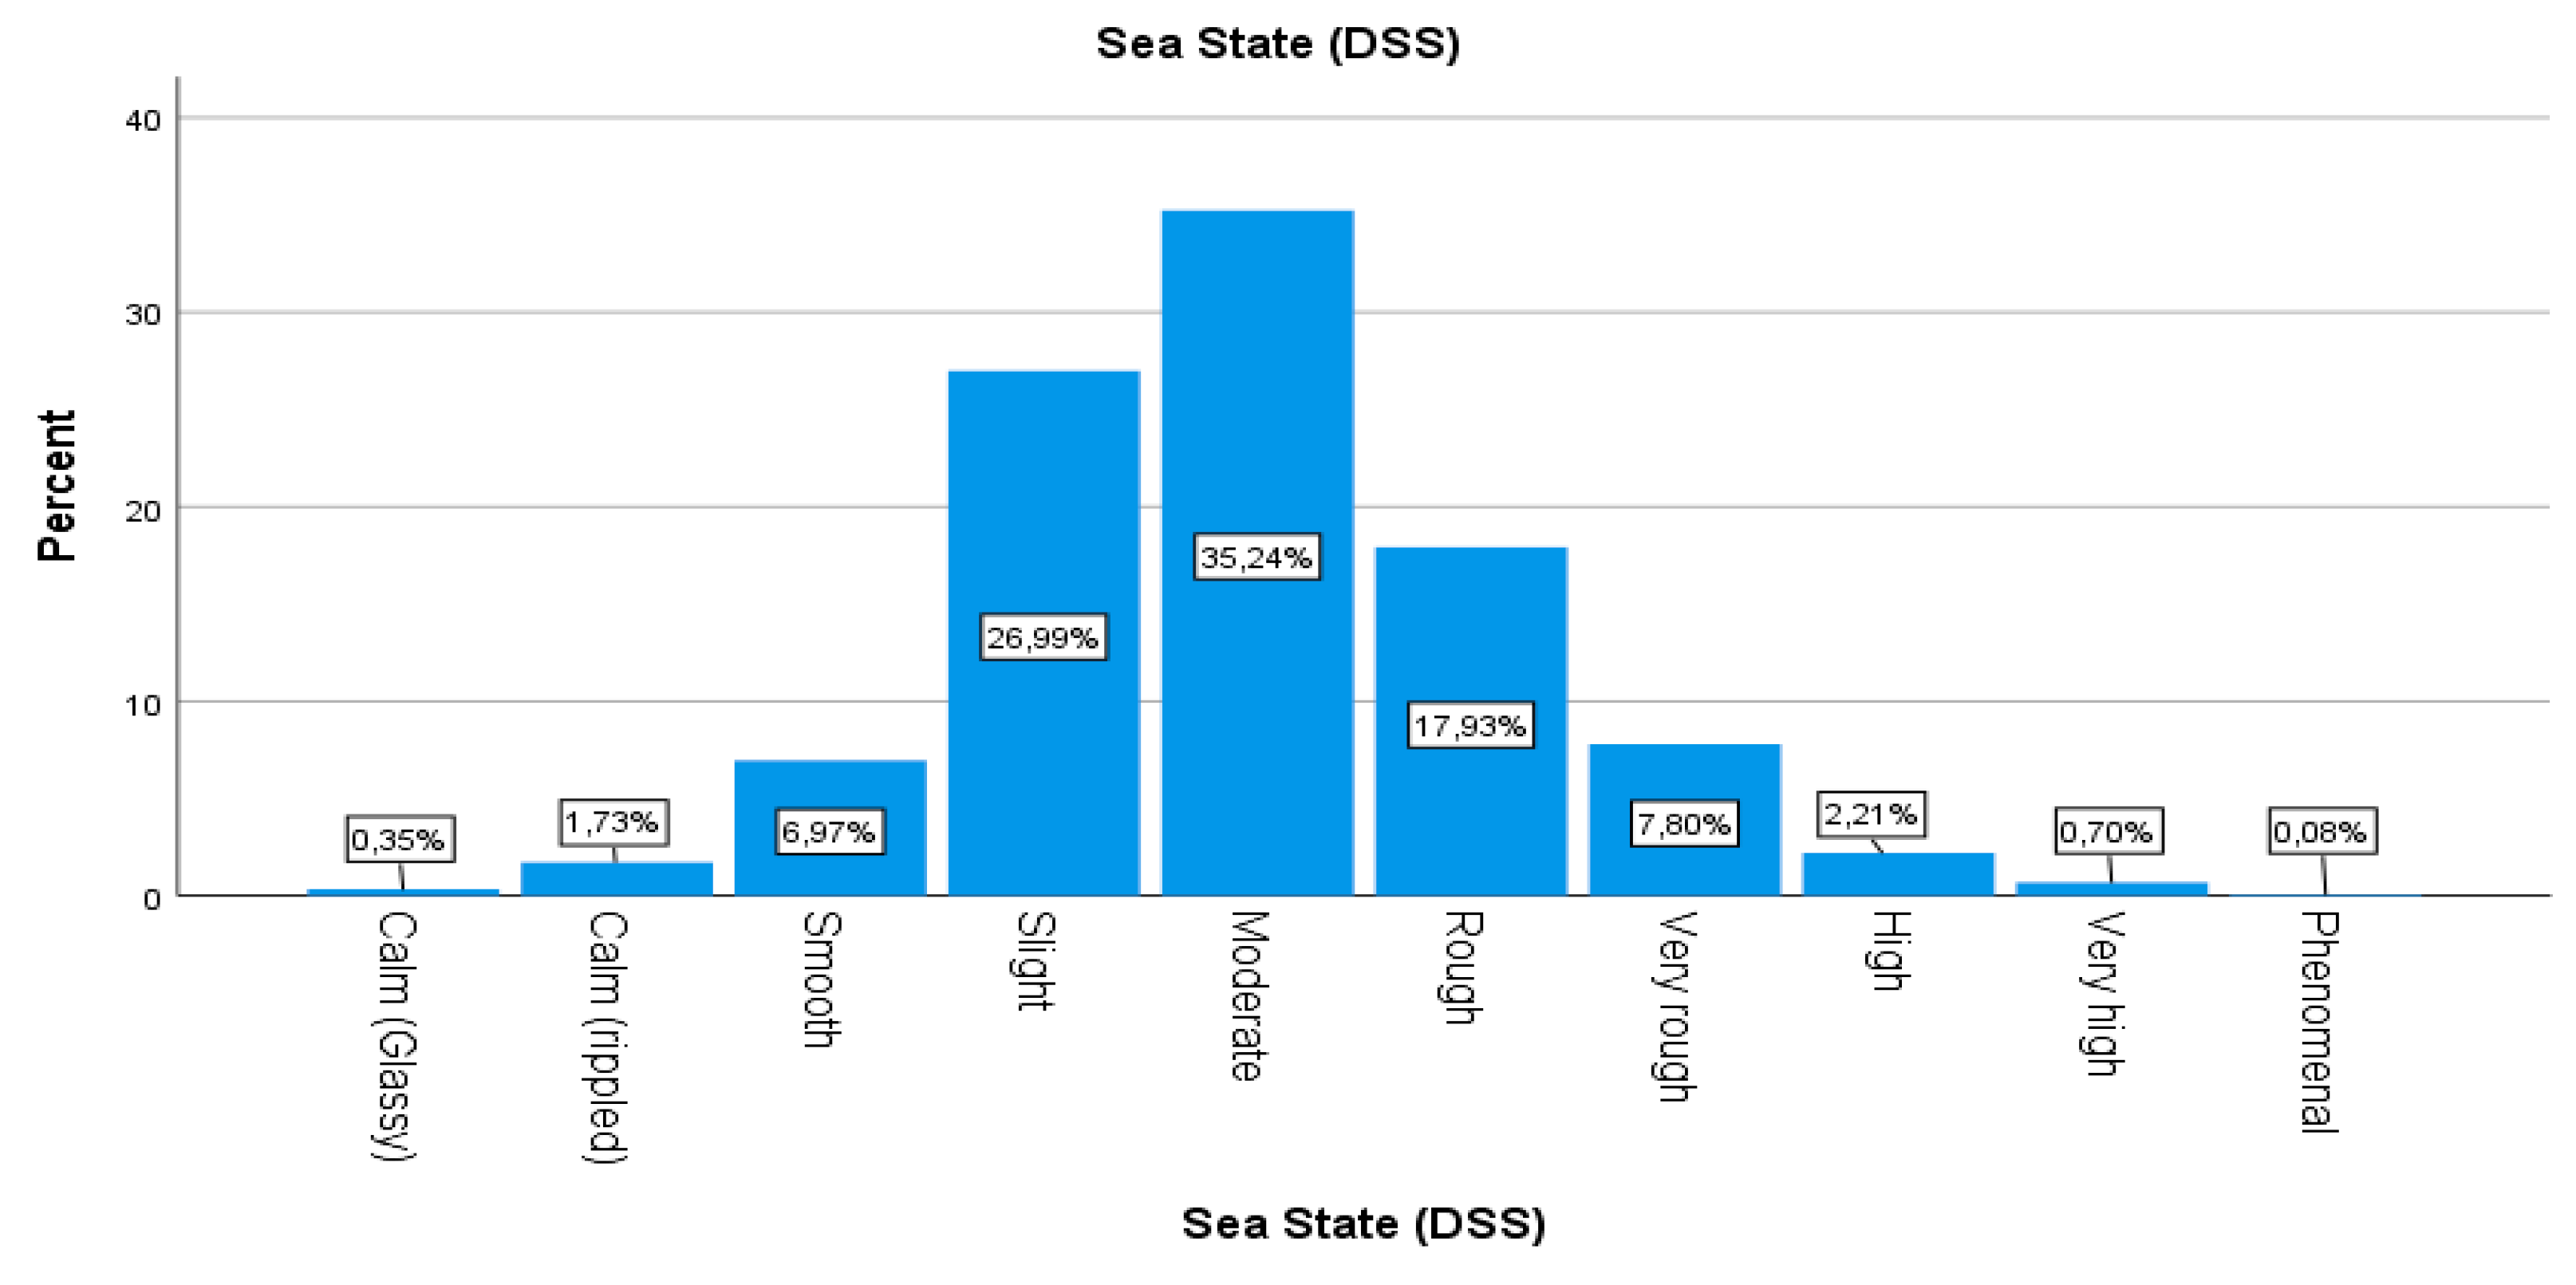
Figure 8.
Big Data Analysis: Average speed. Source: Own study.
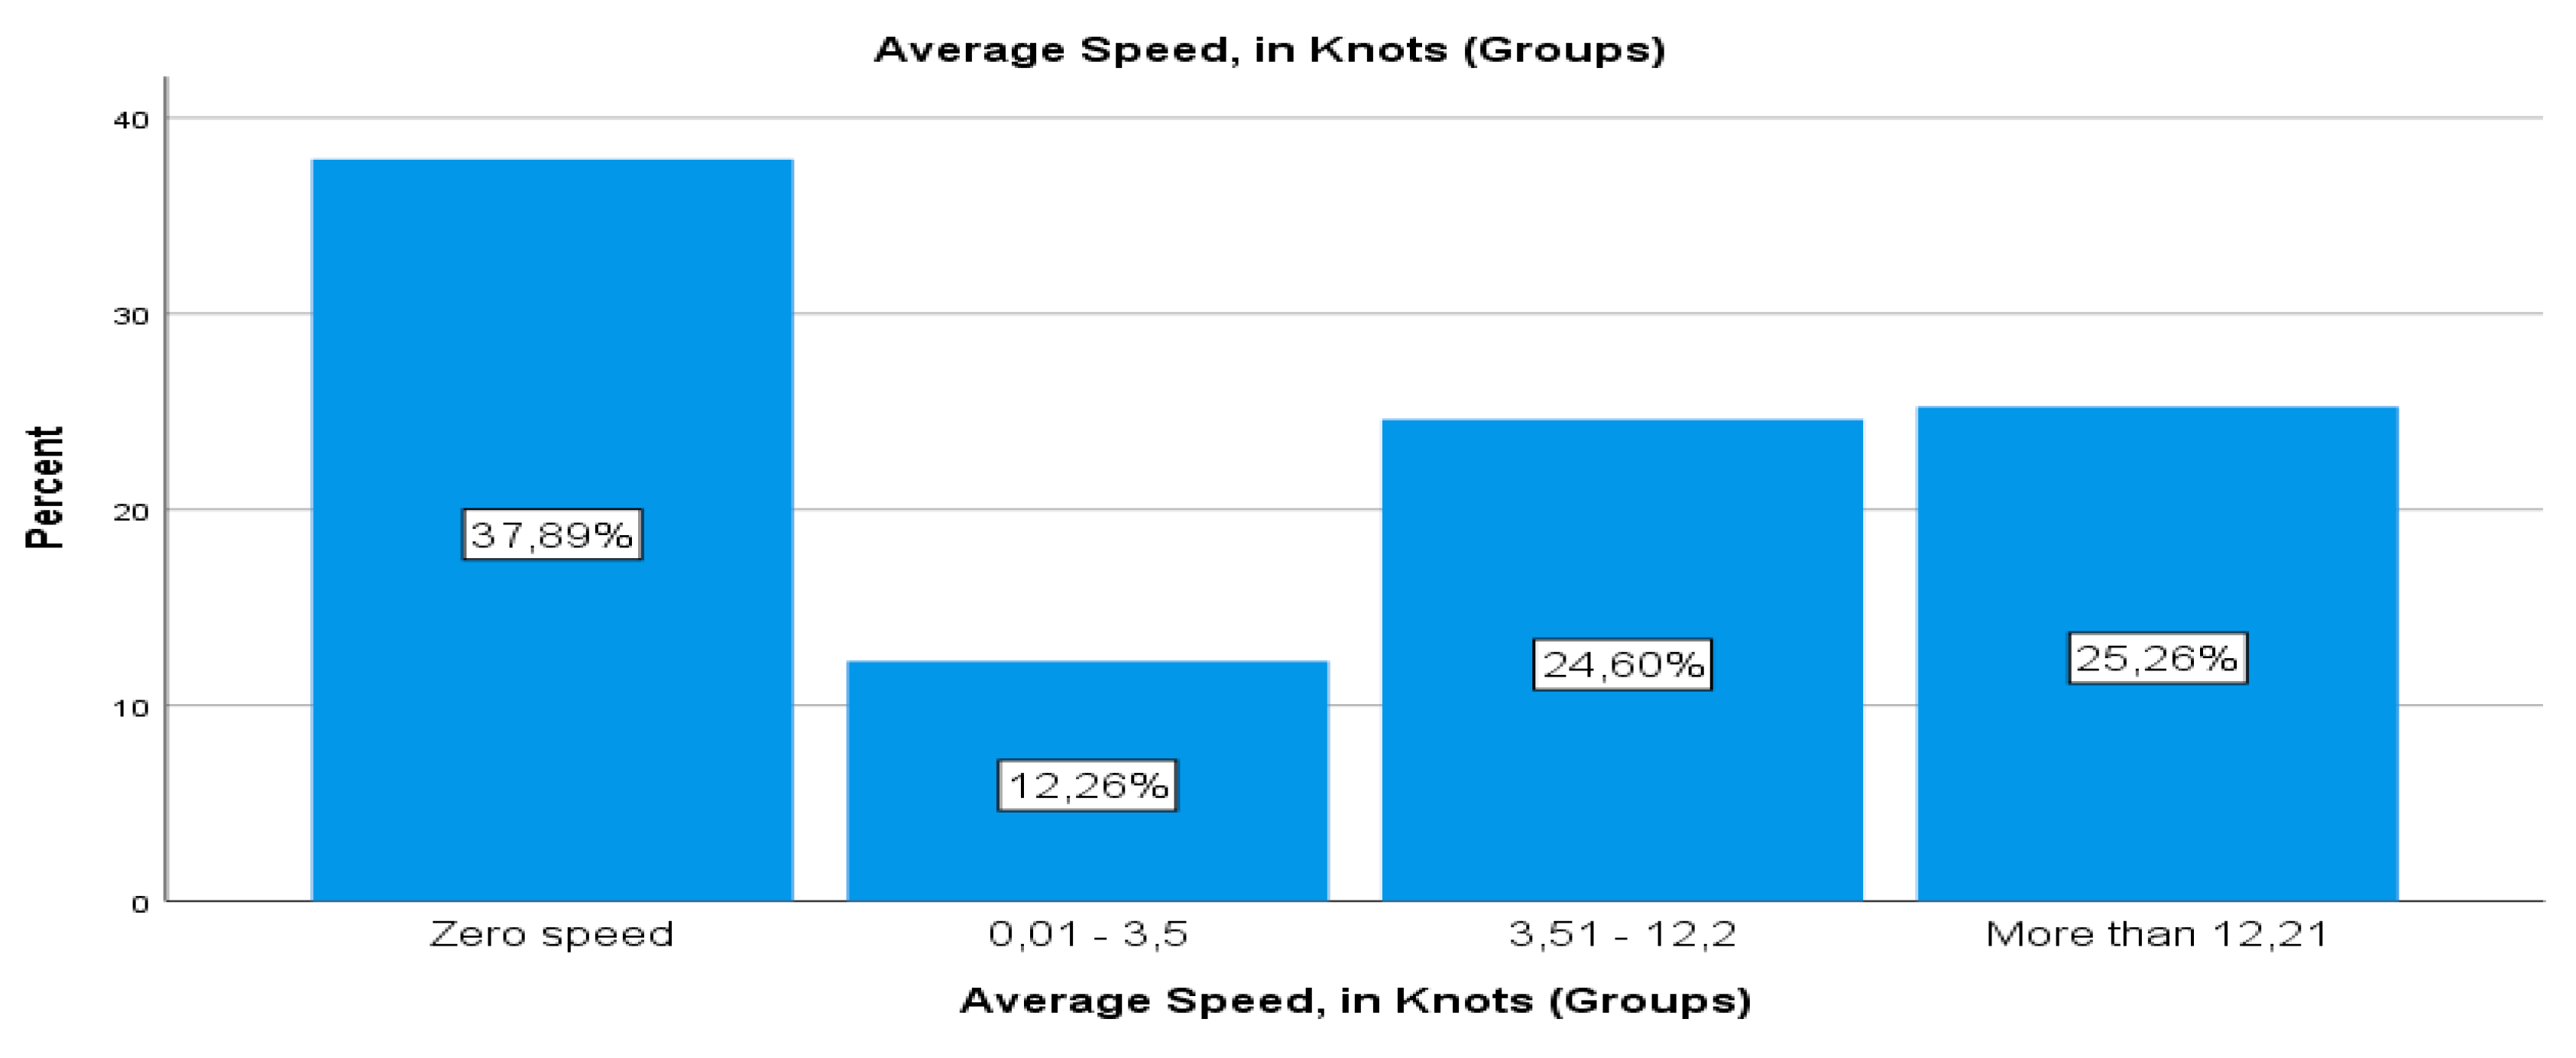
Figure 9.
Big Data Analysis: Cargo Distribution. Source: Own study.
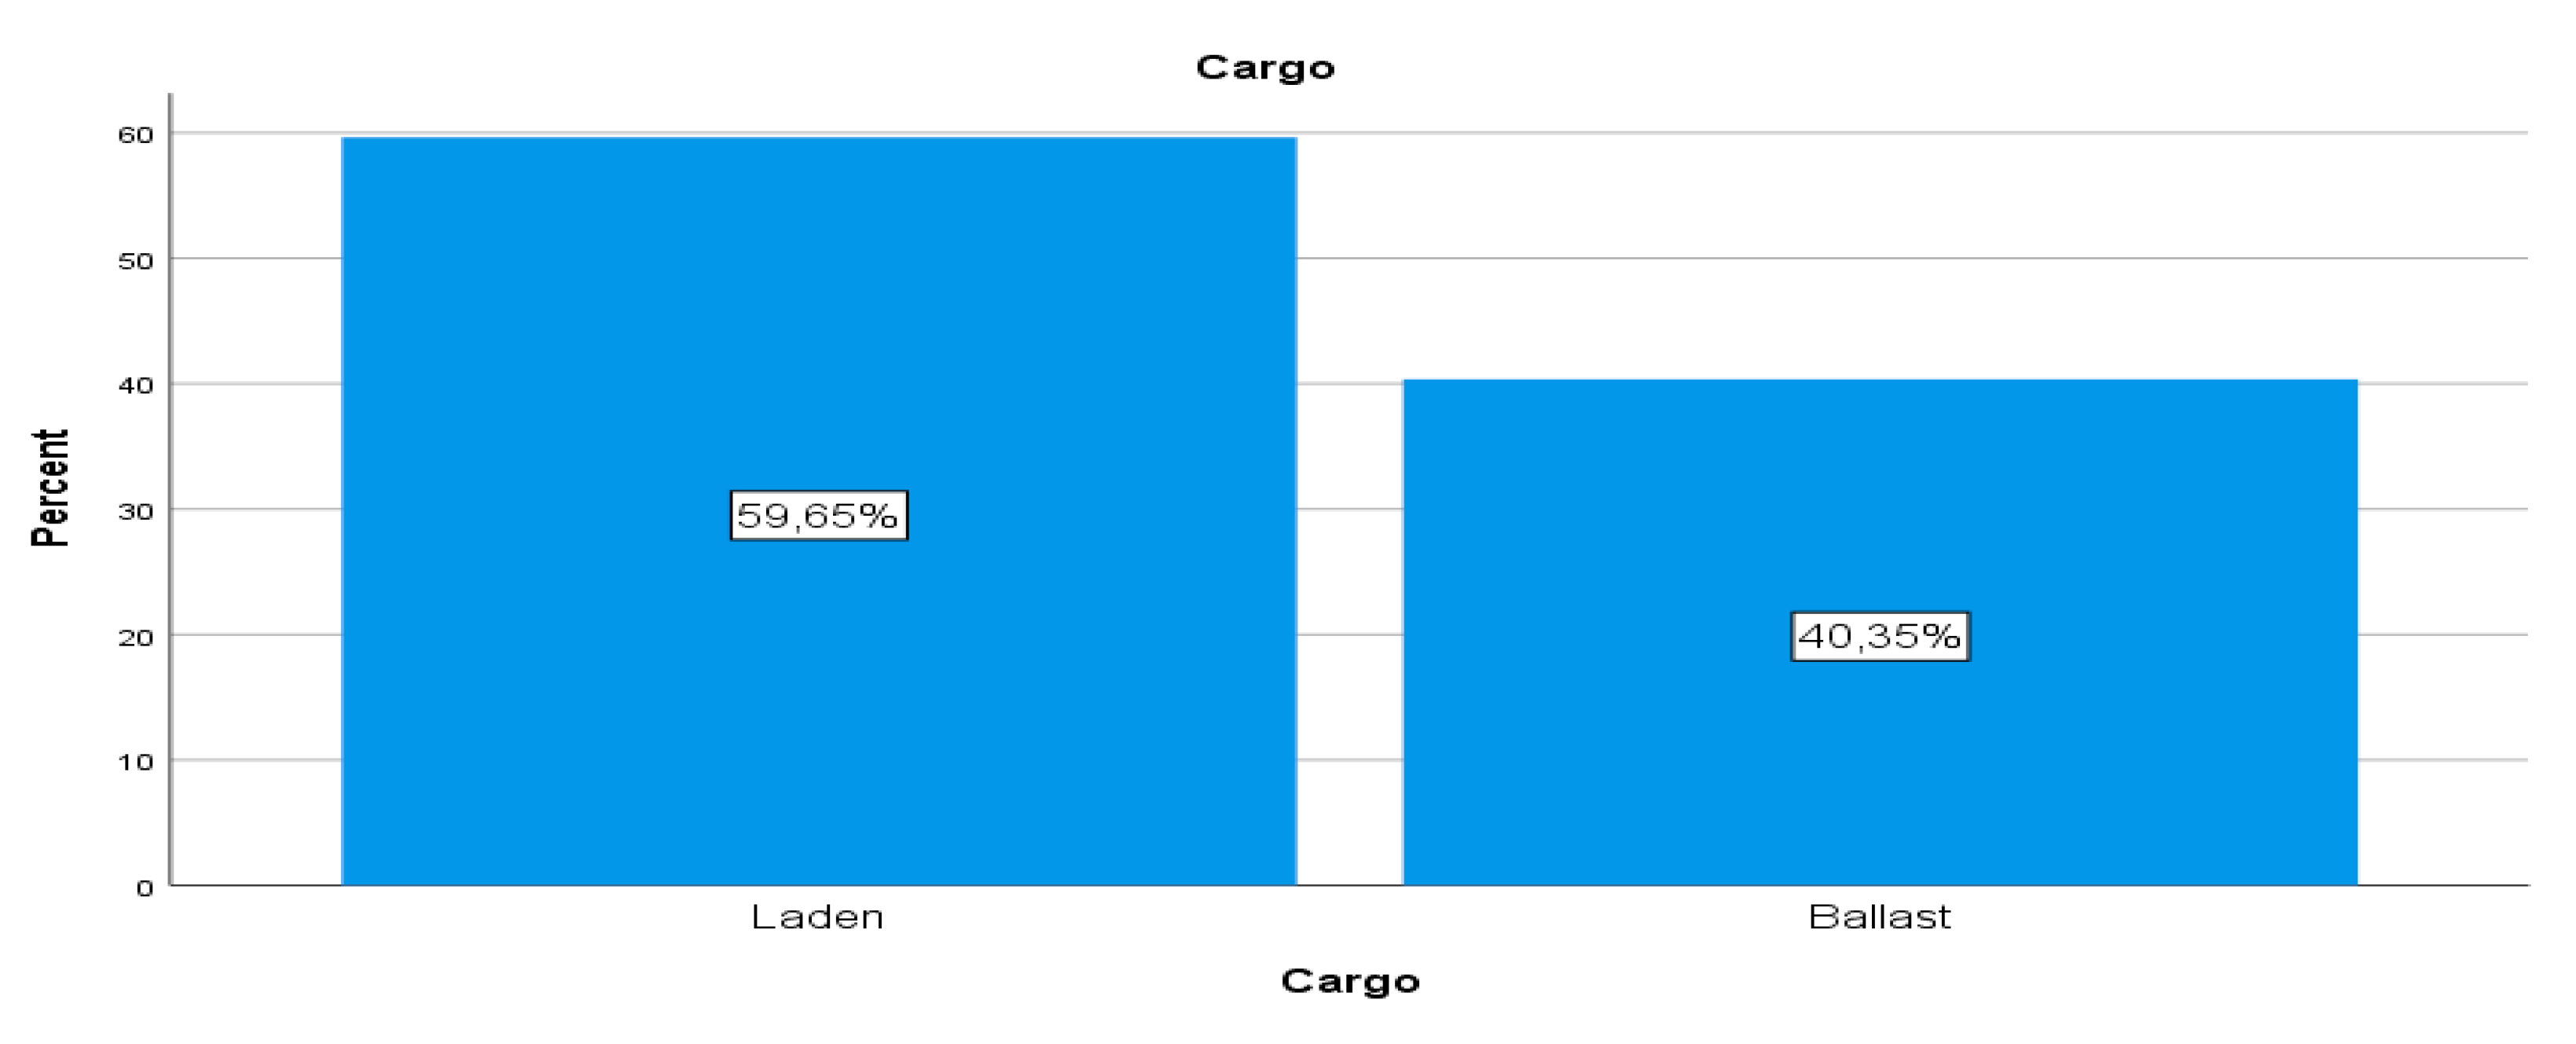
Figure 10.
Big Data Analysis: Vessel State. Source: Own study.
The frequency analysis for the variable " Deadweight" follows.
As shown in Table 4 and Diagram 3 the largest share of vessels falls into the "Up to 75.000" deadweight group (37,7%), indicating a high prevalence of smaller vessels in the fleet. The 75.001- 150.000 deadweight category is also prominent (27,4%), with slightly fewer vessels than the smallest category, but still a significant portion. Although vessels above 150.000 deadweight are the least common, they still represent a substantial 27,4% of the fleet, highlighting the importance of larger vessels. For the deadweight in groups the data set gives the results as presented in Table 5 and Diagram 4.
The frequency analysis for the variable "Average Ambient Temperature" follows.
Table 6 and Diagram 5 illustrate the distribution of ambient temperature data across three temperature groups: up to 20°C, 20,1°C to 28°C, and above 28,01°C. With a total of 900215 observations, the analysis reveals that temperatures up to 20°C account for 11,5% of the valid data, while temperatures ranging from 20,1°C to 28°C represent 12,3%. Above 28,01°C, the data encompasses 7,6% of the total.
The following is the frequency analysis for the variable " Wind Force".
Table 7 and Diagram 6 present a comprehensive analysis of wind force data categorized according to the Beaufort Wind Force Scale. With a total dataset of 90.215 observations, it reveals a varied distribution across different wind force categories. Notably, moderate to strong breezes (Force 3 to Force 6) dominate the observations, collectively representing over 92% of the valid data.
The frequency analysis for the variable "Swell Force" follows.
Table 8 and Diagram 7 presents an analysis of sea state data categorized by the DSS (Douglas Sea Scale). Among 90.215 total observations, the distribution of sea states across different categories varies. Notably, moderate to rough sea states (from "Slight" to "Rough") dominate the observations, collectively representing approximately 89% of the valid data.
The frequency analysis for the variable "Average Speed" follows.
Table 9 and Diagram 8 offer insights into the distribution of average speeds, measured in knots, categorized into four groups. Among a total of 90.215 observations, the analysis reveals varying frequencies across different speed ranges. Notably, most observations fall within the range of "Zero speed" and "More than 12,21 knots," collectively representing approximately 63,2% of the valid data.
The frequency analysis for the variable "Cargo Distribution" follows.
Table 10 and Diagram 9 present an analysis of cargo distribution, categorized into two main groups: "Laden" and "Ballast." Among a total of 90.215 observations, the analysis reveals that laden cargo accounts for 59,6% of the valid data, while ballast cargo constitutes the remaining 40,4%. This breakdown highlights the prevalence of laden cargo in the dataset. Such insight into cargo distribution is crucial for understanding vessel operations and trade dynamics.
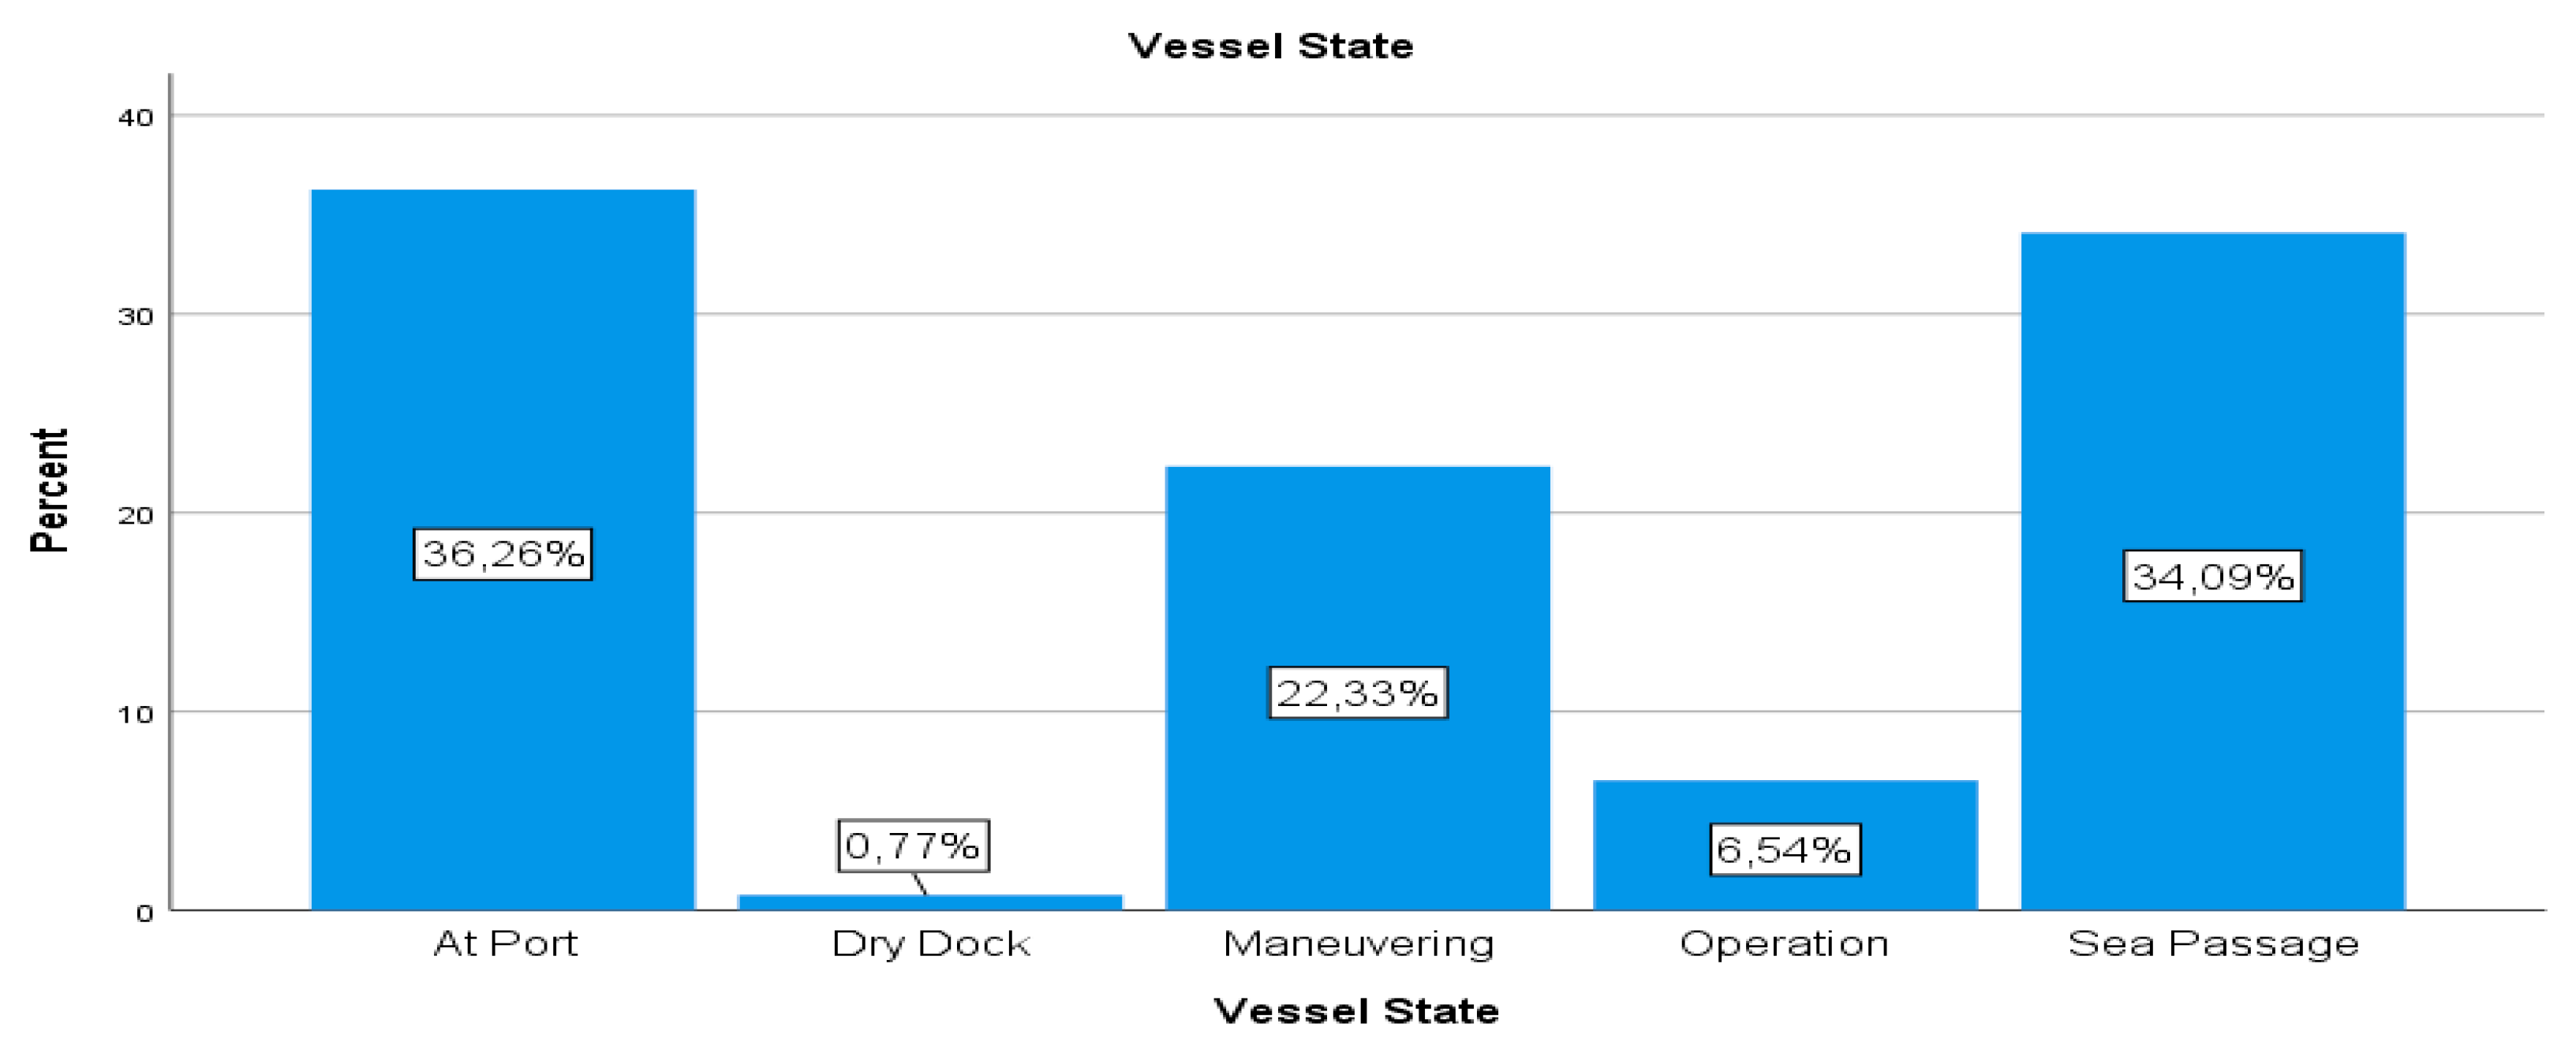
Finally, the results of the frequency analysis for the variable "Vessel State" are presented.
Table 11 and Diagram 10 presents an analysis of vessel states, categorized into five main groups: "At Port," "Dry Dock," "Maneuvering," "Operation," and "Sea Passage." Among a total of 90.215 observations, the analysis reveals varying frequencies across different vessel states. Notably, most observations fall within "At Port" and "Sea Passage" categories, collectively representing 70,4% of the valid data.
4.2. Empirical Results on Statistical Significance Tests: Cross-Tabulation, Chi-Square Tests
All statistical analyses that were conducted failed to find any statistically significant association between accident occurrence and other variables (e.g., Sizing, Deadweight, Average Ambient Temperature, Wind Force, Swell Force, Average Speed, in Knots, etc.). The lack of strong evidence suggesting that the examined variables significantly influence the likelihood of accidents could be due to several factors, including:
Sample Size: The number of accidents recorded are very small. When sample sizes are small, it becomes challenging to detect significant relationships or patterns in the data.
Statistical Tests: The Chi-Square tests conducted on the data indicate that the p-values are not statistically significant. This suggests that any observed differences in accident count across the examined variables could be due to random chance, rather than a true association.
In summary, while there may be observed differences in accident counts across the examined variables (e.g., Sizing, Deadweight, Average Ambient Temperature, Wind Force, Swell Force, Average Speed, in Knots, etc.), the statistical tests indicate that these differences are not statistically significant. Therefore, it is challenging to conclude that some factors significantly influence the likelihood of accidents based on the available data. Further research with a larger sample of accidents and consideration of additional factors would be needed to better understand the relationship between external factors and accidents. Three indicative analyses follow:
The crosstab analysis in Table 12 presents the relationship between accident occurrence and vessel sizing categories (Aframax, Handymax, Panamax, and Suezmax). Within the "Accident" category, the highest count of accidents is observed in the Suezmax category, comprising 40,9% of all accidents. Aframax follows with 31,8%, Handymax with 13,6%, and Panamax with 13,6%. However, when considering the percentage within each sizing category, accidents are proportionally distributed across sizing categories, with 35% within Aframax, 16% within Handymax, 21.6% within Panamax, and 27.4% within Suezmax.
The Chi-Square tests in Table 13 assess the significance of the relationship between accident occurrence and vessel sizing categories, indicating no statistically significant association between the variables (p > 0,05 for all tests).
In summary, while there are variations in the counts of accidents across different vessel sizing categories, these differences are not statistically significant. Therefore, there is no strong evidence to suggest that vessel sizing significantly influences the likelihood of accidents.
4.3. Cross Tabulation Accident * Deadweight (Groups)
The crosstabulation analysis (Table 14) illustrates the relationship between accident occurrence and vessel deadweight groups categorized as Up to 75.000, 75.001 – 150.000, and Above 150.000. Within the "Accident" category, the highest number of accidents is observed in vessels with deadweight above 150.000, comprising 40.9% of all accidents. This is followed by vessels with deadweight between 75.001 and 150.000 (31,8%) and vessels with deadweight up to 75.000 (27,3%).
However, when considering the percentage within each deadweight group, accidents are proportionally distributed, with each group representing approximately 37,7%, 35,0%, and 27,4% of the total accidents, respectively.
The crosstab illustrates the relationship between accident occurrence and vessel deadweight groups categorized as Up to 75.000, 75.001 – 150.000, and above 150.000. Within the "Accident" category, the highest number of accidents is observed in vessels with deadweight above 150.000, comprising 40.9% of all accidents. This is followed by vessels with deadweight between 75.001 and 150.000 (31,8%) and vessels with deadweight up to 75.000 (27,3%).
However, when considering the percentage within each deadweight group, accidents are proportionally distributed, with each group representing approximately 37,7%, 35,0%, and 27,4% of the total accidents, respectively.
The Chi-Square tests (Table 15) assess the significance of the relationship between accident occurrence and vessel deadweight groups, indicating no statistically significant association between the variables (p > 0,05 for all tests).
In summary, while there are differences in accident counts across different vessel deadweight groups, these differences are not statistically significant. Therefore, there is no strong evidence to suggest that vessel deadweight significantly influences the likelihood of accidents.
4.4. Cross Tabulation Accident Occurrence and Average Temperature (In Groups)
The crosstab (Table 16) illustrates the relationship between accident occurrence and average ambient temperature groups categorized as Up to 20, 20,1 - 28, and Above 28,01. Within the "Accident" category, the highest count of accidents is observed when the average ambient temperature is Up to 20, comprising 46,2% of all accidents. This is followed by temperatures ranging from 20,1 to 28 (38,5%), and temperatures above 28,01 (15,4%).
However, when considering the percentage within each temperature group, accidents are proportionally distributed across temperature categories. The Chi-Square tests (Table 17) assess the significance of the relationship between accident occurrence and average ambient temperature groups, indicating no statistically significant association between the variables (p > 0,05 for all tests).
In summary, while there are variations in accident counts across different average ambient temperature groups, these differences are not statistically significant. Therefore, there is no strong evidence to suggest that average ambient temperature significantly influences the likelihood of accidents.
4.5. Empirical Results on Statistical Significance Tests: Analysis of Variance (ANOVA)
ANOVA (Analysis of Variance) tests are essential statistical tools used to assess whether there are statistically significant differences in the mean scores of multiple groups or variables. In this analysis, we focus on ten variables: Sizing, Deadweight, Deadweight (Groups), Average Ambient Temperature, Average Ambient Temperature (Groups), Wind Force (BFT), Swell Force (DSS), Sea State (DSS), Average Speed in Knots, and Average Speed in Knots (Groups). The aim is to determine whether the occurrence of accidents significantly influences the mean scores of these variables. For instance, in the context of Sizing, the ANOVA test assesses whether there are significant differences in vessel sizes between groups with and without accidents.
The analysis found no statistically significant relationships between the occurrence of accidents and the ten variables examined. This lack of significance suggests that, based on the available data, there is no strong evidence to support the idea that accidents are influenced by variations in these operational factors. While accidents undoubtedly have multiple contributing factors, including human error, mechanical failure, and environmental conditions, this analysis did not identify any clear associations between accidents and the variables examined. Therefore, the takeaway from this analysis is that accidents in maritime settings may be influenced by a complex interplay of factors beyond the scope of the variables investigated here.
4.6. Empirical Results on Regression - Correlation: Pearson & Spearman Correlation Coefficients
The two following Tables (Table 20 and Table 21) present Pearson and Spearman correlation coefficients and their corresponding significance levels (two-tailed) for various variables in relation to the occurrence of accidents. Here are the main conclusions:
- Weak Correlation with Accident Occurrence: Across the board, the correlation coefficients between accident occurrence and the examined variables (Sizing, Deadweight, Deadweight (Groups), Average Ambient Temperature, Average Ambient Temperature (Groups), Wind Force (BFT), Swell Force (DSS), Sea State (DSS), Average Speed in Knots, Average Speed in Knots (Groups), Cargo, and Vessel State) are all very close to zero. These coefficients indicate a weak linear relationship between accident occurrence and the variables.
- Insignificant Correlations: The significance levels (Sig.) associated with the correlation coefficients are generally high (greater than 0,05), indicating that the correlations are not statistically significant. This suggests that the observed correlations between accident occurrence and the variables are likely due to chance rather than representing true associations.
- Variable Independence: The lack of statistically significant correlations suggests that accident occurrence may be relatively independent of the variables examined in this analysis. This implies that factors other than those measured in this dataset may have a more substantial influence on accident occurrence in maritime settings.
5. Discussion of the Results
The current research investigates the use of big data analysis in the study of factors that appear to influence maritime accidents examining ship characteristics, environmental conditions and operational factors. The study period of the sample runs for nine (9) years (2014-2022), examining over 90,000 observations. To analyze our data and draw conclusions, in addition to big data analysis, tools from statistical science, in particular, descriptive statistics, statistical significance tests, analysis of variance and regression-correlation are applied.
Starting the discussion around the main results of our study, it should be mentioned that our findings confirm the first hypothesis that we put forward, i.e. that the analysis of big data contributes to the understanding of the factors that lead to safe berthing and correspondingly to the risk of Maritime Transportation Accidents (MTA), which is the main aim of this paper. This initial finding is in line with relevant research studies, including recent studies of Sadaharu (2015), Jović and Edvard (2019), Liu et al. (2023), Zhang et al. (2017) and Ma et al. (2024).
It is obvious that without big data analysis it would have been impossible to examine this huge volume of data involving 90,215 trip cases (including the maritime accidents that occurred) and observations on a number of related variables that were examined: sizing, deadweight, average ambient temperature, wind force, swell force and average speed. Table 1 summarizes these data.
Analyzing the data, it is evident that the number of cases leading to a maritime accident is significantly lower than the total data. This key finding could be seen as weakening our findings, however, because different methods were examined and the findings were converged, it can be argued that we are discovering specific patterns leading to maritime accidents and their factors. For this reason, it is particularly important that our second hypothesis is confirmed, which suggested that there are specific variables per category of factor we examined (endogenous, exogenous) that influence the probability of causing maritime accidents.
Specifically, to test the second hypothesis, we first applied cross-tabulation analysis and Chi-square test to examine the relationship between the variables vessel deadweight and average ambient temperature, separately, with accident occurrence. Furthermore, a variance analysis with hypothesis testing was performed to determine whether the occurrence of accidents significantly influences the mean scores of selected variables, such as Sizing, Deadweight, Deadweight (Groups), Average Ambient Temperature, Average Ambient Temperature (Groups), Wind Force (BFT), Swell Force (DSS), Sea State (DSS), Average Speed in Knots, and Average Speed in Knots (Groups), followed by a correlation analysis with Pearson and Spearman coefficient testing. Our analysis first indicated that there is a correlation between the variable "accident" and the variables "vessel size category", "deadweight groups" and "average ambient temperature groups".
In particular, stronger winds and sea disturbances are associated with an increased probability of accidents, which is in line with the existing literature (see inter alia, Pilatis et al., 2024; Bye and Aalberg, 2018; Ventikos, Stavrou and Andritsopoulos, 2017). Also, although deadweight and vessel size show a weak correlation with accidents, these factors cannot be completely ignored, as the results are also affected by the reduced number of observations. Furthermore, one of the most consistent findings in the data was the strong negative correlation between average speed (in knots) and maritime accidents, thus highlighting the risks associated with high-speed navigation, particularly in adverse weather conditions. For further investigation and applying the analysis of variance, we found that maritime accidents can be influenced by a number of factors and even by a complex interaction of factors.
This finding and the fact that the big data analysis, in our case, did not identify clear correlations between accidents and the variables examined, lead us to the conclusion that other factors that may influence maritime accidents need to be investigated and examined by other methods or even in combination.
Furthermore, the regression-correlation analysis revealed a remarkable correlation between ship size, namely deadweight and shipping accidents. Indeed, a number of studies, such as those of Akten (2006) and Talley, Jin and Kite-Powell (2008) have focused on demonstrating the severity of accidents with ship size, finding that larger ships often experience more serious accidents. In our data set, the deadweight was positively correlated with accident severity (Spearman's rho = 0.104), suggesting that larger ships may have a greater propensity for accidents resulting in significant damage or casualties. This is further supported by our finding that deadweight groups also show a strong correlation with accident severity. Our study also confirms the findings of Heij and Knapp (2015) and Brandt et al. (2024) on the significant influence of environmental conditions, in particular wind force and sea state, on accident risk. We found a strong correlation between wind force and accident severity (Spearman's rho = -0.226).
Moreover, our results showed that average ambient temperature had a weaker association with accidents (Spearman's rho = -0.005), which contradicts some studies suggesting that extreme temperatures can exacerbate accidents. However, in our case, the minimal correlation may reflect the geographical distribution of the data or the limited influence of temperature on the selected dataset. Interestingly, vessel condition also showed a moderate correlation with accident severity (Spearman's rho = 0.104). Although this variable is less frequently studied in the existing literature, it is in line with the findings of other researchers (e.g. Bogalecka, 2024; Dominguez-Péry et al., 2023), who emphasized that poorly maintained or malfunctioning vessels are more likely to experience accidents. Therefore, maintenance and technical readiness of vessels should be a priority to minimize accidents.
From this analysis, we conclude that the use of big data analysis to evaluate marine accidents revealed complex patterns that would have been difficult to identify using traditional statistical methods, while Spearman's rho correlations and regression models allowed the identification of key predictors of accident severity, including environmental factors and operational conditions.
6. Conclusions
This study utilized Big Data analysis techniques in combination with statistical methods to examine the factors that influence maritime accidents, contributing to a deeper understanding of the relationship between ship characteristics, operational variables and environmental conditions. Our research has as its main objectives the evaluation of the possibility of using big data analysis to predict maritime transportation accidents, as well as the investigation of the main factors that cause them through the identification of specific variables. For our analysis, we gathered information and studied more than ninety thousand specific facts over a nine-year period. The findings of this study contribute to the literature by providing important information on the factors that appear to cause marine casualties, thus providing opportunities to develop more effective risk management strategies.
The main findings of our study were that ship characteristics, in particular deadweight (DWT), are important factors in causing marine accidents, with larger ships experiencing more severe problems, while environmental conditions such as wind force (BFT) and sea state (DSS) also appeared to play a role. Furthermore, it is evident that operational factors also have an influence, with average speed being more important, as confirmed by our analysis. The results of this analysis highlight the importance of a multi-factor approach to maritime safety, where both vessel characteristics and environmental conditions play an important role in determining accident risk.
Regarding the processing and analysis of the data and drawing more accurate conclusions, we agreed that the use of big data is a useful tool and indeed, in addition to analysis, can provide the possibility of better accident prediction and mitigation by integrating various data sources such as weather forecasting systems, vessel monitoring systems and sensor data. Of course, although this study demonstrated the value of big data analysis in improving the accuracy of accident prediction, however, it should be noted how it also faced some important limitations, such as small accident data volume and geographical constraints. Furthermore, the reduced values of certain variables, such as the average ambient temperature, affected the statistical significance of the tests.
For these reasons, we believe that future research should incorporate other factors in combination with other tests to create a more comprehensive accident prediction model. Future studies could also explore the application of deep learning algorithms and more complex artificial intelligence models to enhance the predictive power of the analysis. Furthermore, incorporating real-time data streams into accident prediction models can also provide valuable insights and guidance.
Funding
This research has been partly supported by the University of Piraeus Research Center (ELKE), Research Committee of University of Piraeus.
Data Availability Statement
The detailed dataset supporting the results presented in this study is available upon request from the corresponding author.
Conflicts of Interest
The authors declare no conflicts of interest.
References
- Acejo, I., Sampson, H., Turgo, N., Ellis, N., & Tang, L. (2018). The causes of maritime accidents in the period 2002-2016. https://researchportal.plymouth.ac.uk/en/publications/the-causes-of-maritime-accidents-in-the-period-2002-2016.
- Akten, N. (2006). Shipping accidents: a serious threat for marine environment. Journal of the Black Sea / Mediterranean Environment, Vol. 12, pp. 269-304.
- Al-Behadili, A., Al-Taai, O., Al-Muhyi, A. (2023). Analysis of ship accident resulting from bad weather conditions in the port of Khor Al-Zubair, Iraqi crane accident Aba Thar: a case study, Revista Bionatura, Vol 8 (1). [CrossRef]
- Bao, D., Shang, R., Wang, R., and Ma., R. (2020). AIS big data framework for maritime safety supervision", Proc. ICRIS, pp. 150-153.
- Bogalecka, M. (2024). Collision and Contact – Analysis of Accidents at Sea, International Journal on Marine Navigation and Safety of Sea Transportation, Vol. 11 (1). [CrossRef]
- Brandt, P. , Munim, Z.H., Chaal, M., Kang, H.S. (2024). Maritime accident risk prediction integrating weather data using machine learning, Transportation Research Part D: Transport and Environment, Vol. 136, 104388. [CrossRef]
- Bye, R. , Aalberg, A. (2018). Maritime navigation accidents and risk indicators: An exploratory statistical analysis using AIS data and accident reports, Reliability Engineering & System Safety, Vol. 176, pp. 174-186. [CrossRef]
- Chang, Y. , Park, H. (2019). The impact of vessel speed reduction on port accidents. Accident Analysis & Prevention, Elsevier, Vol. 123, pp. 422-432.
- Dominguez-Péry, C. , Tassabehji, R., Corset, F., Chreim, Z. (2023). A holistic view of maritime navigation accidents and risk indicators: examining IMO reports from 2011 to 2021, Journal of Shipping and Trade, 8, 11. [CrossRef]
- Endrina, N., Konovessis, D., Sourina, O., & Krishnan, G. (2019). Influence of ship design and operational factors on human performance and evaluation of effects and sensitivity using risk models. Ocean Engineering, 184, 143–158. [CrossRef]
- Feng, H. (2019). Analysis and enlightenment of AIS content in the accident report of M/T SANCHI. Navigation Technology, 2, pp. 72–73.
- Heij, C. , Knapp, S. (2015). Effects of wind strength and wave height on ship incident risk: Regional trends and seasonality, Transportation Research Part D: Transport and Environment, Vol.37, pp.29-39. [CrossRef]
- Jović, M. , Edvard, T. (2019). Big Data Management in Maritime Transport, Pomorski zbornik, Vol. 57 (1). [CrossRef]
- Liu, Z., Zhang, B., Zhang, M., Wang, H., Fu, X. (2023). A quantitative method for the analysis of ship collision risk using AIS data, Ocean Engineering, Vol. 272, 113906. [CrossRef]
- Ma, Q. , Tang, H., Liu, C., Zhang, m., Zhang, D., Liu, Z., Zhang, L. (2024). A big data analytics method for the evaluation of maritime traffic safety using automatic identification system data, Ocean & Coastal Management, Vol. 251 (1). [CrossRef]
- Maceiras, C., Cao-Feijóo, G., Pérez-Canosa, J. M., & Orosa, J. A. (2024). Application of Machine Learning in the Identification and Prediction of Maritime Accident Factors. Applied Sciences, 14(16), 7239. [CrossRef]
- Özdemir, Ü. , Güneroğlu A. Strategic Approach Model for Investigating the Cause of Maritime Accidents. Sci. J. Traffic Transp. Res. 2015;27:113–123. [CrossRef]
- Pilatis, A. , Pagonis, D.N., Serris, M., Peppa, S., Kaltsas, G. (2024). A Statistical Analysis of Ship Accidents (1990–2020) Focusing on Collision, Grounding, Hull Failure, and Resulting Hull Damage, J. Mar. Sci. Eng., Vol. 12(1), p. 122. [CrossRef]
- Sadaharu, K. (2015). Major challenges and solutions for utilizing big data in the maritime industry. . World Maritime University (dissertation).
- Stojanovic, J. , Koc, Y., & Wang, K. (2019). Big data analytics for maritime safety. In: Proceedings of the International Conference on e-Business Engineering (ICEBE) (pp. 1-8). IEEE.
- Talley, W. K. , Jin, D., & Kite-Powell, H. (2008). Determinants of the severity of cruise vessel accidents. Transportation Research Part D: Transport and Environment, 13(2), 86–94. [CrossRef]
- Talley, W. K. , Jin, D., Kite-Powell, H. (2008). Determinants of the severity of cruise vessel accidents. Transportation Research Part D: Transport and Environment, Vol. 13 (2), pp. 86-94. [CrossRef]
- Toffoli, A. , Lefevre J.M., Bitner-Gregersen E., Monbaliu J. Towards the identification of warning criteria: Analysis of a ship accident database. Appl. Ocean Res. 2005:27, 281–291. [CrossRef]
- Ventikos, N. , Stavrou, D., Andritsopoulos, A. (2016). Studying the marine accidents of the Aegean Sea: critical review, analysis and results, Journal of Marine Engineering & Technology Vol. 16 (3), pp. 103-113. [CrossRef]
- Wu, J. , Thorne-Large, J., & Zhang, P. (2021). Safety first: The risk of over-reliance on technology in navigation. Journal of Transportation Safety & Security, 14(7), 1220–1246. [CrossRef]
- Xu, M., Ma, X., Zhao, Y., & Qiao, W. (2023). A Systematic Literature Review of Maritime Transportation Safety Management. Journal of Marine Science and Engineering, 11(12), 2311. [CrossRef]
- Zhang, W. , Kopca, C., Tang, J., Ma, D. (2017). A Systematic Approach for Collision Risk Analysis based on AIS Data. Journal of Navigation, Vol. 70(05), pp. 1-16. [CrossRef]
Figure 1.
Big Data Analysis: Frequency Table: Accidents. Source: Own study.
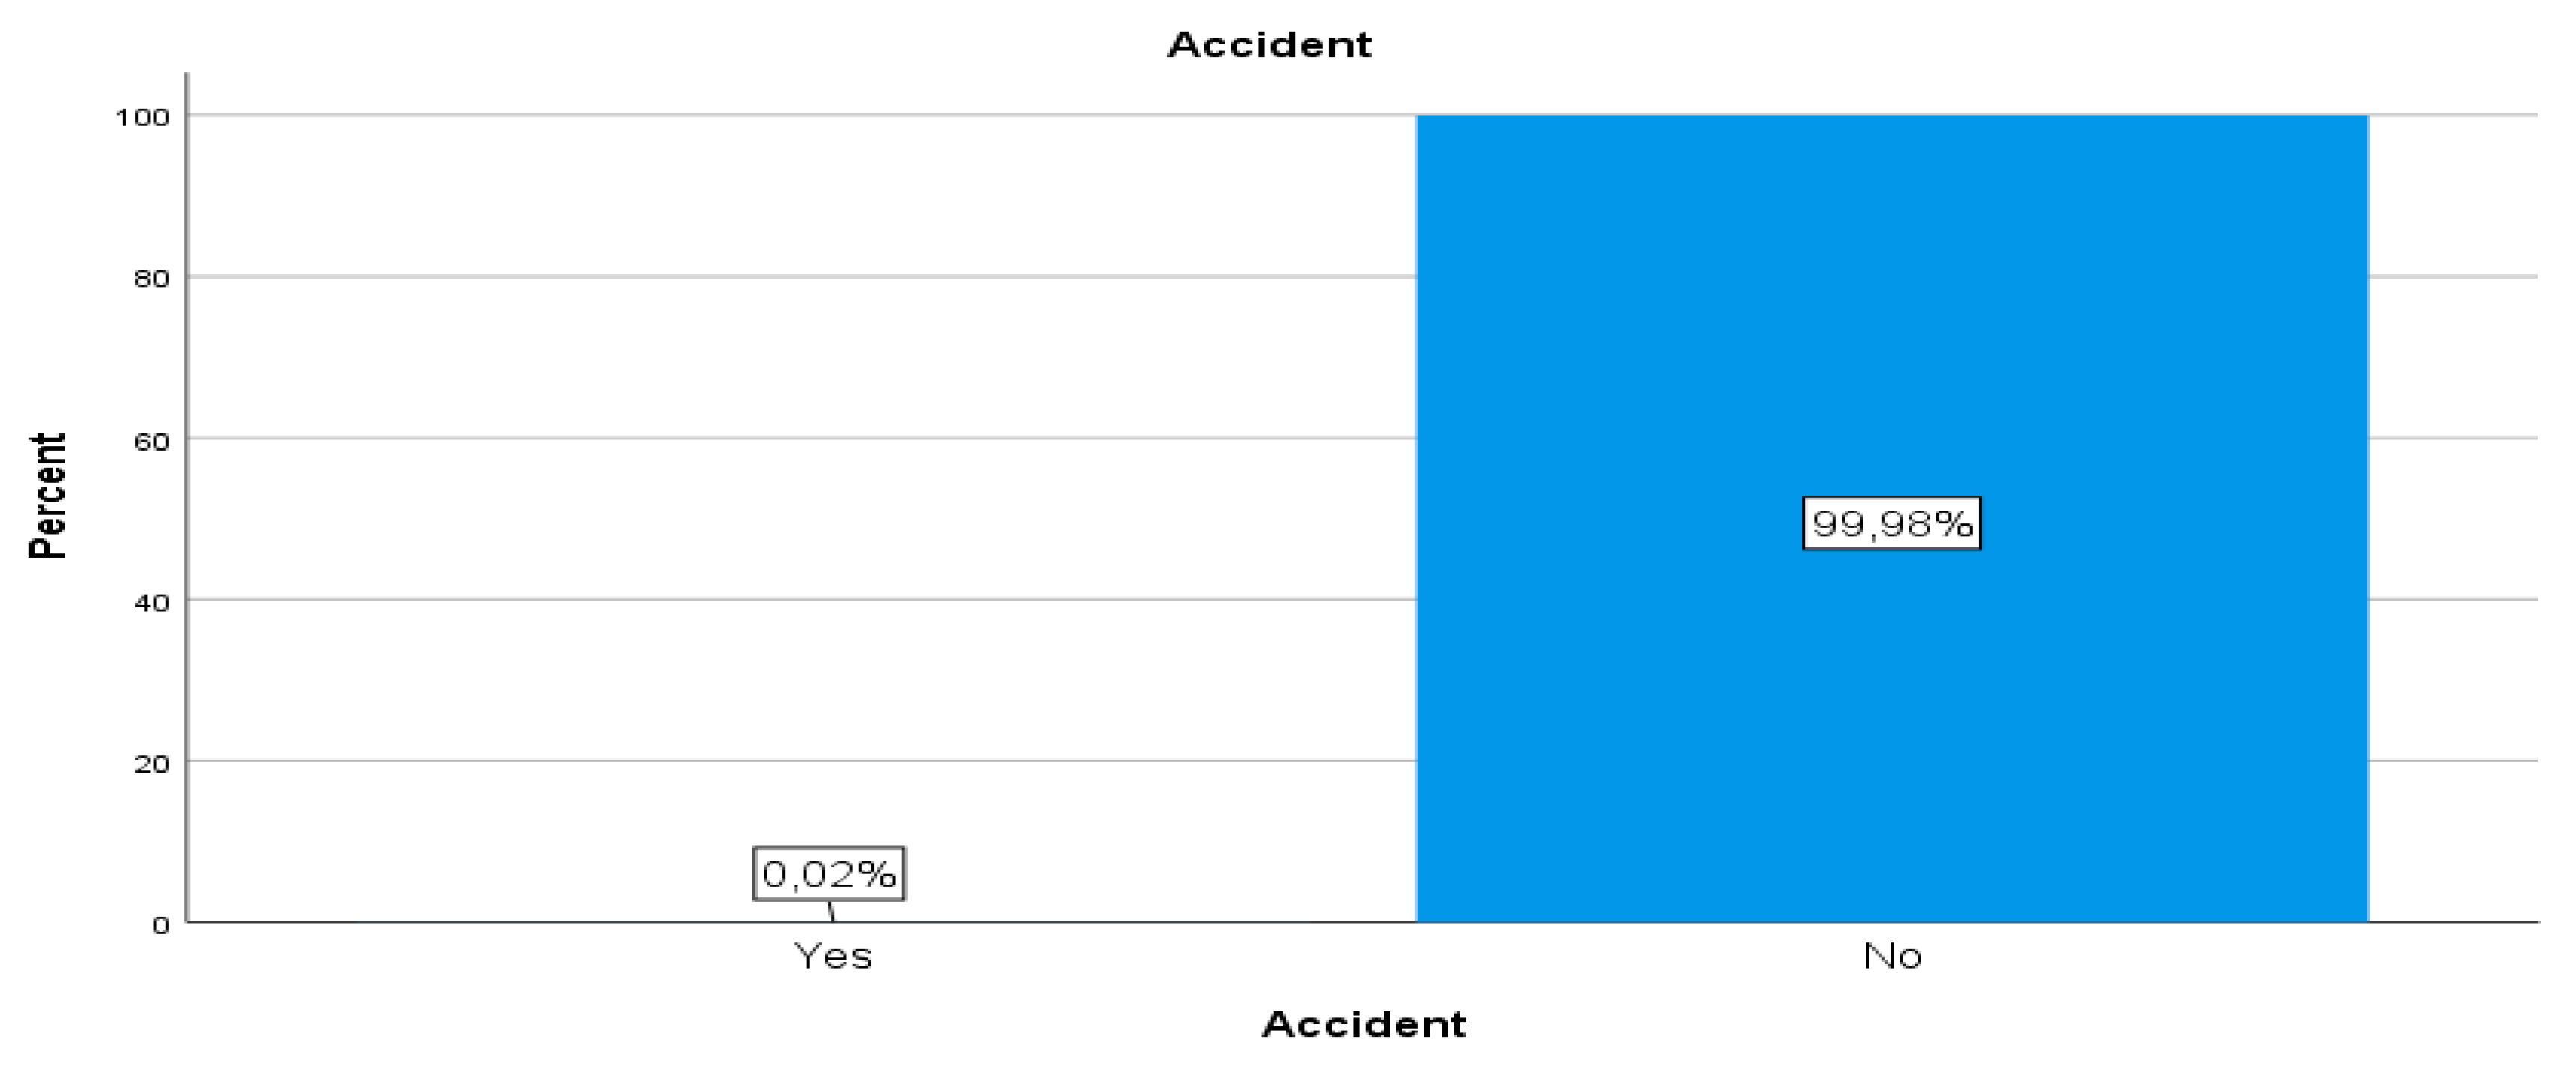
Figure 2.
Big Data Analysis: Dataset in Sizing. Source: Own study.
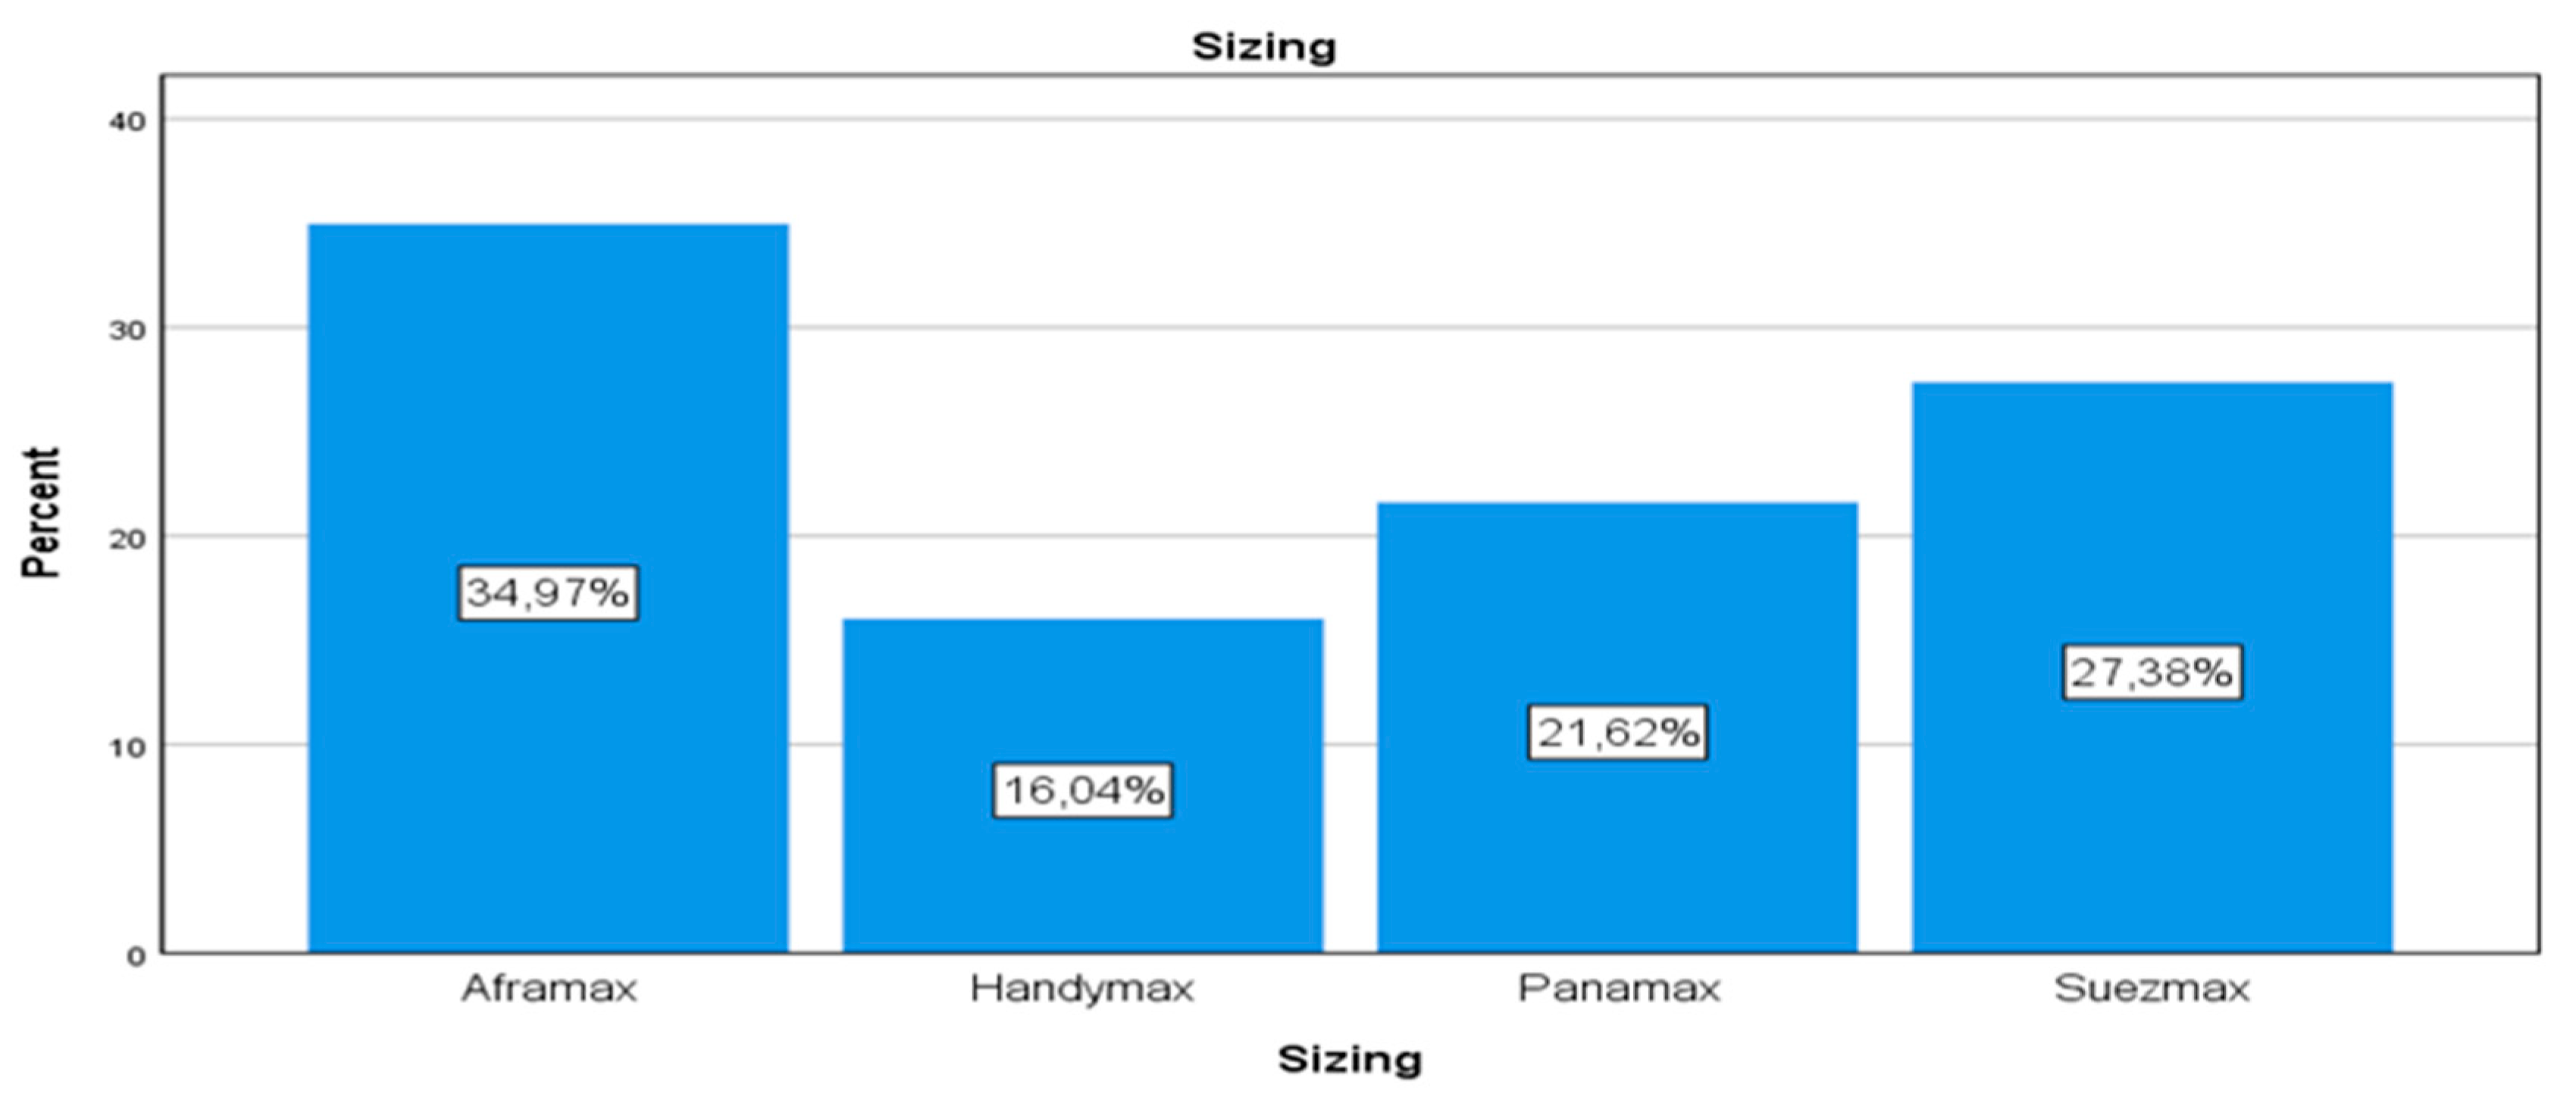

Table 1.
Big Data Analysis: Descriptive Statistics.
| Statistics | ||||||||
| N | Mean | Median | Mode | Std. Deviation | Minimum | Maximum | ||
| Valid | Missing | |||||||
| Accident | 90.215 | 0 | 1,00 | 1,00 | 1 | ,016 | 0 | 1 |
| Sizing | 90.215 | 0 | 2,41 | 2,00 | 1 | 1,220 | 1 | 4 |
| Deadweight | 90.215 | 0 | 105.102,29 | 112.949,00 | 163.216 | 41.213,871 | 39.378 | 164.565 |
| Average Ambient Temperature | 28.359 | 61.856 | 22,2185 | 24,0000 | 28,00 | 8,38562 | -13,00 | 255,00 |
| Wind Force (BFT) | 28.177 | 62.038 | 4,5013 | 4,0000 | 4,00 | 1,36081 | ,00 | 10,00 |
| Swell Force (DSS) | 28.156 | 62.059 | 3,1945 | 3,0000 | 4,00 | 1,73445 | ,00 | 9,00 |
| Average Speed, in Knots | 70.598 | 19.617 | 5,9592 | 3,5000 | ,00 | 6,66689 | ,00 | 490,00 |
Source: Own study.
Table 2.
Big Data Analysis: Frequency Table: Accidents.
| Accident | |||||
| Frequency | Percent | Valid Percent | Cumulative Percent | ||
| Valid | Yes | 22 | ,024 | ,024 | ,0 |
| No | 90.193 | 99,975 | 100,0 | 100,0 | |
| Total | 90.215 | 100,0 | 100,0 | ||
Source: Own study.
Table 3.
Big Data Analysis: Dataset in Sizing.
| Sizing | |||||
| Frequency | Percent | Valid Percent | Cumulative Percent | ||
| Valid | Aframax | 31.546 | 35,0 | 35,0 | 35,0 |
| Handymax | 14.467 | 16,0 | 16,0 | 51,0 | |
| Panamax | 19.502 | 21,6 | 21,6 | 72,6 | |
| Suezmax | 24.700 | 27,4 | 27,4 | 100,0 | |
| Total | 90.215 | 100,0 | 100,0 | ||
Source: Own study.
Table 4.
Big Data Analysis: Deadweight.
| Deadweight | |||||
| Frequency | Percent | Valid Percent | Cumulative Percent | ||
| Valid | 39.378 | 6.092 | 6,8 | 6,8 | 6,8 |
| 39.589 | 5.867 | 6,5 | 6,5 | 13,3 | |
| 53.107 | 2.508 | 2,8 | 2,8 | 16,0 | |
| 68.439 | 2.592 | 2,9 | 2,9 | 18,9 | |
| 74.039 | 2.225 | 2,5 | 2,5 | 21,4 | |
| 74.043 | 2.430 | 2,7 | 2,7 | 24,1 | |
| 74.251 | 2.378 | 2,6 | 2,6 | 26,7 | |
| 74.296 | 4.963 | 5,5 | 5,5 | 32,2 | |
| 74.327 | 2.504 | 2,8 | 2,8 | 35,0 | |
| 74.329 | 2.410 | 2,7 | 2,7 | 37,7 | |
| 105.344 | 2.731 | 3,0 | 3,0 | 40,7 | |
| 105.365 | 2.354 | 2,6 | 2,6 | 43,3 | |
| 105.374 | 2.362 | 2,6 | 2,6 | 45,9 | |
| 105.392 | 3.048 | 3,4 | 3,4 | 49,3 | |
| 112.949 | 3.107 | 3,4 | 3,4 | 52,7 | |
| 113.004 | 2.436 | 2,7 | 2,7 | 55,4 | |
| 113.039 | 2.875 | 3,2 | 3,2 | 58,6 | |
| 113.554 | 2.438 | 2,7 | 2,7 | 61,3 | |
| 113.612 | 2.459 | 2,7 | 2,7 | 64,0 | |
| 113.651 | 2.511 | 2,8 | 2,8 | 66,8 | |
| 113.737 | 2.778 | 3,1 | 3,1 | 69,9 | |
| 117.055 | 2.447 | 2,7 | 2,7 | 72,6 | |
| 155.721 | 4.960 | 5,5 | 5,5 | 78,1 | |
| 155.723 | 2.484 | 2,8 | 2,8 | 80,9 | |
| 157.539 | 2.152 | 2,4 | 2,4 | 83,3 | |
| 157.648 | 2.145 | 2,4 | 2,4 | 85,6 | |
| 157.740 | 2.142 | 2,4 | 2,4 | 88,0 | |
| 163.216 | 6.537 | 7,2 | 7,2 | 95,3 | |
| 163.250 | 2.068 | 2,3 | 2,3 | 97,5 | |
| 164.565 | 2.212 | 2,5 | 2,5 | 100,0 | |
| Total | 90.215 | 100,0 | 100,0 | ||
Source: Own study.
Table 5.
Big Data Analysis: Deadweight in groups.
| Deadweight (Groups) | |||||
| Frequency | Percent | Valid Percent | Cumulative Percent | ||
| Valid | Up to 75.000 | 33.969 | 37,7 | 37,7 | 37,7 |
| 75.001 - 150.000 | 31.546 | 35,0 | 35,0 | 72,6 | |
| Above 150.000 | 24.700 | 27,4 | 27,4 | 100,0 | |
| Total | 90.215 | 100,0 | 100,0 | ||
Source: Own study.
Table 6.
Big Data Analysis: Average Ambient Temperate (Groups).
| Average Ambient Temperature (Groups) | |||||
| Frequency | Percent | Valid Percent | Cumulative Percent | ||
| Valid | Up to 20 | 10.393 | 11,5 | 36,6 | 36,6 |
| 20,1 - 28 | 11.096 | 12,3 | 39,1 | 75,8 | |
| Above 28,01 | 6.870 | 7,6 | 24,2 | 100,0 | |
| Total | 28.359 | 31,4 | 100,0 | ||
| Missing | System | 61.856 | 68,6 | ||
| Total | 90.215 | 100,0 | |||
Source: Own study.
Table 7.
Big Data Analysis: A Comprehensive Analysis of Wind Force Data Categorized According to the Beaufort Wind Force Scale.
Table 7.
Big Data Analysis: A Comprehensive Analysis of Wind Force Data Categorized According to the Beaufort Wind Force Scale.
| Wind Force (BFT) | |||||
| Frequency | Percent | Valid Percent | Cumulative Percent | ||
| Valid | ,00 | 41 | ,0 | ,1 | ,1 |
| 1,00 | 139 | ,2 | ,5 | ,6 | |
| 2,00 | 749 | ,8 | 2,7 | 3,3 | |
| 3,00 | 5.602 | 6,2 | 19,9 | 23,2 | |
| 4,00 | 9.348 | 10,4 | 33,2 | 56,4 | |
| 5,00 | 5.722 | 6,3 | 20,3 | 76,7 | |
| 6,00 | 4.474 | 5,0 | 15,9 | 92,5 | |
| 7,00 | 1.440 | 1,6 | 5,1 | 97,7 | |
| 8,00 | 524 | ,6 | 1,9 | 99,5 | |
| 9,00 | 107 | ,1 | ,4 | 99,9 | |
| 10,00 | 31 | ,0 | ,1 | 100,0 | |
| Total | 28.177 | 31,2 | 100,0 | ||
| Missing | System | 62.038 | 68,8 | ||
| Total | 90.215 | 100,0 | |||
Source: Own study.
Table 8.
Big Data Analysis: Swell Force Data Categorized by the DSS (Douglas Sea Scale).
| Sea State (DSS) | |||||
| Frequency | Percent | Valid Percent | Cumulative Percent | ||
| Valid | Calm (Glassy) | 99 | ,1 | ,4 | ,4 |
| Calm (rippled) | 486 | ,5 | 1,7 | 2,1 | |
| Smooth | 1.957 | 2,2 | 7,0 | 9,0 | |
| Slight | 7.582 | 8,4 | 27,0 | 36,0 | |
| Moderate | 9.901 | 11,0 | 35,2 | 71,3 | |
| Rough | 5.038 | 5,6 | 17,9 | 89,2 | |
| Very rough | 2.192 | 2,4 | 7,8 | 97,0 | |
| High | 620 | ,7 | 2,2 | 99,2 | |
| Very high | 198 | ,2 | ,7 | 99,9 | |
| Phenomenal | 23 | ,0 | ,1 | 100,0 | |
| Total | 28.096 | 31,1 | 100,0 | ||
| Missing | System | 62.119 | 68,9 | ||
| Total | 90.215 | 100,0 | |||
Source: Own study.
Table 9.
Big Data Analysis: Average speed.
| Average Speed, in Knots (Groups) | |||||
| Frequency | Percent | Valid Percent | Cumulative Percent | ||
| Valid | Zero speed | 26.749 | 29,7 | 37,9 | 37,9 |
| 0,01 - 3,5 | 8.652 | 9,6 | 12,3 | 50,1 | |
| 3,51 - 12,2 | 17.366 | 19,2 | 24,6 | 74,7 | |
| More than 12,21 | 17.831 | 19,8 | 25,3 | 100,0 | |
| Total | 70.598 | 78,3 | 100,0 | ||
| Missing | System | 19.617 | 21,7 | ||
| Total | 90.215 | 100,0 | |||
Source: Own study.
Table 10.
Big Data Analysis: Cargo Distribution.
| Cargo | |||||
| Frequency | Percent | Valid Percent | Cumulative Percent | ||
| Valid | Laden | 53.809 | 59,6 | 59,6 | 59,6 |
| Ballast | 36.406 | 40,4 | 40,4 | 100,0 | |
| Total | 90.215 | 100,0 | 100,0 | ||
Source: Own study.
Table 11.
Big Data Analysis: Vessel State.
| Vessel State | |||||
| Frequency | Percent | Valid Percent | Cumulative Percent | ||
| Valid | At Port | 30.163 | 33,4 | 36,3 | 36,3 |
| Dry Dock | 644 | ,7 | ,8 | 37,0 | |
| Maneuvering | 18.575 | 20,6 | 22,3 | 59,4 | |
| Operation | 5.437 | 6,0 | 6,5 | 65,9 | |
| Sea Passage | 28.359 | 31,4 | 34,1 | 100,0 | |
| Total | 83.178 | 92,2 | 100,0 | ||
| Missing | System | 7.037 | 7,8 | ||
| Total | 90.215 | 100,0 | |||
Source: Own study.
Table 12.
Crosstabulation Analysis: Accident * Sizing.
| Crosstab | |||||||
| Sizing | Total | ||||||
| Aframax | Handymax | Panamax | Suezmax | ||||
| Accident | Yes | Count | 7 | 3 | 3 | 9 | 22 |
| % within Accident | 31,8% | 13,6% | 13,6% | 40,9% | 100,0% | ||
| % within Sizing | 0,0% | 0,0% | 0,0% | 0,0% | 0,0% | ||
| % of Total | 0,0% | 0,0% | 0,0% | 0,0% | 0,0% | ||
| No | Count | 31.539 | 14.464 | 19.499 | 24.691 | 90.193 | |
| % within Accident | 35,0% | 16,0% | 21,6% | 27,4% | 100,0% | ||
| % within Sizing | 100,0% | 100,0% | 100,0% | 100,0% | 100,0% | ||
| % of Total | 35,0% | 16,0% | 21,6% | 27,4% | 100,0% | ||
| Total | Count | 31.546 | 14.467 | 19.502 | 24.700 | 90.215 | |
| % within Accident | 35,0% | 16,0% | 21,6% | 27,4% | 100,0% | ||
| % within Sizing | 100,0% | 100,0% | 100,0% | 100,0% | 100,0% | ||
| % of Total | 35,0% | 16,0% | 21,6% | 27,4% | 100,0% | ||
Source: Own study.
Table 13.
Crosstabulation Analysis: Chi-Square Tests.
| Chi-Square Tests | |||
| Value | df | Asymptotic Significance (2-sided) | |
| Pearson Chi-Square | 2,261a | 3 | ,520 |
| Likelihood Ratio | 2,170 | 3 | ,538 |
| Linear-by-Linear Association | ,730 | 1 | ,393 |
| N of Valid Cases | 90.215 | ||
| a. 2 cells (25,0%) have expected count less than 5. The minimum expected count is 3,53. | |||
Source: Own study.
Table 14.
Crosstabulation Analysis: Accident * Deadweight (Groups).
| Crosstab | ||||||
| Deadweight (Groups) | Total | |||||
| Up to 75.000 | 75.001 - 150.000 | Above 150.000 | ||||
| Accident | Yes | Count | 6 | 7 | 9 | 22 |
| % within Accident | 27,3% | 31,8% | 40,9% | 100,0% | ||
| % within Deadweight (Groups) | 0,0% | 0,0% | 0,0% | 0,0% | ||
| % of Total | 0,0% | 0,0% | 0,0% | 0,0% | ||
| No | Count | 33.963 | 31.539 | 24.691 | 90.193 | |
| % within Accident | 37,7% | 35,0% | 27,4% | 100,0% | ||
| % within Deadweight (Groups) | 100,0% | 100,0% | 100,0% | 100,0% | ||
| % of Total | 37,6% | 35,0% | 27,4% | 100,0% | ||
| Total | Count | 33.969 | 31.546 | 24.700 | 90.215 | |
| % within Accident | 37,7% | 35,0% | 27,4% | 100,0% | ||
| % within Deadweight (Groups) | 100,0% | 100,0% | 100,0% | 100,0% | ||
| % of Total | 37,7% | 35,0% | 27,4% | 100,0% | ||
Source: Own study.
Table 15.
Crosstabulation Analysis: Chi-Square Tests.
| Chi-Square Tests | |||
| Value | df | Asymptotic Significance (2-sided) | |
| Pearson Chi-Square | 2,164a | 2 | ,339 |
| Likelihood Ratio | 2,037 | 2 | ,361 |
| Linear-by-Linear Association | 1,966 | 1 | ,161 |
| N of Valid Cases | 90.215 | ||
| a. 0 cells (0,0%) have expected count less than 5. The minimum expected count is 6,02. | |||
Source: Own study.
Table 16.
Cross tabulation: Accident * Average Ambient Temperature (Groups).
| Crosstab | ||||||
| Average Ambient Temperature (Groups) | Total | |||||
| Up to 20 | 20,1 - 28 | Above 28,01 | ||||
| Accident | Yes | Count | 6 | 5 | 2 | 13 |
| % within Accident | 46,2% | 38,5% | 15,4% | 100,0% | ||
| % within Average Ambient Temperature (Groups) | 0,1% | 0,0% | 0,0% | 0,0% | ||
| % of Total | 0,0% | 0,0% | 0,0% | 0,0% | ||
| No | Count | 10.387 | 11.091 | 6.868 | 28.346 | |
| % within Accident | 36,6% | 39,1% | 24,2% | 100,0% | ||
| % within Average Ambient Temperature (Groups) | 99,9% | 100,0% | 100,0% | 100,0% | ||
| % of Total | 36,6% | 39,1% | 24,2% | 100,0% | ||
| Total | Count | 10.393 | 11.096 | 6.870 | 28.359 | |
| % within Accident | 36,6% | 39,1% | 24,2% | 100,0% | ||
| % within Average Ambient Temperature (Groups) | 100,0% | 100,0% | 100,0% | 100,0% | ||
| % of Total | 36,6% | 39,1% | 24,2% | 100,0% | ||
Source: Own study.
Table 17.
Cross tabulation: Accident * Average Ambient Temperature (Groups) Chi-Square Tests.
| Chi-Square Tests | |||
| Value | df | Asymptotic Significance (2-sided) | |
| Pearson Chi-Square | ,742a | 2 | ,690 |
| Likelihood Ratio | ,780 | 2 | ,677 |
| Linear-by-Linear Association | ,738 | 1 | ,390 |
| N of Valid Cases | 28.359 | ||
| a. 2 cells (33,3%) have expected count less than 5. The minimum expected count is 3,15. | |||
Source: Own study.
Table 18.
Bid Data Analysis: ANOVA, Descriptives.
| Descriptives | |||||||||
| N | Mean | Std. Deviation | Std. Error | 95% Confidence Interval for Mean | Minimum | Maximum | |||
| Lower Bound | Upper Bound | ||||||||
| Sizing | Yes | 22 | 2,64 | 1,329 | ,283 | 2,05 | 3,23 | 1 | 4 |
| No | 90.193 | 2,41 | 1,220 | ,004 | 2,41 | 2,42 | 1 | 4 | |
| Total | 90.215 | 2,41 | 1,220 | ,004 | 2,41 | 2,42 | 1 | 4 | |
| Deadweight | Yes | 22 | 116.240,20 | 43.832,271 | 9.345,072 | 96.806,06 | 135.674,34 | 39.378 | 163.250 |
| No | 90.193 | 105.099,58 | 41.213,103 | 137,230 | 104.830,61 | 105.368,55 | 39.378 | 164.565 | |
| Total | 90.215 | 105.102,29 | 41.213,871 | 137,216 | 104.833,35 | 105.371,24 | 39.378 | 164.565 | |
| Deadweight (Groups) | Yes | 22 | 2,14 | ,834 | ,178 | 1,77 | 2,51 | 1 | 3 |
| No | 90.193 | 1,90 | ,800 | ,003 | 1,89 | 1,90 | 1 | 3 | |
| Total | 90.215 | 1,90 | ,800 | ,003 | 1,89 | 1,90 | 1 | 3 | |
| Average Ambient Temperature | Yes | 13 | 20,1538 | 8,84916 | 2,45432 | 14,8064 | 25,5013 | 1,00 | 30,00 |
| No | 28.346 | 22,2194 | 8,38545 | ,04981 | 22,1218 | 22,3170 | -13,00 | 255,00 | |
| Total | 28.359 | 22,2185 | 8,38562 | ,04980 | 22,1209 | 22,3161 | -13,00 | 255,00 | |
| Average Ambient Temperature (Groups) | Yes | 13 | 1,69 | ,751 | ,208 | 1,24 | 2,15 | 1 | 3 |
| No | 28.346 | 1,88 | ,770 | ,005 | 1,87 | 1,88 | 1 | 3 | |
| Total | 28.359 | 1,88 | ,770 | ,005 | 1,87 | 1,88 | 1 | 3 | |
| Wind Force (BFT) | Yes | 13 | 4,1538 | 1,46322 | ,40583 | 3,2696 | 5,0381 | 1,00 | 6,00 |
| No | 28.164 | 4,5015 | 1,36077 | ,00811 | 4,4856 | 4,5174 | ,00 | 10,00 | |
| Total | 28.177 | 4,5013 | 1,36081 | ,00811 | 4,4854 | 4,5172 | ,00 | 10,00 | |
| Swell Force (DSS) | Yes | 13 | 2,9231 | 1,49786 | ,41543 | 2,0179 | 3,8282 | ,00 | 5,00 |
| No | 28.143 | 3,1946 | 1,73456 | ,01034 | 3,1743 | 3,2149 | ,00 | 9,00 | |
| Total | 28.156 | 3,1945 | 1,73445 | ,01034 | 3,1742 | 3,2147 | ,00 | 9,00 | |
| Sea State (DSS) | Yes | 13 | 3,7692 | 1,48064 | ,41066 | 2,8745 | 4,6640 | 1,00 | 6,00 |
| No | 28.083 | 3,9588 | 1,25773 | ,00751 | 3,9441 | 3,9735 | ,00 | 9,00 | |
| Total | 28.096 | 3,9587 | 1,25781 | ,00750 | 3,9440 | 3,9734 | ,00 | 9,00 | |
| Average Speed, in Knots | Yes | 21 | 6,8895 | 6,20515 | 1,35408 | 4,0650 | 9,7141 | ,00 | 13,84 |
| No | 70.577 | 5,9590 | 6,66704 | ,02510 | 5,9098 | 6,0082 | ,00 | 490,00 | |
| Total | 70.598 | 5,9592 | 6,66689 | ,02509 | 5,9101 | 6,0084 | ,00 | 490,00 | |
| Average Speed, in Knots (Groups) | Yes | 21 | 2,57 | 1,363 | ,297 | 1,95 | 3,19 | 1 | 4 |
| No | 70.577 | 2,37 | 1,223 | ,005 | 2,36 | 2,38 | 1 | 4 | |
| Total | 70.598 | 2,37 | 1,223 | ,005 | 2,36 | 2,38 | 1 | 4 | |
Source: Own study.
Table 19.
Bid Data Analysis: ANOVA.
| ANOVA | ||||||
| Sum of Squares | df | Mean Square | F | Sig. | ||
| Sizing | Between Groups | 1,087 | 1 | 1,087 | ,730 | ,393 |
| Within Groups | 134.378,634 | 90.213 | 1,490 | |||
| Total | 134.379,722 | 90.214 | ||||
| Deadweight | Between Groups | 2.729.832.761,146 | 1 | 2.729.832.761,146 | 1,607 | ,205 |
| Within Groups | 153.233.252.987.388,120 | 90.213 | 1.698.571.746,726 | |||
| Total | 153.235.982.820.149,280 | 90.214 | ||||
| Deadweight (Groups) | Between Groups | 1,258 | 1 | 1,258 | 1,966 | ,161 |
| Within Groups | 57.715,413 | 90.213 | ,640 | |||
| Total | 57.716,671 | 90.214 | ||||
| Average Ambient Temperature | Between Groups | 55,440 | 1 | 55,440 | ,788 | ,375 |
| Within Groups | 1.994.040,973 | 28.357 | 70,319 | |||
| Total | 1.994.096,413 | 28.358 | ||||
| Average Ambient Temperature (Groups) | Between Groups | ,438 | 1 | ,438 | ,738 | ,390 |
| Within Groups | 16.824,905 | 28.357 | ,593 | |||
| Total | 16.825,343 | 28.358 | ||||
| Wind Force (BFT) | Between Groups | 1,570 | 1 | 1,570 | ,848 | ,357 |
| Within Groups | 52.174,630 | 28.175 | 1,852 | |||
| Total | 52.176,200 | 28.176 | ||||
| Swell Force (DSS) | Between Groups | ,958 | 1 | ,958 | ,318 | ,573 |
| Within Groups | 84.698,026 | 28.154 | 3,008 | |||
| Total | 84.698,985 | 28.155 | ||||
| Sea State (DSS) | Between Groups | ,467 | 1 | ,467 | ,295 | ,587 |
| Within Groups | 44.448,558 | 28.094 | 1,582 | |||
| Total | 44.449,024 | 28.095 | ||||
| Average Speed, in Knots | Between Groups | 18,179 | 1 | 18,179 | ,409 | ,522 |
| Within Groups | 3.137.833,996 | 70.596 | 44,448 | |||
| Total | 3.137.852,175 | 70.597 | ||||
| Average Speed, in Knots (Groups) | Between Groups | ,833 | 1 | ,833 | ,557 | ,456 |
| Within Groups | 105.656,220 | 70.596 | 1,497 | |||
| Total | 105.657,054 | 70.597 | ||||
Source: Own study.
Table 20.
Correlation Analysis: Pearson Test.
| Correlations | ||||||||||||||
| Accident | Sizing | Deadweight | Deadweight (Groups) | Average Ambient Temperature | Average Amine Temperature (Groups) | Wind Force (BFT) | Swell Force (DSS) | Sea State (DSS) | Average Speed, in Knots | Average Speed, in Knots (Groups) | Cargo | Vessel State | ||
| Accident | Pearson Correlation | 1 | -,003 | -,004 | -,005 | ,005 | ,005 | ,005 | ,003 | ,003 | -,002 | -,003 | -,003 | -,004 |
| Sig. (2-tailed) | ,393 | ,205 | ,161 | ,375 | ,390 | ,357 | ,573 | ,587 | ,522 | ,456 | ,356 | ,276 | ||
| N | 90.215 | 90.215 | 90.215 | 90.215 | 28.359 | 28.359 | 28.177 | 28.156 | 28.096 | 70.598 | 70.598 | 90.215 | 83.178 | |
| Sizing | Pearson Correlation | -,003 | 1 | ,417** | ,383** | ,191** | ,153** | -,073** | ,004 | -,128** | -,003 | ,012** | -,023** | ,015** |
| Sig. (2-tailed) | ,393 | ,000 | ,000 | ,000 | ,000 | ,000 | ,461 | ,000 | ,415 | ,001 | ,000 | ,000 | ||
| N | 90.215 | 90.215 | 90.215 | 90.215 | 28.359 | 28.359 | 28.177 | 28.156 | 28.096 | 70.598 | 70.598 | 90.215 | 83.178 | |
| Deadweight | Pearson Correlation | -,004 | ,417** | 1 | ,968** | ,034** | ,024** | ,096** | ,018** | ,057** | ,062** | ,078** | ,024** | ,093** |
| Sig. (2-tailed) | ,205 | ,000 | ,000 | ,000 | ,000 | ,000 | ,003 | ,000 | ,000 | ,000 | ,000 | ,000 | ||
| N | 90.215 | 90.215 | 90.215 | 90.215 | 28.359 | 28.359 | 28.177 | 28.156 | 28.096 | 70.598 | 70.598 | 90.215 | 83.178 | |
| Deadweight (Groups) | Pearson Correlation | -,005 | ,383** | ,968** | 1 | ,013* | ,001 | ,088** | ,000 | ,050** | ,053** | ,070** | ,027** | ,084** |
| Sig. (2-tailed) | ,161 | ,000 | ,000 | ,023 | ,816 | ,000 | ,950 | ,000 | ,000 | ,000 | ,000 | ,000 | ||
| N | 90.215 | 90.215 | 90.215 | 90.215 | 28.359 | 28.359 | 28.177 | 28.156 | 28.096 | 70.598 | 70.598 | 90.215 | 83.178 | |
| Average Ambient Temperature | Pearson Correlation | ,005 | ,191** | ,034** | ,013* | 1 | ,840** | -,227** | -,115** | -,193** | ,088** | ,110** | -,010 | .c |
| Sig. (2-tailed) | ,375 | ,000 | ,000 | ,023 | ,000 | ,000 | ,000 | ,000 | ,000 | ,000 | ,105 | ,000 | ||
| N | 28.359 | 28.359 | 28.359 | 28.359 | 28.359 | 28.359 | 28.177 | 28.156 | 28.096 | 27.824 | 27.824 | 28.359 | 28.359 | |
| Average Ambient Temperature (Groups) | Pearson Correlation | ,005 | ,153** | ,024** | ,001 | ,840** | 1 | -,229** | -,118** | -,196** | ,071** | ,090** | -,003 | .c |
| Sig. (2-tailed) | ,390 | ,000 | ,000 | ,816 | ,000 | ,000 | ,000 | ,000 | ,000 | ,000 | ,563 | ,000 | ||
| N | 28.359 | 28.359 | 28.359 | 28.359 | 28.359 | 28.359 | 28.177 | 28.156 | 28.096 | 27.824 | 27.824 | 28.359 | 28.359 | |
| Wind Force (BFT) | Pearson Correlation | ,005 | -,073** | ,096** | ,088** | -,227** | -,229** | 1 | ,626** | ,867** | -,105** | -,199** | -,117** | .c |
| Sig. (2-tailed) | ,357 | ,000 | ,000 | ,000 | ,000 | ,000 | ,000 | ,000 | ,000 | ,000 | ,000 | ,000 | ||
| N | 28.177 | 28.177 | 28.177 | 28.177 | 28.177 | 28.177 | 28.177 | 28.142 | 28.081 | 27.644 | 27.644 | 28.177 | 28.177 | |
| Swell Force (DSS) | Pearson Correlation | ,003 | ,004 | ,018** | ,000 | -,115** | -,118** | ,626** | 1 | ,660** | -,094** | -,170** | -,076** | .c |
| Sig. (2-tailed) | ,573 | ,461 | ,003 | ,950 | ,000 | ,000 | ,000 | ,000 | ,000 | ,000 | ,000 | ,000 | ||
| N | 28.156 | 28.156 | 28.156 | 28.156 | 28.156 | 28.156 | 28.142 | 28.156 | 28.075 | 27.626 | 27.626 | 28.156 | 28.156 | |
| Sea State (DSS) | Pearson Correlation | ,003 | -,128** | ,057** | ,050** | -,193** | -,196** | ,867** | ,660** | 1 | -,103** | -,199** | -,108** | .c |
| Sig. (2-tailed) | ,587 | ,000 | ,000 | ,000 | ,000 | ,000 | ,000 | ,000 | ,000 | ,000 | ,000 | ,000 | ||
| N | 28.096 | 28.096 | 28.096 | 28.096 | 28.096 | 28.096 | 28.081 | 28.075 | 28.096 | 27.567 | 27.567 | 28.096 | 28.096 | |
| Average Speed, in Knots | Pearson Correlation | -,002 | -,003 | ,062** | ,053** | ,088** | ,071** | -,105** | -,094** | -,103** | 1 | ,857** | -,044** | ,700** |
| Sig. (2-tailed) | ,522 | ,415 | ,000 | ,000 | ,000 | ,000 | ,000 | ,000 | ,000 | ,000 | ,000 | ,000 | ||
| N | 70.598 | 70.598 | 70.598 | 70.598 | 27.824 | 27.824 | 27.644 | 27.626 | 27.567 | 70.598 | 70.598 | 70.598 | 64.191 | |
| Average Speed, in Knots (Groups) | Pearson Correlation | -,003 | ,012** | ,078** | ,070** | ,110** | ,090** | -,199** | -,170** | -,199** | ,857** | 1 | -,048** | ,791** |
| Sig. (2-tailed) | ,456 | ,001 | ,000 | ,000 | ,000 | ,000 | ,000 | ,000 | ,000 | ,000 | ,000 | ,000 | ||
| N | 70.598 | 70.598 | 70.598 | 70.598 | 27.824 | 27.824 | 27.644 | 27.626 | 27.567 | 70.598 | 70.598 | 70.598 | 64.191 | |
| Cargo | Pearson Correlation | -,003 | -,023** | ,024** | ,027** | -,010 | -,003 | -,117** | -,076** | -,108** | -,044** | -,048** | 1 | -,043** |
| Sig. (2-tailed) | ,356 | ,000 | ,000 | ,000 | ,105 | ,563 | ,000 | ,000 | ,000 | ,000 | ,000 | ,000 | ||
| N | 90.215 | 90.215 | 90.215 | 90.215 | 28.359 | 28.359 | 28.177 | 28.156 | 28.096 | 70.598 | 70.598 | 90.215 | 83.178 | |
| Vessel State | Pearson Correlation | -,004 | ,015** | ,093** | ,084** | .c | .c | .c | .c | .c | ,700** | ,791** | -,043** | 1 |
| Sig. (2-tailed) | ,276 | ,000 | ,000 | ,000 | ,000 | ,000 | ,000 | ,000 | ,000 | ,000 | ,000 | ,000 | ||
| N | 83.178 | 83.178 | 83.178 | 83.178 | 28.359 | 28.359 | 28.177 | 28.156 | 28.096 | 64.191 | 64.191 | 83.178 | 83.178 | |
| **. Correlation is significant at the 0.01 level (2-tailed). | ||||||||||||||
| *. Correlation is significant at the 0.05 level (2-tailed). | ||||||||||||||
| c. Cannot be computed because at least one of the variables is constant. | ||||||||||||||
Source: Own study.
Table 21.
Correlation Analysis: Spearman Test.
| Correlations | |||||||||||||||||
| Accident | Sizing | Deadweight | Deadweight (Groups) | Average Ambient Temperature | Average Ambient Temperature (Groups) | Wind Force (BFT) | Swell Force (DSS) | Sea State (DSS) | Average Speed, in Knots | Average Speed, in Knots (Groups) | Cargo | Vessel State | |||||
| Spearman's rho | Accident | Correlation Coefficient | 1,000 | -,003 | -,005 | -,005 | ,005 | ,005 | ,004 | ,004 | ,004 | -,002 | -,003 | -,003 | -,004 | ||
| Sig. (2-tailed) | . | ,382 | ,126 | ,167 | ,400 | ,393 | ,526 | ,522 | ,523 | ,613 | ,455 | ,356 | ,213 | ||||
| N | 90.215 | 90.215 | 90.215 | 90.215 | 28.359 | 28.359 | 28.177 | 28.156 | 28.096 | 70.598 | 70.598 | 90.215 | 83.178 | ||||
| Sizing | Correlation Coefficient | -,003 | 1,000 | ,363** | ,343** | ,163** | ,154** | -,065** | ,002 | -,115** | ,021** | ,017** | -,022** | ,014** | |||
| Sig. (2-tailed) | ,382 | . | ,000 | ,000 | ,000 | ,000 | ,000 | ,741 | ,000 | ,000 | ,000 | ,000 | ,000 | ||||
| N | 90.215 | 90.215 | 90.215 | 90.215 | 28.359 | 28.359 | 28.177 | 28.156 | 28.096 | 70.598 | 70.598 | 90.215 | 83.178 | ||||
| Deadweight | Correlation Coefficient | -,005 | ,363** | 1,000 | ,941** | -,005 | -,003 | ,108** | ,015* | ,079** | ,087** | ,089** | ,031** | ,104** | |||
| Sig. (2-tailed) | ,126 | ,000 | . | ,000 | ,424 | ,661 | ,000 | ,014 | ,000 | ,000 | ,000 | ,000 | ,000 | ||||
| N | 90.215 | 90.215 | 90.215 | 90.215 | 28.359 | 28.359 | 28.177 | 28.156 | 28.096 | 70.598 | 70.598 | 90.215 | 83.178 | ||||
| Deadweight (Groups) | Correlation Coefficient | -,005 | ,343** | ,941** | 1,000 | -,001 | ,003 | ,094** | ,000 | ,059** | ,070** | ,072** | ,028** | ,086** | |||
| Sig. (2-tailed) | ,167 | ,000 | ,000 | . | ,829 | ,580 | ,000 | ,961 | ,000 | ,000 | ,000 | ,000 | ,000 | ||||
| N | 90.215 | 90.215 | 90.215 | 90.215 | 28.359 | 28.359 | 28.177 | 28.156 | 28.096 | 70.598 | 70.598 | 90.215 | 83.178 | ||||
| Average Ambient Temperature | Correlation Coefficient | ,005 | ,163** | -,005 | -,001 | 1,000 | ,937** | -,243** | -,126** | -,211** | ,099** | ,097** | -,007 | . | |||
| Sig. (2-tailed) | ,400 | ,000 | ,424 | ,829 | . | ,000 | ,000 | ,000 | ,000 | ,000 | ,000 | ,222 | . | ||||
| N | 28.359 | 28.359 | 28.359 | 28.359 | 28.359 | 28.359 | 28.177 | 28.156 | 28.096 | 27.824 | 27.824 | 28.359 | 28.359 | ||||
| Average Ambient Temperature (Groups) | Correlation Coefficient | ,005 | ,154** | -,003 | ,003 | ,937** | 1,000 | -,228** | -,118** | -,197** | ,094** | ,090** | -,003 | . | |||
| Sig. (2-tailed) | ,393 | ,000 | ,661 | ,580 | ,000 | . | ,000 | ,000 | ,000 | ,000 | ,000 | ,614 | . | ||||
| N | 28.359 | 28.359 | 28.359 | 28.359 | 28.359 | 28.359 | 28.177 | 28.156 | 28.096 | 27.824 | 27.824 | 28.359 | 28.359 | ||||
| Wind Force (BFT) | Correlation Coefficient | ,004 | -,065** | ,108** | ,094** | -,243** | -,228** | 1,000 | ,616** | ,868** | -,226** | -,201** | -,124** | . | |||
| Sig. (2-tailed) | ,526 | ,000 | ,000 | ,000 | ,000 | ,000 | . | ,000 | ,000 | ,000 | ,000 | ,000 | . | ||||
| N | 28.177 | 28.177 | 28.177 | 28.177 | 28.177 | 28.177 | 28.177 | 28.142 | 28.081 | 27.644 | 27.644 | 28.177 | 28.177 | ||||
| Swell Force (DSS) | Correlation Coefficient | ,004 | ,002 | ,015* | ,000 | -,126** | -,118** | ,616** | 1,000 | ,656** | -,187** | -,175** | -,079** | . | |||
| Sig. (2-tailed) | ,522 | ,741 | ,014 | ,961 | ,000 | ,000 | ,000 | . | ,000 | ,000 | ,000 | ,000 | . | ||||
| N | 28.156 | 28.156 | 28.156 | 28.156 | 28.156 | 28.156 | 28.142 | 28.156 | 28.075 | 27.626 | 27.626 | 28.156 | 28.156 | ||||
| Sea State (DSS) | Correlation Coefficient | ,004 | -,115** | ,079** | ,059** | -,211** | -,197** | ,868** | ,656** | 1,000 | -,228** | -,207** | -,118** | . | |||
| Sig. (2-tailed) | ,523 | ,000 | ,000 | ,000 | ,000 | ,000 | ,000 | ,000 | . | ,000 | ,000 | ,000 | . | ||||
| N | 28.096 | 28.096 | 28.096 | 28.096 | 28.096 | 28.096 | 28.081 | 28.075 | 28.096 | 27.567 | 27.567 | 28.096 | 28.096 | ||||
| Average Speed, in Knots | Correlation Coefficient | -,002 | ,021** | ,087** | ,070** | ,099** | ,094** | -,226** | -,187** | -,228** | 1,000 | ,982** | -,040** | ,808** | |||
| Sig. (2-tailed) | ,613 | ,000 | ,000 | ,000 | ,000 | ,000 | ,000 | ,000 | ,000 | . | ,000 | ,000 | ,000 | ||||
| N | 70.598 | 70.598 | 70.598 | 70.598 | 27.824 | 27.824 | 27.644 | 27.626 | 27.567 | 70.598 | 70.598 | 70.598 | 64.191 | ||||
| Average Speed, in Knots (Groups) | Correlation Coefficient | -,003 | ,017** | ,089** | ,072** | ,097** | ,090** | -,201** | -,175** | -,207** | ,982** | 1,000 | -,046** | ,796** | |||
| Sig. (2-tailed) | ,455 | ,000 | ,000 | ,000 | ,000 | ,000 | ,000 | ,000 | ,000 | ,000 | . | ,000 | ,000 | ||||
| N | 70.598 | 70.598 | 70.598 | 70.598 | 27.824 | 27.824 | 27.644 | 27.626 | 27.567 | 70.598 | 70.598 | 70.598 | 64.191 | ||||
| Cargo | Correlation Coefficient | -,003 | -,022** | ,031** | ,028** | -,007 | -,003 | -,124** | -,079** | -,118** | -,040** | -,046** | 1,000 | -,043** | |||
| Sig. (2-tailed) | ,356 | ,000 | ,000 | ,000 | ,222 | ,614 | ,000 | ,000 | ,000 | ,000 | ,000 | . | ,000 | ||||
| N | 90.215 | 90.215 | 90.215 | 90.215 | 28.359 | 28.359 | 28.177 | 28.156 | 28.096 | 70.598 | 70.598 | 90.215 | 83.178 | ||||
| Vessel State | Correlation Coefficient | -,004 | ,014** | ,104** | ,086** | . | . | . | . | . | ,808** | ,796** | -,043** | 1,000 | |||
| Sig. (2-tailed) | ,213 | ,000 | ,000 | ,000 | . | . | . | . | . | ,000 | ,000 | ,000 | . | ||||
| N | 83.178 | 83.178 | 83.178 | 83.178 | 28.359 | 28.359 | 28.177 | 28.156 | 28.096 | 64.191 | 64.191 | 83.178 | 83.178 | ||||
| **. Correlation is significant at the 0.01 level (2-tailed). | |||||||||||||||||
| *. Correlation is significant at the 0.05 level (2-tailed). | |||||||||||||||||
Source: Own study.
Disclaimer/Publisher’s Note: The statements, opinions and data contained in all publications are solely those of the individual author(s) and contributor(s) and not of MDPI and/or the editor(s). MDPI and/or the editor(s) disclaim responsibility for any injury to people or property resulting from any ideas, methods, instructions or products referred to in the content. |
© 2025 by the authors. Licensee MDPI, Basel, Switzerland. This article is an open access article distributed under the terms and conditions of the Creative Commons Attribution (CC BY) license (http://creativecommons.org/licenses/by/4.0/).
Copyright: This open access article is published under a Creative Commons CC BY 4.0 license, which permit the free download, distribution, and reuse, provided that the author and preprint are cited in any reuse.


