Submitted:
17 March 2025
Posted:
18 March 2025
You are already at the latest version
Abstract
Conditional transgenic systems and multi-copy target transgenes were used to produce transient fluorescent protein expression in adult Drosophila melanogaster, with the goal of developing an in vivo assay of protein turnover. Free-moving flies were assayed at multiple time points using video, and decay in fluorescence used to calculate protein half-life. Additional experiments involved image capture of anesthetized flies. Half-life of eGFP was increased by the proteasome inhibitor bortezomib, both in vivo and in vitro, indicating proteasomal degradation of eGFP. The accumulation of eGFP in vivo was decreased by the protein synthesis inhibitor cycloheximide, without affecting half-life. The half-lives of several fluorescent proteins were determined, using both tissue-general and tissue-specific expression, in flies of both sexes and varying ages. Typical half-life values varied by fluorescent protein. DsRED showed a greater half-life than eGFP, and little if any degradation was detected for mCherry. Half-life also varied by tissue, with greater eGFP half-life observed in muscle relative to other tissues. Limited effects were observed for sex, age and female mating status. Taken together, the data indicate the in vivo assays are promising tools for study of protein degradation regulated by protein sequence, subcellular compartment, tissue and small molecules.
Keywords:
Drosophila
; GFP
; DsRED
; video
; turnover
; in vivo
; degradation
; proteasome
; bortezomib
; cycloheximide
1. Introduction
In the past, protein half-life has typically been assayed by labeling with a radioactive or heavy isotope followed by quantification by mass spectrometry [1]. One limitation of these assays is that they are invasive and destructive, requiring sacrifice of the animal. Here we report the use of fluorescent proteins to assay protein half-life in vivo in adult Drosophila melanogaster.
Flies were engineered to produce transient expression of a fluorescent protein using the conditional transgenic systems Tet-ON or Gene-Switch [2,3,4,5]. After removal of the activating drug, synthesis of new protein ceases, and fluorescence declines in a manner proportional to protein degradation, yielding a measurement of protein half-life [1,6]. The conditional transgenic systems also allow for tissue-specific expression of fluorescent proteins, which is important in light of evidence for tissue-specific effects of aging on protein degradation [7,8,9]. Moreover, the system allows for assay of proteins targeted to organelles.
2. Materials and Methods
2.1. Video Assays
For video assay, flies were gently knocked into 4 dram (~15ml) glass vials, using 6 flies per vial and 4 vials per group, and each vial was covered with a glass coverslip. Each vial was individually placed in a dark box, illuminated using two LED lights, and two synchronized video cameras were used to capture fluorescence in 4 minute videos (see Supplemental Figure S1). Prior to recording, flies were transferred to media supplemented to 200µg/ml mifepristone for Gene-Switch system, or 640µg/ml doxycycline for Tet-ON system, to initiate fluorescent protein expression, and then removed from the drug media after 24 hours. Recordings were taken immediately after removal from the drug (day 1), and every day over a period of 5-6 days. Videos were analyzed using FluoreScore software, which identifies each fly and quantifies pixel intensity in the area of the flies in each frame [10]. The data from the cameras was combined to yield a fluorescence intensity value for each vial at each time point, and average fluorescence intensity values for the 4 vials in each group were averaged. Fluorescence typically peaked at day 2 or 3, after which it decreased exponentially. The average fluorescence values for each group were plotted as ln(fluorescence) versus time, and the portion of the curve from peak to minimum was used to calculate half-life.
2.2. Fly Culture and Strains
Drosophila melanogaster were cultured at 25°C using a standard agar/dextrose/corn meal/yeast media [11], and adult flies were passaged to fresh media every-other day. Actin-GS-255B is previously described, and contains the Actin5C gene promoter driving tissue-general expression of Gene-Switch [4]. The repo-GS strain drives Gene-Switch expression in glial cells, and was generously provided by Amita Sehgal [12]. The 5966-GS strain expresses Gene-Switch in midgut enterocytes, and was generously provided by Pankaj Kapahi [13]. Actin88F-GS drives expression of Gene-Switch in flight muscle, and was generously provided by Jason Karpac [14]. The w[1118]; 3xP3-GFP[M1] strain transgenic construct includes a synthetic promoter containing three binding sites for the Eyeless/PAX6 transcription factor, and was generously provided by Ernst Wimmer [15]; the construct drives high-level expression of eGFP specifically in retinal tissue, and is abbreviated here as eyeless-GFP [16]. Certain strains were obtained from Bloomington Drosophila Stock Center (BDSC), including strain y[1] w[*]; P{w[+mC]=elav-Switch.O}GSG301 (BDSC#43642), which is abbreviated here as y; Elav-GS, strain y[1],w[*]; P{tubP-GAL4}LL7/TM3 (BDSC#5138), abbreviated here as tub-GAL4, strain y[1], w[*]; wg[Sp-1]/CyO; P{Mhc-Switch.O}GSG314-2 (BDSC#43641), abbreviated here as Mhc-GS, strain w[1118]; P{UAS-MitoTimer}3 (BDSC#57323), abbreviated here as UAS-MT [17,18], and strain y[1] w[*]; wg[Sp-1]/CyO, P{Wee-P.ph0}Bacc[Wee-P20]; P{y[+t7.7] w[+mC]=20XUAS-6XmCherry-HA}attP2 (BDSC#52268), abbreviated here as UAS-mCherry. The w[1118] strain (BDSC#5905) is the isogenized version (w[1118]- iso; 2-iso; 3-iso) which was previously cured of Wolbachia [19]. The UAS-eGFP strain employed is abbreviated as Ultra-GFP, and contains multiple copies of a UAS-2xeGFP construct on both the second and third chromosomes, and has been previously described [20]. To generate mated females, age-synchronized virgin females at 1-2 days of age were combined with young (3-14 day old) male w[1118] flies in regular food vials, with 20 females and 20 males per vial, for 48 hours, after which the males were removed.
2.3. Generation of Multi-Copy Strains
Generation of Tet-ON strain REDA. The Tet-ON system driver construct rtTA consists of the Actin5C promoter driving expression of the reverse tetracycline trans-activator protein called rtTA [5]. The construct is inserted on the third chromosome, and the insertion strain is named rtTA(3)E2. The target construct contains a synthetic promoter consisting of seven Tet-operator (TetO) sequences fused to the core promoter sequences of the hsp70 gene, driving expression of DsRED (9). Two independent strains bearing insertions of this TetO-DsRED construct on the third chromosome were used, TetO-DsRED[6] and TetO-DsRED[26B] [21], each in the w[1118] genetic background. The target transgenic constructs bear the mini-white+ marker gene, and have light orange color eyes resulting from partial rescue of the w[1118] mutant phenotype. To increase the copy number of the target constructs, each strain was crossed to P(ry+,Δ2-3)99B transposase strain [22], and third chromosomes were isolated that had increased dosage of the mini-white+ marker, as indicated by a more red eye color, and named TetO-DsRED[6-7] and TetO-DsRED[26B-6], respectively. The increased copy number of the constructs was confirmed by crossing to the rtTA(3)E2 strain, assay of progeny -/+ DOX treatment, and confirming two-fold increase in DsRED signal using fluorescence microscopy. The TetO-DsRED[6-7] and TetO-DsRED[26B-6] insertions were then recombined onto the same third chromosome, and the increased copy number was confirmed by again crossing to the rtTA(3)E2 strain, assay of progeny -/+ DOX treatment, and confirming total four-fold increase in DsRED signal using fluorescence microscopy. Finally, the chromosome bearing the TetO-DsRED[6-7] and TetO-DsRED[26B-6] insertions was recombined with rtTA(3)E2 to generate a chromosome bearing all three insertions on the same third chromosome, balanced over TM3 Sb balancer, and in a y[*] w[*] genetic background; the resulting strain y[*], w[*];TetO-DsRED[6-7], TetO-DsRED[26B-6], rtTA(3)E2/TM3 Sb, which is abbreviated as “REDA”. The yellow mutant body color allows for increased detection of fluorescence from internal tissues relative to a wild type body color.
Multi-copy mitoGFP strain. The strains P{UAS-mito-HA-GFP.AP}2 and P{UAS-mito-HA-GFP.AP}3 strains [23], were obtained from BDSC (BDSC#8442; BDSC#8443). Each strain was crossed to P(ry+,Δ2-3)99B transposase strain and chromosomes were isolated that had increased dosage of the mini-white+ marker strain, as indicated by a more red eye color, and named UAS-mitoGFP[AP2-4] and UAS-mitoGFP[AP3-7], respectively. The increased copy number of the constructs was confirmed by crossing to the tub-GAL4 strain and assay of progeny to confirm two-fold increase in GFP signal using fluorescence microscopy. UAS-mitoGFP[AP2-4] and UAS-mitoGFP[AP3-7] were then combined into the same strain using double-balancer crosses, to yield strain y[*], w[*]; UAS-mitoGFP[AP2-4]; UAS-mitoGFP[AP3-7]/TM3 Ser.
Multi-copy MitoTimer strain. The UAS-MT strain was crossed to P(ry+,Δ2-3)99B transposase strain, and a third chromosome was isolated that had increased dosage of the mini-white+ marker, as indicated by a more red eye color, and named UAS-MT[1]. The increased copy number of the construct was confirmed by crossing to the tub-GAL4 strain and assay of progeny to confirm two-fold increase in green and red fluorescence signals using fluorescence microscopy. The UAS-MT[1] was crossed to P(ry+,Δ2-3)99B transposase strain, and third chromosome was isolated that had increased dosage of the mini-white+ marker strain, as indicated by a more red eye color, and named UAS-MT[1-1]. The increased copy number of the construct was confirmed by crossing to the tub-GAL4 strain and assay of progeny to confirm three-fold increase in green and red fluorescence signals using fluorescence microscopy (Figure S5).
2.4. Cameras and Filters
The 3D tracking and quantification of GFP fluorescence was carried out essentially as previously described [10]. Briefly, two video cameras (Grasshopper type GRAS-20S4C, Point Grey Research, Scottsdale, AZ) were directed at the glass vial containing the fly. The vial was illuminated by two LED lights, and video was recorded at 30fps. For GFP fluorescence tracking, blue LEDs were used as follows: The MF469-35 filters (Thorlabs, Inc.) were fixed in front of the blue LEDs to limit the light to a range of approximately 452 nm to 486 nm, which overlaps the eGFP absorption peak at approximately 488nm. The MF525-39 filters were placed in front of the camera lenses to limit the light to the range of approximately 510 nm to 548 nm, which overlaps the emission peak for eGFP at approximately 509 nm. For DsRED tracking, green LEDs were used as follows: The TRITC excitation filters (MF542-20; Thorlabs, Inc.) were fixed in front of the green LEDs to limit the light to a range of approximately 532 nm to 552 nm, which overlaps the DsRED absorption peak at approximately 555nm. The TRITC/CY3.5 emission filters (Thorlabs MF620-52) were placed in front of the camera lenses to limit the light to the range of approximately 595 nm to 645 nm, which overlaps the emission peak for DsRED at approximately 590 nm.
2.5. Vials, Media and Fly Handling for Video Assays
Assay of tissue-general eGFP in parallel in young and old, male and female flies. Flies were maintained as adults on NutriFly Grape Agar Premix media (Genesee Scientific 47-102), adjusted to 0.5% Casein protein (Sigma/Aldrich); this is to reduce background green fluorescence from the gut that can result from the standard Drosophila media. For assay, 6 flies were knocked into an empty 4 dram glass shell vial (Kimble 60965-4), without anesthetization, on a foam mouse pad to avoid damage to vials. The bottom of the vial was covered with a round piece of black filter paper to reduce glare, and the top of the vial was covered with a glass cover slip.
Assay of eGFP, mitoGFP and DsRED in various tissue patterns. Clear glass shell vials (4ml; ThermoFisher) were filled with 500ul media. Media was NutriFly Grape Agar Premix (Genesee Scientific 47-102), adjusted to 0.5% Casein protein (Sigma/Aldrich), and adjusted to 0.25% wgt/vol blue dye #1. This media was used to reduce background fluorescence. The media was adjusted to final concentration of 200µg/ml mifepristone for Gene-Switch system, or to 640µg/ml doxycycline for the Tet-ON system. To introduce flies, the flies were lightly anesthetized with CO2 gas, knocked into the vial, and the vial covered at the top with a small piece of clear tape (Grey Parrot brand crystal clear office tape) to prevent flies escaping without compromising visibility. Flies were passaged to fresh vials every other day (using light CO2 anesthesia). When not being assayed, all flies were kept in an incubator at 25°C, with exception of mitoGFP flies, which were maintained at 22(+/-0.5)oC.
2.6. In Vivo Bortezomib Treatment
Virgin female progeny of Actin-GS-255B x ultraGFP cross were placed in vials with media adjusted to a final concentration of 20µM bortezomib. The control group media received an equal volume of ethanol vehicle. All flies were also exposed to 200µg/ml mifepristone in the media for 48 hours starting from the first day of videos. Videos were taken every day for 11 days. Flies were switched to fresh +/- drug vials every 48 hours through the end of the experiment.
2.7. In Vivo Cycloheximide Treatment
Virgin female progeny of Actin-GS-255B x ultraGFP cross were treated with cycloheximide added to food vials as an aqueous solution. Flies were treated with cycloheximide beginning 7 days before the start of video recordings, at an initial age of 1-3 days. Flies in the low concentration group were maintained on media adjusted to a final concentration of 5µM cycloheximide, and the high concentration group were maintained on media adjusted to a final concentration of 10µM cycloheximide. Flies in the control group were maintained on vials adjusted with an equal volume of water vehicle. Beginning with the initial video recording, all flies were transferred to vials adjusted to 200µg/ml mifepristone, in addition to any cycloheximide. Videos were taken every day for 7 days. After 48 hours flies were removed from mifepristone and transferred to new +/- cycloheximide vials; flies continued to be switched to fresh drug vials every 48 hours through the end of the experiment.
2.8. Microscope Image Capture Assay and Statistical Analysis
Flies with eGFP expression were maintained on NutriFly Grape Agar Premix (Genesee Scientific 47-102), adjusted to 0.5% Casein protein (Sigma/Aldrich). Flies with red fluorescent protein expression were maintained on regular fly media vials. Flies were transferred to fresh vials every other day without anesthetization. For image capture, three flies at a time were anesthetized with CO2 on a fly pad (Genesee Scientific), positioned on their side, and fluorescence image generated using the Leica MZFLIII fluorescence microscope and Spot imaging system. Fly fluorescence was quantified using Image J software {Schneider, 2012 #10841}], and selecting the desired fly body regions as ROI using the free-hand drawing tool. For each time point, >10 flies per sample were quantified, and data average +/- standard deviation was calculated. The ln(fluorescence) versus time was plotted and analyzed using Prism 9 to conduct linear regression and generate half-life values.
2.9. In Vitro Proteasome Assay
In vitro degradation of protein by the proteasome was assayed essentially as previously described [24,25]. Young (3-4 day old) virgin female flies from the eyeless-GFP strain were used to generate extracts containing abundant eGFP. Whole flies were homogenized using motorized pestle in extraction buffer composed of 50 mM Tris, 25 mM KCl, 10 mM NaCl, 1 mM MgCl2, and 1 mM DTT at pH 7.5. Three groups of 20 flies each were homogenized in 500µl of buffer. After homogenization, each sample was subjected to 3 rounds of a freeze/thaw cycle consisting of 5 minutes in dry ice followed by 5 minutes in a room temperature water bath. After 3 cycles the samples were centrifuged for 2 minutes at 10,000 g in a 4°C cold room. The supernatents from the 3 replicates were pooled, and then diluted 1:4 in the buffer solution. Next, 180µl aliquots of the diluted extract were added to black 96-well plates (Greiner Bio-One 82050-728) and 20µl of either pure ethanol (control) or 250µM Bortezomib (experimental group) was added to each sample. Purified recombinant eGFP (Cell Biolabs STA-201) at 1mg/ml in PBS was diluted 1:5, 1:10 and 1:15 with PBS, and 200µl each sample was loaded into the plate in duplicate as controls. This plate was then introduced to the plate reader pre-warmed to 37°C. GFP fluorescence was quantified using the BioTek Synergy H4 Hybrid Multi-Mode Microplate Reader, in the USC Dornsife NanoBiophysics Core facility. Reads were taken at 30 second intervals at 395nm excitation/510nm emission to detect GFP fluorescence.
2.10. Generation of Partially Purified eGFP Extract
Young virgin female flies of the eyeless-GFP strain were anesthetized with CO2 on the fly pad, and the heads removed using razor blade. 80 heads were combined with 1ml PBS, homogenized and subjected to 3 rounds of freeze/thaw, centrifuged as described above, and supernatant used as extract. The extract was diluted 1:2, 1:4, 1:8, and 1:16 in PBS, and added to the plate at 180µl per well. Three replicates of each concentration were supplemented with 20µl of 250µM Bortezomib, and the controls were supplemented with 20µl ethanol vehicle. Reads were conducted using plate reader as described above, at room temperature (23.5 +/-0.5°C). GFP fluorescence was quantified using a BioTek Synergy H4 Hybrid Multi-Mode Microplate Reader. For all experiments, reads were taken at 30 second intervals at 395nm excitation/510nm emission to detect GFP fluorescence.
2.11. Video Analysis Software and Statistical Analysis
Videos were generated and analyzed essentially as previously described [10,16]. The software SaveImageToAviEx_v142.exe is used to record videos at 30 frames per second. The desired number of frames to capture is input by the user, and the resulting video from each camera is recorded and saved as .avi video files. The FluoreScore suite is next used to process these videos into quantitative data. The software FluoreScoreGUI is used to analyze representative videos, and select fluorescence threshold for fly detection, select the ROI, and to create a mask if needed, to omit any areas with background fluorescence from the analysis. Next, the software template.bat file is used, and can be edited for each experiment to indicate the chosen threshold for fluorescence detection, and the coordinates for the ROI, and which mask files to utilize, if any. The template.bat file is the only file the user edits and runs directly. It calls the software FluoreScoreCMDV2.exe, which analyzes the videos and derives fluorescence values for the flies in each frame of video, and calls the software SqueezeData_V1.1.exe, which combines the data from the two cameras, and filters out signal below the input threshold. The final output is .csv files with total fly fluorescence for each frame of video. The software Cymito_v5.R uses the data from the .csv files to create plots of average fluorescence versus time for each group in the experiment. This software also generates a summary .csv file, with the data in an easy to read format, including columns for the average daily fluorescence for every vial, average across all vials, and standard deviation. The data is then plotted as average ln(fluorescence) versus time using Prism 9 to conduct linear regression and generate half-life values. Linear models were also constructed using values from the replicate vials, rather than a single average for each time point, but demonstrated no advantage in identifying differences between groups or constructing lines with a good fit. To conduct ANOVA, the half-life values along with information about age and sex of the flies were organized into a table, which was then read into R. The R lm function was used to construct a linear model relating half-life to age and sex (including interaction), and then the ANOVA function was used to run the statistical test. Both functions are available in base R.
3. Results
3.1. Bortezomib Increases eGFP Half-Life In Vivo and In Vitro
To determine if cytoplasmic eGFP is degraded by the proteasome, the proteasome inhibitor drug bortezomib was employed [26]. Bortezomib was fed to flies at 20µM in the media, coincident with the induction of eGFP expression by mifepristone. Notably, eGFP expression in flies treated with bortezomib reached maximum levels approximately three times greater than controls, consistent with inhibited degradation due to bortezomib (Figure 1A,B). Quantification of area under the curve (AUC), a measure of total eGFP accumulation, confirmed a 5.6-fold greater eGFP expression in the bortezomib treated group relative to control group across the entire assay period (Figure 1C). Consistent with these results, plotting ln(fluorescence) versus time reveals a greater in vivo half-life for eGFP in the bortezomib treated flies (17 days) relative to controls (3.5 days; Figure 1D; Supplemental Table S1). Increased area under the curve for eGFP accumulation in presence of bortezomib was confirmed in two additional experiments (Supplemental Figure S2).
To further confirm degradation of eGFP by the proteasome and inhibition by bortezomib, an in vitro proteasome assay was used (Figure 1E)[24,25]. Extracts prepared from flies expressing eGFP were incubated in the absence and presence of 20µM bortezomib in a fluorescence plate reader assay. Plotting ln(fluorescence) versus time again revealed inhibition of eGFP degradation by bortezomib, as indicated by increased eGFP half-life, consistent with proteasome-dependent degradation (Figure 1E; Supplemental Table S1). We note that the absolute eGFP fluorescence detected by plate reader assay was reduced in the presence of bortezomib; however, the magnitude of the inhibitory effect was roughly equal across different sources and concentrations of eGFP, including dilutions of partially purified eGFP (Supplemental Figure S3A,B), as well as purified recombinant eGFP and the starting extract used for proteasome assay (Supplemental Figure S3C), indicating that half-life calculations are not significantly affected.
3.2. Cycloheximide Decreases eGFP Expression In Vivo
To determine if the in vivo assay could also capture changes in protein synthesis, the translation inhibitor cycloheximide was fed to flies at concentrations of 5µM and 10µM in the media. A pulse of eGFP expression was then induced with mifepristone. The peak level of eGFP fluorescence achieved was significantly lower in the drug-treated groups compared to controls (Figure 1F). Consistent with this, quantification of AUC revealed reduced accumulation of eGFP in the cycloheximide-treated groups across the entire assay period (Figure 1G). The half-life of eGFP in the presence and absence of cycloheximide treatment was calculated from the slope of ln(fluorescence) versus time. The eGFP half-life did not differ significantly between the groups, indicating that the decreased eGFP accumulation observed was driven by decreased synthesis (Figure 1H). These results support the conclusion that the in vivo assay provides a relatively accurate measure of in vivo protein half-life.
3.3. Half-Life Values of Different Fluorescent Proteins
Experiments were designed to compare eGFP degradation rates in males and females, at both younger and older ages. Five independent experiments were conducted comparing young and old virgin males and virgin females in parallel, with young fly starting ages of 5-6 days, and older fly starting ages of 35-55 days. Average eGFP half-life was 3.9 days in young males, 3.9 days in young females, 4 days in old males, and 3.4 days in old females. No statistically significant relationship between eGFP half-life and age was detected when analyzing the entire data set. It is notable that eGFP half-life in very young males and females appears particularly variable (Supplemental Table S1; summarized in Supplemental Figure S4A), and when ANOVA analysis is limited to flies >30 days of age, a significant increase with age is detected (p = 0.039)(Supplemental Figure S4B). No significant relationship was detected between eGFP half-life and either sex or female mating status (Supplemental Table S1).
A COX8 mitochondrial targeting sequence fused to the N-terminus of eGFP results in mitoGFP [1]. UAS-mitoGFP construct insertions were mobilized to increase copy number and combined into the same strain (Materials and Methods). When crossed to the tissue-general Actin-GS-255B driver, this yielded sufficient eGFP signal to allow video assay of half-life, giving an average half-life of 2.6 days (Supplemental Figure S6, Supplemental Table S3). However, no consistent effects of age, sex or mating status were observed (Supplemental Table S3).
The half-life of the red fluorescent protein DsRED was assayed using the Tet-ON conditional gene expression system, in which the actin5C gene promoter drives tissue-general expression of the doxycycline-activated transcription factor rtTA, targeting the construct TetO-DsRED in the presence of the drug. The average half-life of DsRED in video assays of young virgin males and virgin females was 7.9 days (Figure 2C; Supplemental Table S4). The half-life of DsRED was observed to increase with age for virgin females (Fig 3A), mated females, and males (Supplemental Table S4). However, we note that the increase in DsRED half-life with age observed in males was not significant in every experiment. No consistently significant difference in DsRED half-life was observed between virgin males and virgin females, or between virgin females and mated females (Supplemental Table S4).
Another red fluorescent protein, mCherry, was found to have a particularly long half-life. The Gene-Switch system and the tissue general Actin-GS-255B driver were used to drive expression of mCherry, using a high copy number UAS-mCherry strain. Microscope assay yielded half-life of 51 days in virgin females, and 32 days in mated females (Figure 2D; Supplemental Table S5). Video assays were complicated by high background and poor fit to exponential decay models, and half the assays did not detect any decay in red fluorescence (Supplemental Table S5).
Finally, another red fluorescent protein, the mitochondria-targeted MitoTimer, was also assayed [2,3]. A multi-copy UAS-MitoTimer strain was constructed (Supplemental Figure S5), and MitoTimer was expressed in neurons using the Elav-GS driver. Robust induction of red fluorescence was observed in video assays in both virgin males and virgin females, yielding a half-life of 4.8-6.7 days. There was no significant difference in half-life between the sexes (Supplemental Table S5).
3.4. Tissue-Specific Expression of eGFP
Protein half-life can vary by tissue [28,29]. To investigate possible differences in tissue-specific eGFP turnover rates, eGFP was expressed using several tissue-specific drivers, and half-life was assayed in virgin and mated females. Video assay of tissue-general expression of eGFP using Actin-GS-255B driver yielded eGFP half-life values of 1.0-1.5 days in young virgin females (ID#091721 and ID#091921; Supplemental Table S2). By contrast, video assay of eGFP targeted to glial cells with the repo-GS driver yielded a half-life in virgin females of 3.1 days. In general, eGFP targeted to muscle exhibited greater half-life than when targeted to other tissues. Targeting eGFP to muscle using the Mhc-GS driver yielded average half-life of 5.6 days, and targeting eGFP specifically to flight muscle using the 88F-GS driver yielded average half-life of 8.1 days (Supplemental Table S2). No consistent difference in eGFP half-life between virgin and mated females was observed with any driver (Supplemental Table S2).
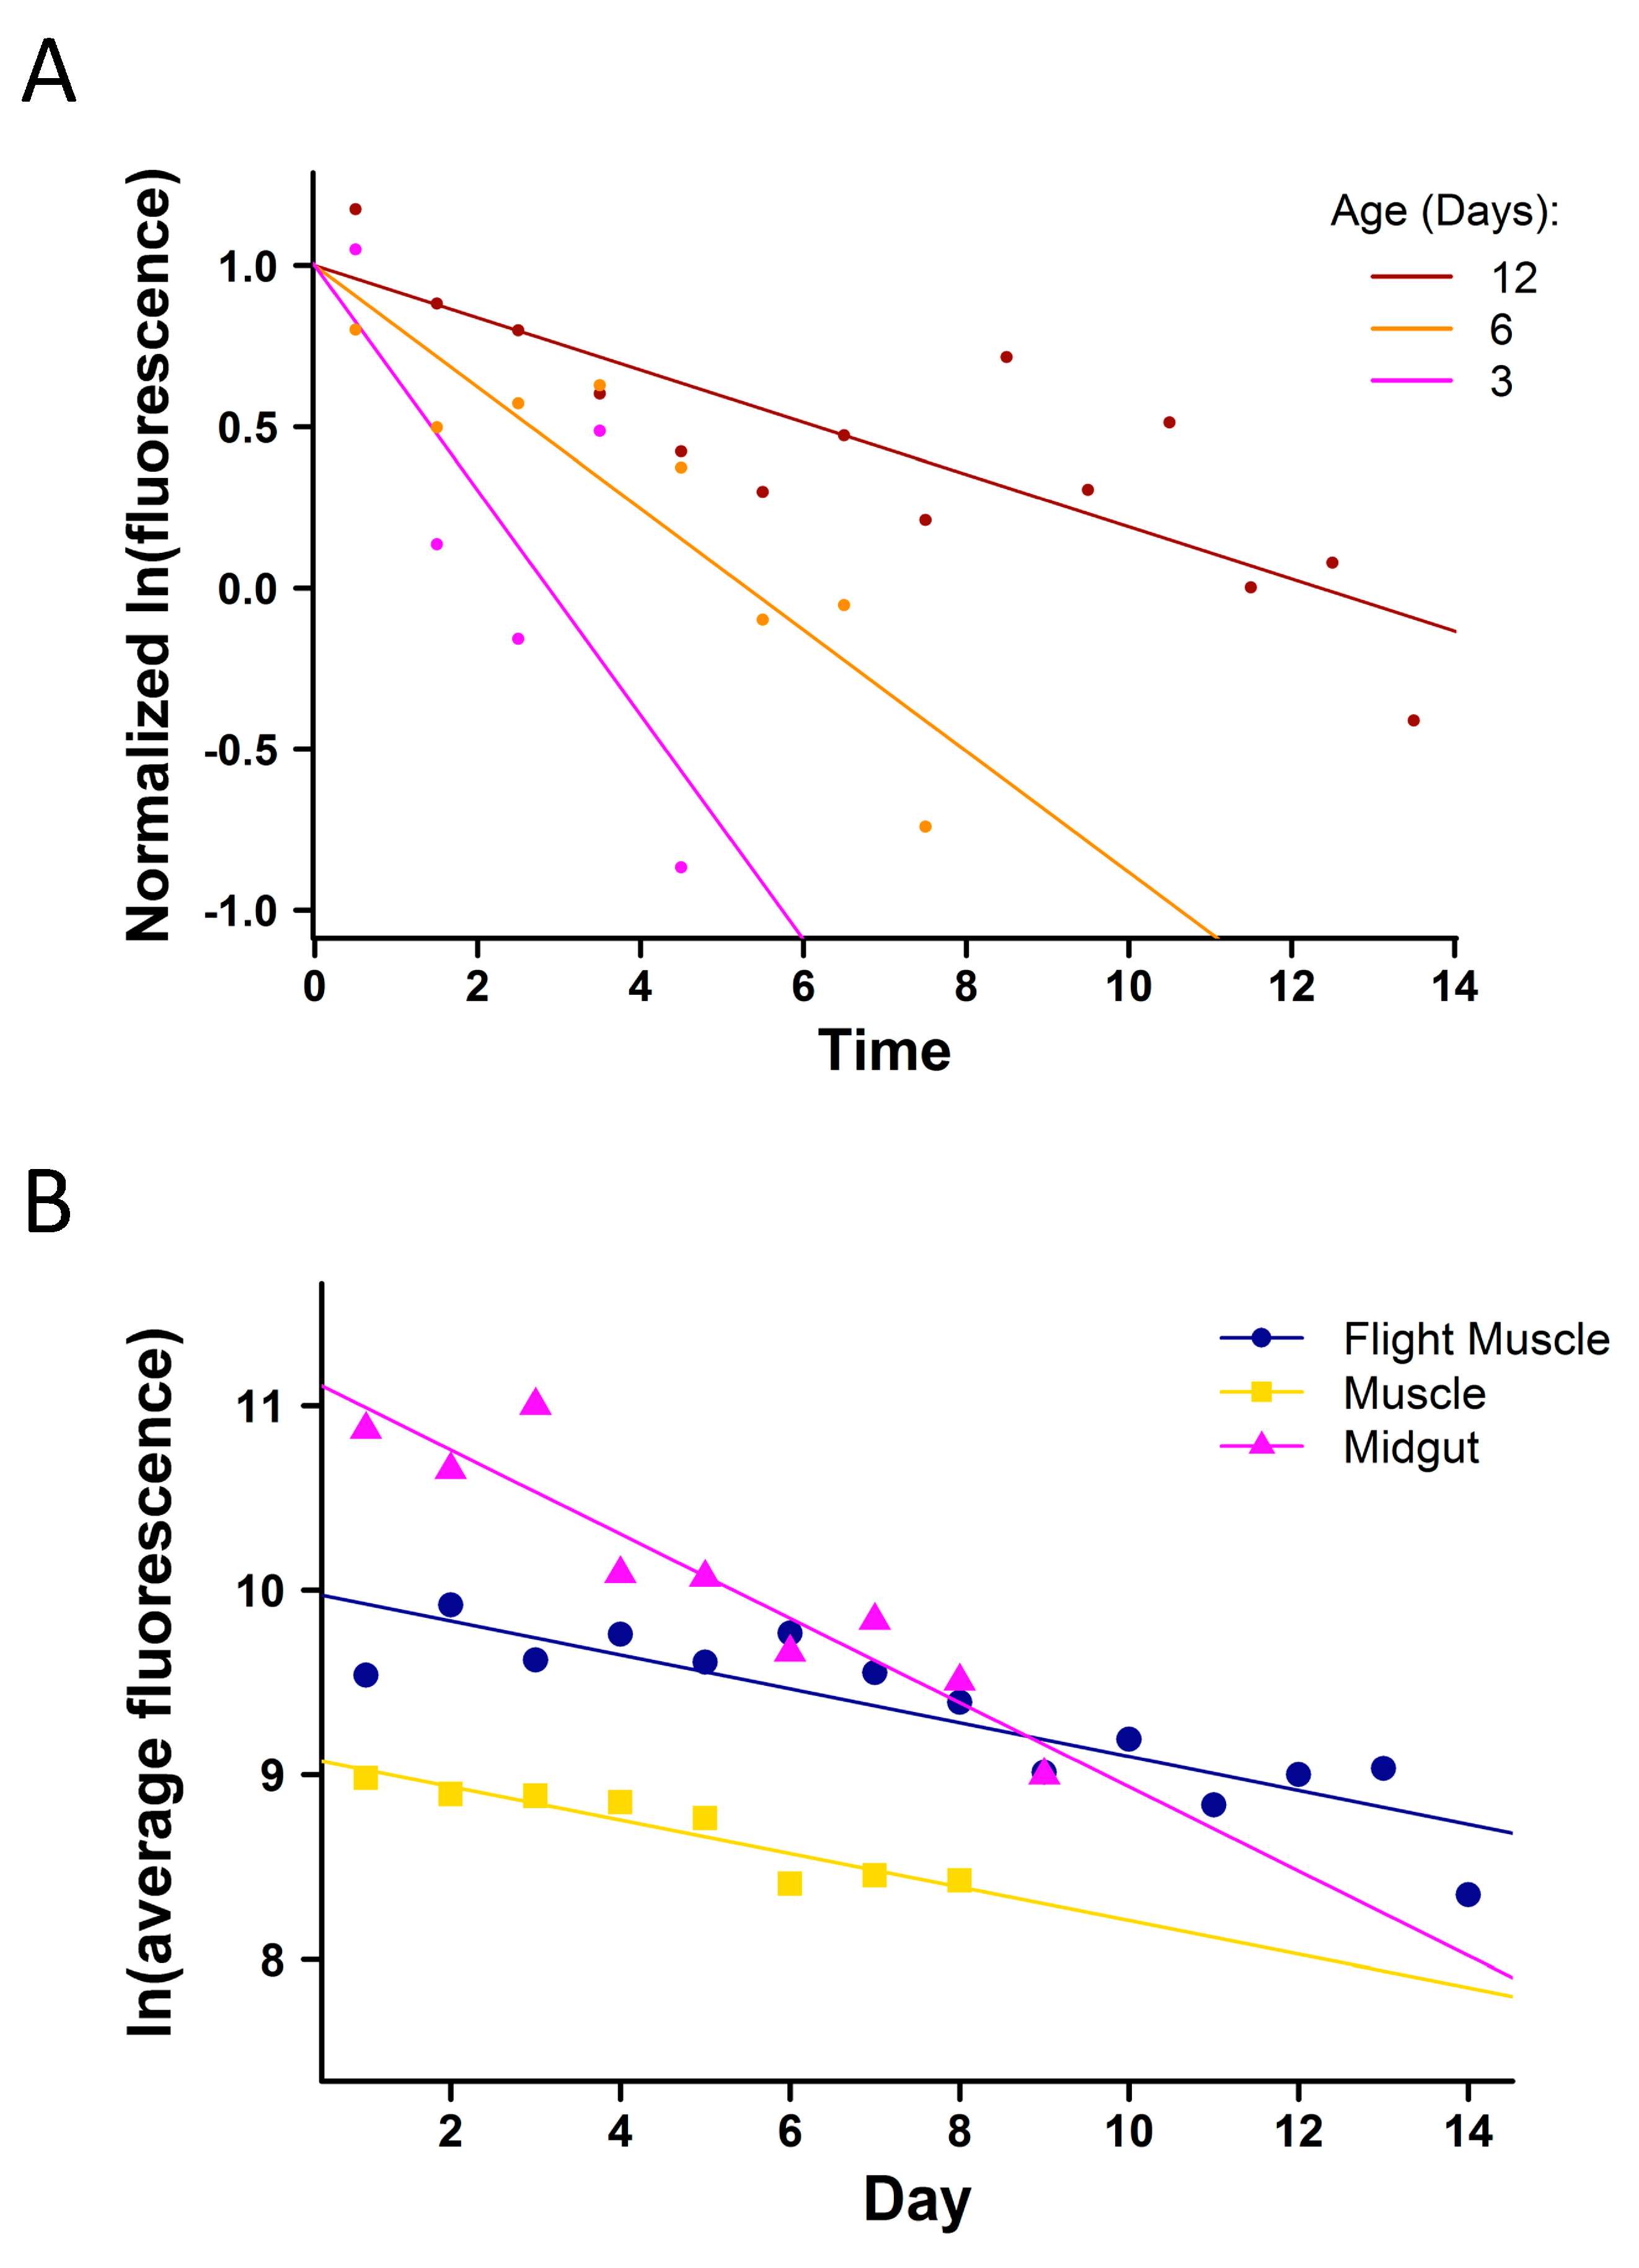
To enable direct comparison of eGFP half-life between tissues, data was normalized with regard to time, using the datasets with the largest number of points in the linear range. The eGFP half-life in midgut was smaller than that in total muscle or flight muscle, in both mated females (Figure 3B), and in virgin females (Supplemental Figure 7).
4. Discussion
Here methods for measuring half-life of fluorescent proteins in living flies are presented, which enable measurements of protein turnover under different conditions and in distinct tissues. This assay captures changes in both protein degradation and synthesis. Half-life of eGFP was increased by the proteasome inhibitor bortezomib, both in vivo and in vitro, indicating proteasomal degradation of eGFP. Consistent with the conclusion that eGFP is degraded by the proteasome, bortezomib has previously been shown to inhibit GFP degradation in cultured human H1299 carcinoma cells [30], and proteasome inhibitors MG132 and Z-L3-VS inhibited GFP degradation in cultured HeLa cells [31]. The accumulation of eGFP in vivo was decreased by the protein synthesis inhibitor cycloheximide, without affecting half-life.
DsRED protein was expressed in a tissue-general pattern using the Tet-ON system and Actin5C gene promoter, and had generally greater half-life than was observed for tissue-general expression of eGFP using Gene-Switch system and Actin5C gene promoter. For example, when averaged over 6 independent assays of young virgin female flies (2-13 days old), the average half-life of eGFP was 3.2 days, and the average half-life of DsRED was 6.1 days (Supplemental Tables 1, 2, 4). Consistent with these observations, a previous study of cultured Drosophila S2 cells reported a half-life for eGFP of approximately 3.8 days, and a half-life for DsRED of approximately 8 days [32]. The half-life of DsRED increased rapidly between eclosion and day 12 of age, with statistically significant increases detected for each of virgin females, mated females, and virgin males (Figure 6). In the future, it may be of interest to ask if the half-life of DsRED continues to increase at greater ages.
Half-life also varied by tissue, with greater eGFP half-life observed in muscle relative to other tissues. Cytoplasmic eGFP had a similar half-life (1-3 days) in young (8-13 day old) flies, when expressed in a tissue general pattern and when targeted to midgut enterocytes and to glial cells. In contrast, eGFP half-life was longer (5-8.5 days) in young (8-13 day old) flies when targeted to muscle tissue (Supplemental Table S2). The relatively longer half-life of eGFP in Drosophila muscle tissue may be related to observations that muscle tissue shows preferential accumulation of protein aggregates and induction of hsp70 protein relative to other adult tissues during aging [33,34,35]. These results appear similar to the mouse, where muscle tissue was reported to exhibit generally slower protein turnover than other tissues such as liver [28]. Limited effects were observed for Drosophila sex, age and female mating status. Taken together, the data indicate the in vivo assays are promising tools for study of protein degradation regulated by protein sequence, subcellular compartment, tissue and small molecules.
Limitations of this study includes some asymmetry of the experiments. For example, eGFP has been assayed only using the Gene-Switch system, and DsRED assayed only using the Tet-ON system. One reason for this is the relative lack of reagents for the Tet-ON system. In the future, it may be of interest to generate additional fluorescent protein target constructs for the Tet-ON system. A limitation of the Gene-Switch system is that the mifepristone used to trigger fluorescent protein expression can have significant physiological effects. In mated females, mifepristone reduces progeny production and midgut size, and greatly increases median life span [36,37,38]. Limiting mifepristone treatment to 48 hours is expected to limit confounding effects. However, it is possible the effects of even brief mifepristone treatment are one reason that differences in eGFP half-life between virgin and mated females were not detected using Gene-Switch. Additional limitations of the video assay include some variability in results, particularly for the youngest flies. Reasons for this likely include some unequal lighting throughout the vial, and some unequal coverage of all regions by the video cameras, combined with fly movement, which is greater in young flies.
Supplementary Materials
The following supporting information can be downloaded at the website of this paper posted on Preprints.org, Figure S1: Setup of video assay; Figure S2: Effect of bortezomib in vitro, replicate assays; Figure S3: Effect of bortezomib on fluorescence plate reader assay; Figure S4: Summary of half-life values for young and old virgin males and virgin females assayed in parallel; Figure S5: Increased copy number of transgenes produced by P element transposition; Figure S6: Degradation rate of tissue-general mitoGFP; Figure S7: Fluorescence decay of eGFP targeted to muscle and midgut of virgin females; Table S1: Tissue-general eGFP expression in young and old virgin males and virgin females; Table S2: Tissue-general and tissue-specific expression of eGFP; Table S3: Tissue-general expression of mitoGFP; Table S4: Tissue-general expression of DsRED using Tet-ON system; Table S5: Analysis of mCherry and MitoTimer; Table S6: ANOVA summary.
Author Contributions
Conceptualization, JT; methodology, JT; software, AS, SB, HSB.; validation, JT, HSB; formal analysis, JT, HSB; investigation, HSB, SK, SA, BB, MK, NR, OP, ME, JP, AT, AS, SA, JT; resources, JT; data curation, HSB, SK, SA, BB, MK, NR, OP, ME, JP, AT, AS, SA, JT; writing—original draft preparation, HSB, JT; writing—review and editing, HSB, JT; visualization, HSB, JT; supervision, JT, KJAD; project administration, JT, KJAD; funding acquisition, JT, KJAD, HSB, SA. All authors have read and agreed to the published version of the manuscript.
Funding
National Institute on Aging (AG057741) JT; National Institute of General Medical Sciences (T32-GM118289) HSB; National Institute on Aging (T32-AG052374) SA; National Institute on Aging (AG052374) KJAD
Data Availability Statement
The datasets supporting the conclusions of this article are included within the article and its additional files. Software used for video assays is available upon publication at: https://github.com/johntower/Tracking-Paper-2024 . Software used for video assays is currently available for the editors and reviewers at: https://gitfront.io/r/towerlab/cNiLM5iRMssN/Tracking-Paper-2024/
Conflicts of Interest
The authors declare no conflict of interest.
Abbreviations
| eGFP | enhanced green fluorescent protein |
| DsRED | Discosoma species red fluorescent protein |
| LED | light emitting diode |
| COX8 | cytochrome c oxidase subunit 8 |
| UAS | upstream activating sequence |
| GS | Gene-Switch |
| rtTA | reverse tetracycline trans-activator |
| tetO | Tet operator |
References
- Bell, H.S.; Tower, J. In vivo assay and modelling of protein and mitochondrial turnover during aging. Fly (Austin) 2021, 15, 60–72. [Google Scholar] [CrossRef] [PubMed]
- Nicholson, L.; Singh, G.K.; Osterwalder, T.; Roman, G.W.; Davis, R.L.; Keshishian, H. Spatial and temporal control of gene expression in Drosophila using the inducible GeneSwitch GAL4 system. I. Screen for larval nervous system drivers. Genetics 2008, 178, 215–234. [Google Scholar] [CrossRef]
- Osterwalder, T.; Yoon, K.S.; White, B.H.; Keshishian, H. A conditional tissue-specific transgene expression system using inducible GAL4. Proc Natl Acad Sci U S A 2001, 98, 12596–12601. [Google Scholar] [CrossRef]
- Ford, D.; Hoe, N.; Landis, G.N.; Tozer, K.; Luu, A.; Bhole, D.; Badrinath, A.; Tower, J. Alteration of Drosophila life span using conditional, tissue-specific expression of transgenes triggered by doxycyline or RU486/Mifepristone. Exp Gerontol 2007, 42, 483–497. [Google Scholar] [CrossRef] [PubMed]
- Bieschke, E.T.; Wheeler, J.C.; Tower, J. Doxycycline-induced transgene expression during Drosophila development and aging. Molecular & general genetics : MGG 1998, 258, 571–579. [Google Scholar]
- Trauth, J.; Scheffer, J.; Hasenjager, S.; Taxis, C. Strategies to investigate protein turnover with fluorescent protein reporters in eukaryotic organisms. AIMS Biophysics 2020, 7, 90–118. [Google Scholar] [CrossRef]
- Sala, A.J.; Bott, L.C.; Morimoto, R.I. Shaping proteostasis at the cellular, tissue, and organismal level. J Cell Biol 2017, 216, 1231–1241. [Google Scholar] [CrossRef]
- Jiao, J.; Demontis, F. Skeletal muscle autophagy and its role in sarcopenia and organismal aging. Curr Opin Pharmacol 2017, 34, 1–6. [Google Scholar] [CrossRef]
- Hetz, C. Adapting the proteostasis capacity to sustain brain healthspan. Cell 2021, 184, 1545–1560. [Google Scholar] [CrossRef]
- Ardekani, R.; Huang, Y.M.; Sancheti, P.; Stanciauskas, R.; Tavare, S.; Tower, J. Using GFP Video to Track 3D Movement and Conditional Gene Expression in Free-Moving Flies. PLoS One 2012, 7, e40506. [Google Scholar] [CrossRef]
- Ren, C.; Finkel, S.E.; Tower, J. Conditional inhibition of autophagy genes in adult Drosophila impairs immunity without compromising longevity. Exp Gerontol 2009, 44, 228–235. [Google Scholar] [CrossRef] [PubMed]
- Jacobs, J.A.; Sehgal, A. Anandamide Metabolites Protect against Seizures through the TRP Channel Water Witch in Drosophila melanogaster. Cell reports 2020, 31, 107710. [Google Scholar] [CrossRef] [PubMed]
- Luis, N.M.; Wang, L.; Ortega, M.; Deng, H.; Katewa, S.D.; Li, P.W.; Karpac, J.; Jasper, H.; Kapahi, P. Intestinal IRE1 Is Required for Increased Triglyceride Metabolism and Longer Lifespan under Dietary Restriction. Cell reports 2016, 17, 1207–1216. [Google Scholar] [CrossRef] [PubMed]
- Mlih, M.; Khericha, M.; Birdwell, C.; West, A.P.; Karpac, J. A virus-acquired host cytokine controls systemic aging by antagonizing apoptosis. PLoS Biol 2018, 16, e2005796. [Google Scholar] [CrossRef]
- Horn, C.; Jaunich, B.; Wimmer, E.A. Highly sensitive, fluorescent transformation marker for Drosophila transgenesis. Dev Genes Evol 2000, 210, 623–629. [Google Scholar] [CrossRef]
- Tower, J.; Agrawal, S.; Alagappan, M.P.; Bell, H.S.; Demeter, M.; Havanoor, N.; Hegde, V.S.; Jia, Y.; Kothawade, S.; Lin, X.; et al. Behavioral and molecular markers of death in Drosophila melanogaster. Exp Gerontol 2019, 126, 110707. [Google Scholar] [CrossRef]
- Laker, R.C.; Xu, P.; Ryall, K.A.; Sujkowski, A.; Kenwood, B.M.; Chain, K.H.; Zhang, M.; Royal, M.A.; Hoehn, K.L.; Driscoll, M.; et al. A novel MitoTimer reporter gene for mitochondrial content, structure, stress, and damage in vivo. J Biol Chem 2014, 289, 12005–12015. [Google Scholar] [CrossRef]
- Xu, P.; Damschroder, D.; Zhang, M.; Ryall, K.A.; Adler, P.N.; Saucerman, J.J.; Wessells, R.J.; Yan, Z. Atg2, Atg9 and Atg18 in mitochondrial integrity, cardiac function and healthspan in Drosophila. J Mol Cell Cardiol 2019, 127, 116–124. [Google Scholar] [CrossRef]
- Ren, C.; Webster, P.; Finkel, S.E.; Tower, J. Increased internal and external bacterial load during Drosophila aging without life-span trade-off. Cell Metab 2007, 6, 144–152. [Google Scholar] [CrossRef]
- Yang, J.; Tower, J. Expression of hsp22 and hsp70 transgenes is partially predictive of drosophila survival under normal and stress conditions. J Gerontol A Biol Sci Med Sci 2009, 64, 828–838. [Google Scholar] [CrossRef]
- Hoe, N.; Huang, C.M.; Landis, G.; Verhage, M.; Ford, D.; Yang, J.; van Leeuwen, F.W.; Tower, J. Ubiquitin over-expression phenotypes and ubiquitin gene molecular misreading during aging in Drosophila melanogaster. Aging (Albany NY) 2011, 3, 237–261. [Google Scholar] [CrossRef] [PubMed]
- Robertson, H.M.; Preston, C.R.; Phillis, R.W.; Johnson-Schlitz, D.M.; Benz, W.K.; Engels, W.R. A stable genomic source of P element transposase in Drosophila melanogaster. Genetics 1988, 118, 461–470. [Google Scholar] [CrossRef] [PubMed]
- Cox, R.T.; Spradling, A.C. A Balbiani body and the fusome mediate mitochondrial inheritance during Drosophila oogenesis. Development 2003, 130, 1579–1590. [Google Scholar] [CrossRef] [PubMed]
- Pickering, A.M.; Staab, T.A.; Tower, J.; Sieburth, D.S.; Davies, K.J. A conserved role for the 20S proteasome and Nrf2 transcription factor in oxidative-stress adaptation in mammals, C. elegans and D. melanogaster. J Exp Biol 2012. [CrossRef]
- Pomatto, L.C.; Carney, C.; Shen, B.; Wong, S.; Halaszynski, K.; Salomon, M.P.; Davies, K.J.; Tower, J. The Mitochondrial Lon Protease Is Required for Age-Specific and Sex-Specific Adaptation to Oxidative Stress. Curr Biol 2017, 27, 1–15. [Google Scholar] [CrossRef]
- Tan, C.R.C.; Abdul-Majeed, S.; Cael, B.; Barta, S.K. Clinical Pharmacokinetics and Pharmacodynamics of Bortezomib. Clin Pharmacokinet 2019, 58, 157–168. [Google Scholar] [CrossRef] [PubMed]
- Ferree, A.W.; Trudeau, K.; Zik, E.; Benador, I.Y.; Twig, G.; Gottlieb, R.A.; Shirihai, O.S. MitoTimer probe reveals the impact of autophagy, fusion, and motility on subcellular distribution of young and old mitochondrial protein and on relative mitochondrial protein age. Autophagy 2013, 9, 1887–1896. [Google Scholar] [CrossRef]
- Rolfs, Z.; Frey, B.L.; Shi, X.; Kawai, Y.; Smith, L.M.; Welham, N.V. An atlas of protein turnover rates in mouse tissues. Nature communications 2021, 12, 6778. [Google Scholar] [CrossRef]
- McClatchy, D.B.; Martinez-Bartolome, S.; Gao, Y.; Lavallee-Adam, M.; Yates, J.R., 3rd. Quantitative analysis of global protein stability rates in tissues. Scientific reports 2020, 10, 15983. [Google Scholar] [CrossRef]
- Neznanov, N.; Komarov, A.P.; Neznanova, L.; Stanhope-Baker, P.; Gudkov, A.V. Proteotoxic stress targeted therapy (PSTT): induction of protein misfolding enhances the antitumor effect of the proteasome inhibitor bortezomib. Oncotarget 2011, 2, 209–221. [Google Scholar] [CrossRef]
- Dantuma, N.P.; Lindsten, K.; Glas, R.; Jellne, M.; Masucci, M.G. Short-lived green fluorescent proteins for quantifying ubiquitin/proteasome-dependent proteolysis in living cells. Nat Biotechnol 2000, 18, 538–543. [Google Scholar] [CrossRef]
- Verkhusha, V.V.; Kuznetsova, I.M.; Stepanenko, O.V.; Zaraisky, A.G.; Shavlovsky, M.M.; Turoverov, K.K.; Uversky, V.N. High stability of Discosoma DsRed as compared to Aequorea EGFP. Biochemistry 2003, 42, 7879–7884. [Google Scholar] [CrossRef] [PubMed]
- Wheeler, J.C.; Bieschke, E.T.; Tower, J. Muscle-specific expression of Drosophila hsp70 in response to aging and oxidative stress. Proc Natl Acad Sci U S A 1995, 92, 10408–10412. [Google Scholar] [CrossRef] [PubMed]
- Wheeler, J.C.; King, V.; Tower, J. Sequence requirements for upregulated expression of Drosophila hsp70 transgenes during aging. Neurobiol Aging 1999, 20, 545–553. [Google Scholar] [CrossRef]
- Demontis, F.; Piccirillo, R.; Goldberg, A.L.; Perrimon, N. Mechanisms of skeletal muscle aging: insights from Drosophila and mammalian models. Dis Model Mech 2013, 6, 1339–1352. [Google Scholar] [CrossRef] [PubMed]
- Landis, G.N.; Salomon, M.P.; Keroles, D.; Brookes, N.; Sekimura, T.; Tower, J. The progesterone antagonist mifepristone/RU486 blocks the negative effect on life span caused by mating in female Drosophila. Aging (Albany NY) 2015, 7, 53–69. [Google Scholar] [CrossRef]
- Landis, G.N.; Hilsabeck, T.A.U.; Bell, H.S.; Ronnen-Oron, T.; Wang, L.; Doherty, D.V.; Tejawinata, F.I.; Erickson, K.; Vu, W.; Promislow, D.E.L.; et al. Mifepristone Increases Life Span of Virgin Female Drosophila on Regular and High-fat Diet Without Reducing Food Intake. Frontiers in genetics 2021, 12, 751647. [Google Scholar] [CrossRef]
- Tower, J.; Landis, G.N.; Shen, J.; Choi, R.; Fan, Y.; Lee, D.; Song, J. Mifepristone/RU486 acts in Drosophila melanogaster females to counteract the life span-shortening and pro-inflammatory effects of male Sex Peptide. Biogerontology 2017, 18, 413–427. [Google Scholar] [CrossRef]
Figure 1.
Effect of proteasome inhibitor bortezomib and translation inhibitor cycloheximide. (A) Fluorescence assay of pulsed eGFP expression in free-moving virgin females (Control; blue symbols), and in virgin females treated with 20µM bortezomib (Btz; red symbols). ID#070722. (B) Peak expression level for control and bortezomib-treated flies at day 4, from (a). p = 0.00315. (C) Area under the curve (AUC) quantification of eGFP fluorescence for control and bortezomib-treated flies in (a). p = 0.00239. (D) Fluorescence decay from peak for control and bortezomib-treated flies in (A). Control half-life 3.5 days, Btz half-life 17 days. p = 0.0489. (E) In vitro proteasomal degradation assay. Fluorescence decay of eGFP in fly extract (Control; blue symbols) and in presence of 20µM bortezomib (Btz; red symbols). Control half-life 78 min, Btz half-life 165 min. p = 0.0004. ID#072922. Statistical test is linear regression and ANCOVA; Statistical summary presented in Table 1. (F) Fluorescence assay of pulsed eGFP expression in free-moving virgin females, and in females pre-treated with low concentration (5µM) or high concentration (10µM) cycloheximide. The peak levels of eGFP fluorescence for control and cycloheximide-treated flies are presented (Experiment ID#081323). Peak levels in the high drug concentration group significantly lower than the control group (p = 0.003284). Low concentration group did not significantly differ from control (p = 0.09583) or high drug concentration (p = 0.1586). (G) Area under the curve (AUC) quantification of eGFP fluorescence for control and cycloheximide-treated flies (Experiment ID#081323). Control AUC significantly different from low drug concentration (5µM; p = 0.02091) and high drug concentration (10µM; p = 0.001728). (H) Fluorescence decay of eGFP in control and cycloheximide-treated flies in (Experiment ID#081323). Slope for control group was -0.2558 (half-life 2.71 days), slope for low concentration was -0.3648 (half-life 1.90 days), and for high concentration was -0.3801 (half-life 1.82 days). Slopes did not significantly differ (p = 0.4281776) Slopes compared with ANCOVA.
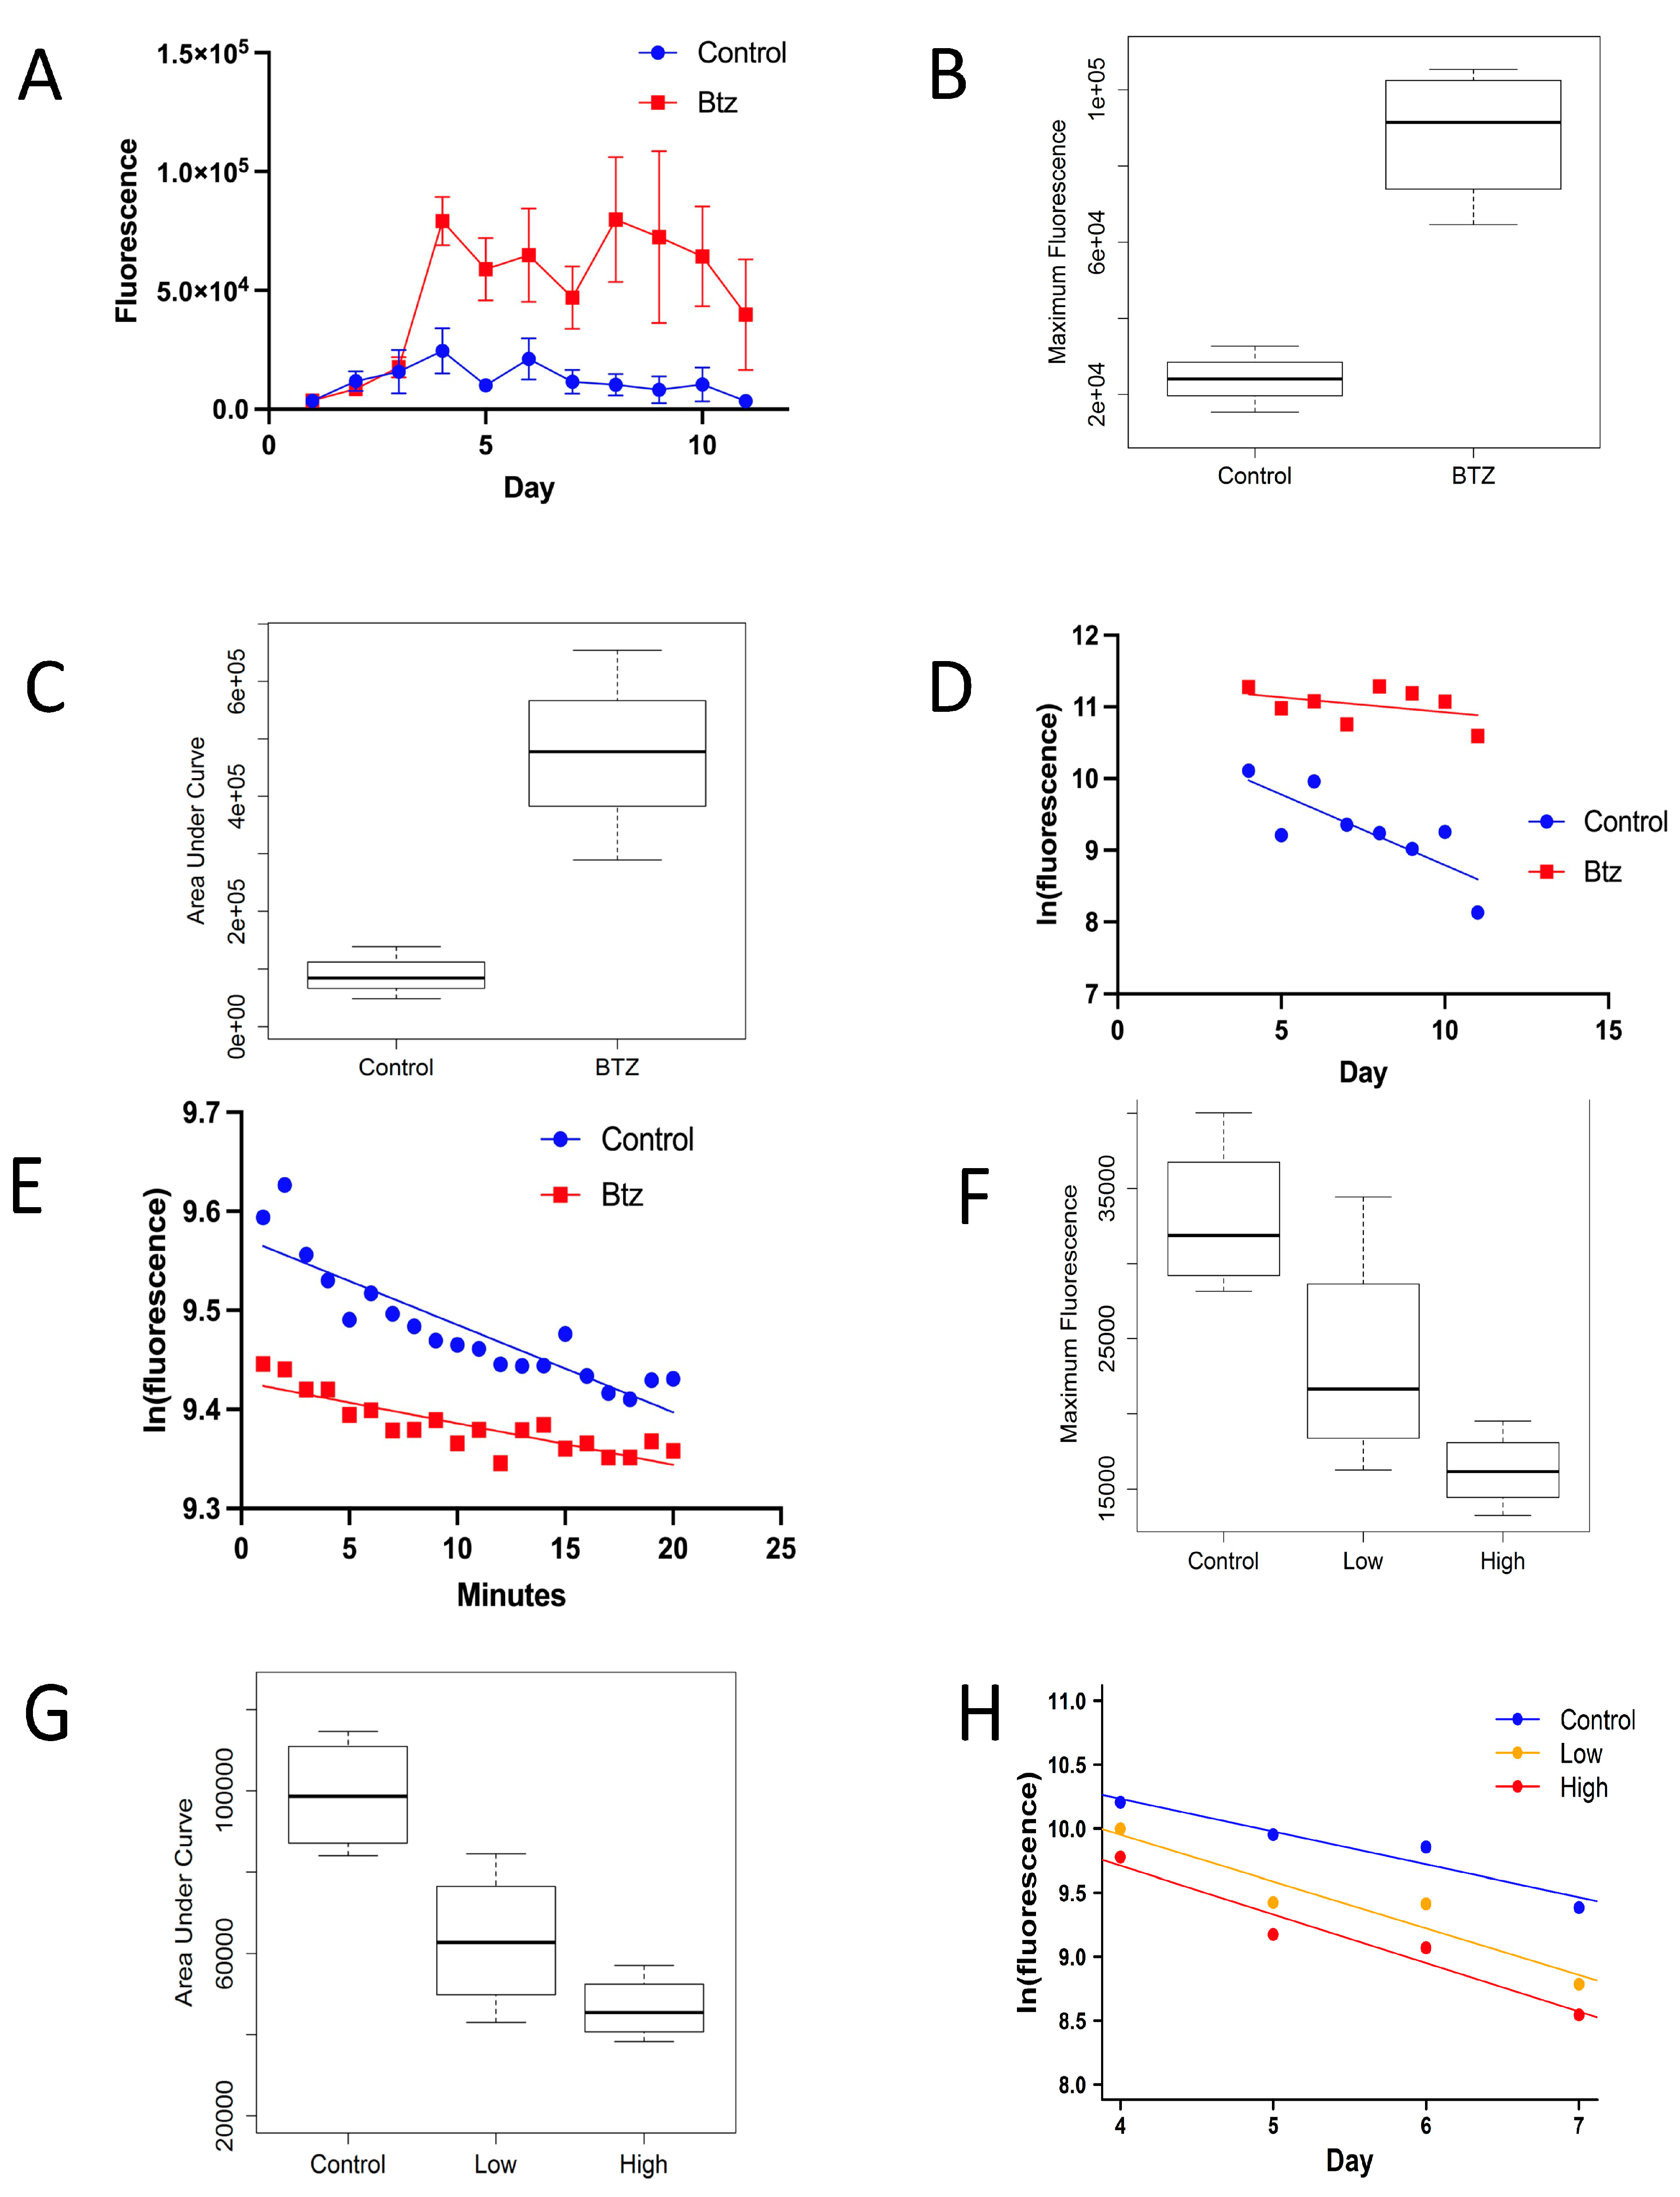
Figure 2.
Half-lives of different fluorescent proteins. (A) Fluorescence decay of eGFP in young (Y; 6 days old) and old (O; 36 days old) virgin males (VM), and virgin females (VF). Half-life values in days: 2.9 (VM Y), 3.1 (VM O), 4.1 (VF Y), 2.9 (VF O). ID#092619. (B) Fluorescence decay in virgin females (VF) and mated females (MF). ID#121720. Half-life values in days: 6.2 (VF), 7.6 (MF). Statistical summary for eGFP experiments presented in Supplemental Table S1. (C) Fluorescence decay of DsRED in free-moving flies, using Tet-ON system. Virgin males (VM) and virgin females (VF). p = 0.2552. ID#111920. Half-life in days: 6.7 (VM), 5.8 (VF). (D) Fluorescence decay of mCherry in flies anesthetized during microscope image capture, using Gene-Switch system. Virgin females (VF), and mated females (MF). p = 0.0319. ID#072221. Half-life in days: 51 (VF), 32 (MF). Statistical summary for mCherry presented in Supplemental Table S5. (E) Fluorescence decay of MitoTimer in central nervous tissue, Gene-Switch system. Virgin males (VM) and virgin females (VF). p = 0.0831. ID#010221. Statistical summary for MitoTimer presented in Supplemental Table 5. Statistical tests are linear regression and ANCOVA.
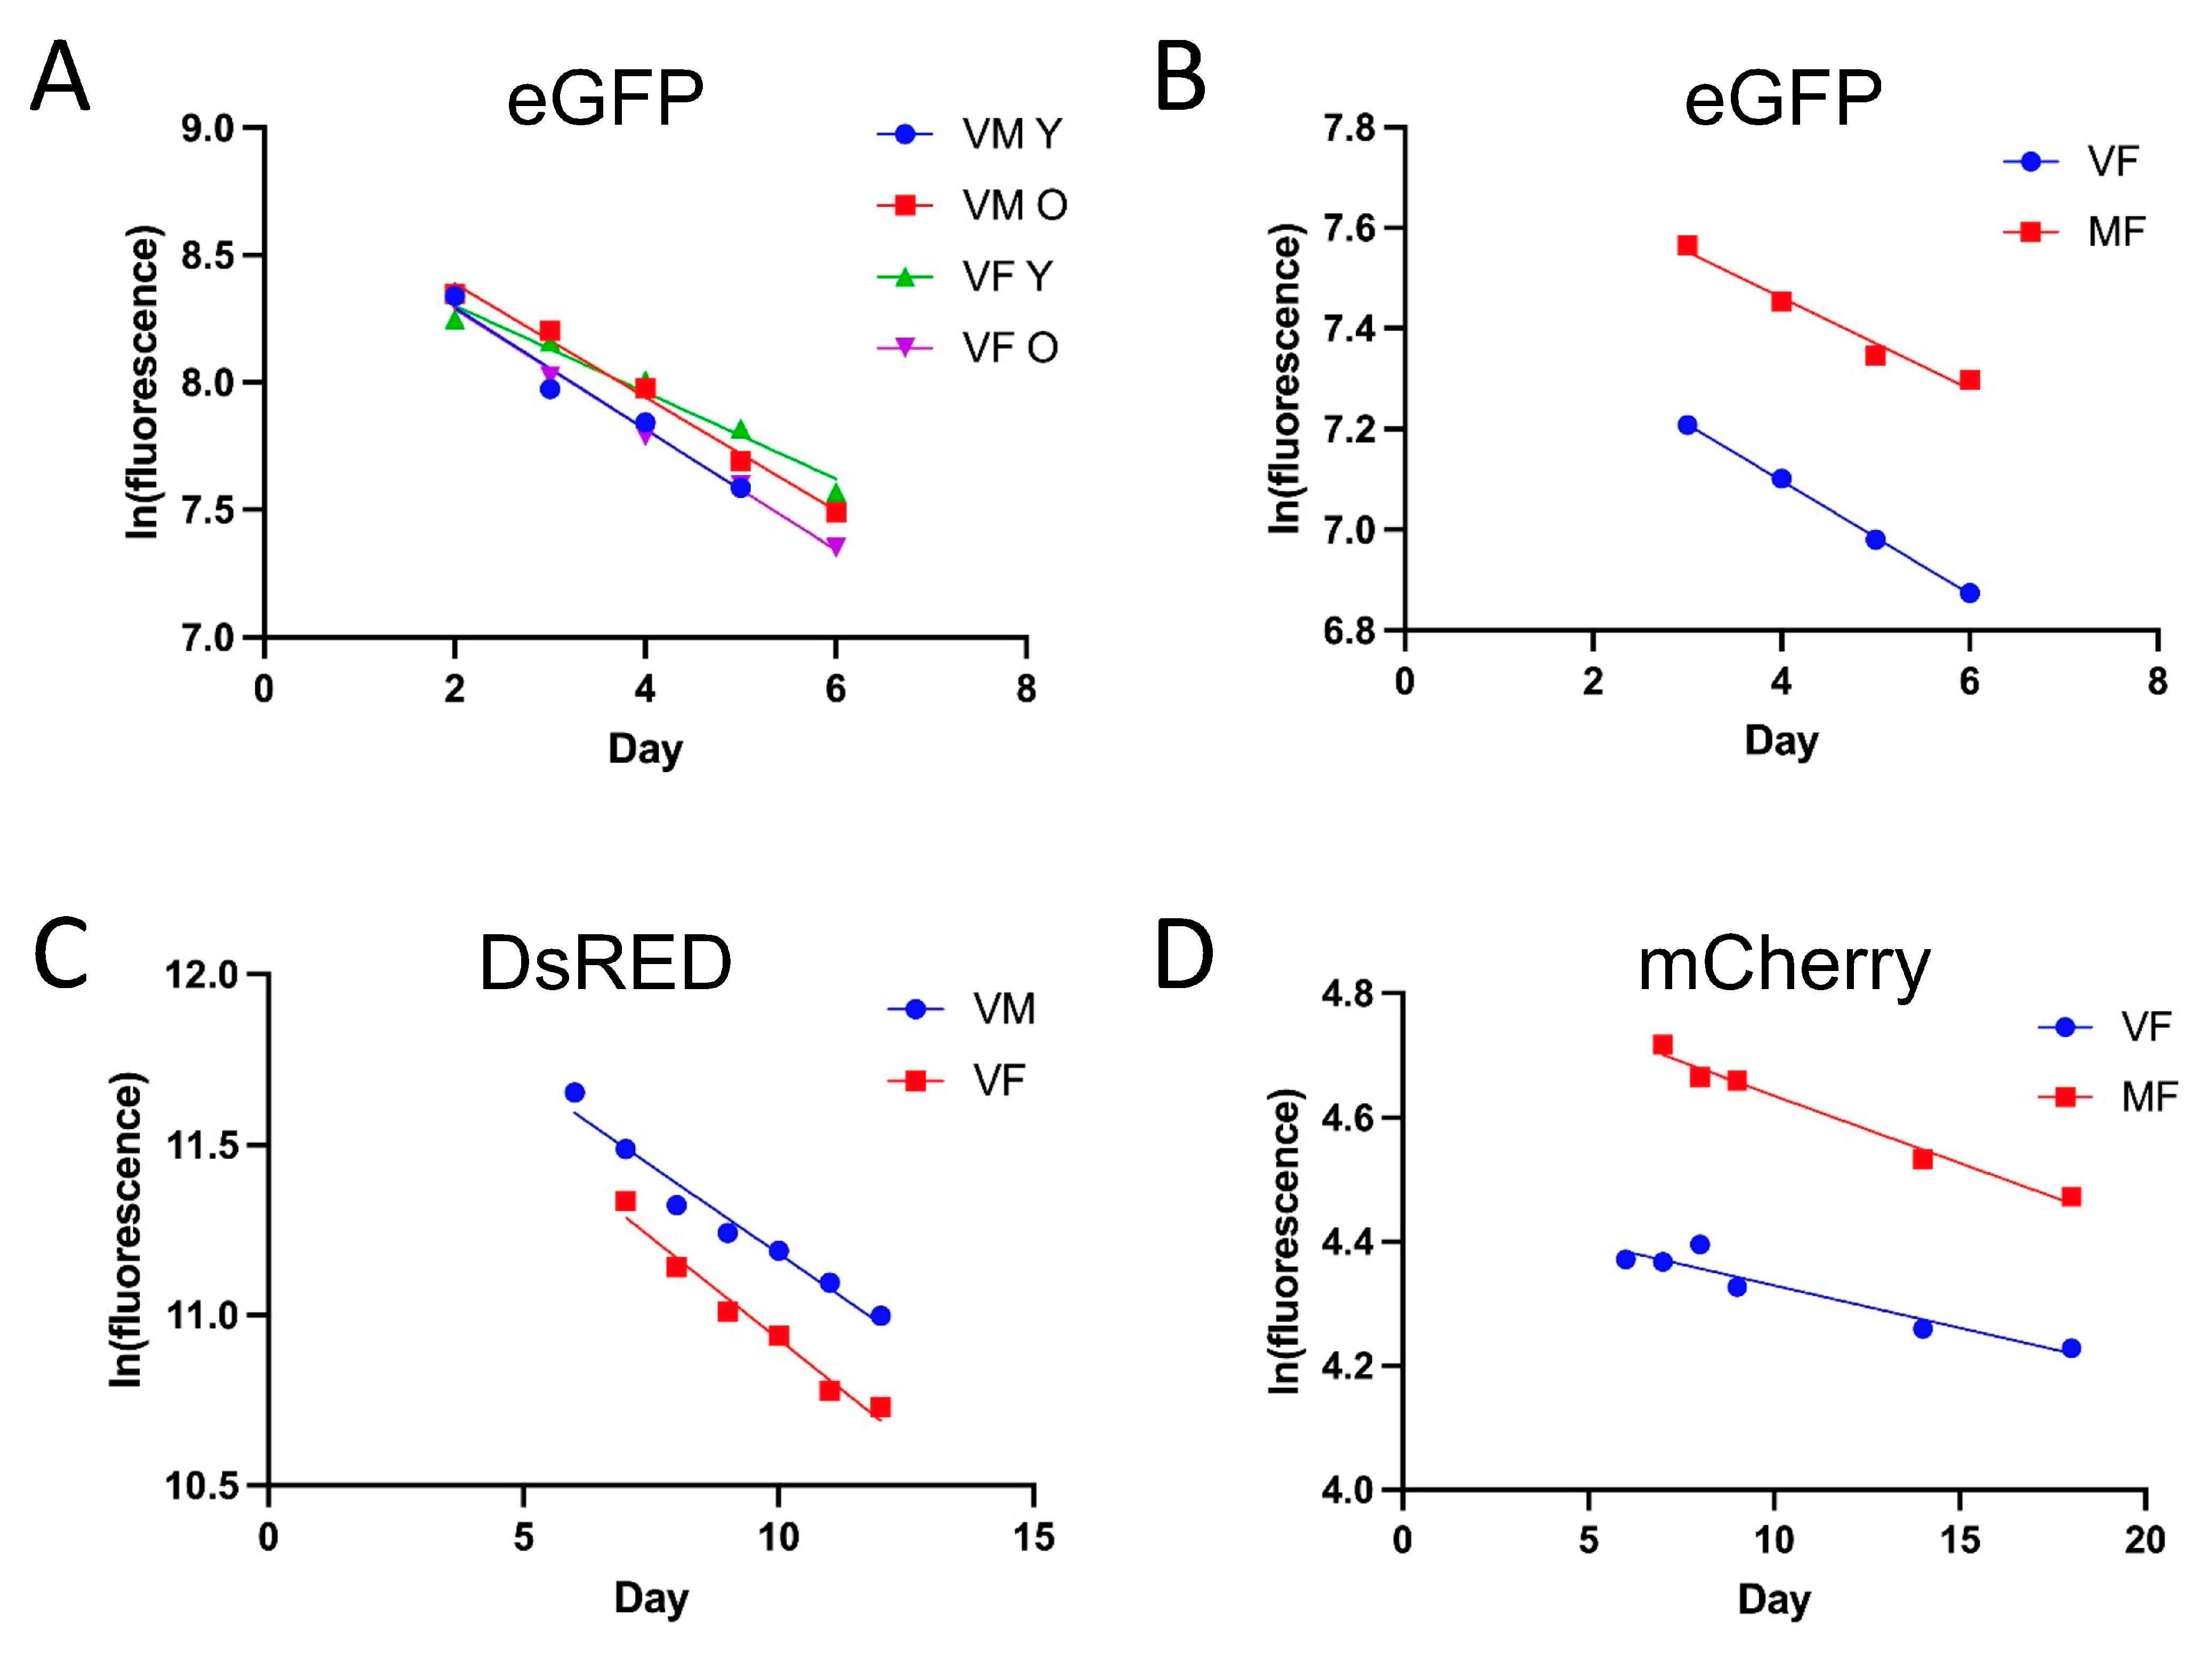
Figure 3.
Half-life differences across age and tissue types. (A) Degradation of DsRED in virgin females with increasing age. To facilitate comparisons, the y-intercepts of all lines are set to 1, and time is normalized so that maximum fluorescence of all experiments occurs at time 0.5 days. Half-life values for DsRED were calculated as 8.6 days (dark red, experiment ID#080921, 12 days old), 3.7 days (orange, ID#120121, 6 days old), and 2.0 days (pink, ID#112920, 3 days old). The half-life for 12 day old flies (dark red) was significantly different from both 6 day old flies (orange, p = 0.01244) and 3 day old flies (pink, p = 0.017984). (B) Fluorescence decay of eGFP targeted to muscle and midgut of mated females. eGFP fluorescence decay is plotted for flight muscle (88F-GS driver, ID#100221), total muscle (Mhc-GS driver, ID#092021), and midgut (5966-GS driver, ID#111021). The slope of eGFP decay in midgut (half-life 3.0 days) differed from flight muscle (half-life 7.6 days, p = 0.003159) and muscle (half-life 7.5 days, p = 0.0006211), whereas no significant difference was detected between flight muscle and total muscle (p = 0.9671537). .
Disclaimer/Publisher’s Note: The statements, opinions and data contained in all publications are solely those of the individual author(s) and contributor(s) and not of MDPI and/or the editor(s). MDPI and/or the editor(s) disclaim responsibility for any injury to people or property resulting from any ideas, methods, instructions or products referred to in the content. |
© 2025 by the authors. Licensee MDPI, Basel, Switzerland. This article is an open access article distributed under the terms and conditions of the Creative Commons Attribution (CC BY) license (http://creativecommons.org/licenses/by/4.0/).
Copyright: This open access article is published under a Creative Commons CC BY 4.0 license, which permit the free download, distribution, and reuse, provided that the author and preprint are cited in any reuse.


